research article open access differential biodistribution
TRANSCRIPT

Varma et al. BMC Medical Imaging 2013, 13:17http://www.biomedcentral.com/1471-2342/13/17
RESEARCH ARTICLE Open Access
Differential biodistribution of intravenouslyadministered endothelial progenitor andcytotoxic T-cells in rat bearing orthotopic humangliomaNadimpalli Ravi S Varma*, Adarsh Shankar, Asm Iskander, Branislava Janic, Thaiz Ferraz Borin, Meser M Aliand Ali S Arbab
Abstract
Background: A major challenge in the development of cell based therapies for glioma is to deliver optimalnumber of cells (therapeutic dose) to the tumor. Imaging tools such as magnetic resonance imaging (MRI), opticalimaging, positron emission tomography (PET) and single-photon emission computed tomography (SPECT) hasbeen used in cell tracking and/or biodistribution studies. In this study, we evaluate the dynamic biodistribution ofsystemic injected labeled cells [human cord blood derived endothelial progenitor cells (EPCs) and cytotoxic T-cells(CTLs)] in rat glioma model with in vivo SPECT imaging.
Methods: Human cord blood EPCs, T-cells and CD14+ cells (monocytes/dendritic cells) were isolated using theMidiMACS system. CD14+ cells were converted to dendritic cells (DC) and also primed with U251 tumor cell linelysate. T-cells were co-cultured with irradiated primed DCs at 10:1 ratio to make CTLs. Both EPCs and CTLs werelabeled with In-111-oxine at 37°C in serum free DMEM media. Glioma bearing animals were randomly assignedinto three groups. In-111 labeled cells or In-111 oxine alone were injected through tail vein and SPECT imagingwas performed on day 0, 1, and 3. In-111 oxine activity in various organs and tumor area was determined.Histochemical analysis was performed to further confirm the migration and homing of injected cells at thetumor site.
Results: EPCs and CTLs showed an In-111 labeling efficiency of 87.06 ± 7.75% and 70.8 ± 12.9% respectively.Initially cell migration was observed in lung following inravenous administration of In-111 labeled cells anddecreased on day 1 and 3, which indicate re-distribution of labeled cells from lung to other organs. Relativelyhigher In-111 oxine activity was observed in tumor areas at 24 hours in animals received In-111 labeled cells(EPCs or CTLs). Histiological analysis revealed iron positive cells in and around the tumor area in animals thatreceived labeled cells (CTLs and EPCs).
Conclusion: We observed differential biodistribution of In-111-oxine labeled EPCs and CTLs in different organsand intracranial glioma. This study indicates In-111 oxine based SPECT imaging is an effective tool to study thebiodistribution of therapeutically important cells.
Keywords: Biodistribution, Endothelial Progenitor Cells, Cytotoxic T-cells, SPECT Imaging And Indium-111Labeling
* Correspondence: [email protected] and Molecular Imaging Laboratory, Radiology, Henry Ford Hospital,Detroit, MI, USA
© 2013 Varma et al.; licensee BioMed Central Ltd. This is an Open Access article distributed under the terms of the CreativeCommons Attribution License (http://creativecommons.org/licenses/by/2.0), which permits unrestricted use, distribution, andreproduction in any medium, provided the original work is properly cited.

Varma et al. BMC Medical Imaging 2013, 13:17 Page 2 of 9http://www.biomedcentral.com/1471-2342/13/17
BackgroundHuman glioma is an aggressive, malignant brain tumorand cure rate of presently available therapies (surgical re-section, radiotherapy, and chemotherapy) are too poor[1,2]. Cell based gene therapies are growing fast as a po-tential alternative therapies for the glioma [3-5]. Cell baseddelivery of therapeutic agents offers advantages over regu-lar vector or viral based delivery due to the ability of cells(such as stem cells) to cross tumor blood brain barrier(TBBB) and for extended homing at the tumor site [6-8]following systemic administration. Development and con-tinual improvement of in vivo cell tracking methods areimportant for ongoing efforts to improve the effectivenessof cell-based therapies for glioma treatment [9]. In cellbased therapies, it is important to determine optimaleffective dose, monitor cell delivery, number of viable cellsand homing to improve the therapeutic effect at the tumorsite.Imaging techniques are necessary to monitor the effi-
ciency of cell retention and dose determination in invivo preclinical models. Magnetic resonance imaging(MRI) has been used in animal models for cell trackingwith the help of iron-oxide nanoparticles as probes[10,11]. Studies have shown the capability of iron-oxidenanoparticles for non-invasive MRI tracking of cell mi-gration and engraftment [9,10]. Recently dual-modalityprobes such as radiolabeled iron oxide nanoparticleshave been developed and shown the promising resultsfor biodistribution and diagnostic applications. Theseprobes can be detected by two different imaging modal-ities (SPECT/PET or MRI) at the same time [12]. Inaddition, these nanoparticles help in generating high sensi-tivity (SPECT/PET) and high resolution (MRI) images[12]. The main drawback of iron based nanoparticles istheir inability to distinguish live from dead cells. Inaddition, iron-oxide nanoparticles induce hypointensitieson T2 or T2*-weighted images, which further hamper todistinguish from hemorrhage. Recently manganeseoxide (MnO) based nanoparticles were developed toovercome these limitations, which show high signal in-tensity on T1-weighted images [13,14]. MnO basednanoparticles have been used to label stem cells andused in vivo MRI to track stem cell migration and en-graftment [13,14]. However, MRI does not provide thedata on whole body biodistribution of labeled cells aswell as number of cell accumulation at the target site.Positron emission tomography (PET) has been used incombination with 18 F-fluorodeoxyglucose (18 F-FDG)for cell tracking. However, long term tracking of cellswith PET imaging was difficult due to short half-life ofthe probes [15,16]. SPECT is advantageous to monitoradministered cells for relatively longer time and to ob-serve clearance of cells from different organs and hom-ing at the tumor site [10,17]. For SPECT imaging, either
Indium-111 (In-111)-oxine or Technetium-99m (Tc-99m) based radiopharmaceuticals (such as Tc-99 m-HMPAO), can be used to label cells. However, In-111-oxine is better suited due to its longer half-life (2.8 days)to monitor migration and homing of intravenously (IV)administered cells to the site of tumor.In the present study, we described the method of label-
ing of EPCs and CTLs with In-111-oxine and investigateddifferential biodistribution of In-111-oxine labeled cellsusing SPECT imaging in rat glioma models. SPECT scan-ning helps to study the whole body and organ specificbiodistribution of the cells (EPCs and CTLs). Such infor-mation would help determining the percent of adminis-tered cells reaching target site (tumor area) and furtherimpacts on dose evaluation that improves therapeuticoutcome.
MethodsIsolation of EPCsHuman cord blood was collected under Henry Ford HealthSystem institutional review board (IRB) approved protocol(3287) [9,17]. AC133+ EPCs were isolated using our previ-ously published method [9,17]. Brief, AC133+ cells wereseparated from human cord blood using ficoll gradient cen-trifugation and further selected using the MidiMACS sys-tem (Miltenyi, Auburn, CA) [9,17]. Collected EPCs weremaintained in hematopoietic stem cell media at 1 × 10⁶
cells per ml in 5% CO2/95% air at 37°C [9,17]. To confirmthe purity of the isolated cells, flow-cytometry was doneusing different AC133+ markers [9,17].
Preparation of Sensitized T-Cells (CTLs)T-cells and CD14+ cells were isolated from human cordblood as described in our previous published method [10].CD14+ cells were converted to immature dendritic cells(DC) [10]. Immature DCs were subjected maturationprocess and primed with U251 cell lysate according ourpublished method [10]. Matured DCs were tested formarkers specific for DCs (CD14, CD86, CD83 and HLA-DR) by flow-cytometry [10]. Sensitization of T-cells wascarried out according to our previous works [10]. Brief,cryopreserved T-cells thawed and cultured overnight andthen co-cultured with irradiated primed DCs at 10:1 ratio[10]. T-cell proliferation was determined by MTT assay(ATCC) according to manufacturer instructions. After 6days of co-culture the T-cells were collected by centrifuga-tion and re-suspended in normal saline for further labeling[10].
In111 oxine labeling of EPCs, and CTLsBoth EPCs and CTLs were labeled with In-111-oxine(Anazao Health Corp, Tampa FL) at 37°C in normal sa-line. Twenty million either EPCs or CTLs were incu-bated with 37 MBq of In-111-oxine in 2 ml of serum

Varma et al. BMC Medical Imaging 2013, 13:17 Page 3 of 9http://www.biomedcentral.com/1471-2342/13/17
free DMEM media for 20–25 minutes. After incubationfor 20–25 minutes, the cells were centrifuged (1200 rpmfor 10 min) and washed twice with PBS. Cell viabilityand percentage of labeling efficiency was calculated. Ratswere administered with 20 × 106 CTLs or 10 × 106 EPCsor In-111 oxine alone for each respective animal andiron-oxide labeling was also used to label small portionof cells (CTLs or EPCs) to detect cell migration to thetumor area using histochemistry [17].
Animal modelAthymic nude rats (6–8 weeks of age) (Charles River La-boratory, Inc.) were anesthetized using ketamin/xylazinemixture and were placed on a stereotactic head holder[10,17]. The tumor was implanted according to our pub-lished method [10,17]. Brief, a hole was drilled after expos-ing the skull and U251 glioma tumor cells (4 × 10⁵) wereinjected stepwise followed by withdrawal of syringe[10,17]. After syringe withdrawal, bone wax was used toclose the surgical hole and skin was sutured [10,17].
SPECT imaging and analysisGlioma bearing nude rats were randomly assigned intothree groups; 1) animals receiving an tail vein administra-tion of In-111-labeled EPCs (10 × 106 cells) (n = 6), 2) ani-mal receiving tail vein injection of In-111 labeled CTLs(20 × 106 cells) (n = 4), 3) animal receiving tail vein injec-tion of equal amount of In-111 oxine (n = 6). After tailvein injection of In-111-labeled cells or In-111-oxinealone, SPECT scanning was performed on day 0 (1–3hours post injection of labeled cells or In-111-oxine), day1and 3. Once put on appropriate anesthesia using keta-mine/xylazine (100/10 mg/kg), animals were scanned witha SPECT imager (PRISM 3000 gamma camera, Picker,USA) [17]. Whole body (neck to tail region) of the animalwas scanned followed by separate scan of the head region.After imaging, rats were euthanized and perfused to col-lect the organs for further analysis [17]. Acquired imageswere processed using Bioscan software (HiSPECT, Wash-ington DC) and Image J software (NIH, Bethesda MD).The whole body radioactivity on day 0 upon administra-tion of labeled cells or In-111-oxine was used as total ad-ministered dose and activity in organs was calculated aspercentage of administered dose after decay correction.
Organ specific radioactivity and histochemistryAfter day 3 SPECT imaging, animals were euthanizedusing pentobarbital (150–200 mg/kg) and perfused with3% paraformaldehyde. Tissue samples from heart, lung,kidney, liver and spleen and brain were obtained. Theradioactivity was measured for all tissue samples usinggamma counter (Wizard 1420, PerkinElmer, USA).Tissue sections from brain were prepared according to
our previous publications [10,17]. In brief, brain samples
were made into 1-mm blocks and paraffin embedded. Theembedded blocks were cut into serial 10 μm sections andprussian blue staining was used to visualize the iron withinFePro labeled cells. Brain tissue sections were stained withprussian blue according to our published works to detectthe migration of administered labeled cells to the tumorarea [10,11,17]. Brief, fixed sections were de-paraffinized,rehydrated, washed, and incubated for 30 min with 5% po-tassium ferrocyanide in 5% hydrochloric acid, DAB en-hanced, and counterstained with nuclear fast red. Prussianblue stained sections were observed under light micro-scope to determine the migration of labeled cells (EPCs orCTLs) to tumor area [10,11,17].
Statistical analysisThe Student t test was used to evaluate differences betweenrat groups, with P < 0.05 considered to be statistically sig-nificant. All data was expressed as mean ± standard devi-ation (± SD) unless stated otherwise.
ResultsLabeling efficiency and cellular viabilityEPCs and CTLs were labeled with In-111 oxine under sus-pension conditions in normal saline. EPCs and CTLsshowed a labeling efficiency of 87.06 ± 7.75% and 70.8 ±12.9% respectively. To test whether labeling with In-111-oxine have any effect on viability of cells, we used trypanblue dye exclusion test to measure the cell viability of la-beled and unlabeled CTLs and EPCs. We tested the cellviability immediately after cells labeled with In-111-oxine.Both CTLs and EPCs showed similar viability (no signifi-cant differences) following In-111-oxine labeling com-pared to that of corresponding unlabeled CTLs or EPCs.
Biodistribution of In-111 labeled cells in different organsIn-111- CTLs, In-111-EPCs or In-111-oxine were injectedIV into glioma bearing nude rats. Biodistribution of radio-activity in different organs and in tumors were determinedon days 0, 1 and 3 using SPECT imaging. In-111 oxineinjected animal showed identical activity from 3 to 72hours in lung, heart, brain, and liver, while in spleen an in-creased activity was observed at 72 hours (Figure 1). Weobserved differences in biodistribution between CTLs andEPCs, In-111 labeled CTLs showed higher activity in lungat 3 hours scan compared to In-111 labeled EPCs(Figure 1). However, 24 hours scanning showed clearanceof activity from the lung, which indicated redistribution ofIn-111-CTLs to other organs. On the other hand, weobserved less activity of In-111-EPCs in the lung at all timepoints compared to In-111-CTLs. Distribution of cell-associated activities (both CTLs and EPCs) in differentorgans was clearly different than that of activities seen inanimals which received In-111-oxine alone.

Figure 1 SPECT images showing biodistribution of IV administered In-111-oxine, In-111 labeled CTLs and EPCs: Biodistribution ofIn-111-oxine alone did not showed any difference from 3 to 72 hours, but activity in spleen increased at 72 hours. Labeled CTLs showedhigh activity in lung at 3 hours and redistribution at 24 and 72 hours. The activity of In-111-CTLs in liver increased from 3 hrs to 72 hours while activityin spleen remained constant. Labeled EPCs showed activity in lung at 3 hours, which is much lower when compared to CTLs. The activity ofIn-111-EPCs in liver and spleen did not change much with the time (3 to 72 hours).
Varma et al. BMC Medical Imaging 2013, 13:17 Page 4 of 9http://www.biomedcentral.com/1471-2342/13/17
We calculated the percentage of injected dose in liver,lung and spleen following IV administration of In-111-oxine. We observed 23.05 ± 3.22%ID in the lung at 1hour, which gradually increased to 25.16 ± 2.74%ID at 3hours but the activity significantly decreased at 24 hours(16.38 ± 3.43%ID) and 72 hours (13.28 ± 2.56%ID)(Figure 2A). However, we did not observe similar shift ofradioactivity in the liver. The percentage of radioactivitywas not decreased over time and there was no signifi-cant difference of In-111-oxine activity among differenttime points (Figure 2A). Spleen showed significantly less
activity of In-111-oxine compared to lung and liver andsimilar to liver there was no change in activity over time.We observed initial accumulation of In-111 labeled
CTLs in the lung (29.90 ± 4.90%ID at 1 hour to 30.18 ±0.00%ID at 3 hours) but activity in lung was dramaticallydecreased at later time point (4.07-2.34%ID at 24 hours),which was further decreased at 72 hours (1.85 ± 1.31%ID) (Figure 2B). However, In-111-CTLs activity in theliver showed gradual increased at 24 hours and 72 hours,which became significantly different compared to that of2 hours (Figure 2B), while activity in spleen showed no

Figure 2 Graphical representation of percentage of activity in different organs with the time. Biodistribution study of IV injected In-111oxine alone (A), In-111 labeled CTLs (B), In-111 labeled EPCs (C) and accumulation of In-111-CTLs and In-111-EPCs in glioma (D). In these graphswe included 1 and 2 hours san data along with 3, 24 and 72 hours. (A) In-111-oxine alone did not show significant change in organ distributionpatterns from 1 to 72 hours. (B) Labeled CTLs showed 40% activity in lung at 2 hours, which dropped to 30% at 3 hours and further droppedafter 24 and 72 hours, which indicates redistribution for CTLs from lung. Liver and spleen did not showed difference from 1 to 72 hour scans.(C) In-111 labeled EPCs showed lung associated activity at 1 hour scan but within 3 hours the activity was dropped by 68.4%, which indicatesrapid redistribution of EPCs from the lung. Liver and spleen did not showed significant difference in activity from 3 to 72 hours. (D) Percentage ofIn-111 labeled CTLs and EPCs’ migration to tumor site and contralateral brain was determined in this graph at three time points (3, 24 and 72hours). CTLs showed highest activity at 24 hours (0.8 ± 0.41%) compared to 3 and 72 hours. EPCs showed highest activity at 24 hours(2.77 ± 2.3%) compared to 3 and 72 hours.
Varma et al. BMC Medical Imaging 2013, 13:17 Page 5 of 9http://www.biomedcentral.com/1471-2342/13/17
significant differences among the different time points(Figure 2B).We observed different patterns of distribution for In-
111 labeled EPCs in lung compared to that of In-111-CTLs or In-111-oxine. The accumulated In-111-EPCs inthe lung (38.02 ± 16.34%ID at 1 hour) started redistribu-tion as early as 2 hours which became significantly lowerat 3 hours, which further reduced at 24 and 72 hours(1.13 ± 0.49%ID at 72 hours) (Figure 2C). Early redistri-bution from the lung was also supported by the in-creased activity in the liver and spleen at 2 hours. Boththe activities in the liver and spleen remained stableuntil 72 hours (55.55 ± 5.87%ID in liver and 7.5 ± 1.94%ID in spleen) (Figure 2C).We further analyzed migration of injected EPCs and
CTLs to the tumor area, where, we observed migration ofIn-111-CTLs and EPCs to tumor site (Figures 2D and 3).Both In-111-CTLs and In-111-EPCs showed migration totumors as early as 3 hours post injection. Comparativelyhigher activity was observed in tumors at 24 hours ofpost IV administration of In-111-CTLs or In-111-EPCs(Figures 2D and 3). Semi-quantitative analysis showedtumor specific accumulation of CTLs (0.8 ± 0.41%ID at24 hours) and EPCs (2.7 ± 2.3%ID at 24 hours)
(Figure 2D). There was almost negligible activity observedon contra-lateral brain for both CTLs and EPCs.To further confirm the SPECT image results, we iso-
lated organs (brain, liver, spleen, kidney, heart and lung)after day 3 SPECT scanning and measured the radio-activity in vitro using a gamma counter. We found outthat radioactivity in the isolated organs are consistentwith in vivo SPECT imaging data.
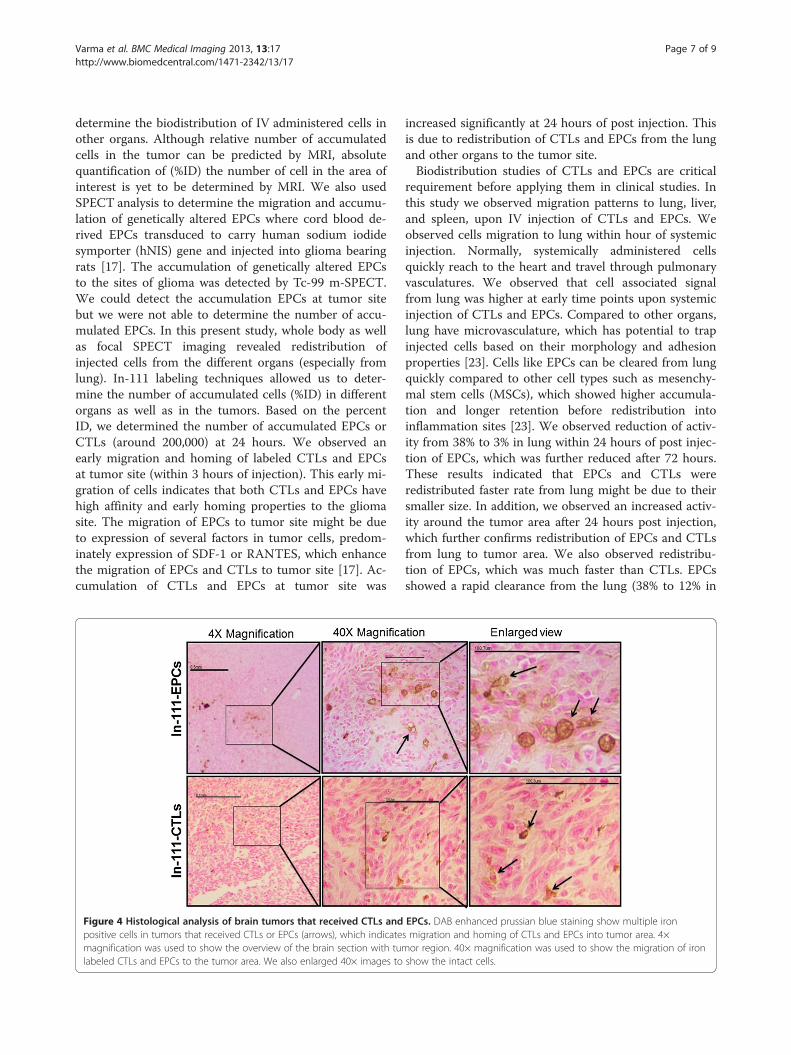
HistochemistryHistochemistry based approach was used to further con-firm the migration of CTLs and EPCs to the tumor area.Brain sections were prepared and analyzed by staining todetermine EPCs and CTLs migration to tumors. We ob-served iron positive cells in and around the tumor areain animals that received iron oxides nanoparticles la-beled CTLs and EPCs (Figure 4). Histochemistry resultsfurther support the SPECT imaging findings of EPCsand CTLs migration to the tumor area.
DiscussionEndothelial progenitor cells and CTLs have been shownto migrate and home to implanted glioma [10,17]. In ourprevious studies, we showed cord blood derived T-cells

Figure 3 SPECT images of biodistribution of labeled cells in brain region. In-111 oxine alone did not show any activity around the tumorarea. Accumulation of In-111 labeled CTLs in tumor area was seen within three hours and the activity further increased on 24 hour scans. In-111labeled EPCs showed high activity around the tumor area in 3 hours scan, which was significantly higher compared to CTLs. 24 hours scanshowed further increase in the radioactivity. Note: The increased accumulation of cells after 24 hours of injection. Window levels of signals arekept identical for all day for respective tumors.
Varma et al. BMC Medical Imaging 2013, 13:17 Page 6 of 9http://www.biomedcentral.com/1471-2342/13/17
can be sensitized against U-251 glioma cells and can belabeled with iron oxide to use as MRI probes to detectglioma from radiation necrosis in rat glioma model [10].Recently, we showed human cord blood derived EPCshoming at glioma in rat models, where we used ironoxide probes to label the EPCs and tracked them usingMRI [11,17]. MRI imaging has limitations to determinethe number of migrated labeled cells to the site of inter-est and whole body biodistribution (different organs) inanimal using current set up of hardware and software.To improve the applicability of cell based therapy incancers and to design effective therapeutic dose, it is im-portant to determine their biodistribution and the rateof migration to tumor site following systemic adminis-tration. In this study, we used SPECT imaging in com-bination with In-111-oxine labeling to determinedistribution of administered cells in whole body and inrat model of glioma.In-111-oxine is commercially available FDA approved
radioactive tracer, generally safe to use in humans[18,19]. In-111-oxine widely used in cell labeling due toits lipophilic nature, which passively diffuses into cellsand binds to intracytoplamic proteins [20,21]. In
addition, half-life of In-111 is 2.8 days, which allowsmonitoring of cell biodistribution for long period of time(0 to 7 days) in animal models [22]. Before applying thelabeled cells in biodistribution study, it is important toknow the labeling efficiency and radio toxicity effects onthe viability of the cells. The labeling efficiency of In-111-oxine was calculated for the CTLs and EPCs. EPCsshowed higher labeling efficiency than that of CTLs. Itwas not unexpected that In-111-oxine cell labeling effi-ciency varies with cell type [23]. Several studies showedthat In111-oxine labeling of human stem cells did notaffect the cell viability and stem cell characteristics[24,25]. Our results with trypan blue dye exclusion assayfor cell viability also showed no differences in the viabil-ity following In-111-oxine labeling when compared withunlabeled cells. These results indicate that In-111 oxinelabeling of CTLs and EPCs did not affect cell viabilitywith the applied dose. These results are also in agree-ment with previously published report [22].In our previous studies, we have shown the migration
and accumulation of iron nanoparticles labeled CTLsand EPCs to the sites of intracranial implanted glioma inrat models by MRI [10,11]. However, MRI could not
Varma et al. BMC Medical Imaging 2013, 13:17 Page 7 of 9http://www.biomedcentral.com/1471-2342/13/17
determine the biodistribution of IV administered cells inother organs. Although relative number of accumulatedcells in the tumor can be predicted by MRI, absolutequantification of (%ID) the number of cell in the area ofinterest is yet to be determined by MRI. We also usedSPECT analysis to determine the migration and accumu-lation of genetically altered EPCs where cord blood de-rived EPCs transduced to carry human sodium iodidesymporter (hNIS) gene and injected into glioma bearingrats [17]. The accumulation of genetically altered EPCsto the sites of glioma was detected by Tc-99 m-SPECT.We could detect the accumulation EPCs at tumor sitebut we were not able to determine the number of accu-mulated EPCs. In this present study, whole body as wellas focal SPECT imaging revealed redistribution ofinjected cells from the different organs (especially fromlung). In-111 labeling techniques allowed us to deter-mine the number of accumulated cells (%ID) in differentorgans as well as in the tumors. Based on the percentID, we determined the number of accumulated EPCs orCTLs (around 200,000) at 24 hours. We observed anearly migration and homing of labeled CTLs and EPCsat tumor site (within 3 hours of injection). This early mi-gration of cells indicates that both CTLs and EPCs havehigh affinity and early homing properties to the gliomasite. The migration of EPCs to tumor site might be dueto expression of several factors in tumor cells, predom-inately expression of SDF-1 or RANTES, which enhancethe migration of EPCs and CTLs to tumor site [17]. Ac-cumulation of CTLs and EPCs at tumor site was
Figure 4 Histological analysis of brain tumors that received CTLs andpositive cells in tumors that received CTLs or EPCs (arrows), which indicatemagnification was used to show the overview of the brain section with tumlabeled CTLs and EPCs to the tumor area. We also enlarged 40× images to
increased significantly at 24 hours of post injection. Thisis due to redistribution of CTLs and EPCs from the lungand other organs to the tumor site.Biodistribution studies of CTLs and EPCs are critical
requirement before applying them in clinical studies. Inthis study we observed migration patterns to lung, liver,and spleen, upon IV injection of CTLs and EPCs. Weobserved cells migration to lung within hour of systemicinjection. Normally, systemically administered cellsquickly reach to the heart and travel through pulmonaryvasculatures. We observed that cell associated signalfrom lung was higher at early time points upon systemicinjection of CTLs and EPCs. Compared to other organs,lung have microvasculature, which has potential to trapinjected cells based on their morphology and adhesionproperties [23]. Cells like EPCs can be cleared from lungquickly compared to other cell types such as mesenchy-mal stem cells (MSCs), which showed higher accumula-tion and longer retention before redistribution intoinflammation sites [23]. We observed reduction of activ-ity from 38% to 3% in lung within 24 hours of post injec-tion of EPCs, which was further reduced after 72 hours.These results indicated that EPCs and CTLs wereredistributed faster rate from lung might be due to theirsmaller size. In addition, we observed an increased activ-ity around the tumor area after 24 hours post injection,which further confirms redistribution of EPCs and CTLsfrom lung to tumor area. We also observed redistribu-tion of EPCs, which was much faster than CTLs. EPCsshowed a rapid clearance from the lung (38% to 12% in
EPCs. DAB enhanced prussian blue staining show multiple irons migration and homing of CTLs and EPCs into tumor area. 4×or region. 40× magnification was used to show the migration of ironshow the intact cells.
Varma et al. BMC Medical Imaging 2013, 13:17 Page 8 of 9http://www.biomedcentral.com/1471-2342/13/17
3 hours), while CTLs showed stable activity up to 3hours (30%ID). This observation might be due to thenatural phenomenon of EPCs to migrate quickly to thesites of lesions [26]. On other hand, T-cell uponsensitization with DC begin macromolecular synthesisand enlargement of cytoplasmic volume and the cellssize could reaches up to 10–30 μm in diameter [27].This might be the reason for slow rate of clearance ofCTLs from lung.In this study, we did not evaluate any therapeutic ef-
fect of administered cells (CTLs, EPCs) on the glioma.The study was designed to evaluate degree of cell reten-tion in different organs following IV administration,biodistribution patterns, and dose design. The use of theSPECT imaging method in combination with In-111-oxine has been validated as an effective means of celltracking method to study the biodistribution of adminis-tered cells. The data generated in this study can be usedto study the timing of injection as well as number ofcells accumulation at tumor site. This study also allowscalculating the timing for secondary therapeutic doseand retention strategies. In addition, information gener-ated in this study further helps to utilize these cells todeliver therapeutic agents to glioma.
ConclusionSPECT studies were able to show the differential bio-dis-tribution of In-111-oxine, EPCs and CTLs in differentorgans and intracranial glioma. Distribution of In-111-oxine alone in different organs remained identical fromday 0 to day 3 except slight increased activity in spleen.Both CLTs and EPCs redistributed from lung to otherorgans within 24 hours.
Competing interestsThe authors have declared that no competing interests exist.
Authors’ contributionsNRSV and ASA carried out the experimental design, data analysis andmanuscript writing. NRSV carried out the tumour model development andSPECT imaging. NRSV and ASA carried out cell labelling. NRSV, ASA, MMA, BJcarried out image analysis. NRSV, ASMI, AS, TFB carried out histologicalstaining and analysis. All authors read and approved the final manuscript.
FundingThis work is supported by NIH grants 1R21CA129801, R01CA122031 (to ASA),R21NS066143 (to MMA), K25CA129173 (to MMA) and HFHS internal grant (toNRSV). The funders had no role in study design, data collection and analysis,decision to publish, or preparation of the manuscript.
Received: 13 November 2012 Accepted: 29 May 2013Published: 10 June 2013
References1. Huncharek M, Muscat J: Treatment of recurrent high grade astrocytoma;
results of a systematic review of 1,415 patients. Anticancer Res 1998,18:1303–1311.
2. Salcman M, Scholtz H, Kaplan RS, Kulik S: Long-term survival in patientswith malignant astrocytoma. Neurosurgery 1994, 34:213–219.
3. Bexell D, Svensson A, Bengzon J: Stem cell-based therapy for malignantglioma. Cancer Treat Rev 2012, 39(4):358–365.
4. Panciani PP, Fontanella M, Tamagno I, Battaglia L, Garbossa D, et al: Stemcells based therapy in high grade glioma: why the intraventricular routeshould be preferred? J Neurosurg Sci 2012, 56:221–229.
5. Altaner C, Altanerova V: Stem cell based glioblastoma gene therapy.Neoplasma 2012, 59:756–760.
6. Arbab AS, Pandit SD, Anderson SA, Yocum GT, Bur M, et al: Magneticresonance imaging and confocal microscopy studies of magneticallylabeled endothelial progenitor cells trafficking to sites of tumorangiogenesis. Stem Cells 2006, 24:671–678.
7. Arbab AS, Frank JA: Cellular MRI and its role in stem cell therapy. RegenMed 2008, 3:199–215.
8. Arbab AS, Janic B, Knight RA, Anderson SA, Pawelczyk E, et al: Detection ofmigration of locally implanted AC133+ stem cells by cellular magneticresonance imaging with histological findings. FASEB J 2008,22:3234–3246.
9. Janic B, Rad AM, Jordan EK, Iskander AS, Ali MM, et al: Optimization andvalidation of FePro cell labeling method. PLoS One 2009, 4:e5873.
10. Arbab AS, Janic B, Jafari-Khouzani K, Iskander AS, Kumar S, et al:Differentiation of glioma and radiation injury in rats using in vitroproduce magnetically labeled cytotoxic T-cells and MRI. PLoS One 2010,5:e9365.
11. Janic B, Jafari-Khouzani K, Babajani-Feremi A, Iskander AS, Varma NR, et al:MRI tracking of FePro labeled fresh and cryopreserved long term in vitroexpanded human cord blood AC133+ endothelial progenitor cells in ratglioma. PLoS One 2012, 7:e37577.
12. Bouziotis P, Psimadas D, Tsotakos T, Stamopoulos D, Tsoukalas C:Radiolabeled Iron Oxide Nanoparticles As Dual-Modality SPECT/MRI andPET/MRI Agents. Curr Top Med Chem 2012, 12:2694–2702.
13. Huang J, Xie J, Chen K, Bu L, Lee S, et al: HSA coated MnO nanoparticleswith prominent MRI contrast for tumor imaging. Chem Commun (Camb)2010, 46:6684–6686.
14. Kim T, Momin E, Choi J, Yuan K, Zaidi H, et al: Mesoporous silica-coatedhollow manganese oxide nanoparticles as positive T1 contrast agentsfor labeling and MRI tracking of adipose-derived mesenchymal stemcells. J Am Chem Soc 2011, 133:2955–2961.
15. Hofmann M, Wollert KC, Meyer GP, Menke A, Arseniev L, et al: Monitoringof bone marrow cell homing into the infarcted human myocardium.Circulation 2005, 111:2198–2202.
16. Huang J, Lee CC, Sutcliffe JL, Cherry SR, Tarantal AF: Radiolabeling rhesusmonkey CD34+ hematopoietic and mesenchymal stem cells with 64Cu-pyruvaldehyde-bis(N4-methylthiosemicarbazone) for microPET imaging.Mol Imaging 2008, 7:1–11.
17. Varma NR, Janic B, Iskander AS, Shankar A, Bhuiyan MP, et al: Endothelialprogenitor cells (EPCs) as gene carrier system for rat model of humanglioma. PLoS One 2012, 7:e30310.
18. Rini JN, Bhargava KK, Tronco GG, Singer C, Caprioli R, et al: PET with FDG-labeled leukocytes versus scintigraphy with 111In-oxine-labeledleukocytes for detection of infection. Radiology 2006,238:978–987.
19. Brenner W, Aicher A, Eckey T, Massoudi S, Zuhayra M, et al: 111In-labeledCD34+ hematopoietic progenitor cells in a rat myocardial infarctionmodel. J Nucl Med 2004, 45:512–518.
20. Thakur MLGA: Indium-111 labeled neutrophils, platelets, and lymphocytes.New York, NY: Trivirum; 1979.
21. Vemulapalli S, Metzler SD, Akabani G, Petry NA, Niehaus NJ, et al: Celltherapy in murine atherosclerosis: in vivo imaging with high-resolutionhelical SPECT. Radiology 2007, 242:198–207.
22. Aicher A, Brenner W, Zuhayra M, Badorff C, Massoudi S, et al: Assessment ofthe tissue distribution of transplanted human endothelial progenitorcells by radioactive labeling. Circulation 2003, 107:2134–2139.
23. Wilson T, Stark C, Holmbom J, Rosling A, Kuusilehto A, et al: Fate of bonemarrow-derived stromal cells after intraperitoneal infusion orimplantation into femoral bone defects in the host animal. J Tissue Eng2010, 2010:345806.
24. Kraitchman DL, Tatsumi M, Gilson WD, Ishimori T, Kedziorek D, et al:Dynamic imaging of allogeneic mesenchymal stem cells trafficking tomyocardial infarction. Circulation 2005, 112:1451–1461.
25. Gildehaus FJ, Haasters F, Drosse I, Wagner E, Zach C, et al: Impact ofindium-111 oxine labelling on viability of human mesenchymal stemcells in vitro, and 3D cell-tracking using SPECT/CT in vivo. Mol ImagingBiol 2011, 13:1204–1214.

Varma et al. BMC Medical Imaging 2013, 13:17 Page 9 of 9http://www.biomedcentral.com/1471-2342/13/17
26. Li B, Sharpe EE, Maupin AB, Teleron AA, Pyle AL, et al: VEGF and PlGFpromote adult vasculogenesis by enhancing EPC recruitment and vesselformation at the site of tumor neovascularization. FASEB J 2006, 20:1495–1497.
27. Rosenbaum JT, Ronick MB, Song X, Choi D, Planck SR: T cell-antigen-presenting cell interactions visualized in vivo in a model of antigen-specific inflammation. Clin Immunol 2008, 126:270–276.
doi:10.1186/1471-2342-13-17Cite this article as: Varma et al.: Differential biodistribution ofintravenously administered endothelial progenitor and cytotoxic T-cellsin rat bearing orthotopic human glioma. BMC Medical Imaging 201313:17.
Submit your next manuscript to BioMed Centraland take full advantage of:
• Convenient online submission
• Thorough peer review
• No space constraints or color figure charges
• Immediate publication on acceptance
• Inclusion in PubMed, CAS, Scopus and Google Scholar
• Research which is freely available for redistribution
Submit your manuscript at www.biomedcentral.com/submit