biodistribution of single and aggregated gold
TRANSCRIPT
RESEARCH Open Access
Biodistribution of single and aggregatedgold nanoparticles exposed to the humanlung epithelial tissue barrier at the air-liquidinterfaceEstelle Durantie1, Dimitri Vanhecke1, Laura Rodriguez-Lorenzo1, Flavien Delhaes1, Sandor Balog1, Dedy Septiadi1,Joel Bourquin1, Alke Petri-Fink1,2 and Barbara Rothen-Rutishauser1*
Abstract
Background: The lung represents the primary entry route for airborne particles into the human body. Most studiesaddressed possible adverse effects using single (nano)particles, but aerosolic nanoparticles (NPs) tend to aggregateand form structures of several hundreds nm in diameter, changing the physico-chemical properties and interactionwith cells. Our aim was to investigate how aggregation might affect the biodistribution; cellular uptake andtranslocation over time of aerosolized NPs at the air-blood barrier interface using a multicellular lung system.
Results: Model gold nanoparticles (AuNPs) were engineered and well characterized to compare single NPs withaggregated NPs with hydrodynamic diameter of 32 and 106 nm, respectively. Exposures were performed byaerosolization of the particles onto the air-liquid interface of a three dimensional (3D) lung model. Particle deposition,cellular uptake and translocation kinetics of single and aggregated AuNPs were determined for various concentrations,(30, 60, 150 and 300 ng/cm2) and time points (4, 24 and 48 h) using transmission electron microscopy and inductivelycoupled plasma optical emission spectroscopy. No apparent harmful effect for single and aggregated AuNPs wasobserved by lactate dehydrogenase assay, nor pro-inflammation response by tumor necrosis factor α assessment.The cell layer integrity was also not impaired. The bio-distribution revealed that majority of the AuNPs, single oraggregated, were inside the cells, and only a minor fraction, less than 5%, was found on the basolateral side. Nosignificant difference was observed in the translocation rate. However, aggregated AuNPs showed a significantly fastercellular uptake than single AuNPs at the first time point, i.e. 4 h.
Conclusions: Our studies revealed that aggregated AuNPs showed significantly faster cellular uptake than singleAuNPs at the first time point, i.e. 4 h, but the uptake rate was similar at later time points. In addition, aggregation didnot affect translocation rate across the lung barrier model since similar translocation rates were observed for single aswell as aggregated AuNPs.
Keywords: Aggregate, Gold nanoparticle, Air liquid interface cell exposure, Biodistribution, Human epithelial airwaymodel, Translocation, Cellular uptake
* Correspondence: [email protected] Group, Adolphe Merkle Institute, Université de Fribourg,Chemin des Verdiers 4, 1700 Fribourg, SwitzerlandFull list of author information is available at the end of the article
© The Author(s). 2017 Open Access This article is distributed under the terms of the Creative Commons Attribution 4.0International License (http://creativecommons.org/licenses/by/4.0/), which permits unrestricted use, distribution, andreproduction in any medium, provided you give appropriate credit to the original author(s) and the source, provide a link tothe Creative Commons license, and indicate if changes were made. The Creative Commons Public Domain Dedication waiver(http://creativecommons.org/publicdomain/zero/1.0/) applies to the data made available in this article, unless otherwise stated.
Durantie et al. Particle and Fibre Toxicology (2017) 14:49 DOI 10.1186/s12989-017-0231-3
BackgroundAgglomeration and/or aggregation is an ubiquitousphenomenon observed for nanoparticles (NPs), however,the interaction of NP agglomerates with cells/tissueshave only rarely being studied, consequently very little isknown on their interaction with biological systems andsubsequent fate [1–3]. Agglomerates and aggregates aresecondary entities in which single NPs, or primary parti-cles, are held together. In agglomerates, primary parti-cles are assembled by weak physical interactions (i.e. vander Waals forces) and the whole process is reversible,while aggregates are defined as comprising stronglybonded primary particles, and the process is irreversible[4]. Agglomerates and aggregates will be simplified to theaggregates term from now on. These assembled NPs sys-tems display more complex physicochemical propertiesthan single NPs as their size, morphology, surface area andeffective density will depend additionally on the fractal di-mension and packing factors [5–7]. Combustion-derivedNPs, are major contributors of aggregates in the airborneambient air and, have been associated to adverse health ef-fect [8, 9]. During the combustion process, i.e. diesel orgasoline engines, unburned or partially burned fuel undergonucleation process forming single particles with diameter ofabout 10–30 nm [10, 11]. These single particles can furthercollapse to form aggregates with mean diameter below100 nm up to several hundreds of nm which results in a re-duced concentration number [6, 12, 13].Humans are constantly exposed to airborne particles
of different sources in the environment which enter thehuman body mainly by inhalation. NPs with a diameterfrom 5 to 500 nm can enter and penetrate into the al-veolar region of the lung by diffusion processed [14] andthe deposited NPs have been shown to translocate acrossthe air-blood barrier reaching the blood or lymphaticcirculation, to be further distributed to secondary organs[15–19]. Evidence suggest that NPs’ translocation inhealthy lungs most likely occurs via transcellular ratherthan paracellular pathway [20]. Moreover, findings sup-port active processes, e.g. endocytotic uptake mechan-ism, to be preferentially involved, albeit passive diffusionis not excluded. It has been shown that NPs’ physico-chemical properties, such as size, shape and surface, in-fluence their uptake into cells and transport across thelung barrier (translocation) [21]. Some studies in ratshave reported a higher translocation rate of smaller NPs[17, 19, 22, 23], while in others studies NP surfacecharge was found to influence the translocation [16].Although aggregation is a common phenomenon, mostof the in vitro and in vivo studies assume NPs remain ina single state when studying interactions with cellular,tissue or organ structures. There are only few investiga-tions explicitly on the interactions of aggregates withbiological systems (for a review see ref. [24]). Among the
very rare in vivo studies, the effect of the aggregate sizeor effect of the primary particle size were explored inrats. It has been shown that smaller aggregates, 20 vs80 nm, containing same primary single iridium NPs(2.4 nm) [19] or smaller primary particle size AuNPs, 7vs 20 nm, forming aggregates with peak diameter of45 nm [25] exhibited higher translocation and widerdistribution to secondary organs. However, systematicin-depth studies at the mechanistic level comparingsingle particles with aggregates are still missing.In the present work, the behavior of single and aggre-
gated AuNPs was compared regarding their biodistribu-tion across the air-blood tissue barrier by investigatingtheir cellular uptake and translocation at different timepoints (i.e. 4, 24 and 48 h). Well-defined single and ag-gregated particles were used as model particles withhydrodynamic diameters of 32 and 106 nm, respectively,composed of primary AuNPs of 14.5 nm (core diameter)stabilized with polymer mixture consisting of polyvinylalcohol and polyallyl amine (PVA/PAAm). To simulate arealistic inhalation the NPs were deposited at the air-liquid interface onto an in vitro 3D human alveolar epi-thelial barrier. The 3D human lung model, developed byRothen-Rutishauser et al. [26], is composed of humanlung alveolar cells (A549 cell line), primary human-monocyte derived macrophages and dendritic cells. Thecells were exposed to single and aggregated AuNPs atthe air-liquid interface at four different concentrations,i.e. 30, 60, 150 and 300 ng/cm2, and the deposition wasthoroughly characterized by inductively coupled plasmaoptical emission spectrometry (ICP-OES) and transmis-sion electron microscopy (TEM). Cytotoxicity, pro-inflammation and cell layer integrity were assessed at 4,24 and 48 h after exposure. NPs cellular uptake andtranslocation were then assessed by measuring the massof gold by ICP-OES in the individual compartments (i.e.apical side, inside the tissue and in the basal medium).In addition, localization of intracellular NPs was ana-lyzed by TEM.
MethodsAuNP synthesisSingle and aggregated AuNPs were prepared followingthe procedure of Hirsch et al. with an adaptation of thepolymer coating [27].Synthesis of tiopronin-coated AuNPs: Briefly, to a
solution of tetrachloroauric acid (500 mL, 0.5 mM; SigmaAldrich Chemie GmbH, Buchs, Switzerland) in ultrapurewater (MilliQ H2O, Merck Millipore) heated at reflux wasadded quickly a warmed solution of sodium citrate (25 mL,1% w/v) and stirred for 15 min. The reaction mixture wascooled to room temperature and a solution of tiopronin(2-mercaptopropionylglycine; Sigma-Aldrich) (15.5 mL,
Durantie et al. Particle and Fibre Toxicology (2017) 14:49 Page 2 of 14
0.5 mM) was added. The reaction mixture was stirred atroom temperature overnight.Preparation of polymer mixture PVA/PAAm-(17 kDa)
and PVA/PAAm-(65 kDa): The mixtures of poly(vinyl al-cohol) (PVA) and poly(allylamine) (PAAm), PVA/PAAm-(17 kDa) and PVA/PAAm-(65 kDa) were prepared bydissolving PVA (11.8% w/v; 5.9 g; 14 kDa, Mowiol 3–85,Omya AG, Switzerland) and PAAm 17 kDa (0.2% w/v;490 μL; Fluka solution 20% wt) or PAAm 65 kDa (0.2%w/v; 980 μL; Fluka solution 10% wt), respectively, inMilliQ H2O (final volume 50 mL) and stirred overnight.In the polymer mixtures PVA/PAAm (11.8:0.2, mass
ratio), the PAAm size was changed depending if it wasused to coat single or aggregated AuNPs. The PAAm65 kDa was chosen to ensure the electrosteric stabilizationof the assembly while PAAm 17 kDa was used to coatsingle AuNPs, hence avoiding any aggregation due topolymer length. However, to make comparative study ofthe two systems, it is important to note that amount ofamines remains equal in the two mixtures.Preparation of single AuNPs: The solution of tiopronin-
coated AuNPs (100 mL) was added dropwise to the aque-ous polymer mixture PVA/PAAm-(17 kDa) (9 mL) andstirred for 4 h at room temperature. After 1 day of storageat 4 °C, the suspension was centrifuged at 10000 × g for1 h and the supernatant was collected and centrifugedagain under the same conditions. This process was re-peated one more time.Preparation of aggregates AuNPs: The solution of
tiopronin-coated AuNPs (10 mL) was treated with HCl(1 M, 36 μL) so that the mixture reaches a pH of 3. Anaqueous mixture of polymer PVA/PAAm-(65 kDa) wasadded to stabilize the agglomerates. After 1 day of stor-age at 4 °C, the suspension was centrifuged at 5000 × gfor 1 h. This process was repeated one more time.
AuNPs characterisationUV-Vis spectroscopyUV-Vis spectra of the single and aggregated AuNPs wererecorded in MilliQ H2O using a Jasco V-670 spectropho-tometer (Jasco Europe S.R.L., Milano, Italy) with 10 mmoptical pathlength optical glass cuvettes. Concentration ofAuNPs suspensions were determined by the absorbanceintensity at 400 nm as described by Scarabelli et al. [28].
Transmission electron microscopy (TEM)All samples were measured with an FEI Tecnai spiritTEM (FEI, Hillsboro, Oregon, USA) at 120 kV. Imageswere recorded with a Veleta CCD camera 2048 × 2048(Olympus-SIS, Münster, Germany) or Eagle CCD camera4096 × 4096 (FEI, Hillsboro, Oregon, USA) and processedusing ImageJ software as described in the supporting in-formation (Section 1 of Additional file 1: Supplementaryinformation).
Single AuNPs were characterized using conventionalTEM: Briefly, single AuNPs suspension (10 μL) was de-posited onto a 400 mesh carbon-coated copper grid andlet dried at room temperature. Images were recordedwith the Veleta camera.Aggregated AuNPs were characterized using cryo-TEM:
Aggregated AuNPs suspension (5 μL) was deposited on acarbon-coated copper grid and liquid excess was carefullyremoved with filter paper. The grid was then plunged intoa liquid ethane bath cooled by liquid nitrogen. The result-ing vitrified sample was then stored in liquid nitrogen priorto analysis. Images were recorded using the Eagle camera.
Depolarized dynamic light scattering (DDLS)Light scattering data were collected at constant tem-perature (21 °C) at θ = 15°, using a commercial goniometerinstrument (3D LS Spectrometer, LS Instruments AG,Switzerland). The primary beam was formed by a linearlypolarized and collimated laser beam (Cobalt 05–01 diodepumped solid state laser, λ = 660 nm, P max. = 500 mW),and the scattered light was collected by single-mode opticalfibres equipped with integrated collimation optics. Thecollected light was coupled into two high-sensitivity APDdetectors via laser-line filters (Perkin Elmer, Single PhotonCounting Module), and their outputs were fed into a two-channel multiple-tau correlator. The signal-to-noise ratiowas improved by cross-correlating these two channels.With respect to the primary beam, depolarized scatteringwas observed via cross-polarizers. The incoming laser beampassed through a Glan-Thompson polarizer with an extinc-tion ratio of 10−6, and another Glan-Thompson polarizer,with an extinction ratio of 10−8, was mounted in front ofthe collection optics. To estimate the number-averaged par-ticle size distribution, the DDLS spectra were analyzed bythe approach presented elsewhere [29].
3D human epithelial tissue barrier modelCell cultureExperiments were carried out using the human alveolarepithelial type II cell line A549 [30], human bloodmonocyte-derived macrophages (MDM) and dendritic cells(MDDC). A549 cell line was obtained from the AmericanType Culture Collection (ATCC, USA), while humanwhole blood monocytes (MDM and MDDC) were isolatedfrom buffy coats provided by the blood donation serviceSRK Bern and purified using CD14 Microbeads (MiltenyBiotech) [31]. Cells were maintained in RPMI 1640 (Gibco,Life Technologies Europe B.V., Zug, Switzerland) supple-mented with 10% (v/v) fetal bovine serum (FBS; PAALaboratories, Chemie Brunschwig AG, Basel, Switzerland),1% (v/v) L-Glutamine (Life Technologies Europe) and 1%(v/v) penicillin/streptomycin (Gibco) and placed in ahumidified incubator (37 °C, 5% CO2). A549 cellswere subcultured through trypsinization when reached
Durantie et al. Particle and Fibre Toxicology (2017) 14:49 Page 3 of 14
near-confluence and medium was changed every 3 days.Initial cell concentrations were calculated using trypanblue exclusion method (0.4% Trypan blue solution, T8154;Sigma Aldrich). The working cell concentrations wereprepared by diluting cells with cell culture medium.
3D co-culture modelThe co-cultures were prepared as previously described[26]. Briefly, A549 cells (54⋅104 cells/mL, 0.5 mL, upperchamber) were seeded on a transparent BD Falcon cell cul-ture inserts (surface area of 0.9 cm2, pores of 3.0 μm diam-eter, PET membranes for 12-well plates; BD Biosciences)placed in a BD Falcon tissue culture plates (12-er wellplates; BD Biosciences) containing 1.5 mL medium (lowerchamber). Cells were cultured for 4 days and the mediumwas changed after the 2nd day. On day 5, medium was re-moved from the upper and lower chambers, the insertswere turned up-side down, placed in a petri dish and cellsat the bottom of the membrane were gently abraded with acell scraper. MDDCs (84⋅104 cells/mL, 65 μL) were thenpipetted onto the bottom side of the inserts and incubatedfor 70 min. Afterwards, the insert were placed back intothe well plate containing 1.5 mL fresh medium. FinallyMDMs (2.5⋅104 cells/mL, 0.5 mL) were added on top ofthe A549 cells prior to be incubated for another 24 h. Thecells were then transferred from submerged to air-liquidinterface conditions 24 h prior to be exposed. On day 6,medium was removed from the upper chamber andmedium form the lower chamber was replaced with0.6 mL of fresh medium.
Characterization of co-culture model with laser scanningmicroscopy (LSM)LSM description: Samples were acquired using LSM 710Meta with an inverted Zeiss microscope (Carl ZeissGmbH, Jena, Germany). The z-stack images of the cellswere acquired using 20× and 40× magnification lens withnumerical aperture with numerical aperture, NA 0.75 and1.3, respectively. Image processing was performed usingImageJ software and 3D rendering with Imaris software.Visualization of the 3D co-culture model: In order to
obtain a clear characterization of the 3D co-culture model,each cell type was stained with different fluorophores(Vybrant® multicolor cell labeling kit, Invitrogen Molecu-lar Probes) prior to the co-culture composition. Briefly,MDDCs and MDMs (1.106 cells/mL in RPMI 1640) weretreated with vibrant dye DiI and DiD, respectively, (5 μLfor 1 mL of cell suspension) and incubated for 20 min inthe incubator. Cells were centrifuged and washed withRPMI 1640 3 times prior to be seeded. In the meantime,the layer of A549 grown on the insert was treated withvibrant dye DiO (1.5 μL in 200 μL of RPMI 1640) andincubated for 20 min in the incubator. Cells were washedtwice with RPMI 1640 for 10 min. The co-cultures were
then composed as previously described except that MDMswere seeded at a higher density (4⋅104 cells/mL) in orderto improve their visualization in the window frame.
Air-liquid Interface cell exposureExposure systemThe cells were exposed to AuNPs at the air-liquid inter-face using the Vitrocell® Cloud exposure system. It con-sists of three main parts: a nebulizer, an aerosol chamberand a base module constituted of 12-well size inserts andconnected to a controlled heating unit. The aerosol is gen-erated into the exposure chamber via a vibrating mesh(Aeroneb®Pro, Aerogen, with a span of 2.5–6.0 μm volumemean diameter). The Vitrocell® Cloud exposure systemallows for a dose-controlled and uniform deposition.
Cell exposureCells were exposed at the air-liquid interface to single andaggregated AuNPs by nebulization of 200 μL of AuNPssuspension in 0.5 mM NaClaq at the specific concentrationsof 0.05, 0.10, 0.25 and 0.50 mg/mL (concentrations deter-mined by UV-Vis measurements). Exposure to 200 μL of0.5 mM NaClaq only was done as negative control. After10 min exposure, deposition of cloud was complete andthe TCCC were kept at the air-liquid interface in freshmedium for post-exposure incubation times of 4, 24 and48 h in the incubator.
Deposition characterizationThe deposition of AuNPs after nebulization was analyzedby inductively coupled plasma optical emission spectros-copy (ICP-OES) and transmission electron microscopy(TEM) to determine the mass of gold and the number ofparticles (i.e. single or aggregates), respectively.
TEM analysisFor each exposure condition (single/aggregated AuNPand concentration), a single slot copper grid was ex-posed to nebulized AuNPs. Deposition was repeated intriplicate for each condition. Automatic acquisition of 25images per grid was recorded using the Eagle camera ata magnification of 18,500X (image size 2.39 × 2.39 μm).Images containing obvious large artefacts (i.e. dirt, gridedge) that interfered with the automated thresholdingwere excluded prior to the image processing, since thesedata yield biased results. Also empty pictures were notprocessed. Image processing was performed on a stackof images as described in the supporting information(Section 1 of Additional file 1: Supplementary information)and the number of analyzed particles is also reported. Theoutput of the analysis is the number of events (single parti-cles or aggregates) and their associated area. Hence, thenumber deposition (single and aggregated AuNPs/cm2)and surface deposition (% area) can be obtained by the
Durantie et al. Particle and Fibre Toxicology (2017) 14:49 Page 4 of 14

ratio of these results and the total surface area of allpictures (including empty pictures).
ICP-OES analysisMass deposition was determined by addition of the massof each fraction (apical, intracellular and basal). Seechapter below.
Biological responseCell morphology, cell layer integrity, cytotoxicity and(pro)-inflammation of co-culture model exposed toAuNPs were evaluated and compared to co-culture modelexposed to 0.5 mM aqueous NaCl as negative control.Assays were repeated in 3 individual experiments.
Cell morphology after exposure was analyzed by LSM(see LSM description above)After particle exposure and post-incubation, the sampleswere washed with PBS, fixed with paraformaldehyde (4% inPBS, Sigma Aldrich) for 10 to 15 min and washed twicewith PBS. The samples were incubated with DAPI (4′,6-diamidino-2-phenylindole, Sigma Aldrich) (1:100, nucleistain) and rhodamine phalloidin (1:50, F-actin cytoskeletonstain, Life Technologies) in Triton X-100 solution (0.2% inPBS, to permeabilize the cell membrane, Sigma Aldrich) for60 min. Afterwards, the samples were washed with PBS(3 times) prior to be mounted on objective slides inglycergel mounting medium (Dako).
Cell layer integrityPermeability to fluorescein isothiocyanate (FITC) coupledto dextran 70 kDa (Sigma Aldrich) was used to assess celllayer integrity. Intact epithelial cell layer grown on a mem-brane forming tight junction should prevent paracellulartransport, and so transport of FITC dextran applied on theapical side is low. Briefly, after post-exposure time, TCCCwas rinsed with RPMI without phenol red and the mediumin the basal side was replaced by 1.5 mL of RPMI withoutphenol red. At the apical side, 500 μL of 1 mg/mL FITCdextran in RPMI without phenol red was applied andincubated for 1 h. As a positive control, EDTA(Ethylenediaminetetraacetic Acid, Sigma Aldrich) 10 mMin RPMI without phenol red was added to the FITC dextransolution applied at the apical side. Afterwards, medium inthe lower side was collected and the passage of FITCdextran was quantified by measuring fluorescence ofthe sample in triplicate using a Multireader microplate(λex/λem = 490/520 nm). The fluorescence was normalizedto the translocation of the FITC dextran trough an emptyinsert.
CytotoxicityThe cytotoxicity was assessed by measuring the releaseof the cytosolic enzyme lactate dehydrogenase (LDH)
into the medium (basal compartment) that is indicativeof cell membrane damage. LDH was quantified using theLDH cytotoxicity detection kit (Roche Applied Science,Germany) according to the manufacturer’s guidelines andabsorbance was read at 490 nm using a microplate reader(Bio-Rad). The sample was measured in triplicate, sampleabsorbance was corrected by subtracting medium absorb-ance and values were then normalized to the negativecontrol. As a positive control, TCCC were treated with100 μL of 0.2% triton X100 in PBS at the apical side andplaced in the incubator for the post-exposure time. Posi-tive control sample was diluted 10 times prior to be mea-sured to remain in the linear part of the LDH activity andthe absorbance was then multiply by the diluting factor toexpress the normalized LDH activity.
(pro)-inflammationThe (pro)-inflammation response was investigated byquantifying the tumor necrosis factor α (TNF-α) releaseinto the medium (basal compartment) using the DuoSetELISA Development Kit (R&D Systems) according tothe manufacturer’s protocol and absorbance was read at450 nm using a microplate reader (Bio-Rad). The samplewas measured in triplicates, sample absorbance was cor-rected by subtracting medium absorbance. As a positivecontrol, TCCC were treated with 600 μL of LPS 1 μg/mLin medium at the basal side and placed in the incubatorfor the post-exposure time.
Particle distributionFor each exposure condition (i.e. AuNPs type, concen-tration and time), apical, intracellular and basal fractionswere collected from 3 different inserts and the amountof gold was determined using ICP-OES. Each exposurecondition was repeated in 4 individual experiments.
Sample collectionFirst, the basolateral medium was collected. Then, to re-cover particles deposited on the apical side that have notbeen associated with cells, the cell layer was washedtwice with PBS (300 μL). Finally, the cells were collectedby scrapping the cells after treatment with trypsin-EDTA (600 μL) for approximatively 25 min at 37 °C.The obtained samples were stored at −80 °C until fur-ther processing.
Sample preparationMicrowave-assisted acidic digestion of AuNP sampleswas conducted in the microwave Multiwave Pro (AntonPaar, Germany) which is equipped with two standardmagnetrons of 850 W able to deliver a microwave powerup to 1500 W in an unpulsed mode over the full powerrange. The applied microwave energy is controlled bycontactless sensors for internal temperature and vessel
Durantie et al. Particle and Fibre Toxicology (2017) 14:49 Page 5 of 14

pressure and by IR sensor which is equipped with atemperature sensor, preventing overheating, and an IRsensor monitors the temperature of vessels. Rotor24HVT50 was used with pressure vessels HVT50 madeof PTFE-TFM. Briefly, samples were gradually defrostedfrom −80 °C → -20 °C → 4 °C → room temperature.Samples were transferred into vessels and were treatedwith HNO3 70% (0.6 mL, Sigma Adrich) and H2O2
30% (0.3 mL, Merck). The volume was completed to3 mL with millipore H2O (0.3 mL). Samples were placedin the microwave and the mixture was irradiated at100 °C (ramp for 10 min, hold 10 min) and further at140 °C (ramp for 10 min, hold for 10 min) and finallycooled to 70 °C (ramp 12 min) with a maximum power of600 W. Samples was then transferred into 15 mL falcontubes, and each vessel was rinsed with millipore H2O(0.5 mL). Finally samples were completed with milliporeH2O, if necessary, to a final volume of 3.5 mL.
ICP-OESICP-OES analyses were carried out on an Optima 7000DV, Perkin Elmer. Measurements were performed at awavelength of 242.8 nm, at an axial plasma view. Theplasma flow was 15 L/min and the sample flow rate1.5 mL/min. Calibration was performed using a goldstandard for ICP (1001 mg/L ± 2 mg/L, Fluka) for eachmatrix from 0.025 to 0.5 μg/mL. Samples were measuredin triplicate and a washing step was performed by the in-strument between each exposure condition. Analysis wasrepeated 4 times for each exposure condition. The ob-tained concentration (μg/mL) was multiplied by thesample volume (3.5 mL) to determine the Au mass.
Particle localization in the co-culture by TEMSample preparation: All chemicals were obtained fromPolysciences, unless otherwise stated. The exposed cellson the transwell membrane were fixed with glutaralde-hyde 2.5% in HEPES buffer (0.03 M) for at least 48 h at4 °C. Then, they were washed three times at roomtemperature with sodium cacodylate buffer (0.1 M) undergentle stirring for at least 5 min per washing step. Thesamples were then post-fixed with OsO4 (1% in 0.1 M so-dium cacodylate buffer) for 2 h and washed again threetimes with sodium cacodylate buffer as described before.The dehydration of the samples was achieved using aseries of gradually increasing ethanol concentration(30, 50, 70, 80, 96 and 100% dried over molecular sieve),each step lasting 15 min followed by gradual increasingconcentrations of the epoxy embedding polymer in 100%ethanol dried over molecular sieve (30% for 1 h at 4 °C,70% overnight at 4 °C, 100% for 2 h at room temperature,repeated twice). The samples were then polymerized at60 °C for 72 h. From the polymerized epoxy resin blocks,ultrathin sections of 80 nm (gray-sliver reflection) were
sectioned perpendicular to the Transwell membrane by aUltra 35° diamond knife (Diatome, Nidau, Switzerland)using a Leica Ultracut UC6 ultramicrotome (LeicaMicrosystems, Wetzlar, Germany). These sections werethen brought onto Formvar film coated single slot coppergrids (PlanoEM, Wetzlar, Germany) and stained with ur-anyl acetate and lead citrate in a Leica EM Stain citrate(Leica Microsystems, Wetzlar, Germany). TEM imageswere recorded using the Veleta camera, with a resolutionof 11.2 nm/pixel (overviews) and 0.78 nm/pixel (details).
Data analysisNumber of repetitions is given in the respective para-graph. Individual experiments mean different aerosoliza-tion and cell culture with different passage number anddifferent monocytes isolations. Data are presented eitheras mean ± standard deviation or mean with data points.Statistics were run using ORIGINLAB. Statistical differ-ences were determined by comparison of the meansusing one-way ANOVA and Tukey’s honest significancedifference test (p = 0.05).
ResultsParticle AuNPs synthesis and characterizationSingle and aggregated AuNPs were prepared adaptingthe method developed by Hirsch et al. (Fig. 1a) [27].Citrate-capped AuNPs were covalently functionalizedwith tiopronin forming AuNPs which then displayed car-boxylic groups on the surface. As shown in the previousstudy, protonation of these carboxylic groups allows theformation of controlled aggregates. The agglomerationprocess is driven by electrostatic attraction between twotiopronin-AuNPs resulting from the hydrogen bondsformation, hence replacing the electrostatic repulsionwhen carboxylic groups are negatively charged. Agglom-eration was then stopped by addition of a polymer mix-ture composed of polyvinyl alcohol and polyallyl amine(PVA/PAAm). PVA/PAAm is important for stabilizingthe agglomerates to aggregates, because (i) amine groupsact as proton sponge, (ii) they interact with the negativecharges of the tiopronin-AuNPs and (iii) the overallPVA/PAAm coating prevents the reversal of the self-assembly at physiological pH. Single tiopronin-AuNPswere also coated with PVA/PAAm polymers to havesimilar chemical surface properties.The synthesized single and aggregated AuNPs were
then characterized by UV-Vis spectroscopy, TEM, DDLSand zeta-potential, the results are summarized in thetable (Fig. 1b). UV-Vis spectra (Fig. 1c) showed a redshift from 524 to 574 nm and a broadened localized sur-face plasmon resonance (LSPR) band for the aggregatesin comparison to the single NPs showing the formationof the aggregates. TEM images and DDLS measure-ments further confirmed the size and state of dispersion
Durantie et al. Particle and Fibre Toxicology (2017) 14:49 Page 6 of 14
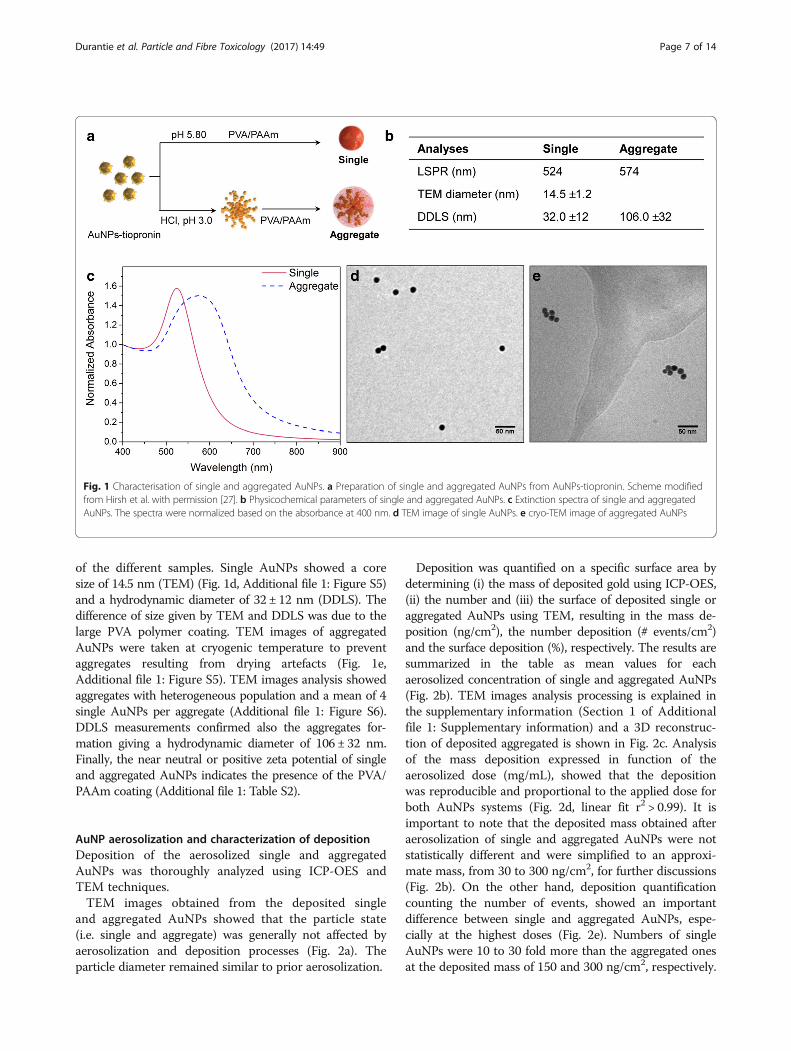
of the different samples. Single AuNPs showed a coresize of 14.5 nm (TEM) (Fig. 1d, Additional file 1: Figure S5)and a hydrodynamic diameter of 32 ± 12 nm (DDLS). Thedifference of size given by TEM and DDLS was due to thelarge PVA polymer coating. TEM images of aggregatedAuNPs were taken at cryogenic temperature to preventaggregates resulting from drying artefacts (Fig. 1e,Additional file 1: Figure S5). TEM images analysis showedaggregates with heterogeneous population and a mean of 4single AuNPs per aggregate (Additional file 1: Figure S6).DDLS measurements confirmed also the aggregates for-mation giving a hydrodynamic diameter of 106 ± 32 nm.Finally, the near neutral or positive zeta potential of singleand aggregated AuNPs indicates the presence of the PVA/PAAm coating (Additional file 1: Table S2).
AuNP aerosolization and characterization of depositionDeposition of the aerosolized single and aggregatedAuNPs was thoroughly analyzed using ICP-OES andTEM techniques.TEM images obtained from the deposited single
and aggregated AuNPs showed that the particle state(i.e. single and aggregate) was generally not affected byaerosolization and deposition processes (Fig. 2a). Theparticle diameter remained similar to prior aerosolization.
Deposition was quantified on a specific surface area bydetermining (i) the mass of deposited gold using ICP-OES,(ii) the number and (iii) the surface of deposited single oraggregated AuNPs using TEM, resulting in the mass de-position (ng/cm2), the number deposition (# events/cm2)and the surface deposition (%), respectively. The results aresummarized in the table as mean values for eachaerosolized concentration of single and aggregated AuNPs(Fig. 2b). TEM images analysis processing is explained inthe supplementary information (Section 1 of Additionalfile 1: Supplementary information) and a 3D reconstruc-tion of deposited aggregated is shown in Fig. 2c. Analysisof the mass deposition expressed in function of theaerosolized dose (mg/mL), showed that the depositionwas reproducible and proportional to the applied dose forboth AuNPs systems (Fig. 2d, linear fit r2 > 0.99). It isimportant to note that the deposited mass obtained afteraerosolization of single and aggregated AuNPs were notstatistically different and were simplified to an approxi-mate mass, from 30 to 300 ng/cm2, for further discussions(Fig. 2b). On the other hand, deposition quantificationcounting the number of events, showed an importantdifference between single and aggregated AuNPs, espe-cially at the highest doses (Fig. 2e). Numbers of singleAuNPs were 10 to 30 fold more than the aggregated onesat the deposited mass of 150 and 300 ng/cm2, respectively.
Fig. 1 Characterisation of single and aggregated AuNPs. a Preparation of single and aggregated AuNPs from AuNPs-tiopronin. Scheme modifiedfrom Hirsh et al. with permission [27]. b Physicochemical parameters of single and aggregated AuNPs. c Extinction spectra of single and aggregatedAuNPs. The spectra were normalized based on the absorbance at 400 nm. d TEM image of single AuNPs. e cryo-TEM image of aggregated AuNPs
Durantie et al. Particle and Fibre Toxicology (2017) 14:49 Page 7 of 14
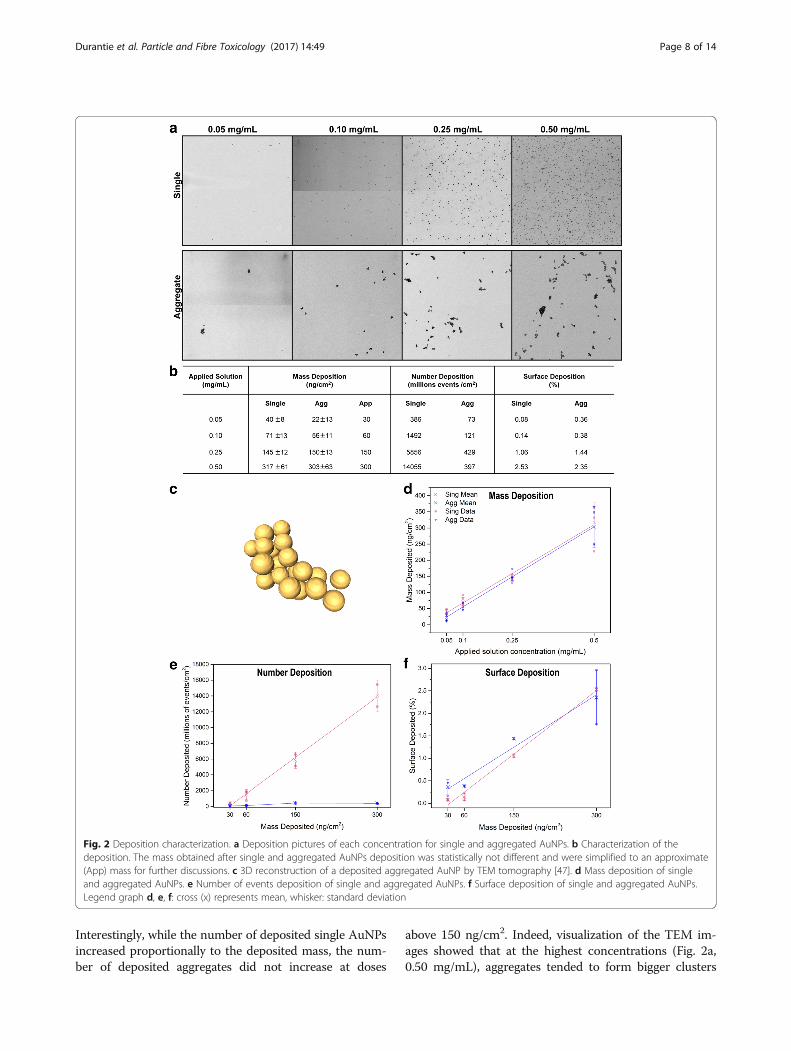
Interestingly, while the number of deposited single AuNPsincreased proportionally to the deposited mass, the num-ber of deposited aggregates did not increase at doses
above 150 ng/cm2. Indeed, visualization of the TEM im-ages showed that at the highest concentrations (Fig. 2a,0.50 mg/mL), aggregates tended to form bigger clusters
Fig. 2 Deposition characterization. a Deposition pictures of each concentration for single and aggregated AuNPs. b Characterization of thedeposition. The mass obtained after single and aggregated AuNPs deposition was statistically not different and were simplified to an approximate(App) mass for further discussions. c 3D reconstruction of a deposited aggregated AuNP by TEM tomography [47]. d Mass deposition of singleand aggregated AuNPs. e Number of events deposition of single and aggregated AuNPs. f Surface deposition of single and aggregated AuNPs.Legend graph d, e, f: cross (x) represents mean, whisker: standard deviation
Durantie et al. Particle and Fibre Toxicology (2017) 14:49 Page 8 of 14

while single particles remained mainly dispersed. Finally,analysis of the surface deposition showed that the depos-ited single and aggregated NPs covered similar total surfacearea which increased proportionally with the depositedmass (Fig. 2f). This is also supporting the previous obser-vation of a clustering effect with the aggregates at higherconcentration. Indeed, to obtain the same total surface areaas the single NPs, the individual deposited aggregatedNPs must have larger surface area to compensate thelower number deposition. Determination of the numberof particles per aggregates showed an increase at thehighest concentration (300 ng/cm2) (Additional file 1:Figure S6). The larger size of the deposited aggregates athigher concentration could be the result of agglomer-ation occurring during nebulization, as also observed forhigher concentration of nebulized superparamagneticiron oxide NPs [32] and/or the result of the dryingartifact of the more concentrated nebulized droplets.
Characterization of the 3D human epithelial tissue barrierafter AuNPs exposureThe in vitro lung model was first characterized by LSM.As depicted in Fig. 3a, the three cell types, each repre-sented in a different color, were visualized. The presenceof the apical layer composed of a monolayer of alveolar
cells (green) with incorporated MDMs (red), while at thebasal side MDDCs (orange) were observed.No noticeable change was observed in the cell morph-
ology after exposure to different concentrations of singleand aggregated AuNPs in comparison to control culturesexposed to NaClaq solution only (Fig. 3b-d).The epithelial integrity of the cell layer after exposure
was also assessed by testing the FITC-dextran (70 kDa)permeability. As shown in Fig. 3e, FITC-dextrantranslocation across the barrier 24 h after exposure toNaClaq solution was very low (1.95%) and remained lowafter 48 h (1.80%). Similar translocation rates were foundfor cells exposed to the highest concentration of singleand aggregated AuNPs. In contrast, when the cells weretreated with EDTA, a chelator agent known to openthe tight junctions, dextran translocation increased toabout 50%.
Cell response after AuNPs exposurePost-exposure cytotoxicity was assessed by measuringthe release of lactate dehydrogenase enzyme into themedium. As shown in Fig. 4, cell exposure to single andaggregated AuNPs up to the highest dose of 300 ng/cm2,did not show any apparent membrane damage 4, 24 and48 h in comparison to saline solution.
Fig. 3 Characterization of 3D human epithelial tissue barrier. a Laser Scanning Microscopy (LSM) of 3D co-culture model after 3D rendering:epithelial cells (green), macrophages (red), and dendritic cells (orange). The triple layer co-culture with macrophages on top and dendritic cellsat the bottom is shown from two different views. b-d LSM images of F-actin (magenta) and nuclei (cyan) 24 h after exposure to b. NaClaq solution,c Single AuNPs 60 ng/cm2, d Aggregated AuNPs 60 ng/cm2. e Translocation of FITC-Dextran 70 kDa accross the co-culture 24 and 48 h after-exposureto single and aggregated AuNPs (300 ng/cm2). The fluorescence in the baso-lateral compartment was measured and normalized to the blank control(empty insert, without cells). Sing = single; Agg = aggregate. Plain horizontal line represents the mean value and dashed horizontal line the median
Durantie et al. Particle and Fibre Toxicology (2017) 14:49 Page 9 of 14

(Pro)-inflammation response to AuNPs exposure wasassessed by measuring the released cytokine TNFα. NoTNFα release has been measured in comparison to thepositive control indicating that the particles did not in-duce any pro-inflammatory reactions (data not shown).
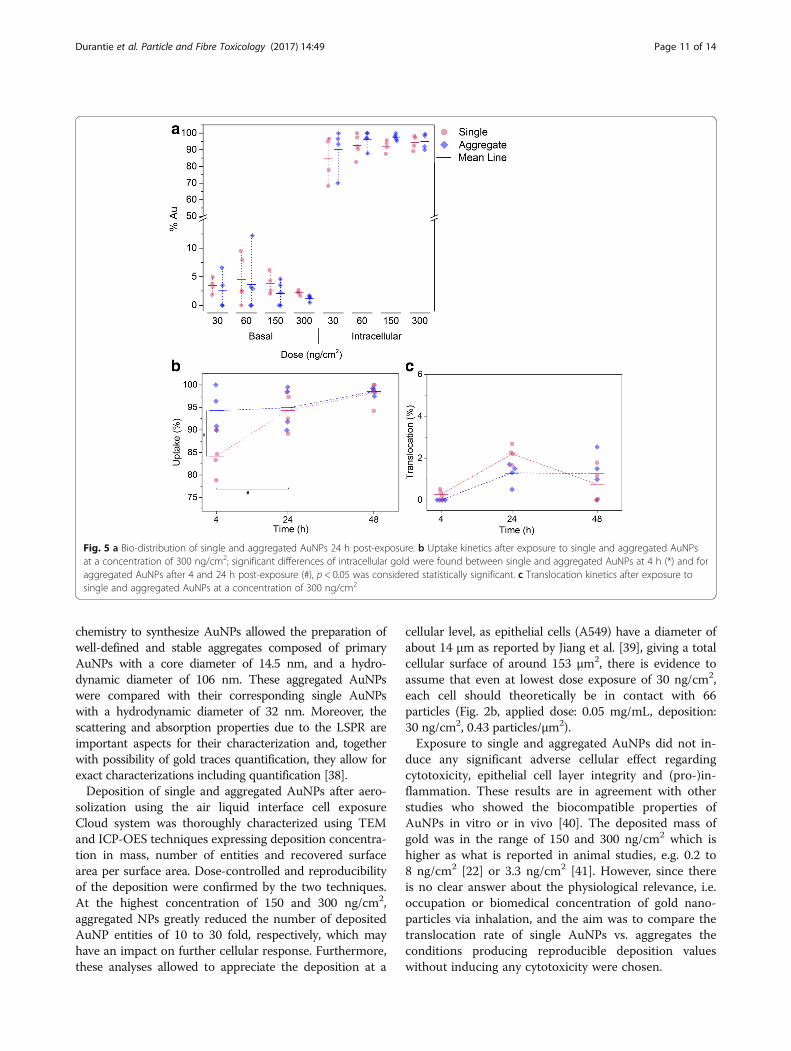
Biodistribution behavior of AuNPs and localizationin the cellsAfter exposure onto the lung cell surface, AuNPs caneither remain on the apical surface, being taken up bycells and/or translocated across the cell layer into thebasolateral compartment. The AuNPs concentration wasdetermined by ICP-OES for three different compart-ments: (i) air-exposed (apical) cell side to measure theAuNPs deposited on the apical cell surface, (ii) the intra-cellular AuNPs content, and (iii) the medium in thelower (basal) compartment to determine the translo-cated particles. The cultures were first exposed to singleand aggregated AuNPs at different concentrations, i.e.30, 60, 150 and 300 ng/cm2, and the gold distributionwas analyzed 24 h after exposure (Fig. 5a). For both par-ticle types and all concentrations less than 5% gold wasfound in the apical fraction and the majority of gold, i.e.more than 90% of the total applied gold mass, was foundin the intracellular fraction (Additional file 1: Figure S7shows amount of gold found intracellularly). Onlyexposure to single AuNPs at the lowest concentration of30 ng/cm2 was slightly different as 12% of gold wasfound in the apical fraction and 85% intracellularly.However, for all conditions only a minor fraction of goldwas found in the basolateral compartment showingminor translocation rates between 2 and 5%. Thus, the
majority of single or aggregated AuNPs were taken upby the cells. Moreover, the translocation rate did not in-crease with increasing concentration.Then, the biodistribution, i.e. uptake and translocation
across the barrier, of exposed single and aggregatedAuNPs was assessed at different time points, i.e. 4, 24and 48 h at a dose of 300 ng/cm2 (Fig. 5b and c). Forsingle AuNPs the cellular fraction after 4 h was 84%,increased to 94% after 24 h, and remained constantafterwards. For aggregated AuNPs 94% of the depositedmass was detected intracellularly after 4 h and remainedconstant. The results showed that the aggregated AuNPswere taken up faster than single AuNPs (94 vs 84%, re-spectively, at 4 h post-exposure), however no differencecould be observed for the translocation rate.Ultrathin sections of cells exposed to AuNPs were
visualized using TEM to observe the cellular localizationof AuNPs (Fig. 6). After 24 h the majority of single andaggregated AuNPs were found intracellularly. Some ofthe particles were found to be attached to the outer ap-ical cell surface and no particles were observed in theintercellular space. The AuNPs were found in all threecell types, i.e. MDM and epithelial cells on the upperinsert surface, and even to a minor extent in MDDC onthe basal side of the insert. Most of the AuNPs werelocalized in vesicles and only rarely in the cytoplasm.Attached or internalized aggregated AuNPs resulted inspot containing much higher density of AuNPs which isin line with the deposition characterization.
DiscussionLung is the first portal of entry into our body to airborneparticles, which have been associated to lung and cardio-vascular diseases [33, 34]. Aggregated NPs are a majorform of airborne particles [7, 12]. Their low effective dens-ity compared to single particles of similar size increasestheir mobility and allow them to penetrate and deposit inthe deep lung region [8]. However their behavior at thelung barrier is poorly studied, therefore gaining a betterunderstanding of the aggregates interaction and fate at thehuman alveolar epithelial tissue barrier is important. Inthis study, an approach combining air liquid interface andadvanced lung cell co-culture has been used representinga more realistic perspective when compared to submergedexposures [35]. Although the system has its limitation, i.e.it is not possible to follow the long-term fate of the parti-cles and/or drugs in the blood as well as lymph circula-tions and secondary organs, it has been shown to givecomparable results to in vivo data for short-term trans-location kinetics, i.e. up to 24 h, of apically applied nano-particles [36] or drugs [37].AuNPs were used as model particles to study the inter-
action and biodistribution of single and aggregated NPswith lung cells after aerosol deposition. The well-controlled
Fig. 4 Cell viability estimated by quantification of the releasedlactate dehydrogenase enzyme after exposure to single and aggregatedAuNPs at an applied dose of 300 ng/cm2. Values expressed as a mean(n= 3) after normalization to the negative control. Negative control:exposure to saline solution; Positive control: treatment with 0.1% tritonX-100. Sing: single AuNPs; Agg: aggregated AuNPs
Durantie et al. Particle and Fibre Toxicology (2017) 14:49 Page 10 of 14
chemistry to synthesize AuNPs allowed the preparation ofwell-defined and stable aggregates composed of primaryAuNPs with a core diameter of 14.5 nm, and a hydro-dynamic diameter of 106 nm. These aggregated AuNPswere compared with their corresponding single AuNPswith a hydrodynamic diameter of 32 nm. Moreover, thescattering and absorption properties due to the LSPR areimportant aspects for their characterization and, togetherwith possibility of gold traces quantification, they allow forexact characterizations including quantification [38].Deposition of single and aggregated AuNPs after aero-
solization using the air liquid interface cell exposureCloud system was thoroughly characterized using TEMand ICP-OES techniques expressing deposition concentra-tion in mass, number of entities and recovered surfacearea per surface area. Dose-controlled and reproducibilityof the deposition were confirmed by the two techniques.At the highest concentration of 150 and 300 ng/cm2,aggregated NPs greatly reduced the number of depositedAuNP entities of 10 to 30 fold, respectively, which mayhave an impact on further cellular response. Furthermore,these analyses allowed to appreciate the deposition at a
cellular level, as epithelial cells (A549) have a diameter ofabout 14 μm as reported by Jiang et al. [39], giving a totalcellular surface of around 153 μm2, there is evidence toassume that even at lowest dose exposure of 30 ng/cm2,each cell should theoretically be in contact with 66particles (Fig. 2b, applied dose: 0.05 mg/mL, deposition:30 ng/cm2, 0.43 particles/μm2).Exposure to single and aggregated AuNPs did not in-
duce any significant adverse cellular effect regardingcytotoxicity, epithelial cell layer integrity and (pro-)in-flammation. These results are in agreement with otherstudies who showed the biocompatible properties ofAuNPs in vitro or in vivo [40]. The deposited mass ofgold was in the range of 150 and 300 ng/cm2 which ishigher as what is reported in animal studies, e.g. 0.2 to8 ng/cm2 [22] or 3.3 ng/cm2 [41]. However, since thereis no clear answer about the physiological relevance, i.e.occupation or biomedical concentration of gold nano-particles via inhalation, and the aim was to compare thetranslocation rate of single AuNPs vs. aggregates theconditions producing reproducible deposition valueswithout inducing any cytotoxicity were chosen.
Fig. 5 a Bio-distribution of single and aggregated AuNPs 24 h post-exposure. b Uptake kinetics after exposure to single and aggregated AuNPsat a concentration of 300 ng/cm2; significant differences of intracellular gold were found between single and aggregated AuNPs at 4 h (*) and foraggregated AuNPs after 4 and 24 h post-exposure (#), p < 0.05 was considered statistically significant. c Translocation kinetics after exposure tosingle and aggregated AuNPs at a concentration of 300 ng/cm2
Durantie et al. Particle and Fibre Toxicology (2017) 14:49 Page 11 of 14

The biodistribution of the AuNPs in the lung cells24 h after exposure showed that majority of both singleand aggregated particles were taken up and retained in-side the cells, only a minor fraction translocated acrossthe epithelial tissue layers, i.e. between 1.3 and 4.5%.The translocated fraction observed in this study is inagreement with another in vitro study where aerosolized18-nm citrate AuNPs were exposed to a A549 epithelialcell monolayer where a translocation rate of 2% had beenreported [36]. In vivo studies also reported only minortranslocation of AuNPs across lung in rats, 0.5% after in-stillation of sulfonated triphenylphosphine AuNPs (18 and200 nm) [22] and 1.4% after inhalation of citrate AuNPsagglomerates (peak diameter 45 nm) [25].ICP-OES measurements showed that the uptake and/
or translocation are fast processes as majority of, if notall, AuNPs were taken up and translocated already 4 hafter exposure. This is in agreement with in vivo studiesof inhaled AuNPs: one study in mice concluded thatAuNPs (21 nm) were translocated after a short time, in-ferior to 2 h [41] and another study in rats investigatingtranslocation over time showed that translocation ofAuNPs (18–80 nm) was complete after 1 h [22].The rapid translocation and the similar low rate
(1.3–4.5%) regardless of the different deposited concen-trations let suggest that translocation of single and aggre-gated AuNPs occurs through an active transcellular
transport (or transcytosis) [21]. This hypothesis is furthersupported with TEM observations: 1) no AuNPs werefound in the intercellular space; 2) most of the intracellu-lar AuNPs were found in vesicles; 3) presence of AuNPsin MDDCs on the basal side of the membrane. Similar ob-servations were found in stereological analysis of micelung tissue after exposure to 21-nm AuNPs [42].Although, aggregated AuNPs behavior was similar to
single AuNPs regarding distribution, the only differencefound was that aggregated AuNPs were faster observedintracellularly in comparison to single AuNPs (Fig. 5b).Indeed, it is well known that particle size and shapeinfluence cellular uptake [21, 43]. However, this observa-tion can be surprising since preferential uptake is com-monly expected with particles of the size around 50 nmand with spherical shape [21]. The faster uptake of ag-gregated AuNPs could be explained by i) the larger sur-face area of the aggregated AuNPs; ii) a different cellularuptake pathway; iii) the lower number of deposited par-ticles for aggregates. Firstly, several findings support thetheory that larger surface area in contact with cell mem-brane allow for more multivalent ionic interactionsexplaining a faster or higher NPs uptake. For instance, astudy investigating internalization of NPs with varioussizes and shapes, found that in cylindrical NPs of similarvolume, particles with higher aspect ratio were internal-ized faster, suggesting a favored internalization for the
Fig. 6 Cellular localization of single and aggregated AuNPs. a Single AuNPs attached to the outer apical cell surface. b Intracellular single AuNPswithin vesicle on the apical side of the membrane. c Intracellular aggregated AuNPs found within vesicle on the apical side of the membrane.d Intracellular aggregated AuNPs found within vesicle in dendritic cell on the basal side. All the other black spots are not AuNPs and mightoriginate from lead citrate staining (Histogram analysis in Additional file 1: Figure S8)
Durantie et al. Particle and Fibre Toxicology (2017) 14:49 Page 12 of 14

larger surface area [44]. Similar observations were foundin a study comparing cellular uptake of single and aggre-gated transferrin coated AuNPs (30 and 98 nm, respectively)in which aggregated AuNPs uptake were 2-fold higher incomparison to single AuNPs in cells expressing few trans-ferrin receptors [45]. Secondly, the difference observed inuptake kinetics could also be explained by a different up-take mechanism. Indeed, Kreyling et al. have observed adifferent translocation behavior with the bigger 200 nmAuNPs in comparison to 18–80 nm AuNPs, suggestingthat these two NPs categories were endocytosed and/orexocytosed via different pathway [22]. Furthermore, astudy investigating shape effect of mesoporous silica NPsfound that spherical NPs were preferentially internalizedvia clathrin-mediated pathway while higher aspect ratioNPs favored caveolae-mediated pathways [46]. Finally, asshown in Fig. 2f, at a deposition of 300 ng/cm2, thenumber of deposited aggregated NPs is 30 times less thanfor single AuNPs.
ConclusionsIn this study, the biodistribution of aerosolized singleand aggregated AuNPs was investigated using a 3Dmodel of the human epithelial tissue barrier. Robustcharacterization was used to evaluate the exact delivereddose onto the cell surface and to determine the cellularuptake and translocation across the barrier. Overall, wefound that within a short time (<4 h), the majority of theAuNPs, single or aggregated, were taken up and retainedinside the cells while only a minor fraction translocatedto the basal side (<5%). The low translocation rate issimilar to the ones found for AuNPs in vivo highlightingthe possibility of using a sophisticated in vitro approachto predict in vivo biokinetics of inhaled AuNPs. Finally,at higher concentration (300 ng/cm2) the aggregatedAuNPs showed a significant reduction of the number ofdeposited spots and a faster cellular uptake but only dur-ing the first time points assessed, however, no significantchange of the translocation rate was observed. Hence,aggregation is fundamental for the cellular uptake kinet-ics of NPs during the first hours after exposure and hasto be considered, either in a biomedical setting of drugdelivery or for hazard assessment.
Additional file
Additional file 1: Supplementary information. (PDF 765 kb)
AcknowledgementsWe thank P Lemal and D Urban for their help in performing cryo-TEM andICP-OES measurements, respectively.
FundingThis study was supported by the Toyota Motor Corporation and grants ofthe Swiss National Science Foundation (Grant # 310030_159847 / 1) and the
work benefitted from support from the Swiss National Science Foundationthrough the National Centre of Competence in Research Bio-InspiredMaterials, and the Adolphe Merkle Foundation.
Availability of data and materialsThe datasets generated and/or analyzed during the current study are notpublicly available due to their large storage space (> 100 Gigabyte) but areavailable by FTP link from the corresponding author on reasonable request.
Authors’ contributionsED participated in the design of the study, carried out all chemical synthesis,biological based experimentation and drafted the manuscript. DV was involvedin the TEM analysis and characterization of the AuNPs, LR-L supported theparticle synthesis and characterization, FD supported air-liquid interface cellexposure and biological experiments, SB was involved in the DLS measurementand analysis, DS and JB were involved in performing LSM imaging. AP-F andBR-R were involved in the planning and technical advisory of the study. BR-Rwas the project leader; she was involved in the planning the design of thestudy, has intellectually accompanied all experimental work, made substantialcontributions to the analysis and interpretation of the data. BR-R, LR-L andDV have been involved in critically revising the manuscript for importantintellectual content. All authors have read and approved the final manuscript.
Ethics approval and consent to participateThe need for ethics approval or consent to participate is not applicable.
Consent for publicationThe need for consent for publication is not applicable.
Competing interestsThe authors declare that they have no competing interests.
Publisher’s NoteSpringer Nature remains neutral with regard to jurisdictional claims inpublished maps and institutional affiliations.
Author details1BioNanomaterials Group, Adolphe Merkle Institute, Université de Fribourg,Chemin des Verdiers 4, 1700 Fribourg, Switzerland. 2Chemistry Department,University of Fribourg, Chemin du Musée 9, 1700 Fribourg, Switzerland.
Received: 18 May 2017 Accepted: 16 November 2017
References1. Moore TL, Rodriguez-Lorenzo L, Hirsch V, Balog S, Urban D, Jud C, et al.
Nanoparticle colloidal stability in cell culture media and impact on cellularinteractions. Chem Soc Rev. 2015;44:6487–305. doi:10.1039/c4cs00487f.
2. Stark WJ. Nanoparticles in biological systems. Angew Chemie - Int Ed.2011;50:1242–58.
3. Wick P, Manser P, Limbach LK, Dettlaff-Weglikowska U, Krumeich F, Roth S,et al. The degree and kind of agglomeration affect carbon nanotubecytotoxicity. Toxicol Lett. 2007;168:121–31.
4. Nichols G, Byard S, Bloxham MJ, Botterill J, Dawson NJ, Dennis A, et al. Areview of the terms agglomerate and aggregate with a recommendationfor nomenclature used in powder and particle characterization. J Pharm Sci.2002;91:2103–9.
5. Puri R, Richardson TF, Santoro RJ, Dobbins RA. Aerosol dynamic processes ofsoot aggregates in a laminar ethene diffusion flame. Combust Flame.1993;92:320–33.
6. Maricq MM, Xu N. The effective density and fractal dimension of sootparticles from premixed flames and motor vehicle exhaust. J Aerosol Sci.2004;35:1251–74.
7. Van Gulijk C, Marijnissen JCM, Makkee M, Moulijn JA, Schmidt-Ott A.Measuring diesel soot with a scanning mobility particle sizer and anelectrical low-pressure impactor: performance assessment with a model forfractal-like agglomerates. J Aerosol Sci. 2004;35:633–55.
8. Rissler J, Swietlicki E, Bengtsson A, Boman C, Pagels J, Sandström T, et al.Experimental determination of deposition of diesel exhaust particles in thehuman respiratory tract. J Aerosol Sci. 2012;48:18–33.
Durantie et al. Particle and Fibre Toxicology (2017) 14:49 Page 13 of 14

9. Steiner S, Bisig C, Petri-Fink A, Rothen-Rutishauser B. Diesel exhaust: currentknowledge of adverse effects and underlying cellular mechanisms.Arch Toxicol. 2016. doi:10.1007/s00204-016-1736-5.
10. Van Setten BAAL, Makkee M, Moulijn JA. Science and technology ofcatalytic diesel particulate filters. doi:101081/CR-120001810. 2007.
11. Zhu J, Lee KO, Yozgatligil A, Choi MY. Effects of engine operating conditionson morphology, microstructure, and fractal geometry of light-duty dieselengine particulates. Proc Combust Inst. 2005;30:2781–9. doi:10.1016/j.proci.2004.08.232.
12. Rissler J, Messing ME, Malik AI, Nilsson PT, Nordin EZ, Bohgard M, et al. Effectivedensity characterization of soot agglomerates from various sources andcomparison to aggregation theory. Aerosol Sci Technol. 2013;47:792–805.doi:10.1080/02786826.2013.791381.
13. Burtscher H. Physical characterization of particulate emissions from dieselengines: a review. J Aerosol Sci. 2005;36:896–932.
14. Heyder J, Gebhart J, Rudolf G, Schiller CF, Stahlhofen W. Deposition ofparticles in the human respiratory tract in the size range 0.005–15 μm.J Aerosol Sci. 1986;17:811–25.
15. Oberdörster G, Oberdörster E, Oberdörster J. Nanotoxicology: an emergingdiscipline evolving from studies of ultrafine particles. Environ HealthPerspect. 2005;113:823–39.
16. Choi HS, Ashitate Y, Lee JH, Kim SH, Matsui A, Insin N, et al. Rapidtranslocation of nanoparticles from the lung airspaces to the body. NatBiotechnol. 2010;28:1300–3. 10.1038/nbt.1696.
17. Semmler-Behnke M, Kreyling WG, Lipka J, Fertsch S, Wenk A, Takenaka S, etal. Biodistribution of 1.4- and 18-nm gold particles in rats. Small.2008;4:2108–11.
18. Lipka J, Semmler-Behnke M, Sperling RA, Wenk A, Takenaka S, Schleh C, etal. Biodistribution of PEG-modified gold nanoparticles followingintratracheal instillation and intravenous injection. Biomaterials.2010;31:6574–81.
19. Kreyling WG, Semmler-Behnke M, Seitz J, Scymczak W, Wenk A, Mayer P, et al.Size dependence of the translocation of inhaled iridium and carbon nanoparticleaggregates from the lung of rats to the blood and secondary target organs.Inhal Toxicol. 2009;21(Sup 1):55–60. doi:10.1080/08958370902942517.
20. Mühlfeld C, Gehr P, Rothen-Rutishauser B. Translocation and cellular enteringmechanisms of nanoparticles in the respiratory tract. Swiss Med Wkly.2008;138:387–91.
21. Pillay V, Murugan K, Choonara YE, Kumar P, Bijukumar D, du Toit LC.Parameters and characteristics governing cellular internalization andtrans-barrier trafficking of nanostructures. Int J Nanomedicine.2015;10:2191–206. doi:10.2147/IJN.S75615.
22. Kreyling WG, Hirn S, Möller W, Schleh C, Wenk A, Celik G, et al. Air–bloodbarrier translocation of tracheally instilled gold Nanoparticles inverselydepends on particle size. ACS Nano. 2014;8:222–33. doi:10.1021/nn403256v.
23. Kreyling WG, Semmler M, Erbe F, Mayer P, Takenaka S, Schulz H, et al.Translocation of ultrafine insoluble iridium particles from lung epithelium toextrapulmonary organs is size dependant but very low. Environment.2002;7394:1513–30.
24. Bruinink A, Wang J, Wick P. Effect of particle agglomeration in nanotoxicology.Arch Toxicol. 2015;89:659–75. doi:10.1007/s00204-015-1460-6.
25. Balasubramanian SK, Poh K-W, Ong C-N, Kreyling WG, Ong W-Y, Yu LE.The effect of primary particle size on biodistribution of inhaled goldnano-agglomerates. Biomaterials. 2013;34:5439–52.
26. Blank F, Rothen-Rutishauser B, Gehr P. Dendritic cells and macrophagesform a transepithelial network against foreign particulate antigens.Am J Respir Cell Mol Biol. 2007;36:669–77. doi:10.1165/rcmb.2006-0234OC.
27. Hirsch V, Kinnear C, Rodriguez-Lorenzo L, Monnier CA, Rothen-Rutishauser B,Balog S, et al. In vitro dosimetry of agglomerates. Nano. 2014;6:7325–31.doi:10.1039/c4nr00460d.
28. Scarabelli L, Grzelczak M, Liz-Marzán LM. Tuning gold Nanorod synthesisthrough Prereduction with salicylic acid. Chem Mater. 2013;25:4232–8.doi:10.1021/cm402177b.
29. Geers C, Rodriguez-Lorenzo L, Andreas Urban D, Kinnear C, Petri-Fink A,Balog S. A new angle on dynamic depolarized light scattering: number-averaged size distribution of nanoparticles in focus. Nano. 2016;8:15813–21.doi:10.1039/C6NR03386E.
30. Lieber M, Todaro G, Smith B, Szakal A, Nelson-Rees W. A continuoustumor-cell line from a human lung carcinoma with properties oftype II alveolar epithelial cells. Int J Cancer. 1976;17:62–70. doi:10.1002/ijc.2910170110.
31. Steiner S, Czerwinski J, Comte P, Popovicheva O, Kireeva E, Müller L, et al.Comparison of the toxicity of diesel exhaust produced by bio- and fossil dieselcombustion in human lung cells in vitro. Atmos Environ. 2013;81:380–8.
32. Graczyk H, Bryan LC, Lewinski N, Suarez G, Coullerez G, Bowen P, et al.Physicochemical characterization of nebulized superparamagnetic ironoxide nanoparticles (SPIONs). J Aerosol Med Pulm Drug Deliv.2015;28:43–51.
33. Pope CA, Dockery DW, Schwartz J. Review of epidemiological evidence ofhealth effects of particulate air pollution. Inhal Toxicol. 1995;7:1–18.doi:10.3109/08958379509014267.
34. Donaldson K, Tran L, Jimenez LA, Duffin R, Newby DE, Mills N, et al.Combustion-derived nanoparticles: a review of their toxicology followinginhalation exposure. Part Fibre Toxicol. 2005;2:10.
35. Paur HR, Cassee FR, Teeguarden J, Fissan H, Diabate S, Aufderheide M, et al.In-vitro cell exposure studies for the assessment of nanoparticle toxicity inthe lung-a dialog between aerosol science and biology. J Aerosol Sci.2011;42:668–92.
36. Bachler G, Losert S, Umehara Y, von Goetz N, Rodriguez-Lorenzo L,Petri-Fink A, et al. Translocation of gold nanoparticles across the lungepithelial tissue barrier: combining in vitro and in silico methods tosubstitute in vivo experiments. Part Fibre Toxicol. 2015;12:18. doi:10.1186/s12989-015-0090-8.
37. Schmid O, Jud C, Umehara Y, Mueller D, Bucholski A, Gruber F, et al.Biokinetics of aerosolized liposomal Ciclosporin a in human lung cellsIn Vitro using an air-liquid cell Interface exposure system. J Aerosol MedPulm Drug Deliv. 2017;:jamp.2016.1361. doi:10.1089/jamp.2016.1361.
38. Liz-marzan LM. Tailoring surface Plasmons through the morphology andassembly of metal Nanoparticles. Langmuir. 2006;22:32–41.
39. Jiang R, Shen H, Piao Y-J. The morphometrical analysis on the ultrastructureof A549 cells. Romanian J Morphol Embryol. 2010;51:663–7.
40. Ghosh P, Han G, De M, Kim CK, Rotello VM. Gold nanoparticles in deliveryapplications. Adv Drug Deliv Rev. 2008;60:1307–15.
41. Schleh C, Holzwarth U, Hirn S, Wenk A, Simonelli F, Schäffler M, et al.Biodistribution of inhaled gold nanoparticles in mice and the influence ofsurfactant protein D. J Aerosol Med Pulm Drug Deliv. 2013;26:24–30.doi:10.1089/jamp.2011.0951.
42. Geiser M, Quaile O, Wenk A, Wigge C, Eigeldinger-Berthou S, Hirn S, et al.Cellular uptake and localization of inhaled gold nanoparticles in lungs ofmice with chronic obstructive pulmonary disease. Part Fibre Toxicol.2013;10:19. doi:10.1186/1743-8977-10-19.
43. Albanese A, Tang PS, Chan WCW. The effect of Nanoparticle size, shape, andsurface chemistry on biological systems. Annu Rev Biomed Eng. 2012;14:1–16.https://doi.org/10.1146/annurev-bioeng-071811-150124.
44. Gratton SEA, Ropp PA, Pohlhaus PD, Luft JC, Madden VJ, Napier ME, et al.The effect of particle design on cellular internalization pathways. Proc NatlAcad Sci U S A. 2008;105:11613–8.
45. Albanese A, Chan WCW. Effect of gold Nanoparticle aggregation on celluptake and toxicity. ACS Nano. 2011;5:5478–89. doi:10.1021/nn2007496.
46. Hao N, Li L, Zhang Q, Huang X, Meng X, Zhang Y, et al. The shape effect ofPEGylated mesoporous silica nanoparticles on cellular uptake pathway inHela cells. Microporous Mesoporous Mater. 2012;162:14–23. doi:10.1016/j.micromeso.2012.05.040.
47. Vanhecke D, Rodriguez-Lorenzo L, Kinnear C, Durantie E, Rothen-Rutishauser B,Fink AS. Assumption-free morphological quantification of single anisotropicnanoparticles and aggregates. Nano. 2017;9:4918–27. doi:10.1039/C6NR07884B.
• We accept pre-submission inquiries
• Our selector tool helps you to find the most relevant journal
• We provide round the clock customer support
• Convenient online submission
• Thorough peer review
• Inclusion in PubMed and all major indexing services
• Maximum visibility for your research
Submit your manuscript atwww.biomedcentral.com/submit
Submit your next manuscript to BioMed Central and we will help you at every step:
Durantie et al. Particle and Fibre Toxicology (2017) 14:49 Page 14 of 14