research article focusing properties of high-order harmonics
TRANSCRIPT

Research ArticleFocusing Properties of High-Order Harmonics
Maria Hoflund ,1 Jasper Peschel,1 Marius Plach,1 Hugo Dacasa ,1 Kévin Veyrinas ,2
Eric Constant ,3 Peter Smorenburg,4 Hampus Wikmark ,1 Sylvain Maclot ,1
Chen Guo ,1 Cord Arnold ,1 Anne L'Huillier ,1 and Per Eng-Johnsson 1
1Department of Physics, Lund University, P.O. Box 118, 22100 Lund, Sweden2Université de Bordeaux, CNRS, CEA, Centre Laser Intenses et Applications (CELIA), 43 Rue P. Noailles, 33400 Talence, France3Univ Lyon, Univ Claude Bernard Lyon 1, CNRS, Institut Lumière Matière, F-69622 Villeurbanne, France4ASML Research, ASML Netherlands B.V., 5504 DR Veldhoven, Netherlands
Correspondence should be addressed to Maria Hoflund; [email protected]
Received 29 April 2021; Accepted 27 July 2021; Published 29 August 2021
Copyright © 2021 Maria Hoflund et al. Exclusive Licensee Xi’an Institute of Optics and Precision Mechanics. Distributed under aCreative Commons Attribution License (CC BY 4.0).
Many applications of the extreme ultraviolet (XUV) radiation obtained by high-order harmonic generation (HHG) in gases requirea small focus area in order to enable attosecond pulses to reach a high intensity. Here, high-order harmonics generated in Ar with amultiterawatt laser system in a loose focusing geometry are focused to a few micrometers using two toroidal mirrors in a Wolterconfiguration with a high demagnification factor. Using a knife-edge measurement technique, we determine the position andsize of the XUV foci as a function of harmonic order. We show that the focus properties vary with harmonic order and thegeneration conditions. Simulations, based on a classical description of the harmonic dipole phase and assuming that theindividual harmonics can be described as Gaussian beams, reproduce the experimental behavior. We discuss how the generationgeometry affects the intensity and duration of the focused attosecond pulses.
1. Introduction
High-order harmonic generation (HHG) is a highly nonlin-ear process that converts intense low-frequency light intoattosecond pulse trains in the extreme ultraviolet (XUV)spectral region. In spite of a low conversion efficiency[1–3], the choice of appropriate gas targets combined withthe use of loose focusing geometries has led to high pulseenergies on the order of microjoules [4–8]. The highintensity that can potentially be achieved by focusing thisradiation opens the way to multiphoton ionization pro-cesses in the XUV range [7, 9–12], and in particular tononlinear XUV pump-XUV probe studies with attosecondresolution [13–15]. While XUV and X-ray radiation fromfree-electron lasers provide the required intensities forthese types of studies [16, 17], they have only recentlystarted to demonstrate the generation of attosecond pulses[18]. Using these sources for experiments is still very chal-lenging, whereas HHG-based sources already provide amature technology for nonlinear pump-probe experimentsin the attosecond range.
To obtain both high intensity and attosecond pulse dura-tion in the interaction with a low-density gas target, it isimportant to focus the broadband radiation on a small spot.This requires focusing the different harmonic componentsat the same position. Focusing of high-order harmonics hasbeen achieved using ellipsoidal mirrors [19, 20], pairs oftoroidal mirrors at grazing incidence [21–23], or sphericalmirrors at normal incidence for low photon energy [8, 24].Focal spot sizes of the order of a few μm for the emittedharmonics in a certain spectral range are typically obtained.The methods used for measuring these spot sizes vary fromdirect techniques like the knife-edge method [20, 25–27] ormicroscopy [21] to indirect ones based on wavefront deter-mination [23, 28–30]. Recently, focus sizes of the order of0:3 × 0:4μm 2 have been measured for harmonics between10 and 20nm (i.e., 60-120 eV) focused with an ellipsoidalmirror [31].
Previous studies [30, 32–36] have shown that high-orderharmonics have different wavefronts at the exit of the nonlin-ear medium, which can be convergent or divergent [35],corresponding to a real or virtual focus, respectively. The
AAASUltrafast ScienceVolume 2021, Article ID 9797453, 8 pageshttps://doi.org/10.34133/2021/9797453

wavefront curvature of the harmonics is the sum of that ofthe driving laser and an additional contribution originatingfrom the process behind the generation of high-order har-monics. The resulting harmonic radius of curvature and spa-tial profile [37] depends on harmonic order, laser intensity,and generation position. When they are refocused, thisresults in separated waist positions along the propagationdirection, thus affecting the focusing properties of the har-monics and the peak intensity and pulse duration of thefocused attosecond pulses. Although theoretically predictedin [34, 35], and experimentally shown for the total harmonicbeam in [38], no experiments have yet quantitatively exam-ined the influence of the generation geometry on the focusposition, waist, and intensity of individual harmonics andattosecond pulses.
In the present study, we generate high-order harmonicsin argon using a 45mJ, 40 fs, Ti:Sapphire laser in a loosefocusing geometry. We refocus the XUV radiation with a pairof toroidal mirrors in aWolter configuration [23, 39] in orderto achieve broadband focusing with a high demagnificationfactor. A knife-edge technique [20, 25–27] is used to measurethe individual harmonic focus positions for different loca-tions of the gas target relative to the laser focus in the gener-ation chamber. In some cases, the harmonics are found to berefocused at positions that evolve strongly with the harmonicorder. The observed experimental trends can be explained bya simple model which takes into account the intensity depen-dence of the spectral phase of the attosecond pulses, alsocalled the dipole phase [34, 35]. We find that the chromaticaberrations induced by the dipole phase affect strongly thetemporal profile and intensity of the focused attosecondpulses.
2. Experimental Method
The experimental setup used in this study is sketched inFigure 1. We use a multiterawatt Ti:Sapphire laser systemdelivering 40 fs, 806 nm, and 45mJ pulses [7]. A deformablemirror (DM), used together with an infrared wavefront sen-sor, allows us to correct for spatial aberrations and to controlthe IR focusing position with respect to the generationmedium by introducing a slight curvature to the beam. Afteraberration correction, the measured laser wavefront has anRMS value of about λ/40, corresponding to a Strehl ratio of0.97. After going through an iris, the infrared beam is looselyfocused with an 8.7m spherical mirror into a 1 cm long,pulsed, Ar gas cell, generating high-order harmonics up to45 eV. We estimate that the IR waists are approximately340-360μm with corresponding Rayleigh lengths of 45 to50 cm for the different focal lengths used in the experiment.
The XUV radiation is reflected, at a 10° grazing incidenceangle, by a fused silica (FS) plate, which is antireflection-coated for the IR, and spectrally filtered by a 200nm Al filter.The FS plate and Al filter allow us to completely eliminate theIR. Further, the broadband beam is refocused by Wolteroptics, consisting of a prealigned assembly of two toroidalmirrors from Thales SESO, designed to image the generationmedium, after 6m propagation, with a high demagnificationfactor and minimal aberrations in the XUV range. The graz-
ing incidence angle on the two toroidal mirrors is 15°, givinga total deviation angle of 60°. The Wolter optics assembly isaligned in our beamline by using a homemade XUV Hart-mann wavefront sensor. The tangential focal lengths are265.3mm and 545.2mm for the first and secondmirror whilethe sagittal focal lengths are 265.0mm and 544.4mm. Thecombined focal length of 164.2mm provides a demagnifi-cation factor of 35. A homemade flat-field spectrometer,based on a Hitachi aberration-corrected concave grating,images the focus in the vertical direction onto a micro-channel plate (MCP). In this configuration, no entranceslit is needed and the entire beam is characterized. Thegrating disperses the harmonics along the vertical axis ofthe MCP, while the far field spatial profile is recordedalong the horizontal axis.
For each position of the cell relative to the IR focus alongthe propagation direction Z, called “generation position,” wemeasure the focus position of the harmonics in the applica-tion chamber. Harmonic spectra are recorded for differentxk (transverse to the beam) and zk (along the beam) positionsof a knife-edge located close to the focus (see Figure 1). Arough estimate of the focus position for each harmonic canbe obtained by looking at the diffraction image position ofthe knife-edge on the spatial profile recorded by the spec-trometer. If the knife is after the focus, the shadow is on thesame side as the knife, while if the focus is after, it is on theopposite side. This is illustrated in Figure 2, showing spectraobtained without the knife-edge (a) and for three positions ofthe knife-edge (b–d). In (b) (respectively, d), the knife isbefore (after) the focus for all harmonic orders and theshadow is observed on the right (left) sides of the profile. In(c), the shadow of the knife is on the right side for thelower-order harmonics while it is on the left side for thehigher-order harmonics. This means that the knife is beforethe focus for the lower-order harmonics, and after the focusfor the higher orders. The harmonics in the middle are lessaffected by the knife, which indicates that it is located closeto their focus. These results show that the harmonics areindeed focused at different positions along the propagationaxis.
Figure 1: Schematic representation of the experimental setup. Thespatially filtered IR beam (red) is first wavefront-corrected by adeformable mirror before it goes through an iris and is reflectedby a focusing mirror. High-order harmonics (blue) are generatedin an argon gas cell. The IR is filtered out by an IR antireflection-coated fused silica plate followed by an aluminum filter. In theapplication chamber, the harmonic beam is focused by the Wolteroptics. The knife is placed around the focus, and the beam isdetected by a flat-field spectrometer.
2 Ultrafast Science

Mapping out the individual harmonic focus positionsrequires scanning both xk and zk in small steps. Instead, weuse a faster and less tedious method based on measurementsat only four positions in zk , outside the Rayleigh range(zR ≈ 1mm), two before and two after the focus, which issufficient to extract the position of each focus. Figure 3illustrates this method for the 21st harmonic. The har-monic intensity as a function of knife insertion (xk) isrecorded for each knife-edge position along the propaga-tion direction (zk) (see Figure 3(a)). Assuming Gaussianbeams, this data is then fitted to a normalized error function,f ðxkÞ = ferf ½bðxk − cÞ� + 1g/2, representing the integral of aGaussian function exp ½−b2ðx − cÞ2� from −∞ to xk . For eachknife-edge position, the 1/e2 beam waist radius (wq =
ffiffiffi2
p/b)
is obtained from the fit. The position of the harmonic focus(zq) can be determined by performing a linear fit of the beamwidths, after mirroring those corresponding to the knife-edgeposition behind the focus (Figure 3(b)). If we assume that theharmonics are ideal Gaussian beams with M2 = 1, the beamwaists (wq) can also be estimated as λq/ðπθqÞ, where λq is
the wavelength of the qth harmonic and θq the (half) diver-gence angle. Note that wq represents a lower limit to thebeam waist and that a better estimation would require a mea-surement of the quality factor M2, which has not been donein the present work.
3. Theoretical Model
HHG can be described by a three-step process: tunneling ion-ization, electron acceleration by the laser field, and recombi-nation [40, 41]. In the second step, the electron wave packetaccumulates a phase, called the dipole phase, which is thentransferred to the harmonic field. Two families of trajectories,related to the time spent by the electron in the continuum(“short” or “long”), have been identified and observed exper-imentally [42, 43]. The dipole phase is often expressed as αI,
where α depends on the harmonic order and electron trajec-tory, and I is the intensity of the driving laser [44]. Thisexpression is derived by using the strong-field approximationto solve the time-dependent Schrödinger equation (TDSE) ofthe single-atom response. Instead, we use an analyticalexpression derived by solving Newton’s equation of motion[34, 45]:
Φi q, Ið Þ = αiI + tpi qω − ωp
� �+ γi
Iqω − ωp
� �2, ð1Þ
where i refers to the trajectory (short or long), q is the har-monic order, I and ω are the fundamental intensity andangular frequency, respectively, ωp is the angular frequencycorresponding to the ionization energy, and tpi is a returntime, as explained in [34]. We here consider only the contri-bution from the short trajectory, which is mainly observed inour experiment. In Equation (1), the quantity αi is indepen-dent of the harmonic order and is equal to zero for the shorttrajectory, while the quantity γi is equal to 1:03 × 10−18 s 2Wcm −2 for a driving laser of 800nm. The first and thirdterms depend on the laser intensity, leading to an order-dependent wavefront curvature.
We assume that high-order harmonics are generated atposition Z relative to the IR focus (located at Z = 0) in a thinmedium [46]. For a Gaussian fundamental beam, with a pro-file I0 exp ½−2r2/w2ðZÞ�, where I0 is the peak intensity, r is theradial coordinate, and wðZÞ is the beam width at position Z,the r-dependence of the dipole phase can be approximated by
−2αiI0w2
0w4 Zð Þ r2 −
2γi qω − ωp
� �2I0w
20
r2: ð2Þ
The generated harmonic field also includes an r-depen-dent phase contribution from the fundamental, which isequal to qkr2/2RðZÞ, where k is the fundamental wavevectorand RðZÞ is its radius of curvature. The total radius of
Figure 2: Measured spectra with no knife (a), the knife before (b)and after (d) the focus, and the knife in the focal region (c). Thesecond-order diffraction from the spectrometer grating isnumerically filtered out. The insets in (b) and (d) illustrate theposition of the knife relative to the focus and its shadow. Theknife positions in (b–d) are zk = −8:3, zk = 0mm, and zk = 9:1mm.
Figure 3: Illustration of our analysis method for one harmonicorder (21). (a) Normalized harmonic intensity as a function ofknife-edge insertion (blue dots). An error function is fitted to thedata (red curve), allowing us to determine the beam width at 1/e2,marked with a red circle in (b). (b) Measured beam widths forfour different knife-edge positions along the propagationdirection (black dots). A linear fit (green curve) is performedbetween these widths, after mirroring two of them relative to thehorizontal axis (black circles). The focus is the position wherethe fit crosses zero.
3Ultrafast Science

curvature of the harmonic field, corresponding to one trajec-tory i, is given by
1Ri Zð Þ = 1
R Zð Þ −4αiI0w2
0cw4 Zð Þqω +
4γi qω − ωp
� �2cI0w
20qω
, ð3Þ
where c is the speed of light and w0 is the fundamental beamwaist [34].
To fully characterize the harmonic beams, the width atthe generation position is estimated by assuming that theharmonic intensity (Iq) is proportional to the fundamental
intensity to the power of p (Iq ∝ Ip0) [46–50], where thedegree of nonlinearity, p, is assumed to be equal to 4, whichis confirmed by TDSE calculations [34]. The harmonicwidth, at the position of the gas target, is then simply halfthe width of the driving laser. Assuming Gaussian opticsfor the harmonic beam, knowing the width and radius of cur-vature at the generation position Z allows us to determine thebeam properties at any position.
Figure 4 shows the calculated focus positions and waistsize, with respect to the IR focus, for harmonic 11 to 25 as afunction of generation position Z. The left column showsthe (virtual or real) focus positions and waists at generationwhile the right column shows the foci and waists of the refo-cused beams. The first row (a, b) shows results obtained with-out the dipole phase. In this case, the harmonics have thesame wavefront, which is equal to that of the fundamental.When they are generated at the IR waist, they have the same
focus, which is identical to the IR focus (Figure 4(a)). How-ever, for this generation position (Z = 0), the harmonics arenot refocused at the same focus position in the applicationchamber (Figure 4(b)). In this very loose focusing geometry,some harmonics have very long Rayleigh lengths. Conse-quently, the focusing optics is not fully in the far field, so thatthe curvatures of the harmonics at this position are slightlyharmonic-dependent. Therefore, the harmonics will befocused at slightly different positions. In this case, wherethe dipole phase is not included, the foci in the applicationchamber are overlapped for all harmonics, when the genera-tion medium is slightly before the IR focal spot. This is a cleardeviation from the predictions of geometrical optics, due tothe long Rayleigh lengths mentioned above.
The second row (c, d) is calculated including the dipolephase. This leads to an asymmetric focus position distribu-tion for positive and negative generation positions. Further-more, there is no generation position where all harmonicsare focused at the same position. We also show in (e, f) theharmonic waists both in the generation and applicationchambers, including the dipole phase in the calculations.
Finally, we also simulate the experimental conditions,where the cell position is fixed and where the focal length isslightly varied in order to change the relative positionbetween the generation and the IR focus. As expected, theresults, shown as dashed lines in Figures 4(d) and 4(f), pres-ent the same qualitative behavior as when the focal length isnot varied (solid lines), and only minor quantitative differ-ences. The simulation with the varying focal length is usedin the comparison with the experimental results.
4. Results
To describe our experimental geometry, where the genera-tion cell is fixed and the position of the IR focus varied,we introduce ΔZ = Zm − Z0, which is the medium position(Zm) relative to the IR focus (Z0). Similarly, in the appli-cation chamber, we refer to the refocused focus positionsin the coordinate Δz = zq − z0, where z0 is the position of therefocused IR, which was estimated from the simulations.The 19th harmonic is removed from the dataset because itsposition on the detector coincides with a damaged area onthe microchannel plate of the spectrometer, making its detec-tion unreliable.
The results of our knife-edge measurements are shown inFigures 5(a)–5(e), for different generation positions, asshown at the top of the figure. The experimental data arecompared with simulations (dashed line) using the modelpresented above. The different harmonics are found to befocused at different positions, with a separation of up to1.5mm, which is significant since the harmonic Rayleighlengths are typically around 1mm. This effect decreases asthe generation position moves towards and beyond the laserfocus. When the medium is before the focus (seeFigures 5(a)–5(c)), the lower-order harmonics are focusedapproximately one mm after the higher-order harmonics,on different sides of the IR focus. When the generationmedium is centered at the infrared focus or beyond (seeFigures 5(d) and 5(e)), all of the harmonics are focused much
Wai
st [µ
m]
Figure 4: Calculated harmonic focus positions as a function ofgeneration position Z, in the HHG chamber (a, c) and after beingrefocused, in the application chamber (b, d). In (e, f), thecorresponding waists are shown. The simulation is run without (a,b) and with (c–f) the dipole phase included. The harmonic ordergoes from 11 (red) to 25 (blue). The dashed lines in (d) and (f)simulate the experimental conditions, where the relative medium-laser focus distance is varied by changing the focal length of thegenerating laser with a deformable mirror.
4 Ultrafast Science
closer to each other, at a position before the IR focus. Simu-lations reproduce the main features of the experimental data,which indicates that, despite its simplicity, our modeldescribes the physics behind the focusing properties ofhigh-order harmonics well [34, 35].
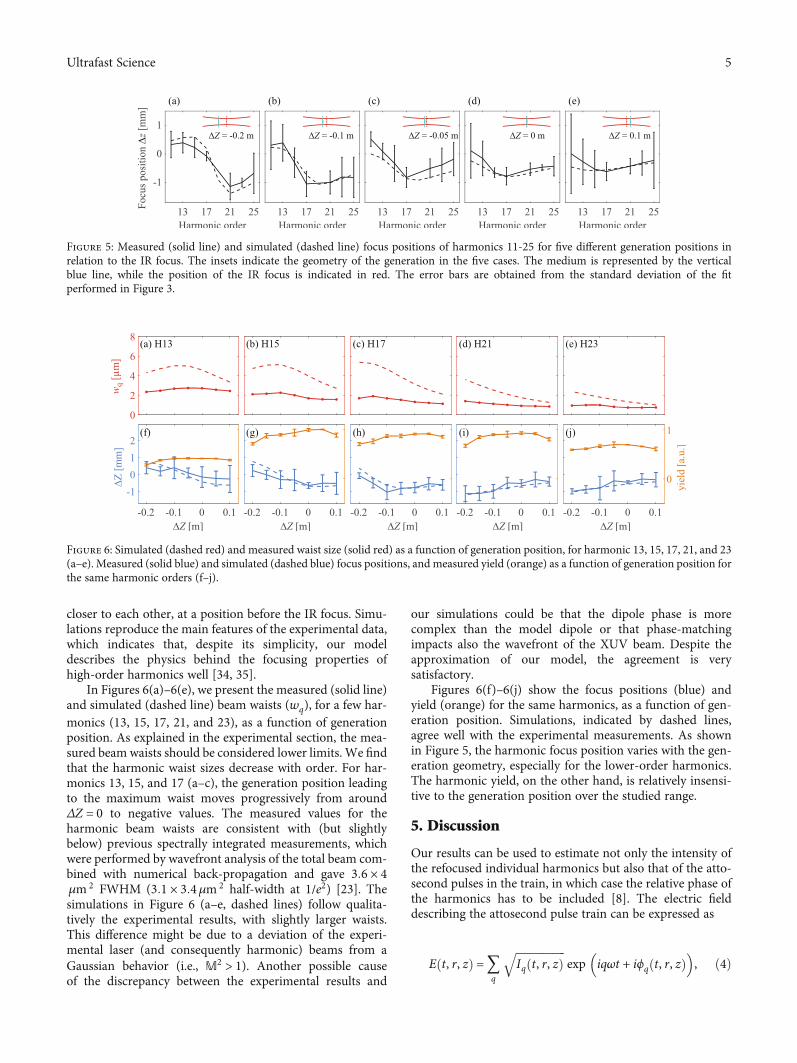
In Figures 6(a)–6(e), we present the measured (solid line)and simulated (dashed line) beam waists (wq), for a few har-monics (13, 15, 17, 21, and 23), as a function of generationposition. As explained in the experimental section, the mea-sured beam waists should be considered lower limits. We findthat the harmonic waist sizes decrease with order. For har-monics 13, 15, and 17 (a–c), the generation position leadingto the maximum waist moves progressively from aroundΔZ = 0 to negative values. The measured values for theharmonic beam waists are consistent with (but slightlybelow) previous spectrally integrated measurements, whichwere performed by wavefront analysis of the total beam com-bined with numerical back-propagation and gave 3:6 × 4μm 2 FWHM (3:1 × 3:4μm 2 half-width at 1/e2) [23]. Thesimulations in Figure 6 (a–e, dashed lines) follow qualita-tively the experimental results, with slightly larger waists.This difference might be due to a deviation of the experi-mental laser (and consequently harmonic) beams from aGaussian behavior (i.e., M2 > 1). Another possible causeof the discrepancy between the experimental results and
our simulations could be that the dipole phase is morecomplex than the model dipole or that phase-matchingimpacts also the wavefront of the XUV beam. Despite theapproximation of our model, the agreement is verysatisfactory.
Figures 6(f)–6(j) show the focus positions (blue) andyield (orange) for the same harmonics, as a function of gen-eration position. Simulations, indicated by dashed lines,agree well with the experimental measurements. As shownin Figure 5, the harmonic focus position varies with the gen-eration geometry, especially for the lower-order harmonics.The harmonic yield, on the other hand, is relatively insensi-tive to the generation position over the studied range.
5. Discussion
Our results can be used to estimate not only the intensity ofthe refocused individual harmonics but also that of the atto-second pulses in the train, in which case the relative phase ofthe harmonics has to be included [8]. The electric fielddescribing the attosecond pulse train can be expressed as
E t, r, zð Þ =〠q
ffiffiffiffiffiffiffiffiffiffiffiffiffiffiffiffiffiffiIq t, r, zð Þ
qexp iqωt + iϕq t, r, zð Þ
� �, ð4Þ
Figure 5: Measured (solid line) and simulated (dashed line) focus positions of harmonics 11-25 for five different generation positions inrelation to the IR focus. The insets indicate the geometry of the generation in the five cases. The medium is represented by the verticalblue line, while the position of the IR focus is indicated in red. The error bars are obtained from the standard deviation of the fitperformed in Figure 3.
Figure 6: Simulated (dashed red) and measured waist size (solid red) as a function of generation position, for harmonic 13, 15, 17, 21, and 23(a–e). Measured (solid blue) and simulated (dashed blue) focus positions, and measured yield (orange) as a function of generation position forthe same harmonic orders (f–j).
5Ultrafast Science

where Iq are the relative experimental harmonic intensities.The phases, ϕq, are the sum of the Gouy phase obtained byusing the experimentally determined position of the focusand Rayleigh length for each harmonic and the inherentphase due to the generation process (see Equation (1)), alsocalled attochirp [51].
In Figures 7(a)–7(c), we show the estimated attosecondpulse intensity on axis in the application chamber, as a func-tion of time and position along the propagation axis (Δz), forthree generation positions, ΔZ = −150mm (a), ΔZ = 0 (b),and ΔZ = 150mm (c). This is obtained using Equation (4)for each Δz and taking the absolute square to get the inten-sity. The peak of the attosecond pulse intensity is extractedfrom these results and shown in Figure 7(d) in black as afunction of Δz, for different generation positions (ΔZ). Theintensity variation for each harmonic is marked in colorgoing from the 11th (red) to 25th (blue). Figure 7(d) alsoshows the maximum XUV peak intensity (green) and thetotal yield (red) for each generation position. Furthermore,the intensity distribution as a function of the transverse coor-dinate x and Δz is shown for ΔZ = −150mm (e), ΔZ = 0 (f),and ΔZ = 150mm (g).
As seen in Figure 7, the distribution of harmonic focuspositions is clearly broader when the cell is before the IRfocus (negative ΔZ), as shown in panels (a) and (e). In con-trast, the foci are closer to each other along the propagationaxis when the cell is located at the IR focus or beyond, asshown in panels (b, c) and (f, g). The maximum intensity isobtained for ΔZ = 0 and Δz = −0:47mm, as seen in panels(b) and (f). When ΔZ < 0, the harmonics are focused at dif-ferent positions, while when ΔZ > 0, the generation efficiencydecreases. The total yield and the maximum intensity varydifferently with respect to the generation position, as shownin Figure 7(d).
From the estimated spatiotemporal intensities inFigure 7, we find for the conditions where the maximumintensity is obtained (ΔZ = 0 and Δz = −0:47mm), an aver-age pulse duration of the individual attosecond pulses of~ 200 as and a beam waist of ~ 1.5μm. Combining thiswith the XUV pulse energy, measured using an X-rayCCD camera (Andor) to be 1.6 nJ, and a harmonic pulseduration of 20 fs (half of the IR pulse duration, accordingto the same power law used for the harmonic beam widthsabove), gives an estimate of the maximum XUV peakintensity of 1013W/cm 2. This corresponds to an intensityof 1 on the vertical axis in Figure 7(d).
6. Conclusion
By inserting a knife before and after the focus and scanning itthrough the XUV beam, we have mapped out the focus posi-tion and estimated the waist size of each individual har-monic, as a function of the position of the gas cell relativeto the IR focus. The key conclusion of this work is that theharmonics’ focusing properties are found to depend on theorder and the generation position. We interpret this effectas a consequence of the intensity-dependent dipole phase.The experimental data agree with relatively simple simula-tions based on an analytical expression for the dipole phase[34, 35], the assumption that the harmonics can be repre-sented as Gaussian beams [33], and without taking intoaccount propagation effects in the nonlinear medium. Thesemeasurements allow us to estimate the focused intensity ofthe individual harmonics and the attosecond pulses in thetrain and to define the optimal conditions to achieve high-intensity attosecond illumination. We find that these optimalconditions do not necessarily coincide with those leading tothe highest yield. Even when the yield is approximately con-stant, the harmonic focusing properties can change signifi-cantly and thus affect the pulse duration and intensity ofthe attosecond pulses.
Data Availability
All data discussed in the article will be made available uponrequest.
Disclosure
Hugo Dacasa’s present address is Department of PhysicalChemistry, Complutense University of Madrid, Ciudad
Figure 7: Estimated on-axis intensity as a function of time and Δzfor generation positions: ΔZ = −150mm (a), ΔZ = 0 (b), and ΔZ =150mm (c). (d) Peak intensity (black) varying along thepropagation axis (Δz) for different generation positions (ΔZ). Theharmonic intensities (multiplied by two) are plotted for each ΔZ,going from order 11 (red) to 25 (blue). Measured total yield (red)and peak intensity (green) as a function of ΔZ are plotted inthe intensity-ΔZ-plane. Estimated peak intensity as a functionof the transverse coordinate x and Δz for generation positions:ΔZ = −150mm (e), ΔZ = 0 (f), and ΔZ = 150mm (g).
6 Ultrafast Science

Universitaria, 28040 Madrid, Spain. Kévin Veyrinas’ presentaddress is Amplitude Laser Group, 11, avenue de Canter-anne, Cité de la Photonique, 33600 Pessac, France. HampusWikmark’s present address is Department of Physics andAstronomy, Uppsala University, Box 516, SE-751 20,Uppsala, Sweden. Sylvain Maclot’s present address is Depart-ment of Physics, Gothenburg University, Box 100, 405 30Gothenburg, Sweden.
Conflicts of Interest
The authors declare no conflict of interest.
Authors’ Contributions
M.H, J.P., M.P., and H.D. performed the experiments.P.E.-J, J.P., and C.A. designed the experiment. K.V., E.C.,H.W., and S.M. contributed to building the experimentalsetup and preparing the experiment. M.H. did the dataanalysis and the simulations based on theory that P.S.,H.W., C.G., C.A., and A.L. developed. M.H., A.L., P.E.-J.,J.P., and M.P. wrote the article, with feedback from allthe authors.
Acknowledgments
The authors acknowledge support from the SwedishResearch Council, the European Research Council (advancedgrant QPAP), the Knut and Alice Wallenberg Foundation,and the Crafoord Foundation. The research leading to theseresults has received funding from LASERLAB-EUROPE(grant agreement no. 654148, European Union’s Horizon2020 research and innovation programme). S.M. acknowl-edges financial support from the COST Action CA18212-Molecular Dynamics in the GAS phase (MD-GAS), sup-ported by COST (European Cooperation in Science andTechnology).
References
[1] P. Agostini and L. F. DiMauro, “The physics of attosecondlight pulses,” Reports on Progress in Physics, vol. 67, no. 6,pp. 813–855, 2004.
[2] J. Tate, T. Auguste, H. G. Muller, P. Salières, P. Agostini, andL. F. DiMauro, “Scaling of wave-packet dynamics in an intensemidinfrared field,” Physical Review Letters, vol. 98, no. 1,article 013901, 2007.
[3] A. D. Shiner, C. Trallero-Herrero, N. Kajumba et al., “Wave-length scaling of high harmonic generation efficiency,” Physi-cal Review Letters, vol. 103, no. 7, article 073902, 2009.
[4] Y. Kobayashi, T. Ohno, T. Sekikawa, Y. Nabekawa, andS. Watanabe, “Pulse width measurement of high-order har-monics by autocorrelation,” Applied Physics B: Lasers andOptics, vol. 70, no. 3, pp. 389–394, 2000.
[5] J.-F. Hergott, M. Kovacev, H. Merdji et al., “Extreme-ultravio-let high-order harmonic pulses in the microjoule range,” Phys-ical Review A, vol. 66, no. 2, article 021801, 2002.
[6] P. Rudawski, C. M. Heyl, F. Brizuela et al., “A high-flux high-order harmonic source,” Review of Scientific Instruments,vol. 84, no. 7, article 073103, 2013.
[7] B. Manschwetus, L. Rading, F. Campi et al., “Two-photon dou-ble ionization of neon using an intense attosecond pulse train,”Physical Review A, vol. 93, no. 6, article 061402, 2016.
[8] I. Makos, I. Orfanos, A. Nayak et al., “Α 10-gigawatt attose-cond source for non-linear XUV optics and XUV-pump-XUV- probe studies,” Scientific Reports, vol. 10, no. 1,p. 3759, 2020.
[9] K. Midorikawa, Y. Nabekawa, and A. Suda, “XUV multipho-ton processes with intense high-order harmonics,” Progressin Quantum Electronics, vol. 32, no. 2, pp. 43–88, 2008.
[10] E. J. Takahashi, P. Lan, O. D. Mücke, Y. Nabekawa, andK. Midorikawa, “Attosecond nonlinear optics using gigawatt-scale isolated attosecond pulses,” Nature Communications,vol. 4, no. 1, 2013.
[11] A. Nayak, I. Orfanos, I. Makos et al., “Multiple ionization ofargon via multi-xuv-photon absorption induced by 20-gwhigh-order harmonic laser pulses,” Physical Review A,vol. 98, no. 2, article 023426, 2018.
[12] B. Senfftleben,M. Kretschmar, A. Hoffmann et al., “Highly non-linear ionization of atoms induced by intense high-harmonicpulses,” Journal of Physics: Photonics, vol. 2, no. 3, 2020.
[13] P. A. Carpeggiani, P. Tzallas, A. Palacios, D. Gray, F. Martín,and D. Charalambidis, “Disclosing intrinsic molecular dynam-ics on the 1-fs scale through extreme-ultraviolet pump-probemeasurements,” Physical Review A, vol. 89, no. 2, article023420, 2014.
[14] P. Tzallas, D. Charalambidis, N. A. Papadogiannis, K. Witte,and G. D. Tsakiris, “Direct observation of attosecond lightbunching,” Nature, vol. 426, no. 6964, pp. 267–271, 2003.
[15] Y. Nabekawa, H. Hasegawa, E. J. Takahashi, andK. Midorikawa, “Production of doubly charged helium ionsby two-photon absorption of an intense sub-10-fs soft X-raypulse at 42 eV photon energy,” Physical Review Letters,vol. 94, no. 4, article 043001, 2005.
[16] C. Pellegrini, A. Marinelli, and S. Reiche, “The physics of x-rayfree-electron lasers,” Reviews of Modern Physics, vol. 88, no. 1,article 015006, 2016.
[17] L. Young, K. Ueda, M. Gühr et al., “Roadmap of ultrafast x-rayatomic and molecular physics,” Journal of Physics B: Atomic,Molecular and Optical Physics, vol. 51, no. 3, p. 032003, 2018.
[18] J. Duris, S. Li, T. Driver et al., “Tunable isolated attosecond x-ray pulses with gigawatt peak power from a free-electronlaser,” Nature Photonics, vol. 14, no. 1, pp. 30–36, 2020.
[19] A. Suda, H. Mashiko, and K. Midorikawa, “Focusing intensehigh-order harmonics to a micron spot size,” in Progress inUltrafast Intense Laser Science II, pp. 183–198, Springer BerlinHeidelberg, Berlin, Heidelberg, 2007.
[20] H. Motoyama, T. Sato, A. Iwasaki et al., “Development of high-order harmonic focusing system based on ellipsoidal mirror,”Review of Scientific Instruments, vol. 87, no. 5, article 051803,2016.
[21] C. Valentin, D. Douillet, S. Kazamias et al., “Imaging and qual-ity assessment of high-harmonic focal spots,” Optics Letters,vol. 28, no. 12, pp. 1049–1051, 2003.
[22] F. Frassetto, S. Anumula, F. Calegari, A. Trabattoni, M. Nisoli,and L. Poletto, “Microfocusing beamline for xuv-xuv pump-probe experiments using hh generation,” in Adaptive X-RayOptics III, vol. 9208, pp. 159–167, September 2014.
[23] H. Coudert-Alteirac, H. Dacasa, F. Campi et al., “Micro-focus-ing of broadband highorder harmonic radiation by a doubletoroidal mirror,” Applied Sciences, vol. 7, no. 11, p. 1159, 2017.
7Ultrafast Science

[24] I. Orfanos, I. Makos, I. Liontos et al., “Non-linear processes inthe extreme ultraviolet,” Journal of Physics: Photonics, vol. 2,no. 4, 2020.
[25] J. A. Arnaud, W. M. Hubbard, G. D. Mandeville, B. de laClavière, E. A. Franke, and J. M. Franke, “Technique forfast measurement of Gaussian laser beam parameters,”Applied Optics, vol. 10, no. 12, pp. 2775-2776, 1971.
[26] D. R. Skinner and R. E. Whitcher, “Measurement of the radiusof a high-power laser beam near the focus of a lens,” Journal ofPhysics E: Scientific Instruments, vol. 5, no. 3, pp. 237-238,1972.
[27] L. le Déroff, P. Salières, and B. Carré, “Beam-quality measure-ment of a focused high-order harmonic beam,” Optics Letters,vol. 23, no. 19, pp. 1544–1546, 1998.
[28] D. G. Lee, J. J. Park, J. H. Sung, and C. H. Nam, “Wave-frontphase measurements of high-order harmonic beams by useof point-diffraction interferometry,” Optics Letters, vol. 28,no. 6, pp. 480–482, 2003.
[29] E. Frumker, G. G. Paulus, H. Niikura, D. M. Villeneuve, andP. B. Corkum, “Frequency-resolved high-harmonic wavefrontcharacterization,” Optics Letters, vol. 34, no. 19, pp. 3026–3028, 2009.
[30] D. R. Austin, T. Witting, C. A. Arrell et al., “Lateral shearinginterferometry of high-harmonic wavefronts,” Optics Letters,vol. 36, no. 10, pp. 1746–1748, 2011.
[31] H. Motoyama, A. Iwasaki, Y. Takei et al., “Broadband nano-focusing of high-order harmonics in soft x-ray region withellipsoidal mirror,” Applied Physics Letters, vol. 114, no. 24,article 241102, 2019.
[32] D. T. Lloyd, K. O’Keeffe, and S. M. Hooker, “Complete spatialcharacterization of an optical wavefront using a variable-separation pinhole pair,” Optics Letters, vol. 38, no. 7,pp. 1173–1175, 2013.
[33] E. Frumker, G. G. Paulus, H. Niikura, A. Naumov, D. M.Villeneuve, and P. B. Corkum, “Order-dependent structureof high harmonic wavefronts,” Optics Express, vol. 20, no. 13,article 13870, p. 13877, 2012.
[34] H. Wikmark, C. Guo, J. Vogelsang et al., “Spatiotemporalcoupling of attosecond pulses,” Proceedings of the NationalAcademy of Sciences, vol. 116, no. 11, pp. 4779–4787,2019.
[35] L. Quintard, V. Strelkov, J. Vabek et al., “Optics-less focusingof XUV high-order harmonics,” Science Advances, vol. 5,no. 4, article eaau7175, 2019.
[36] H. Dacasa, H. Coudert-Alteirac, C. Guo et al., “Single-shotextreme-ultraviolet wavefront measurements of high-order har-monics,” Optics Express, vol. 27, no. 3, pp. 2656–2670, 2019.
[37] C. Hernández-García, A. Picón, J. San Román, and L. Plaja,“Attosecond extreme ultraviolet vortices from high-order har-monic generation,” Physical Review Letters, vol. 111, no. 8,article 083602, 2013.
[38] S. Chatziathanasiou, S. Kahaly, D. Charalambidis, P. Tzallas,and E. Skantzakis, “Imaging the source of high-harmonicsgenerated in atomic gas media,” Optics Express, vol. 27, no. 7,pp. 9733–9739, 2019.
[39] H. Wolter, “Spiegelsysteme streifenden Einfalls als abbildendeOptiken für Röntgenstrahlen,” Annalen der Physik, vol. 445,no. 1-2, pp. 94–114, 1952.
[40] P. B. Corkum, “Plasma perspective on strong field multipho-ton ionization,” Physical Review Letters, vol. 71, no. 13,pp. 1994–1997, 1993.
[41] K. J. Schafer, B. Yang, L. F. DiMauro, and K. C. Kulander,“Above threshold ionization beyond the high harmonic cut-off,” Physical Review Letters, vol. 70, no. 11, pp. 1599–1602,1993.
[42] M. Bellini, C. Lyngå, A. Tozzi et al., “Temporal coherence ofultrashort high-order harmonic pulses,” Physical Review Let-ters, vol. 81, no. 2, pp. 297–300, 1998.
[43] P. Salières, B. Carré, L. le Déroff et al., “Feynman’s path-integral approach for intense-laser-atom interactions,” Science,vol. 292, no. 5518, pp. 902–905, 2001.
[44] M. Lewenstein, K. C. Kulander, K. J. Schafer, and P. H.Bucksbaum, “Rings in above-threshold ionization: a quasi-classical analysis,” Physical Review A, vol. 51, no. 2,pp. 1495–1507, 1995.
[45] C. Guo, A. Harth, S. Carlström et al., “Phase control of attose-cond pulses in a train,” Journal of Physics B: Atomic Molecularand Optical Physics, vol. 51, no. 3, article 034006, 2018.
[46] C. Hernández-García, J. S. Román, L. Plaja, and A. Picón,“Quantum-path signatures in attosecond helical beams drivenby optical vortices,” New Journal of Physics, vol. 17, no. 9, arti-cle 093029, 2015.
[47] F. Catoire, A. Ferré, O. Hort et al., “Complex structure of spa-tially resolved high-order-harmonic spectra,” Physical ReviewA, vol. 94, no. 6, 2016.
[48] L. Rego, J. S. Román, A. Picón, L. Plaja, and C. Hernández-García, “Nonperturbative twist in the generation of extreme-ultraviolet vortex beams,” Physical Review Letters, vol. 117,no. 16, 2016.
[49] J. A. Pérez-Hernández, L. Roso, and L. Plaja, “Harmonic gen-eration beyond the Strong-Field approximation: the physicsbehind the short-wave-infrared scaling laws,” Optics Express,vol. 17, no. 12, pp. 9891–9903, 2009.
[50] C. G. Durfee, A. R. Rundquist, S. Backus, C. Herne, M. M.Murnane, and H. C. Kapteyn, “Phase matching of high-orderharmonics in hollow waveguides,” Physical Review Letters,vol. 83, no. 11, pp. 2187–2190, 1999.
[51] Y. Mairesse, A. de Bohan, L. J. Frasinski et al., “Attosecondsynchronization of high-harmonic soft X-rays,” Science,vol. 302, no. 5650, pp. 1540–1543, 2003.
8 Ultrafast Science