research article a quantitative analysis of cold water...
TRANSCRIPT

Research ArticleA Quantitative Analysis of Cold Water for HumanConsumption in Hospitals in Spain
A. G. González,1 J. García-Sanz-Calcedo,2 D. R. Salgado,3 and A. Mena4
1School of Design Engineering, Department of Mechanical, Energy, and Materials Engineering, University of Extremadura,06800 Merida, Spain2Department of Projects, University of Extremadura, 06007 Badajoz, Spain3School of Industrial Engineering, Department of Mechanical, Energy, and Materials Engineering, University of Extremadura,06007 Badajoz, Spain4School of Industrial Engineering, Department of Engineering Design and Projects, University of Huelva, 21003 Huelva, Spain
Correspondence should be addressed to J. Garcıa-Sanz-Calcedo; [email protected]
Received 16 December 2015; Revised 3 May 2016; Accepted 8 May 2016
Academic Editor: John S. Katsanis
Copyright © 2016 A. G. Gonzalez et al.This is an open access article distributed under the Creative Commons Attribution License,which permits unrestricted use, distribution, and reproduction in any medium, provided the original work is properly cited.
An estimation of the water used for human consumption in hospitals is essential to determine possible savings and to fix criteria toimprove the design of new water consumption models. The present work reports on cold water for human consumption (CWHC)in hospitals in Spain and determines the possible savings. In the period of 2005–2012, 80 Eco-Management and Audit Schemes(EMAS) from 20 hospitals were analysed.The results conclude that the average annual consumption of CWHC is 1.59m3/m2 (witha standard deviation of 0.48m3/m2), 195.85m3/bed (standard deviation 70.07m3/bed), or 53.69m3/worker (standard deviation16.64m3/worker). The results demonstrate the possibility of saving 5,600,000m3 of water per year. Assuming the cost of water asapproximately 1.22 €/m3, annual savings are estimated as 6,832,000 €. Furthermore, 2,912MWh of energy could be saved, and theemission of 22,400 annual tonnes of CO
2into the atmosphere could be avoided.
1. Introduction
The hospital is a tertiary sector building in which, due tothe nature of its usage, a large number of human resourcesare needed.The objectives outlined by the European Councilin March 2007 were initially to reduce the total energyconsumption by 20% (based on the 2005 consumption) andto cut greenhouse emissions by 20% to below the emissionsrecorded in 1990. These objectives were designed to reducethe use of resources [1].
Although the quantity of water available on Earth todayis sufficient to cover the needs of the population, continualinappropriate and excessive usage could lead to a lack ofresources within a few years. To overcome this situation, achange in current consumption rates is crucial. This wouldfocus on (i) the preservation of water and an improvement inwater management, (ii) encouragement of a greater respectand sensitivity towards the usage of water, and (iii) a morebalanced distribution and emphasis on its ecological andsocial value [2].
In Spain, annual water consumption in cities totals5,000,000,000m3, which is 20% of the country’s total con-sumption. The average daily usage is 171 litres per person,at a cost between 0.91 €/m3 and 1.69 €/m3 depending on theregion [3].
At EuropeanUnion level, theWater FrameworkDirectivesets objectives to be achieved by all member states, but waterquantities are relatively less considered than water quality,and achieving the goals often requires collaboration as wateris a shared resource that requires a holistic and integratedapproach [4].
ThePacific Institute for Studies inDevelopment, Environ-ment and Security highlights the importance of the hospitalsin the construction sector, for its usage of large quantitiesof water in most procedures [5]. The areas where waterconsumption in a hospital is high are as follows: patientsrooms 20%, domestic hot water (DHW) 15%, laundry areas15%, maintenance of green areas 10%, therapeutic pools9%, kitchens 8%, cleaning 5%, refrigeration towers 5%,
Hindawi Publishing CorporationJournal of Healthcare EngineeringVolume 2016, Article ID 6534823, 10 pageshttp://dx.doi.org/10.1155/2016/6534823
2 Journal of Healthcare Engineering
UE
USA U
K UE
USA U
K
Ger
man
y
Cana
da
Mex
ico
HPO
Pola
nd
Gre
ece
(m3 /b
ed)
0
100
200
300
400
500
600
700
(m3 /b
ed)
0
10
20
30
40
50
60
70
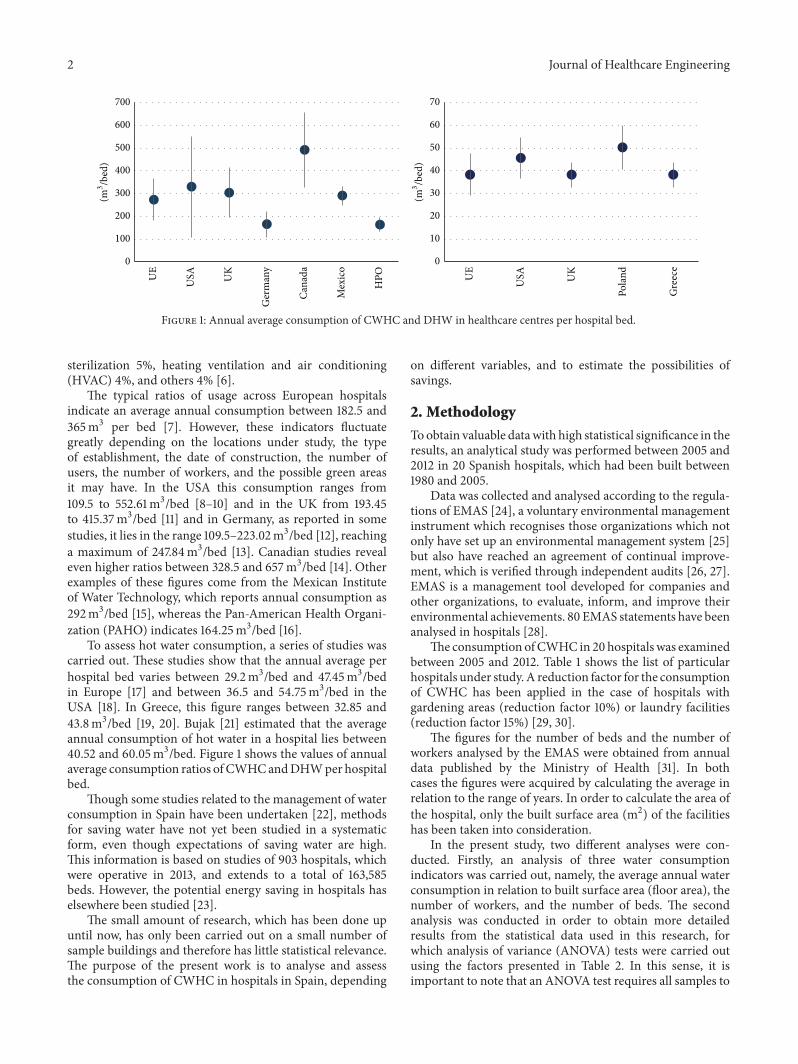
Figure 1: Annual average consumption of CWHC and DHW in healthcare centres per hospital bed.
sterilization 5%, heating ventilation and air conditioning(HVAC) 4%, and others 4% [6].
The typical ratios of usage across European hospitalsindicate an average annual consumption between 182.5 and365m3 per bed [7]. However, these indicators fluctuategreatly depending on the locations under study, the typeof establishment, the date of construction, the number ofusers, the number of workers, and the possible green areasit may have. In the USA this consumption ranges from109.5 to 552.61m3/bed [8–10] and in the UK from 193.45to 415.37m3/bed [11] and in Germany, as reported in somestudies, it lies in the range 109.5–223.02m3/bed [12], reachinga maximum of 247.84m3/bed [13]. Canadian studies revealeven higher ratios between 328.5 and 657m3/bed [14]. Otherexamples of these figures come from the Mexican Instituteof Water Technology, which reports annual consumption as292m3/bed [15], whereas the Pan-American Health Organi-zation (PAHO) indicates 164.25m3/bed [16].
To assess hot water consumption, a series of studies wascarried out. These studies show that the annual average perhospital bed varies between 29.2m3/bed and 47.45m3/bedin Europe [17] and between 36.5 and 54.75m3/bed in theUSA [18]. In Greece, this figure ranges between 32.85 and43.8m3/bed [19, 20]. Bujak [21] estimated that the averageannual consumption of hot water in a hospital lies between40.52 and 60.05m3/bed. Figure 1 shows the values of annualaverage consumption ratios of CWHCandDHWper hospitalbed.
Though some studies related to the management of waterconsumption in Spain have been undertaken [22], methodsfor saving water have not yet been studied in a systematicform, even though expectations of saving water are high.This information is based on studies of 903 hospitals, whichwere operative in 2013, and extends to a total of 163,585beds. However, the potential energy saving in hospitals haselsewhere been studied [23].
The small amount of research, which has been done upuntil now, has only been carried out on a small number ofsample buildings and therefore has little statistical relevance.The purpose of the present work is to analyse and assessthe consumption of CWHC in hospitals in Spain, depending
on different variables, and to estimate the possibilities ofsavings.
2. Methodology
Toobtain valuable datawith high statistical significance in theresults, an analytical study was performed between 2005 and2012 in 20 Spanish hospitals, which had been built between1980 and 2005.
Data was collected and analysed according to the regula-tions of EMAS [24], a voluntary environmental managementinstrument which recognises those organizations which notonly have set up an environmental management system [25]but also have reached an agreement of continual improve-ment, which is verified through independent audits [26, 27].EMAS is a management tool developed for companies andother organizations, to evaluate, inform, and improve theirenvironmental achievements. 80 EMAS statements have beenanalysed in hospitals [28].
The consumption ofCWHC in 20 hospitals was examinedbetween 2005 and 2012. Table 1 shows the list of particularhospitals under study.A reduction factor for the consumptionof CWHC has been applied in the case of hospitals withgardening areas (reduction factor 10%) or laundry facilities(reduction factor 15%) [29, 30].
The figures for the number of beds and the number ofworkers analysed by the EMAS were obtained from annualdata published by the Ministry of Health [31]. In bothcases the figures were acquired by calculating the average inrelation to the range of years. In order to calculate the area ofthe hospital, only the built surface area (m2) of the facilitieshas been taken into consideration.
In the present study, two different analyses were con-ducted. Firstly, an analysis of three water consumptionindicators was carried out, namely, the average annual waterconsumption in relation to built surface area (floor area), thenumber of workers, and the number of beds. The secondanalysis was conducted in order to obtain more detailedresults from the statistical data used in this research, forwhich analysis of variance (ANOVA) tests were carried outusing the factors presented in Table 2. In this sense, it isimportant to note that an ANOVA test requires all samples to

Journal of Healthcare Engineering 3
Table 1: List of hospitals under study.
Hospital Management Area (m2) Number of workers Number of beds CWHC (m3/year) ProvinceHospital Asepeyo de Coslada Private 22,000 389 200 31,536 MadridHM Universitario de Madrid Private 7,717 257 110 10,074 MadridHM Universitario Monteprıncipe Private 19,521 503 197 40,147 MadridHM Universitario Torrelodones Private 10,808 291 136 12,928 MadridHM Universitario Sanchinarro Private 33,989 520 190 24,692 MadridHospital Clınico San Carlos Public 175,000 5,811 996 271,270 MadridHospital Juan Ramon Jimenez Public 126,241 2,685 725 215,232 HuelvaHospital Costa del Sol Public 24,408 1,271 366 71,690 MalagaHAR de Benalmadena Public 7,077 300 48 8,184 MalagaHospital Virgen de las Nieves Public 42,734 4,977 1,075 266,767 GranadaHospital Victoria Eugenia Private 7,330 372 39 9,889 SevillaHospital General de Valencia Public 18,209 2,184 550 145,773 ValenciaFundacion Hospital Calahorra Public 6,683 382 91 36,195 La RiojaHospital Galdakao-Usansolo Public 72,000 1,599 383 131,730 VizcayaHospital de Zumarraga Public 14,125 470 130 23,801 GuipuzcoaHospital Asepeyo Sant Cugat Private 15,000 350 120 23,194 BarcelonaHospital de Figueres Private 18,186 643 168 36,857 GeronaHospital de Manacor Public 28,333 1,076 226 62,330 BalearesHospital de Palamos Private 21,151 643 136 30,455 GeronaHospital Perpetuo Socorro Private 10,409 237 195 12,568 Las Palmas
Table 2: Classification of the factors considered in the statistical analysis of the collected data.
Factors Distribution regarding factors
Type of management (TM) PublicPrivate
Gross Domestic Product (GDP)
GDP 1: <20,000 €GDP 2: 20,000 €–25,000 €GDP 3: 25,000 €–30,000 €
GDP 4: >30,000 €
Heating degrees-day year (HDDY)
HDDY 1: 0∘ to 250∘CHDDY 2: 250∘ to 500∘CHDDY 3: 500∘ to 750∘CHDDY 4: 750∘ to 1000∘CHDDY 5: 1,000∘ to 1,250∘CHDDY 6: 1,250∘ to 1,500∘C
HDDY 7: >1,500∘C
Hospital category depending on the number of beds (HCNB)
HCNB 1: <200 bedsHCNB 2: 200 to 500 bedsHCNB 3: 500 to 1,000 beds
HCNB 4: >1,000 beds
Geographic location (GL)
MadridAndalucıaValenciaRioja
Paıs VascoCatalunaCanarias
Range of years 2005–20072008–2012
4 Journal of Healthcare Engineering
follow a normal distribution and to have the same variance.To prove that these indicators verify a normal distribution,the Levene test (an inferential statistic used to assess theequality of variances for a variable calculated for two ormore groups) [32] was used. ANOVA is a statistical tool usedto determine whether there are any significant differencesbetween the means of three or more unrelated groups ofdata. In particular, ANOVA compares the means betweenthe groups and determines whether any of those means aresignificantly different from each other.
The Gross Domestic Product (GDP) is the monetaryvalue of all finished goods and services produced within acountry’s borders during a specific period of time, and itis considered a representative indicator that measures thegrowth or decrease of goods and services production. GDPis one of the primary measures used by decision-makers andfinancial and other institutions to evaluate the health of theeconomy. An increase in real GDP is interpreted as a signthat the economy is doing well, while a decrease indicatesthat the economy is not working at its full capacity. RealGDP is linked to other macro-economic variables such asemployment, economic cycles, productivity, and long-termeconomic growth. In this sense, it is reasonable to considerthat theGDPcan be related to the services offered by hospitalsand that such services could directly be related to the waterconsumption. The GDP has been divided into four ranges inthis study (Table 2).
Heating degrees-day year (HDDY) is defined as the sumof the difference between a reference temperature and theaverage temperature of the day (taking into account all thedays in a period) when such a temperature is lower than 15∘C:
HDDY (∘C) =𝑛
∑
𝑖=1
(15 −
𝑇max + 𝑇min2
) ⋅ 𝑋𝑐, (1)
where 𝑇max and 𝑇min represent the maximum and the min-imum daily temperature, respectively, and 𝑋
𝑐is a logical
coefficient that will equal unity when the average dailytemperature is lower than 15∘C and zero for values exceeding15∘C.
3. Results
In this section, firstly, the analysis of the correlation betweenthe average annual consumption of water and the threeindicators considered (built surface area, number of workers,and number of beds) is presented. Secondly, theANOVA testsaccording to the factors listed in Table 2 are presented. Thefollowing results are obtained from the water consumptiondata given in Table 1.
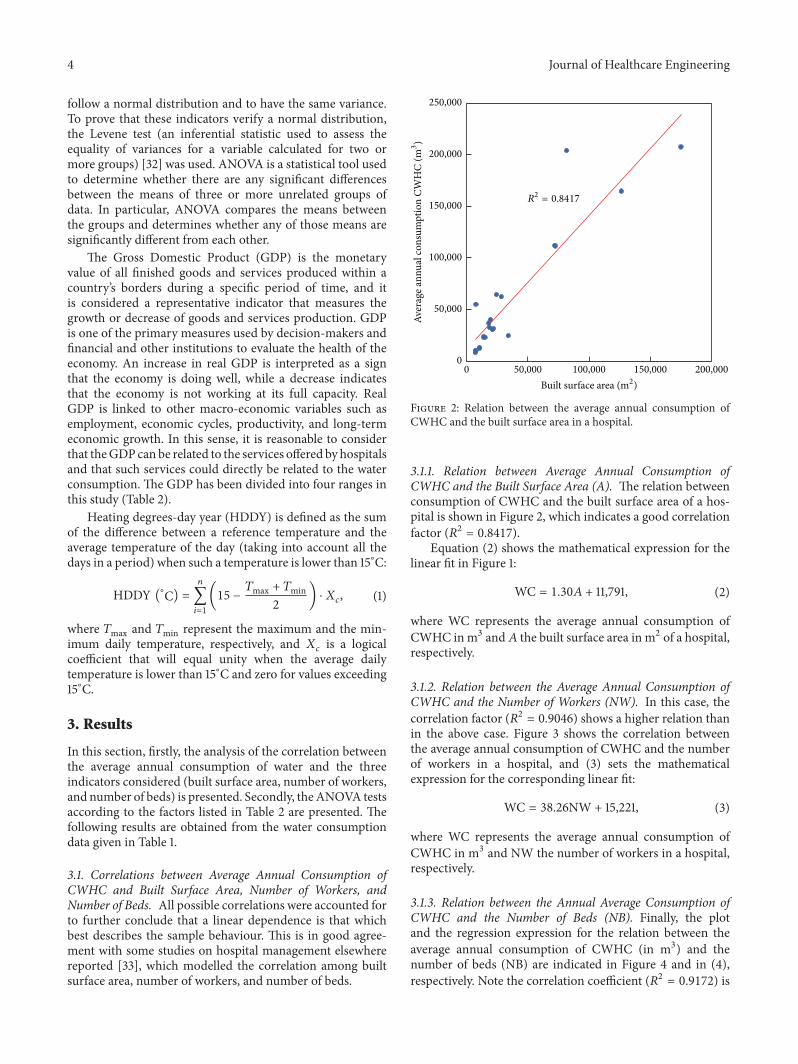
3.1. Correlations between Average Annual Consumption ofCWHC and Built Surface Area, Number of Workers, andNumber of Beds. All possible correlations were accounted forto further conclude that a linear dependence is that whichbest describes the sample behaviour. This is in good agree-ment with some studies on hospital management elsewherereported [33], which modelled the correlation among builtsurface area, number of workers, and number of beds.
R2= 0.8417
0
50,000
100,000
150,000
200,000
250,000
Aver
age a
nnua
l con
sum
ptio
n CW
HC
(m3 )
50,000 100,000 150,000 200,0000Built surface area (m2)
Figure 2: Relation between the average annual consumption ofCWHC and the built surface area in a hospital.
3.1.1. Relation between Average Annual Consumption ofCWHC and the Built Surface Area (A). The relation betweenconsumption of CWHC and the built surface area of a hos-pital is shown in Figure 2, which indicates a good correlationfactor (𝑅2 = 0.8417).
Equation (2) shows the mathematical expression for thelinear fit in Figure 1:
WC = 1.30𝐴 + 11,791, (2)
where WC represents the average annual consumption ofCWHC inm3 and𝐴 the built surface area in m2 of a hospital,respectively.
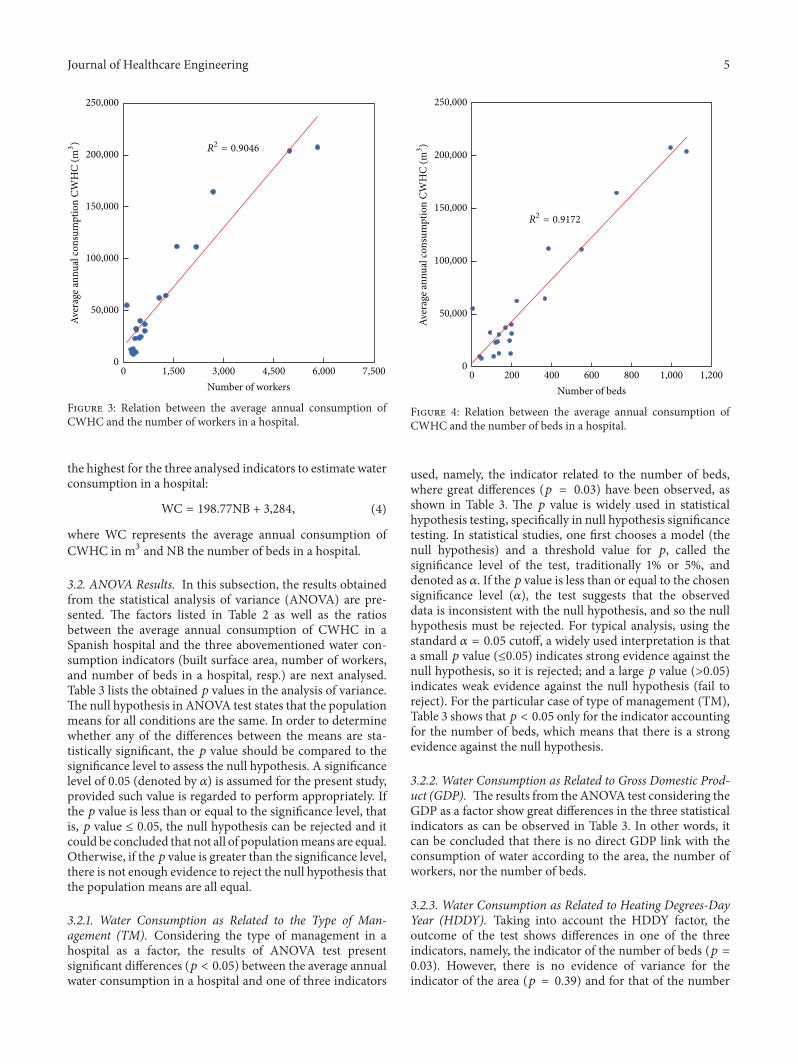
3.1.2. Relation between the Average Annual Consumption ofCWHC and the Number of Workers (NW). In this case, thecorrelation factor (𝑅2 = 0.9046) shows a higher relation thanin the above case. Figure 3 shows the correlation betweenthe average annual consumption of CWHC and the numberof workers in a hospital, and (3) sets the mathematicalexpression for the corresponding linear fit:
WC = 38.26NW + 15,221, (3)
where WC represents the average annual consumption ofCWHC in m3 and NW the number of workers in a hospital,respectively.
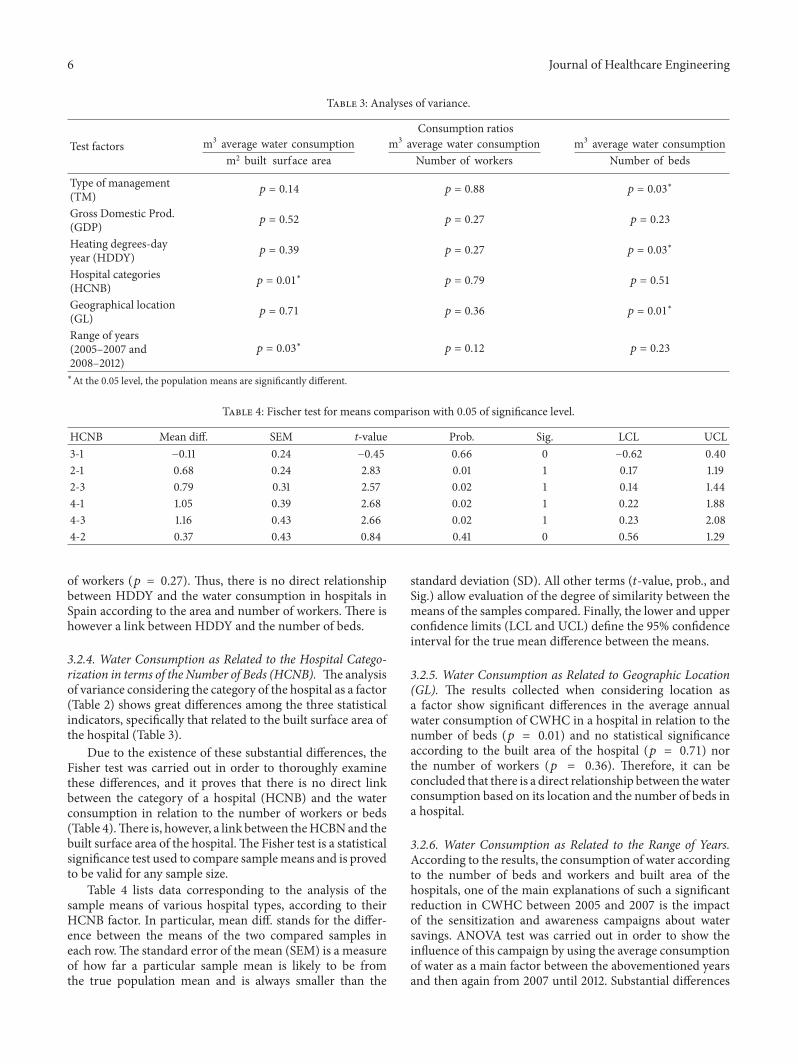
3.1.3. Relation between the Annual Average Consumption ofCWHC and the Number of Beds (NB). Finally, the plotand the regression expression for the relation between theaverage annual consumption of CWHC (in m3) and thenumber of beds (NB) are indicated in Figure 4 and in (4),respectively. Note the correlation coefficient (𝑅2 = 0.9172) is
Journal of Healthcare Engineering 5
R2= 0.9046
0
50,000
100,000
150,000
200,000
250,000
Aver
age a
nnua
l con
sum
ptio
n CW
HC
(m3 )
1,500 3,000 4,500 6,000 7,5000Number of workers
Figure 3: Relation between the average annual consumption ofCWHC and the number of workers in a hospital.
the highest for the three analysed indicators to estimate waterconsumption in a hospital:
WC = 198.77NB + 3,284, (4)
where WC represents the average annual consumption ofCWHC in m3 and NB the number of beds in a hospital.
3.2. ANOVA Results. In this subsection, the results obtainedfrom the statistical analysis of variance (ANOVA) are pre-sented. The factors listed in Table 2 as well as the ratiosbetween the average annual consumption of CWHC in aSpanish hospital and the three abovementioned water con-sumption indicators (built surface area, number of workers,and number of beds in a hospital, resp.) are next analysed.Table 3 lists the obtained 𝑝 values in the analysis of variance.The null hypothesis in ANOVA test states that the populationmeans for all conditions are the same. In order to determinewhether any of the differences between the means are sta-tistically significant, the 𝑝 value should be compared to thesignificance level to assess the null hypothesis. A significancelevel of 0.05 (denoted by 𝛼) is assumed for the present study,provided such value is regarded to perform appropriately. Ifthe 𝑝 value is less than or equal to the significance level, thatis, 𝑝 value ≤ 0.05, the null hypothesis can be rejected and itcould be concluded that not all of populationmeans are equal.Otherwise, if the 𝑝 value is greater than the significance level,there is not enough evidence to reject the null hypothesis thatthe population means are all equal.
3.2.1. Water Consumption as Related to the Type of Man-agement (TM). Considering the type of management in ahospital as a factor, the results of ANOVA test presentsignificant differences (𝑝 < 0.05) between the average annualwater consumption in a hospital and one of three indicators
200 400 600 800 1,000 1,2000Number of beds
0
50,000
100,000
150,000
200,000
250,000
Aver
age a
nnua
l con
sum
ptio
n CW
HC
(m3 )
R2= 0.9172
Figure 4: Relation between the average annual consumption ofCWHC and the number of beds in a hospital.
used, namely, the indicator related to the number of beds,where great differences (𝑝 = 0.03) have been observed, asshown in Table 3. The 𝑝 value is widely used in statisticalhypothesis testing, specifically in null hypothesis significancetesting. In statistical studies, one first chooses a model (thenull hypothesis) and a threshold value for 𝑝, called thesignificance level of the test, traditionally 1% or 5%, anddenoted as 𝛼. If the 𝑝 value is less than or equal to the chosensignificance level (𝛼), the test suggests that the observeddata is inconsistent with the null hypothesis, and so the nullhypothesis must be rejected. For typical analysis, using thestandard 𝛼 = 0.05 cutoff, a widely used interpretation is thata small 𝑝 value (≤0.05) indicates strong evidence against thenull hypothesis, so it is rejected; and a large 𝑝 value (>0.05)indicates weak evidence against the null hypothesis (fail toreject). For the particular case of type of management (TM),Table 3 shows that 𝑝 < 0.05 only for the indicator accountingfor the number of beds, which means that there is a strongevidence against the null hypothesis.
3.2.2. Water Consumption as Related to Gross Domestic Prod-uct (GDP). The results from the ANOVA test considering theGDP as a factor show great differences in the three statisticalindicators as can be observed in Table 3. In other words, itcan be concluded that there is no direct GDP link with theconsumption of water according to the area, the number ofworkers, nor the number of beds.
3.2.3. Water Consumption as Related to Heating Degrees-DayYear (HDDY). Taking into account the HDDY factor, theoutcome of the test shows differences in one of the threeindicators, namely, the indicator of the number of beds (𝑝 =0.03). However, there is no evidence of variance for theindicator of the area (𝑝 = 0.39) and for that of the number
6 Journal of Healthcare Engineering
Table 3: Analyses of variance.
Test factorsConsumption ratios
m3 average water consumptionm2 built surface area
m3 average water consumptionNumber of workers
m3 average water consumptionNumber of beds
Type of management(TM) 𝑝 = 0.14 𝑝 = 0.88 𝑝 = 0.03
∗
Gross Domestic Prod.(GDP) 𝑝 = 0.52 𝑝 = 0.27 𝑝 = 0.23
Heating degrees-dayyear (HDDY) 𝑝 = 0.39 𝑝 = 0.27 𝑝 = 0.03
∗
Hospital categories(HCNB) 𝑝 = 0.01
∗𝑝 = 0.79 𝑝 = 0.51
Geographical location(GL) 𝑝 = 0.71 𝑝 = 0.36 𝑝 = 0.01
∗
Range of years(2005–2007 and2008–2012)
𝑝 = 0.03∗
𝑝 = 0.12 𝑝 = 0.23
∗At the 0.05 level, the population means are significantly different.
Table 4: Fischer test for means comparison with 0.05 of significance level.
HCNB Mean diff. SEM t-value Prob. Sig. LCL UCL3-1 −0.11 0.24 −0.45 0.66 0 −0.62 0.402-1 0.68 0.24 2.83 0.01 1 0.17 1.192-3 0.79 0.31 2.57 0.02 1 0.14 1.444-1 1.05 0.39 2.68 0.02 1 0.22 1.884-3 1.16 0.43 2.66 0.02 1 0.23 2.084-2 0.37 0.43 0.84 0.41 0 0.56 1.29
of workers (𝑝 = 0.27). Thus, there is no direct relationshipbetween HDDY and the water consumption in hospitals inSpain according to the area and number of workers. There ishowever a link between HDDY and the number of beds.
3.2.4. Water Consumption as Related to the Hospital Catego-rization in terms of the Number of Beds (HCNB). The analysisof variance considering the category of the hospital as a factor(Table 2) shows great differences among the three statisticalindicators, specifically that related to the built surface area ofthe hospital (Table 3).
Due to the existence of these substantial differences, theFisher test was carried out in order to thoroughly examinethese differences, and it proves that there is no direct linkbetween the category of a hospital (HCNB) and the waterconsumption in relation to the number of workers or beds(Table 4).There is, however, a link between theHCBNand thebuilt surface area of the hospital.The Fisher test is a statisticalsignificance test used to compare samplemeans and is provedto be valid for any sample size.
Table 4 lists data corresponding to the analysis of thesample means of various hospital types, according to theirHCNB factor. In particular, mean diff. stands for the differ-ence between the means of the two compared samples ineach row.The standard error of the mean (SEM) is a measureof how far a particular sample mean is likely to be fromthe true population mean and is always smaller than the
standard deviation (SD). All other terms (𝑡-value, prob., andSig.) allow evaluation of the degree of similarity between themeans of the samples compared. Finally, the lower and upperconfidence limits (LCL and UCL) define the 95% confidenceinterval for the true mean difference between the means.
3.2.5. Water Consumption as Related to Geographic Location(GL). The results collected when considering location asa factor show significant differences in the average annualwater consumption of CWHC in a hospital in relation to thenumber of beds (𝑝 = 0.01) and no statistical significanceaccording to the built area of the hospital (𝑝 = 0.71) northe number of workers (𝑝 = 0.36). Therefore, it can beconcluded that there is a direct relationship between thewaterconsumption based on its location and the number of beds ina hospital.
3.2.6. Water Consumption as Related to the Range of Years.According to the results, the consumption of water accordingto the number of beds and workers and built area of thehospitals, one of the main explanations of such a significantreduction in CWHC between 2005 and 2007 is the impactof the sensitization and awareness campaigns about watersavings. ANOVA test was carried out in order to show theinfluence of this campaign by using the average consumptionof water as a main factor between the abovementioned yearsand then again from 2007 until 2012. Substantial differences
Journal of Healthcare Engineering 7
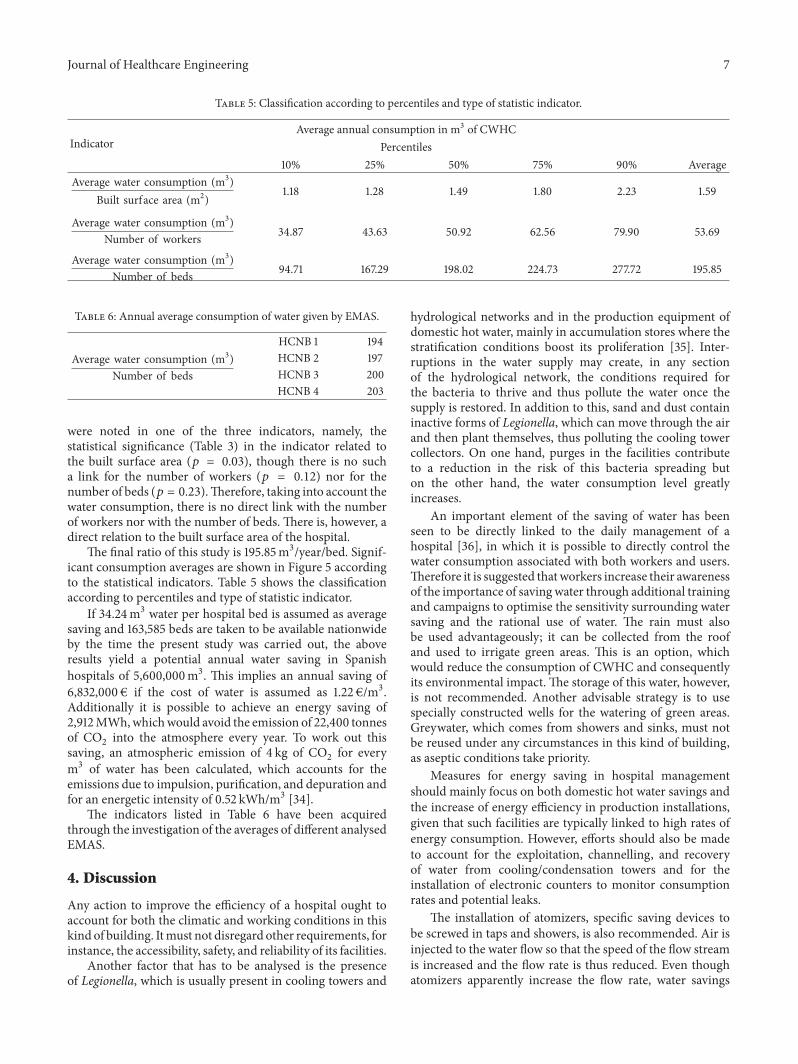
Table 5: Classification according to percentiles and type of statistic indicator.
IndicatorAverage annual consumption in m3 of CWHC
Percentiles10% 25% 50% 75% 90% Average
Average water consumption (m3)Built surface area (m2)
1.18 1.28 1.49 1.80 2.23 1.59
Average water consumption (m3)Number of workers 34.87 43.63 50.92 62.56 79.90 53.69
Average water consumption (m3)Number of beds 94.71 167.29 198.02 224.73 277.72 195.85
Table 6: Annual average consumption of water given by EMAS.
Average water consumption (m3)Number of beds
HCNB 1 194HCNB 2 197HCNB 3 200HCNB 4 203
were noted in one of the three indicators, namely, thestatistical significance (Table 3) in the indicator related tothe built surface area (𝑝 = 0.03), though there is no sucha link for the number of workers (𝑝 = 0.12) nor for thenumber of beds (𝑝 = 0.23).Therefore, taking into account thewater consumption, there is no direct link with the numberof workers nor with the number of beds. There is, however, adirect relation to the built surface area of the hospital.
The final ratio of this study is 195.85m3/year/bed. Signif-icant consumption averages are shown in Figure 5 accordingto the statistical indicators. Table 5 shows the classificationaccording to percentiles and type of statistic indicator.
If 34.24m3 water per hospital bed is assumed as averagesaving and 163,585 beds are taken to be available nationwideby the time the present study was carried out, the aboveresults yield a potential annual water saving in Spanishhospitals of 5,600,000m3. This implies an annual saving of6,832,000 € if the cost of water is assumed as 1.22 €/m3.Additionally it is possible to achieve an energy saving of2,912MWh,whichwould avoid the emission of 22,400 tonnesof CO
2into the atmosphere every year. To work out this
saving, an atmospheric emission of 4 kg of CO2for every
m3 of water has been calculated, which accounts for theemissions due to impulsion, purification, and depuration andfor an energetic intensity of 0.52 kWh/m3 [34].
The indicators listed in Table 6 have been acquiredthrough the investigation of the averages of different analysedEMAS.
4. Discussion
Any action to improve the efficiency of a hospital ought toaccount for both the climatic and working conditions in thiskind of building. Itmust not disregard other requirements, forinstance, the accessibility, safety, and reliability of its facilities.
Another factor that has to be analysed is the presenceof Legionella, which is usually present in cooling towers and
hydrological networks and in the production equipment ofdomestic hot water, mainly in accumulation stores where thestratification conditions boost its proliferation [35]. Inter-ruptions in the water supply may create, in any sectionof the hydrological network, the conditions required forthe bacteria to thrive and thus pollute the water once thesupply is restored. In addition to this, sand and dust containinactive forms of Legionella, which can move through the airand then plant themselves, thus polluting the cooling towercollectors. On one hand, purges in the facilities contributeto a reduction in the risk of this bacteria spreading buton the other hand, the water consumption level greatlyincreases.
An important element of the saving of water has beenseen to be directly linked to the daily management of ahospital [36], in which it is possible to directly control thewater consumption associated with both workers and users.Therefore it is suggested thatworkers increase their awarenessof the importance of saving water through additional trainingand campaigns to optimise the sensitivity surrounding watersaving and the rational use of water. The rain must alsobe used advantageously; it can be collected from the roofand used to irrigate green areas. This is an option, whichwould reduce the consumption of CWHC and consequentlyits environmental impact. The storage of this water, however,is not recommended. Another advisable strategy is to usespecially constructed wells for the watering of green areas.Greywater, which comes from showers and sinks, must notbe reused under any circumstances in this kind of building,as aseptic conditions take priority.
Measures for energy saving in hospital managementshould mainly focus on both domestic hot water savings andthe increase of energy efficiency in production installations,given that such facilities are typically linked to high rates ofenergy consumption. However, efforts should also be madeto account for the exploitation, channelling, and recoveryof water from cooling/condensation towers and for theinstallation of electronic counters to monitor consumptionrates and potential leaks.
The installation of atomizers, specific saving devices tobe screwed in taps and showers, is also recommended. Air isinjected to the water flow so that the speed of the flow streamis increased and the flow rate is thus reduced. Even thoughatomizers apparently increase the flow rate, water savings

8 Journal of Healthcare Engineering
1.00 1.50 2.00 2.50 3.000.500
2
4
6
8
10
12N
umbe
r of h
ospi
tals
(a)40 60 8020
0
2
4
6
8
10
12
Num
ber o
f hos
pita
ls
(b)
0 200 300 4001000
2
4
6
8
10
12
Num
ber o
f hos
pita
ls
(c)
Figure 5: Average consumption in m3 of CWHC for each indicator: (a) built surface area, (b) number of workers, and (c) number of beds.
associated with their use are reported to range between 30%and 50%.
With regard to gardening, savings of around 25–30% canbe achieved by landscape adaptation of the surroundingsthrough xeriscape techniques, by the selection of nativespecies, and by the use of efficient and programmable irri-gation systems.
The use of floor cleaning devices based on microfiberfabric in hospitals is proved to reduce water consumption aswell as decrease the needs for chemicals.
In all cases ISO-14000 and EMAS certifications aresuggested procedures for improved management of hospitalinfrastructures, as can be seen from different ISO-14000studies [37] and EMAS studies [38]. Being in possessionof such certificates implies a greater ability to implementthe improvement of the hospital image and environmental
surroundings. At the same time, environmentally speaking,wastage and how it is discharged cannot be overlooked noromitted.
The information related to the environmental efficiencyof Spanish hospitals registered in EMAS is sufficient butthere are certain deficiencies in the indicators (surface builtarea, number of beds, and number of workers) that make itdifficult to make a comparative evaluation. This is becausethe chosen indicators are not always used with the samecriteria, and consequently they do not quantify the analysedparameter appropriately. In turn, this is likely to be because ofa wrongly chosen indicator. There are studies which indicatesuch deficiencies according to the used indicators, like theEVER study [39].
The results of this research can be useful to quantify theexact cost of water consumption. It could be interesting to
Journal of Healthcare Engineering 9
repeat the same study in different organizations and hospitalsin other countries, in order to establish some comparisons.
The results are extrapolated to similar buildings withlimitations due to the wide variety of healthcare buildingdesigns mainly based on architectural conception, climateconditions, interior facilities, and building locations.
5. Conclusion
It can be concluded that there is a link between the cold waterfor human consumption (CWHC) in hospitals and the builtsurface area of the hospital (𝐴) and the number of beds (NB).However, the number of workers (NW) has no significantstatistical relation to such consumption.
Furthermore, it has been proved that the factors basedon the hospital category depending on number of beds(HCNB), type of management (TM), heating degrees-dayyear (HDDY), and geographic location (GL) have a directrelationship with water consumption. There is no such linkregarding the GDP.
The statistical indicator of the number of workers (NW)is not considered appropriate to be used as a ratio to quantifythe consumption of water. This indicator is the most used inEMAS and it has been proved throughout this study that it isnot consistent enough and it is not adequately quantified.
Nomenclature
𝐴: Value of the built area in a hospital, m2HDDY: Heating degrees-day year, ∘CNB: Total number of beds in a hospitalNW: Number of workers in a hospital𝑇max: Maximum daily temperature, ∘C𝑇min: Minimum daily temperature, ∘CWC: Average annual consumption of CWHC, m3𝑋𝑐: Logical coefficient.
Competing Interests
The authors declare no potential competing interests.
Acknowledgments
The authors wish to express their gratitude to the EU Eco-Management and Audit Scheme for the resources providedthroughout the development of the present work. This studyhas been carried out through the Research Project GR-15057linked to the IV Regional Plan of Research and Investigationfrom the General Government of Extremadura 2015–2017.
References
[1] Fundacion de la Energıa de la Comunidad de Madrid, Guıa deAhorro y Eficiencia Energetica en Hospitales, 2010.
[2] Ambientum, El Portal Profesional del Medio Ambiente, ElConsumo de Agua en Porcentajes, 2005.
[3] Ministry of Agriculture, Food and Environment, Ministry ofAgriculture, Madrid, Spain, 1998.
[4] European Union, “Water performance of buildings,” FinalReport, European Commission, DG Environment, 2012.
[5] P. H. Gleick, D. Haasz, C. Henges-Jeck et al., Waste Not, WantNot: The Potential for Urban Water Conservation in California,Alonzo Printing, Hayward, Calif, USA, 2003.
[6] Best Environmental Practices in the Healthcare Sector, AGuide to Improve your Environmental Performance, Institute forEcopreneurship (IEC), University of Applied Sciences North-wester Switzerland (FHNW), School of Life Sciences (HLS),Sustainable Business Associate (SBA), Royal Scientific Society(RSS), 2006.
[7] F. Daschner, “Substance flow water management-substanceflow relatedwater/sewagewastewatermanagement in Europeanhospitals. Water saving- strategies and strategies for reducingwastewater pollution for water saving potentials and pollutioncontrol of sewage,” Project LIFE99 ENV/D/000455, 1999–2012.
[8] FEMP-Federal Energy Management Program, http://energy.gov/eere/femp/federal-energy-management-program.
[9] The Office of the Reviser of Statutes, State of Minnesota, 2013,https://www.revisor.mn.gov/rules/?id=4715.3600.
[10] Washington State Department of Health, Water System DesignManual, Office of DrinkingWater Constituent Services Section,2009.
[11] The Audit Commission for local authorities and the NationalHealth Service in England andWales, Untapped Savings: WaterServices in the NHS, NHS Occasional Paper no. 5, AuditCommission, 1993.
[12] A. Reller, Greener Hospitals. Improving Environmental Per-formance, Environment Science Center, University Augsburg,Augsburg, Germany, 2003.
[13] M. Dettenkofer, K. Kuemmerer, A. Schuster et al., “Envi-ronmental auditing in hospitals: First results in a UniversityHospital,” Environmental Management, vol. 25, no. 1, pp. 105–113, 2000.
[14] New Found Labrador and Department of Environment andConservation of Canada, Study on Water Quality and Demandon Public Water Supplies with Variable Flow Regimes and WaterDemand, CBLC Limited, Halifax, UK, 2011.
[15] Comision Nacional del Agua, Manual de Agua Potable, Alcan-tarillado y Saneamiento. Datos Basicos, 2007, ftp://ftp.cna.gob.mx/Mapas/libros%20pdf%202007/Alcantarillado%20Pluvial.pdf.
[16] Organizacion Panamericana de la Salud et al., 1999, http://www.paho.org.
[17] K. S. Werner-Verlag, GmbH, Sanitare Haustechnik, Dusseldorf,Germany, 1981.
[18] P. D. Bourkas,Applications of Installations in Hospitals, NationalTechnical University of Athens, Athens, Greece, 1999.
[19] J. S. Katsanis, P. G. Halaris, G. N. Malahias, and P. D. Bourkas,“Estimation of energy consumption in hospitals,” in Proceedingsof the 5th IASTED International Conference ‘Power and EnergySystems’, June 2005.
[20] J. S. Katsanis, P. G. Halaris, P. T. Tsarabaris, G. N. Malahias, andP. D. Bourkas, Estimation of Energy Consumption for DomesticHot Water in Hospitals, Series on Energy and Power Systems,2006.
[21] J. Bujak, “Heat consumption for preparing domestic hot waterin hospitals,” Energy and Buildings, vol. 42, no. 7, pp. 1047–1055,2010.
[22] J. Garcıa Sanz-Calcedo, S. Garrido, and F. Fernandez Tardıo, “Sepuede ahorrar energıa en la gestion del agua en un hospital,” in
10 Journal of Healthcare Engineering
XXVIICongresoNacional de IngenierıaHospitalaria, AsociacionEspanola de Ingenierıa Hospitalaria, Santiago de Compostela,Spain, 2009.
[23] J. Garcıa-Sanz-Calcedo, “Analysis on energy efficiency inhealthcare buildings,” Journal of Healthcare Engineering, vol. 5,no. 3, pp. 361–374, 2014.
[24] European Communities, “Regulation (EC) No 1221/2009 of theEuropean Parliament and of the Council of 25 November 2009on the voluntary participation by organizations in a Com-munity eco-management and audit scheme (EMAS), repeal-ing Regulation (EC) No 761/2001 and Commission Decision2001/681/EC and 2006/193/EC,” Official Journal of EuropeanCommunities, Brussels, 2009.
[25] F. Iraldo, F. Testa, and M. Frey, “Is an environmental manage-ment system able to influence environmental and competitiveperformance? The case of the eco-management and auditscheme (EMAS) in the European union,” Journal of CleanerProduction, vol. 17, no. 16, pp. 1444–1452, 2009.
[26] UK Department of Health, Environment and SustainabilityHealth Technical Memorandum 07-04: Water Management andWater Efficiency—Best Practice Advice for the Healthcare Sector,UK Department of Health, London, UK, 2013.
[27] Water Transformed Sustainable Water Solutions for ClimateChange Adaptation, Identifying & Implementing Water Effi-ciency & Recycling Opportunities by Service Sector Lecture4.2, chapter 4, The Health Sector-Water Savings in Hospitals,Sydney, Australia, 2009.
[28] European Commission, Environment EMAS, http://ec.europa.eu/environment/emas/index en.htm.
[29] J. S. Katsanis, P. T. Tsarabaris, P. D. Bourkas, P. G. Halaris, andG. N. Malahias, “Estimating water and energy consumptionof hospital laundries,” AATCC Review, vol. 8, no. 7, pp. 32–36,2008.
[30] Ministerio de Sanidad, Servicios Sociales e Igualdad de Espana,http://www.msssi.gob.es/estadisticas/microdatos.do.
[31] Schneider Electrics, “Leading techniques for energy savings inhealthcare facilities,” White Paper on Healthcare, 2006, http://static.schneider-electric.us/assets/pdf/healthcare/whitepapers/Leading Techniques WP.pdf.
[32] N. R. Farnumy and J. L. Devore, Applied Statistics for Engineersand Scientists, Duxbury Press, NewYork, NY, USA, 2nd edition,2004.
[33] J. Garcıa-Sanz-Calcedo, F. Lopez-Rodrıguez, and F. Cuadros,“Quantitative analysis on energy efficiency of health centersaccording to their size,” Energy and Buildings, vol. 73, pp. 7–12,2014.
[34] L. Hardy andA. Garrido, Papeles de AguaVirtual no. 6: Analisisy Evaluacion de las relaciones entre el agua y la energıa enEspana: Fundacion Botın, 2010.
[35] J. G. Sanz-Calcedo and P. Monzon-Gonzalez, “Analysis of theeconomic impact of environmental biosafety works projects inhealthcare centres in Extremadura (Spain),” DYNA, vol. 81, no.188, pp. 100–105, 2014.
[36] J. Garcıa Sanz-Calcedo, F. Cuadros Blazquez, F. LopezRodrıguez, and A. Ruiz-Celma, “Influence of the number ofusers on the energy efficiency of health centres,” Energy andBuildings, vol. 43, no. 7, pp. 1544–1548, 2011.
[37] S. X. Zeng, C. M. Tam, V. W. Y. Tam, and Z. M. Deng,“Towards implementation of ISO 14001 environmentalmanage-ment systems in selected industries inChina,” Journal of CleanerProduction, vol. 13, no. 7, pp. 645–656, 2005.
[38] K. Rennings, A. Ziegler, K. Ankele, S. Hoffman, and J. Nill,“The influence of the EU environmental management and auditscheme on environmental innovations and competitivenessin Germany: an analysis on the basis of case studies anda large-scale survey,” ZEW Discussion Papers 03-14, 2003,http://ideas.repec.org/s/zbw/zewdip.html.
[39] EVER Team, EVER: Evaluation of EMAS and Eco-label fortheir Revision. IEFE, Bocconi University IT, Adelphi Consult—DE, IOEW, Office Heidelberg—DE, SPRU, Sussex University-UK, Valor & Tinge A/S—DK. European Commission, DG,Environment, Brussels, 2005.

International Journal of
AerospaceEngineeringHindawi Publishing Corporationhttp://www.hindawi.com Volume 2014
RoboticsJournal of
Hindawi Publishing Corporationhttp://www.hindawi.com Volume 2014
Hindawi Publishing Corporationhttp://www.hindawi.com Volume 2014
Active and Passive Electronic Components
Control Scienceand Engineering
Journal of
Hindawi Publishing Corporationhttp://www.hindawi.com Volume 2014
International Journal of
RotatingMachinery
Hindawi Publishing Corporationhttp://www.hindawi.com Volume 2014
Hindawi Publishing Corporation http://www.hindawi.com
Journal ofEngineeringVolume 2014
Submit your manuscripts athttp://www.hindawi.com
VLSI Design
Hindawi Publishing Corporationhttp://www.hindawi.com Volume 2014
Hindawi Publishing Corporationhttp://www.hindawi.com Volume 2014
Shock and Vibration
Hindawi Publishing Corporationhttp://www.hindawi.com Volume 2014
Civil EngineeringAdvances in
Acoustics and VibrationAdvances in
Hindawi Publishing Corporationhttp://www.hindawi.com Volume 2014
Hindawi Publishing Corporationhttp://www.hindawi.com Volume 2014
Electrical and Computer Engineering
Journal of
Advances inOptoElectronics
Hindawi Publishing Corporation http://www.hindawi.com
Volume 2014
The Scientific World JournalHindawi Publishing Corporation http://www.hindawi.com Volume 2014
SensorsJournal of
Hindawi Publishing Corporationhttp://www.hindawi.com Volume 2014
Modelling & Simulation in EngineeringHindawi Publishing Corporation http://www.hindawi.com Volume 2014
Hindawi Publishing Corporationhttp://www.hindawi.com Volume 2014
Chemical EngineeringInternational Journal of Antennas and
Propagation
International Journal of
Hindawi Publishing Corporationhttp://www.hindawi.com Volume 2014
Hindawi Publishing Corporationhttp://www.hindawi.com Volume 2014
Navigation and Observation
International Journal of
Hindawi Publishing Corporationhttp://www.hindawi.com Volume 2014
DistributedSensor Networks
International Journal of