research article a morphological approach for vessel
TRANSCRIPT

Delivered by Ingenta to:Guest User
IP : 137.194.133.115Tue, 27 Sep 2011 15:03:15
Copyright © 2011 American Scientific PublishersAll rights reservedPrinted in the United States of America
R E S E A R CH AR T I C L E
Journal of Medical Imaging andHealth Informatics
Vol. 1, 42–49, 2011
A Morphological Approach for VesselSegmentation in Eye Fundus Images,
with Quantitative EvaluationFlorence Rossant2�∗, Maddalena Badellino1, Alexandre Chavillon2,
Isabelle Bloch1, and Michel Paques3
1Telecom ParisTech, CNRS LTCI, Paris 75013, France2Institut Supérieur d’Electronique de Paris (ISEP), Paris 75006, France
3CIC 503 du CHNO des 1520, INSERM & Direction de l’Hospitalisation et des Soins, Paris 75011, France
In this paper, we propose a method based on morphological and topological analysis for the segmentation ofvessels in eye fundus images. This is a very important problem, in particular for the quantitative assessmentof microvascular damage due to arterial hypertension, diabetes and aging, such as branch retinal vein occlu-sions. This paper addresses the segmentation step required for such studies. A pre-processing step includes amorphological filtering to enhance the vessels. Attribute images are then built from a combination of a top-hattransform (i.e., a non linear operation) with linear filters at two different scales, leading to complementary infor-mation. Linear structure extraction is then performed using path-opening filters. The final segmentation relies ona fusion step and automatic thresholding. From this segmentation, a graph representation is then extracted, suit-able for further quantitative analysis. The method has been evaluated on a large database of images, and goodresults have been obtained, in particular in terms of accuracy (average of 94.33% over the whole database, witha standard deviation of 0.61) and specificity (average of 97.88% over the whole database, with a standard devi-ation of 0.57). These results compare favorably to the ones obtained by other methods on the same database.The proposed approach can therefore be further exploited for temporal analysis of retinal diseases.
Keywords: Eye Fundus Images, Vessel Segmentation, Mathematical Morphology.
1. INTRODUCTIONIn the last years, retinal image analysis became a popularresearch field, three main factors explaining this trend:1. retina is the only location where blood vessels can be visual-ized non-invasively in vivo;2. retinal images can be produced and distributed with low timeand financial costs;3. retinal vessels are strong indicators for the presence of fre-quent diseases, such as diabetic retinopathy, retinal vessel occlu-sion, arterial hypertension.
Moreover, in the context of clinical research, methods for auto-matically analyzing retinal images have a high relevance sincethey offer the potential to examine a large number of images withtime and cost savings and offer more objective measurementsthan current observer-driven techniques.
Aging leads to increased thickness of the wall of large(atherosclerosis) and/or of small arteries (arteriolosclerosis).While the consequences of the latter on transversal geometry
∗Author to whom correspondence should be addressed.
(e.g., focal or generalized reduction of lumen, arteriovenous nick-ing) has been the subject of many investigations, its consequenceson longitudinal geometry (e.g., vessel length) are poorly known.It is likely that increased thickness of the arterial wall willincrease its length and subsequently its tortuosity. Thus, analysisof age-related changes in retinal vascular anatomy may providecues about vascular aging, a major cause of diseases of the brainand heart. Furthermore, such age-related changes in arterial path-ways may participate to a retinal disease called branch retinalvein occlusions (BRVO) due to the geometrical constraints atarteriovenous crossings, that is, local compression of a vein by abypassing arteriole.
In order to better understand normal and pathological aging ofretinal vessels, the Clinical Investigation Center of the Quinze-Vingts hospital in Paris needs dedicated image processing tools,allowing the automatic analysis of eye fundus images and espe-cially the detection of small variations of the geometry of vessels.Our ultimate goal is to quantify the changes in the geometry ofretinal vessels over time in the same subject. In this paper wepropose, as a first step towards this aim, a method for extractingthe vascular tree and then detect the characteristic points of this
42 J. Med. Imaging Health Inf. Vol. 1, No. 1, 2011 2156-7018/2011/1/042/008 doi:10.1166/jmihi.2011.1006

Delivered by Ingenta to:Guest User
IP : 137.194.133.115Tue, 27 Sep 2011 15:03:15
R E S E A R CH AR T I C L EJ. Med. Imaging Health Inf. 1, 42–49, 2011
structure (intersection and bifurcation points), based on morpho-logical and topological analysis of the data, and which overcomesome of the limitations of existing methods. A discussion on thestate of the art highlighting these limitations is given in Section 2.
The proposed segmentation is detailed in Section 3, adaptingand extending the approach developed in Refs. [35, 36]. Thevascular tree construction and key points identification are alsopresented in this section. The segmentation method has beenevaluated on a large database of images, and results are sum-marized in Section 4. A discussion and concluding remarks arefinally provided in Section 5.
2. RELATED WORKA number of algorithms have been presented in the literaturesince the last two decades for the segmentation of retinal bloodvessels. Many of them are based on the assumption that theintensity profile of the vessels is Gaussian-like. Thus, direc-tional Gaussian filters,5�6�14�22 as well as their first or secondorder derivatives,8�10�22�34�36 have been widely applied in orderto enhance the blood vessels.
Many other filters have been proposed for highlighting the ves-sels: morphological filters with linear structuring elements,35�36
modified top-hat,21 tramline algorithms,2�17 line detectors,23
wavelets.28 In Refs. [19, 29], the maximum curvature of the ves-sels is found by computing the eigenvalues of the Hessian matrix,with the aim of finding the vessel ridges. Recently, Lam pro-posed three concavity measures extracted from two regularizedimages, allowing a better discrimination between vessels and reti-nal lesions.16
One key-point is the choice of the matched filter parameters.For example, many authors choose a fixed standard deviationvalue for the Gaussian model (e.g., Refs. [5, 6, 14, 19, 36]),assuming implicitly that the vessel caliber is invariant inside theFOV area, which is obviously not the case, as underlined inRefs. [3, 10, 11, 22]. The same issue occurs with line detec-tors and with morphological approaches: in Ref. [21] for exam-ple, the size of the structuring element defines four analysisscales. Oppositely, wavelets decomposition allows naturally amulti-scale analysis.
The vessel segmentation relies then on a classification step,which can be either non-supervised or supervised. In unsuper-vised approaches, the pixels of the enhanced image are clas-sified as vessel or non-vessel, by comparing their intensitylevel to a threshold. This one can be set for the whole image(e.g., Refs. [5, 6]), calculated locally3 for dealing with the inten-sity and contrast variations throughout the FOV area, or evenset according to the filter parameters.10�34 Sometimes, severalenhanced images are combined, using a probabilistic16 or afuzzy32 formalism to achieve the fusion. Due to the difficulty ofclassifying each pixel without any structural information, Hooverproposed an iterative process, called threshold probing, in whichthe threshold value used in a region growing process is opti-mized, based on tests realized on the detected vessel region.14
Mendonca combined region growing with binary masks obtainedby morphological operations at four different scales.21 A gen-eral framework for “intelligent” thresholding was also proposedby Jiang, and applied on the brute retinal images: the image isprobed with a number of thresholds, and, for each one, the binaryextracted regions are classified so that only those having vessel-like features are retained.15
In order to improve the segmentation accuracy, super-vised classification schemes have been developed, based onknn-classifiers,22�29 neural networks,27 SVM23 or Bayesianclassifier.28 Again, the feature vector, calculated for each pixel,contains intensity values extracted from the vessel enhanc-ing step,22�23�27�28 or higher-level knowledge provided by thesub-region including the pixel.29 The supervised-classificationapproaches reach better accuracy than the unsupervised ones.28
However, the learning stage requires many manual segmenta-tions, which are long and tedious to realize and have to be redonewhen dealing with another kind of retina database.
Tracking procedures (e.g., Refs. [2, 4, 7–9, 11, 31]) are alsoworth mentioning. They range from simple contour trackingunder parallelism constraints7�9 to more sophisticated approachesrelying on vessel profile models. For example, Al-diri used amodel derived from the ROT active contour,2 Chutatape proposeda Kalman filter incorporating information about vessel width anddirection.8 The main advantages of tracking procedures are, first,that the computational cost is reduced,4 since only a part of theimage is explored, and, second, that the method leads to a con-nected vascular network. However, the tracking is always realizedbased on local properties and bifurcation points are difficult tohandle. So there is a real risk of error. Especially, if the trackingstops prematurely, an important part of the vessel tree may bedefinitely lost.
Finally, advanced active contour models, with energy termsintegrating parallelism constraints, have been proposed.1 How-ever, this approach requires additional steps to detect bifurcationand crossing area. This problem is avoided in Ref. [20] since theACID framework allows a powerful snake re-parameterization,so that complex structures and topology changes can be handled.But this time, the model may be insufficiently robust, since itdoes not make use of a priori knowledge.
Based on our literature review, morphological approaches com-bined with curvature estimation seemed very interesting to us,since they combine structural information, related to the curvi-linear shape of the vessel, with intensity profile model, revealedby the Laplacian operator. Moreover, a non-supervised method isabsolutely required since we have to process images acquired bydifferent devices, which would lead us to repeat tedious learningprocedures. So, our aim is to adapt and extend the method pro-posed in Refs. [35, 36], with the specific objective of detectingaccurately the main vessels (the small ones are not important inour clinical context) and improve the connectivity of the obtainedvascular tree.
3. METHOD: VESSEL SEGMENTATIONFigure 1 depicts the flowchart of the proposed segmentationmethod. From the original color images of the eye fundus, thegreen channel is first extracted, resized and denoised. Then, thepreprocessed image is passed to the analysis process, consistingof two main stages:• Filtering, allowing highlighting the vessel features and extract-ing two attribute images, in which the vessels appear morecontrasted.• Path-opening, applied to each attribute image so that the mainelongated features are preserved whereas the other ones aresuppressed.
43

Delivered by Ingenta to:Guest User
IP : 137.194.133.115Tue, 27 Sep 2011 15:03:15
R E S E A R CH AR T I C L E J. Med. Imaging Health Inf. 1, 42–49, 2011
Fig. 1. Flowchart of the proposed segmentation method.
• Finally, the two resulting images are binarized and fused, toprovide the final segmentation image where vessel pixels arelabeled ‘1’ and background pixels ‘0’.
3.1. PreprocessingAs the blood vessels appear more contrasted in the green bandthan in the red or blue ones, only the green channel will beprocessed. The user is then invited to define the diameter dmax
of the thickest vessel, simply by clicking with the mouse ontwo border pixels. This interactive stage is not very coercive andwell accepted by medical experts, and permits to define moreaccurately the operators used thereafter, this maximal diameterdmax serving as a reference value. Moreover, it can be easilybypassed by just using a standard value. A typical value of dmax
is 7 pixels for an eye fundus image of 512 rows.The image is then preprocessed. A Gaussian filter followed by
an opening of size 1 is applied, in order to eliminate the noise andsmall “walls” that may disconnect the vascular tree35 (Fig. 2).
(a)
(b)
Fig. 2. Original image and preprocessed green channel (image g�.
On the resulting image, denoted by g, a toggle mapping filter isthen applied.26�35 This filter is based on the comparison betweenthe input image g and its opening � and closing � (see Ref. [25]for the definitions and properties of the morphological operators):
h�x�= �TM�g���x�
={�B1
�g��x� if �B1�g��x�−g�x�≤ g�x�−�B2
�g��x�
�B2�g��x� if �B1
�g��x�−g�x� > g�x�−�B2�g��x�
(1)
where �B and �B denote the opening and the closing with astructuring element B, respectively.
In our application, the structuring element B1 is a disk whoseradius is chosen so that most vessels are completely suppressedin the closing image (Fig. 3). Therefore, the grey-level value g�x�of a vessel pixel x is closer to the opening than to the closing,and so it will be darkened, whereas a background pixel will takethe value of the closing. Thus, the contrast of the blood vessels
(a)
(b)
Fig. 3. (a) Closing �B1�g� with a disk of size 4. (b) Opening �B2 �g� with a
disk of size 3.
44

Delivered by Ingenta to:Guest User
IP : 137.194.133.115Tue, 27 Sep 2011 15:03:15
R E S E A R CH AR T I C L EJ. Med. Imaging Health Inf. 1, 42–49, 2011
is increased, as explained in Ref. [35]. Especially, some of thebright areas that can be observed in the middle of the thickestarteries are filled. In our experiments we used a disk of size 4for B1 and a disk of size 3 for B2 (the same values have beenused for all processed cases).
3.2. Attribute ExtractionRetinal blood vessels appear as elongated connected structureshaving approximately a Gaussian profile.36 Morphological oper-ations and adapted filtering are applied on the inverted image(Fig. 4) in order to highlight these features.
The top-hat morphological operator is defined as the differencebetween the original image h and its opening.25 By choosing asstructuring element a disk whose diameter is slightly larger thandmax, all bright features smaller than dmax will be suppressed bythe opening while larger features will remain almost unchanged.Thus, the top-hat operation will set to zero the background areas,while the vessels will be enhanced, as shown in Figure 5.
The obtained image att0 is well contrasted but noisy. Indeed,other small features, smaller than the structuring element, havealso been highlighted.
One characteristic of the vessels is their Gaussian-like profile,whose curvature is locally stable along the crest line. Zana andKlein demonstrated in Ref. [36] that the sign of the curvaturecan be approximated by the sign of the Laplacian. Thus, theyproposed to convolve the image with a Gaussian filter and thento compute the Laplacian. The main issue is the choice of thestandard deviation of the Gaussian filter, which should be setaccording to the size of the vessels (matched filter). Most authorschoose a single fixed value although all ranges of diameters arepossible, from dmax pixels (main vessel near the optical disk) to1 or two pixels (small capillaries). For this reason, we propose,as an original feature of the method, to process the top-hat imageat two different resolutions, by convolving it with the negativeof two different Laplacian of Gaussian kernels, k1 and k2, whosestandard deviations are set as follows:
atti = att0 ∗ki� i = 1�2 with �1 = dmax/6��2 = dmax/3 (2)
The negative values of the results are then set to zero. Figure 6shows the obtained attribute images. Non-vessel structures areattenuated in both images. With the largest standard deviation(att2�, the main veins and arteries are very well detected, with-out holes and with regular contours. Nevertheless, disconnections
Fig. 4. Input image h of the attribute extraction process.
Fig. 5. Top-hat image att0.
at bifurcation or crossing areas can be observed and capillariesare not precisely extracted. On the contrary, with the smalleststandard deviation (att1� the capillaries are better highlighted andimportant connections are better preserved. Thus, both attributeimages complement each other. The next step aims at improvingthese results by extracting the main elongated features.
3.3. Linear Structure Extraction Based onPath-Opening Filters
Path-opening is an advanced morphological filter which extendsthe idea of applying openings with straight line segments asstructuring elements, in order to detect elongated features. Ratherthan restricting ourselves to particular directions, we will workwith paths that are given by an adjacency relation on theimage domain, and our structuring element will be paths ofa given length L12�33 This approach is well suited for our
(a)
(b)
Fig. 6. The two attribute images att1 (a) and att2 (b) obtained from thetop-hat image with �1 and �2. The images have been calibrated for a bettervisualization.
45
Delivered by Ingenta to:Guest User
IP : 137.194.133.115Tue, 27 Sep 2011 15:03:15
R E S E A R CH AR T I C L E J. Med. Imaging Health Inf. 1, 42–49, 2011
application, since retinal blood vessels are not completely lin-ear, even locally.32 The path-opening filter32 is applied to bothattribute images, allowing retaining elongated bright structureswhose length is larger than L and removing the others. We useL = 40, which is a good compromise between robustness andcomputation cost. The implementation relies on the fast algo-rithm proposed in Ref. [30]. In the following, we denote by i
the images obtained using this filter on atti (Fig. 7).
3.4. Classification and FusionThe pixels of each processed attribute image i are classifiedinto vessel ‘1’ or background ‘0’, by hysteresis thresholding. Thedifficult aspect of this step is the choice of the low and highthresholds, respectively SL and SH , which have to be automati-cally adapted to each case. For that, we propose to define themwith respect to an “optimal” threshold Sopt, determined via thefollowing ratio:
r �S�= # of connected objects# pixels set to ‘1’
(3)
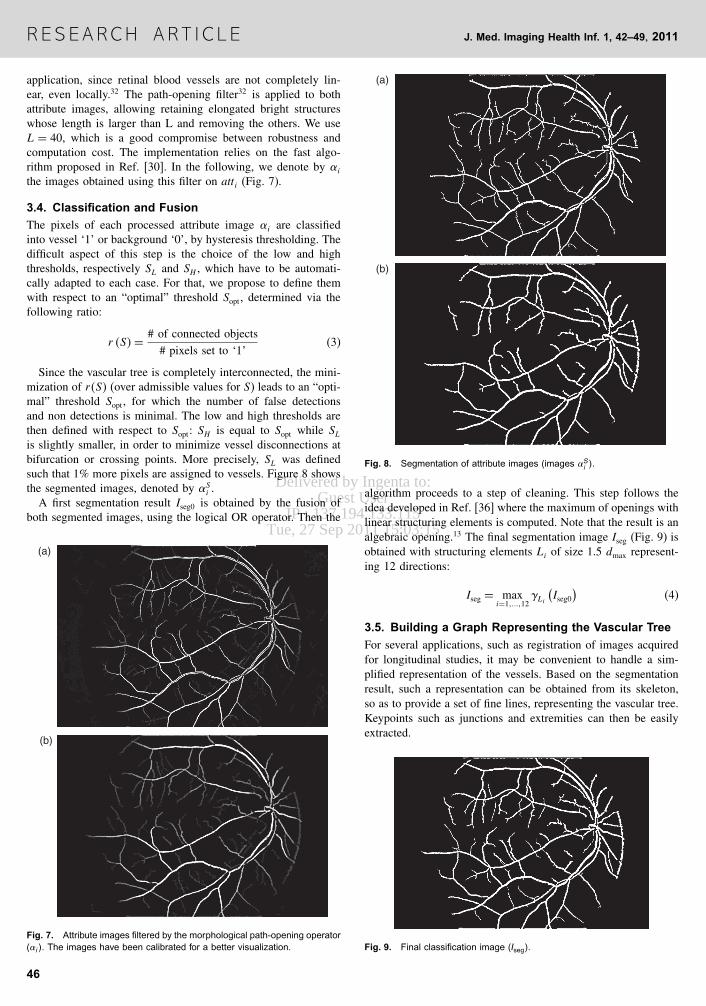
Since the vascular tree is completely interconnected, the mini-mization of r�S� (over admissible values for S) leads to an “opti-mal” threshold Sopt, for which the number of false detectionsand non detections is minimal. The low and high thresholds arethen defined with respect to Sopt: SH is equal to Sopt while SLis slightly smaller, in order to minimize vessel disconnections atbifurcation or crossing points. More precisely, SL was definedsuch that 1% more pixels are assigned to vessels. Figure 8 showsthe segmented images, denoted by S
i .A first segmentation result Iseg0 is obtained by the fusion of
both segmented images, using the logical OR operator. Then the
(a)
(b)
Fig. 7. Attribute images filtered by the morphological path-opening operator(�i �. The images have been calibrated for a better visualization.
(a)
(b)
Fig. 8. Segmentation of attribute images (images �Si �.
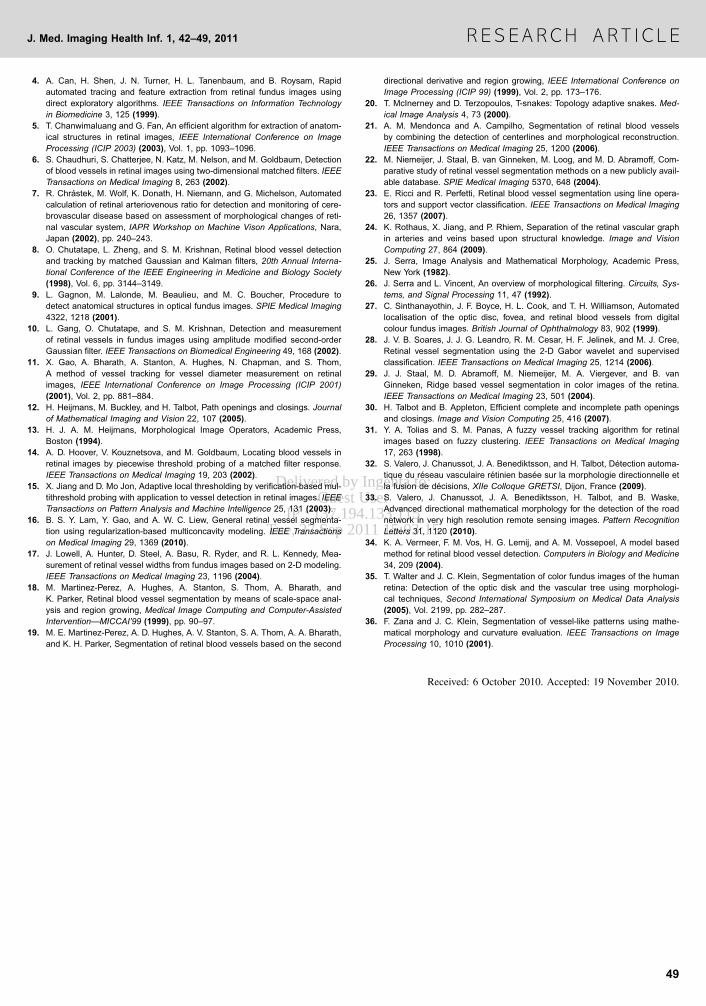
algorithm proceeds to a step of cleaning. This step follows theidea developed in Ref. [36] where the maximum of openings withlinear structuring elements is computed. Note that the result is analgebraic opening.13 The final segmentation image Iseg (Fig. 9) isobtained with structuring elements Li of size 1.5 dmax represent-ing 12 directions:
Iseg = maxi=1��12
�Li
(Iseg0
)(4)
3.5. Building a Graph Representing the Vascular TreeFor several applications, such as registration of images acquiredfor longitudinal studies, it may be convenient to handle a sim-plified representation of the vessels. Based on the segmentationresult, such a representation can be obtained from its skeleton,so as to provide a set of fine lines, representing the vascular tree.Keypoints such as junctions and extremities can then be easilyextracted.
Fig. 9. Final classification image (Iseg).
46

Delivered by Ingenta to:Guest User
IP : 137.194.133.115Tue, 27 Sep 2011 15:03:15
R E S E A R CH AR T I C L EJ. Med. Imaging Health Inf. 1, 42–49, 2011
Fig. 10. Skeleton of the segmented vessels, and detection of extremities(red) and junction points (green).
The skeleton is first computed on the segmented imageIseg. A thinning-based skeleton is used, so as to preserve thetopology.25 Since the best connected result is obtained from thebinarized top-hat S
0 (att0 processed as att1 and att2, according toSections 3.3 and 3.4), the skeleton is also applied to this image,and segments that were not detected in Iseg are added to the firstskeleton if they are connected to it. This allows us on the one handto obtain a topologically correct skeleton, and on the other handto have a representation of as many vessel branches as possible.
Topological characteristics of the skeleton points allow us toclassify them and to detect end-points (or extremities), and junc-tion points (or bifurcations and crossing points). An extremityhas only one skeleton point in its neighborhood, while a junctionpoint has at least three.
An example of result is displayed in Figure 10 and illustratesthe final skeleton (after fusion of the branches under connectivityconstraint), and the detection of key-points.
The detection of end-points allows in a next step restoring fur-ther the connectivity that may be lost during the segmentation.Candidates for reconnection are selected among the end-pointsbased on their distance (here a maximum distance of 10 pix-els is used) and the grey levels along the segment joining theend-points. The segment between two end-points with a maximalaverage grey level (in the original image) along the segment isselected. A result is illustrated in Figure 11, showing the betterconnectivity obtained after this post-processing step.
Finally, a high-level description of the vascular tree is derived,as a graph, where vertices correspond to the specific points of
(a)
(b)
Fig. 11. (a) A subregion of the skeleton of the segmented vessels. (b) Thesame region after the reconnection procedure.
Table I. Accuracy results for existing methods.
Method Accuracy Source Type of method
2nb observer 0.9473 Staal (2004)29 ManualChaudhuri et al.6 0.8773 Niemeijer (2004)22 UnsupervisedZana et al.36 0.9377 Niemeijer (2004)22 UnsupervisedJiang et al.15 0.8911 Staal (2004)29 UnsupervisedRossant et al. 0.9433 This paper UnsupervisedMendonca green 0.9452 Mendonca (2006)21 Unsupervisedchannel21
Line detector23 0.9563 Ricci (2007)23 UnsupervisedMartinez-Perez et al.18 0.9181 Niemeijer (2004)22 UnsupervisedMatched filter knn 0.9416 Niemeijer (2004)22 Supervised(Niemeijer 04)22
PBM (Staal 2004)29 0.9441 Staal (2004)29 SupervisedRicci (2007)23 0.9595 Ricci (2007)23 SupervisedSoares (2006)28 0.9466 Soares (2006)28 Supervised
interest, and edges correspond to either vessels or arteries. Thisstructure can then be used in an approach like the one proposedin Ref. [24] Attributes can also be computed, such as vesselthickness and tortuosity, and position of crossings.
4. RESULTS: SEGMENTATION EVALUATIONThe proposed method has been tested on the DRIVE (DigitalRetinal Images for Vessel Extraction) database,a which contains40 color eye fundus images (with 7 showing a pathology),acquired using a Canon CR5 non-mydriatic 3CCD camera with a45 degrees field of view (FOV).29 The photographs were obtainedfrom a diabetic retinopathy screening program in The Nether-lands. Images have been anonymized. Each image is capturedusing 8 bits per color plane and has a size of 768× 584 pixels.The FOV of each image is circular with a diameter of approxi-mately 540 pixels. Manual segmentations are available and havebeen performed by three observers.29 The database is decom-posed in a training set of 20 images and a test set of 20 images.
The proposed method was evaluated by comparing theobtained results to the manual segmentations, using classicalmeasures of accuracy, sensitivity and specificity. Considering thetwenty images of the test database, the obtained average mea-sures are as follows: accuracy= 94.33% (with a standard devia-tion of 0.61), sensitivity= 70.31% (with a standard deviation of4.60), specificity = 97.88% (with a standard deviation of 0.57).These results are very good, in particular in terms of accuracyand specificity. The somewhat less good sensitivity values aredue to the fact that the method focuses on the main vesselsonly, while the ground truth includes more vessels. These resultsare among the best reported in the literature for unsupervisedmethods on the same database, with only 1% lower accuracythan the best reported result. Noticeably, they are also within therange of the expert results, considering the inter-expert variability(94.73%).29 Table I provides a comparison with other methods.
An example of segmentation is shown in Figure 12. Theobtained results are visually good and precise. The network iswell connected, even better than reported results on this database,and this is an important feature provided by the proposedmethod.
ahttp://www.isi.uu.nl/Research/Databases/DRIVE.
47

Delivered by Ingenta to:Guest User
IP : 137.194.133.115Tue, 27 Sep 2011 15:03:15
R E S E A R CH AR T I C L E J. Med. Imaging Health Inf. 1, 42–49, 2011
(a) (b)
(c)
Fig. 12. (a) Manual segmentation. (b) Automated result. (c) Comparison: common parts in white, differences in red (parts from the manual segmentationmissed in our result) and green (over-segmentation).
5. DISCUSSION AND CONCLUSIONIn this paper we proposed an automated method for segment-ing the vascular network in eye fundus images. The methodimproved existing work in particular by making use of two dif-ferent sets of parameters and combining the results. This allowsovercoming several drawbacks of usual methods requiring tomake a compromise between connectivity of the vessels and falsedetections.
Results have been evaluated on a large database includingpathological cases. A very good specificity is obtained, and thelower value of sensitivity is due to very narrow vessel extremitieswhich are not taken into account in the proposed approach. Thisis the main difference with the manual segmentations. Overall,the results remain in the range of the expert segmentations, giventheir variability. Another important result is that the connectivityof the vessel network is well preserved by the proposed approach,and this is also an improvement over existing methods.
A structured representation is then derived, as an attributedgraph, which will be the basis for further analysis. This graphis built from a topologically correct skeleton of the resultingsegmentation and from the detection of junction points. These
topological features can be correctly extracted thanks to thestrong connectivity properties of the segmentation result.
Future work aims at exploiting these results for differentiatingbetween veins and arteries, for registering images acquired at dif-ferent dates, finding corresponding points in successive images,and for longitudinal follow-up. This will allow us to quantifyand model changes over time, in particular changes of tortuos-ity and shifting of arteriovenous crossings. Correlation to thedegree of arteriolosclerosis using gold standards (arteriovenousnicking, arteriovenous ratio, presence of retinopathy) will thenbe possible.
References and Notes1. B. Al-Diri and A. Hunter, A ribbon of twins for extracting vessel bound-
aries, European Medical and Biological Engineering Conference (EMBEC’05)(2005), pp. 1727–1983.
2. B. Al-Diri, A. Hunter, and D. Steel, An active contour model for segmenting andmeasuring retinal vessels. IEEE Transactions on Medical Imaging 28, 1488(2009).
3. W. Cai and A. Chung, Multi-resolution vessel segmentation using normal-ized cuts in retinal images, Medical Image Computing and Computer-AssistedIntervention—MICCAI 2006, Copenhagen, Danemark (2006), pp. 928–936.
48
Delivered by Ingenta to:Guest User
IP : 137.194.133.115Tue, 27 Sep 2011 15:03:15
R E S E A R CH AR T I C L EJ. Med. Imaging Health Inf. 1, 42–49, 2011
4. A. Can, H. Shen, J. N. Turner, H. L. Tanenbaum, and B. Roysam, Rapidautomated tracing and feature extraction from retinal fundus images usingdirect exploratory algorithms. IEEE Transactions on Information Technologyin Biomedicine 3, 125 (1999).
5. T. Chanwimaluang and G. Fan, An efficient algorithm for extraction of anatom-ical structures in retinal images, IEEE International Conference on ImageProcessing (ICIP 2003) (2003), Vol. 1, pp. 1093–1096.
6. S. Chaudhuri, S. Chatterjee, N. Katz, M. Nelson, and M. Goldbaum, Detectionof blood vessels in retinal images using two-dimensional matched filters. IEEETransactions on Medical Imaging 8, 263 (2002).
7. R. Chrástek, M. Wolf, K. Donath, H. Niemann, and G. Michelson, Automatedcalculation of retinal arteriovenous ratio for detection and monitoring of cere-brovascular disease based on assessment of morphological changes of reti-nal vascular system, IAPR Workshop on Machine Vison Applications, Nara,Japan (2002), pp. 240–243.
8. O. Chutatape, L. Zheng, and S. M. Krishnan, Retinal blood vessel detectionand tracking by matched Gaussian and Kalman filters, 20th Annual Interna-tional Conference of the IEEE Engineering in Medicine and Biology Society(1998), Vol. 6, pp. 3144–3149.
9. L. Gagnon, M. Lalonde, M. Beaulieu, and M. C. Boucher, Procedure todetect anatomical structures in optical fundus images. SPIE Medical Imaging4322, 1218 (2001).
10. L. Gang, O. Chutatape, and S. M. Krishnan, Detection and measurementof retinal vessels in fundus images using amplitude modified second-orderGaussian filter. IEEE Transactions on Biomedical Engineering 49, 168 (2002).
11. X. Gao, A. Bharath, A. Stanton, A. Hughes, N. Chapman, and S. Thom,A method of vessel tracking for vessel diameter measurement on retinalimages, IEEE International Conference on Image Processing (ICIP 2001)(2001), Vol. 2, pp. 881–884.
12. H. Heijmans, M. Buckley, and H. Talbot, Path openings and closings. Journalof Mathematical Imaging and Vision 22, 107 (2005).
13. H. J. A. M. Heijmans, Morphological Image Operators, Academic Press,Boston (1994).
14. A. D. Hoover, V. Kouznetsova, and M. Goldbaum, Locating blood vessels inretinal images by piecewise threshold probing of a matched filter response.IEEE Transactions on Medical Imaging 19, 203 (2002).
15. X. Jiang and D. Mo Jon, Adaptive local thresholding by verification-based mul-tithreshold probing with application to vessel detection in retinal images. IEEETransactions on Pattern Analysis and Machine Intelligence 25, 131 (2003).
16. B. S. Y. Lam, Y. Gao, and A. W. C. Liew, General retinal vessel segmenta-tion using regularization-based multiconcavity modeling. IEEE Transactionson Medical Imaging 29, 1369 (2010).
17. J. Lowell, A. Hunter, D. Steel, A. Basu, R. Ryder, and R. L. Kennedy, Mea-surement of retinal vessel widths from fundus images based on 2-D modeling.IEEE Transactions on Medical Imaging 23, 1196 (2004).
18. M. Martinez-Perez, A. Hughes, A. Stanton, S. Thom, A. Bharath, andK. Parker, Retinal blood vessel segmentation by means of scale-space anal-ysis and region growing, Medical Image Computing and Computer-AssistedIntervention—MICCAI’99 (1999), pp. 90–97.
19. M. E. Martinez-Perez, A. D. Hughes, A. V. Stanton, S. A. Thom, A. A. Bharath,and K. H. Parker, Segmentation of retinal blood vessels based on the second
directional derivative and region growing, IEEE International Conference onImage Processing (ICIP 99) (1999), Vol. 2, pp. 173–176.
20. T. McInerney and D. Terzopoulos, T-snakes: Topology adaptive snakes. Med-ical Image Analysis 4, 73 (2000).
21. A. M. Mendonca and A. Campilho, Segmentation of retinal blood vesselsby combining the detection of centerlines and morphological reconstruction.IEEE Transactions on Medical Imaging 25, 1200 (2006).
22. M. Niemeijer, J. Staal, B. van Ginneken, M. Loog, and M. D. Abramoff, Com-parative study of retinal vessel segmentation methods on a new publicly avail-able database. SPIE Medical Imaging 5370, 648 (2004).
23. E. Ricci and R. Perfetti, Retinal blood vessel segmentation using line opera-tors and support vector classification. IEEE Transactions on Medical Imaging26, 1357 (2007).
24. K. Rothaus, X. Jiang, and P. Rhiem, Separation of the retinal vascular graphin arteries and veins based upon structural knowledge. Image and VisionComputing 27, 864 (2009).
25. J. Serra, Image Analysis and Mathematical Morphology, Academic Press,New York (1982).
26. J. Serra and L. Vincent, An overview of morphological filtering. Circuits, Sys-tems, and Signal Processing 11, 47 (1992).
27. C. Sinthanayothin, J. F. Boyce, H. L. Cook, and T. H. Williamson, Automatedlocalisation of the optic disc, fovea, and retinal blood vessels from digitalcolour fundus images. British Journal of Ophthalmology 83, 902 (1999).
28. J. V. B. Soares, J. J. G. Leandro, R. M. Cesar, H. F. Jelinek, and M. J. Cree,Retinal vessel segmentation using the 2-D Gabor wavelet and supervisedclassification. IEEE Transactions on Medical Imaging 25, 1214 (2006).
29. J. J. Staal, M. D. Abramoff, M. Niemeijer, M. A. Viergever, and B. vanGinneken, Ridge based vessel segmentation in color images of the retina.IEEE Transactions on Medical Imaging 23, 501 (2004).
30. H. Talbot and B. Appleton, Efficient complete and incomplete path openingsand closings. Image and Vision Computing 25, 416 (2007).
31. Y. A. Tolias and S. M. Panas, A fuzzy vessel tracking algorithm for retinalimages based on fuzzy clustering. IEEE Transactions on Medical Imaging17, 263 (1998).
32. S. Valero, J. Chanussot, J. A. Benediktsson, and H. Talbot, Détection automa-tique du réseau vasculaire rétinien basée sur la morphologie directionnelle etla fusion de décisions, XIIe Colloque GRETSI, Dijon, France (2009).
33. S. Valero, J. Chanussot, J. A. Benediktsson, H. Talbot, and B. Waske,Advanced directional mathematical morphology for the detection of the roadnetwork in very high resolution remote sensing images. Pattern RecognitionLetters 31, 1120 (2010).
34. K. A. Vermeer, F. M. Vos, H. G. Lemij, and A. M. Vossepoel, A model basedmethod for retinal blood vessel detection. Computers in Biology and Medicine34, 209 (2004).
35. T. Walter and J. C. Klein, Segmentation of color fundus images of the humanretina: Detection of the optic disk and the vascular tree using morphologi-cal techniques, Second International Symposium on Medical Data Analysis(2005), Vol. 2199, pp. 282–287.
36. F. Zana and J. C. Klein, Segmentation of vessel-like patterns using mathe-matical morphology and curvature evaluation. IEEE Transactions on ImageProcessing 10, 1010 (2001).
Received: 6 October 2010. Accepted: 19 November 2010.
49