reputation in the western world - saïd business … · reputation in the western world stories...
TRANSCRIPT
Reputation in the Western World
Stories about the Blood and Soil
of Business
These slides are from from published and unpublished works. All rights are reserved (© Ronald S. Burt 2011). Materials can be
downloaded from http://faculty.chicagobooth.edu/ronald.burt/research.
15-‐17/09/2011
15/04/2011
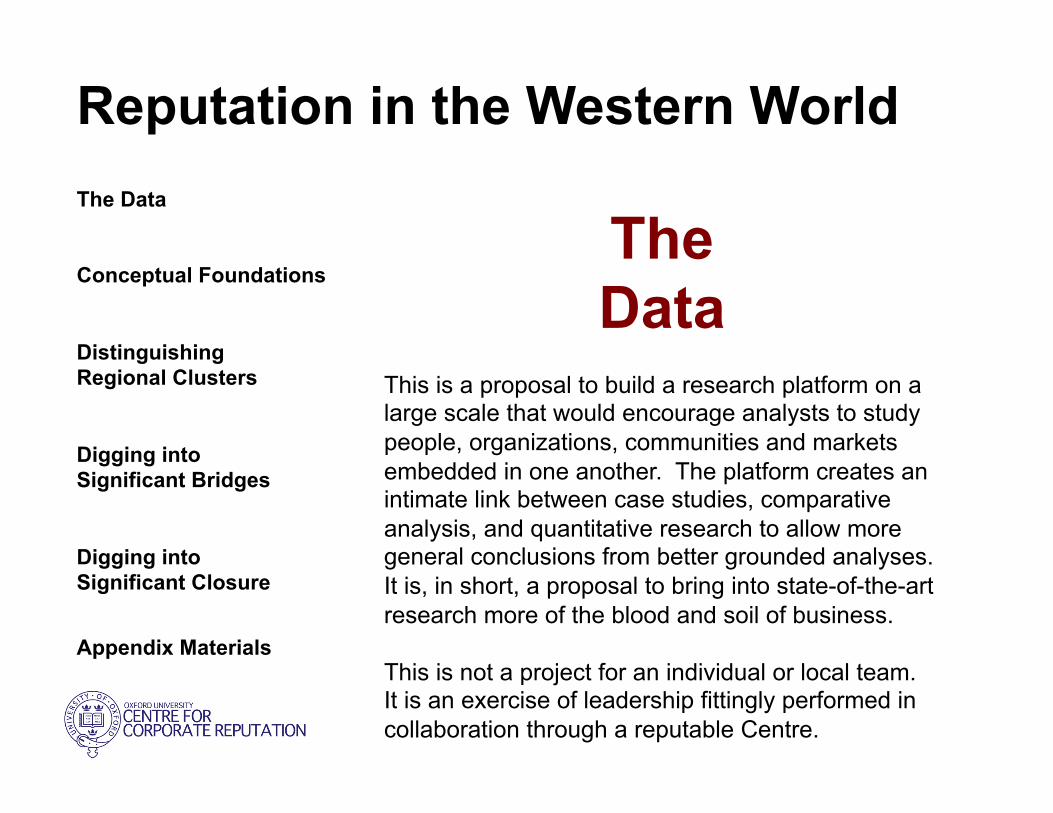
Reputation in the Western World The Data Conceptual Foundations Distinguishing Regional Clusters Digging into Significant Bridges Digging into Significant Closure
Appendix Materials
The Data
This is a proposal to build a research platform on a large scale that would encourage analysts to study people, organizations, communities and markets embedded in one another. The platform creates an intimate link between case studies, comparative analysis, and quantitative research to allow more general conclusions from better grounded analyses. It is, in short, a proposal to bring into state-of-the-art research more of the blood and soil of business. This is not a project for an individual or local team. It is an exercise of leadership fittingly performed in collaboration through a reputable Centre.
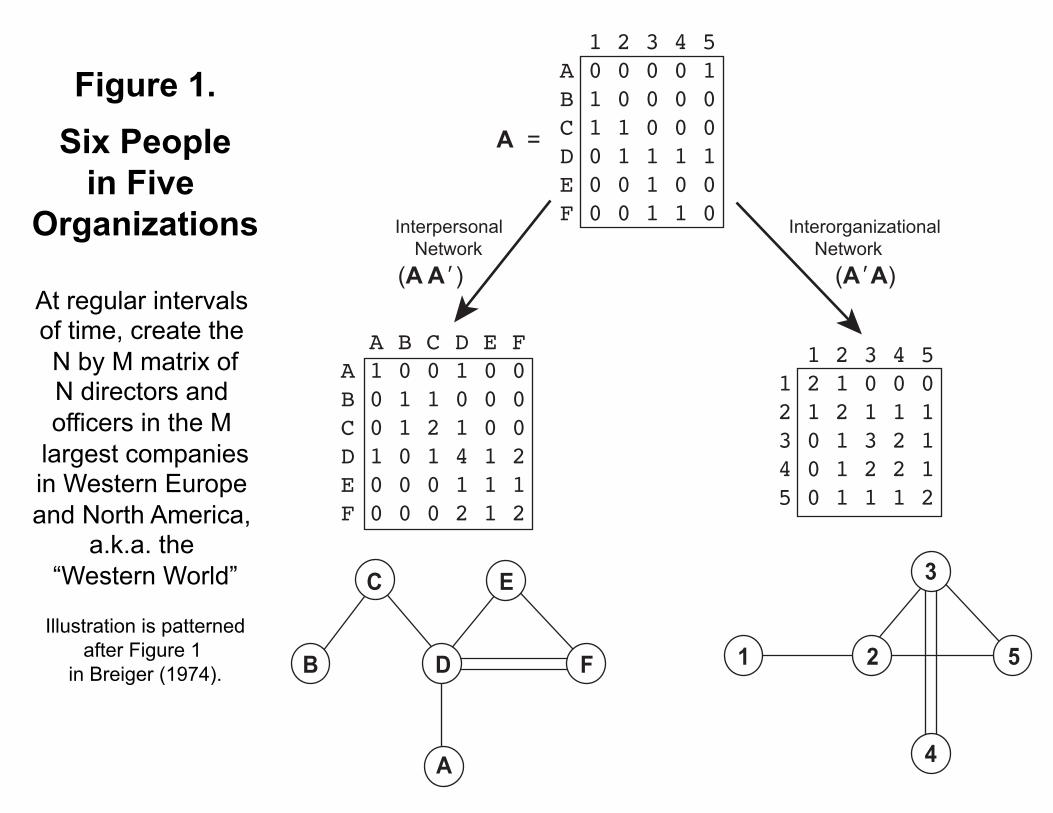
Figure 1. Six People
in Five Organizations
At regular intervals of time, create the N by M matrix of N directors and officers in the M
largest companies in Western Europe and North America,
a.k.a. the “Western World”
Illustration is patterned
after Figure 1 in Breiger (1974).
1 2 3 4 5A 0 0 0 0 1B 1 0 0 0 0C 1 1 0 0 0D 0 1 1 1 1E 0 0 1 0 0F 0 0 1 1 0
1 2 3 4 51 2 1 0 0 02 1 2 1 1 13 0 1 3 2 14 0 1 2 2 15 0 1 1 1 2
A =
A B C D E FA 1 0 0 1 0 0B 0 1 1 0 0 0C 0 1 2 1 0 0D 1 0 1 4 1 2E 0 0 0 1 1 1F 0 0 0 2 1 2
InterpersonalNetwork (A A’)
Interorganizational Network (A’A)
A
C E
B D F 1 2 5
3
4
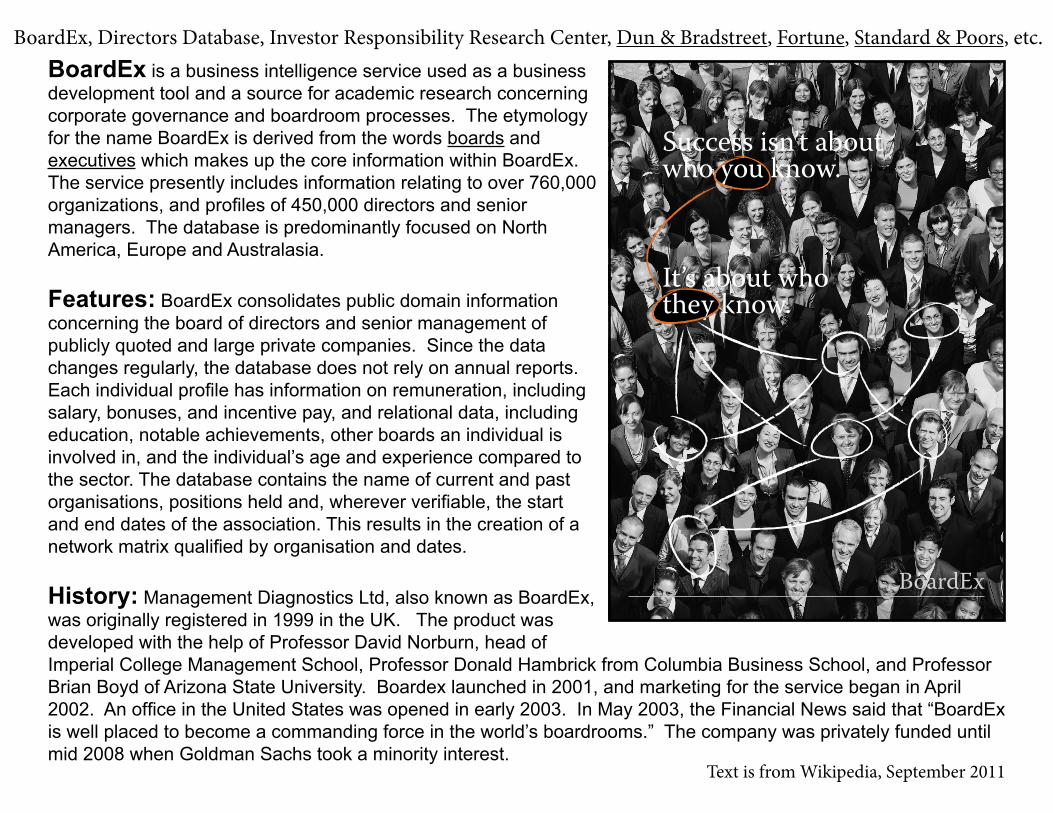
BoardEx is a business intelligence service used as a business development tool and a source for academic research concerning corporate governance and boardroom processes. The etymology for the name BoardEx is derived from the words boards and executives which makes up the core information within BoardEx. The service presently includes information relating to over 760,000 organizations, and profiles of 450,000 directors and senior managers. The database is predominantly focused on North America, Europe and Australasia.
Features: BoardEx consolidates public domain information concerning the board of directors and senior management of publicly quoted and large private companies. Since the data changes regularly, the database does not rely on annual reports. Each individual profile has information on remuneration, including salary, bonuses, and incentive pay, and relational data, including education, notable achievements, other boards an individual is involved in, and the individual’s age and experience compared to the sector. The database contains the name of current and past organisations, positions held and, wherever verifiable, the start and end dates of the association. This results in the creation of a network matrix qualified by organisation and dates.
History: Management Diagnostics Ltd, also known as BoardEx, was originally registered in 1999 in the UK. The product was developed with the help of Professor David Norburn, head of Imperial College Management School, Professor Donald Hambrick from Columbia Business School, and Professor Brian Boyd of Arizona State University. Boardex launched in 2001, and marketing for the service began in April 2002. An office in the United States was opened in early 2003. In May 2003, the Financial News said that “BoardEx is well placed to become a commanding force in the world’s boardrooms.” The company was privately funded until mid 2008 when Goldman Sachs took a minority interest.
Text is from Wikipedia, September 2011
Success isn’t about who you know.
It’s about who they know.
BoardEx
BoardEx, Directors Database, Investor Responsibility Research Center, Dun & Bradstreet, Fortune, Standard & Poors, etc.
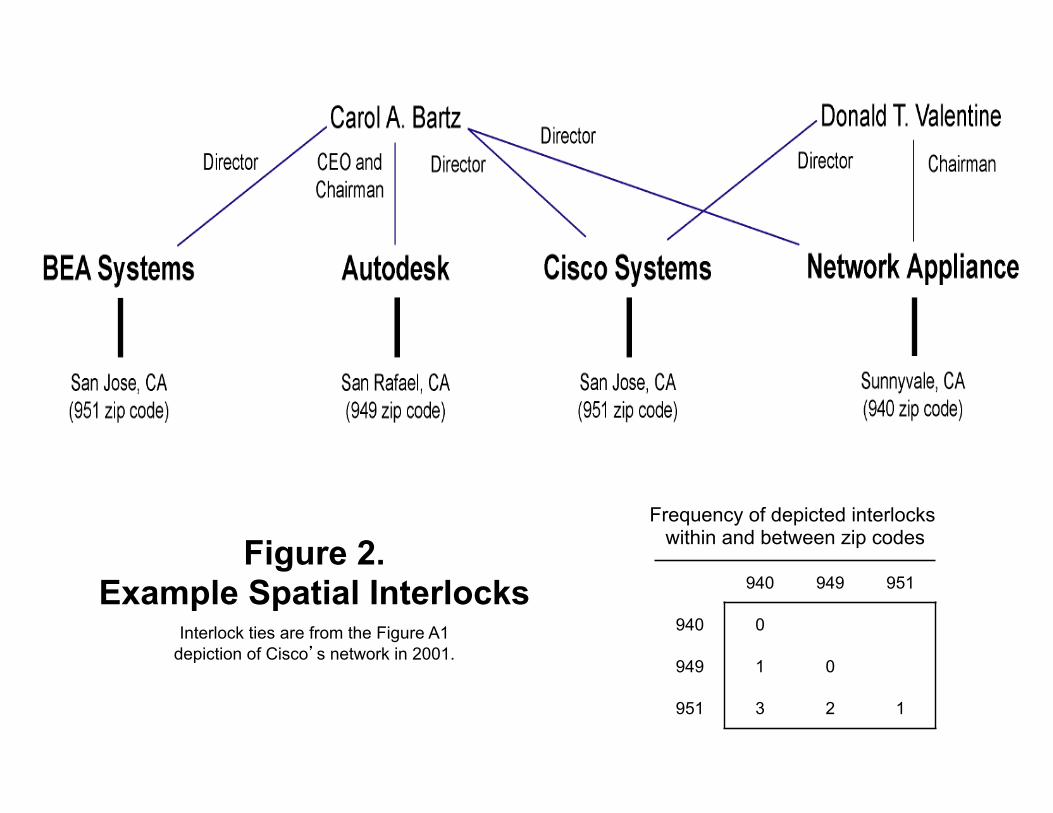
Figure 2. Example Spatial Interlocks
Interlock ties are from the Figure A1 depiction of Cisco’s network in 2001.
940 949 951
940 0
949 1 0
951 3 2 1
Frequency of depicted interlocks within and between zip codes
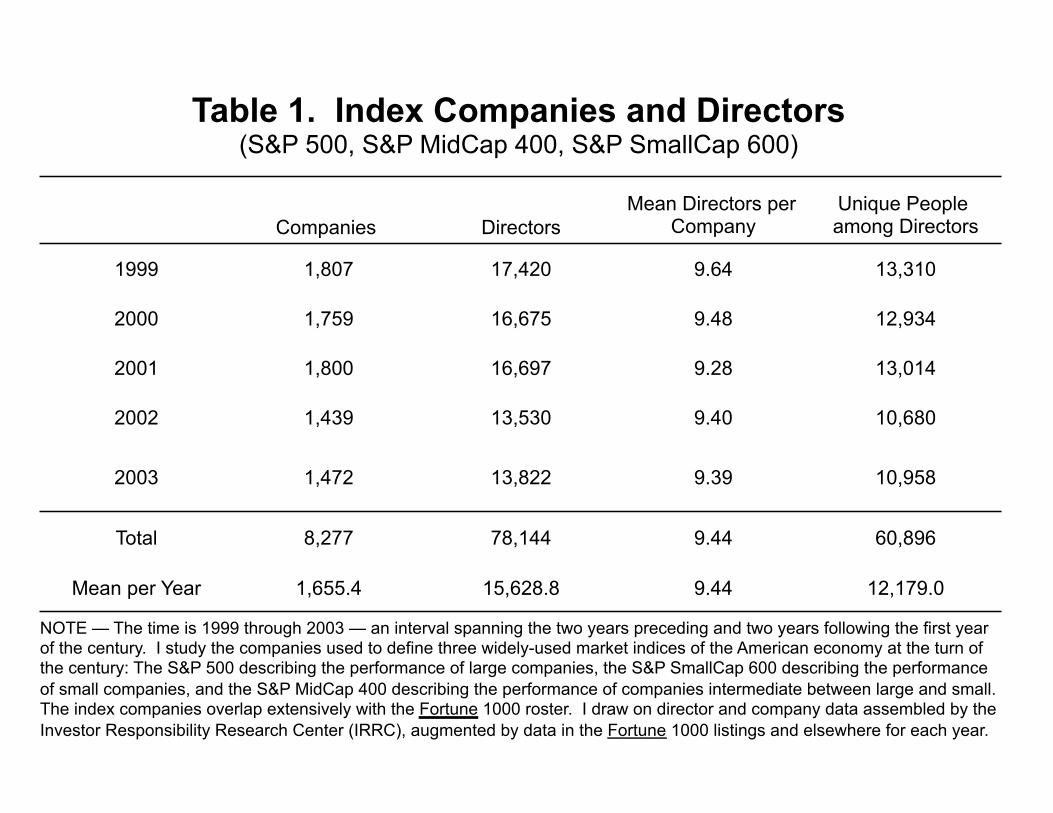
Table 1. Index Companies and Directors (S&P 500, S&P MidCap 400, S&P SmallCap 600)
Companies Directors Mean Directors per
Company Unique People among Directors
1999 1,807 17,420 9.64 13,310
2000 1,759 16,675 9.48 12,934
2001 1,800 16,697 9.28 13,014
2002 1,439 13,530 9.40 10,680
2003 1,472 13,822 9.39 10,958
Total 8,277 78,144 9.44 60,896
Mean per Year 1,655.4 15,628.8 9.44 12,179.0
NOTE — The time is 1999 through 2003 — an interval spanning the two years preceding and two years following the first year of the century. I study the companies used to define three widely-used market indices of the American economy at the turn of the century: The S&P 500 describing the performance of large companies, the S&P SmallCap 600 describing the performance of small companies, and the S&P MidCap 400 describing the performance of companies intermediate between large and small. The index companies overlap extensively with the Fortune 1000 roster. I draw on director and company data assembled by the Investor Responsibility Research Center (IRRC), augmented by data in the Fortune 1000 listings and elsewhere for each year.
15/04/2011
Reputation in the Western World The Data Conceptual Foundations Distinguishing Regional Clusters Digging into Significant Bridges Digging into Significant Closure
Appendix Materials
Conceptual Foundations
Networks Embedded in Networks
Stra
tegi
c Lea
ders
hip
Crea
ting
Valu
e: T
he S
ocial
Cap
ital o
f Bro
kera
ge (p
age 7
)
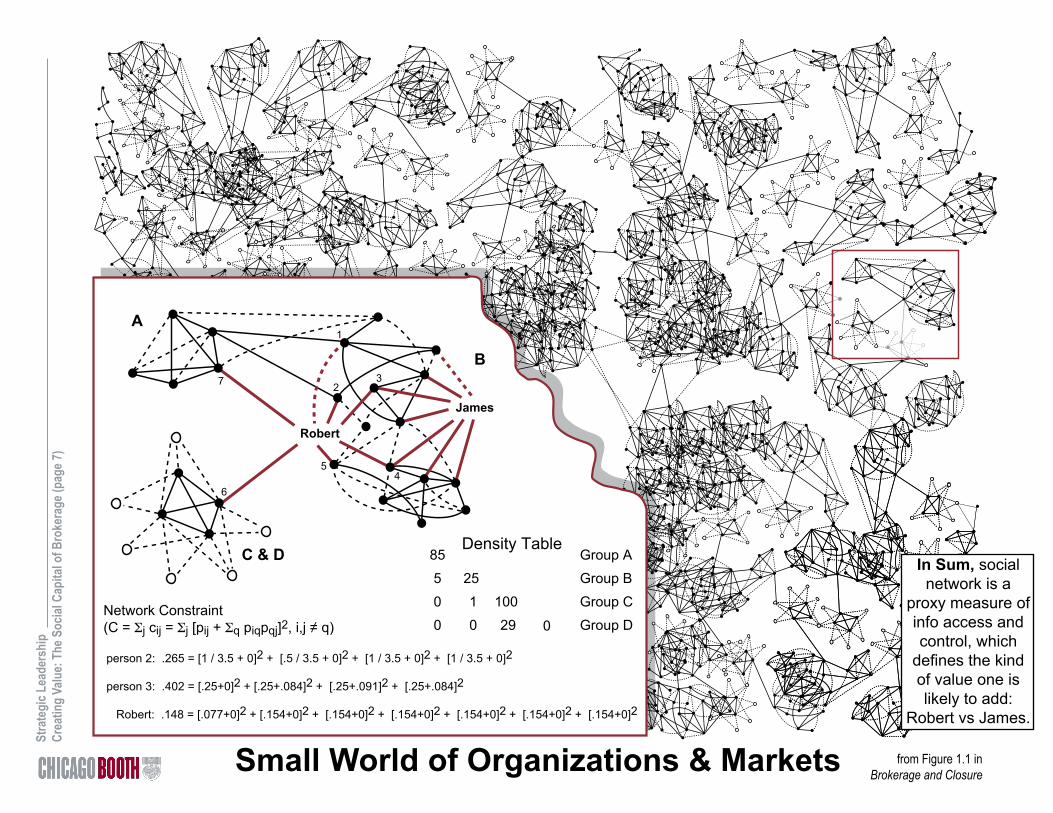
from Figure 1.1 inBrokerage and ClosureSmall World of Organizations & Markets
James
Robert
1
23
54
6
7
A
B
C & D 25
1
0
100
29
Group A
Group B
Group C
Group D
Density Table
0
85
5
0
0Network Constraint(C = Σj cij = Σj [pij + Σq piqpqj]2, i,j ≠ q)
person 2: .265 = [1 / 3.5 + 0]2 + [.5 / 3.5 + 0]2 + [1 / 3.5 + 0]2 + [1 / 3.5 + 0]2
person 3: .402 = [.25+0]2 + [.25+.084]2 + [.25+.091]2 + [.25+.084]2
Robert: .148 = [.077+0]2 + [.154+0]2 + [.154+0]2 + [.154+0]2 + [.154+0]2 + [.154+0]2 + [.154+0]2
In Sum, social network is a
proxy measure of info access and control, which
defines the kind of value one is likely to add:
Robert vs James.
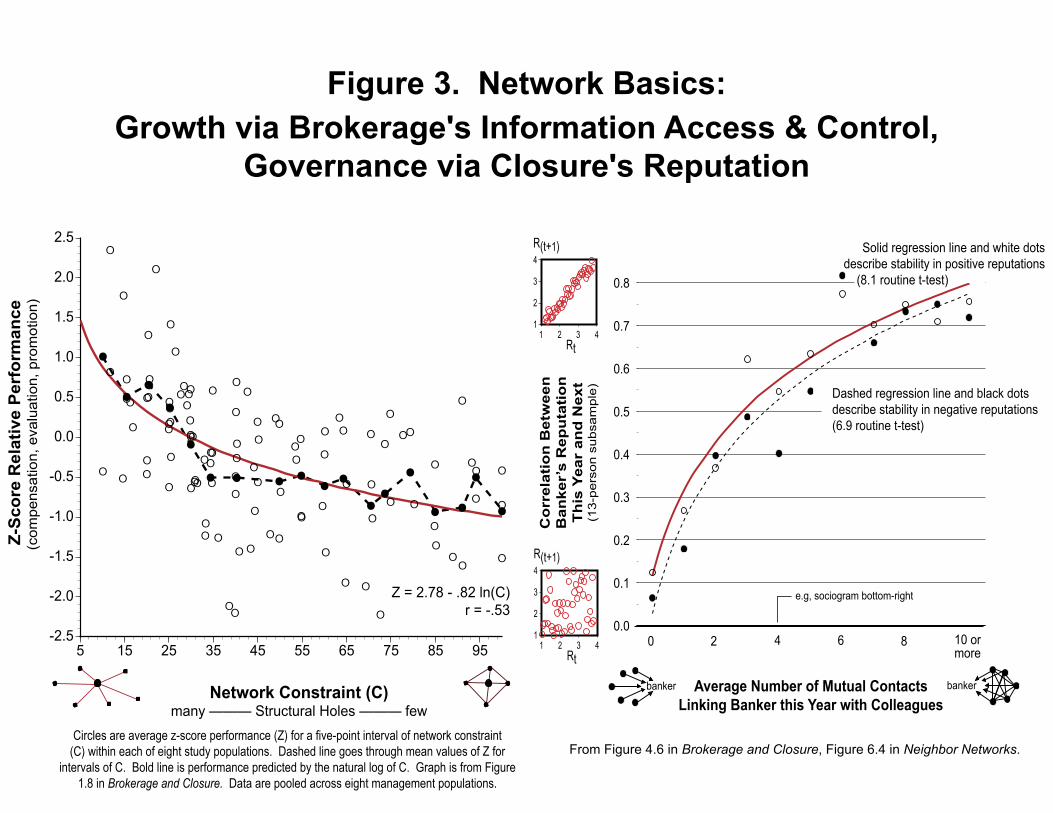
Figure 3. Network Basics:Growth via Brokerage's Information Access & Control,
Governance via Closure's Reputation
E
E
E
E
E
E
E
E
E
E
E
E
E
EEE
E
EE
E
EE
E
E
E
E
EE
EE
E
E
EE
E
E
EEE
E
EE
EE
E
E
E
E
EE
E
E
E
E
E
E
E
E
E
E
E
E
E
E
E
E
E
E
E
EE
E
EEE
E
E
E
EE
E
E
E
E
E
E
E
E
E
E
EE
E
E
E
EE
E
E
E
E
E
E
E
E
J
JJ
J
J
J J JJJJ
JJ
J
J J
J
J
-2.5
-2.0
-1.5
-1.0
-0.5
0.0
0.5
1.0
1.5
2.0
2.5
5 15 25 35 45 55 65 75 85 95
Z = 2.78 - .82 ln(C)r = -.53
Network Constraint (C)many ——— Structural Holes ——— few
Z-S
core
Rel
ativ
e P
erfo
rman
ce(c
ompe
nsat
ion,
eva
luat
ion,
pro
mot
ion)
Circles are average z-score performance (Z) for a five-point interval of network constraint (C) within each of eight study populations. Dashed line goes through mean values of Z for
intervals of C. Bold line is performance predicted by the natural log of C. Graph is from Figure 1.8 in Brokerage and Closure. Data are pooled across eight management populations.
From Figure 4.6 in Brokerage and Closure, Figure 6.4 in Neighbor Networks.
0.0
0.1
0.2
0.3
0.4
0.5
0.6
0.7
0.8
0 2 4 6 8 10 ormore
Co
rrel
atio
n B
etw
een
Ban
ker’
s R
epu
tati
on
Th
is Y
ear
and
Nex
t(1
3-pe
rson
sub
sam
ple)
1
2
3
4
1 2 3 4Rt
R(t+1)
1
2
3
4
1 2 3 4Rt
R(t+1)
Average Number of Mutual ContactsLinking Banker this Year with Colleagues
banker banker
e.g, sociogram bottom-right
Solid regression line and white dotsdescribe stability in positive reputations
(8.1 routine t-test)
Dashed regression line and black dotsdescribe stability in negative reputations(6.9 routine t-test)

Stra
tegi
c Lea
ders
hip
Deliv
erin
g Va
lue:
The
Soc
ial C
apita
l of C
losu
re (p
age 2
)
from Figure 3.1 in Brokerage and Closure (for discussion, see pages 105-111)
Robert Jessica Robert Jessica Robert Jessica
Situation ARobert New Acquaintance
(no embedding)
Situation BRobert Long-Time Colleague
("relational" embedding)
Situation CRobert Co-Member Group
("structural" embedding)
More connections allow more rapid communication, so poor behavior can be more readily detected and punished. Bureaucratic authority was the traditional engine for coordination in organizations (budget, head count). The new engine is reputation (e.g., eBay). In flattened-down organizations, leader roles are often ambiguous, so people need help knowing who to trust, and the boss needs help supervising her direct reports. Multi-point evaluation systems, often discussed as 360° evaluation systems, gather evaluative data from the people who work with an employee. These are "reputational" systems in that evaluations are the same data that define an employee's reputation in the company.
Trust is essential to exercising social capital. Organizations depend on able employees using social capital to search out and implement ways to add value, but too much puts the enterprise at risk. Company chains of command broken in service of company interests can just as easily be broken in service of personal interests, or in service of well-intentioned but strategy-eroding interests. Zaffaroni in Affymax, Clendenin at Xerox, and Beers in WPP illustrate the importance of reputation for overcoming the suspicions with which brokers are viewed. In essence, reputation is the governance mechanism in social networks.
Closure Creates a Reputation Cost for Misbehavior,Which Facilitates Trust and Collaboration

Figure 4. Brokerage and Closure Are Two Sides of the Same Coin, Operating by Mechanisms Local and Interdependent
Brokerage and closure operate by local, personal mechanisms — skill in recombinant knowledge and sharing stories — and as we get closer to individual people, we find the people with brokerage advantages in access
to structural holes are the same people who have closure advantages in status and reputation.
A Global Organizationof Bankers
A BalkanizedAsia-Pacific
Product-LaunchOrganization
0.0
1.0
2.0
3.0
4.0
5.00.0 0.5 1.0 1.5 2.0 2.5 3.0 3.5
Net
owrk
Cen
tral
ity/P
ower
/Sta
tus
(eig
enve
ctor
sco
re /
mea
n sc
ore)
Network Brokerage (-(ln[C]))
r = .94
Circles in US, diamonds elsewhere
0
1
2
3
4
5
6
7
8
90.0 0.5 1.0 1.5 2.0 2.5
Net
wor
k C
entr
ality
/Pow
er/S
tatu
s(e
igen
vect
or s
core
/ m
ean
scor
e)
Network Brokerage (-(ln[C]))
r = .86
Sales Regional OpsProduct SupportAdministration
Regions indexedby color, functions by shape
Banker organization is described in Chapter 4 of Neighbor Networks, product-launch in Chapter 3.
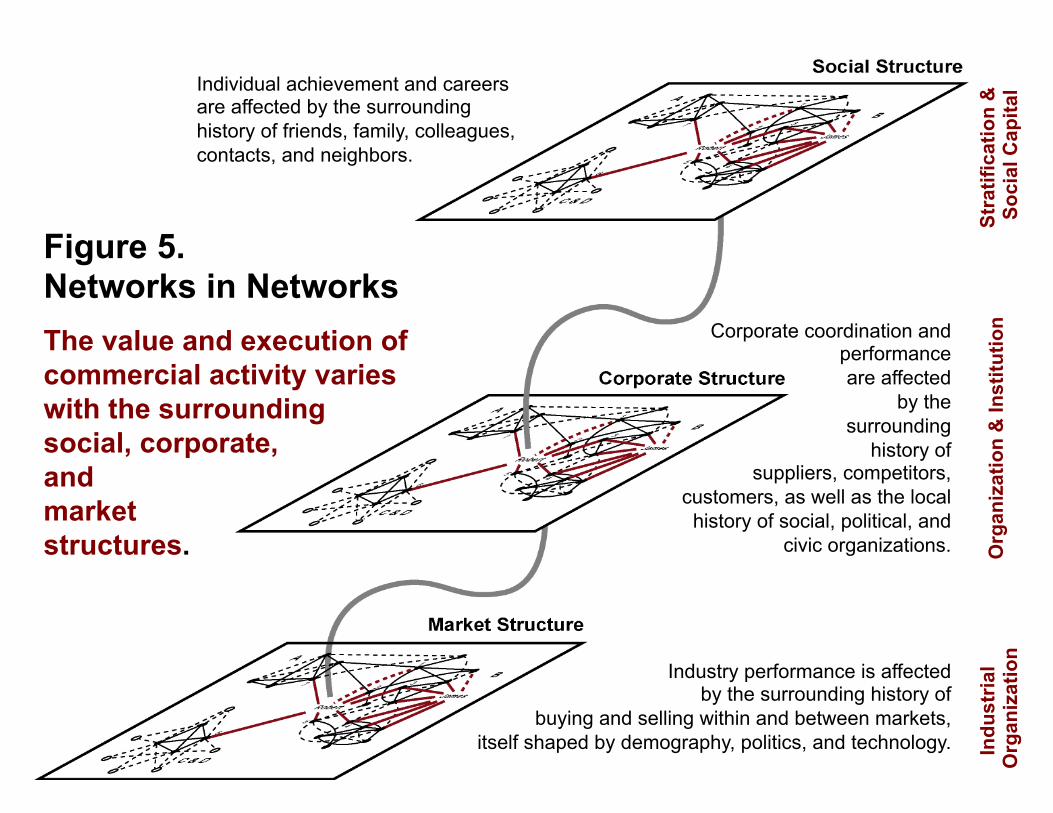
Figure 5. Networks in Networks The value and execution of commercial activity varies with the surrounding social, corporate, and market structures.
Individual achievement and careers are affected by the surrounding history of friends, family, colleagues, contacts, and neighbors.
Corporate coordination and performance are affected
by the surrounding
history of suppliers, competitors,
customers, as well as the local history of social, political, and
civic organizations.
Industry performance is affected by the surrounding history of
buying and selling within and between markets, itself shaped by demography, politics, and technology. In
dust
rial
Org
aniz
atio
n O
rgan
izat
ion
& In
stitu
tion
Stra
tific
atio
n &
So
cial
Cap
ital

15/04/2011
Distinguishing Regional Clusters
Reputation in the Western World The Data Conceptual Foundations Distinguishing Regional Clusters Digging into Significant Bridges Digging into Significant Closure
Appendix Materials
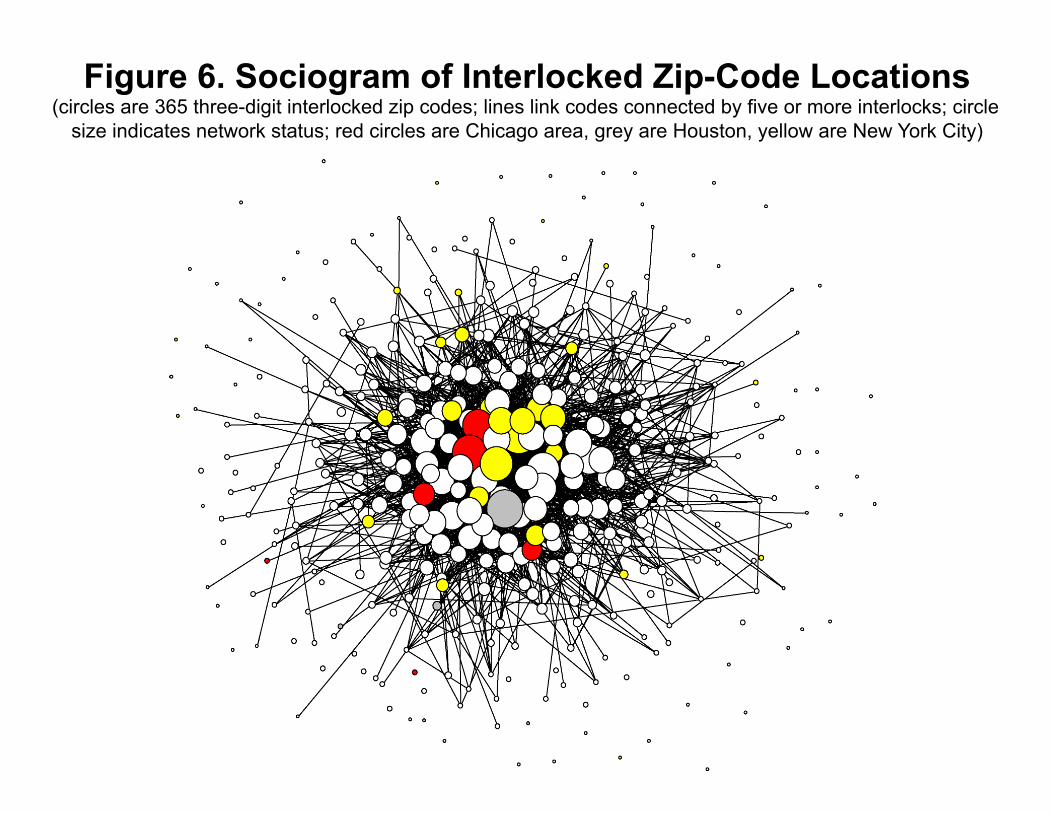
Figure 6. Sociogram of Interlocked Zip-Code Locations (circles are 365 three-digit interlocked zip codes; lines link codes connected by five or more interlocks; circle
size indicates network status; red circles are Chicago area, grey are Houston, yellow are New York City)
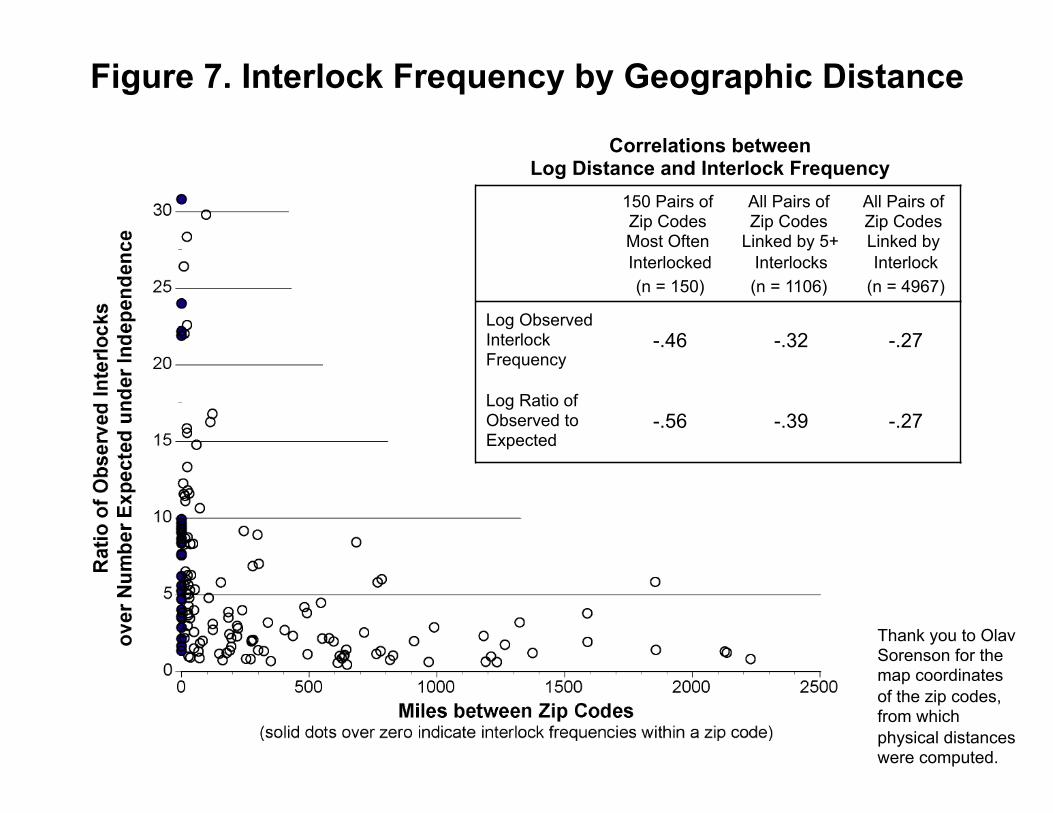
Figure 7. Interlock Frequency by Geographic Distance
Correlations between Log Distance and Interlock Frequency
150 Pairs of Zip Codes Most Often Interlocked (n = 150)
All Pairs of Zip Codes
Linked by 5+ Interlocks (n = 1106)
All Pairs of Zip Codes Linked by Interlock
(n = 4967)
Log Observed Interlock Frequency
-.46 -.32 -.27
Log Ratio of Observed to Expected
-.56 -.39 -.27
Thank you to Olav Sorenson for the map coordinates of the zip codes, from which physical distances were computed.
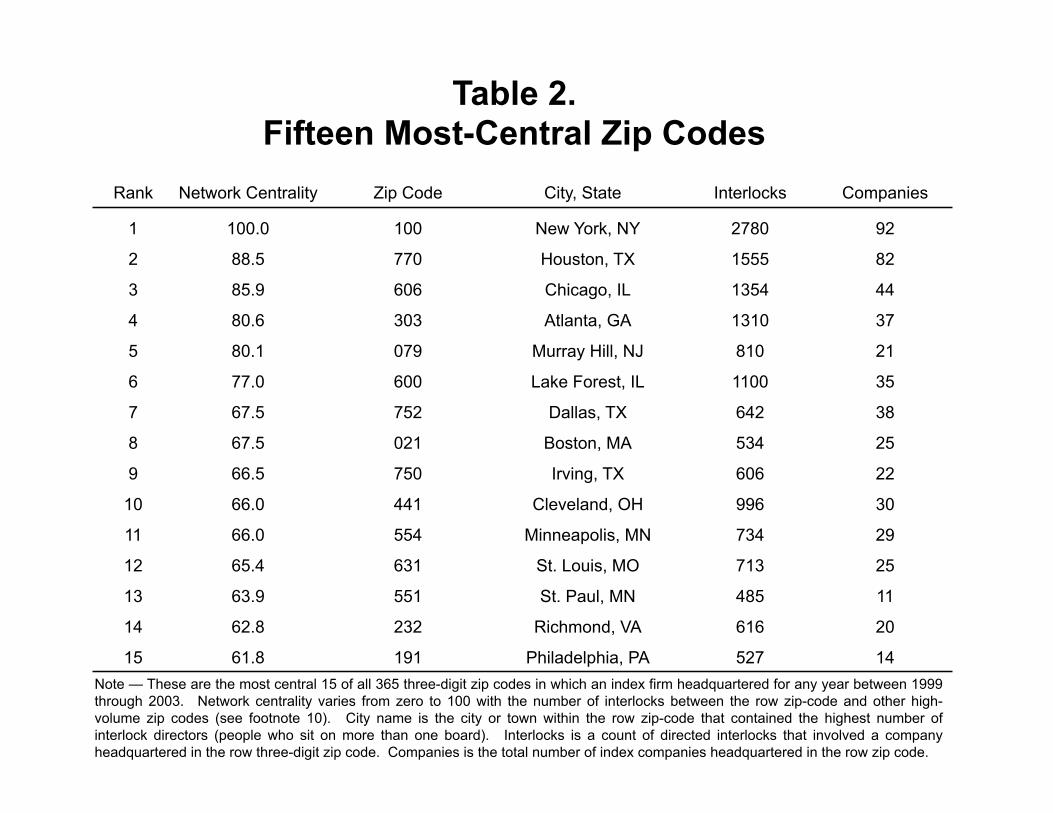
Table 2. Fifteen Most-Central Zip Codes
Rank Network Centrality Zip Code City, State Interlocks Companies
1 100.0 100 New York, NY 2780 92
2 88.5 770 Houston, TX 1555 82
3 85.9 606 Chicago, IL 1354 44
4 80.6 303 Atlanta, GA 1310 37
5 80.1 079 Murray Hill, NJ 810 21
6 77.0 600 Lake Forest, IL 1100 35
7 67.5 752 Dallas, TX 642 38
8 67.5 021 Boston, MA 534 25
9 66.5 750 Irving, TX 606 22
10 66.0 441 Cleveland, OH 996 30
11 66.0 554 Minneapolis, MN 734 29
12 65.4 631 St. Louis, MO 713 25
13 63.9 551 St. Paul, MN 485 11
14 62.8 232 Richmond, VA 616 20
15 61.8 191 Philadelphia, PA 527 14 Note — These are the most central 15 of all 365 three-digit zip codes in which an index firm headquartered for any year between 1999 through 2003. Network centrality varies from zero to 100 with the number of interlocks between the row zip-code and other high-volume zip codes (see footnote 10). City name is the city or town within the row zip-code that contained the highest number of interlock directors (people who sit on more than one board). Interlocks is a count of directed interlocks that involved a company headquartered in the row three-digit zip code. Companies is the total number of index companies headquartered in the row zip code.
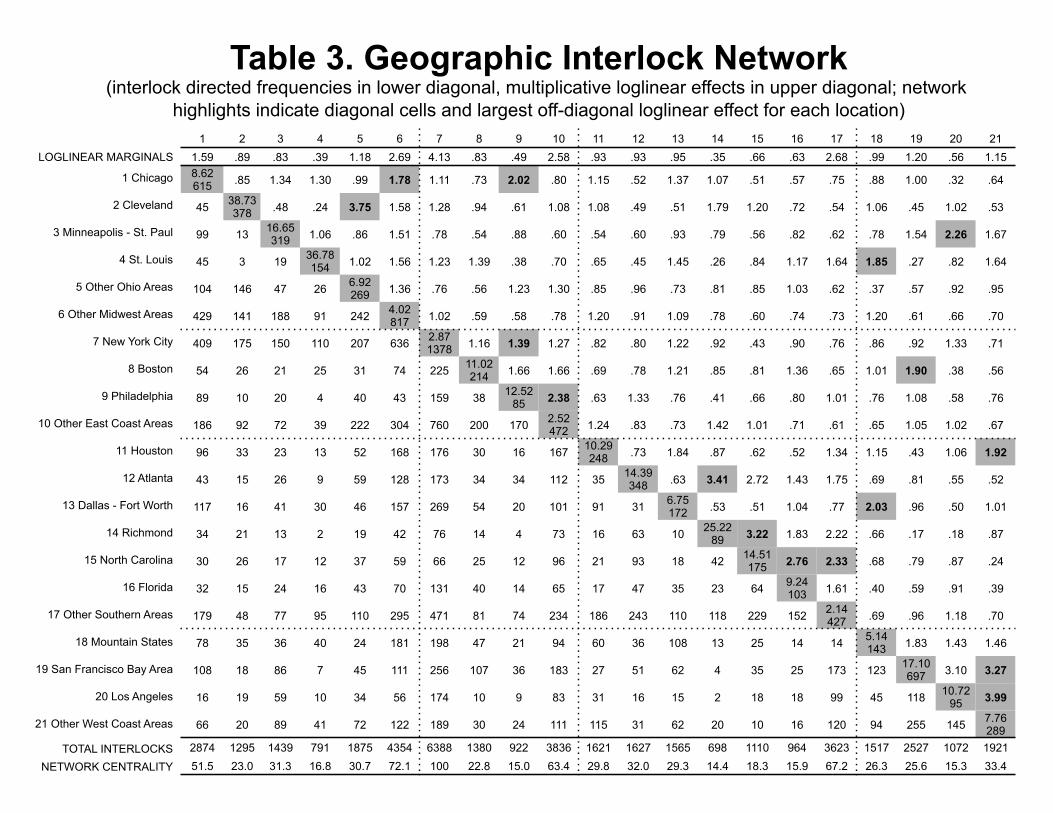
Table 3. Geographic Interlock Network (interlock directed frequencies in lower diagonal, multiplicative loglinear effects in upper diagonal; network
highlights indicate diagonal cells and largest off-diagonal loglinear effect for each location) 1 2 3 4 5 6 7 8 9 10 11 12 13 14 15 16 17 18 19 20 21
1.59 .89 .83 .39 1.18 2.69 4.13 .83 .49 2.58 .93 .93 .95 .35 .66 .63 2.68 .99 1.20 .56 1.15 8.62 615 .85 1.34 1.30 .99 1.78 1.11 .73 2.02 .80 1.15 .52 1.37 1.07 .51 .57 .75 .88 1.00 .32 .64
45 38.73 378 .48 .24 3.75 1.58 1.28 .94 .61 1.08 1.08 .49 .51 1.79 1.20 .72 .54 1.06 .45 1.02 .53
99 13 16.65 319 1.06 .86 1.51 .78 .54 .88 .60 .54 .60 .93 .79 .56 .82 .62 .78 1.54 2.26 1.67
45 3 19 36.78 154 1.02 1.56 1.23 1.39 .38 .70 .65 .45 1.45 .26 .84 1.17 1.64 1.85 .27 .82 1.64
104 146 47 26 6.92 269 1.36 .76 .56 1.23 1.30 .85 .96 .73 .81 .85 1.03 .62 .37 .57 .92 .95
429 141 188 91 242 4.02 817 1.02 .59 .58 .78 1.20 .91 1.09 .78 .60 .74 .73 1.20 .61 .66 .70
409 175 150 110 207 636 2.87 1378 1.16 1.39 1.27 .82 .80 1.22 .92 .43 .90 .76 .86 .92 1.33 .71
54 26 21 25 31 74 225 11.02 214 1.66 1.66 .69 .78 1.21 .85 .81 1.36 .65 1.01 1.90 .38 .56
89 10 20 4 40 43 159 38 12.52 85 2.38 .63 1.33 .76 .41 .66 .80 1.01 .76 1.08 .58 .76
186 92 72 39 222 304 760 200 170 2.52 472 1.24 .83 .73 1.42 1.01 .71 .61 .65 1.05 1.02 .67
96 33 23 13 52 168 176 30 16 167 10.29 248 .73 1.84 .87 .62 .52 1.34 1.15 .43 1.06 1.92
43 15 26 9 59 128 173 34 34 112 35 14.39 348 .63 3.41 2.72 1.43 1.75 .69 .81 .55 .52
117 16 41 30 46 157 269 54 20 101 91 31 6.75 172 .53 .51 1.04 .77 2.03 .96 .50 1.01
34 21 13 2 19 42 76 14 4 73 16 63 10 25.22 89 3.22 1.83 2.22 .66 .17 .18 .87
30 26 17 12 37 59 66 25 12 96 21 93 18 42 14.51 175 2.76 2.33 .68 .79 .87 .24
32 15 24 16 43 70 131 40 14 65 17 47 35 23 64 9.24 103 1.61 .40 .59 .91 .39
179 48 77 95 110 295 471 81 74 234 186 243 110 118 229 152 2.14 427 .69 .96 1.18 .70
78 35 36 40 24 181 198 47 21 94 60 36 108 13 25 14 14 5.14 143 1.83 1.43 1.46
108 18 86 7 45 111 256 107 36 183 27 51 62 4 35 25 173 123 17.10 697 3.10 3.27
16 19 59 10 34 56 174 10 9 83 31 16 15 2 18 18 99 45 118 10.72 95 3.99
66 20 89 41 72 122 189 30 24 111 115 31 62 20 10 16 120 94 255 145 7.76 289
2874 1295 1439 791 1875 4354 6388 1380 922 3836 1621 1627 1565 698 1110 964 3623 1517 2527 1072 1921 51.5 23.0 31.3 16.8 30.7 72.1 100 22.8 15.0 63.4 29.8 32.0 29.3 14.4 18.3 15.9 67.2 26.3 25.6 15.3 33.4
1 Chicago
2 Cleveland
3 Minneapolis - St. Paul
4 St. Louis
5 Other Ohio Areas
6 Other Midwest Areas
7 New York City
8 Boston
9 Philadelphia
10 Other East Coast Areas
11 Houston
12 Atlanta
13 Dallas - Fort Worth
14 Richmond
15 North Carolina
16 Florida
17 Other Southern Areas
18 Mountain States
19 San Francisco Bay Area
20 Los Angeles
21 Other West Coast Areas
TOTAL INTERLOCKS NETWORK CENTRALITY
LOGLINEAR MARGINALS
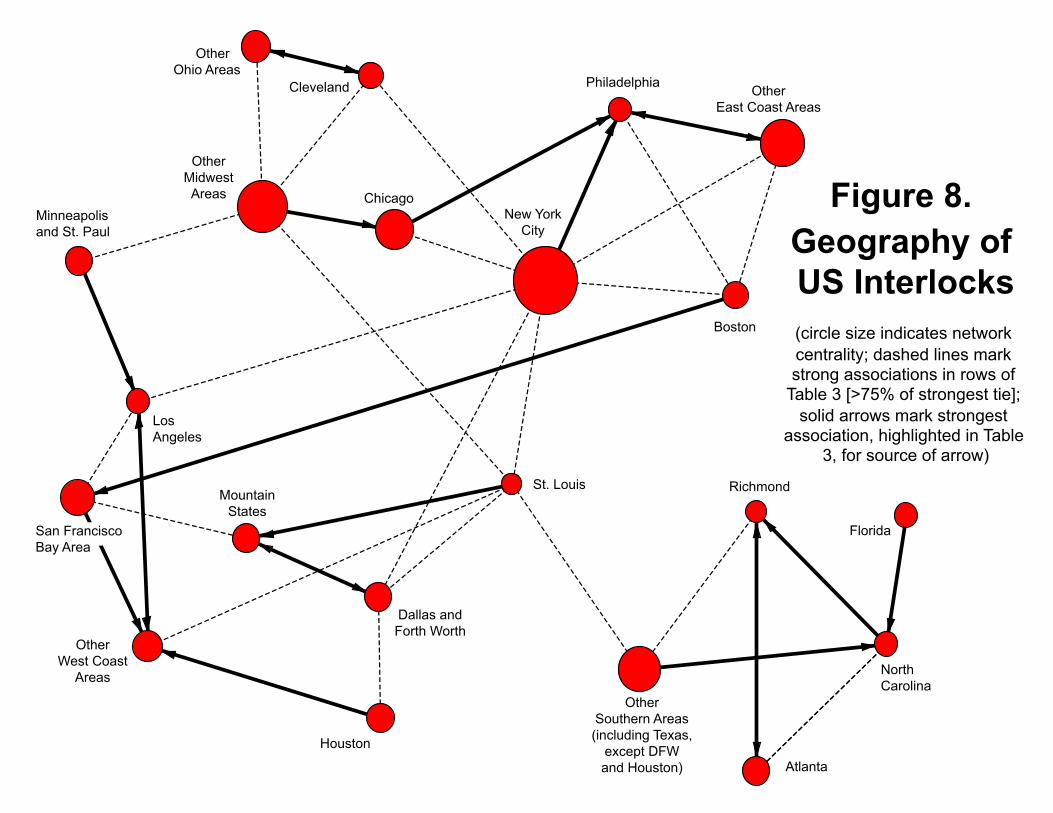
Figure 8. Geography of US Interlocks (circle size indicates network centrality; dashed lines mark strong associations in rows of
Table 3 [>75% of strongest tie]; solid arrows mark strongest
association, highlighted in Table 3, for source of arrow)
OtherOhio Areas
Cleveland
OtherMidwestAreas
Minneapolisand St. Paul
St. Louis
OtherWest CoastAreas
Boston
OtherSouthern Areas(including Texas,except DFWand Houston)
Richmond
NorthCarolina
Atlanta
Florida
LosAngeles
MountainStates
Chicago
Philadelphia OtherEast Coast Areas
Dallas andForth Worth
Houston
New YorkCity
San FranciscoBay Area
15/04/2011
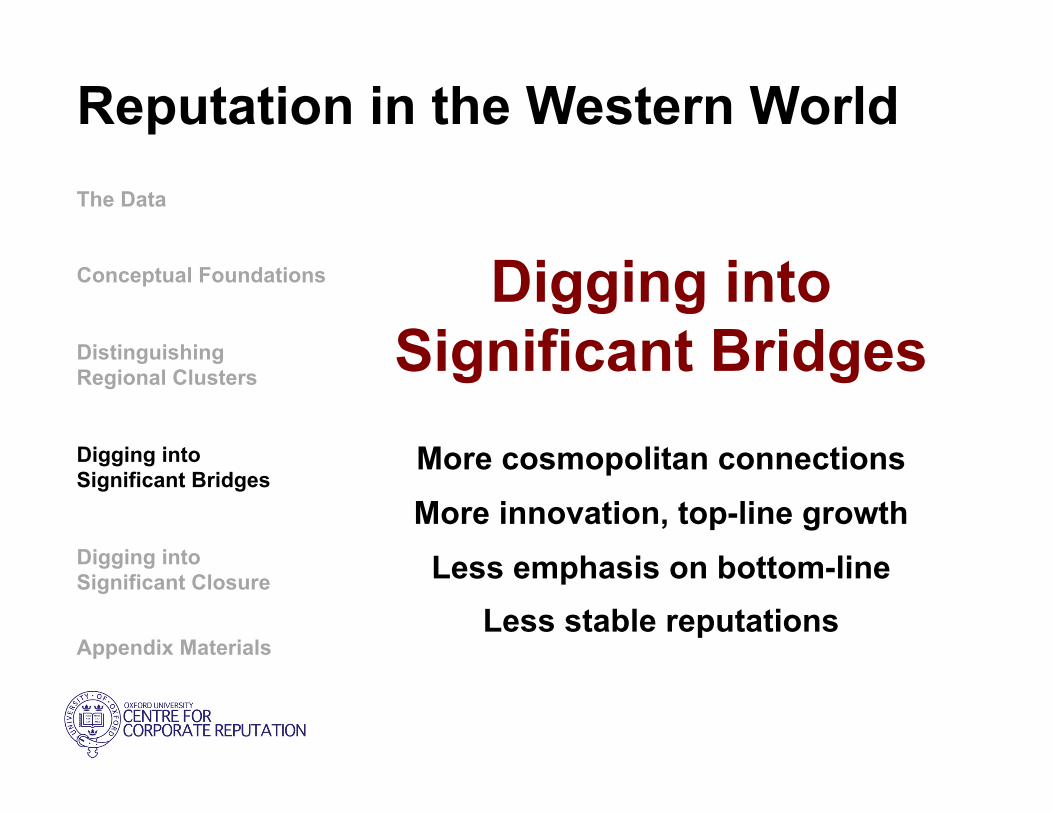
Digging into Significant Bridges
More cosmopolitan connections More innovation, top-line growth Less emphasis on bottom-line
Less stable reputations
Reputation in the Western World The Data Conceptual Foundations Distinguishing Regional Clusters Digging into Significant Bridges Digging into Significant Closure
Appendix Materials
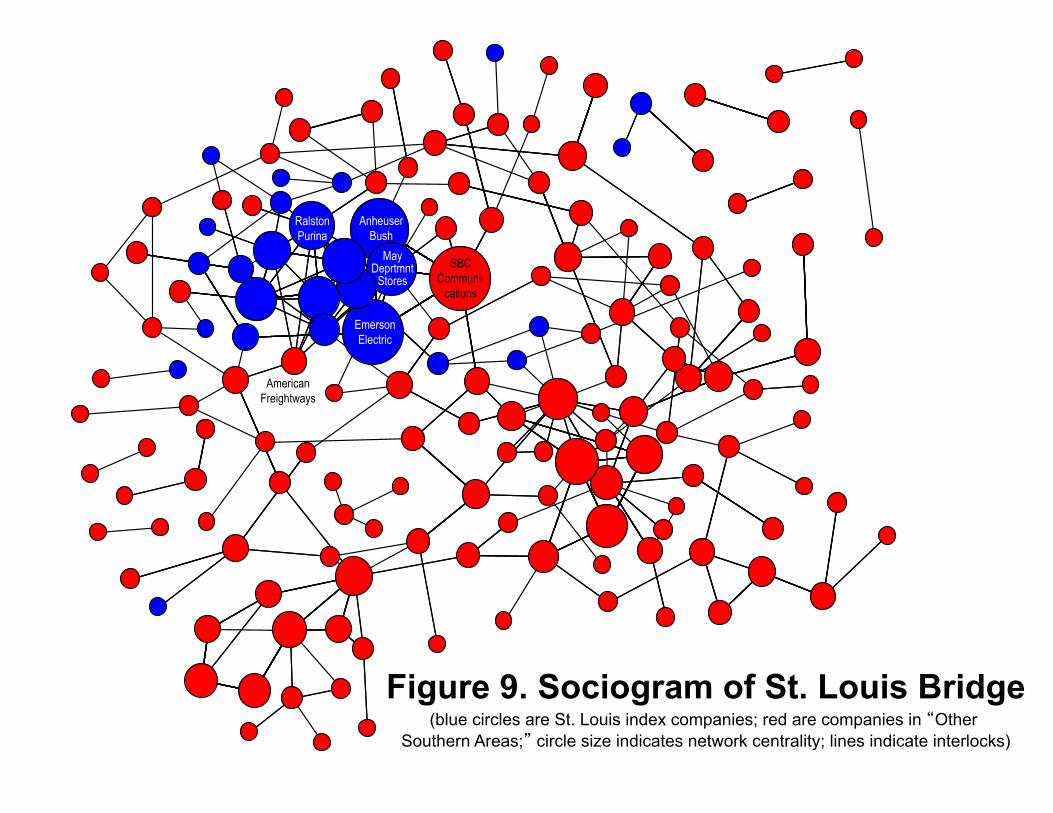
Figure 9. Sociogram of St. Louis Bridge (blue circles are St. Louis index companies; red are companies in “Other
Southern Areas;” circle size indicates network centrality; lines indicate interlocks)
Emerson Electric
SBC Communi-
cations
Anheuser Bush
May Deprtmnt
Stores
Ralston Purina
AmericanFreightways
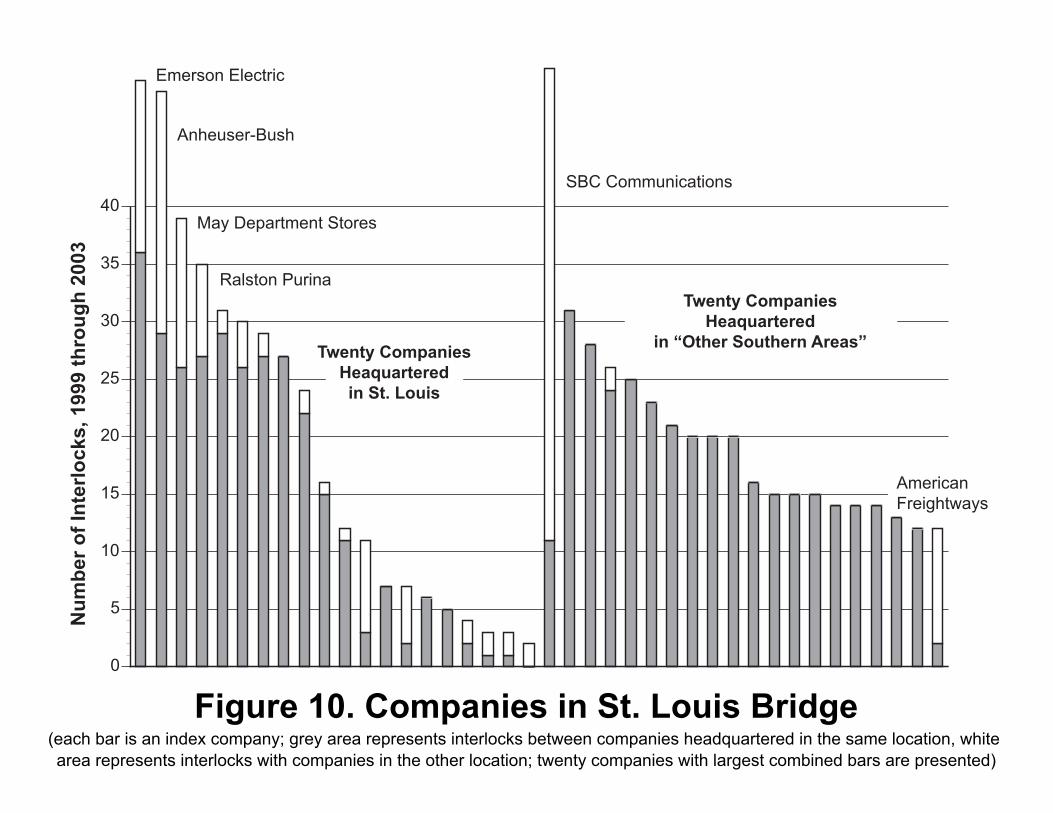
Figure 10. Companies in St. Louis Bridge (each bar is an index company; grey area represents interlocks between companies headquartered in the same location, white area represents interlocks with companies in the other location; twenty companies with largest combined bars are presented)
0
5
10
15
20
25
30
35
40
Num
ber of Interlocks, 1999 through 2003
Emerson Electric
Anheuser-Bush
May Department Stores
Ralston Purina
SBC Communications
Twenty CompaniesHeaquartered
in “Other Southern Areas”Twenty CompaniesHeaquarteredin St. Louis
AmericanFreightways
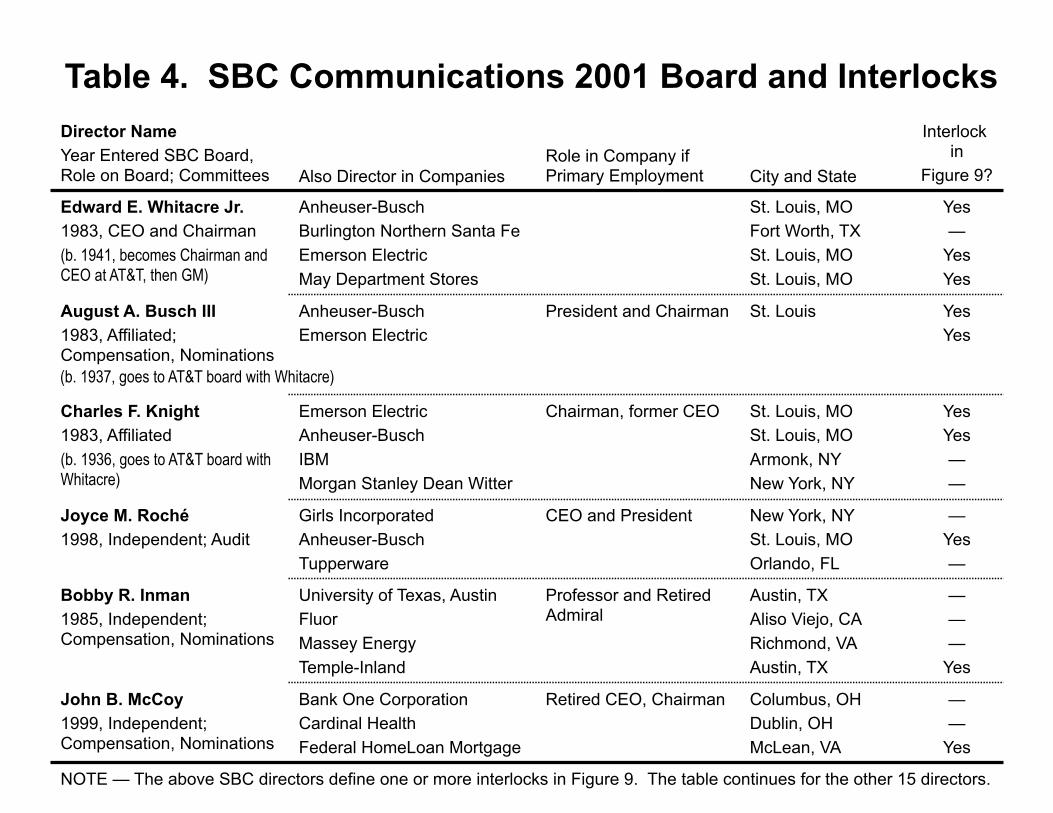
Director Name Year Entered SBC Board, Role on Board; Committees Also Director in Companies
Role in Company if Primary Employment City and State
Interlock in
Figure 9?
Edward E. Whitacre Jr. 1983, CEO and Chairman (b. 1941, becomes Chairman and CEO at AT&T, then GM)
Anheuser-Busch Burlington Northern Santa Fe Emerson Electric May Department Stores
St. Louis, MO Fort Worth, TX St. Louis, MO St. Louis, MO
Yes —
Yes Yes
August A. Busch III 1983, Affiliated; Compensation, Nominations
Anheuser-Busch Emerson Electric
President and Chairman St. Louis Yes Yes
Charles F. Knight 1983, Affiliated (b. 1936, goes to AT&T board with Whitacre)
Emerson Electric Anheuser-Busch IBM Morgan Stanley Dean Witter
Chairman, former CEO St. Louis, MO St. Louis, MO Armonk, NY New York, NY
Yes Yes — —
Joyce M. Roché 1998, Independent; Audit
Girls Incorporated Anheuser-Busch Tupperware
CEO and President New York, NY St. Louis, MO Orlando, FL
— Yes —
Bobby R. Inman 1985, Independent; Compensation, Nominations
University of Texas, Austin Fluor Massey Energy Temple-Inland
Professor and Retired Admiral
Austin, TX Aliso Viejo, CA Richmond, VA Austin, TX
— — —
Yes
John B. McCoy 1999, Independent; Compensation, Nominations
Bank One Corporation Cardinal Health Federal HomeLoan Mortgage
Retired CEO, Chairman Columbus, OH Dublin, OH McLean, VA
— —
Yes
Table 4. SBC Communications 2001 Board and Interlocks
(b. 1937, goes to AT&T board with Whitacre)
NOTE — The above SBC directors define one or more interlocks in Figure 9. The table continues for the other 15 directors.
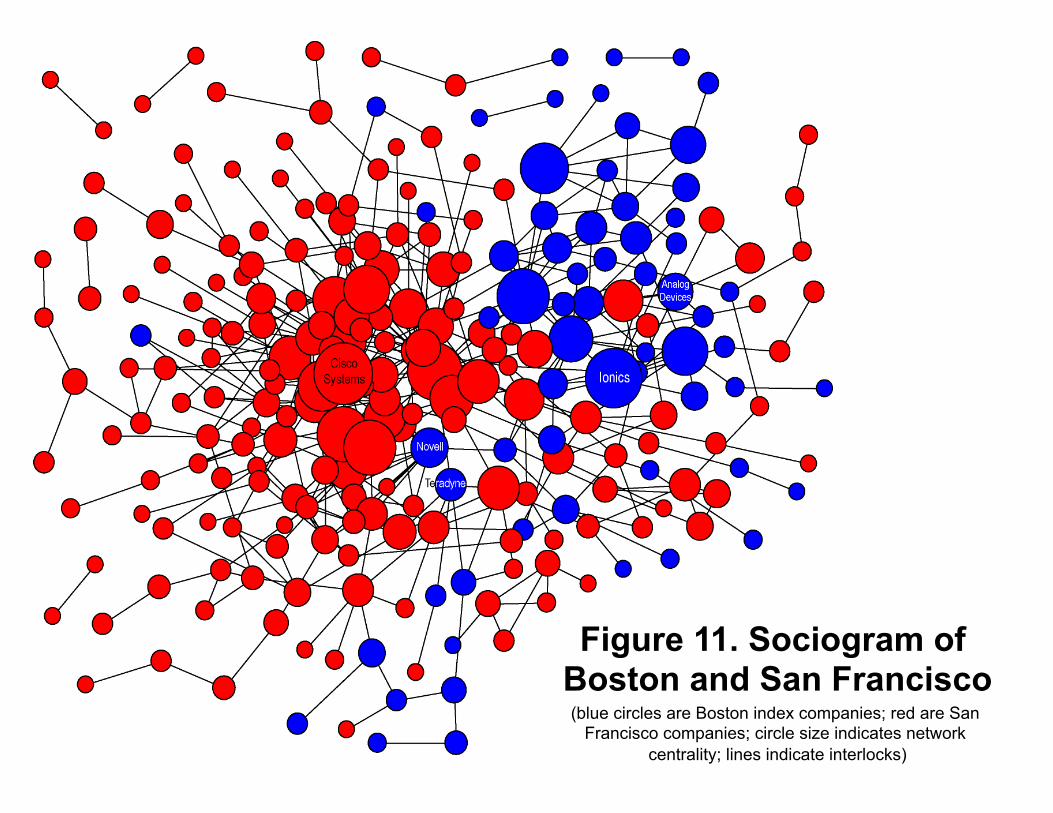
Figure 11. Sociogram of Boston and San Francisco (blue circles are Boston index companies; red are San
Francisco companies; circle size indicates network centrality; lines indicate interlocks)
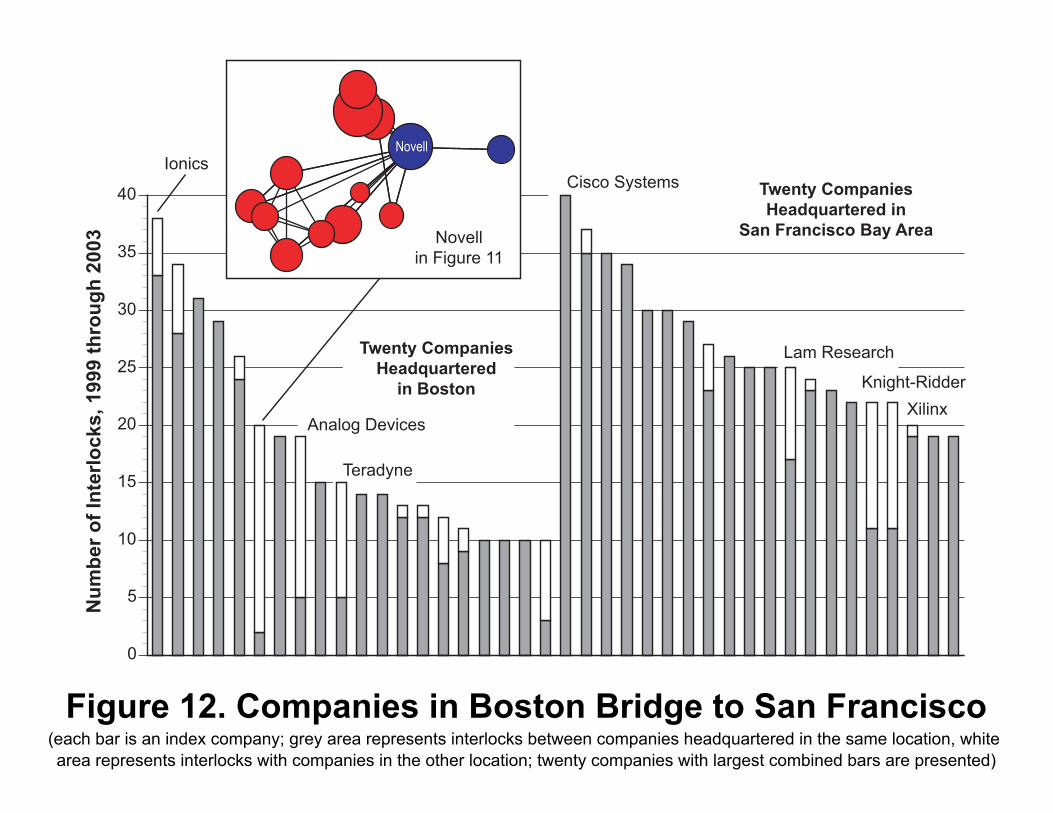
Figure 12. Companies in Boston Bridge to San Francisco (each bar is an index company; grey area represents interlocks between companies headquartered in the same location, white area represents interlocks with companies in the other location; twenty companies with largest combined bars are presented)
0
5
10
15
20
25
30
35
40
Novell
Number of Interlocks, 1999 through 2003
Lam Research
Knight-RidderXilinx
Ionics
Novellin Figure 11
Teradyne
Cisco SystemsTwenty Companies
Headquartered in
San Francisco Bay Area
Twenty Companies
Headquartered
in Boston
Analog Devices
15/04/2011
Digging into Significant Closure
More community connections More emphasis on bottom line
Less innovation, top-line growth More stable reputations
Reputation in the Western World The Data Conceptual Foundations Distinguishing Regional Clusters Digging into Significant Bridges Digging into Significant Closure
Appendix Materials
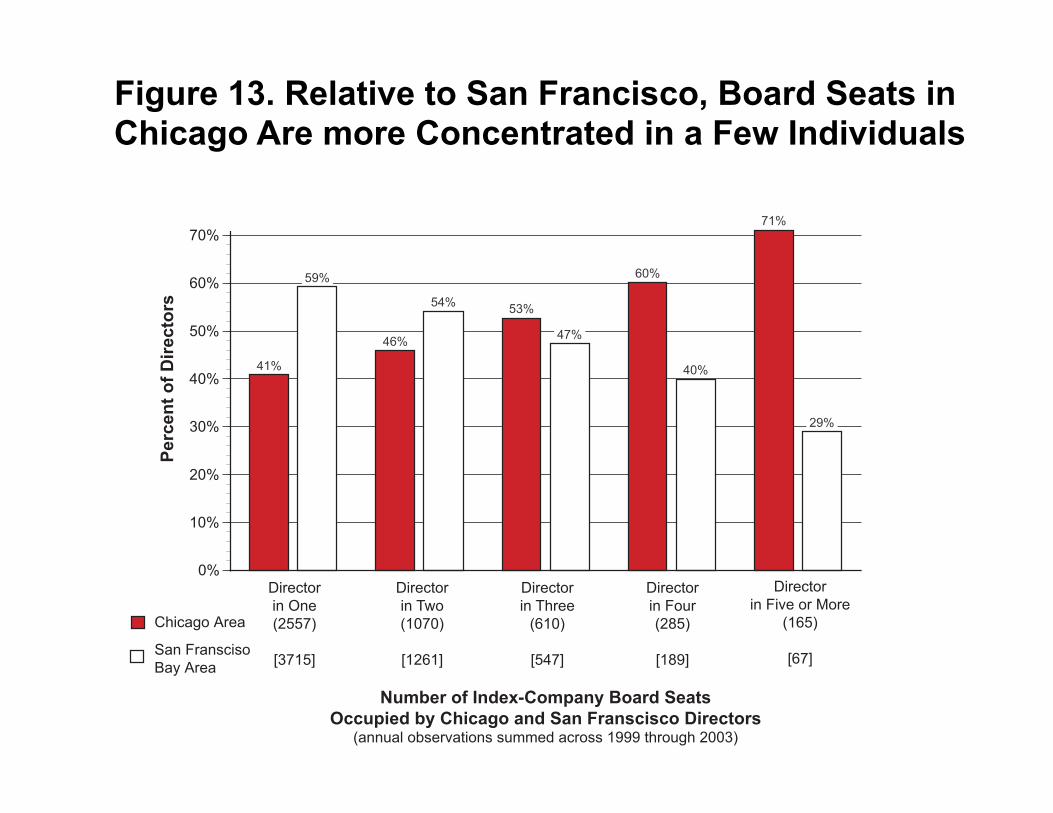
Figure 13. Relative to San Francisco, Board Seats in Chicago Are more Concentrated in a Few Individuals
0%
10%
20%
30%
40%
50%
60%
70%
41%
59%
46%
54% 53%
47%
60%
40%
71%
29%
Director
in One
(2557)
[3715]
Director
in Two
(1070)
[1261]
Director
in Three
(610)
[547]
Director
in Four
(285)
[189]
Director
in Five or More
(165)
[67]
Number of Index-Company Board Seats
Occupied by Chicago and San Franscisco Directors
(annual observations summed across 1999 through 2003)
Percent of Directors
Chicago Area
San Fransciso
Bay Area
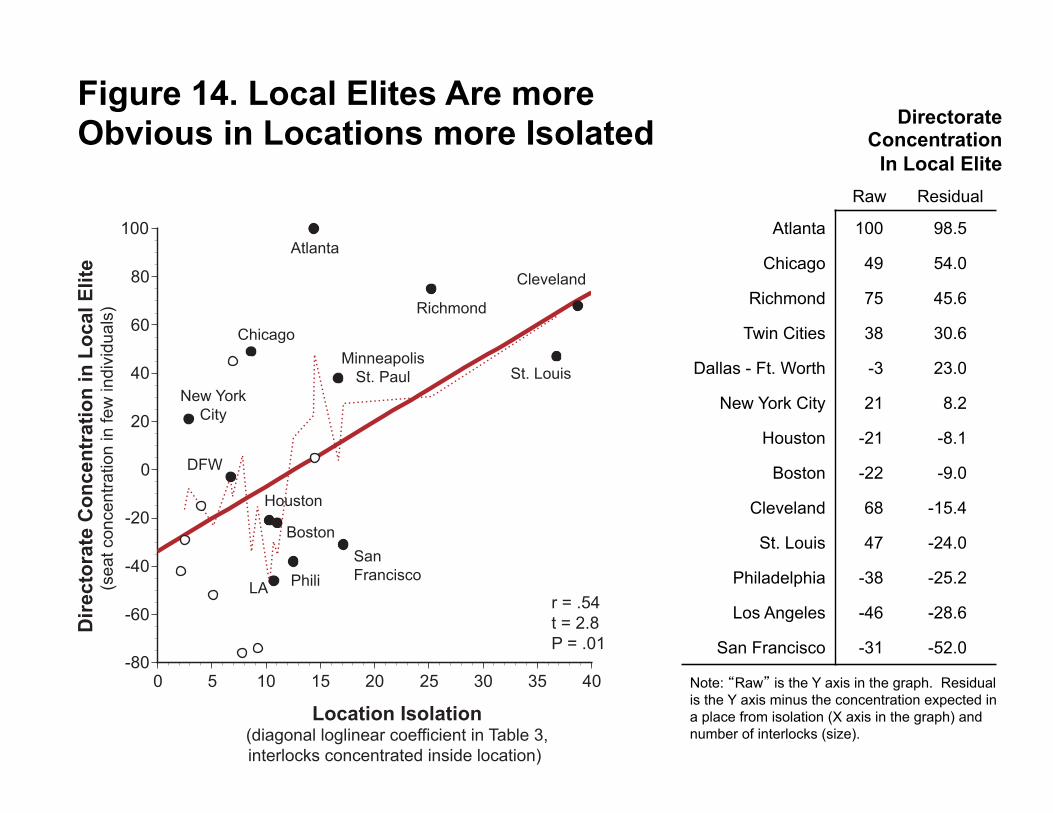
Figure 14. Local Elites Are more Obvious in Locations more Isolated
Raw Residual
Atlanta 100 98.5
Chicago 49 54.0
Richmond 75 45.6
Twin Cities 38 30.6
Dallas - Ft. Worth -3 23.0
New York City 21 8.2
Houston -21 -8.1
Boston -22 -9.0
Cleveland 68 -15.4
St. Louis 47 -24.0
Philadelphia -38 -25.2
Los Angeles -46 -28.6
San Francisco -31 -52.0
Directorate Concentration
In Local Elite
Note: “Raw” is the Y axis in the graph. Residual is the Y axis minus the concentration expected in a place from isolation (X axis in the graph) and number of interlocks (size).
-80
-60
-40
-20
0
20
40
60
80
100
0 5 10 15 20 25 30 35 40
Location Isolation(diagonal loglinear coefficient in Table 3,
interlocks concentrated inside location)
Directorate Concentration in Local Elite
(seat concentration in few individuals)
Atlanta
Cleveland
St. Louis
Richmond
Minneapolis
St. Paul
San
Francisco
Chicago
New York
City
DFW
Boston
PhiliLA
r = .54
t = 2.8
P = .01
Houston
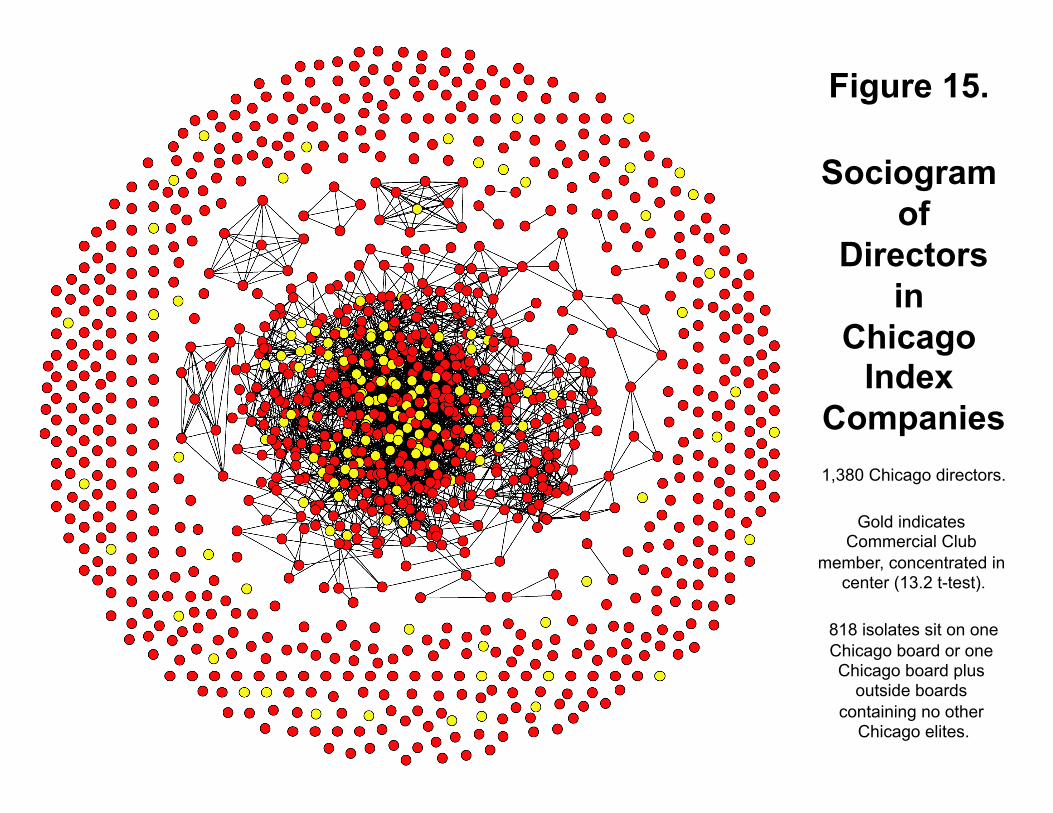
Figure 15.
Sociogram of
Directors in
Chicago Index
Companies
1,380 Chicago directors.
Gold indicates Commercial Club
member, concentrated in center (13.2 t-test).
818 isolates sit on one Chicago board or one Chicago board plus
outside boards containing no other
Chicago elites.

Some Initial Projects
The Chicago Project — Questions to be addressed include how local, social, and historical factors affect access to capital, the circulation of favors, the arrival and departure of companies, the emergence and loss of local markets, as well as the benefits to executive careers that pass through the city.
Comparative analysis to target industries — market profiles compared across cities using Porter cluster data. Set up for Sabel-Saxenian story on why certain industries flourished in the city and others do not.
Comparative network analysis to target firms and individuals — interlocking directorates compared across cities using Fortune 1000 data distinguishing Commercial Club members. Set up for Ansell-Padget story on key people or Saxenian story on key companies.
Institutional story about Commercial Club as closed-network base for reputation in Chicago. The Club as a merchant guild or “business group” in late 19th and early 20th centuries. Set up for Coleman-Granovetter-Grief story.
Here is the founder of PayPal explaining why they moved from Skokie to Palo Alto (underline added):
“We looked around in Chicago, but were told that no one invests in good ideas; you had to ‘know’ somebody.
We moved to Palo Alto, got Nokia to listen (Motorola would not talk to us), and within a year had over $100 million in investment and turned a profit in year two.”
Quoted from p. 12 of Call to Action, June 2003 study by A.T.Kearney for
Chicagoland Chamber of Commerce & Chicagoland Entrepreneurial Center
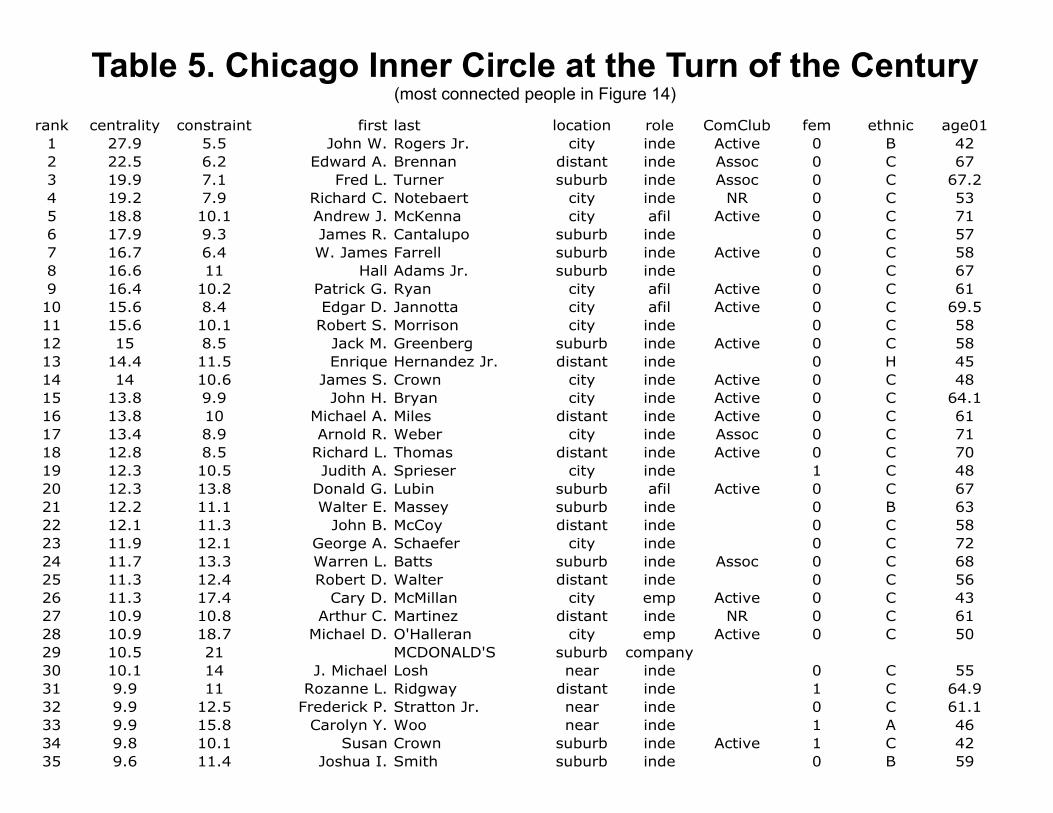
Table 5. Chicago Inner Circle at the Turn of the Century (most connected people in Figure 14)
rank centrality constraint first last location role ComClub fem ethnic age01
1 27.9 5.5 John W. Rogers Jr. city inde Active 0 B 42
2 22.5 6.2 Edward A. Brennan distant inde Assoc 0 C 67
3 19.9 7.1 Fred L. Turner suburb inde Assoc 0 C 67.2
4 19.2 7.9 Richard C. Notebaert city inde NR 0 C 53
5 18.8 10.1 Andrew J. McKenna city afil Active 0 C 71
6 17.9 9.3 James R. Cantalupo suburb inde 0 C 57
7 16.7 6.4 W. James Farrell suburb inde Active 0 C 58
8 16.6 11 Hall Adams Jr. suburb inde 0 C 67
9 16.4 10.2 Patrick G. Ryan city afil Active 0 C 61
10 15.6 8.4 Edgar D. Jannotta city afil Active 0 C 69.5
11 15.6 10.1 Robert S. Morrison city inde 0 C 58
12 15 8.5 Jack M. Greenberg suburb inde Active 0 C 58
13 14.4 11.5 Enrique Hernandez Jr. distant inde 0 H 45
14 14 10.6 James S. Crown city inde Active 0 C 48
15 13.8 9.9 John H. Bryan city inde Active 0 C 64.1
16 13.8 10 Michael A. Miles distant inde Active 0 C 61
17 13.4 8.9 Arnold R. Weber city inde Assoc 0 C 71
18 12.8 8.5 Richard L. Thomas distant inde Active 0 C 70
19 12.3 10.5 Judith A. Sprieser city inde 1 C 48
20 12.3 13.8 Donald G. Lubin suburb afil Active 0 C 67
21 12.2 11.1 Walter E. Massey suburb inde 0 B 63
22 12.1 11.3 John B. McCoy distant inde 0 C 58
23 11.9 12.1 George A. Schaefer city inde 0 C 72
24 11.7 13.3 Warren L. Batts suburb inde Assoc 0 C 68
25 11.3 12.4 Robert D. Walter distant inde 0 C 56
26 11.3 17.4 Cary D. McMillan city emp Active 0 C 43
27 10.9 10.8 Arthur C. Martinez distant inde NR 0 C 61
28 10.9 18.7 Michael D. O'Halleran city emp Active 0 C 50
29 10.5 21 MCDONALD'S suburb company
30 10.1 14 J. Michael Losh near inde 0 C 55
31 9.9 11 Rozanne L. Ridgway distant inde 1 C 64.9
32 9.9 12.5 Frederick P. Stratton Jr. near inde 0 C 61.1
33 9.9 15.8 Carolyn Y. Woo near inde 1 A 46
34 9.8 10.1 Susan Crown suburb inde Active 1 C 42
35 9.6 11.4 Joshua I. Smith suburb inde 0 B 59

15/04/2011
Reputation in the Western World The Data Conceptual Foundations Distinguishing Regional Clusters Digging into Significant Bridges Digging into Significant Closure
Appendix Materials
Appendix Materials
This is a proposal to build a research platform on a large scale that would encourage analysts to study people, organizations, communities and markets embedded in one another. The platform creates an intimate link between case studies, comparative analysis, and quantitative research to allow more general conclusions from better grounded analyses. It is, in short, a proposal to bring into state of the art research more of the blood and soil of business. This is not a project for an individual or local team. It is an exercise of leadership fittingly performed in collaboration through a reputable Centre.

Illustra(ve 3-‐Year Time Line 1a. Begin papers on US data to ini2ate product stream (templates for kinds of reports from Centre), e.g.:
-‐ compara2ve analysis of regions & ci2es – US map & Chicago vs. open city -‐ which companies have the best-‐connected directors & so what? -‐ where is reputa2on more and less persistent – rela2ve to closed network -‐ what is the role of reputa2on in local & industry recogni2on – ascension in Chicago -‐ what is the role of reputa2on in forming key bridges in the economy -‐ SBC
1b. Assemble data on European firms comparable to 1999-‐2002 US data so we have a complete “turn of the century” data set. 2a. Begin papers on European and US firms following up on work in 1a. 2b. Assemble data on US and European firms to create a second data set (lagged to avoid conflict with commercial interests), perhaps a three-‐year interval eight years later? 2008-‐2009-‐2010 3a. Con2nue work crea2ng second data set. 3b. Begin papers crea2ng templates for over-‐2me analysis of European and US firms. Based on results in these papers (much change, liRle), set 2me for next data set.

Figure A1. Cisco Systems Board of Directors in 2001 Data are from the IRRC director file and the proxy statement in Cisco’s 2001 Annual Report.
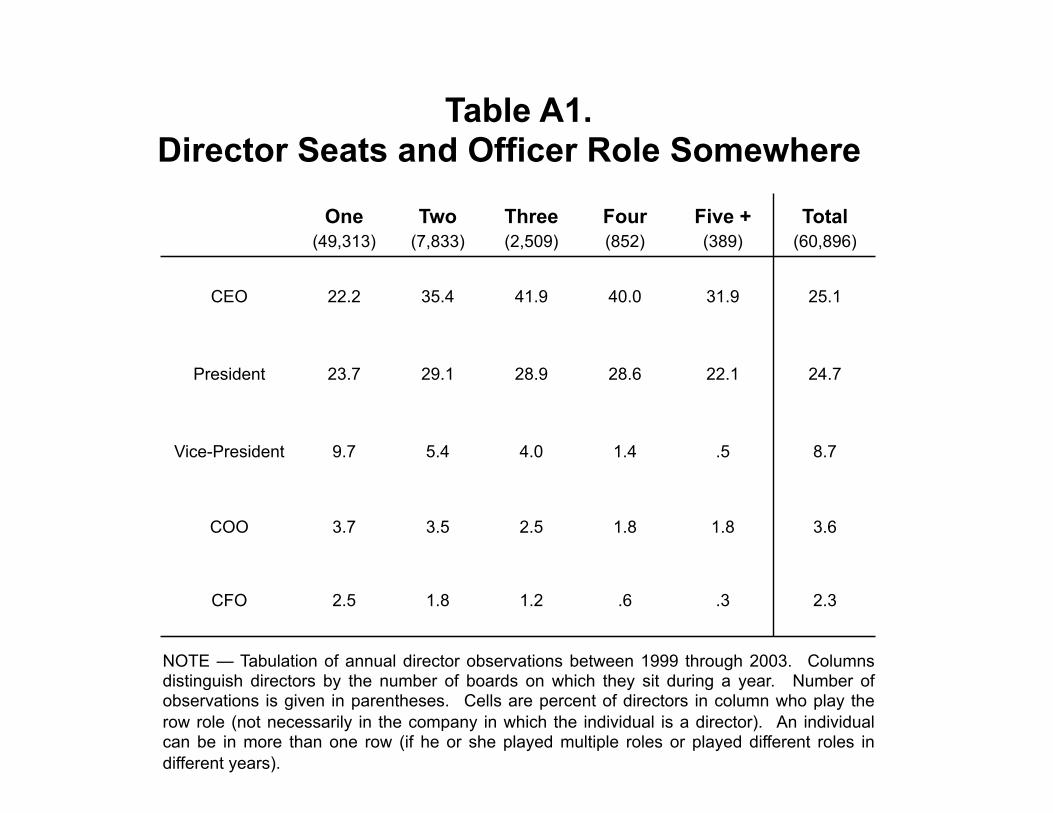
NOTE — Tabulation of annual director observations between 1999 through 2003. Columns distinguish directors by the number of boards on which they sit during a year. Number of observations is given in parentheses. Cells are percent of directors in column who play the row role (not necessarily in the company in which the individual is a director). An individual can be in more than one row (if he or she played multiple roles or played different roles in different years).
Table A1. Director Seats and Officer Role Somewhere
One (49,313)
Two (7,833)
Three (2,509)
Four (852)
Five + (389)
Total (60,896)
CEO 22.2 35.4 41.9 40.0 31.9 25.1
President 23.7 29.1 28.9 28.6 22.1 24.7
Vice-President 9.7 5.4 4.0 1.4 .5 8.7
COO 3.7 3.5 2.5 1.8 1.8 3.6
CFO 2.5 1.8 1.2 .6 .3 2.3
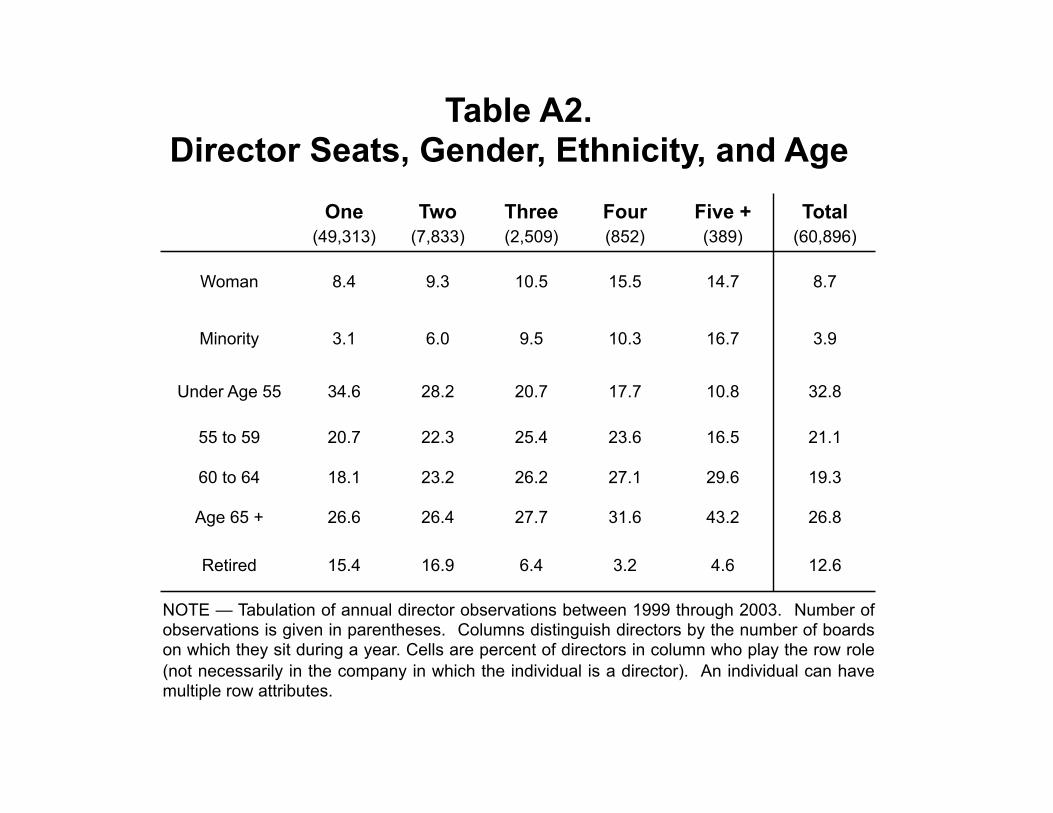
NOTE — Tabulation of annual director observations between 1999 through 2003. Number of observations is given in parentheses. Columns distinguish directors by the number of boards on which they sit during a year. Cells are percent of directors in column who play the row role (not necessarily in the company in which the individual is a director). An individual can have multiple row attributes.
Table A2. Director Seats, Gender, Ethnicity, and Age
One (49,313)
Two (7,833)
Three (2,509)
Four (852)
Five + (389)
Total (60,896)
Woman 8.4 9.3 10.5 15.5 14.7 8.7
Minority 3.1 6.0 9.5 10.3 16.7 3.9
Under Age 55 34.6 28.2 20.7 17.7 10.8 32.8
55 to 59 20.7 22.3 25.4 23.6 16.5 21.1
60 to 64 18.1 23.2 26.2 27.1 29.6 19.3
Age 65 + 26.6 26.4 27.7 31.6 43.2 26.8
Retired 15.4 16.9 6.4 3.2 4.6 12.6

Stra
tegi
c Lea
ders
hip
Deliv
erin
g Va
lue:
The
Soc
ial C
apita
l of C
losu
re (p
age 4
4)
Reputation Stability Predicted by Positive Closure versus Negative Closure
Figure 3 in Burt, "Gossip and reputation" in Management et Réseaux Sociaux, edited by edited by Marc Lecoutre and Pascal Lievre (2008 Hermes-Lavoisier, English language version on my website).
A. Positive Indirect Connections B. Negative Indirect Connections
Colleague Employee Colleague Employee
+++
MutualContactPhilippe
MutualContact
Catherine
+- - -
-
MutualContactEmile
MutualContact
Marc
If bandwidth story true, then: Stability of positive reputation increases with positive indirect, decreases with negative indirect (relations as info pipes) Stability of negative reputation increases with negative indirect, decreaess with positive indirect (relations as info pipes)
If echo story true, then Stability of positive reputation increases with positive or negative indirect (etiquette filter on info transmitted) Stability of negative reputation increases with positive or negative indirect (etiquette filter on info transmitted)

Stra
tegi
c Lea
ders
hip
Deliv
erin
g Va
lue:
The
Soc
ial C
apita
l of C
losu
re (p
age 4
5)
Stability of Positive and Negative ReputationsIncrease with Either Positive or Negative Closure.
Relations Are Balanced in Amplitude, not Direction;Reputations Are Defined by Network Echo, not Bandwidth.
Table 1 in Burt, "Gossip and reputation" in Management et Réseaux Sociaux, edited by edited by Marc Lecoutre and Pascal Lievre (2008 Hermes-Lavoisier, English language version on my website).
NOTE — These are regression models predicting reputation stability from this year to next using network variables measured this year. Stability is measured for an employee by the sub-correlation between reputation in adjacent years (vertical axis in Figure 2 of the source paper cited below, cf. pages 16 and 42 of this handout). Average number of mutual contacts (horizontal axis in Figure 2) are here log scores to capture the nonlinear association illustrated in Figure 2. T-tests in parentheses are adjusted for autocorrelation between repeated observations (using "cluster" option in STATA), but they are only a heuristic since routine statistical inference is not applicable for sub-sample correlations as a criterion variable (footnote 1 in the source paper cited below). * P < .05 ** P < .001
1 2 3 4 5 6
R2 .59 .50 .59 .45 .50 .51
Average Number of Mutual Contacts Linking Employee this Year with Colleagues
Number of Positive .77** (28.1) — .66**
(11.7) .67** (21.2) — .21**
(3.6)
Number of Negative — .71** (23.7)
.12* (2.2) — .70**
(23.3) .52** (8.7)
Predict Positive Reputations
(N = 899)
Predict Negative Reputations
(N = 797)
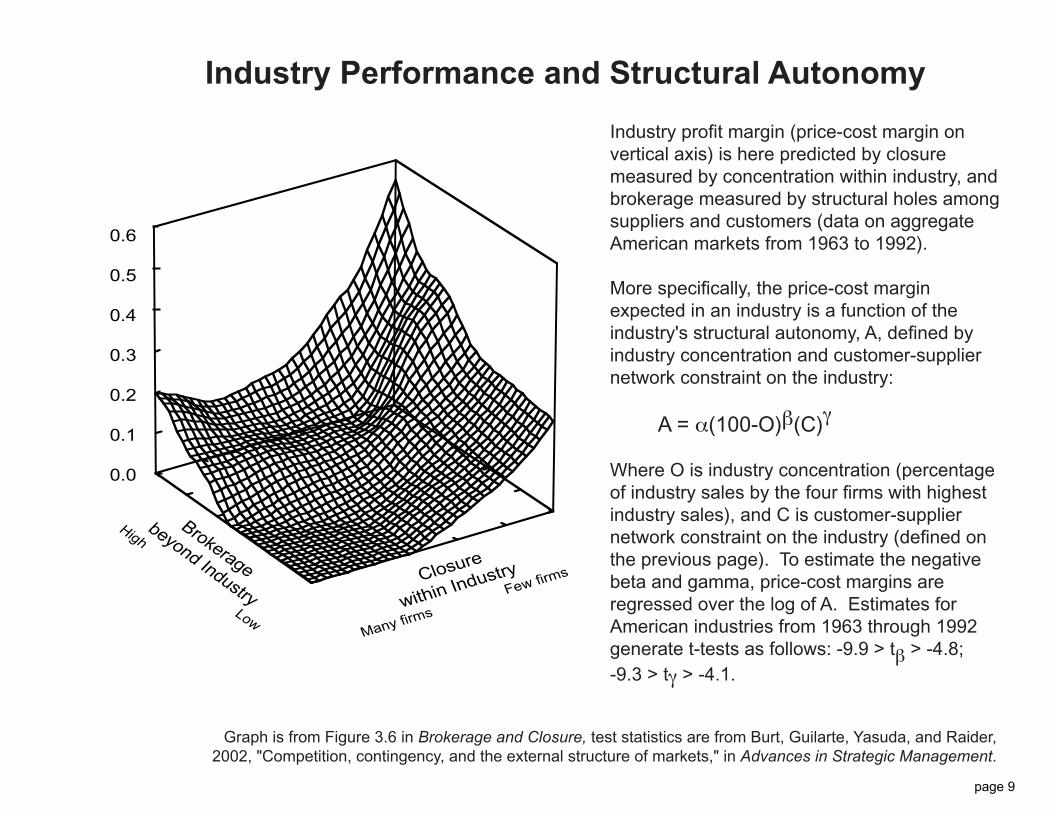
Industry Performance and Structural Autonomy
Industry profit margin (price-cost margin on vertical axis) is here predicted by closure measured by concentration within industry, and brokerage measured by structural holes among suppliers and customers (data on aggregate American markets from 1963 to 1992).
More specifically, the price-cost margin expected in an industry is a function of the industry's structural autonomy, A, defined by industry concentration and customer-supplier network constraint on the industry:
A = a(100-O)b(C)g
Where O is industry concentration (percentage of industry sales by the four firms with highest industry sales), and C is customer-supplier network constraint on the industry (defined on the previous page). To estimate the negative beta and gamma, price-cost margins are regressed over the log of A. Estimates for American industries from 1963 through 1992 generate t-tests as follows: -9.9 > tb > -4.8; -9.3 > tg > -4.1.
Graph is from Figure 3.6 in Brokerage and Closure, test statistics are from Burt, Guilarte, Yasuda, and Raider, 2002, "Competition, contingency, and the external structure of markets," in Advances in Strategic Management.
0.1
0.2
0.3
0.4
0.5
0.6
Internal
Brokerage
beyondIndustry
High
Low
Closure
within Industry
Many firms
Few firms
0.6
0.5
0.4
0.3
0.2
0.1
0.0
page 9
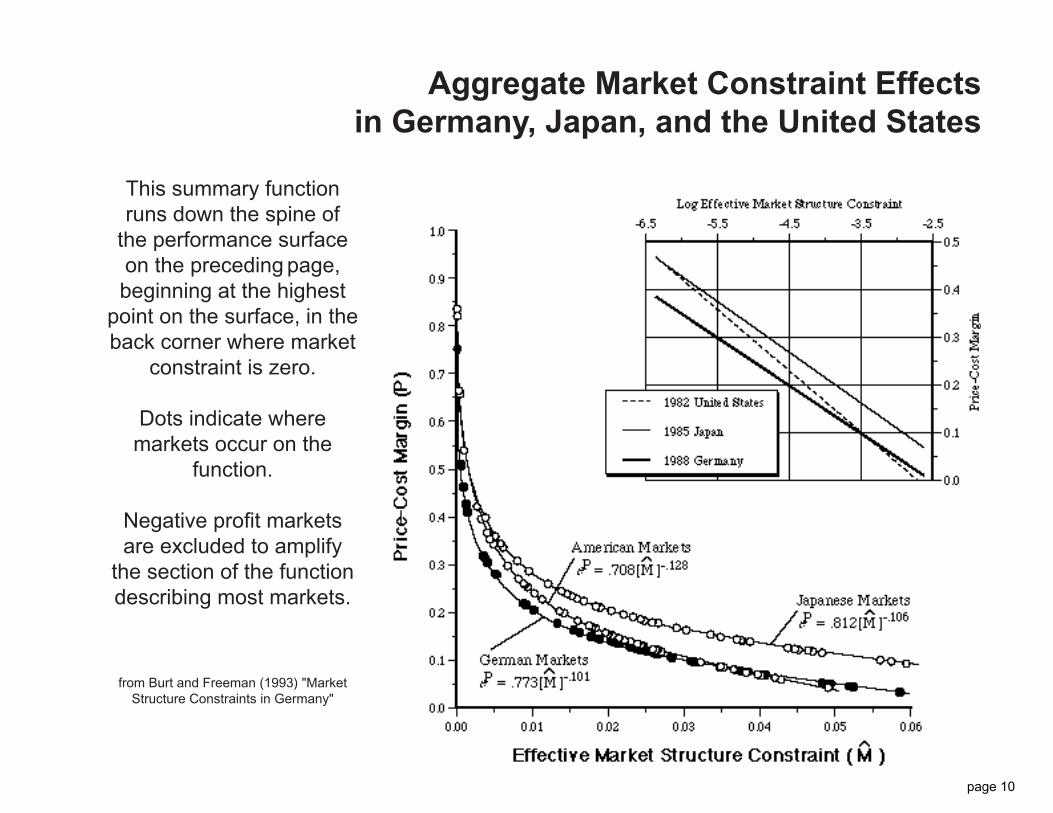
Aggregate Market Constraint Effectsin Germany, Japan, and the United States
This summary function runs down the spine of
the performance surface on the preceding page, beginning at the highest
point on the surface, in the back corner where market
constraint is zero.
Dots indicate where markets occur on the
function.
Negative profit markets are excluded to amplify
the section of the function describing most markets.
from Burt and Freeman (1993) "Market Structure Constraints in Germany"
page 10
Stra
tegi
c Lea
ders
hip
Deliv
erin
g Va
lue:
The
Soc
ial C
apita
l of C
losu
re (p
age 3
7)
Ronald S
. Burt is the
Hobart W
. William
sP
rofessor of Sociology
and Strategy at the
University of C
hicagoG
raduate School of
Business, and the S
hellP
rofessor of Hum
anR
esources at INS
EA
D.
His w
ork describesthe social structure ofcom
petition: network
mechanism
s that ordercareers, organizations,and m
arkets.
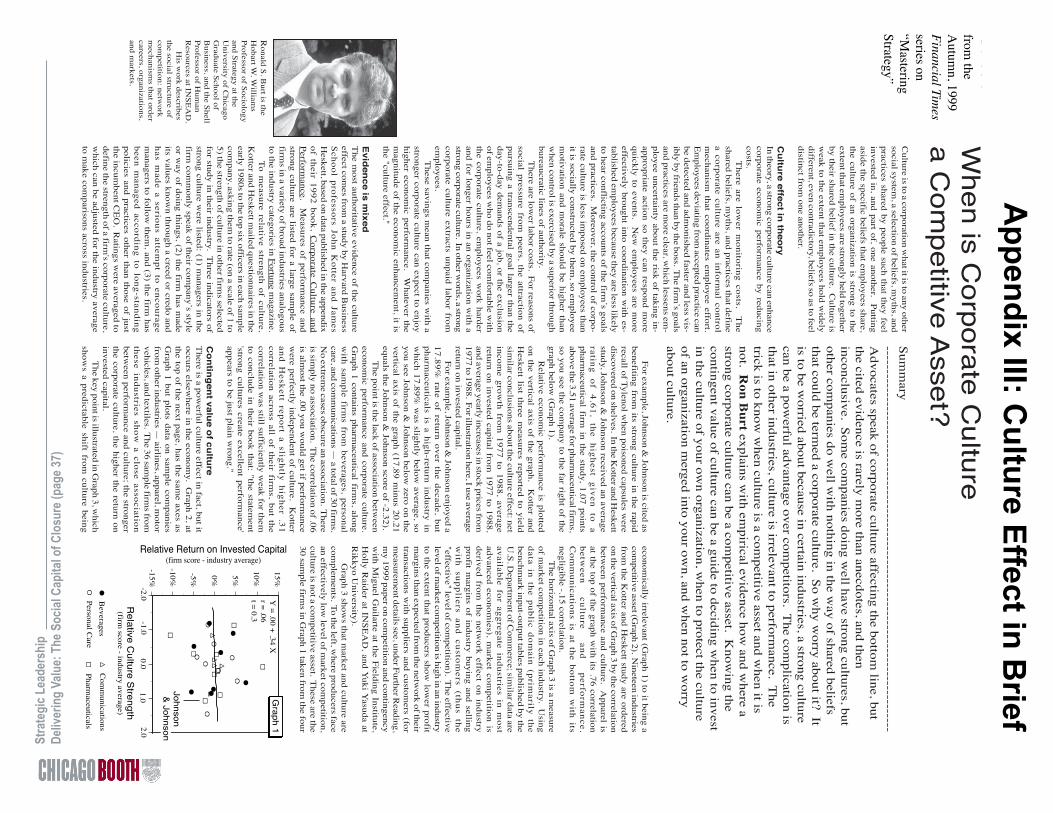
When is C
orporate Culture
a Com
petitive Asset?
Sum
mary
-----------------------------------------------------------------------------------A
dvocates speak of corporate culture affecting the bottom line, but
the cited evidence is rarely more than anecdotes, and then
inconclusive. Som
e companies doing w
ell have strong cultures, butother com
panies do well w
ith nothing in the way of shared beliefs
that could be termed a corporate culture. S
o why w
orry about it? Itis to be w
orried about because in certain industries, a strong culturecan be a pow
erful advantage over competitors. T
he complication is
that in other industries, culture is irrelevant to performance. T
hetrick is to know
when culture is a com
petitive asset and when it is
not. Ron B
urt explains with em
pirical evidence how and w
here astrong corporate culture can be a com
petitive asset. Know
ing thecontingent value of culture can be a guide to deciding w
hen to investin the culture of your ow
n organization, when to protect the culture
of an organization merged into your ow
n, and when not to w
orryabout culture.
Culture is to a corporation w
hat it is to any othersocial system
, a selection of beliefs, myths, and
practices shared by people such that they feelinvested in, and part of, one another. P
uttingaside the specific beliefs that em
ployees share,the culture of an organization is strong to theextent that em
ployees are strongly held togetherby their shared belief in the culture. C
ulture isw
eak to the extent that employees hold w
idelydifferent, even contradictory, beliefs so as to feeldistinct from
one another.
Culture effect in theory
In theory, a strong corporate culture can enhancecorporate econom
ic performance by reducing
costs.T
here are lo
wer m
on
itorin
g co
sts. Th
eshared beliefs, m
yths, and practices that definea co
rpo
rate cultu
re are an in
form
al con
trol
mech
anism
that co
ord
inates em
plo
yee effo
rt.E
mployees deviating from
accepted practice canbe detected and adm
onished faster and less vis-ibly by friends than by the boss. T
he firm’s goals
and practices are more clear, w
hich lessens em-
ployee uncertainty about the risk of taking in-ap
pro
priate actio
n so
they
can resp
on
d m
ore
qu
ickly
to ev
ents. N
ew em
plo
yees are m
ore
effectively brought into coordination with es-
tablished employees because they are less likely
to hear conflicting accounts of the firm’s goals
and practices. Moreover, the control of corpo-
rate culture is less imposed on em
ployees thanit is socially constructed by them
, so employee
motivation and m
orale should be higher thanw
hen control is exercised by a superior throughbureaucratic lines of authority.
There are low
er labor costs. For reasons of
social p
ressure fro
m p
eers, the attractio
n o
fpursuing a transcendental goal larger than theday-to-day dem
ands of a job, or the exclusionof em
ployees who do not feel com
fortable with
the corporate culture, employees w
ork harderand for longer hours in an organization w
ith astrong corporate culture. In other w
ords, a strongco
rpo
rate cultu
re extracts u
np
aid lab
or fro
mem
ployees.T
hese savings mean that com
panies with a
stronger corporate culture can expect to enjoyhigher econom
ic performance. W
hatever them
agnitude of the economic enhancem
ent, it isthe "culture effect."
Evidence is m
ixedT
he most authoritative evidence of the culture
effect comes from
a study by Harvard B
usinessS
cho
ol p
rofesso
rs Joh
n K
otter an
d Jam
esH
eskett, based on data published in the appendixo
f their 1
99
2 b
oo
k, C
orp
orate C
ultu
re and
Perfo
rman
ce. Measu
res of p
erform
ance an
dstrong culture are listed for a large sam
ple offirm
s in a variety of broad industries analogousto the industry categories in F
ortune magazine.
To
measu
re relative stren
gth
of cu
lture,
Kotter and H
eskett mailed questionnaires in the
early 1980s to the top six officers in each sample
company, asking them
to rate (on a scale of 1 to5) the strength of culture in other firm
s selectedfor study in their industry. T
hree indicators ofstrong culture w
ere listed: (1) managers in the
firm com
monly speak of their com
pany’s styleor w
ay of doing things, (2) the firm has m
adeits values know
n through a creed or credo andh
as mad
e a seriou
s attemp
t to en
cou
rage
managers to follow
them, and (3) the firm
hasb
een m
anag
ed acco
rdin
g to
lon
g-stan
din
gpolicies and practices other than those of justthe incum
bent CE
O. R
atings were averaged to
define the strength of a firm's corporate culture,
which can be adjusted for the industry average
to make com
parisons across industries.
For exam
ple, Johnson & Johnson is cited as
benefiting from its strong culture in the rapid
recall of Tylenol w
hen poisoned capsules were
discovered on shelves. In the Kotter and H
eskettstudy, Johnson &
Johnson received an averagera
ting
o
f 4
.61
, th
e
hig
he
st g
ive
n
to
ap
harm
aceutical firm
in th
e stud
y, 1.0
7 p
oin
tsabove the 3.51 average for pharm
aceutical firms,
so you see the company to the far right of the
graph below (G
raph 1).R
elative economic perform
ance is plottedon the vertical axis of the graph. K
otter andH
eskett list th
ree measu
res repo
rted to
yield
similar conclusions about the culture effect: net
inco
me g
row
th fro
m 1
97
7 to
19
88
, averag
ereturn on invested capital from
1977 to 1988,and average yearly increases in stock prices from1977 to 1988. F
or illustration here, I use averagereturn on invested capital.
For exam
ple, Johnson & Johnson enjoyed a
17
.89
% rate o
f return
ov
er the d
ecade, b
ut
ph
armaceu
ticals is a hig
h-retu
rn in
du
stry in
which 17.89%
was slightly below
average, soyou see Johnson &
Johnson below zero on the
vertical axis of the graph (17.89 minus 20.21
equals the Johnson & Johnson score of -2.32).
The point is the lack of association betw
eeneconom
ic performance and corporate culture.
Graph 1 contains pharm
aceutical firms, along
with
samp
le firms fro
m b
everag
es, perso
nal
care, and comm
unications — a total of 30 firm
s.N
o extreme cases obscure an association. T
hereis sim
ply no association. The correlation of .06
is almost the .00 you w
ould get if performance
were perfectly independent of culture. K
ottera
nd
He
ske
tt rep
ort a
sligh
tly h
igh
er .3
1co
rrelation
across all o
f their firm
s, bu
t the
correlation was still sufficiently w
eak for themto conclude in their book that: "the statem
ent'stro
ng
cultu
res create excellen
t perfo
rman
ce'appears to be just plain w
rong."
Contingent value of culture
There is a pow
erful culture effect in fact, but itoccurs elsew
here in the economy. G
raph 2, atthe top of the next page, has the sam
e axes asG
raph
1 b
ut p
lots d
ata on
samp
le com
pan
iesfrom
other industries — airlines, apparel, m
otorvehicles, and textiles. T
he 36 sample firm
s fromth
ese ind
ustries sh
ow
a close asso
ciation
between perform
ance and culture; the strongerthe corporate culture, the higher the return oninvested capital.
The key point is illustrated in G
raph 3, which
sho
ws a p
redictab
le shift fro
m cu
lture b
eing
economically irrelevant (G
raph 1) to it being acom
petitive asset (Graph 2). N
ineteen industriesfrom
the Kotter and H
eskett study are orderedon the vertical axis of G
raph 3 by the correlationbetw
een performance and culture. A
pparel isat the top of the graph w
ith its .76 correlationb
etw
ee
n
cu
lture
a
nd
p
erfo
rma
nc
e.
Co
mm
un
ication
s is at the b
otto
m w
ith its
negligible -.15 correlation.T
he horizontal axis of Graph 3 is a m
easureof m
arket competition in each industry. U
singd
ata in th
e pu
blic d
om
ain (p
rimarily
the
benchmark input-output tables published by the
U.S
. Departm
ent of Com
merce; sim
ilar data areav
ailable fo
r agg
regate in
du
stries in m
ost
adv
anced
econ
om
ies), mark
et com
petitio
n is
deriv
ed fro
m th
e netw
ork
effect on
ind
ustry
profit margins of industry buying and selling
with
su
pp
liers
an
d
cu
stom
ers
(thu
s th
e"effective" level of com
petition). The effective
level of market com
petition is high in an industryto the extent that producers show
lower profit
margins than expected from
the network of their
transactions with suppliers and custom
ers (form
easurement details see, under F
urther Reading,
my 1999 paper on com
petition and contingencyw
ith Miguel G
uilarte at the Fielding Institute,
Holly R
aider at INS
EA
D, and Y
uki Yasuda at
Rikkyo U
niversity). G
raph 3 shows that m
arket and culture arecom
plements. T
o the left, where producers face
an effectively low level of m
arket competition,
culture is not a competitive asset. T
hese are the30 sam
ple firms in G
raph 1 taken from the four
Relative C
ulture Strength
(firm score - industry average)
0.0-1.0
-2.01.0
2.0
Y =
.00 + .34 X
r = .06
t = 0.3
Beverages
Pharm
aceuticalsP
ersonal Care
Com
munications
Relative Return on Invested Capital(firm score - industry average)
15%
10%5%0%
-5%
-10%
-15%
Johnson &
Johnson
Graph 1
Scheduled to
appear in anA
utumn, 1999
series in theF
inancial Times
on Mastering
Strategy
from the
Autum
n, 1999Financial Tim
esseries on“M
asteringStrategy”
Appendix III: C
ulture Effect in Brief

Stra
tegi
c Lea
ders
hip
Deliv
erin
g Va
lue:
The
Soc
ial C
apita
l of C
losu
re (p
age 3
8)
Fu
rther read
ing
:
J. P. Kotter and J. L
Heskett (1992)
Corporate C
ulture andP
erformance.
R. S
. Burt, S
. M.
Gabbay, G
. Holt, and
P. Moran (1994)
"Contingent
organization as anetw
ork theory: theculture-perform
ancecontingency function,"A
cta Sociologica
37:345-370.
J. B. S
ørensen (1998)
"The strength of
corporate culture andthe reliability of firmperform
ance," (http://gsbw
ww
.uchicago.edu/fac/jesper.sorensen/research).
R. S
. Burt, M
. Guilarte,
H. J. R
aider and Y.Y
asuda (1999)"C
ompetition,
contingency, and theexternal structure ofm
arkets," (http://gsbw
ww
.uchicago.edu/fac/ronald.burt/research; also here isthe industry appendixfrom
which the results
in the box are taken).
industries en
closed
by a d
otted
line in
the lo
wer-
left of G
raph 3
. These are co
mplex
, dynam
icm
ark
ets su
ch
as th
e c
om
mu
nic
atio
ns a
nd
ph
arm
aceu
tical in
du
stries, in
wh
ich
pro
fitm
argin
s are good, b
ut co
mpan
ies hav
e to stay
nim
ble to
take ad
van
tage o
f the n
ext sh
ift in th
em
arket. T
here is co
mpetitio
n to
be su
re (see the
1999 p
aper), b
ut th
e poin
t here is th
at a strong
co
rpo
rate
cu
lture
is n
ot a
sso
cia
ted
with
econ
om
ic perfo
rman
ce. (My
colleag
ue at th
eU
niv
ersity
of C
hic
ag
o, Je
sper S
øren
sen
, has
studied
these firm
s over tim
e, and d
escribes in
his 1
998 p
aper o
n reliab
le perfo
rman
ce how
the
cultu
re effect is weak
er for firm
s more su
bject
to m
arket ch
ange.)
At th
e oth
er extrem
e, to th
e right in
Grap
h3, w
here p
roducers face an
effectively
hig
h lev
el
of m
ark
et c
om
petitio
n, c
ultu
re is c
lose
lyasso
ciated w
ith eco
nom
ic perfo
rman
ce. These
are the 3
6 sam
ple firm
s in G
raph 2
taken
from
the fo
ur in
dustries en
closed
by a d
otted
line in
the u
pper-rig
ht o
f Grap
h 3
. In th
ese industries
of
effe
ctiv
ely
h
igh
m
ark
et
co
mp
etitio
n,
pro
ducers are easily
substitu
ted fo
r one an
oth
er,su
ppliers, cu
stom
ers or fo
reign p
roducers are
strong, an
d m
argin
s are low
.
Co
ntin
gen
cy fun
ction
Be
twe
en
th
e
two
m
ark
et
ex
trem
es,
the
perfo
rman
ce effect of a stro
ng co
rporate cu
lture
incre
ase
s with
mark
et c
om
petitio
n. T
he
nonlin
ear regressio
n lin
e in G
raph 3
(the so
lidbold
line), can
be u
sed as a co
ntin
gen
cy fu
nctio
nd
esc
ribin
g h
ow
cu
lture
's effe
ct v
arie
s with
mark
et com
petitio
n. F
or an
y sp
ecific level o
fm
arket co
mpetitio
n o
n th
e horizo
ntal ax
is, the
co
ntin
gen
cy
fun
ctio
n d
efin
es a
n e
xp
ecte
dco
rrelation o
n th
e vertical ax
is betw
een cu
lture
strength
and eco
nom
ic perfo
rman
ce.S
ince in
dustry
scores o
n th
e horizo
ntal ax
isare co
mputed
from
data p
ublicly
availab
le on
all in
du
stries, th
e e
xp
ecte
d v
alu
e o
f a stro
ng
co
rpo
rate
cu
lture
in a
ny
ind
ustry
can
be
ex
trap
ola
ted
from
the c
on
ting
en
cy
fun
ctio
n.
Resu
lts for a selectio
n o
f industries are g
iven
inth
e box to
the rig
ht.
Th
e h
igh
co
rrela
tion
for th
e c
on
ting
en
cy
functio
n sh
ow
s that th
e functio
n is an
accurate
desc
riptio
n o
f cu
lture
's effe
ct in
the d
iverse
mark
ets (r = .8
5, fo
r details o
n d
erivin
g, an
dex
trapolatin
g fro
m, th
e contin
gen
cy fu
nctio
n see
my 1
994 article o
n co
ntin
gen
t org
anizatio
n w
ithS
hau
l Gab
bay
at T
ech
nio
n, G
erh
ard
Ho
lt at
INS
EA
D, a
nd
Pete
r Mo
ran
at th
e L
on
do
nB
usin
ess Sch
ool).
At th
e level o
f indiv
idual firm
s, 44%
of th
evarian
ce in co
mpan
y retu
rns to
invested
capital
can b
e pred
icted b
y th
e industry
in w
hich
they
prim
arily o
perate, an
d th
eir relative stren
gth
of
corp
orate cu
lture acco
unts fo
r anoth
er 23%
of
the v
ariance. C
ultu
re accounts fo
r half ag
ain
the p
erform
ance v
ariance d
escribed
by in
dustry
differen
ces!
Th
inkin
g strateg
ically abo
ut cu
lture
Co
ntin
gen
t valu
e is th
e m
ain
po
int h
ere
. Astro
ng
co
rpo
rate
cu
lture
is neith
er a
lway
sv
alu
ab
le, n
or a
lway
s irrele
van
t. Valu
e is
contin
gen
t on m
arket. A
strong co
rporate cu
lture
can
be a
po
werfu
l co
mp
etitiv
e a
sset in
aco
mm
od
ity m
ark
et. In
a c
om
ple
x, d
yn
am
icm
arket, o
n th
e oth
er han
d, cu
lture is irrelev
ant
to eco
nom
ic perfo
rman
ce.T
he c
on
ting
en
t valu
e o
f cu
lture
can
be a
guid
e to th
inkin
g strateg
ically ab
out cu
lture. T
he
more y
our co
mpan
y’s in
dustry
resembles a co
m-
modity
mark
et, the m
ore eco
nom
ic return
you
can ex
pect fro
m in
vestin
g in
a strong co
rporate
cultu
re. Furth
er, when
you m
erge w
ith a n
ewco
mpan
y, ask ab
out its in
dustry. If th
e industry
resembles a co
mm
odity
mark
et and th
e com
-p
an
y h
as n
o c
orp
ora
te c
ultu
re, th
en
the
com
pan
y's p
erform
ance w
ou
ld b
e hig
her if a
strong cu
lture w
ere instilled
. But if th
e indus-
try resem
bles a co
mm
odity
mark
et and th
e com
-pan
y alread
y h
as a strong co
rporate cu
lture, p
ayatten
tion to
the cu
lture b
ecause th
e com
pan
y's
perfo
rman
ce is som
e part d
ue to
its cultu
re. On
the o
ther h
and, if th
e com
pan
y o
perates in
a com
-plex
, dynam
ic mark
et, you are free to
integ
rateth
e com
pan
y in
to y
our o
wn w
ithout co
ncern
for
whatev
er cultu
re existed
befo
re becau
se cultu
reis irrelev
ant to
perfo
rman
ce in su
ch m
arkets.
Fin
al illustratio
n: co
nsid
er two co
nsu
ltants
assemblin
g resu
lts on th
e perfo
rman
ce effectsof a stro
ng co
rporate cu
lture. O
ne selects 1
0teleco
mm
unicatio
n firm
s for case an
alysis b
e-cau
se he w
ork
ed in
the in
dustry, an
d so
has g
ood
perso
nal co
ntacts th
ere. The o
ther co
nsu
ltant
selects 10 tex
tile firms.
Th
ese
are
two
reaso
nab
le a
nd
inte
restin
gpro
jects, with
a relatively
large n
um
ber o
f firms
for case an
alysis.
There is n
o n
eed to
read th
eir reports. T
he
first consu
ltant selected
an in
dustry
with
a low
effe
ctiv
e le
vel o
f mark
et c
om
petitio
n (th
eco
mm
un
icatio
ns in
du
stry is to
the fa
r left in
Grap
h 3
). A stro
ng co
rporate cu
lture is n
ot a
co
mp
etitiv
e a
sset in
such
co
mp
lex
, dy
nam
icin
dustries. T
his co
nsu
ltant w
ill find n
o ev
iden
ceof h
igher p
erform
ance in
strong-cu
lture firm
s,w
ill gen
eralize his resu
lts to co
nclu
de th
at the
cultu
re effect does n
ot ex
ist, then
earnestly
(since
he h
as research to
support h
is conclu
sion) ad
vise
clie
nt firm
s ag
ain
st wastin
g re
sou
rces o
nin
stitutio
nalizin
g a stro
ng co
rporate cu
lture.
The seco
nd co
nsu
ltant selected
an in
dustry
at the o
ther ex
treme o
f the co
ntin
gen
cy fu
nc-
tion. T
extile p
roducers face an
effectively
hig
hlev
el of m
arket co
mpetitio
n (th
ey ap
pear at th
efar rig
ht o
f Grap
h 3
). A stro
ng co
rporate cu
l-tu
re is a com
petitiv
e asset in su
ch in
dustries.
Th
is seco
nd
co
nsu
ltan
t will fin
d e
vid
en
ce o
fhig
her p
erform
ance in
strong-cu
lture firm
s, will
gen
eralize her resu
lts to co
nclu
de th
at perfo
r-m
ance d
epen
ds o
n d
evelo
pin
g a stro
ng co
rpo-
rate cultu
re, then
earnestly
(since sh
e too h
asresearch
to su
pport h
er conclu
sion) ad
vise cli-
ent firm
s to co
ncen
trate on in
stitutio
nalizin
g a
strong co
rporate cu
lture.
When
these co
nsu
ltants ap
pro
ach th
e same
clients, clien
ts will h
ear earnest, co
ntrad
ictory
results, an
d co
nclu
de th
at the ju
ry is still o
ut o
nco
rporate cu
lture. A
ll of th
ese peo
ple are d
raw-
ing reaso
nab
le conclu
sions w
ithin
the lim
its of
their ex
perien
ce. Nev
ertheless, all are w
rong;
simplistic in
their ig
noran
ce of th
e contin
gen
tvalu
e of a stro
ng co
rporate cu
lture.
-.47
Real estate &
rental
-.08
*C
om
mu
nicatio
ns (n
ot rad
io o
r TV
)-.0
8T
ob
acco0
.06
Bu
siness serv
ices0
.13
Op
tical, op
hth
almic &
ph
oto
grap
hic eq
uip
.0
.15
Ord
nan
ce & accesso
ries0
.16
*F
oo
d (b
everag
es)0
.19
Rad
io &
TV
bro
adcastin
g0
.20
Electric, g
as, water &
sanitary
services
0.2
2H
otels, p
erson
al & rep
air services
0.2
2*
Dru
gs, clean
ing
& to
ilet prep
aration
s0
.26
Sto
ne &
clay p
rod
ucts
0.2
7*
Aircraft &
parts
0.2
7A
mu
semen
ts0
.33
Co
nstru
ction
& m
inin
g eq
uip
men
t0
.38
*P
etroleu
m refin
ing
0.3
9*
Prin
ting
& p
ub
lishin
g0
.43
*P
aper &
allied p
rod
ucts (n
ot co
ntain
ers)0
.44
Wh
olesale trad
e0
.44
Rad
io, T
V &
com
mu
nicatio
n eq
uip
.0
.45
Electric lig
htin
g &
wirin
g eq
uip
.0
.47
Tran
spo
rtation
& w
areho
usin
g (n
ot airlin
es)0
.47
Eatin
g &
drin
kin
g p
laces0
.47
Mach
ines, m
aterials han
dlin
g0
.48
*C
hem
icals0
.48
Fu
rnitu
re (no
t ho
useh
old
)0
.48
Heatin
g, p
lum
bin
g &
struc. m
etals pro
du
cts0
.49
Farm
& g
arden
mach
inery
This is a selectio
n o
f industries fro
m th
e 1982 b
ench
mark
input-o
utp
ut tab
le publish
ed b
y th
e U.S
.D
epartm
ent o
f Com
merce. In
dustries are listed
in o
rder o
f the ex
tent to
which
a strong co
rporate
cultu
re is a com
petitiv
e asset. The fractio
n n
ext to
each in
dustry
is the co
rrelation (p
redicted
by th
eco
ntin
gen
cy fu
nctio
n) in
the in
dustry
betw
een cu
lture stren
gth
and eco
nom
ic perfo
rman
ce. Kotter
and H
eskett in
dustries are m
arked
with
an asterisk
(note h
ow
similar th
e pred
icted co
rrelations
belo
w are to
the co
rrelations in
Grap
h 3
that w
ere observ
ed in
the in
dustries).
0.4
9S
cientific &
con
trollin
g in
strum
ents
0.4
9*
Lum
ber &
wo
od p
rod
ucts (n
ot co
ntain
ers)0.4
9P
aints &
allied p
rod
ucts
0.5
3*
Fin
ance (b
ankin
g)
0.5
3*
Rubb
er & m
iscellaneo
us p
lastic pro
ducts
0.5
4*
Office, co
mp
utin
g &
accoun
ting m
achin
es0.5
7*
Plastics &
syn
thetic m
aterials0.5
8*
Foo
d (n
ot b
everag
es)0.5
8Jew
elry, sports, to
ys &
oth
er misc. m
anu.
0.6
0M
edical/ed
ucat. serv
ices & n
onp
rofit o
rgs.
0.6
2*
Retail trad
e (no
t eating
& d
rinkin
g p
laces)0.6
3F
inan
ce (bro
kers an
d in
suran
ce)0.6
5M
achin
es, metalw
ork
ing
0.6
6E
ngin
es & tu
rbin
es0.6
7H
ou
sehold
app
liances
0.6
9F
ootw
are & o
ther leath
er pro
ducts
0.7
0M
achin
es, gen
eral industry
0.7
0*
Mo
tor v
ehicles &
equ
ipm
ent
0.7
2E
lectrical ind
ustrial eq
uip
men
t0.7
2F
urn
iture (h
ou
sehold
)0.7
3*
Airlin
es0.7
4*
Ap
parel
0.7
4G
lass & g
lass pro
du
cts0.7
5E
lectronic co
mpon
ents &
accessories
0.7
9*
Fab
rics, yarn
& th
read m
ills0.7
9*
Tex
tile goo
ds &
floo
r coverin
gs
0.8
0S
crew m
achin
e pro
du
cts & stam
pin
gs
0.8
7M
achin
es, special in
dustry
Relative Return on Invested Capital(firm score - industry average)
Relative C
ulture Strength
(firm sco
re - industry
averag
e)
0.0
-1.0
-2.0
1.0
2.0
Y =
-.60 +
4.9
0 X
r = .7
2t =
5.8
Apparel
Tex
tilesM
oto
r Veh
icles
Airlin
e
15%
10%
5%
0%
-5%
-10%
-15%
Graph 2
Effective M
arket Co
mp
etition
with
in In
du
stry
Correlation within Industrybetween Performance and Strong Culture
0.0
0.1
0.2
0.3
0.4
0.5
0.6
0.7
0.8
textiles
airlines
apparel
ban
kin
g
food
chem
icals
perso
nal
care
publish
ing
com
municatio
ns
bev
erages
aerosp
ace
retail(o
ther)
lum
ber &
pap
er
retail(fo
od-d
rug)
com
puters
petro
leum
moto
r veh
iclesru
bber
pharm
aceuticals
-0.2 0
0.2
0.4
0.6
0.8
These four industries
contain the 30 sample firm
sdisplayed in G
raph 1.G
raph 3
Y =
.941 +
.312 ln
(1-X
)r =
.85
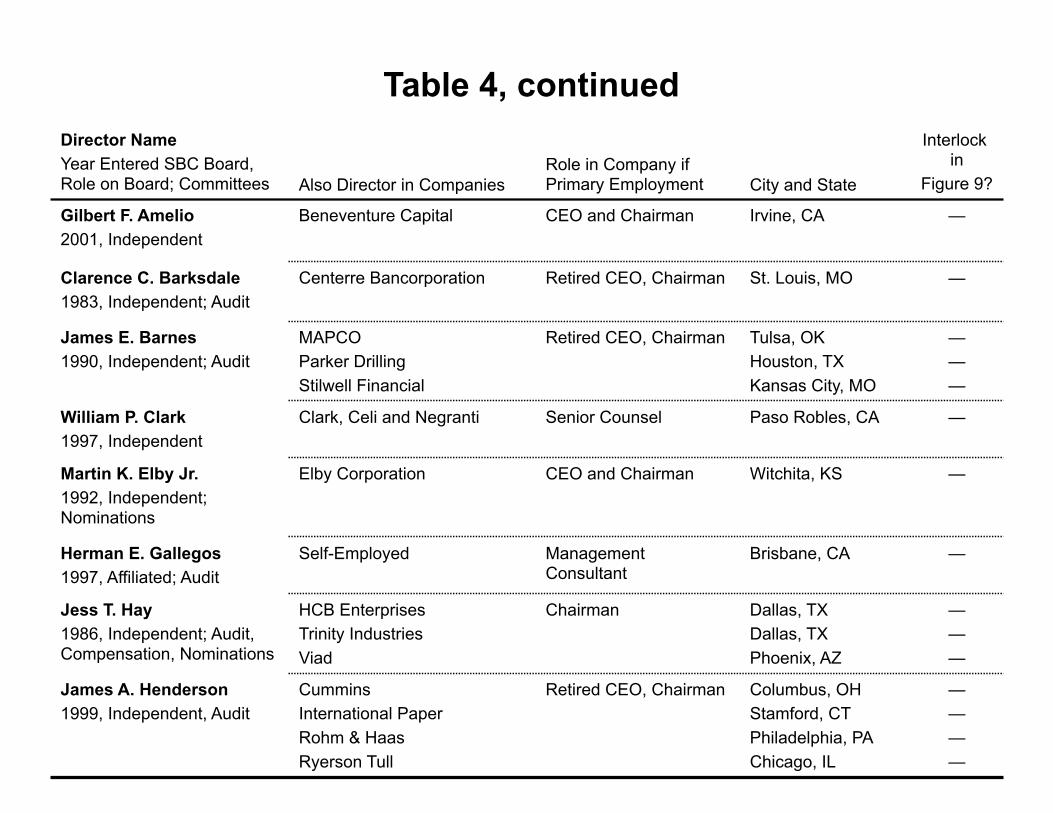
Director Name Year Entered SBC Board, Role on Board; Committees Also Director in Companies
Role in Company if Primary Employment City and State
Interlock in
Figure 9?
Gilbert F. Amelio 2001, Independent
Beneventure Capital CEO and Chairman Irvine, CA —
Clarence C. Barksdale 1983, Independent; Audit
Centerre Bancorporation Retired CEO, Chairman St. Louis, MO —
James E. Barnes 1990, Independent; Audit
MAPCO Parker Drilling Stilwell Financial
Retired CEO, Chairman Tulsa, OK Houston, TX Kansas City, MO
— — —
William P. Clark 1997, Independent
Clark, Celi and Negranti Senior Counsel Paso Robles, CA —
Martin K. Elby Jr. 1992, Independent; Nominations
Elby Corporation CEO and Chairman Witchita, KS —
Herman E. Gallegos 1997, Affiliated; Audit
Self-Employed Management Consultant
Brisbane, CA —
Jess T. Hay 1986, Independent; Audit, Compensation, Nominations
HCB Enterprises Trinity Industries Viad
Chairman Dallas, TX Dallas, TX Phoenix, AZ
— — —
James A. Henderson 1999, Independent, Audit
Cummins International Paper Rohm & Haas Ryerson Tull
Retired CEO, Chairman Columbus, OH Stamford, CT Philadelphia, PA Chicago, IL
— — — —
Table 4, continued
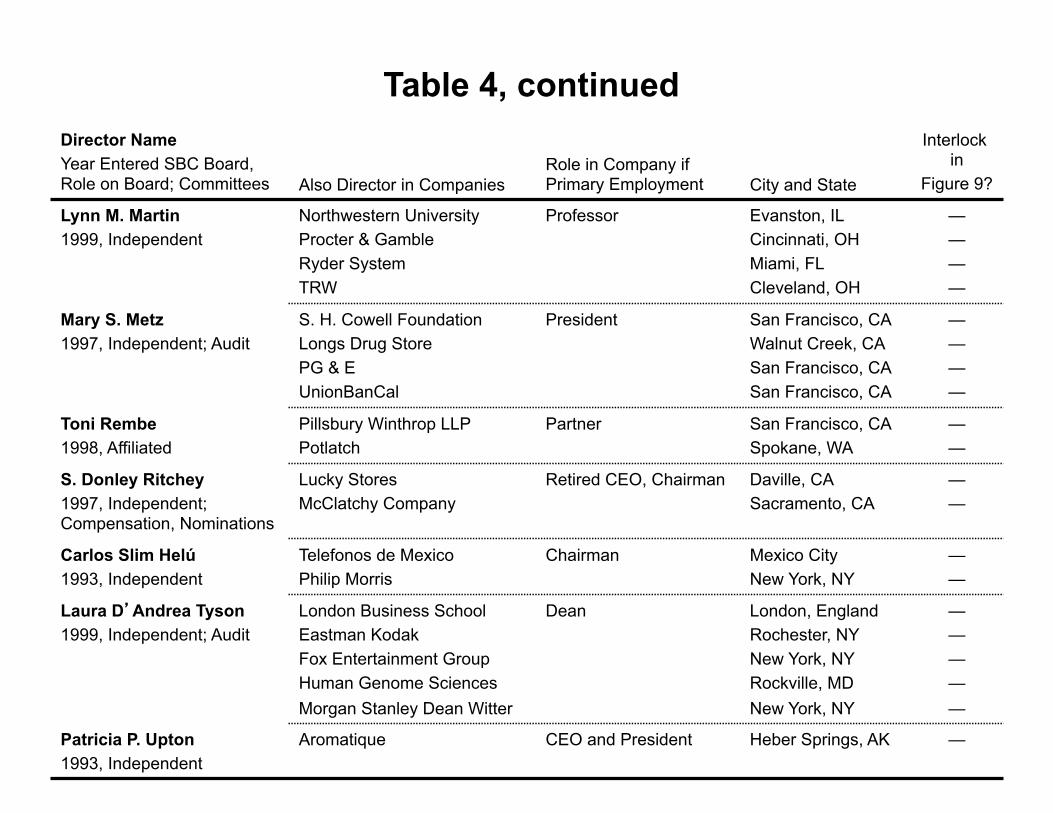
Director Name Year Entered SBC Board, Role on Board; Committees Also Director in Companies
Role in Company if Primary Employment City and State
Interlock in
Figure 9?
Lynn M. Martin 1999, Independent
Northwestern University Procter & Gamble Ryder System TRW
Professor Evanston, IL Cincinnati, OH Miami, FL Cleveland, OH
— — — —
Mary S. Metz 1997, Independent; Audit
S. H. Cowell Foundation Longs Drug Store PG & E UnionBanCal
President San Francisco, CA Walnut Creek, CA San Francisco, CA San Francisco, CA
— — — —
Toni Rembe 1998, Affiliated
Pillsbury Winthrop LLP Potlatch
Partner San Francisco, CA Spokane, WA
— —
S. Donley Ritchey 1997, Independent; Compensation, Nominations
Lucky Stores McClatchy Company
Retired CEO, Chairman Daville, CA Sacramento, CA
— —
Carlos Slim Helú 1993, Independent
Telefonos de Mexico Philip Morris
Chairman Mexico City New York, NY
— —
Laura D’Andrea Tyson 1999, Independent; Audit
London Business School Eastman Kodak Fox Entertainment Group Human Genome Sciences Morgan Stanley Dean Witter
Dean London, England Rochester, NY New York, NY Rockville, MD New York, NY
— — — — —
Patricia P. Upton 1993, Independent
Aromatique CEO and President Heber Springs, AK —
Table 4, continued
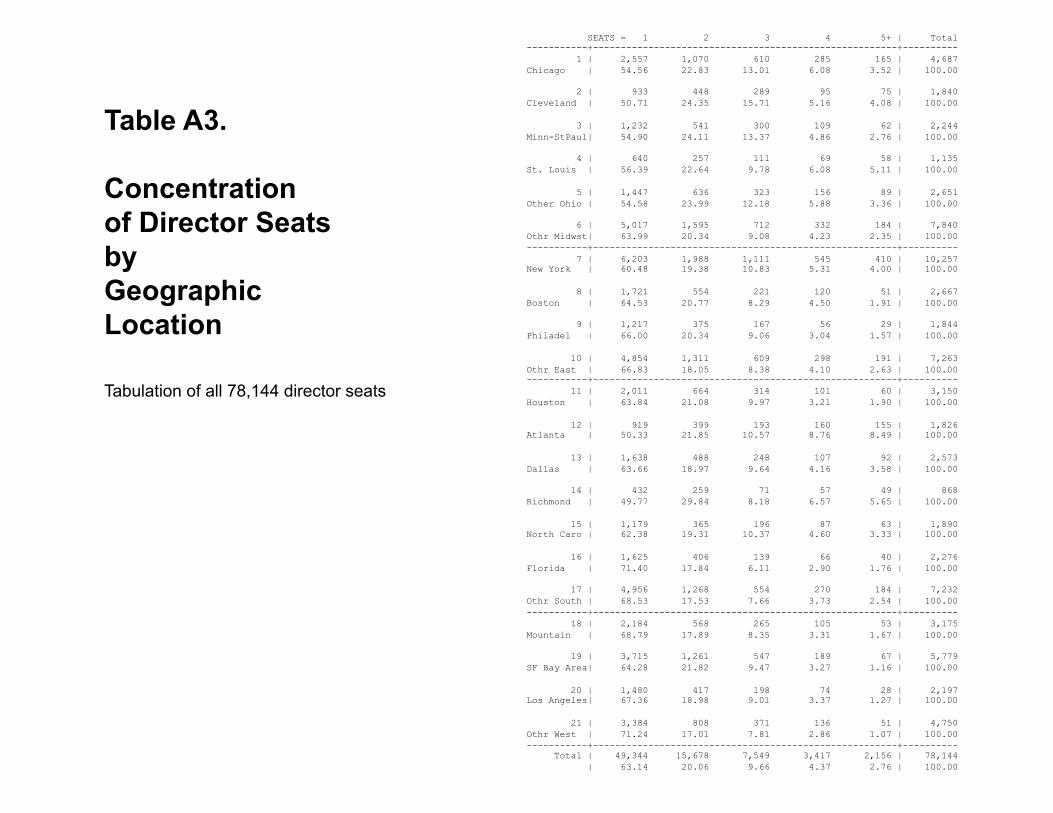
SEATS = 1 2 3 4 5+ | Total -----------+-------------------------------------------------------+---------- 1 | 2,557 1,070 610 285 165 | 4,687 Chicago | 54.56 22.83 13.01 6.08 3.52 | 100.00 2 | 933 448 289 95 75 | 1,840 Cleveland | 50.71 24.35 15.71 5.16 4.08 | 100.00 3 | 1,232 541 300 109 62 | 2,244 Minn-StPaul| 54.90 24.11 13.37 4.86 2.76 | 100.00 4 | 640 257 111 69 58 | 1,135 St. Louis | 56.39 22.64 9.78 6.08 5.11 | 100.00 5 | 1,447 636 323 156 89 | 2,651 Other Ohio | 54.58 23.99 12.18 5.88 3.36 | 100.00 6 | 5,017 1,595 712 332 184 | 7,840 Othr Midwst| 63.99 20.34 9.08 4.23 2.35 | 100.00 -----------+-------------------------------------------------------+---------- 7 | 6,203 1,988 1,111 545 410 | 10,257 New York | 60.48 19.38 10.83 5.31 4.00 | 100.00 8 | 1,721 554 221 120 51 | 2,667 Boston | 64.53 20.77 8.29 4.50 1.91 | 100.00 9 | 1,217 375 167 56 29 | 1,844 Philadel | 66.00 20.34 9.06 3.04 1.57 | 100.00 10 | 4,854 1,311 609 298 191 | 7,263 Othr East | 66.83 18.05 8.38 4.10 2.63 | 100.00 -----------+-------------------------------------------------------+---------- 11 | 2,011 664 314 101 60 | 3,150 Houston | 63.84 21.08 9.97 3.21 1.90 | 100.00 12 | 919 399 193 160 155 | 1,826 Atlanta | 50.33 21.85 10.57 8.76 8.49 | 100.00 13 | 1,638 488 248 107 92 | 2,573 Dallas | 63.66 18.97 9.64 4.16 3.58 | 100.00 14 | 432 259 71 57 49 | 868 Richmond | 49.77 29.84 8.18 6.57 5.65 | 100.00 15 | 1,179 365 196 87 63 | 1,890 North Caro | 62.38 19.31 10.37 4.60 3.33 | 100.00 16 | 1,625 406 139 66 40 | 2,276 Florida | 71.40 17.84 6.11 2.90 1.76 | 100.00 17 | 4,956 1,268 554 270 184 | 7,232 Othr South | 68.53 17.53 7.66 3.73 2.54 | 100.00 -----------+-------------------------------------------------------+---------- 18 | 2,184 568 265 105 53 | 3,175 Mountain | 68.79 17.89 8.35 3.31 1.67 | 100.00 19 | 3,715 1,261 547 189 67 | 5,779 SF Bay Area| 64.28 21.82 9.47 3.27 1.16 | 100.00 20 | 1,480 417 198 74 28 | 2,197 Los Angeles| 67.36 18.98 9.01 3.37 1.27 | 100.00 21 | 3,384 808 371 136 51 | 4,750 Othr West | 71.24 17.01 7.81 2.86 1.07 | 100.00 -----------+-------------------------------------------------------+---------- Total | 49,344 15,678 7,549 3,417 2,156 | 78,144 | 63.14 20.06 9.66 4.37 2.76 | 100.00!
Table A3. Concentration of Director Seats by Geographic Location Tabulation of all 78,144 director seats
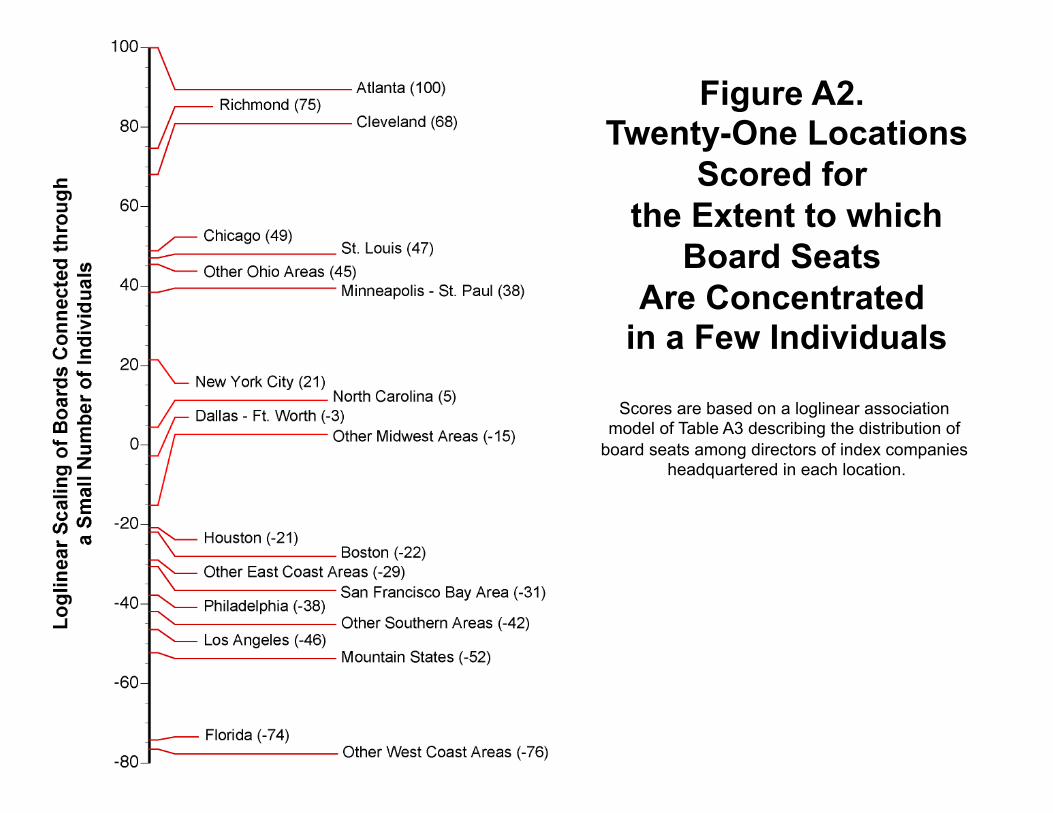
Figure A2. Twenty-One Locations
Scored for the Extent to which
Board Seats Are Concentrated
in a Few Individuals
Scores are based on a loglinear association model of Table A3 describing the distribution of
board seats among directors of index companies headquartered in each location.
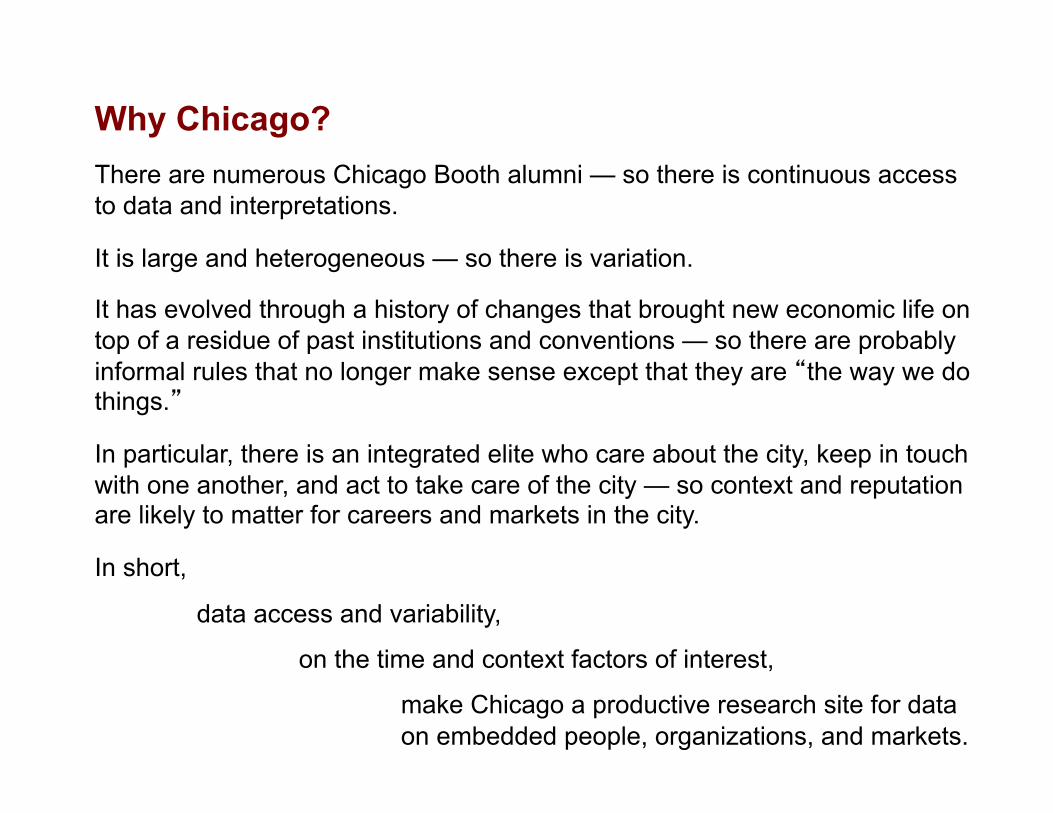
Why Chicago? There are numerous Chicago Booth alumni — so there is continuous access to data and interpretations.
It is large and heterogeneous — so there is variation.
It has evolved through a history of changes that brought new economic life on top of a residue of past institutions and conventions — so there are probably informal rules that no longer make sense except that they are “the way we do things.”
In particular, there is an integrated elite who care about the city, keep in touch with one another, and act to take care of the city — so context and reputation are likely to matter for careers and markets in the city.
In short,
data access and variability,
on the time and context factors of interest,
make Chicago a productive research site for data on embedded people, organizations, and markets.

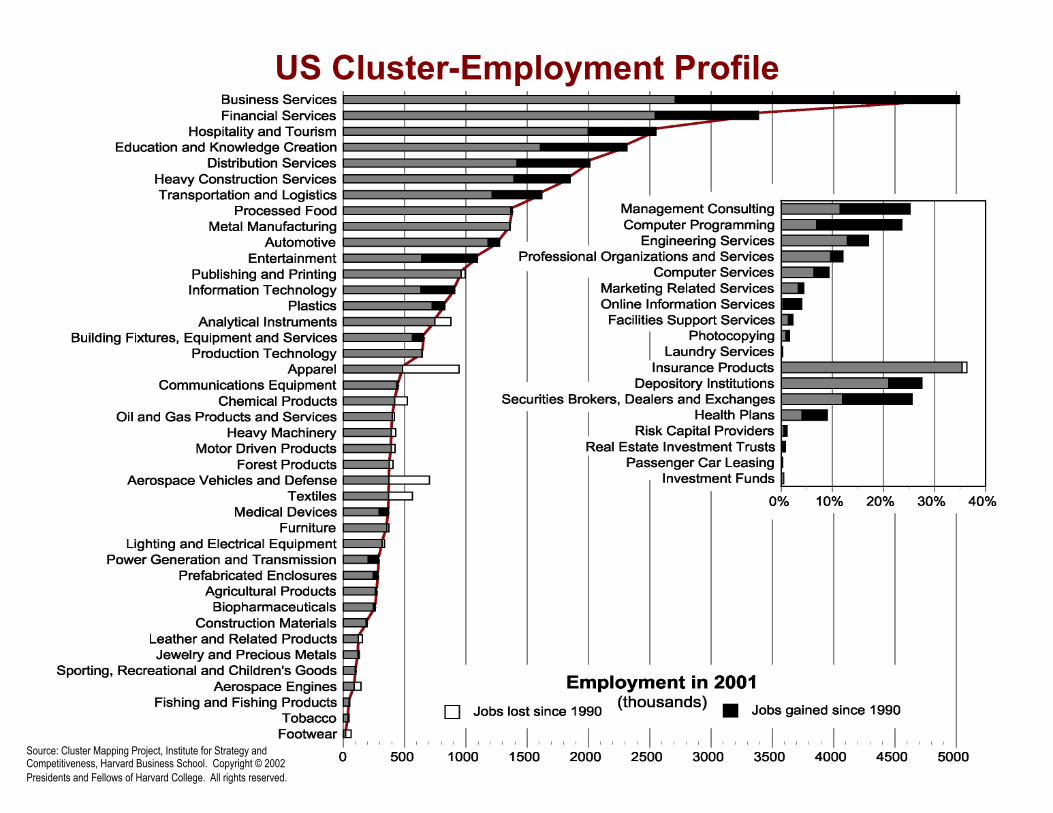
US Cluster-Employment Profile
Source: Cluster Mapping Project, Institute for Strategy and Competitiveness, Harvard Business School. Copyright © 2002 Presidents and Fellows of Harvard College. All rights reserved.
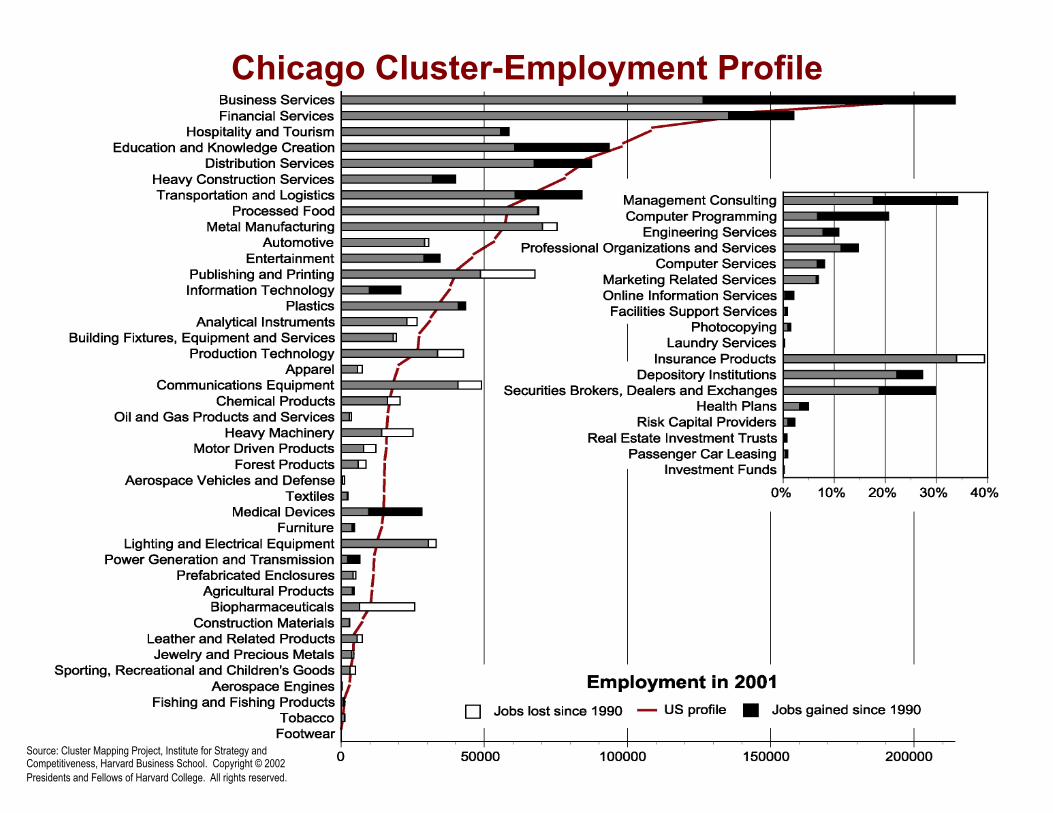
Chicago Cluster-Employment Profile
Source: Cluster Mapping Project, Institute for Strategy and Competitiveness, Harvard Business School. Copyright © 2002 Presidents and Fellows of Harvard College. All rights reserved.