republic of togo basic agricultural public …
TRANSCRIPT

REPUBLIC OF TOGO
BASIC AGRICULTURAL PUBLIC EXPENDITURE
DIAGNOSTIC REVIEW
FINAL REPORT
JANUARY 2012
CONTENTS
Pub
lic D
iscl
osur
e A
utho
rized
Pub
lic D
iscl
osur
e A
utho
rized
Pub
lic D
iscl
osur
e A
utho
rized
Pub
lic D
iscl
osur
e A
utho
rized

ii
ACCRONYMS AND ABBREVIATIONS ........................................................................... iii ACKNOWLEDGEMENTS ............................................................................................... viii EXECUTIVE SUMMARY .................................................................................................. ix
INTRODUCTION ................................................................................................................ 1
1. STRATEGIC AND INSTITUTIONAL CONTEXT .......................................................... 3
1.1. Strategic Context ..................................................................................................... 3
1.2. Institutional Framework............................................................................................ 6
2. LEVEL OF AGRICULTURAL PUBLIC EXPENDITURE ............................................. 10
2.1. MAEP Budget: General Overview ......................................................................... 10
2.2. Level and Evolution of the MAEP Provisional Budget, Excluding Feeder Roads ... 13
2.3. Level and Evolution of the MAEP Implemented Budget, Excluding Feeder Roads 16
2.4. Analysis of the Level of Support to the Agricultural Sector Using COFOG Methodology .......................................................................................................... 19
2.5. Analysis of the Level of Support to the Agricultural Sector, Including the Estimated Amount of the Fertilizer Subsidy ............................................................................ 23
2.6. Sources of Financing for Agricultural Public Expenditures .................................... 24
2.7. NGO-Implemented Public Expenditures and Cross-Industry Organizations ........... 25
2.8. Feeder Road Expenditures ..................................................................................... 26
2.9. Summary of Public Agricultural Expenditures—International Comparisons .......... 27
3. REGIONAL BREAKDOWN AND DISTRIBUTION OF PUBLIC AGRICULTURAL EXPENDITURE (ALLOCATIVE EFFICIENCY) .............................................................. 29
3.1 The Economic Breakdown of the MAEP Budget .................................................... 29
3.2 Operational Breakdown of the MAEP Budget ........................................................ 36
3.3 Regional Distribution of the MAEP Budget ............................................................ 45
4. TECHNICAL EFFICIENCY OF AGRICULTURE BUDGET PREPARATION, IMPLEMENTATION, AND MONITORING-EVALUATION PROCESSES ..................... 47
4.1. Technical Efficiency of Budget Programming ....................................................... 48
4.2. Technical Efficiency of Budget Implementation .................................................... 56
4.3. Monitoring & Evaluation ........................................................................................ 60
4.4. Appropriation of Projects by MAEP ....................................................................... 60
5. SPECIFIC INSTANCE OF AGRICULTURAL INPUTS, FOOD SECURITY (ANSAT), AND MECHANIZATION .................................................................................................. 62
5.1. Supply of Agricultural Inputs ................................................................................ 62
5.2. Food Security Strategy (ANSAT's role) .................................................................. 74
5.3. Farm Mechanization ............................................................................................... 78
6. THE INCIDENCE AND IMPACT OF AGRICULTURAL EXPENDITURES ............... 80
7. CONCLUSIONS AND RECOMMENDATIONS ........................................................... 82
REFERENCES ................................................................................................................... 85
APPENDIX 1: METHODOLOGY ...................................................................................... 89
APPENDIX 2: BASELINE DATA ..................................................................................... 95

iii
ACCRONYMS AND ABBREVIATIONS
AFD French Development Agency (Agence française de développement) AfDB African Development Bank
AFITO Agro-inputs Suppliers’ Association of Togo
(Association des Fournisseurs d'Intrants du Togo)
ANPAT National Association of Poultry Producers of Togo
(Association Nationale des producteurs Avicoles du Togo)
ANSAT National Agency for Food Security
(Association Nationale de Sécurité Alimentaire du Togo)
APAF Association for the Promotion of Agroforestry - NGO
(Association pour la Promotion de l'agroforesterie (ONG)) AU African Union
AVSF Agronomists and Veterinarians without Borders - NGO (Agronomes et
Vétérinaires Sans Frontière (ONG)) BADEA Arab Bank for Economic Development in Africa
(Banque arabe pour le développement économique en Afrique) BN/CRA Togo’s Regional and National Chambers of Agriculture
(Bureau National et Chambres Régionales d'Agriculture) CAADP Comprehensive Africa Agriculture Development Program
CAGIA Central Procurement and Management of Agricultural Inputs
(Central d’Approvisionnement et de Gestion des Intrants Agricoles) CAON National Authorizing Officer Support Unit
(Cellule d’Appui à l’Ordonnateur National) CCFC Coordinating Committee for the Coffee and Cocoa Sectors
(Comité de Coordination pour les Filières de Café-Cacao) CDP Community Development Project CET Common External Tariff CGIAR Consultative Group on International Agricultural Research CIDR International Center for Rural Development
(Centre International de Développement Rural ) CIF Cost, Insurance and Freight
CN/CMLA National Committee for the International Fight Against Hunger (Comité National pour la Campagne Mondiale de Lutte pour
l’Alimentation) COFOG Classification of the Functions of Government CPC Togo Organization of Grain Producers
(Centrale des Producteurs de Céréales du Togo) CPM Procurement Commission (Commission de Passation des Marchés) DA/MAEP MAEP Agricultural Directorate (Direction de l’Agriculture du MAEP) DAE/MEF MAEF Economic Directorate (Direction des Affaires Economiques du
MEF) DAER/MAEP MAEP MAEP Rural Landscape Land Development and Equipment
Directorate (Direction de l’Aménagement et de l’Equipement Rural du
MAEP) DAF/MAEP MAEP Directorate of Administration and Financial Affairs (Direction
de l’Administration et des Finances du MAEP) DB/MEF Budget Directorate of the Ministry of Economy and Finance

iv
(Direction du Budget du MEF) DCEP Directorate of Control and Implementation of the MEF National Plan
(Direction de Contrôle et de l’Exécution du Plan du MEF) DCF/MEF MEF Directorate of Financial Affairs
(Direction du Contrôle Financier du MEF) DE/MAEP MAEP Directorate of Livestock
(Direction de l’Elevage du MAEP)
DF/MEF MEF Directorate for Financial Affairs
(Direction des Finances du MEF)
DNCMP/MEF MEF National Directorate of Public Procurement Monitoring (Direction Nationale de Contrôle des Marchés Publics du MEF)
DP Development Partners DPA/MAEP MAEP Directorate of Fisheries and Aquaculture
(Direction des Pêches et Aquaculture du MAEP) DPAC Directorate for Planning and Agricultural Cooperation DPAEP Prefectural Directorate of Agriculture, Livestock and Fisheries
(Direction Préfectorale de l’Agriculture, de l’Elevage et de la Pêche) DPV/MAEP MAEP Directorate for Plant Protection
(Direction de la Protection des Végétaux du MAEP) DRH/MAEP MAEP Human Resources Directorate
(Direction des Ressources Humaines du MAEP)
DS/MAEP MAEP Directorate for Seeds (Direction des Semences du MAEP)
DSID/MAEP MAEP Directorate for Agricultural Statistics, Data Processing and Documentation (Direction des Statistiques Agricoles, de l’Informatique et de la
Documentation du MAEP) EAF Expenditure Authorization Form
EBID ECOWAS Bank for Investment and Development ECOWAP ECOWAS Agricultural Policy
ECOWAS Economic Community of West African States EDF European Development Fund EFSP Emergency Food Security Program ESOP Service Providers to Producers’ Organizations
(Entreprise de Services aux Organisations de Producteurs) ETD Enterprises Territories and Development –NGO EU European Union FAO Food and Agricultural Organization FCFA CFA Franc FNGPC Togo Federation of Cotton Producers’ Groups
(Fédération Nationale des Groupements de Producteurs de Coton) FO Farmer Organisation FONGTO Federation of Non-Governmental Organizations in Togo FUCEC Federation of Unions of Credit and Savings Cooperatives
(Faîtière des Unités d’Epargne et de Crédit du Togo) FUPROCAT Togo Federation of Coffee and Cocoa Producers’ Unions
v
(Fédération des Unions de Groupements de Producteurs de Café et de
Cacao du Togo) GAFSP Global Agriculture and Food Security Program GDP Gross Domestic Product GDPAS Group of Development Partners for the Agricultural Sector (Groupe des
Partenaires Techniques et Financiers pour le Secteur Agricole) GFRP Global Food Crisis Response Program GoT State of Togo ICAT Technical Assistance and Support Institute (Institut de Conseil et
d’Appui Technique) IDA International Development Association IFAD International Fund for Agricultural Development IFC International Finance Corporation IFMIS Integrated Financial Management Information System IFPRI International Food Policy Institute IMF International Monetary Fund INADES African Institute for Economic and Social Development – NGO
(Institut Africain pour le Développement Economique et Sociale
(ONG)) INFA National Institute for Agricultural Training in Tové
(Institut National de Formation Agricole de Tové) IPRSP Interim Poverty Reduction Strategy Paper
IsDB Islamic Development Bank ITRA Agronomical Research Institute of Togo
(Institut Togolais de Recherche Agronomique) LORLF Organic Law relating to Public Finance Laws
(Loi Organique Relative aux Lois de Finances) M&E Monitoring and Evaluation MAEP Ministry of Agriculture, Livestock and Fisheries MDB Ministry in Charge of Grassroots Development
(Ministère du Développement à la Base) MDGs Millennium Development Goals
MDMAEPIR Delegated Ministry to the MAEP in Charge of Rural Infrastructures MEF Ministry of Economy and Finance MERF Ministry of Environment and Forest Resources MFI Microfinance Institution MOF Mutual Obligations Framework (STABEX EU/EDF) MPDAT Ministry of Planning, Development and Land Use Planning
(Ministère de la Planification, du Développement et de
l’Aménagement du Territoire) MTEF Medium Term Expenditure Framework MTP Ministry of Public Works
(Ministère des Travaux Publics) NEPAD New Partnership for Africa’s Development NFSP National Food Security Program NSCT New Parastatal Togo Cotton Company
(Nouvelle Société Cotonnière du Togo) O & M Operations and Maintenance

vi
ODEF Office for the Development and Exploitation of Forests (Office de Développment et d’Exploitation Forestière)
ONAF National Slaughterhouse and Cold Chain Equipment Office (Office National des Abattoirs et Frigorifiques)
OSAT Togo Food Safety Observatory (Observatoire de la Sécurité Alimentaire au Togo)
PADAT Togo Rural Development Support Project (Projet d’Appui au Développement Agricole au Togo)
PAFVI Support Program for Village level Agroforestry and Forestry Initiatives in Southwest Togo (Programme d’Appui aux Initiatives d’Agroforesterie et de
Foresterie Villageoise dans le Sud-Ouest du Togo) PAI Institutional Support Program
(Programme d’Appui Institutionnel) PARTAM Development and Rehabilitation Project for Agricultural Lands in the
Mission-Tové Area (Projet d’Aménagement et Réhabilitation des Terres Agricoles dans la
Zone Mission-Tové) PASA Togo Agriculture Sector Support Project
(Projet d’Appui au Secteur Agricole) PBVM Irrigation Development Project in the Lower Valley of the Mono
River (Projet d’Aménagement Hydro-Agricole de la Basse Vallée du Fleuve
Mono) PDRI Integrated Rural Development Project
(Projet de Développement Rural Intégré) PEFA Public Expenditure and Financial Accountability PEMFAR Public Expenditure Management and Fiduciary Assessment Review PGT General Pay Office of the Treasury
(Paierie Générale du Trésor) PMU Project Management Unit PNASA National Agricultural Support Program
(Programme Nationale d’Appui au Secteur Agricole) PNIA National Agricultural Investment Program
(Programme Nationale d’Investissement Agricole) PNIASA National Agricultural and Food Security Investment Program
(Programme Nationale d’Investissements Agricoles et de Sécurité
Alimentaire) PPF Project Preparation Facility PPMR Pluriannual Micro-projects Program
(Programmes Pluriannuel de Micro-Réalisations) PPRA Public Procurement Regulatory Authority (Commission de Contrôle des
Marchés Publics) PRMP Procurement Officer
(Personne Responsable des Marchés Publics) PRSP-F Poverty Reduction Strategy Paper-Full PSAEG Support Program for Economic Activities and Producer Associations
(Programme de Soutien aux Activités Economiques et aux
Groupements) R&D Research and Development

vii
RAFIA Research, Advice and Training for Self-development Initiatives - NGO (Recherche, Appui et Formation aux Initiatives d’Auto-
développement) RBM Results-based Management ReSAKSS Regional Strategic Analysis and Knowledge Support System RI Internal Resources
(Ressources Internes) SFD Saudi Fund for Development SG/MAEP General Secretariat of the MAEP SOTOCO Togo National Cotton Company
(Société Togolaise du Coton) SWAp Sector Wide Approach TTL Task Team Leader UNDP United Nations Development Program UONGTO Union of NGOs in Togo
(Union des ONG du Togo) USD US Dollar WAAPP West Africa Agricultural Productivity Program
WADB West African Development Bank WAEMU West African Economic and Monetary Union WAGES Women and Associations for Gain both Economic and Social (IMF)
viii
ACKNOWLEDGEMENTS
1. The report summarizes the conclusions of a team of World Bank consultants who travelled to Lomé from May 1 through 27 and September 19 through October 7, 2011 to support the Ministère de l’Agriculture, de l’Elevage et de la Pêche (MAEP) in carrying out a basic agricultural public expenditure diagnostic review. This team was composed of Mr. Ekoué Assiongbon and Mr. Joël Hourticq (Agricultural Economists, consultants), assisted by Mrs. Esinam Hlomador (Program Assistant, Lomé Office of the World Bank). Mrs. Irina Ramniceanu (Economist, World Bank AFTAR), joined the mission from May 23 through 27, 2011.
2. A Technical Committee was established, bringing together the focal points of the MAEP, the Ministère de l’Economie et des Finances (MEF) and the Ministère de la Planification, du
Développement et de l’Aménagement du Territoire (MPDAT) and the consultants. During the first mission, this Technical Committee held daily working sessions to guide the work which additionally benefitted from the supervision of Mr. Mindi Lamboni, Secretary General of MAEP. MAEP held a Launch Workshop on May 12, 2011, presided over by His Excellency Mr. Kossi Messan Ewovor, Minister of Agriculture, Livestock Farming and Fisheries, with the participation of the Resident Representative of the World Bank, the Deputy Minister for Rural Infrastructures and representatives of the relevant government agencies as well as the civil society and the Development Partners (DP). These various consultative processes produced a map of the stakeholders working in the agricultural sector, with whom the consultants later met individually.
3. A videoconference held on July 15, 2011, brought together the MAEP executives, the Advisor to the President of Togo for Planning and M&E, representatives of the World Bank and the consultants to discuss the progress of the works and exchange ideas on the initial findings of the analysis so that they could provide inputs into launching the PASA, PPAAO/WAAP and PADAT projects, as well as the budget planning process for 2012.
4. Lastly, a Final Presentation Workshop and Discussion of Conclusions was held on October 3, 2011 at the Lomé Ibis Hotel, presided over by His Excellency Mr. Kossi Messan Ewovor and in the presence of representatives of the relevant government services, the civil society and the DPs.
5. The consultants express their gratitude to the Togolese authorities, the DPs and other non-governmental partners for the warm welcome, their availability and excellent collaboration.
6. The consultants also thank Mrs. Irina Ramniceanu (Economist, World Bank AFTAR), Mr. Stephen Mink (TTL, Principal Economist, World Bank AFTSN) and Mr. Christian Berger (Principal Agricultural Specialist, PASA Project Manager, World Bank AFTAR) for their continued support, advice and comments.
7. This Review is the work of the Program for Strengthening National Comprehensive Agricultural Public Expenditure in Sub-Saharan Africa and is jointly financed by the Bill and Melinda Gates Foundation and the Multi-donor Trust Fund of the CAADP and implemented by the World Bank.

ix
EXECUTIVE SUMMARY
i. In 2007, after fifteen years of economic stagnation caused by the socio-political
unrest that disrupted the country from 1990 to 2005, during which time most
international aid was suspended, Togo entered a phase of political stability and
economic renewal. In July 2009 Togo was the first country in West Africa, and the second
after Rwanda in sub-Saharan Africa, to sign its CAADP Compact. The implementation of the
Togolese CAADP builds on the National Program for Agricultural Investment and Food
Security (PNIASA) which is beginning to gain ground through the launch of three major
projects: the Support Project for the Agricultural Sector (PASA), the West African
Agricultural Productivity Program (WAAPP), and the Support Project for Agricultural
Development in Togo (PADAT).
ii. As part of its stimulation of agricultural development, the Government of Togo
(GoT) has launched a review of public agriculture expenditure to learn from past
budgetary implementation in this sector and thereby improve future program
performance. Following a request by the Ministry of Agriculture, Livestock, and Fisheries
(MAEP), the NEPAD Planning and Coordination Agency designated Togo to carry out this
exercise. This review was undertaken by the Program for Strengthening National
Comprehensive Agricultural Public Expenditure in Sub-Saharan Africa, jointly financed by
the Bill and Melinda Gates Foundation and the CAADP Multi-Donor Trust Fund, and
implemented by the World Bank.
iii. The objectives of the Analytical Review of Basic Public Expenditures in the
Agricultural Sector in Togo are as follows:
a) to more accurately assess the country’s performance with respect to the
Maputo Declaration of 2003;
b) to learn from the lessons of the past in terms of budget implementation in the
agricultural sector to improve future program performance;
c) to improve the awareness of the GoT and its DPs of the sector’s absorption
capacity so that a decision can then be reached on increasing the financial
resources allocated to agricultural development;
d) to promote ownership of the review process for public expenditures within
MAEP, with the more general goal of strengthening its monitoring and
evaluation capacity (M&E).
iv. The study focused on the 2002−2011 period.
Levels of Agricultural Public Expenditures

x
v. From 2002 to 2011, the provisional MAEP budget, excluding feeder roads,1
increased 3.5 times at current values, increasing from 7 to 25 billion CFA francs. In
constant values, it increased by a factor of 3. It increased slightly more rapidly than the
State’s national budget.
Figure E1. Breakdown of extraordinary items in the MAEP budget, excluding feeder
roads, at current values, 2002−2011
Source: Authors’ calculations based on data provided by the DAF/MAEP, the DB/MEF, the DF/MEF, and the
DCEP/MEF
vi. The individualization of exceptional items in the budget (repayment of SOTOCO
debts, participation in NSCT equity, replenishing the fund for fertilizer purchase, projects
included in error, etc.) bring to light that, from 2010, the core budget has grown
significantly (Figure E1), which is evidence of the strong political will to give further
support to this sector.
vii. However, the budget implementation rate is far lower than the budget
implementation rate of the national budget (56% versus 77% on average for the period
under discussion) and this means that public agricultural expenditures, estimated in
terms of NEPAD’s2 COFOG methodology, in 2010 only amounted to 6.4% of the State’s
1 Feeder roads are dealt with separately in this analysis for two reasons; (i) firstly, they are not included in the analysis to conform with the COFOG methodology prescribed by NEPAD (see below); (ii) secondly, they are not part of the function of the Ministries in charge of agriculture in all countries (in fact, even in Togo, they were allocated to the Ministry of Infrastructure and Public Works until 2010); to include them in the MAEP budget would make international comparisons ineffective, especially since they have come to represent significant amounts over the past few years. 2 A memorandum on NEPAD methodology has stipulated how agricultural expenditures in national budgets should be calculated (AU/NEPAD 2005): effective public expenditures (not budget allocations) should be taken into account as defined by the United Nations Classification of the Functions of Government (COFOG) in the expanded agricultural sector including the spheres of agriculture, forestry, hunting, and fisheries. Research expenditures carried out in all of these sectors must also be incorporated. On the other hand, expenditures on feeder roads do not feature in expenditures covered by NEPAD. The budgets implemented by MAEP were thus
0
5
10
15
20
25
30
35
40
2002 2003 2004 2005 2006 2007 2008 2009 2010 2011Bill
ions o
f C
FA
fra
ncs
IsDB Mô misreported amount
Food Facility EU
Replenishing of grain purchasingaccount
Replenishing of fertilizer andseed purchasing account
NSCT capital
Reimbursememt of SOTOCOdebts
Core budget

xi
total expenditure, thus less than the target set by the 2003 Maputo Declaration. The MAEP
budget increase starting in 2010 will have to be continued and accompanied by a major
improvement in the effectiveness of budget implementation.
Table E1: Estimate of public agricultural expenditures implemented in terms of
NEPAD’s COFOG methodology, 2010 and 2011 estimates (billions of CFA francs)
2010 2011
(prov.)
MAEP on-budget, excluding feeder roads 15.2 25.3
Under MAEP supervision, off State budget 6.1 1.9
Under the supervision of other Ministries
MPDAT
MDB
Subtotal
0.2
1.6
1.8
0.1
1.3
1.4
MERF forests and agriculture 1.8 2.8
Total 24.8 31.4
% Implemented State budget 6.4% 5.7%
Source: authors’ calculations based on data provided by: DAF/MAEP, DPAC/MAEP, CAGIA, ICAT, ITRA, MERF, DF/MEF, MBD, AFD, FAO, UNDP, Embassy of China; EU 2004; EU 2007; EU 2011b
viii. In 2010 agriculture’s share of the national budget was broken down into its different
components as follows: MAEP budget: 4.2%; off-budget MAEP items: 1.6%; other
ministries: 0.5%; MERF: 0.5% (Table E1).
ix. The 6.4% proportion allocated to agriculture in 2010 from the national budget was
calculated taking into account Government spending on the purchase of fertilizer. This
fertilizer was then sold to farmers at prices below the cost of importation and distribution; the
real cost for the State was therefore the net amount of the subsidy, estimated in 2010 at
approximately 600 million CFA francs. By taking the estimated subsidy amount into
account, and not the amount actually spent on the purchase of fertilizer, the proportion,
in 2010, of the State’s budget allocated to agriculture is 5.7%.
x. Agricultural public expenditures, excluding feeder roads and forestry, were
financed for the 2002−2010 period at 64% from internal resources (RI) and 36% from
external resources (RE, detailed in Figure E2). This ratio shows that a large number of
calculated excluding feeder road expenditures, taking into account State expenditures on off-budget items overseen by MAEP (STABEX programs, the CSP agricultural component, co-operation with China, etc.), agricultural expenditures by other Ministries (Ministry of Planning, Development and Land Use (MPDAT), and the Ministry of Basic Development (MDB), and the portion of the budgets implemented by the Ministry of the Environment and Forestry (MERF) attributable to forestry development.
xii
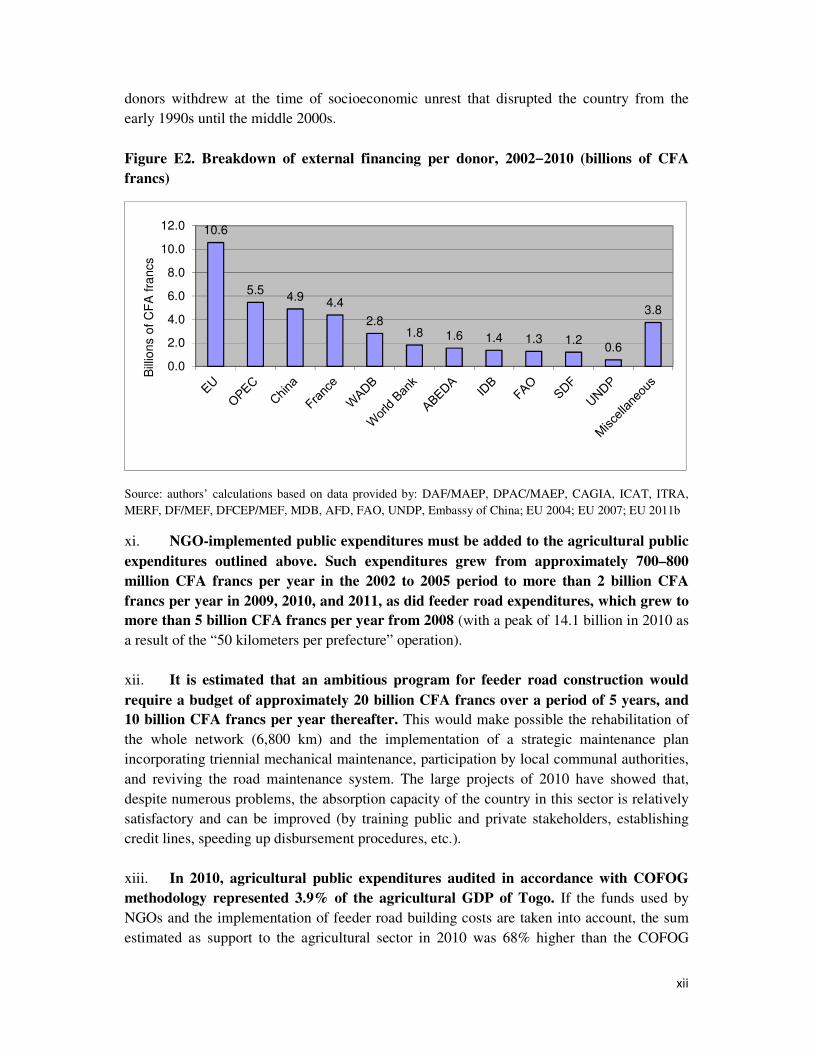
donors withdrew at the time of socioeconomic unrest that disrupted the country from the
early 1990s until the middle 2000s.
Figure E2. Breakdown of external financing per donor, 2002−2010 (billions of CFA
francs)
Source: authors’ calculations based on data provided by: DAF/MAEP, DPAC/MAEP, CAGIA, ICAT, ITRA,
MERF, DF/MEF, DFCEP/MEF, MDB, AFD, FAO, UNDP, Embassy of China; EU 2004; EU 2007; EU 2011b
xi. NGO-implemented public expenditures must be added to the agricultural public
expenditures outlined above. Such expenditures grew from approximately 700–800
million CFA francs per year in the 2002 to 2005 period to more than 2 billion CFA
francs per year in 2009, 2010, and 2011, as did feeder road expenditures, which grew to
more than 5 billion CFA francs per year from 2008 (with a peak of 14.1 billion in 2010 as
a result of the “50 kilometers per prefecture” operation).
xii. It is estimated that an ambitious program for feeder road construction would
require a budget of approximately 20 billion CFA francs over a period of 5 years, and
10 billion CFA francs per year thereafter. This would make possible the rehabilitation of
the whole network (6,800 km) and the implementation of a strategic maintenance plan
incorporating triennial mechanical maintenance, participation by local communal authorities,
and reviving the road maintenance system. The large projects of 2010 have showed that,
despite numerous problems, the absorption capacity of the country in this sector is relatively
satisfactory and can be improved (by training public and private stakeholders, establishing
credit lines, speeding up disbursement procedures, etc.).
xiii. In 2010, agricultural public expenditures audited in accordance with COFOG
methodology represented 3.9% of the agricultural GDP of Togo. If the funds used by
NGOs and the implementation of feeder road building costs are taken into account, the sum
estimated as support to the agricultural sector in 2010 was 68% higher than the COFOG
10.6
5.54.9
4.4
2.81.8 1.6 1.4 1.3 1.2
0.6
3.8
0.0
2.0
4.0
6.0
8.0
10.0
12.0
Bill
ion
s o
f C
FA
fra
ncs

xiii
estimated amount and was equivalent to 6.5% of agricultural GDP. These figures place Togo
among the middle ranks of sub-Saharan African countries with respect to support to the
agricultural sector as expressed in terms of a proportion of agricultural GDP, although they
are far below the performance of middle- and high-income countries. To achieve a support
level equivalent to the bottom range of middle-income countries (10% of agricultural GDP),
Togo will have to achieve a level of support for agriculture in the order of 70 billion CFA
francs per year, which would bring it close to the needs estimated in PNIASA—569 billion
CFA francs for the 2010−2015 period, equivalent to approximately 95 billion CFA francs per
year.
Economic and Functional Breakdown and Regional Distribution of the MAEP Budget
(Allocative Efficiency)
Figure E3. Economic breakdown of expenditures overseen by MAEP, both budgeted
and off-budget, excluding feeder roads, 2002−2010 (billions of CFA francs)
Notes: The repayment of SOTOCO’s debts in 2007 (12 billion CFA francs) was not accounted for because this
exceptional item would have distorted the results of the analysis: the payroll costs for contract employees were
accounted for as part of operating costs.
Source: authors’ calculations based on data provided by: DAF/MAEP, DPAC/MAEP, CAGIA, ICAT, ITRA,
DF/MEF, DFCEP/MEF, CDP Branch, ADF, FAO, UNDP, Embassy of China; EU 2004; EU 2007; EU 2011b
xiv. The economic breakdown of expenditures overseen by MAEP, both budgeted
and off-budget, for the period 2002−2010 (Figure E3) shows that the sector, like the rest
of the Togolese economy, received very little support throughout most of the period. In
this context, personnel expenditures and other administrative costs represent an exaggerated
proportion of expenditures (42%). Capital expenditures, mostly financed by external
resources, only accounted for 27% of expenditures. The remainder was committed for the
purchase of fertilizer (CAGIA, 28%) and grains (ANSAT, 3%).
Civil servant personnel, 14.5,
16%
Operating costs, 24.8, 27%
Investments (RI), 4.6, 5%
Investments (RE), 19.9, 21%
Purchase of inputs (RI), 12.7, 14%
Purchase of inputs (RE), 13.0, 14%
Cereal Purchases (RI), 2.5, 3%

xiv
xv. Capital expenditures have nevertheless experienced a net growth since 2009 and
especially since 2010 (Figure E4), owing to increased support by the GoT to the sector
and to the resurgence of international aid.
Figure E4. Progression of capital expenditures under the oversight of MAEP, budgeted
and off-budget, excluding feeder roads, 2002–2010 and estimates for 2011 (in billions of
CFA francs)
Source: authors’ calculations based on data provided by: DAF/MAEP, DPAC/MAEP, CAGIA, ICAT, ITRA,
DF/MEF, DFCEP/MEF, CDP Branch, ADF, FAO, UNDP, Embassy of China; EU 2004; EU 2007; EU 2011b
xvi. While the provisional and implemented MAEP budgets increased respectively by
a factor of 3 and of 4 in constant terms from 2002−2011, the total payroll component for
civil service personnel decreased by 20% in constant terms over the same period, in
spite of personnel recruitment in 2008. MAEP civil service personnel represented 3% of
the State’s entire payroll at the beginning of the 2000s, but represents less than 2% at present,
even though the sector it regulates contributes more than 40% to GDP, 20% of export
revenue, provides a livelihood to 60% of the population, and received 9% of the State’s
budgeted public expenditures over the 2002−2010 period (taking the purchase of inputs into
account). The total MAEP staff count is currently around 2,400 persons, including some
1,100 contract staff.3 The piecemeal information available at the moment on these contract
workers would suggest that their numbers have not varied in a significant way in the period
under consideration.
xvii. In addition, in comparative payroll terms, central services and deconcentrated
services manage respectively 70% and 2% of MAEP resources (Figures E5 and E6).
Figure E5. Estimate of distribution of MAEP personnel (civil servants only), 2010
3 The MAEP Human Resources Directorate undertook an initial audit of personnel in the Ministry in 2010 which provided inadequate data; it is currently undertaking a second audit, financed by PASA, whose results should be available by October 2011.
0.0
2.0
4.0
6.0
8.0
10.0
12.0
14.0
16.0
2002 2003 2004 2005 2006 2007 2008 2009 2010 2011
Bill
ions o
f C
FA
fra
ncs
RI
RE

xv
Source: authors’ estimates based on data provided by the DAF/MAEP and the DHR/MAEP
Figure E6. Breakdown of administrative component in the MAEP provisional budget,
excluding feeder roads, 2010 (billions of CFA francs).
Source: authors’ calculations based on data provided by the DAF/MAEP
xviii. Capacity building in the ministry should therefore include not only training for
existing employees but also plan to increase their numbers, together with a thorough
study of the division of the means and responsibilities between the central level and the
regional level, and, at the regional level, between the different institutions involved.
xix. Moreover, the increase in the resources managed by MAEP must necessarily be
accompanied by the planning and implementation of maintenance strategies for
investments undertaken, both for equipment put at Government officials’ disposal, and
for capital goods transferred to beneficiaries. At the moment no such strategy is in place.
xx. The analysis of the functional composition of the provisional and implemented
budgets demonstrates broad cohesiveness, since 2010, between the provisional MAEP
Cabinet, SG and central directorates
33%
DRAEP30%
Autonomous agencies
37%
Central services, 25, 69%
DRAEP, 1, 2%
Autonomous agencies, 10, 29%

xvi
budgets and PNIASA goals. This analysis also makes it apparent that, by comparison
with the intensification of food crops which were given priority (60% of budget
estimates allocated in 2010−2011), livestock breeding, fish farming, research and
extension services, and DRAEP were neglected over the past decade and should receive
increased support in the future.
xxi. Taking into account the cost of ITRA personnel paid directly from the national
budget, and not from the State subsidy to ITRA in the 2005−2010 period, the ITRA
budget only represented 0.07% of national GDP, which is noticeably lower than the
objective of 1% set by the AU (Khartoum 2006). Togo is one of the sub-Saharan African
countries allocating the least resources to agricultural research, with less than US$0.40 per
inhabitant per year.
xxii. By the same token, the issues of processing and marketing do not feature
strongly enough, either in the institutional arrangements or in investment programs; it
seems that they need to be given greater institutional attention by the formation of a dedicated
MAEP directorate (or dedicated in part) or by redefining of the role and resources of
ANSAT.
Figure E7. Regional distribution of the provisional and implemented MAEP capital
expenditure budget, 2002–2010 compared with regional share of population, rural
poverty levels, and food crop production (%)
Source: DAF and DSID/MAEP; authors’ calculations per IMF 2010
xxiii. The analysis of the geographic distribution of the provisional and implemented
MAEP capital expenditure budget for the 2002−2010 period shows a strong bias
favoring the Maritime region (Figure E7). This bias is even more pronounced in actual
implementation. The bias favoring the region closest to Lomé, and also closest to the central
services of MAEP, is indubitably the result of the high level of management centralization of
the budget items mentioned above. An inter-regional realignment of MAEP interventions is
therefore imperative, and this will, of necessity, entail transferring greater responsibility to
0%
10%
20%
30%
40%
50%
60%
Maritime Plateaux Centrale Kara Savanes Lomé
Share of provisional budget
Share of implemented budget
Contribution to rural population
Contribution to rural poverty
Contribution to food cropproduction

xvii
the decentralized services in resource management, pending the implementation of the
deconcentration planned by the GoT.
Technical Efficiency in the Process of Preparation, Implementation, and Monitoring-
Evaluation of Agricultural Budgets
Figure E8. Trends in the implementation rates of capital expenditures and purchases of
inputs from RI and RE, excluding feeder roads, 2002–2010 (%)
Note: No data available on implementation rates of RI investments in 2007.
Source: MEF/DFCEP
xxiv. In the 2002−2010 period, the implementation rate of capital expenditures and
purchase of inputs, excluding feeder roads, by RE was noticeably lower than those
capital expenditures and purchase of inputs by RI: 23% as opposed to 69% in weighted
average (Figure E8). The first cause for the very low implementation rate for investments by
RE is the inclusion in the budget of projects which are not ultimately carried out, or are not
yet ready for implementation, or whose budgeted cost is not covered by the resources
available. It is estimated that in 2010, these errors in programming for RE capital
expenditures amounted to more than 20 billion CFA francs, representing in that year 87% of
investments by RE included in the budget, and 60% of the total MAEP budget, excluding
feeder roads.
xxv. To achieve the best capital expenditure implementation rates, greater precision
is therefore essential in programming and planning operations and especially more
realism in determining the timeframes necessary, especially for administrative
procedures (procurement processes etc.), to only include in the budget those operations
that have the maximum probability of being implemented. The operations for preparatory
work (such as primary surveys, and bid solicitations) that have already been concluded or
initiated during the budget planning phase, should be given priority. Programs which are
unlikely to be launched in the following fiscal year should not be included in that budget. If a
0%
20%
40%
60%
80%
100%
2002 2003 2004 2005 2006 2007 2008 2009 2010
RI
RE

xviii
program which has not been budgeted for can, in fact, be launched, a supplementary budget
act should be passed to rectify the budgetary situation.
xxvi. There is also an urgent need to institutionalize a mechanism within MAEP for
closer collaboration with donors for budgeting and follow-up on the implementation of
the projects they finance. Any project financed by RE and included in the agriculture
budget should have a focal point within MAEP familiar with the donor’s procedures and
responsible for establishing realistic budgetary provisions with the donor, for monitoring
compliance with the preconditions for launching the project, and for eliminating any
obstacles during its implementation, and, lastly, for reporting monthly to SG/MAEP,
DAF/MAEP, and to the directorate in charge of M&E on the progress of budgetary
implementation and its fulfillment. This focal point would therefore be responsible for the
project’s budgetary implementation rate. It is recommended that this proposal be referred
to GDPAS to define its implementation.
xxvii. It is equally necessary to ensure better real-time follow-up on expenditures by
the DAF/MAEP which would eliminate some of the bottlenecks in reasonable
timeframes.
xxviii. Furthermore, in applying WAEMU directives, several reforms are underway in
public finance management, which should also lead to achieving better implementation
rates (reform of the budgetary planning process, of expenditure flows, of public procurement
procedures, the introduction of results-based management [RBM], and of the medium-term
expenditure framework [MTEF] etc.).
xxix. Due to an apparent lack of both human and material resources and a lack of
training, the RBM and MTEF process is still faltering and struggling to proceed from a
means-based approach to a results-based approach. It should be noted that carrying out an
MTEF exercise at the sectoral level will only have a limited effect and could lead to wide
frustration and lack of commitment if it is not accompanied by an equivalent exercise at the
national level which would assure a continued provision of means to the technical ministries.
xxx. It appears that in spite of reforms, MAEP internal public procurement
procedures continue to be very drawn out. The relevant official bodies should be
strengthened in order to achieve an acceptable performance level.
xxxi. A fair number of the matters promoting the improvement of the implementation
rate lie in the hands of the MEF: paying domestic debts and suppliers within a maximum of
60 days, a timetable for releasing appropriations more suitable for needs as they arise,
collaboration with technical ministries for the reassignment of payment appropriations during
the course of the year.
xxxii. Better implementation rates also occur when there is a noticeable strengthening
of M&E capabilities which are presently almost non-existent both at the MAEP and

xix
State levels; at the MAEP level, monthly monitoring of the financial implementation of all
budgeted projects should be carried out by DAF and an effective M&E of completed projects
should be applied by the future directorate in charge of M&E and the directorates and
authorities involved by applying the M&E plan provided for by PNIASA; at the State level, it
is urgent that the Court of Auditors finally begin functioning and drawing up the budget acts,
and that the National Assembly receive greater powers in sector-based matters.
xxxiii. Analysis has shown that the projects driven by project management units (PMU)
independently of State services have undoubtedly made rapid execution possible and
have achieved implementation rates of nearly 100%, but have, in general, achieved
limited results in the transfer of skills to local authorities, capitalizing on experience
gained and the sustainability of their accomplishments. In the future, all agricultural
projects approved by the GoT should be supported by a greater MAEP involvement even
when they are to be carried out by another ministry; the PMU formula should be gradually
phased out in favor of direct project management by MAEP when its fiduciary management
capabilities are demonstrated in the PASA exercise.
xxxiv. These various issues—more intensive and realistic efforts in programming and
planning, closer collaboration with donors, taking ownership of all agriculture projects,
effective implementation of RBM and MTEF, greater technical efficiency in
implementation (especially as regards public procurement), and activation of a
functional M&E system—constitute the foundations of the potential development of a
Sector Wide Approach (SWAp) that would make MAEP’s leadership structure focus on
the realization of PNIASA.
The Special Issue of Agricultural Inputs, Food Security, and Mechanization
xxxv. The de facto State fertilizer monopoly today limits the quantity of fertilizer
available, certainly well below the potential absorption capacity of the country. In fact,
the consumption of 35,000 tons (the goal in 2011, on the very optimistic assumption that all
of the fertilizer sold in Togo was actually used there) would represent an average application
of 7.4 kg of fertilizing material per hectare of arable land, which falls far short of the average
in Africa (19.2 kg per hectare).
xxxvi. It is estimated that in the 2005−2010 period the sales price of fertilizer to farmers
was equivalent to a subsidy of 35% to 40% of the real cost of importation and
distribution. During this period, it is calculated that the subsidy, excluding customs duties
not levied, cost the State 8.4 billion CFA francs, or, on average, 1.4 billion CFA francs per
year, with a peak in 2009 (subsidy equivalent to more than 50% at the cost of 5.3 billion CFA
francs) as a result of a sharp rise in the cost of fertilizer on the international market.
xxxvii. The disparity between the calculation method for the subsidy and the micro-
economic reality on the farms, its failure to set targets, and the deficiencies in regard to
M&E of the program raises questions about the effectiveness of such a strategy for the

xx
promotion of fertilizer use, and support for the most vulnerable population groups. A
not-insignificant proportion of the subsidized fertilizer is in all probability used by farmers
cultivating large acreages who would be prepared to pay higher prices to have larger
quantities of fertilizer and at more appropriate seasons, even acquired through neighboring
countries.
xxxviii. In order to increase the availability of fertilizer in Togo, an immediate
shift towards a subsidy system which encourages the development of private
distribution networks is recommended. In the medium term, this is the goal advanced by
the GoT (MAEP 2010c) as well as the recommendation of ECOWAS (ECOWAS 2006) and
of the AU following the African Summit on Fertilizer in Abuja in 2006 (AU 2006). Besides
the increase in the quantity of fertilizer (and other inputs) available, the privatization of the
supply chain should entail a noticeable reduction in the farmer–warehouse distance
(calculated presently at 15–20 km) as well as a better alignment between fertilizer availability
and the agricultural seasons that is vital for a type of agriculture dependent on rainfall which
has to balance the ever more intense inter- and intra-annual rainfall. Privatization should also
provide farmers with different sorts of fertilizer more suitable to different crops and diverse
soil types than the NPK 15-15-15 and 46% urea alone (which have been imported until now)
and possibly also access to different ways of packaging more appropriate to the needs and the
capacities of the users.
xxxix. The reconciliation of privatization with the provision and the continuation of the
subsidy could be ensured by the introduction of a voucher system distributed to target
groups for the purchase of subsidized fertilizer from private distributors. Such a voucher
system is already used in a number of countries and is considered as the soundest means of
carrying out a strategy for subsidized inputs without jeopardizing a durable distribution
network.
xl. It is hence recommended that a study be commissioned as soon as possible to
determine how such a system could be put in place as a transition from the current
system, and that it should preferably start before the 2013−2014 season. The study
should particularly identify the needs of private operators (importers and local manufacturers,
input supply shop promoters, FOs wanting to become involved in wholesale and distribution),
especially with respect to training and financing. On the latter point, support from the IFC or
the African Fertilizer Financing Mechanism managed by the ADB (if it comes into operation
in the interim), to guarantee a credit line through local banking institutions, could
undoubtedly be a worthwhile option. The above study must also unravel the situation
regarding duties on imports of inputs; it must also specify the impact of the present subsidy
system, its cost-benefit relationship, and the interventions needed to make it more effective
(targeted beneficiaries) and to phase it out, as the GoT anticipates; lastly it must give some
clarity on the subregional fertilizer market and the steps to be taken to prevent the cross-
border leakage to neighboring countries and to promote an alignment of strategies regarding
agricultural inputs.
xxi
xli. The use of improved seed is even less widespread than the use of fertilizer. It is
calculated that it is used in only 3% of food crop areas. The lack of appropriate
legislation, the insufficient means at the disposal of ITRA, ICAT, and the MAEP seed
directorate, which result in the non-certification of improved seed produced, and the
inadequacy of private finance for agriculture have, over the past few years, led to bogging
down the supply chain and to flooding the market with seed of doubtful quality and origin.
An attempt is presently being made to get the supply chain running again with the EU/Food
Facility Program for Enhancing Food Security for Vulnerable Households operated by the
FAO, and the FAO TCP project of Support for the Recovery of the Seed Sector. It is
extremely important that, in the future, more resources be allocated for the development of
seed production nationally and for raising awareness among producers of the value of using
fertilizer and improved seed together.
xlii. The various ongoing programs for the distribution of free
seed/fertilizer/pesticide product kits to vulnerable population groups for demonstration
purposes should be evaluated carefully to determine whether they are likely to convince
the target population of the validity of the use of improved technologies and whether they do
indeed, as anticipated, lead to such a noticeable increase in income as to enable them to
purchase these inputs in subsequent years.
xliii. The inadequate financial resources allocated to food security by ANSAT (3% of
agricultural public expenditures in the 2002−2010 period) meant that it was unable to
play a significant role in price stabilization either for the farmer or for the consumer.
From 2005 to 2010, OSAT and ANSAT purchased less than 19,000 tons of grains, or 0.3% of
national production over this period.
xliv. However, the unsuitable nature of these intervention prices (target prices instead
of floor purchase prices and ceiling sale prices) leads to the distortions and frustrations
in the market that many operators complain of. Furthermore, a significant portion of
the stock (45% of volume purchased or received from donors between 2005 and 2008) is
lost as a result of inadequate storage conditions. Lastly, the regulatory regime for
exports is not sufficiently explained and communicated to the operators, has an adverse
effect on producer prices, and does not prevent informal exports. The results of the
present strategy run contrary to its own goals: in actual fact it has an adverse effect on the
growth of production and income of farmers, without necessarily achieving the desired
results for urban consumers.
xlv. A country like Togo, which regularly produces a grain surplus, and having a
small domestic market, traditionally engages in trans-border trade, and, being part of a
free-trade community generally short of grain, is able to position itself as a regular
maize exporter to the subregion. In these circumstances, the best strategy to assure price
stability and food security would be market liberalization. It is thus urgent to publicly address
the ambivalence with respect to the prohibition (or otherwise) of exports, to ensure that
export procedures are not restrictive and to inform the operators accordingly.

xxii
xlvi. Consideration should be given to developing a support agency within ANSAT for
marketing agricultural produce in domestic and external markets. Such an agency would
not intervene in the market, except possibly in exceptional circumstances (market collapse or
price surge), setting floor purchase prices and ceiling sale prices in advance; it could also, at
some point, take over the sourcing and purchase of State requirements (for schools, hospitals,
prisons, etc.), through bids for solicitations and contracts with private suppliers; its principal
function would be the active support, through reports, training and promotion, research and
financing, etc., of initiatives for the development of markets for local produce and structuring
national production organization (FOs, Value Chain organizations). The precise scope of
such an agency would have to be defined by a further study.
xlvii. It is surprising to note that the very same mistakes in terms of mechanization
which led to the failure of programs implemented in the 1970s and 1980s were partly
repeated for the management of the new program initiated in 2006 (State management of
a service which should be provided by the private sector, prices not covering real costs
without the State providing sufficient additional funds to cover maintenance costs, non-
availability of spare parts and maintenance services, a lack of qualified tractor drivers,
difficulty in mechanizing in areas not yet cleared). One can thus rightly question the
sustainability and economic profitability of the current program.
xlviii. Discussions are currently underway on importing an additional 200 tractors
donated by India. It is imperative to seriously study the feasibility of and conditions for
the development of private mechanical repair centers. In the interests of sustainability and
economic viability, it is imperative that the State withdraw from this activity. As a
consequence, even its involvement in the choice of and importation of future equipment is
questionable, in as much as private operators should be responsible for the choice of their
own equipment.
Impact and Effect of Public Agricultural Expenditures
xlix. In spite of the absence of any evaluation study, it can be assumed that the impact
and effect of public agricultural expenditures has been minimal until now. The
proportion of farmers deriving benefit from the various programs implemented until now,
including training and the provision of subsidized fertilizer, probably does not exceed 10%.
Acknowledgement of this fact should lead to priority being given to the implementation of
structural programs benefiting a far greater number of farmers, such as deregulating the
inputs sector, structuring the rural environment, resolving the land question and the problem
of financing agriculture, enhancing research and training, investing in rural infrastructure, and
developing domestic and regional markets, etc.
l. The robustness of the food crops and livestock subsectors, which have
experienced sustained growth despite the limited impact of public agricultural
xxiii
expenditures until the present time, suggests there will be an excellent response from the
Togolese agricultural sector to such programs and reforms.
Conclusions and Recommendations
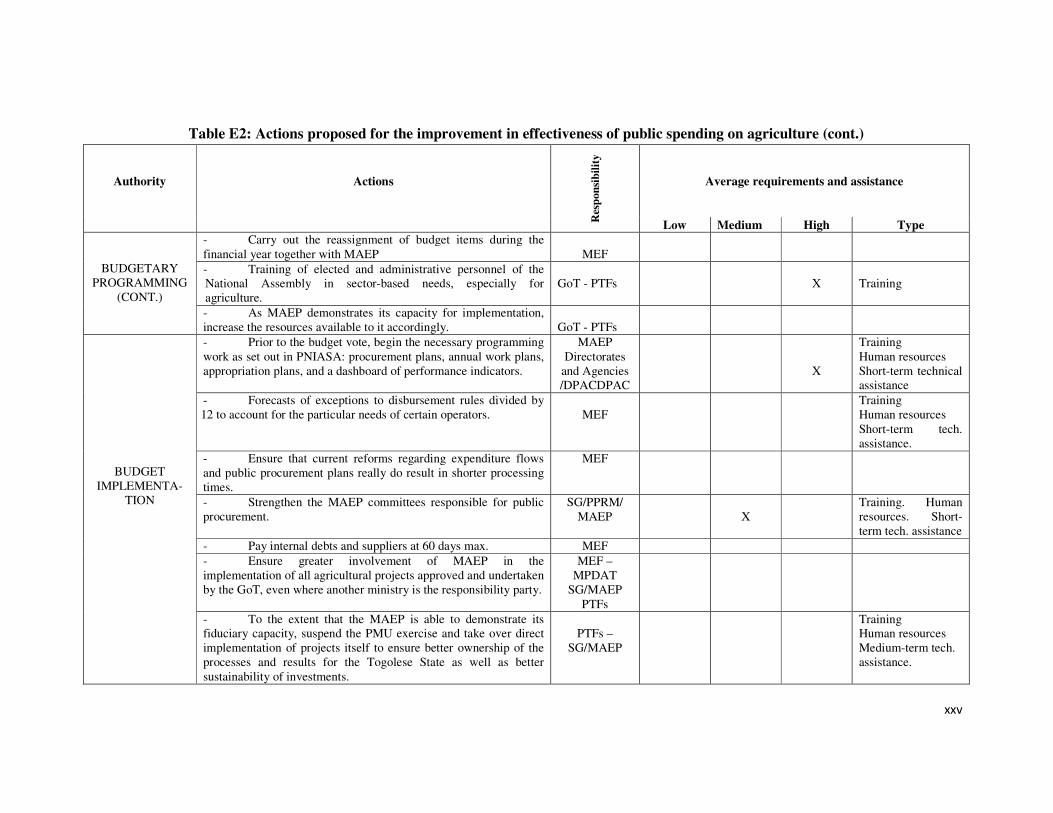
li. The various recommendations of this review are summarized in the table below
(Table E2).
lii. It is very clear that the main risk facing the implementation of the
recommendations of this review, in particular those of PNIASA, in general stems from
MAEP’s present lack of capacity. Capacity-building support within the ministry should be
prioritized through the projects now being launched (PASA and PADAT), and should include
not only training of present officials but also increasing their number, greater stability, a re-
assessment, and serious reconsideration of the division of resources and responsibilities
between national and regional levels, and between the various institutions on the ground.

xxiv
Table E2: Actions proposed for the improvement in the effectiveness of public agricultural expenditures
Authority
Actions
Res
pon
sib
ilit
y
Average requirements and assistance
Low Medium High Type
BUDGETARY
PROGRAMMING
- Meeting target dates especially for sending the budget guideline letter to sectoral Ministries and for submitting the draft budget to the National Assembly.
MEF
- Effective adoption of the RBM/METF approach.
SG/MAEP
X
Human resources DPAC. Training Short-term technical assistance
- Better planning of actions before their inclusion in the budget and non-inclusion of items until they are ready to be undertaken (baseline studies and completed tender processes).
MAEP Directorates and Agencies
X
Training Human resources
- Use of a Supplementary Budget Act to regularize the situation for unbudgeted actions commenced during the financial year.
SG-DAF/MAEP
- Better appreciation of external resources available for use through a collaborative mechanism involving donors, such as the designation of a focal point within MAEP for each donor, trained in their procedures, and who will be responsible for the implementation rates of projects financed by the donor.
Directorates and agencies of the MAEP
– DPs (GDPAS)
X
Training Human resources
- Inclusion in the budget of provisions for maintenance of completed investments.
MAEP Directorates
and Agencies
- Adjustment of the MAEP budget in favor of research and extension services in livestock production, fishing and fish farming, and regional administration.
SG/MAEP
- Adjust the budget between regions SG/MAEP - Devote more resources to processing and marketing issues SG/MAEP
xxv
Table E2: Actions proposed for the improvement in effectiveness of public spending on agriculture (cont.)
Authority
Actions
Res
pon
sib
ilit
y
Average requirements and assistance
Low Medium High Type
BUDGETARY PROGRAMMING
(CONT.)
- Carry out the reassignment of budget items during the financial year together with MAEP
MEF
- Training of elected and administrative personnel of the National Assembly in sector-based needs, especially for agriculture.
GoT - PTFs
X
Training
- As MAEP demonstrates its capacity for implementation, increase the resources available to it accordingly.
GoT - PTFs
BUDGET IMPLEMENTA-
TION
- Prior to the budget vote, begin the necessary programming work as set out in PNIASA: procurement plans, annual work plans, appropriation plans, and a dashboard of performance indicators.
MAEP Directorates
and Agencies /DPACDPAC
X
Training Human resources Short-term technical assistance
- Forecasts of exceptions to disbursement rules divided by 12 to account for the particular needs of certain operators.
MEF
Training Human resources Short-term tech. assistance.
- Ensure that current reforms regarding expenditure flows and public procurement plans really do result in shorter processing times.
MEF
- Strengthen the MAEP committees responsible for public procurement.
SG/PPRM/ MAEP
X
Training. Human resources. Short-term tech. assistance
- Pay internal debts and suppliers at 60 days max. MEF - Ensure greater involvement of MAEP in the implementation of all agricultural projects approved and undertaken by the GoT, even where another ministry is the responsibility party.
MEF – MPDAT
SG/MAEP PTFs
- To the extent that the MAEP is able to demonstrate its fiduciary capacity, suspend the PMU exercise and take over direct implementation of projects itself to ensure better ownership of the processes and results for the Togolese State as well as better sustainability of investments.
PTFs –
SG/MAEP
Training Human resources Medium-term tech. assistance.

xxvi
Table E2: actions proposed for the improvement in the effectiveness of public agricultural expenditures (cont.)
Authority
Actions
Res
pon
sib
ilit
y
Average requirements and assistance
Low Medium High Type
MONITORING & EVALUATION
- Continue implementation of the M&E plan provided for in
PNIASA
DPACDPAC – Directorates and Agencies
X
Training Human resources Medium-term technical assistance
- Carry out a study to establish an accounting system in MAEP to monitor PNIASA components.
DAF – DPACDPAC
/MAEP
X
Software Training Medium-term technical assistance
- Perform a monthly review of all projects included in the MAEP budget.
SG – DPACDPAC
- DAF /MAEP
Human resources
- Focal points collect implementation rates for projects financed by donors.
MAEP Directorates
and Agencies
X
Human resources
- Draw up Budget Acts and specific studies on budget implementation.
MEF – Court of Auditors
MAEP GENERAL
CAPACITY BUILDING
- Develop a capacity building strategy for MAEP with a view to meeting PNIASA objectives (training, personnel, stability, and compensation).
MAEP/SG
X
Internal audit
- Give careful consideration to the division of resources and responsibilities between national and regional levels, and at the regional level, between the different institutions on the ground.
MAEP/SG
X
Internal audit

xxvii
Table E2: Actions proposed for the improvement in the effectiveness of public agricultural expenditures (cont. to end)
Authority
Actions
Res
po
nsi
bil
ity
Average requirements and assistance
Low Medium High Type
POLICIES
- Develop and implement strategies for the maintenance of completed investments, both for equipment placed at the disposal of State agents and for capital goods transferred to beneficiaries.
MAEP Directorate
and Agencies
X
Short-term technical assistance
- Prepare a study on the deregulation of fertilizer distribution system, such as by a voucher system for subsidized fertilizer.
SG/MAEP CAGIA
X
Initial study Medium-term technical assistance
- Continue with the revival of the national seed sector. SG/MAEP DS/MAEP
X
Ongoing FAO project
- Promote the alignment of a subregional strategy for agricultural inputs.
SG/MAEP CAGIA
X
Short-term technical assistance
- Resolve the issue of the legality of maize exports, check that export procedures are clearly defined, and are not restrictive and inform the operators accordingly.
SG/MAEP ANSAT
- Prepare a study on the development of ANSAT to become a support agency for marketing agricultural produce domestically and externally.
SG/MAEP ANSAT
X
Initial study Medium-term technical assistance
- Promote the development of private mechanization centers.
SG/DAER/ MAEP
X
Initial study
- Generally, promote the implementation of structural programs benefiting the largest number of people, such as deregulating the inputs sector, structuring the rural environment, resolving the land question and the agricultural financing issue, support for research and extensions, investing in rural infrastructure, developing domestic and regional markets, etc. so as to maximize the impact and effect of public agricultural expenditures.
SG/MAEP
X
Medium-term technical assistance

1
INTRODUCTION
1. In 2007, after fifteen years of economic stagnation resulting from the socio-political
unrest which disturbed the country between 1999 and 2005, a period in which a
great proportion of international aid to Togo was suspended, Togo entered into a
period of political stability and economic revival. The objective of economic recovery
was underpinned by an extensive effort to reform the State’s operations and the
development of policies encouraging growth.
2. In July 2009 Togo was the first country in West Africa, and the second after
Rwanda in sub-Saharan Africa, to sign its CAADP Compact. The implementation of
the Togolese CAADP builds on the National Agricultural Investment and Food Security
Program (NAIFSP) which is gaining purchase through the launch of three major projects
(the Agricultural Sector Support Project [PASA], the West African Agricultural
Productivity Program [PPAAO/WAAPP] and the Support to Agricultural Development
Project in Togo [PADAT]).
3. As part of its stimulation of agricultural development, the State of Togo (GoT) has
launched a review of public agriculture spending to learn from the lessons of the
past in budgetary implementation in this sector, and thus improve future project
performance. Following a request sent by the Ministry of Agriculture, Livestock, and
Fisheries (MAEP), the NEPAD Planning and Coordinating Agency designated Togo to
carry out this exercise. This review is to be undertaken by the Program for Strengthening
National Comprehensive Agricultural Public Expenditure in Sub-Saharan Africa, jointly
financed by the Bill and Melinda Gates Foundation and the Multi-Donor Trust Fund of
the CAADP. This program, implemented by the World Bank, seeks to improve the impact
of limited public resources available to sub-Saharan African state governments to
promote agricultural development and combat poverty in rural areas, where most of these
countries’ poor still live (80% in Togo).4
4. This study follows—and builds upon—a number of similar works conducted over
the last few years, particularly the Public Expenditure Management and Financial
Accountability Review (PEMFAR, World Bank/ADB/, UNDP/French Aid and
Cooperation 2006, and World Bank/ADB/EU/ 2009), the Evaluation of Public
Expenditure in accordance with the PEFA Method (EU 2009), the work undertaken by
ReSAKSS (ReSAKSS 2009 and ReSAKSS 2010), and the Agricultural Sector Review
(MAEP 2010b).
5. The objectives of the Diagnostic Review of Basic Public Expenditures in the
Agricultural Sector are as follows:
4 Source: ReSAKSS 2009.

2
i. To gain a better understanding of the country’s performance in the
context of the Maputo Declaration of 2003;
ii. Learn from the lessons of the past concerning budgetary implementation
in this sector to improve the performance of future projects;
iii. Improve the awareness of the GoT and its DPs of the sector’s absorption
capacity so that a decision can then be reached on increasing the amount
of financial resources allocated to agricultural development;
iv. Contribute to “ownership” of the review process in public expenditure
within MAEP itself, with the more general goal of strengthening its
monitoring and evaluation (M&E) capacity.
6. Unlike other countries where support for agricultural development has to some extent
leveled off, Togo is in a unique position, in as much as foreign aid is rising and numerous
reforms of State operations are underway: rationalization of public accounts,
implementation of results-based management (RBM) with the Medium-Term Expenditure
Framework (MTEF) for the ministries in priority sectors (like MAEP and the Ministry of
Environment and Forest Resources – MERF), new methods for procurement processes
with the launch of the National Directorate of Public Procurement Control (DNCMP)
falling under the Ministry of Economy and Finance (MEF), the MAEP reorganization
project, reform of public enterprises (in the agricultural sector, liquidation of the Togo
National Cotton Company [SOTOCO] replaced by the New Cotton Company of Togo) –
NSCT, etc. Under these circumstances, now fully underway, learning lessons from
the past concerning budgetary expenditure certainly remains important, but
ownership of the analysis process appears to be a crucial objective for the successful
implementation of PNIASA.
7. This report has seven sections:
i. Chapter One sets out the strategic and institutional background;
ii. Chapter Two examines the level of public agricultural expenditures in Togo;
iii. Chapter Three analyzes the composition and the regional distribution of
public expenditures undertaken by MAEP (allocative efficiency);
iv. Chapter Four evaluates the technical efficiency of these public expenditures;
v. Chapter Five examines special cases of public spending in three particularly
important and sensitive subsectors: inputs supply (with an analysis of the role
of the Central Supply and Management of Agricultural Inputs – CAGIA),

3
food security (with an analysis of the role of the National Food Security
Agency of Togo – ANSAT), and agricultural mechanization;
vi. Chapter Six considers the question of the implications and impact of public
agricultural expenditures;
vii. Finally, the last chapter, Chapter Seven, summarizes the conclusions and
recommendations of the preceding chapters.
8. The terms of reference of this analysis provided for a review period of six years, from
2005 to 2010, to which it seemed appropriate to add the draft budget for 2011. Given that
foreign aid only resumed in 2006, thus dividing the 2000s into two distinct periods, it has
been suggested that the study rather cover the period 2000 to 2011. In fact, data
pertaining to the operations of various State services were not available until 2002,
so ultimately, the period 2002 to 2011 was established as the review period.
9. The methodology and the set of hypotheses used for this review are set out in Appendix 1
and the baseline data in Appendix 2.
1. STRATEGIC AND INSTITUTIONAL CONTEXT
1.1. Strategic Context
10. Since 1992 there have been many different strategic policy initiatives and agricultural development programs in Togo, all with the aim of improving food security and reducing poverty and all gradually drawing their inspiration over the years from the policy initiatives and strategies adopted at the regional and subregional levels. As the policy choices have changed, so have the primary objectives, expanding with every new vision, every change of strategic direction, every major constraint, and every new development demand. These changes have taken place despite the fact that there is no formal legislative framework for these policies, apart from Togo's decision to ratify the WAEMU agricultural policy in 2001 and ECOWAS agricultural policy (ECOWAP) in 2005. Togo also committed to taking account of the main declarations of the AU, in particular the 2003 Maputo Declaration on the allocation of at least 10% of national budgetary resources to agriculture, the 2004 Sirte Declaration on the integrated and sustainable development of agriculture and water in Africa, and the 2006 Abuja Declaration on fertilizer and food security.
11. The first Declaration of Agricultural Development Policy was drawn up in December 1992 for the 1993–1997 period and then updated with the help of the FAO to cover 1996–2000. Its main objectives were: (i) to liberalize the agricultural sector; (ii) to reassess the role of stakeholders in the sector; (iii) to establish a system for financing rural activities; and (iv) to guarantee agricultural productivity at the same time as protecting natural resources. These overarching objectives were broken down into more specific goals, namely to: (i) increase the use of inputs, develop a water management system and reduce post-harvest losses for food crops; (ii) encourage growth in cotton production through

4
intensifying and liberalizing the sector; (iii) gradually renew plantations and improve growing techniques; and (iv) develop short-cycle livestock breeding and reinvigorate inland fisheries.
12. This Declaration of Agricultural Development Policy was followed by an Agricultural and Rural Sector Growth Strategy for 2003–2007, with six development objectives: (i) improve food crop production; (ii) develop traditional export crops and promote new crops; (iii) structure the rural economy; (iv) improve the effectiveness of production support services; (v) prevent the destruction of natural resources; (vi) promote the development of a rural agricultural private sector.
13. In December 2006 an Agricultural Policy Note was published in light of the UN Millennium Development Goals (MDGs), in particular MDG 1, which aims to eliminate extreme poverty and hunger.5 Given the delays in achieving this goal, the MDG Acceleration Framework was created in 2010, which estimated that meeting MDG 1 would require 139.6 billion CFA francs for 2010–2015, of which 13.0 billion CFA francs have already been allocated, leaving a gap of 126.6 billion CFA francs.6
14. In April 2007, with the support of UNDP, the GoT drew up a National Development Strategy focused on MDGs. This was then the basis for the poverty reduction strategies (the 2008 Interim Poverty Reduction Strategy Paper (IPRSP) and the 2009 Poverty Reduction Strategy Paper – Full (PRSP-F) developed with the support of the IMF). The PRSP-F acts as the cross-sector reference framework for any national interventions. It is based on four pillars: (i) Pillar 1: strengthening of governance; (ii) Pillar 2: consolidation of the foundations of strong and sustainable growth; (iii) Pillar 3: development of human capital; and (iv) Pillar 4: community development and reduction of regional imbalances.7
15. This was followed by the publication of a number of agricultural policy orientation documents: the National Food Security Program (NFSP) in 2007–2008, the Strategy for the Relaunch of Agricultural Production (Stratégie de Relance de la Production Agricole) in July 2008, the Interim Priority Action Plan 2008–2010 (Plan Intérimaire d’Actions Prioritaires) in September 2008 and the National Agricultural Investment Program (Programme National
d’Investissement Agricole - PNIA) in April 2009.
16. In July 2009, Togo became the first West African nation and the second sub-Saharan African nation (after Rwanda) to sign up for the CAADP. The CAADP, promoted by the African Union (AU) via its New Partnership for Africa's Development (NEPAD), encourages African States to increase the share of their national budgetary resources allocated to agriculture to at least 10%, in order to reach agricultural growth of at least 6% a year (Maputo Declaration 2003).
17. The National Agricultural and Food Security Investment Program (Programme
National d’Investissement Agricole et de Sécurité Alimentaire - PNIASA)8 supports both the implementation of Togo's CAADP and the development of a national strategy based on the ECOWAP from the Economic Community of West African States. PNIASA was created through the merger of NFSP and PNIA and stems from the work carried out under the agriculture chapter of the PRSP-F with a view to attaining the MDGs. PNIASA covers the 5 MDG 1 has two targets: to cut in half the proportion of people living on less than $1.00 a day and the proportion of people who suffer from hunger between 1990 and 2015. 6 UNDP 2010b. 7 IMF 2010. 8 MAEP 2010a and MAEP 2010c.

5
years 2010–2015 and is now the single reference framework for the deployment of both national and external resources and for actions carried out by the various stakeholders in the agricultural sector. Financing for the program was secured thanks to an agreement between the GoT and DPs signed in July 2009 and extended by a partnership framework agreement signed in February 2010.
18. The chief aim of the PNIASA is to increase productivity and producers' revenues, and as such it focuses on stimulating production of food crops, export crops, livestock breeding, and fisheries through priority actions: (i) strengthening the legal and institutional framework; (ii) structuring the rural economy and professionalizing the various agricultural subsectors; (iii) ensuring sustainable access to productive resources and to markets. Within PNIASA there are five action areas or subprograms, each of which in turn consists of a number of different elements:
i. Subprogram 1: Promotion of the vegetable sector, consisting of four elements:
- 1.1 Managing sustainable natural resources;
- 1.2 Developing rural infrastructure;
- 1.3 Intensifying food crop production;
- 1.4 Diversifying and promoting export crops;
ii. Subprogram 2: Promotion of the livestock sector, consisting of two elements:
- 2.1 Improving traditional livestock breeding methods;
- 2.2 Promoting small and medium-sized livestock breeders;
iii. Subprogram 3: Promotion of the fisheries sector, consisting of two elements:
- 3.1 Intensifying fisheries production;
- 3.2 Supporting inland and maritime fisheries;
iv. Subprogram 4: Agricultural research and extension, consisting of three elements:
- 4.1 Improving technological development;
- 4.2 Marketing improved technologies;
- 4.3 Coordinating and managing research and extension services;
v. Subprogram 5: Strengthening institutions and improving sector coordination, consisting of three elements:
- 5.1 Reinforcing the sector's institutions;
- 5.2 Building sector management capacities;
- 5.3 Promoting the right to food and good governance of food security and nutrition.

6
19. When it was originally drawn up, the total cost of PNIASA was estimated at 569.1 billion CFA francs for 2010–2015, of which 16% (90.4 billion CFAF) would come from the State and DPs with the remaining 84% (478.7 billion CFAF) still to be found.
20. PNIASA is starting to be put into practice with the launch of three major projects:
i. The Togo Agriculture Sector Support Project (Projet d’Appui au Secteur Agricole – PASA9), approved by the Board of Directors of the World Bank in April 2011, is a US$37 million project supported by the International Development Association (IDA – US$9 million), the Global Agriculture and Food Security Program (GAFSP – US$19 million) and the Global Food Crisis Response Program (GFRP – US$9 million); the project is focused on promoting the development of strategic food crops, export crops, and inland fisheries, relaunching the livestock sector, and supporting capacity building and coordination across the sector;
ii. The West Africa Agricultural Productivity Program (WAAPP10), approved by the Board of Directors of the World Bank in March 2011; in Togo, this project will be financed by a grant of US$12 million from the IDA which will be used to support agricultural research and extension;
iii. The Togo Rural Development Support Project (Projet d’Appui au Développement Agricole au Togo - PADAT11), a US$63.5 million project approved in December 2010 and co-financed by the International Fund for Agricultural Development (IFAD – US$13.5 million), the GAFSP (US$20 million), the West African Development Bank (WADB – US$15 million) and the ECOWAS Bank for Investment and Development (EBID – US$15 million); this project will provide additional support for food crop production and the development of rural infrastructure.
21. These three projects, which together total US$112.5 million or around 50 billion CFA francs, account for around one-tenth of the estimated PNIASA funding still to be found.
1.2. Institutional Framework
22. See below for a flowchart of the various stakeholders in the agricultural sector (Figure 1).
23. The Ministry of Agriculture, Livestock, and Fisheries (MAEP), along with its central, regional (DRAEP), and prefectural (DPAEP) directorates, its autonomous agencies and, since late 2010, the Delegated Ministry to the MAEP in Charge of Rural Infrastructure (MDMAEPIR), is the lead institution managing agricultural public expenditure (see Section 2.1 for more details).
24. There are several other State-controlled bodies involved in the management and funding of the agricultural sector:
i. The Ministry of Economy and Finance (MEF) is involved upstream in the budget
programming and execution process;
9 World Bank 2011b. 10 MAEP 2010e. 11 IFAD 2010.

7
ii. The Ministry of Planning, Development and Land Use Planning (Ministère en
charge de la Planification, du Développement et de l’Aménagement du Territoire –
MPDAT12) is involved upstream in the budget process but also downstream in the
implementation of various agricultural projects;
iii. The Ministry of the Environment and Forest Resources (MERF);
iv. The Ministry of Water, Sanitation, and Village Hydraulics (Ministère de l’Eau, de
l’Assainissement et de l’Hydraulique Villageoise);
v. The Ministry of Public Works (Ministère des Travaux Publics – MTP) was
responsible for feeder roads until the end of 2010 when responsibility for them
switched to MDMAEPIR (although MTP remains in charge of the actual road works);
vi. To a lesser extent, the Ministry in Charge of Grassroots Development (Ministère
en charge du Développement à la Base – MDB), the Ministry of Commerce and
Promotion of the Private Sector, the Ministry of Communication, and the Ministry for
the Promotion of Women.
25. There are also a number of non-governmental organizations that act alongside these State-controlled bodies, although they are still rather limited in terms of their human resources and technical, financial, logistical, and management capacities. The most noteworthy of them are:
i. Farmer Organizations (FOs): there are around 8,200 grassroots FOs with more than 180,000 members, grouped together into 55 federations (organized at the prefectoral, regional and federal levels); specialist organizations such as the Togo Federation of Coffee and Cocoa Producers' Unions (Fédération des Unions de Groupements de
Producteurs de Café et de Cacao du Togo – FUPROCAT), the Togo Federation of Cotton Producers' Groups (Fédération Nationale des Groupements de Producteurs de
Coton – FNGPC), the Togo Organization of Grain Producers (Centrale des
Producteurs de Céréales – CPC), the National Association of Poultry Producers of Togo (Association Nationale des Producteurs Avicoles du Togo – ANPAT), etc. will certainly have a wider role to play as will inter-professional organizations, which currently exist only in embryonic form in the Togo agricultural sector in the form of the Coordinating Committee for the Coffee and Cocoa Sectors (Comité de
Coordination pour les Filières Café-Cacao – CCFCC);
ii. Civil society organizations (NGOs, associations): there are around 100 NGOs in Togo, scattered unevenly throughout the country, some more active and effective than others; at the national level, they are grouped into two major networks: the Federation of Non-Governmental Organizations in Togo (FONGTO) and the Union of NGOs in Togo (Union des ONG du Togo – UONGTO); at the regional level, they are grouped
12 MPDAT is the National Authorizing Officer for the EU's European Development Fund (EDF). As a result, it houses the National Authorizing Officer Support Unit (Cellule d’Appui à l’Ordonnateur National - CAON). Over the last few years, in the rural and agricultural sector CAON has in particular been responsible for overseeing the implementation through independent PMUs of the Pluriannual Micro-Projects Program (Programme Pluriannuel de Micro-Réalisations - PPMR) and management of the European Commission's STABEX (Système de Stabilisation des Recettes d'Exportation) accounts COM 90–94 and 95–99 (see Sections 2.4 and 2.5).
8
into smaller networks with specialized committees, including one focusing on agriculture;
iii. Micro-finance institutions (MFI): there are six networks covering the micro-finance sector representing around 70% of users, as well as 36 institutions representing 13% of users and 14 registered organizations representing 17% of users, although the number of agricultural loans they grant remains very small; the largest outstanding loans are held by FUCEC (the Federation of Unions of Credit and Savings Cooperatives – Faitière des Unités d'Epargne et de Crédit du Togo) and the registered organization WAGES (Women and Associations for Gain both Economic and Social13);
iv. The private sector: women are primarily responsible for marketing agricultural products, mainly through informal channels; the liberalization of the veterinary products sector in 1997 led to a significant increase in the number of private operators in this sector; there are also a number of private suppliers of inputs (fertilizers and pesticide products), grouped together under the Agro-inputs Suppliers' Association of Togo (Association des Fournisseurs d’Intrants du Togo – AFITO).
26. Donors make up the last group of stakeholders in agricultural development in Togo. The country's socio-economic problems from 1990–2005 meant that cooperation was suspended with most Development Partners (the EU from 1992, the World Bank and IFAD from 2002, the AfDB, the WADB, the Arab Bank for Economic Development in Africa (BADEA), the French Development Agency [AFD], Germany, Japan, etc.). The national political agreement of June 2006 and the general election of 2007 led to renewed political stability and thus allowed cooperation to begin again. Public development aid is estimated to have doubled between 2006 and 2009, from US$95 million, or US$17.5 per capita, in 2006 to US$231 million, or US$40.4 per capita, in 2009.14
27. Public development aid has however until now been unevenly spread between the four strategic pillars of the PRSP-F: on average, over the 2007–2009 period, Pillar 1 (strengthening of governance) accounted for an estimated 36.7% of aid, Pillar 2 (consolidation of the foundations of strong and sustainable growth) 26.0%, Pillar 3 (development of human capital) 31.5%, and Pillar 4 (community development and reduction of regional imbalances) just 5.7%. This shows that above all the GoT and aid donors want to strengthen the country's socioeconomic stability, the sine qua non condition for economic growth. Over the same period, the agriculture, forestry, and fisheries sector received just an estimated 1.6% of public development aid, barely one-sixth of the total aid spent on Pillar 2, which is very little considering the importance of the agriculture sector to the economy as a whole (40% of GDP, 20% of export revenues, 60% of the population classified as rural, etc.) and its potential role in poverty reduction.
28. In May 2010, donors involved in supporting the agricultural sector formed the Group of Development Partners for the Agricultural Sector (Groupe des Partenaires Techniques et Financiers du Secteur Agricole – GDPAS), which acts as a forum for discussion, coordination, and interface between the GoT and Development Partners concerning the PNIASA implementation.
13 Source: IFDC/UNDP/UNCDF 2010. 14 Sources for paragraphs 17 and 18: UNDP 2010a and UNDP 2011b.

9
Figure 1 : Cadre de mise en œuvre des financements à caractère public dans le secteur agricole
MDB
*DP:
AfDB
BADEA
EBID
ECOWAS
EU
IFAD
IFDC-Africa
IsDB
SFD
UN (FAO, UNDP)
WADB
WAEMU
WB
Bilateral:
CCFCC
MAEP GENERAL SECRETARIAT
Grass roots communities working in the agricultural sector
Figure 1. Implementation framework for public expenditures in the agricultural sector
INTERNAL RESOURCES
MEF
Projects
PASA
PARTAM
PADAT
PBVM
PPAAO
Autonomous agencies
CN/CMLA
ANSAT
ICAT
UTCC
NSCT
INFA
ONAF
ITRA
CAGIA
Central Directorate
s
DPCA
DAF
DSID
DRH
DPV
DAER
DE
DA
DPA
DS
Regional Directorate
Savanna DRAEP 4 DPAEPs
Kara DRAEP 7 DPAEPs
Central DRAEP 4 DPAEPs
Uplands DRAEP
9 DPAEPs
Maritime DRAEP
6 DPAEPs
Civil society organizations
FONGTO UONGTO
INADES
Training
MERF MPDAT
PRIVATE SECTOR &
FEDERATIONS
EXTERNAL
RESOURCES* Local
authorities (Deconcentrated cooperation)
Credit organizations Organismes
de crédit
Universities, agricultural
training centers MAEP
Delegated ministry
Private Office
Private Office
Red Cross
AVSF
AFITO
CONGAT
AGAÏB
CPC
FNGPC
FUPROCAT
MTP
Projects
etc.

10
2. LEVEL OF AGRICULTURAL PUBLIC EXPENDITURE
2.1. MAEP Budget: General Overview
29. The budget allocated to MAEP every year by the Budget Act includes:
i. The budget of the Cabinet, the General Secretariat (SG/MAEP) and the Central Directorates; there were six Central Directorates until 2009 (Agriculture, Livestock and Fisheries – Rural Development and Infrastructure – Statistics, Data Processing, and Documentation – Human Resources and Planning – Administration and Finance), and ten in 2010: Agricultural Directorate (DA/MAEP), Directorate for Plant Protection (DPV/MAEP), Directorate for Seeds (DS/MAEP), Directorate of Livestock Farming (DE/MAEP), Directorate of Fisheries and Aquaculture (DPA/MAEP), Directorate of Rural Land Development and Equipment (DAER/MAEP), Directorate for Agricultural Statistics, Data Processing and Documentation (DSID/MAEP), Directorate for Planning and Agricultural Cooperation (DPAC/MAEP), Directorate of Administration and Financial Affairs (DAF/MAEP) and Human Resources Directorate (DRH/MAEP); MAEP is undergoing further restructuring following the creation of the MAEP Delegated Ministry in Charge of Rural Infrastructure (MDMAEPIR) in 2010, an audit financed by the UNDP15 and preparations for the launching of important upcoming projects (PASA, PADAT, and WAAPP);16
ii. The budget of the five Regional Directorates of Agriculture, Livestock, and Fisheries (DRAEP);17
iii. Allocations to autonomous agencies: Institut de Conseil et d’Appui Technique (ICAT, Technical Assistance and Support Institute), Institut Togolais de Recherche Agronomique (ITRA, Agronomical Research Institute of Togo), Agence Nationale de Sécurité Alimentaire du Togo (ANSAT, National Agency for Food Security), Centrale d’Approvisionnement et de Gestion des Intrants Agricoles (CAGIA, Central Procurement and Management of Agricultural Inputs), Office National des Abattoirs et Frigorifiques (ONAF, National Slaughterhouse and Cold Chain Equipment Office), Nouvelle Société Cotonnière du Togo (NSCT, New Parastatal Togo Cotton Company), Institut National de Formation Agricole de Tové (INFA, National Institute for Agricultural Training in Tové), Bureau National et Chambres Régionales d’Agriculture (BN/CRA, Regional and National Chambers of Agriculture) and the Comité National pour la Campagne Mondiale de Lutte pour l’Alimentation (CN/CMLA, National Committee for the International Fight against Hunger);
30. The Cabinet, SG/MAEP, Central Directorates, and DRAEP have separate lines of funding in their provisional budgets for staff expenses, operating expenditures, and, since 2009, their capital expenditures from internal and external resources (until 2008, all capital expenditures were combined under the SG/MAEP).
31. Since the 2011 fiscal year, the MDMAEPIR, created in 2010, has had its own budget and has assimilated the DAER18 as well as a majority of the agricultural development
15 UNDP 2011a. 16 World Bank 2011d. 17 Five regions are still at the deconcentrated administration stage.

11
projects: Projet d’Aménagement et Réhabilitation des Terres Agricoles dans la Zone de Mission-Tové (PARTAM, Development and Rehabilitation Project for Agricultural Lands in the Mission-Tové Area), Projet d’Aménagement Hydro-Agricole de la Basse Vallée du Fleuve Mono (PBVM, Irrigation Development Project in the Lower Valley of the Mono River), Projet de Développement Rural Intégré de la Plaine de Mô (Integrated Rural Development Project for Mô Plain), Projet d’Aménagement des Terres Agricoles de la Plaine de l’Oti (Farmland Development Project for Oti Plain), and the Projet d’Aménagement des Terres Agricoles de la Plaine de Dzagblé (Farmland Development Project for Djagblé Plain). For this study, feeder roads19 were excluded from the examination of the MDMAEPIR budget.
32. Autonomous agencies have had a non-itemized “transfer” or “subsidy” line; since 2009, they have also had a development budget. The largest subsidies go to ICAT and ITRA (respectively, 1,000 and 625 million CFA francs in 2011), and represent their main source of funding (box 4). With this subsidy, the autonomous agencies pay their operating costs, contract staff, which for ICAT and ITRA represent roughly two-thirds of their total staff (about 500 out of 750 people for ICAT, and 200 out of 300 people for ITRA), and, in some years, equipment. The civil servants working in autonomous agencies, who are paid by the State, are globally recorded under the SG/MAEP. For ICAT and ITRA, the payroll for civil servants equals about 300 and 200 million CFA francs per year, respectively.
33. The NSCT, a semipublic company founded in 2008 that is independently financed, in principal, only received the State’s payment of its share of capital in 200820 and a subsidy line entitled Cotton Producer Price Support Fund in 2010 and 2011, which has heretofore remained unused. The NSCT’s accounts are not included in the State budget and were not taken into consideration for this study, in accordance with NEPAD directives (AU/NEPAD 2005, see section 2.4).
34. The administrative composition of the 2010 MAEP provisional budget (Figure 2), excluding feeder roads, illustrates how highly centralized resource management currently is. Seventy percent of the budget is placed under the direct authority of the central services, and only two percent under DRAEP authority. Furthermore, of the 800 million CFA francs budgeted for DRAEP that year, the majority (59%) were salaries paid automatically by
18 At the time of writing, the MDMAEPIR organization chart had not yet been officially established; it proposed a Directorate for Development (in charge of agricultural land issues, agricultural development and related infrastructures, including feeder roads) and a Directorate for Rural Equipment and Agricultural Mechanization (in charge of agricultural mechanization and processing and conservation equipment and units). Source: MDMAEPIR 2011. 19 Feeder roads will be treated separately in this analysis for two reasons: (i) first, they are excluded from the analysis according to COFOG methodology recommended by NEPAD (see section 2.4) ; (ii) second, they are not placed under the Ministry in charge of agriculture in all countries (in fact, even in Togo, they were under the supervision of the Ministry of Infrastructures and Public Works until 2010); their inclusion in the MAEP budget would thus render international comparisons ineffective, all the more so since, as shall be illustrated, they have represented significant amounts in recent years. 20 1,200 million CFA francs, or 60% of the capital; the remaining 40% (800 million CFA francs) is held by cotton producers through the Fédération Nationale des Groupements de Producteurs de Coton (FNGPC, Togo Federation of Cotton Producers’ Groups) and was paid on behalf of the producers by the European Union (EU) STABEX program.
In future budgets, it would be advisable for the civil servants assigned to
autonomous agencies to be recorded under each of these agencies in order to
facilitate an analytical monitoring by function.

12
the central level; their actual managerial autonomy was thus limited to their investment budget (13% of their allocation) and their provisions for operations (28%).
Figure 2. Administrative breakdown of the MAEP provisional budget, excluding feeder roads, 2010 (in billions of CFA francs)
Note: This refers to the initial 2010 provisional budget, prior to the budget amendment, contrary to the data presented in the sections below. The payroll of civil servants assigned to autonomous agencies, which is recorded under the SG/MAEP in the MAEP budget, was estimated at 520 million CFA francs, and paid into the autonomous agency budget. Source: Authors’ calculations based on data provided by the DAF/MAEP
35. Besides the NSCT, a number of MAEP entities have their own resources. This is true of four central directorates (DAER, DE, DPA, DPV), which bill for services provided (ex.: the inspection of imported food for DE). These directorates have a MEF-certified advance funds administrator who turns this revenue over to the Treasury. This revenue thus figures in the State budget but represents modest sums (less than 10 million CFA francs per year for DE). Twenty percent of this revenue is placed in a special account that the directorates concerned can use for operating expenses (DE pays four contract workers with these funds).
36. This is also true of ITRA and ICAT which, in addition to the subsidy and capital expenditures budget allocated to them, generate their own resources from the provision of services (ex.: farmer extension services provided as part of an ICAT project) or the sale of goods (ex.: the sale of pre-basic and basic seeds, for ITRA). ITRA also receives income from research and partnership contracts (CGIAR, foreign foundations, etc.) and a contribution from the cotton sector disbursed by NSCT (see box 4 below). ITRA and ICAT keep this revenue in their own accounts. It is not included in the State budget, but is nevertheless managed by an accountant assigned to each of these institutions by the MEF. This revenue represents a minority of their resources, yet it plays an important role in cash availability, especially for ITRA.
37. The largest volume of own resources is managed by CAGIA and generated by the resale of agricultural inputs to farmers. Until 2009, this revenue was paid into an account
Central services, 25, 69%
DRAEP, 1, 2%
Autonomous agencies, 10, 29%

13
managed directly by CAGIA and was no longer included in the State budget.21 Since 2009, it has been turned over to the Treasury,22 which unfortunately has led to cash availability problems for the payment of carriers and, consequently, to delays in the delivery of fertilizer throughout the country (see Chapter 5).
38. Finally, to a lesser extent, ANSAT also generates revenue through the resale of grains. In 2009, it also lost direct control of its revenue to the Treasury (see Chapter 5).
2.2. Level and Evolution of the MAEP Provisional Budget, Excluding Feeder Roads23
39. The MAEP provisional budget (Figure 3), excluding feeder roads, increased 3.5 times in current terms between 2002 and 2011, increasing from 7 to 25 billion CFA francs. In constant terms, it increased threefold. The peak observed in 2010 (35 billion CFA francs) was the result of extraordinary items (see below). The MAEP budget estimates increased slightly more rapidly than the State’s global provisional budget which, over the same period, increased threefold in current terms, increasing from slightly less than 200 to around 500 billion CFA francs, and 2.5 times in constant terms (Figure 4).
Figure 3. Evolution of the MAEP provisional budget, excluding feeder roads, in current and constant terms (2002 CFA francs), 2002–2011
Note 1: In 2010 and 2011, the feeder road lines included in the MAEP provisional budget and excluded from this graph equaled 14.6 and 7.3 billion CFA francs, respectively; the MAEP total budget for these two years was thus 49.1 and 32.6 billion CFA francs. Note 2: The 2008, 2009, and 2010 provisional budget reflect revisions made during the course of the year. Source: Authors’ calculations based on data provided by the DAF/MAEP and the Directorates of the Budget (DB/MEF), Financial Affairs (DF/MEF), Control and Implementation of the MEF National Plan (DCEP/MEF),
21 Representing 5 billion CFA francs in 2007, this fund (known as the KR-II Fund, prior to the creation of CAGIA in October 2008) was identified in the EU’s 2009 PEFA report as one of the two most significant extra-budgetary funds in Togo, after the Educational Support Fund (8.5 billion CFA francs) financed by school fees. Source: EU 2009. 22 In 2006, the PEMFAR review (World Bank/AfDB/UNDP/France 2006) estimated at more than 200 the number of accounts opened in the banking system in the name of the State; in 2009, the Treasury began centralizing them, which affected CAGIA and ANSAT in particular. 23 See note 16 on page 11.
0
5
10
15
20
25
30
35
40
2002 2003 2004 2005 2006 2007 2008 2009 2010 2011
Bill
ions o
f C
FA
fra
ncs
Current terms
Constant terms, 2002

14
and the Economic Directorate (DAE/MEF) of the Ministry of Economy and Finance (MEF). See Appendix 2 for details.

15
Figure 4. Evolution of the State provisional budget, in current and constant terms (2002 CFA francs), 2002–2011
Source: Authors’ calculations based on data provided by the DB/MEF, the DF/MEF, the DCEP/MEF, and the DAE/MEF. See Appendix 2 for details.
40. Some years, extraordinary items inflate the MAEP provisional budget. They must be isolated in order to evaluate the evolution of the core budget. They include:
i. Replenishing of the agricultural inputs purchasing fund, which does not apply every year and represents widely varying amounts (for example, in 2007, no budget was set aside for the purchase of inputs, while the 2008 provisional budget for the purchase of fertilizer, seed, and preservation products was 14.1 billion CFA francs, or 58% of the MAEP total provisional budget);
ii. Reimbursement of debts and the redundancy plan during the SOTOCO liquidation from 2006 to 2009 (in 2007, 11 billion CFA francs were budgeted to reimburse debts to farmers, an amount representing 52% of the MAEP provisional budget for that year);
iii. Payment of the State’s equity investment in the NSCT in 2008 (1.2 billion CFA francs);
iv. To a lesser extent, the replenishing of the account for grain purchases under the food safety program;
v. Finally, in 2010, two items representing a total of 37% of the budget estimates, excluding feeder roads:
- The global amount of the IsDB loan for the Integrated Rural Development Project for Mô Plain, or 8.2 billion CFA francs, was included in the budget instead of the planned annual installment;
- MAEP included in its provisional budget a total of 4.5 billion CFA francs of projects to be funded by the EU Food Facility fund; this budgetary support, amounting to an overall total of €8.1 million, or 5.3 billion CFA francs, was
0
100
200
300
400
500
600
2002 2003 2004 2005 2006 2007 2008 2009 2010 2011
Bill
ions o
f C
FA
fra
ncs
Current terms
Constant terms, 2002 base

16
paid to the GoT in November 2010, but MAEP ultimately did not benefit from it directly.24
41. Excluding extraordinary items and feeder roads, the core of the MAEP provisional budget fluctuated between 6 and 10 billion CFA francs between 2002 and 2009, and genuinely began to increase in 2010, nearly doubling to 19 billion CFA francs (Figure 5). The isolation of extraordinary items also reveals that despite an apparent significant decrease in the budget estimates in 2011 (-26% excluding feeder roads), the core of the budget actually continued to increase, reaching 23 billion CFA francs. This strong increase in the core of the budget as of 2010 obviously illustrates the desire of public authorities to significantly increase support to the agricultural sector.
Figure 5. Isolation of extraordinary items in the MAEP budget estimates, excluding feeder roads (in current terms), 2002–2011
Source: Authors’ calculations based on data provided by the DAF/MAEP, the DB/MEF, the DF/MEF, and the DCEP/MEF. See Annex 2 for details.
2.3. Level and Evolution of the MAEP Implemented Budget, Excluding Feeder Roads
42. Over the 2002–2010 period, the MAEP budget implementation rate was well below the State’s global budget implementation rate (Box 1 and Figure 6). The average implementation rate of the MAEP budget, excluding feeder roads, was 56% over the period, compared to 77% for the State overall. The MAEP implementation rate, which was particularly low at around 40 to 50% until 2005, then increased steadily until 2008, when it met the national average (77%), notably thanks to high implementation rates for the fertilizer
24 This incident was a source of controversy in Togo. Some did not understand why budgetary aid motivated by the 2008 hike in agricultural prices was not implemented by MAEP, especially since the specific conditions of its disbursement involved the drafting of a PNIASA review and a review of the agricultural sector by MAEP (MAEP 2010b). In fact, this budgetary support provided within the framework of the Food Facility program was not meant to be utilized directly by MAEP; it was specifically meant to permit “an increase of the relative share of public expenditures allocated to the agricultural sector” (EU 2011c). This specific objective was reached, as Figure 5 illustrates.
0
5
10
15
20
25
30
35
40
2002 2003 2004 2005 2006 2007 2008 2009 2010 2011Bill
ions o
f C
FA
fra
ncs
IsDB Mô misreported amount
Food Facility EU
Replenishing of grain purchasingaccount
Replenishing of fertilizer andseed purchasing account
NSCT capital
Reimbursememt of SOTOCOdebts
Core budget

17
and food security stock purchasing programs implemented that year. The implementation rate then fell again, reaching only 44% in 2010. The reasons for this evolution will be discussed in Chapter 4, which examines the effectiveness of the MAEP budget development and implementation process.
Box 1. Where can one find an estimation of the MAEP budget implementation rate
today?
Unfortunately, MAEP does not have one available. Only DF/MEF and DFCEP/MEF
(Direction du financement et du contrôle de l’exécution du Plan) are capable of providing
information about the performance rates of MAEP’s various budget lines, the former for
staff and operating expenditures (including the subsidies to autonomous agencies), and the
latter for the capital expenditures budget. The information concerning capital expenditures
from external resources is obviously incomplete, since DFCEP does not always have the
means and expertise to collect the implementation levels of projects included in the State
budget but implemented directly by independent project management units (PMUs) or
donors. It does not receive this information automatically because, at this time, Togo does
not have a universal expenditure management system: the sectoral ministries, various
MEF directorates involved in the public expenditure implementation chain, and the
donors maintain their data independently, without any systematic reconciliation of the
various sources of information.
In the future, it would be advisable for DAF/MAEP to carry out monthly
monitoring of the financial implementation of all projects included in the budget,
and no longer leave this task solely to DFCEP/MEF. A more accurate monitoring
of the budget is the key to improving implementation rates, which would
undoubtedly eliminate certain obstacles in a timely manner.
Furthermore, it is hoped that when the new Togo Court of Auditors is brought
into service, it will expand the study of implementation rates and make them
public, thanks to a management account and a Budget Review Act.1
___________________
1 The Budget Review Act is provided for in the 1989 Loi Organique Relative aux Lois de Finances
(LORLF, Organic Law relating to Public Finance Laws), but was never carried out in Togo; the Court
of Auditors, instituted by the 1992 Constitution and whose operation and organization were
established by an organic law in 1998, is not yet ready for operation, even though the magistrates
who will sit upon it were elected in 2009.

18
Figure 6. Implementation rates for the MAEP budgets (excluding feeder roads) and the State’s comprehensive budgets, 2002–2010
Source: Authors’ calculations based on data provided by the DAF/MAEP, the DB/MEF, the DF/MEF, and the DCEP/MEF. See Appendix 2 for details.
43. Consequently, the evolution of the MAEP implemented budget, excluding feeder roads, in the 2002–2010 period was substantially different from that of the provisional budget (Figure 7): the implemented budget increased fivefold in current terms, increasing from 3 to 15 billion CFA francs, and by four in constant terms, with a peak in 2008 due to a better implementation rate. Over the same period, the State’s implemented budget increased slightly more than threefold in current terms, increasing from about 120 to nearly 400 CFA francs, and by slightly less than three in constant terms (Figure 8).
Figure 7. Evolution of the MAEP implemented budget, excluding feeder roads, in current and constant terms (2002 CFA francs), 2002–2010
Note: In 2010, the implementation of feeder roads included in the MAEP budget but excluded from this graph equaled 12.6 billion CFA francs, bringing the MAEP total implemented budget to 29.0 billion CFA francs. Source: Authors’ calculations based on data provided by the DF/MEF, the DCEP/MEF, and the DAE/MEF. See Appendix 2 for details.
0%
10%
20%
30%
40%
50%
60%
70%
80%
90%
2002 2003 2004 2005 2006 2007 2008 2009 2010
Government
MAEP (excluding feederroads)
0
2
4
6
8
10
12
14
16
18
20
2002 2003 2004 2005 2006 2007 2008 2009 2010
Bill
ion
s o
f C
FA
fra
ncs
Current terms
Constant terms, 2002 base

19
Figure 8. Evolution of the State’s implemented budget, in current and constant terms (2002 CFA francs), 2002–2010
Source: Authors’ calculations based on data provided by the DF/MEF, the DCEP/MEF, and the DAE/MEF. See Annex 2 for details.
2.4. Analysis of the Level of Support to the Agricultural Sector Using COFOG Methodology
44. With the Maputo Declaration in 2003, African States pledged to increase the share of their national budget dedicated to agriculture, the goal being a minimum of 10%, in order to reach at least 6% agricultural growth per year. Following this commitment, NEPAD defined the methods for calculating the share of agricultural expenditures in national budgets (AU/NEPAD 2005): actual public expenditures (not allocated budgets) as defined by the United Nations Classification of the Functions of Government (COFOG), in the broadened agricultural sector, which includes the fields of agriculture (plant and livestock production), forestry and hunting (including forestry productions other than wood), and fishing, must be included. Applied research expenditures in each of these sectors must be included. However, feeder road expenditures do not figure among the expenditures listed by NEPAD.
45. A number of agricultural public expenditures that are funded by internal or external resources but not included in the national budget, and in whose implementation MAEP is more or less involved, were compiled and included in this analysis. They include, in particular (see Appendices 1 and 2 for details):
i. internal resources allocated off-budget (on instructions from the presidency) to autonomous agencies of MAEP;
ii. own and external resources of ICAT and ITRA (see Box 4), which have heretofore never been included in the national budget;
iii. “emergency” projects implemented after the 2008 crisis and not included in the national budget: the agricultural component of the Community Development Project (CDP) financed by the World Bank in 2009–2010, a food security support project
0
50
100
150
200
250
300
350
400
450
2002 2003 2004 2005 2006 2007 2008 2009 2010
Bill
ions o
f C
FA
fra
ncs
Current terms
Constant terms, 2002 base

20
financed by the IsBD in 2009 and 2011, the Seed Emergency Program financed by WARDA in 2010, the agricultural capital section of the Emergency Food Security Program (EFSP) financed by the WADB in 2010–2011 (the commercial seed section implemented in 2009 was included in the State budget);
iv. projects financed by the Agence Française de Développement (AFD, French Development Agency) up to 2005 and the budgetary support France provided for fertilizer imports in 2008 (€5 million);
v. technical assistance projects, studies, and actions financed by the FAO and the UNDP and not included in the State budget (some programs financed by these institutions are included in the budget, while others are not);
vi. programs and studies financed by the EU and not included in the State budget, especially agriculture expenditures financed by the STABEX COM 90–94 and COM 95–99 funds (see box 2); and
vii. programs financed by China (fertilizer donations estimated at roughly 300 and 400 million CFA francs in 2004 and 2005, construction of an agricultural training center near Lomé for 2.8 billion CFA francs in 2010, manager training program in China estimated at 200 million CFA francs per year).
46. Moreover, a number of agricultural development actions have been implemented in recent years by ministries other than MAEP, namely the Ministry of Planning, Development, and Land Use Planning (MPDAT) and the Ministry in Charge of Grassroots Development (MDB),25 created in late 2008.
47. The projects implemented under the supervision of MPDAT and included in this analysis are:
i. the Support Program for Agroforesty and Forestry Village Initiatives in Southwest Togo (PAFVI), implemented from 2001 to 2004 with funding from the EU/EDF;
ii. an estimate of the agricultural accomplishments of the Pluriannual Micro-projects Program (PPMR), implemented from 2001 to 2009 and also financed by the EU/EDF; and
iii. an estimate of the agricultural component of the Millennium Villages Project financed by the UNDP and launched in 2009.
48. The projects implemented under the supervision of the MDB, the near majority of which are financed by internal resources, are:
i. the Support Program for Economic Activities and Producer Associations (PSAEG), launched in 2009;
ii. the market hall construction component of the Social and Community Infrastructure Program, launched in 2010; and
iii. the Roots and Tuber Development Project, launched in 2010 in collaboration with the Anié sugar refinery (SINTO).
25 Full name: Ministry of Grassroots Development, Crafts, Youth, and Youth Employment.

21
49. Lastly, in Togo, forestry development public expenditures are managed by the Ministry of Environment and Forest Resources (MERF); determining the forest and environmental components of the actions implemented is not always easy. In collaboration with MERF representatives, a set of coefficients was defined in an attempt to estimate forestry development expenditures (Appendix 1). The autonomous budget of the Office for the Development and Exploitation of Forests (ODEF) was included as recommended by NEPAD (AU/NEPAD 2005).
Box 2. Breakdown of agricultural expenditures made under the STABEX COM 90–
94 and COM 95–99 programs (EU/EDF)
The STABEX COM 90–94 and COM 95–99 programs financed by the EU/EDF were
implemented from 2007 to 2010 by an ad-hoc unit under the authority of the National
Authorizing Officer for EDF programs, the Ministry of Planning, Development, and Land
Use Planning. Amounting to a total of €26 million, or 17.1 billion CFA francs, they
included a feeder road construction and rehabilitation component (7.6 billion CFA francs),
an agricultural development component (4.6 billion CFA francs), a rural water supply
component (3.4 billion CFA francs) and a coordination component (1.5 billion CFA
francs). The agricultural expenditures totalled 4.1 billion CFA francs and included the
following:
• 2.4 billion CFA francs for the cotton industry:
- Construction of storage facilities: 0.7 billion CFA francs,
- Share of the FNGPC in NSCT capital: 0.8 billion CFA francs,
- Support of the FNGPC: 0.9 billion CFA francs;
• 1.2 billion CFA francs for the coffee and cocoa industry:
- Fight against swollen shoot (cocoa tree disease): 0.3 billion CFA francs,
- Support of FUPROCAT: 0.9 billion CFA francs; and finally
• 0.5 billion CFA francs for lowland development.
These agricultural expenditures were included in the MAEP provisional budget for the
2007 and 2008 fiscal years, but were actually implemented in 2009 and 2010. The
accomplishments inscribed for the 2007 and 2008 budgets by DFCEP/MEF thus
obviously concern the feeder road component, the implementation of which began in
2007; for the purpose of this study, they were thus deducted from the MAEP implemented
budget. The agricultural expenditures of the STABEX COM 90–94 and COM 95–99
programs were thus made outside the State budget.
Source: EU 2011b.

22
50. The compilation of all this data—the MAEP implemented budget expenditures, off-budget implemented expenditures, the implemented agricultural expenditures of other ministries, and the MERF implemented expenditures for forest and agricultural development—reveals Togo’s achievements regarding its commitment to the Maputo Declaration (Table 1).
Table 1. Estimate of implemented agricultural public expenditures using NEPAD’s COFOG methodology, 2002–2011 (in millions of CFA francs)
2002 2003 2004 2005 2006 2007 2008 2009 2010 2011
(pred.)
From MAEP budget, excluding feeder roads
2,811 3,554 3,204 3,292 7,458 15,703 18,765 11,077 15,173 25,289
Under MAEP super-vision, not in the State budget
2,247 1,696 1,530 2,513 536 587 3,715 4,112 6,115 1,940
Under the supervision of other ministries MPDAT MDB Subtotal
675 -
675
675 -
675
675 -
675
350 -
350
350 -
350
350 -
350
350 -
350
396 745 1,141
170 1,605 1,775
62
1,305
1,367
MERF forestry and agriculture
877 865 1,056 1,603 1,105 1,110 1,305 1,285 1,765 2,762
Total 6,609 6,790 6,465 7,758 9,450 17,750 24,135 17,615 24,828 31,357
% State’s implemented budget
5.6% 5.3% 4.3% 5.0% 4.9% 8.2% 9.8% 5.1% 6.4% 5.7%
Source: Authors’ calculations based on data provided by: DAF/MAEP, DPAC/MAEP, CAGIA, ICAT, ITRA, MERF, DF/MEF, DFCEP/MEF, MDB, AFD, FAO, UNDP, Chinese Embassy; EU 2004; EU 2007, EU 2011b. See Appendix 2 for details.
51. The share of public expenditures dedicated to agriculture thus fluctuated around 5% for the majority of the period studied, with a peak of 8.2% and 9.8% in 2007 and 2008, resulting, as has been shown, from significant extraordinary items in the MAEP budget for these two years (the SOTOCO liquidation and input purchasing, in particular).
52. The increase in agricultural public expenditures to 6.4% in 2010 embodies the evident political desire to increase support of the agricultural sector as of that year. This achievement nevertheless falls below the level initially announced by Togolese authorities. Indeed, in 2010, it was declared that Togo had reached the objective of dedicating 10% of its State budget to agriculture, but this figure was based on the MAEP provisional budget, which, as illustrated above, contained incorrect information (the total amount of the IsDB Mô Plain project was included in the budget) as well as the feeder roads (15 billion CFA francs, or 30% of that year’s budget estimates), and took into account neither the budget revision carried out during the year nor, more importantly, this budget’s extremely low implementation rate (44%, excluding feeder roads).
53. In 2010, the share of the national budget dedicated to agriculture was broken down between the various contributors as follows: from the MAEP budget: 4.2%; off-budget from MAEP: 1.6%; other ministries: 0.5%; MERF: 0.5% (Figure 9).
54. It should be noted that despite the continuing increase of the core MAEP budget, as illustrated above, the share of public expenditures dedicated to agriculture should fall below 6% in 2011.

23
Figure 9. Contributions of the various contributors to the share of agricultural expenditures in the State’s global implemented budget, 2002–2010
Source: Authors’ calculations based on data provided by: DAF/MAEP, DPCA/MAEP, CAGIA, ICAT, ITRA, MERF, DF/MEF, DFCEP/MEF, MDB, AFD, FAO, UNDP, Chinese Embassy; EU 2004; EU 2007, EU 2011b. See Annex 2 for details.
2.5. Analysis of the Level of Support to the Agricultural Sector, Including the Estimated Amount of the Fertilizer Subsidy
55. The integrality of the expenditures managed by CAGIA for the importation and distribution of subsidized fertilizers, whether or not they were included in the MAEP budget, were taken into account when preparing the above calculations for the share of public expenditures dedicated to agriculture. Until 2008, these transfers corresponded to the replenishing at irregular intervals of a revolving account managed by the CAGIA, a replenishing made necessary by a depletion of the fund caused by the subsidies and the CAGIA’s operating costs, on the one hand, and the fluctuations of world fertilizer prices, on the other hand. As of 2009, the year in which fertilizer sales revenue began to be collected directly by the Treasury, these expenditures corresponded exactly to the fertilizer purchasing and distribution cost; they had greatly increased due to the significant rise in the volume imported, which had increased from 5 to 10,000 tons per year until 2008 to 30,000 tons in 2009 and 2010 (including the CDP’s imports in 2009) and 35,000 tons in 2011 (see Chapter 5).
56. These expenditures thus constituted a budgetary requirement for the Togolese State, but they do not accurately represent actual support of the agricultural sector since they were partially offset by revenues from the sale of subsidized fertilizer to farmers. Using the estimated amount of the subsidy paid for by the Togolese State (see the calculation in chapter 5), which varies according to the fertilizer purchase price on the international market, provides a better approximation of the State’s support of the agricultural sector (see table 2). Moreover, this calculation method allows comparisons to be made with countries that use a voucher system to manage input subsidies (which may one day be the case for Togo), since in such a system only the net cost of the subsidy is covered by the State.
0%
2%
4%
6%
8%
10%
12%
2002 2003 2004 2005 2006 2007 2008 2009 2010
Total COFOG
MAEP on budget
MAEP off budget
Other ministries
MERF

24
Table 2. Estimate of implemented public agricultural expenditures using the estimated amount of the net fertilizer subsidy, 2005–2011 (in millions of CFA francs)
2005 2006 2007 2008 2009 2010 2011
(prov.)
Estimate of the fertilizer subsidy 800 200 0 1,400 5,300 600 2,900
Estimate of public agricultural expenditures including the fertilizer subsidy
7,155 8,479 17,740 11,204 18,912 22,193 32,872
% State’s implemented budget 4.6% 4.4% 8.2% 4.5% 5.4% 5.7% 6.0%
Note: The net fertilizer subsidy cannot be determined using the data available for years prior to 2005. Source: Authors’ calculations based on data provided by: DAF/MAEP, DPAC/MAEP, CAGIA, ICAT, ITRA, MERF, DF/MEF, DFCEP/MEF, MDB, AFD, FAO, UNDP, Chinese Embassy; EU 2004; EU 2007, EU 2011b. See Appendix 2 and Chapter 5 for details.
57. Using the estimated amount of the subsidy for fertilizer use instead of the implemented expenditures for replenishing the CAGIA account until 2008, and that for fertilizer imported and distributed in 2009 and after, confirms that the share of public expenditures dedicated to agriculture is increasing. According to this analysis method, the share of agricultural public expenditures reached 5.7% in 2010. Again, the peak recorded in 2007 is largely explained by expenditures related to the SOTOCO liquidation (12 billion CFA francs).
2.6. Sources of Financing for Agricultural Public Expenditures
58. Over the 2002–2010 period, internal resources were used to finance 64% of agricultural public expenditures, excluding feeder roads and forestry, while 36% were financed from external resources (Figure 10). This ratio reflects the fact that a large number of donors withdrew during the socioeconomic difficulties that gripped the country from the early 1990s to the mid-2000s.
Figure 10. Sources of public agricultural financing (excluding feeder roads and forestry), 2002–2010 (in billions of CFA francs)
Note: This graph takes into account all implemented agricultural public expenditures from 2002 to 2010 (from the MAEP budget, off-budget, and from other ministries), excluding feeder roads and forestry. Source: Authors’ calculations based in data provided by: DAF/MAEP, DPAC/MAEP, CAGIA, ICAT, ITRA, DF/MEF, DFCEP/MEF, MDB, AFD, FAO, UNDP, Chinese Embassy; EU 2004; EU 2007, EU 2011b. See Annex 2 for details.
Internal resources, 70, 64%
External resources, 40, 36%

25
59. The breakdown of external funding by donor (Figure 11) reveals the preponderance of the EU. Some of their programs (such as PPMR) were maintained during the period of socioeconomic difficulty while others restarted in 2006 (STABEX). Furthermore, all of the EU programs are implemented by partner organizations (NGO, FAO) or non-Governmental PMUs, which ensure these programs a rapid disbursement of funds. In contrast, the numerous projects financed by the BADEA during the period studied (PBVM, PARTAM, etc.), and implemented directly by the MAEP were characterized by very long delays and very low disbursement rates caused by complex bureaucracy and communication problems between the Togolese authorities and the donors (see Chapter 4).
Figure 11. Breakdown of external funding by donor, 2002–2010 (in billions of CFA francs)
Source: Authors’ calculations based on data provided by: DAF/MAEP, DPAC/MAEP, CAGIA, ICAT, ITRA, MERF, DF/MEF, DFCEP/MEF, MDB, AFD, FAO, UNDP, Chinese Embassy; EU 2004; EU 2007, EU 2011b. See Annex 2 for details.
2.7. NGO-Implemented Public Expenditures and Cross-Industry Organizations
60. The programs implemented by leading local and international NGOs present in Togo were inventoried (AVSF, the French Red Cross, RAFIA, CIDR/ETD, INADES Training, GRADSE [Action Research Group for Socio-economic Development], etc.). The amounts mobilized by these NGOs have also increased significantly: they are estimated to have risen from around 700–800 million CFA francs per year in the 2002–2005 period to more than 2 billion CFA francs per year in 2009, 2010, and 2011 (see details in Appendix 2). These programs include actions financed by the EU Food Facility, implemented by NGOs (AVSF, French Red Cross, Spanish Red Cross).
61. These public expenditures also include resources mobilized by the only cross-industry organization operating in Togo today: the Coordinating Committee for the Coffee and Cocoa Sectors (CCFCC). Its resources, which come exclusively from the voluntary contribution of exporters, total 200 to 300 million CFA francs per year and primarily serve to finance
10.6
5.54.9
4.4
2.81.8 1.6 1.4 1.3 1.2
0.6
3.8
0.0
2.0
4.0
6.0
8.0
10.0
12.0
Bill
ion
s o
f C
FA
fra
ncs

26
research, extension services, subsidies for the use of certain inputs, and subscriptions to international organizations active in the sector.
2.8. Feeder Road Expenditures
62. Expenditures for the rehabilitation and creation of feeder roads have significantly increased since 2008 because of flood damage (Table 3). As of 2008, the greater complexity of the structures to be built has also led to a significant increase in the unit costs, which amount to an average of 12 million CFA francs per kilometer. It is important to note that, in Togo, all feeder road work is delegated to private companies by invitation to bid.
63. The “50 km” program was launched in 2009–2010; it involved the construction or rehabilitation of 50 km of roads in each of the 35 prefectures, or 1750 km in all, as well as the construction of 750 km of roads per region per year beginning in 2011.26 Roughly 1,300 km of road were opened or rehabilitated in 2010 under this program and through implementation of EU/EDF STABEX funds. However, due to a lack of resources, the objectives of the second phase set to begin in 2011 had to be lowered to a “30 km” program, or 1,150 km in all, and spread out over 2011 and 2012: 5 billion CFA francs, or 37% of the program’s needs, were budgeted for 2011, while 8.5 billion CFA francs, or 63%, will be budgeted in 2012. Furthermore, 1.8 billion CFA francs were budgeted in 2011 for the maintenance of listed roads and slightly more than 500 million CFA francs for the installation of metal bridges. These amounts fall very short of what is needed (Box 3).
Table 3. Feeder road works, 2000–2010 (in km and millions of CFA francs)
2000 2001 2002 2003 2004 2005 2006 2007 2008 2009 2010
2011
(prov.)
Km 430 727 534 398 691 712 750 465 409 668 1,291 425
Millions CFA francs
718 1,338 1,488 1,424 1,033 722 1,857 780 5,110 5,343 14,135 5,000
Source: MDMAEPIR
64. Over the 2000–2011 period, 37% of feeder road rehabilitation was financed using external resources (primarily EU/EDF STABEX, WADB, and EBID), while 63% was financed using internal resources; this ratio is notably similar to that observed above for agricultural public expenditures.
26 Republic of Togo 2010.
27
2.9. Summary of Public Agricultural Expenditures—International Comparisons
65. In 2010, agricultural public expenditures, as estimated using COFOG methodology, represented 3.9% of Togo’s agricultural GDP (Table 4). If the resources implemented by NGOs and feeder road works are also taken into consideration, the estimated amount of support to the agricultural sector increases by 68% compared to the COFOG amount and reaches 6.5% of agricultural GDP. For 2011, the budget includes less feeder road work and the COFOG amount is predicted to reach 4.7% of agricultural GDP, while overall agricultural support, including the actions of NGOs and feeder road work, is predicted to be 30% greater than the COFOG amount, reaching 6.1% of agricultural GDP.
66. These figures place Togo in the middle range of sub-Saharan African countries when it comes to agricultural support expressed in shares of agricultural GDP, yet it falls far below the performance of middle- and high-income countries, even when the actions of NGOs and feeder road works are taken into account (Table 5). To demonstrate
Box 3. What should the feeder road budget be?
In Togo, the inventoried roads cover a distance of around 6,800 km. It is estimated that
2,800 km have recently been renovated within the framework of the various programs
mentioned above (EU/EDF STABEX, 50 km, 30 km, etc.) and that 4,000 km need to be
restored, at a unit cost of roughly 12 million CFA francs per km, or a total cost of about
50 billion CFA francs.
Moreover, routine maintenance must be done every three years, at an estimated unit cost
of 4.5 million CFA francs per km. The annual maintenance budget should thus amount to
roughly 10 billion CFA francs per year, compared to the 1.8 billion CFA francs budgeted
for 2011.
Finally, due to the dissolution of the Road Maintenance Fund in 2008, Togo no longer has
a system of light maintenance provided by local communities and/or road maintenance
workers. These systems should be reinstated, at an estimated cost of around 600 million
CFA francs per year.
An ambitious feeder road program would thus require a budget of roughly 20 billion
CFA francs per year for five years, followed by an annual budget of 10 billion CFA
francs. This would allow for the renovation of the entire network and the
implementation of a maintenance strategy combining triennial maintenance, the
participation of local communities, and the revival of the road maintenance system.
The significant accomplishments of 2010 demonstrated that despite numerous
problems, the country’s absorptive capacity in this sector is relatively satisfactory
and can be improved (by training public and private participants, establishing lines
of credit, accelerating disbursement procedures, etc.).
Source: Directorate for Feeder Roads/MTP

28
a level of support in the lower range of middle-income countries (10% of agricultural GDP), Togo would have to reach a level of agricultural support in the order of 70 billion CFA francs per year, which would bring it close to the needs estimated by PNIASA: 569 billion CFA francs over the 2010–2015 period, or roughly 95 billion CFA francs per year.
Table 4. Summary of public agricultural expenditures, 2008–2011 (in billions of CFA francs)
2008 2009 2010 2011 (prov.)
Amount %
COFOG Amount
% COFOG
Amount %
COFOG Amount
%
COFOG
From MAEP budget, excluding feeder roads
18.8 78 11.1 63 15.2 63 25.3 81
Under MAEP oversight, not included in State budget
3.7 15 4.1 23 6.1 23 1.9 6
Under the supervision of other Ministries (MPDAT, MDB)
0.4 2 1.1 6 1.8 7 1.4 4
MERF forestry and agriculture 1.3 5 1.3 7 ..1.8 7 2.8 9
Total COFOG 24.1 100 17.6 100 24.8 100 31.4 100
% agricultural GDP 4.2% - 2.8% - 3.9% - 4.7% - % total GDP 1.7% - 1.2% - 1.6% - 1.9% - NGO 0.9 4 2.1 12 2.8 11 2.2 7
Feeder roads 5.1 21 5.3 30 14.1 57 7.3 23
Total agricultural support 30.1 125 25.0 142 41.7 168 40.9 130
% agricultural GDP 5.2% - 3.9% - 6.5% - 6.1% - % total GDP 2.1% - 1.7% - 2.6% - 2.5% - Agricultural GDP 578.6 - 639.4 - 642.4 - 673.2 - Total GDP 1,418.5 - 1,493.5 - 1,577.9 - 1,657.4 -
Source: Authors’ calculations based on data collected from all participants in agricultural support (see details in Appendix 2); DE/MEF.
Table 5. International comparison of budget transfers to agriculture, 2002–2011
Region/Country Share of agriculture
in GDP
Share of agricultural public expenditures in
national GDP
Share of agricultural public expenditures in
agricultural GDP
High-income countries Australia 3.0% 0.3% 10% Canada 2.3% 0.5% 22% EU 2.3% 0.7% 28% USA 1.6% 0.7% 46% Middle- income countries Turkey 13.0% 2.0% 15% Mexico 4.0% 0.7% 18% Venezuela 5.0% 0.5% 12% China 15.0% 1.2% 8% Brazil 9.3% 0.7% 8% Russia 6.0% 1.0% 16% Ukraine 11.6% 1.3% 11% Low-income countries Uganda 32% 1.5% 5% Tanzania 45% 1.2% 3% Ethiopia 44% 2.7% 6% Kenya 29% 1.3% 4% Togo estimated COFOG 2011 41% 1.9% 4.7% Togo implemented COFOG 2010
41% 1.6% 3.9%
Togo total implemented support 41% 2.7% 6.5%

29
2010
Note: the data shown refers to different years within the 2002 and 2011 period, depending on the country. Source: World Bank 2010a; authors’ calculations for Togo
3. REGIONAL BREAKDOWN AND DISTRIBUTION OF PUBLIC AGRICULTURAL EXPENDITURE (ALLOCATIVE EFFICIENCY)
3.1 The Economic Breakdown of the MAEP Budget
67. The composition of expenditures is primarily determined by the quality of the budgetary
programming process (Box 4). Theoretically, expenditures should be analyzed based on
budget estimates. However, because the agricultural expenditure rates of implementation in
Togo vary enormously from year to year and especially from one budget item to another
(very high for administrative costs, and usually low for capital expenditures), it was
considered more appropriate to base this economic breakdown on expenditures actually
implemented.
68. The economic breakdown of expenditures under the control of MAEP, budgeted or
off-budget, for the 2002−2010 period (Figure 12), shows that the sector, like the rest of
the Togolese economy, received very little support for the greater part of the period. In
this context, personnel expenditures and other administrative spending absorb an
unreasonable proportion of expenditures (42%).
Figure 12. Economic breakdown of expenditures under MAEP oversight, budgeted or
off-budget, excluding feeder roads, 2002−2010 (billions of CFA francs)
Notes: The repayment of SOTOCO debts in 2007 (12 billion CFA francs) was not taken into account because
this exceptional item would have distorted the results of the analysis; contract staff were accounted for in
operating expenditures.
Civil servant personnel, 14.5,
16%
Operating costs, 24.8, 27%
Investments (RI), 4.6, 5%
Investments (RE), 19.9, 21%
Purchase of inputs (RI), 12.7, 14%
Purchase of inputs (RE), 13.0, 14%
Cereal Purchases (RI), 2.5, 3%

30
Source: Authors’ calculations based on data supplied by: DAF/MAEP, DPAC/MAEP, CAGIA, ICAT, ITRA,
DF/MEF, CDP Branch, AFD, FAO, UNDP, Embassy of China; EU 2004; EU 2007, EU 2011b. Details of
baseline data in Annex 2.
69. Capital expenditures, financed mostly by external resources, only made up 27% of
overall expenditures. Furthermore, until recently only a very limited proportion of capital
expenditures was actually visible because they consisted mainly of feasibility studies and
teaching tools and training for State services (see Chapter 6). Nevertheless, since 2009 and
especially since 2010, capital expenditures have seen a net increase (Figure 13) due to the
increased support to the sector by the GoT and a revival in foreign aid.
70. Lastly, the analysis of the economic breakdown of expenditures brings to light the
preponderant proportion allocated to input purchases, primarily fertilizer, which
consumed 28% of the resources under MAEP oversight which were implemented over
the period. These inputs were financed equally by internal and external resources. ANSAT
price-stabilizing grain purchases only accounted for 3% of expenditures.
Figure 13. Trends in capital expenditures undertaken under MAEP oversight, budgeted
or off-budget, excluding feeder roads, 2002−2010, and estimates for 2011 (billions CFA
francs)
Source: Authors’ calculations based on data supplied by: DAF/MAEP, DPAC/MAEP, CAGIA, ICAT, ITRA,
DF/MEF, DFCEP/MEF, CDP Branch, AFD, FAO, UNPD, Embassy of China; EU 2004: EU 2007, EU 2011b.
Details of baseline data in Annex 2.
0.0
2.0
4.0
6.0
8.0
10.0
12.0
14.0
16.0
2002 2003 2004 2005 2006 2007 2008 2009 2010 2011
Bill
ion
s o
f C
FA
fra
ncs
RI
RE
In the future, on account of the increased support to the sector by the GoT and the
revival of foreign aid, the economic composition of the MAEP budget must progress
towards significantly increasing the relative proportion of capital expenditures,
particularly for public goods (research, infrastructure, etc.), and the operating
expenditures must decrease proportionately, as must the provision of private goods
(inputs).

31
71. Salary expenditures for civil servants and MAEP operating expenditures
progressed in opposite ways (Figure 14): a decrease for the former and a sharp increase
for the latter, owing principally to the increase in subsidies to autonomous agencies. The
level of subsidies is still inadequate and this is a major constraint for ITRA and ICAT since
these are their principal sources of financing (Box 5).
72. While the estimated and implemented MAEP budgets were increased from 2002 to
2011, as seen above, by a factor of 3 and of 4 respectively in constant terms, the payroll
for civil servants declined by 20% over the same period in constant terms, despite
recruitment in 2008 (civil servants and contract staff). The MAEP civil service
component represented 3% of State payroll at the beginning of the 2000s and only
accounts for 2% today, even though the sector it regulates contributes more than 40%
to GDP, 20% of export revenue, provides a livelihood to 60% of the population, and
received 9% of the State’s budgeted public capital expenditures over the 2002−2010
period (taking into account the purchase of inputs).
73. Not filling posts vacated by personnel who retired through most of the 2000s resulted not
only in a reduction in staff, but also in an inversion of the age pyramid that will undoubtedly
be borne out in the second audit of MAEP human resources27 carried out in 2011.
74. In addition to civil service personnel, operational costs must also take into account
contract staff who number significantly, particularly in the autonomous agencies, ICAT
and ITRA, where they represent about two thirds of the total staff. According to the first
MAEP personnel audit conducted by the DRH/MAEP in 2010 and, based on the information
gathered for this review, the total MAEP staff count is 2,400 persons, including
approximately 1,100 contract staff, of whom about 500 work at ICAT, 200 at ITRA, 90 at
INFA, 60 at ANSAT, 60 at DSID, 50 at CAGIA, 40 at ONAF, and the remainder in various
central and regional directorates and other agencies. The piecemeal information available
at present on contract staff, indicates that their numbers have not changed significantly
in the period under consideration.
75. In total, MAEP’s operating expenditures doubled in constant terms from 2002 to
2011.
Figure 14. Trends in operational expenditures implemented by MAEP, excluding
extraordinary items, 2002−2010 and estimates for 2011 (constant prices 2002 base)
27 Since the data available to the DRH/MAEP is incomplete, the World Bank June-July 2011 Support Mission for Reform of MAEP recommended conducting a more exhaustive second audit of the Ministry’s human resources than that conducted in 2010; the results of this audit, financed by PASA, should become available at the end of October 2011. Source: World Bank 2011d.

32
Source: DF/MEF
0
1
1
2
2
3
3
4
4
5
5
2002 2003 2004 2005 2006 2007 2008 2009 2010 2011
Bill
ion
s o
f C
FA
fra
ncs
Civil servant personnel
Operating costs (excludingextraordinary items
Total

33
Box 4. Allocative efficiency and technical efficiency: definitions
• The evaluation of allocative efficiency in public spending on agriculture consists in
attempting to answer the question:
Are the agricultural expenditures that are being financed best suited to achieving the
country’s agricultural policy goals? In short: is the spending SOUND?
Allocative efficiency will primarily be determined by the efforts made in budget
preparation to align the budget with sectoral goals. Allocative efficiency will be analyzed
as follows:
- Economic breakdown of expenditure: operating and capital expenditures; in the
operating expenditure item, payroll expenditures and non-payroll expenditures; in
the investment item, capital expenditures and current expenditures;
- Functional breakdown of expenditures: distribution among the various subsectors
(agriculture, cattle-breeding, research, etc.);
- Regional distribution of expenditures.
• The evaluation of technical efficiency in public spending, on the other hand, consists in
providing a response to the following question:
Are the available resources properly used to maximize production? In other words: is
the expenditure PROPERLY EFFECTED?
Technical efficiency is thus primarily determined by the effectiveness of the process of
preparing and implementing the budget. Tools for assessing technical efficiency include an
alignment between the funds allocated in the budget and their actual use, the budget
implementation rate, and the cost-effectiveness of programs implemented.
Source: World Bank 2011a.

34
76. DRAEP represents a significant proportion of MAEP human resources, of similar
size both in terms of numbers of personnel and as a payroll item, as central
administration staff (Figures 15 and 16). It is accordingly reasonable to raise questions
about the effective use of these decentralized human resources, and, particularly, about the
means at their disposal, the extent of their delegated powers, and their relations or
complementarities regarding other MAEP field services (ICAT agents in particular). In this
respect, it is informative to compare Figures 15 and 16 below with Figure 2 (administrative
breakdown of the provisional MAEP budget) given above (Section 2.1): with similar staff
size, the central and decentralized services manage respectively 70% and 2% of MAEP’s
resources. This serious matter must be addressed in a later phase of the MAEP restructuring
presently underway.
Figure 15. Estimate of the distribution of MAEP staff (civil servants and contract staff),
2010
Notes: The staff identified by DRH/MAEP at PBVM (7), PARTAM (11), and at the Adele (22) and Namiele
(14) Ranches were incorporated in the central administration numbers. In 2010 DRH/MAEP documented 589
persons at ICAT while ICAT itself declared 745; this last figure that was used. For all other Directorates and
Agencies the staff numbers furnished by the DRH/MAEP were used.
Source: DRH/MAEP and the ICAT
Figure 16. Estimate of MAEP payroll distribution (civil servants only), 2010
Cabinet, SG and central directorates,
450, 19%
DRAEP, 536, 22%
Agences autonomes; 1,393; 58%

35
Source: Authors’ estimates based on data furnished by the DAF/MAEP and the DRH/MAEP
77. It is to be noted that at this time there is no mechanism within MAEP to ensure that
the maintenance costs for capital acquisitions are covered, and this applies both to
equipment supplied to State services and capital goods transferred to beneficiaries. A
mechanism for the gradual transfer of ownership of motorcycles to ICAT agents to encourage
better use and maintenance was investigated but never put into practice. The organization of
beneficiaries and the gradual transfer of responsibility for maintenance have, until now,
mostly been ignored, both for development projects (PBVM, STABEX) and for capital
equipment projects, thus undermining the sustainability of the capital items. Even costly
investments undertaken for the rehabilitation and opening of feeder roads presently have no
matching maintenance strategy (See Section 2.8), resulting in an extremely rapid degradation
of the new roads due to the intensity of the tropical rain.
Cabinet, SG and central directorates
33%
DRAEP30%
Autonomous agencies
37%
The increase in resources managed by MAEP must necessarily be accompanied by the
drawing up and implementation of maintenance strategies for capital expenditures
undertaken, both for equipment put at the disposal of State agents and for capital goods
transferred to beneficiaries. The lack of such strategies leads inevitably to the non-
sustainability of these investments and above all to the failure of their anticipated impact on
economic development.
Without pre-empting the conclusions and recommendations of work underway regarding
MAEP restructuring, this study recommends that capacity building for the ministry should
include not only training of existing staff, but also increasing their number, as well as
giving serious consideration to the distribution of the means and responsibilities between
the central and regional levels, and, at the regional level, between the various institutions
on the ground.

36
3.2 Operational Breakdown of the MAEP Budget
78. To assess the alignment of the MAEP budgets with sector policies and strategies,
the operational breakdown of provisional and implemented budgets for the 2002−2011
period will be compared with the reallocation of priority investments provided for by
PNIASA for the 2010−2015 period (Figure 17). Given that the years 2010−2011 marked a
fresh start in public support to the agricultural sector, as stated above, the operational
breakdown will be analyzed over the two periods, 2002−2009 and 2010−2011.
Figure 17. Share of subsectors in the budget estimates of PNIASA priority actions,
2010−2015 (billions of CFA francs)
Note: Investments planned for the sustainable management of natural resources and the development of rural
infrastructure were accounted for within the intensification of food crop production figures although it is clear
that they will also benefit other production.
Source: MAEP 2010a
79. The operational breakdown of the MAEP budgets will also demonstrate the
proportional contribution of each of the subsectors to agricultural GDP (Figure 18) and
the role of each subsector in agricultural imports (Figure 19), this last criterion
highlighting the potential of each subsector for import substitution.
Figure 18. Contribution of subsectors to the make-up of primary sector GDP in
constant terms, 2002−2010
Intensification of food crop
production, 354, 62%
Diversification and promotion of export
crops, 19, 3%
Promotion of livestock sector, 39,
7%
Promotion of fisheries sector, 17,
3%
Agricultural research, 20, 4%
Agricultural Council, 34, 6%
Institutional enhancement and
sectoral coordination, 87,
15%
\

37
Source: DE/MEF
Figure 19. Imports of agricultural products, live animals, and fisheries products into
Togo, 2008 (millions of US$)
Source FAOSTAT
80. In the 2002−2009 period (Figure 20), it can be observed that the MAEP budget
estimates show a strong bias in favor of the production of commercial crops due
principally to the large sums spent by the Togolese State on the liquidation of SOTOCO and
the formation in 2007−2008−2009 of NSCT, and for the budgetization of the STABEX COM
91−94 and MOF 95−99 funds, intended principally for the cotton and coffee-cocoa sectors in
2007−2008. The fisheries and fish-farming and the livestock subsectors were seriously
neglected in this period, the first receiving virtually no budgetary provision at all, while the
second received a portion far below its contribution to agricultural GDP. It is interesting to
note that in this period, the proportion of the budget estimates allocated to agricultural
administrative services at the national and regional level were very nearly identical.
Figure 20. Operational breakdown of the MAEP budget estimates, excluding feeder
roads, 2002−2009 (billions of CFA francs)
Production of food crops68%
Commercial crop production
6%
Livestock production17%
Fisheries, forestry9%
Alcoholic and non-alcoholic beverages,
36, 10%
Tobacco products, 14, 4%
Processed food, 36, 11%
Fruits and vegetables, 8, 2%
Vegetable oils, 29, 8%
Sugar, 32, 10%Wheat, 22, 7%Maize, 1, 0%
Rice, 106, 31%
Mild and milk products, 24, 7%
Chicken meat, 10, 3%
Other meat products, 2, 1%
Live animals, 3, 1% Fish, 11, 3%Other, 6, 2%

38
Source: Authors’ calculations based on data provided by the DAF/MAEP
81. By contrast, the budget estimates drawn up for the 2010–2011 period (Figure 21)
show a return to a situation in which the share allocated to food crops decreases
markedly, noticeably less than the proportion of their contribution to agricultural GDP,
and that the proportion of the budget estimate allocated to livestock production, fishing
and aquaculture, and to research, increases considerably.
Figure 21. Operational composition of the MAEP budget estimates, excluding feeder
roads, 2010–2011 (billions of CFA francs)
Source: Authors’ calculations based on data provided by the DAF/MAEP
82. The operational composition of the budgets drawn up for the 2010–2011 financial
years show a remarkable degree of consistency with the PNIASA draft budget, and a
far better alignment with the relative contributions of the various subsectors to
agricultural GDP. The livestock production subsector nevertheless remains relatively
disadvantaged. It is also evident that, as has been pointed out above, the gap continues
to widen between resources allocated to the central administration and the regional
administration.
Production of food crops, 54.1, 49%
Commercial crop production, 30.4,
27%
Livestock production, 3.3, 3%
Fishing-Aquaculture, 0.4, 0%
Research, 5.1, 5%
Extension services, 6.4, 6%
Administration and cross-cutting issues-national level, 5.5,
5%
Administration and cross-cutting issues-regional level, 5.9,
5%
Production of food crops, 36, 60%
Commercial crop production, 2, 3%
Livestock production, 4, 7%
Fishing-Aquaculture, 2, 3%
Research, 4, 7%
Extension services, 4, 6%
Administration and cross-cutting issues-
national level, 7, 11%
Administration and cross-cutting issues-regional level, 2, 3%

39
83. However, the operational composition of actual spending under MAEP oversight in
2010, excluding feeder roads, taking into account expenses which were not included in
its budget, differs significantly from the provisional budget (Figure 22). Production of
food crops, livestock production, and fisheries and fish farming, suffered from low
implementation rates which meant that their share of expenditures decreased to 45%, 6%, and
0% respectively. This is in contrast to commercial crop production which experienced an
increase in expenditures of 9% thanks to good implementation rates in the coffee-cocoa and
cotton sectors through the STABEX programs implemented by MAEP in that year. Finally,
actual spending on administration and for cross-cutting issues at the central level rose steeply
to 24% of total expenditures, which was entirely due to the inclusion of the construction of a
training center in the Lomé region, financed by China at a cost of 2.8 billion CFA francs.
Figure 22. Operational breakdown of actual expenditures under MAEP oversight,
budgeted or off-budget, excluding feeder roads, 2010 (in billions of CFA francs)
Source: Authors’ calculations based on data provided by: the DAF/MAEP, DPAC/MAEP, CAGIA, ICAT,
ITRA, DF/MEF, CDP Branch, AFD, UNDP, Embassy of China; EU 2004; EU 2007; EU 2011b.
Details of baseline data given in Annexure 2.
84. In practice, fishing and aquaculture, training and research (Box 5), and regional
agricultural administration have not in fact benefited in the last decade except for the
involvement of personnel with limited operational capacity. The DRAEP budget estimates
in particular have doubled in the 2002–2011 period while, during the same period, those of
central services quadrupled, and the capital expenditure budgets allocated to them remained
insignificant.
Production of food crops, 9.4, 44%
Commercial crop production, 2.0, 10%
Livestock production, 1.3, 6%
Fishing-Aquaculture, 0.1, 0%
Research, 1.1, 5%
Extension services, 1.4, 7%
Administration and cross-cutting issues-national level, 5.1,
24%
Administration and cross-cutting issues-regional level, 0.8,
4%

40
An analysis of the operational composition of the MAEP budget over the last decade shows
a preponderance of food crop production expenditures, justified by the fact that it
represents more than two thirds of agricultural GDP and almost 40% of imports of
agricultural products. Commercial crop producers received a proportion of expenditures
considered in line with their contribution to agricultural GDP.
Livestock production and the central administration were relatively neglected but have
experienced a realignment in their favor in 2010–2011, especially in capital expenditures.
The provisional budgets drawn up for the 2010–2011 financial years show a remarkable
degree of consistency with the PNIASA provisional budget. This realignment should be
extended, particularly for livestock production, which has until now received a level of
support which is quite significantly lower than its substantial contribution to agricultural
GDP.
The subsectors for fishing and aquaculture, research and extension services, and regional
administration have not in fact benefited in the last decade except from the involvement of
personnel with limited operational capacity. ITRA and ICAT will very soon benefit from a
grant through the WAAPP, which is particularly timely for Togo. This grant will
nevertheless be insufficient to bring Togo up to international standards in research and
extension services financing (Box 5). Further support should be given to the fisheries sector
and to assessing potential strengthening of DRAEP in this sphere, as has already been
mentioned above, and giving serious consideration to reapportioning resources between the
central and regional administrative levels, and, at the regional level, between the various
institutions on the ground.
Finally, it is vital to note that underlying all the PNIASA subprograms, problems continue
to exist in processing and marketing, which presently enjoy only a small share of the
MAEP budget. It is crucial that these issues be accorded their proper importance and given
greater institutional exposure, through the creation of a directorate within the MAEP
dedicated (or dedicated in part) to these matters or to a reorientation of the ANSAT
mandate and resources (see Chapter 5).1 Without this institutional stimulus, the tendency of
agricultural technicians the world over is to focus on production processes and to neglect
questions of market access.
____________________
1 Work underway on MAEP restructuring includes this ANSAT reorientation (World Bank 2011c).

41
Box 5. Details of the ITRA and ICAT budgets
• As has been mentioned above, ITRA benefited from a subsidy and a capital budget
funded by the State, as well as from its own revenue generated from services provided and
the sale of products (for example: the sale of pre-basic or basic seed), revenue from research
contracts or partnerships (with CGIAR, foreign foundations, and the like), and from
contributions from the cotton sector paid by NSCT. Furthermore, about a third, or 100 out of
300 employees, are regarded as civil servants and are paid directly by the State (the latter State contribution is estimated at 200 million CFA francs per year).
The breakdown of ITRA revenues changed significantly over the 2002–2011period: grants
increased regularly to reach 625 million CFA francs in 2010 and 2011; on the other hand the contribution from the cotton sector decreased greatly from 200 million CFA francs in 2002 to 50
million CFA francs in 2005 and 30 million CFA francs in 2010; partnership funds, amounting to
less than 80 million CFA francs in 2010 were much greater at the beginning of the 2000s (820 million CFA francs in 2000, 400 million CFA francs in 2001, and 300 million CFA francs in 2002)
thanks to the grant from the National Support Program for the Agricultural Sector (PNASA)
financed by IFAD and the World Bank but suspended in 2002; finally it was only in 2010 that
ITRA began to receive a budget allocation for investments and capital goods (254 million CFA francs). Against this background the available figures for 2002–2010 are of little value and it was
judged preferable to present ITRA’s average revenue distribution in a more uniform manner for the
2005–2010 period (Figure 23).
Figure 23. Breakdown of ITRA revenue, 2005–2010 average (millions of CFA francs)
Source: ITRA
On average, the ITRA budget for the period 2005–2010 was 80% underwritten by the State
and 20% from other sources and rose to a little less than 1 billion CFA francs per year. It fell
by 32% in current terms and by 43% in constant terms between 2002 and 2009 (Figure 24) and only
began to increase in 2010. The 2011 budget estimates are 12% greater in current terms but still 9%
less in constant terms than in 2002.
State subsidies, 538, 56%
State budget for investment and
capital equipment, 42, 4%
Contibution to the cotton sector, 20, 2%
Partnerships, 92, 9%
Own resources, 75, 8%
Cost to State of civil service salaries, 200,
21%

42
Box 5. Details of the ITRA and ICAT budgets (continued)
Figure 24. Trends in the ITRA budget in current and constant terms (2002 base), 2002–2011
(millions of CFA francs)
Source: Authors’ calculations based on data provided by ITRA and DE/MEF
During the 2005–2010 period, ITRA’s budget accounted for 0.2% of agricultural GDP (excluding
fisheries and forests) and 0.07% of total GDP, which is far short of the goal of 1% of GDP to be
allocated to agricultural research set by the AU Executive Council in its 2006 Khartoum Decision
regarding science and technology. Togo is one of the countries in sub-Saharan Africa which dedicates
the fewest resources to agricultural research (Table 6), with less than US$0.40 per inhabitant per year.
Table 6. Budget allocated to research and development (R&D) in agriculture in sub-Saharan Africa
____________________________________________________________________________
Total Amount
Year Amount per %GDP
Reviewed Millions of US$ Inhabitant US$
_____________________________________________________________________________
Malawi 2007 180.1 12.9 1.70
Uganda 2007 359.8 11.6 1.10
South Africa 2007 4,976.6 102.4 1.05
Kenya 2007 277.8 7.4 0.48
Senegal 2008 99.0 8.0 0.48
Tanzania 2007 234.6 5.8 0.48
Gabon 2008 78.7 58.3 0.47
Ghana 2007 120.1 5.0 0.38
Zambia 2008 55.3 4.6 0.37
Mali 2007 37.4 3.0 0.28
Mozambique 2007 42.9 2.0 0.25
Nigeria 2007 583.2 3.9 0.20
Togo 2005–2010 2.0 0.4 0.07
Notes: For most countries, these data include applied research by the State, universities, and institutes of higher
education, the private sector, and non-profit organizations. The data for the other countries are in USD “purchase
price parity” (exchange rate calculated by the UNDP to account for the real value of the USD in the country in
500
600
700
800
900
1000
1100
1200
1300
1400
2002 2003 2004 2005 2006 2007 2008 2009 2010 2011
Mill
ion
s o
f C
FA
fra
ncs
Current terms
Constant terms - 2002 base

43
Box 5. Details of the ITRA and ICAT budgets (continued)
In defense of the Togolese State, most of the sub-Saharan African countries which give the
greatest support to agriculture R&D have the advantage either of external funds or of significant
contributions from the private sector, with the notable exception of Uganda, where research
dedicated to agriculture is financed from internal State resources to the extent of 80% (Figure 25). The interruption of the greater portion of international aid to Togo between 1990 and 2006, and in particular
the suspension of PNASA in 2002, was especially prejudicial to the interests of research in agriculture.
Figure 25. Sources of financing for R&D in agriculture in sub-Saharan Africa (%)
Notes: Resources committed by the State, universities, and institutions of higher learning have been aggregated. In
the case of Togo, resources apart from ITRA have been taken into account (partnerships and research contracts
with CGIAR, foreign foundations etc.) as well as contributions by non-profit organizations.
Source: AU/NEPAD 2010 and ITRA.
Undoubtedly, as Togo is a small country with agro-ecological systems much resembling those of its
neighbors, there is no doubt much merit in making the most of agricultural R&D undertaken at the
regional level. The fact remains that the present budget which it has allocated to research in agriculture is totally insufficient. The WAAPP, which is being implemented now, will help bridge the gap but will
not get Togo out of the bottom league with respect to support for agricultural R&D in sub-Saharan
African countries: the WAAPP allocation to Togo is US$12 million over five years; if it is assumed that half of these funds will be for the benefit of ITRA, then the ITRA budgets should increase by 50% to
US$3 million per year, but this new budget only represents US$0.50 per inhabitant per year, and about
0.1% of national GDP (based on an estimated GDP for 2011 of 1,657.4 billion CFA francs), and still far
short of the 1% fixed by the AU in 2006. In these circumstances it is vitally important that those capital projects to be implemented under WAAPP should be carefully targeted towards research themes which
will have the most appreciable and rapid benefits in the fight against rural poverty.
0102030405060708090
100
%
Private Sector Government Non-Profit Organizations External Funds

44
Box 5. Details of the ITRA and ICAT budgets (continued)
• Since 2010, ICAT has also benefited from a subsidy (1 billion CFA francs for 2011), from
a capital expenditure budget, and from its own revenues earned through the provision of
services (for example: support for farmers under projects launched by NGOs and donors). As
with ITRA, about a third of its personnel, about 250 employees out of 750, have civil service
status and are paid directly by the State (this last contribution by the State was estimated at 200 million CFA francs per year until 2009, and 300 million CFA francs thereafter).
For the 2005–2010 period, the ICAT budget was financed 86% by the State and 14% from
revenue from partnerships (Figure 26) and rose on average by some 1.2 billion CFA francs. It was maintained at about 1 billion CFA francs until 2009 before being significantly increased
starting in 2010. The provisional budget for 2011 (1.9 billion CFA francs) is more than 64% greater
than that of 2002 in current terms, and 33% more in constant terms (Figure 27).
Like ITRA, ICAT has suffered greatly from a lack of capital in the last decade: from the start
of its operations in 1999, only 160 motorcycles (for 350 field officers), and 7 vehicles (1 for each
region and 2 for UTCC) were replaced in 2010. In terms of personnel, ICAT management estimated that at least 150 additional technical advisors would be necessary to cover the country adequately.
Figure 26. Composition of ICAT revenue, 2005–2010 average (millions of CFA francs)
Source: ICAT
State subsidies, 766, 65%State budget for
investment and capital equipment,
32, 3%
Partnerships, 162, 14%
Cost to State of civil service salaries, 217,
18%

45
3.3 Regional Distribution of the MAEP Budget
85. The geographic distribution of the MAEP provisional and implemented capital
expenditure budgets for the 2002–2010 period was compared to the contribution of each
region to rural population, rural poverty, and to the national food crop production,
which as we have seen, was some 68% of agricultural GDP (Figure 28).
86. This analysis illustrates a strong bias in favor of the region closest to Lomé, the
Maritime region, which is further exacerbated in the implemented budget. In fact,
during the period under review, the Maritime region absorbed almost half of the investment
resources though it accounts for, at most, 28% of the rural population, 27% of rural poverty,
and 15% of the country’s food crop production.
87. The Plateaux region, by contrast, which accounts for 29% of the rural population,
23% of rural poverty, and provides 36% of the national food crop production, benefited
from only 16% of capital expenditures.
88. The Centrale region, with 12% of budget spending, received a budget allocation in
line with its population and proportion of rural poverty (11% and 13% respectively),
but nevertheless inferior to its contribution to the total food crop production (29%).
89. Finally, the Kara and Savanes regions, which received respectively 10% and 12%
of actual budget spending, received allocations commensurate with their contribution to
Box 5. Details of the ITRA and ICAT budgets (continued to end)
Figure 27. Trends in the ICAT budget in current and constant terms (2002 baseline), 2002–
2011 (millions of CFA francs)
Source: Author’s calculations based on data provided by ICAT and DE/MEF
500
700
900
1100
1300
1500
1700
1900
2002 2003 2004 2005 2006 2007 2008 2009 2010 2011
Mill
ion
s o
f C
FA
fra
ncs
Current terms
Constant terms - 2002 base

46
the national food crop production (10% each), but falling short of their proportion of
the rural population (15% and 17% respectively) and in particular of their proportion
of rural poverty (16% and 21% respectively), the incidence of rural poverty being
particularly high in these two regions (Table 7).
Figure 28. Regional distribution of MAEP provisional and implemented capital
expenditure budgets, 2002–2010, comparing the contributions, by region, to population,
rural poverty, and food crop production (%)
Note: The contribution of each region to national food crop production is based on the sum of grain production,
tubers, and legumes for the country 2010–2011, expressed in tons.
Source: DAF/MAEP for the provisional and implemented budgets; authors’ calculations based on the IMF 2010
for the contributions to population and rural poverty; DSID/MAEP for food crop production
Table 7. Regional population distribution and incidence of rural poverty ______________________________________________________________________
% % % Incidence
Population Population Rural of Rural
Outside Lomé Population Poverty (%)
_______________________________________________________________________
Lomé 19.9 - - -
Maritime 21.0 26.2 89.9 71.1
Plateaux 23.0 28.7 83.1 60.2
Centrale 10.3 12.9 73.5 84.0
Kara 13.3 16.6 73.8 80.0
Savanes 12.5 15.6 87.8 92.4
Total 100.0 100.0 66.5 74.3
_______________________________________________________________________
Source: Authors’ calculations based on the IMF 2010
0%
10%
20%
30%
40%
50%
60%
Maritime Plateaux Centrale Kara Savanes Lomé
Share of provisional budget
Share of implemented budget
Contribution to rural population
Contribution to rural poverty
Contribution to food cropproduction

47
4. TECHNICAL EFFICIENCY OF AGRICULTURE BUDGET PREPARATION, IMPLEMENTATION, AND MONITORING-EVALUATION PROCESSES
90. Over the 2002–2010 period, the implementation rates of capital expenditures and input purchasing from external resources (RE), excluding feeder roads, were much lower than those of capital expenditures and input purchasing from internal resources (RI, Figure 29). The weighted average of the implementation rates of capital expenditures and input purchasing from RE, excluding feeder roads, was 23% compared to 69% for capital expenditures and input purchasing from RI. In 2010, capital expenditures and input purchasing from RE, excluding feeder roads, were implemented at 21% (4.9 billion CFA francs) compared to 86% (4.8 billion CFA francs) for capital expenditures and input purchasing from RI.
91. However, the analysis of the budgetary chain described in the following sections will show that the implementation rates of capital expenditures and input purchasing from RE are distorted by a miscalculation of available resources and insufficient knowledge of the effective disbursement of the projects. For example, the implementation rate of capital expenditures and input purchasing from RE in 2010 increases to 44% if the IsDB Mô Plain Project, which was erroneously budgeted in its entirety (8.2 billion CFA francs), and EU Food Facility budgetary support (4.5 billion CFA francs), which was not meant for MAEP, are excluded from the budget estimates.
Figure 29. Evolution of the implementation rates of capital expenditures and input purchasing from internal resources (RI) and external resources (RE), excluding feeder roads, 2002–2010 (%)
This bias in favor of the Maritime region, which is closest to Lomé, and thus to the
central services of MAEP, is undeniably a result of the high degree of centralization of
budget management noted above (Section 3.1). An inter-regional realignment of MAEP
interventions is essential, necessitating greater responsibility passing to decentralized
resource management, in anticipation of the implementation of the decentralization
scheduled by the GoT.

48
Note: No data for the implementation rate of capital expenditures from RI in 2007. Source: DFCEP/MEF
4.1. Technical Efficiency of Budget Programming
92. As yet, Togo does not have any regulation that establishes budget preparation methods or timeframes. At the moment, the process is only described in a MEF procedures manual that is not legally binding. A formalized institutional and methodological framework is currently in preparation, with the help of the Institutional Support Program (PAI) financed by the EU, in order to bring the budget programming process into compliance with WAEMU directives before 2017.28
93. In practice, the budget programming process currently consists of the following stages:
i. At the beginning of year n, the local authorities of the sectoral ministries (the DRAEPs for the MAEP) begin identifying the population’s needs for year n+1. The expressed needs are prioritized a first time by the technical directorates according to the objectives for the sector. A second prioritization is then carried out by the directorate in charge of planning, which submits a compilation of the propositions to the ministry’s cabinet for an initial review at a budget mini-conference with the technical directorates, at the end of which the minister has a draft budget.
ii. Theoretically in May, but in practice in early July or even later (July 18 in 2005, and July 22 in 2007), a budget guideline letter signed by the prime minister is sent to the ministries, in which the budget thresholds and schedule are set;
iii. The directorates in charge of planning in the sectoral ministries then make adjustments to the draft budget so that it coincides with the allocated envelope. This draft budget is then submitted to the ministry for review during a budget conference and, at the end of this process, the sector’s final draft budget is sent to the MEF with, in principle, the MTEF for years n+1, n+2, and n+3 attached as an appendix;
iv. From late July to early September, several budget conferences are held between the ministries and MEF, during which new budget reviews are carried out. Until
28 Source: EU 2011a.
0%
20%
40%
60%
80%
100%
2002 2003 2004 2005 2006 2007 2008 2009 2010
RI
RE

49
2007, MEF supervised operating expenditures while MPDAT supervised the capital expenditure budget. This separation has ended, and now the MEF (DB/MEF) is responsible for preparing the entire budget;
v. The draft budget act is then finalized by the Council of Ministers in September and transmitted to the National Assembly, in theory no later than the first Tuesday of October (Box 6); the budget act is passed by Parliament before the end of the year and promulgated within a few days;
vi. The LORLF allows for supplementary budget laws, but this budget tool had never been utilized prior to 2008; in 2008 and 2009, supplementary budget laws were submitted to Parliament for vote; in 2010, budget amendments were made during the course of the year without being submitted to Parliament;
vii. Since 2009, Togo has gradually been establishing pluriannual budget programming (MTEF for 3 years) beginning with the “priority” ministries (Health, Education, Water and Sanitation, MAEP, MERF); MAEP should present its first proper MTEF this year for the 2012–2013–2014 period.
94. The ongoing reform will primarily provide a clearer definition of the various participants’ responsibilities, improved compliance to the budget schedule, the organization of a State budget seminar in May before the distribution of the budget guideline letters, and the creation of specialized inter-ministerial committees that will serve as a driving force for the entire process.29
29 EU 2011a.

50
Box 6: The political and democratic dimension of the Budget Law
Today, the Council of Ministers does not become involved until after the budget guideline
letters have been sent and the reviews supervised by MEF have been held.
The National Assembly only has a short period, one generally inferior to that stipulated by
law, to debate the budget act. In principle, the fall parliamentary session, from October to
December, is dedicated to the examination and passing of the budget act; to this end, the
LORLF sets the 1st Tuesday of October as the deadline by which the Council of Ministers
must submit the draft budget act to Parliament, and provides for 40 days of parliamentary
debate on the subject. In practice, in the past seven years, the draft budget bill has never
been submitted before November 10th, and the 40-day period of debate was only
observed three out of the seven times (Table 8); in 2006, the State did not transmit the bill
until December 8th, and not until December 21st in 2007! Despite these delays, the
National Assembly has always passed the budget before the end of the year, and the initial
budget act has always been promulgated either at the end of the year or in the first days of
the fiscal year concerned.
Furthermore, without budget review acts and an operational Court of Auditors, the
National Assembly does not have any information about the effectiveness of previous
budgets. Neither does it have the sufficient expertise to examine all of the sectoral aspects
of the budget bill.
These various elements greatly decrease the policy and democratic dimension of the
budget act and increase the risk that the State’s provisional budget will be driven by
a means-based approach instead of a results-based approach.
Table 8. Analysis of the meeting of deadlines for the examination of the draft budget
act by Parliament, 2005–2010
Fiscal year
Date budget act
was transmitted
to Parliament
Legal
parliamentary
debate period (40
days) respected
Date initial
budget act was
approved
Date initial
budget act was
promulgated
2005 11/11/04 Yes 12/21/04 12/22/04
2006 11/30/05 No 12/27/05 01/03/06
2007 12/08/06 No 12/29/06 01/10/07
2008 12/21/07 No 12/31/07 01/04/08
2009 11/10/08 Yes 12/17/08 12/22/08
2010 11/24/09 No 12/18/09 12/23/09
2011 11/12/10 Yes 12/22/10 12/27/10
Source: EU 2009 for 2005–2009; DB/MEF for 2010–2011

51
95. The late delivery of the budget guidelines letter, which asks the ministries to prepare their budget within the following two weeks, has the negative effect of obliging the internal and MEF budget reviews to be conducted in a period of 2 to 3 months instead of the 4 to 5 months initially planned. This obviously induces errors and has a negative effect on the quality of the prioritization process, given the budget constraints, thus resulting in the risk that a means-based approach will prevail over a strategy- or impact-based approach. For the 2011 budget, for instance, the MAEP draft budget, excluding feeder roads, was 47.2 billion CFA francs, including 39.8 billion CFA francs for capital expenditures, while the budget passed by Parliament ultimately amounted to only 25.4 billion CFA francs, including 22.4 billion CFA francs for capital expenditures. In such a short timeframe, was the MAEP able to reduce its budget by nearly half while carefully prioritizing its objectives?
96. Moreover, until 2009 (the preparation of the 2010 budget), MEF and MPDAT were in charge of compiling all the budget items, up to a certain point, which eliminated any possibility of further verification by the technical ministries involved. This sometimes led to significant errors that represented a large share of the provisional budget, which consequently had a negative effect on budget implementation rates. For example, in 2010, MEF included the total amount of the IsDB-financed Integrated Rural Development Project
Box 6: The policy and democratic dimension of the Budget Law (cont.)
One of the propositions of the budget programming process reform consists in
adding a budgetary dimension to the State seminar organized the past two years
in May–June to review the State’s actions.1 The gradual establishment of MTEF
in the priority ministries and the presentation of a program budget by each
ministry to Parliament—for the first time this year, in October as part of the
preparation of the 2012 budget—are also important steps towards strengthening
the policy and democratic dimension of the Budget Act. However, increasing the
Assembly’s sectoral expertise is necessary if it is to comprehend the budgets of
technical ministries effectively; this support could undoubtedly be organized as
part of the ongoing programs to strengthen the Parliament’s capacities.2
Furthermore, it is high time that the Court of Auditors, for which the country
has been waiting since 1998, finally enters into operation and helps provide
greater transparency and effectiveness to the budget process, by allowing for the
creation of budget review acts and the carrying out of specific budget
implementation studies.
____________________
1 EU 2011a.
2 There are currently two programs whose mission is to strengthen the National Assembly’s capacities;
one is financed by the UNDP, and the other by the EU (Institutional Support Program – PAI).
52
for the Mô Plain (8.2 billion CFA francs) in the MAEP budget instead of the project’s annual installment. Since 2010 (the preparation of the 2011 budget), MEF and the technical ministries have continued to communicate until the draft budget is submitted to the Council of Ministers, which should keep such errors from reoccurring.
97. Furthermore, the planning and preparation phase (feasibility studies, invitations to bid, etc.) of actions assigned a line in the provisional budget for the following fiscal year were often not advanced enough for these actions to obtain a satisfactory implementation rate during that fiscal year.
98. This problem becomes even more critical in regards to external resources: the Togolese administration appears to have little understanding of the conditions, procedures, and time constraints of the various donors, which, in its defense, are often complex and vary from one donor to another. In Togo, this lack of knowledge is undoubtedly exacerbated by the fact that the amount of international aid decreased significantly from the early 1990s to the mid-2000s, and has not yet reached its previous levels. In the case of MAEP, this results in projects included in the budget that are never implemented, or estimate amounts that are completely different from the sums that are ultimately disbursed during the fiscal year. Quite often, a project is included in the budget one, or even several, year(s) before it is actually implemented and when it is implemented, the sums disbursed remain inferior, and often greatly inferior, to the planned amount, due to constraints related to an unfamiliarity with the donor’s procedures or an inadequate planning of the actions, as mentioned above.
99. In 2010, for the various reasons mentioned above, programming errors involving capital expenditures from external resources amounted to more than 20 billion CFA francs, or 87% of the capital expenditures from external resources included in the budget, and 60% of the overall MAEP budget, excluding feeder roads, for that year (Table 9). These errors are the leading cause of the very low implementation rate of capital expenditures from external resources for that year (21%, since some projects partly compensated by exceeding their budget estimates).

53
More precision is needed in the programming and planning of actions, and, more
importantly, the estimation of the necessary deadlines must be more realistic, especially as
concerns administrative procedures (public procurement, etc.), so that only actions having
the highest probability of being implemented are included in the budget. Priority must be
given to actions for which the preliminary work has been completed or at least started
during the budget programming period.
Programs that have little chance of being implemented within the following fiscal year must
not be included in its budget. If an unbudgeted program is, in fact, ready to be
implemented, the supplementary budget law must be used to bring its budget situation into
compliance.
An institutional system within the MAEP allowing for greater collaboration with donors
regarding the budgeting (and the monitoring of achievements, as discussed in Section 4.2) of
the projects they finance must be developed. All projects financed from external resources
and included in the agricultural budget should have, within MAEP (in the technical
directorate involved or, for inter-ministerial projects, in the directorate in charge of
planning or directly under the SG) a designated focal point who is familiar with the donor’s
procedures and who would be responsible for collaborating with the donor to establish
realistic budget estimates, ensure the pre-conditions for project implementation have been
met, remove any obstacles during implementation, and, finally, make monthly progress
reports about budget implementation and the actions accomplished to SG/MAEP,
DAF/MAEP and the Directorate in charge of Monitoring and Evaluation (M&E). This focal
point would thus be accountable for the project’s budget implementation rate. The GDPAS
should take up this proposal and define the terms and conditions of its implementation.

54
Table 9. Budget programming errors for the 2010 fiscal year
Project title Source of funding
Budgeted amount
(millions of CFA francs)
Implemen-ted amount (millions of CFA francs)
Implemen-tation rate
DAF/MAEP Explanations
Irrigation Development Project in the Lower Valley of the Mono River (PBVM)
BADEA 1,069 159 15%
Project launched in 1998 that has always had serious problems receiving disbursements from the BADEA part of its financing, due to complex procedures, lack of communication with the donor, and MAEP’s difficulty in finalizing the initial studies; late 2010, 12 years after the project began, only 89ha had been rehabilitated, and only 47% of the BADEA loan had been disbursed.
Development and Rehabilitation Project for Agricultural Lands in the Mission-Tové Area (PARTAM)
BADEA 1,156 47 4% Project launched in 2004, has the same problems as the PBVM regarding BADEA’s share of its financing.
Farmland Development Project for Djagblé Plain
BADEA 1,800 136 8% Project launched in 2008, has the same problems as the PBVM and the PARTAM.
Integrated Rural Development Project for the Mô Plain
IsDB 8,159 0 0%
Project inscribed erroneously for its global amount instead of its yearly installment by MEF. Until 2009, MAEP did not have the option of reviewing the draft budget before its submission to the National Assembly, and was thus unable to correct this MEF error. The yearly installment was not disbursed because the preliminary studies had not been completed.
Pilot test for M&E and capitalization FAO 359 0 0% Unknown FAO project of undetermined origin. ICAT – Strengthening of the capacities of assistance and support structures to ATAs
FAO 381 0 0% Actually a subcomponent of the EU Food Facility/Strengthening of the Food Security of Vulnerable Households project already included in the budget elsewhere; this is thus a redundancy.
Emergency rice initiative FAO/
WARDA 1,995 0 0% Project included in the MAEP budget by MPDAT, never developed.
Aquaculture investment in the lower Volta valley
Spain 843 0 0% Global amount of the project included by error, project never developed.
ITRA - WAAPP World Bank 450 0 0% Project included much too early; actually launched in late 2011.
Various projects to be financed with the Food Facility budgetary support
EU 4,505 0 0% Lack of communication between MPDAT, MEF, and MAEP; MPDAT included it in the MAEP budget even though this budgetary support was not meant for it.
TOTAL 20,717 342 2% For the record, total budget for capital expenditures from RE in 2010, excluding feeder roads: 23,813 million CFA francs.
Source: DAF/MAEP

55
100. Implementing the MTEF, while advocating a strategy- and results-based approach instead of a means-based one, should help resolve a good number of the problems described above. Nevertheless, it seems evident that too few resources, both human and material, have been dedicated to the implementation of this important innovation, which seriously jeopardizes its pertinence. Indeed, such an operation is of little interest unless it truly allows all levels of MAEP to build and integrate an impact-based medium-term strategy. This operation is more complex for MAEP than for the other ministries involved, because, in agriculture, the strategic options and possible actions are much more numerous and their impact is often more difficult to evaluate than in the sectors of health or education, for example.
101. Four people from MAEP were trained to pilot this operation: the head of the Planning Division, two other individuals from DPAC, and one person from DAF. One of the trained DPAC employees has since left to become a project coordinator, which is an illustration of yet another recurring issue in MAEP: the rapid turnover rate of trained employees. The three remaining individuals, along with a representative from DSID, compose the MTEF unit, which works with focal points from each directorate. In theory, these focal points are responsible for leading the planning operations within their directorate and providing the budget documents and project briefs for a 3-year period, based on RBM and including M&E indicators. These same focal points will later be responsible for monitoring the programs and drafting performance reports.
102. In practice, due to a lack of both human and material means, as well as a lack of training, the process is still in its infancy and has experienced great difficulty in shifting from a means-based to a results-based approach. The first MTEF produced in 2010, for the 2011–2012–2013 period, was not a veritable MTEF, and the same will probably be true of the one for the 2012–2013–2014 period, which was in preparation when this review was being drafted.
103. It must nevertheless be emphasized that the implementation of an MTEF process at a sectoral level will have a limited scope and may lead to profound frustration and disinterest if it does not coincide with a similar process on a national scale that would guarantee a continuity of resources for the technical ministries. Building a 3-year strategy at the sectoral level makes little sense if the anticipated budget level for the period remains a mystery that is only revealed year after year, one fiscal year at a time.
PASA thus comes at a good time to strengthen MAEP capacities, especially for the
effective implementation of the RBM and MTEF. The training financed by PASA
has already begun (training of four executives in Senegal and Cape Verde).
The implementation of MTEF at the sectoral level must coincide with a similar
process for the budget on a national scale that would guarantee a continuity of
resources for the technical ministries.

56
4.2. Technical Efficiency of Budget Implementation
104. As with the budget programming process, a reform of the expenditure circuit is also planned in order to bring it into compliance with WAEMU directives before 2017.30 Today, the expenditure commitment/validation/payment order issuing/liquidation process is relatively cumbersome and consists of two parallel circuits, one for operating expenditures and another for capital expenditures. Indeed, the Minister of the Economy and Finance is currently the only chief authorizing officer of the State’s expenditures in Togo, while the Director of Financial Affairs is the delegated authorizing officer for operating expenditures, and the Director of Financial Affairs and Control of the Implementation of the National Plan is the delegated authorizing officer for capital expenditures. The expenditure circuit is described below:
i. After the promulgation of the Budget Act, the various ministries are notified of the amount of their appropriation by distribution decree. The Minister of Finance, who is responsible for regulating the rate of appropriation consumption according to the situation of the State treasury, sends them expenditure authorization forms (EAF) and sets the period in which they can commit expenditures. At the beginning of the fiscal year, appropriations are generally available at 100% for staff expenditures, 100% for public expenditures, and 50% for operating costs (80% for priority ministries, which includes MAEP);
ii. The DF/MEF commits the staff expenditures all at once, based on the recruitment of civil servants, and issues payment orders for them on a monthly basis;
iii. Commitment notes are issued by the appropriations administrators for operating expenditures in each sectoral ministry and sent to the MEF Directorate of Financial Affairs (DCF/MEF) for a priori review (the charging and nature of the expenditure, detection of any slice and package bidding to circumvent the 15 million CFA franc threshold (see below), availability of the appropriations, etc.); if the DCF/MEF review does not reveal any irregularities, the commitment notes are approved, recorded in the new Integrated Financial Management Information System (IFMIS, launched in 2009) and transmitted to DF/MEF. After receiving the commitment confirmation certificate, the appropriations administrator ensures the action is performed then sends the liquidation file to the DCF/MEF, which verifies the service provided on site. The file is then sent to DF/MEF which issues the payment order and returns it to DCF/MEF, which approves the payment order (in the future, the repeated delivery to DCF/MEF will probably be done away with). The file is finally sent to the General Pay Office of the Treasury (PGT) for additional review and payment;
iv. The technical ministries submit their commitment propositions for capital expenditures to DFCEP/MEF, which reviews them and proceeds with the commitment. After implementing the expenditures from internal resources, the liquidation file is reviewed and approved by DCF/MEF and sent to DFCEP/MEF, which issues the payment order and transmits it to PGT; in general, capital expenditures from external resources are not sent to DCF/MEF, but directly to the donor.
30 MEF 2011.

57
105. The current WAEMU directive reforms involve the unification of the circuits and a horizontal and vertical deconcentration of the process: the sectoral ministries and regional administrations will become chief authorizing officers: they will commit, liquidate, and issue payment orders for expenditures, and will have their own DCF/MCF unit.
106. The organization of the public procurement system also underwent a comprehensive reform in 2009. Previously, it was highly centralized around a National Public Procurement Commission and involved an extremely complex post-tender signature circuit, which delayed implementation by several months. The 2009 reform established a National Directorate of Public Procurement Monitoring within the MEF (DNCMP/MEF) and, within each ministry, a Procurement Commission (CPM) and a Public Procurement Regulatory Authority (PPRA), under the authority of a Procurement Officer (PRMP) vested by the minister with the authority to supervise the entire process. The latter is now deconcentrated: the technical directorates of the ministries prepare the invitations to bid under the supervision of the PPRA (and the DNCMP/MEF for those amounting to more than 15 million CFA francs) and open and evaluate the proposals under the supervision of the CPM; the DAF then prepares the contracts, which are now signed only by the minister or the PRMP, the Minister of Financial Affairs, or the prime minister and the service provider. The new applicable thresholds are as follows: mutual agreement below 15 million CFA francs; restricted bid from 15 to 25 million CFA francs; invitation to bid above 25 million CFA francs. Each ministry must prepare an annual procurement plan, reviewed by the PRPM and submitted to DNCMP/MEF, ideally before the beginning of the fiscal year so that the invitations to bid can be issued beginning in January.
107. As concerns MAEP’s budget implementation and programming, a distinction must be made between the actions financed from internal resources and those financed from external resources for the period under examination, 2002–2010. The implementation rate of actions from internal resources suffered due to the following obstacles:
i. Insufficient planning at the time of inscription in the budget, as seen in the previous section;
ii. Delays resulting from the centralization and cumbersome nature of public procurement procedures; as illustrated above, this obstacle should no longer exist, since the procedure has been deconcentrated and simplified. In 2011, however, the MAEP public procurement plan was submitted to DNCMP in January but not approved until the beginning of May and so from January to April MAEP was thus not authorized to use its appropriations for capital expenditures from internal resources. Furthermore, it appears that MAEP’s internal public procurement procedures are still extremely long, as the commissions are unable to meet in a timely manner, which has a negative impact on the launching of the PASA and WAAPP projects in particular, since the PADAT project has chosen to turn to the UNDP Service Center to accelerate the acquisition of its equipment and services;
iii. The accumulation of payment arrears to service providers, due in part to the cumbersome nature of payment order procedures, presented above, and in part to a shortfall in the State cash flow; for instance, CAGIA had great difficulty contracting carriers to distribute fertilizer in the regions this year because of the payment delays they experienced in 2010 (9 to 12 months);

58
iv. Ill-suited timing of expenditure availability: appropriations for operating expenditures and subsidies for autonomous agencies, in particular, are made available in equal monthly installments (1/12th), which do not necessarily correspond to the needs of the recipient administrations; the ITRA, for example, has difficulty planting its test and demonstration crops due to a lack of means at seedling time;
v. Cancellation of appropriations due to lower than expected revenues at the national level or restructuring in the course of the year; these budget overhauls, which have generally been done collectively at mid-year (June–July) since 2008, lead to a suspension of the budget for several months (in 2010, from April to July) and are apparently carried out by the MEF in a standard and arbitrary fashion without any consultation with the technical ministries involved.
108. The implementation problems for capital expenditures from external resources are a consequence of those found in the budget programming phase: unfamiliarity with donor procedures and sometimes, when projects are managed by structures other than MAEP, an absence of precise information about the actual achievements.
109. Whether it is a matter of actions financed from internal resources or those financed from external resources, the real-time monitoring of DAF/MAEP disbursements must be improved. There are 15 appropriations administrators within MAEP (the 10 central directorates and 5 regional directorates). They commit their expenditures directly and inform DAF/MAEP. The latter must conduct a monthly monitoring of the financial execution of all projects included in its budget and no longer leave this task to DFCEP/MEF alone. More precise budget monitoring, which would remove some obstacles within an acceptable timeframe, is a necessary step towards improving implementation rates.

59
Capital expenditure implementation rates could be improved under the following
conditions:
- The planning of actions at the time of their inclusion in the budget must be better; only interventions that are at a rather advanced stage of preparation (preliminary studies, invitations to bid, etc.) must be included in the budget; non-budgeted projects that are ready to be launched within the fiscal year must be included in the budget as part of the Supplementary Budget Law;
- In particular, a better understanding of the external resources that are available and ready to be implemented must be developed by creating a donor consultation system; a focal point must be designated for each donor and trained in that donor’s procedures; he will be accountable for the implementation rate of the programs financed by that donor;
- The public procurement plan for year n+1 must be submitted to DNCMP/MEF before the end of year n;
- The commissions in charge of public procurement within MAEP must be strengthened in order to attain an acceptable level of performance.
- An effort must be made to cancel internal debt and pay service providers within a maximum limit of 60 days;
- Appropriations must be made available at a rate that is adapted to need (quarterly or biannually, if necessary);
- Any appropriations restructuring by MEF in the course of the year must be done in consultation with MAEP;
- DAF/MAEP must conduct monthly monitoring of the financial implementation of all projects included in its budget;
- In particular, the focal points for each donor must collect information about the performance rates of the projects they finance.

60
4.3. Monitoring & Evaluation
110. As mentioned above, M&E has heretofore been seriously neglected on both the national level and within the agricultural sector.
111. On the national level, in the absence of a budget review act, the budget cycle is not closed and the available information about budget implementation rates is currently fragmentary and limited to the DF/MEF, the DFCEP/MEF, and the donors.
112. Within MAEP, there is currently no effective M&E system at any level. At the central level, no staff was allocated to the M&E division from 2007 to 2009, and the division has since received young, poorly trained employees who are lacking in means. The majority of them were rapidly transferred elsewhere, to the point that only two remain today. Within ICAT and CAGIA, the two autonomous agencies that are the most present in the field, it is impossible to obtain reliable and objective data about the impact of their actions. Even for the projects implemented by PMU, M&E has generally been neglected; the CDP, for example, never finalized the hiring of its M&E manager, and although the incidence of its agricultural component is known, its impact remains unclear. The evaluation of the agricultural information system that was recently conducted by the EU (EU 2011d) confirms this observation.
4.4. Ownership of Projects by MAEP
113. As seen in Chapter 2, a number of important agricultural projects are implemented by entities that do not have a strong organic link to MAEP, either by being included in its budget regardless (ex.: EU/EDF projects for the Fight against the Avian Flu and EU/Food Facility of Food Security Support for Vulnerable Households, which were both implemented by the FAO), by not being included in the national budget (ex.: STABEX, agricultural component of the CDP, NGO component of the EU Food Facility project), or by being included in the budget of other ministries (ex.: new lowlands development project by the MERF, etc.). This institutional arrangement discourages MAEP involvement , even when
In the PNIASA document (MAEP 2010a), a detailed M&E methodology and
indicator grid are provided. However, it is clear that they cannot be implemented
unless MAEP’s M&E capacities are significantly strengthened by PASA and
PADAT.
The implementation of this M&E system will also require the implementation of
appropriate cost accounting and software within MAEP, which would make it
possible to monitor the implementations related to the various components of
PNIASA. IFMIS-compatible software would be preferable. The corresponding
invitation to bid is already being prepared.
Finally, the strengthening of M&E capabilities should coincide with the creation of a
studies unit that inventories, collects, archives, and publishes all of the available
documents about the sector produced by DPAC, DSID, and the other actors.
61
it is provided for in the project documents, and often results in situations that are unsatisfying on several levels:
i. Only programs included in the MAEP budget are taken into consideration when determining the amount of agricultural support;
ii. Problems of coherence with national policies: within the framework of the EU Food Facility, for example, the distribution of free inputs in 2010 by the NGOs involved (AVSF, French Red Cross, and the Spanish Red Cross), while the inputs distributed by the State are subsidized but must be purchased, generated discontent among the non-recipients and led the EU to place this program under MAEP authority; as part of the CDP, a complicated institutional arrangement had CAGIA distributing inputs, ANSAT receiving payment in kind (although it never collected the harvests), and ICAT implicated in the collection of appropriations, which led to defaults and placed ICAT agents in a delicate situation that was incompatible with their extension service mission;
iii. Insufficient knowledge transfer and capitalization of experience: when these projects end, the experts who implemented them, whether local or foreign, disperse leaving behind little of their expertise and knowledge, especially since the State’s archive system is still inefficient. This was the case for PPMR and STABEX, which were both implemented under MPDAT authority and whose implementation units were disbanded in 2009 and 2010, having transmitted little knowledge about their agricultural achievements within MAEP;
iv. Risk that achievements may not last over time: either because adequate attention was not necessarily paid to the organization of the recipients (ex.: feeder roads, lowlands, and cotton warehouses with respect to STABEX31), or because the State services will be unwilling to be responsible for ensuring the durability of achievements in which they were not (or were hardly) involved;
v. In some cases, a depletion of the administration’s human resources, since executives were recruited by the PMU of these projects for much higher salaries (3 to 4 times higher) than those given to civil servants; this raises the important question of the payment and motivation of MAEP executives, an issue that must be addressed in the current reforms.32
31 EU 2011b. 32 The World Bank’s previous mission on the reorganization of MAEP encouraged the GoT to give serious thought to this subject (World Bank 2011c).

62
5. SPECIFIC INSTANCE OF AGRICULTURAL INPUTS, FOOD SECURITY (ANSAT), AND MECHANIZATION
5.1. Supply of Agricultural Inputs
114. The State has been involved for the past 35 years in importing and distributing fertilizer in Togo (Table 10), justifying its involvement by the strategic nature of fertilizer use for growth in the agricultural sector and the country's food security, the high incidence of rural poverty, and the fear that dealers may take advantage of the lack of sophistication among farmers, most of whom are poorly trained and even more poorly organized.
115. Since 2008 this mission has been assigned to CAGIA, which manages all agricultural inputs (mainly fertilizers, and to a lesser extent seed and pesticides) acquired through public resources or through donations from PTFs. By law, CAGIA does not have a monopoly over this activity but, on a de facto basis, private operators prefer
In the future, MAEP should become more involved in all the agricultural projects
that the GoT has accepted or committed itself to, even when they are implemented
by another ministry. This would guarantee better coherence with national
agricultural policies and allow the Togolese administration to improve its
assimilation of expertise and results.
The need for a strong organic link raises the issue of the PMUs: of course, these
structures made it possible to implement projects quickly, with implementation rates
close to 100% (ex.: STABEX, PPMR, etc.), while also reducing the risks related to
the State’s reputably weak fiduciary management capabilities. However, experience
has also shown that, in practice, these structures have limited results when it comes
to knowledge transfer to local authorities, the capitalization of experience, and the
durability of achievements, even when they are set up in immediate proximity to
their State counterparts (ex.: EU/EDF project for the Fight against the Avian Flu
implemented by the FAO).
The PASA currently being launched takes an innovative approach: the project
implementation is entrusted to MAEP directly, and strengthened by technical
assistance; if this experience proves to be successful, the PMU formula should
gradually be phased out.
The various elements discussed in this chapter—more thorough and realistic
programming and planning, closer consultation with donors, the appropriation of all
agricultural projects, the effective implementation of RBM and MTEF, increased
technical efficiency in regards to implementation (and especially for public
procurement), the implementation of an effective M&E system—are the foundation
for a possible evolution towards a sector-wide approach (SWAp) that would
consecrate MAEP’s effective leadership in PNIASA implementation.

63
to avoid getting involved in a market controlled by the State and characterized by a subsidy factor that varies from year to year (see below). It is estimated that fertilizer imports by private operators distributed in the domestic market do not exceed 10 to 15% of the total. Private importers, some of whom are grouped together in the Agro-Inputs Suppliers Association of Togo (AFITO), also complain because CAGIA is now launching its bid solicitations among international manufacturers, whereas in the past they were launched among local operators who imported on the State's behalf.33
Table 10. History of the organization of fertilizer supply in Togo, 1976–2011
1976–1984 SEMP Creation of the Fertilizer and Means of Production Service (SEMP) with the fertilizer import monopoly
1984–1990 SEMP – SOTOCO
SOTOCO is authorized on an exceptional basis to import and market food-crop fertilizers in its area of action and to distribute cotton fertilizer throughout the country.
1990–1997 DMMP SEMP took over the monopoly by becoming the Division of Markets and Means of Production (DMMP) of the Administration and Finances Department of the Ministry of Agriculture.
1997–2008 DMPL – SOTOCO
DMMP became the Division of Maintenance, Patrimony, and Logistics (DMPL) as part of the Sector Import Program. SOTOCO resumed its imports. DMPL and SOTOCO stopped importing fertilizer directly and issued calls for bids from market companies. The winning companies import and sell to DMPL and to SOTOCO. However, DMPL's weak financial capacity gradually forced it to limit itself to managing fertilizer donated by Japan (KR1 and KR2 programs). At the same time as they are filling these orders, the market companies are involved in the subregional trade in fertilizers. They import other quantities of fertilizer, a tiny part of which is sold domestically and the rest to the landlocked Sahelian markets (Burkina Faso, Mali, Niger, etc.).
2008– Today
CAGIA – NSCT/FNGPC – CCFCC/ FUPROCAT
Creation of the Central Procurement and Management of Agricultural Inputs (CAGIA), the main actor in supplying and distributing food-crop fertilizers throughout the country. NSCT imports cotton fertilizer in collaboration with FNGPC. CCFCC and FUPROCAT import very limited quantities for the coffee-cacao industry. The private sector is virtually nonexistent in the domestic market.
Source: data collected by the authors
116. Overall, the quantities of fertilizer imported by CAGIA hovered around 10,000 tons from 2003 to 2008 and then rose to 30,000 tons in 2009 and 2010 (taking into account the imports done on behalf of the CDP [Box 7] in 2009) and 35,000 tons in 2011 (Table 11). It is worthwhile noting that the increase in imports led immediately to an increase in sales, which went from around 10,000 tons in 2008 to around 25,000 tons in 2009 and 2010;34 the gap between imports and sales is most likely due to logistical constraints (fertilizer arriving too late in the agricultural season).
33 World Bank 2010b. 34 They are distributed regionally as follows: Maritime: 13%; Centrale: 14%; Plateaux: 15%; Kara: 31%;
Savanes: 27%. Source: CAGIA.

64
Box 7. Fertilizer distribution in the agricultural segment of the Community
Development Project (CDP): a nonviable and unreplicable all-state approach
In the wake of the 2008 farm-price crisis, the World Bank sought to provide support to
the agricultural sector. To speed up execution, this support was channelled through the
CDP, a project already under way under the aegis of the MDB. The cost of the
agricultural component was estimated at 5 million USD; of that amount, 3.5 million USD
was ultimately disbursed. In particular, the project imported 4,275 tons of fertilizer and
844 tons of improved seed, distributed mainly in 2009 to around 14,000 producers (or
about 1% of Togo's farmers). The fertilizer was distributed half for cash and half on
credit, at the state-set subsidized price, and the improved seed was sold 100% on credit.
ICAT was to identify and do technical monitoring of the beneficiaries, CAGIA was to
distribute the inputs, and ANSAT was to collect the loans in kind at a price of 18,000 CFA
francs per 100 kg sack of maize.
Farmer beneficiaries were then to receive three consecutive subsidies without counting
the free support from ICAT:
- the subsidy on the price of inputs, estimated for fertilizers at more than 50%
of the actual cost in 2009 (taking into account the import duties not paid by
the CAGIA, see above);
- a free seasonal credit;
- a subsidy on the selling price of maize, the price of which was between
13,000 and 16,000 CFA francs at the time of harvest, for a subsidy of
between 10% and 40%.
Aside from the fact that such an approach can only contribute to completely isolating
farmers from market reality, which raises the issue of the sustainability of the impact,
the multiplication and scale of the subsidy elements make it completely impossible to
replicate in the State's current financial situation.
In addition, precisely because of the shortage of resources as well as communication
problems between the agencies involved, ANSAT ultimately did not meet all of its
commitments. Unhappy at being unable to sell their maize at a subsidized price, and
consequently seeing their credit become 10% to 40% more expensive, and in some cases
also having suffered losses while vainly waiting for ANSAT to intervene, many farmers
chose to default. ICAT was therefore obligated to take over collection of the credits
(sometimes with help from the police), which is obviously highly prejudicial to the good
relations it needs to maintain with producers in order to fulfil its extension mission.
As of December 31, 2010, a year after the harvest in question, the credit repayment rate
was 69% (358 million CFA francs out of 520 million CFA francs); it has since risen to 84%.
Sources: World Bank 2008 and 2011c, CDP 2011, MAEP 2011

65
Table 11. State fertilizer imports and distribution, 2003–2011
2003 2004 2005 2006 2007 2008 2009 2010 2011 Quantities imported (tons) 10,485 11,7191 6,1212 9,801 700 9,285 29,2753 30,000 35,000 Average purchase price4 (CFA F/ton) 184,000 184,000 239,000 240,000 208,000 363,000 396,000 190,000 274,000 Total cost of operations5 (billion CFA F) 2.0 1.9 1.2 2.5 0.3 3.5 11.2 6.5 10.66 Proportion of local costs in total cost 2% 5% 8% 6% 46%7 5% 7% 12% 9%8 Funding from internal resources9 (billions CFA F) 1.1 0.0 1.0 0.0 0.0 5.7 1.8 3.2 Funding from external resources9 (billions CFA F) 0.0 0.0 0.0 1.210 0.0 8.611 1.012 0.0 Quantities sold (tons) 10,424 ?13 8,423 6,415 5,177 9,844 24,87114 25,32415 Selling price (CFA F/50 kg sack) 7,750 7,750 7,750 12,000 12,000 12,000 11,000 10,000 11,000 Estimated cost16 (CFA F/50 kg sack sold) 9,367 ?17 12,480 13,181 11,602 19,003 21,570 11,081 15,08218 Estimated subsidy level19 17% ?17 38% 9% -3% 37% 49% 10% 27%18 Estimated total subsidy cost20 (billion CFA F) 0.3 ?17 0.8 0.2 0.0 1.4 5.3 0.6 2.918
Notes: 1 of this, 1,790 tons Chinese donation; 2 of this, 1,570 tons Chinese donation; 3 of this, 4,275 tons CDP; 4 average purchase price in international markets CIF Lomé + import duties when paid; donations not taken into account; 5 average purchase price in international markets CIF Lomé + import duties when paid + local costs (CAGIA operation, domestic transport, etc.); 6 estimated cost, based on known purchase cost of fertilizers (9.6 billion CFA F) + local costs estimated at 1 billion CFA F; 7 not a very significant figure considering the very limited fertilizer purchases that year because of significant residual reserves at the end of 2006; 8 projection based on previous years and quantities imported; 9 Replenishment of the revolving account until 2008, direct payment of cost of operations by the Treasury beginning in 2009; 10 IsDB loan; 11 budget support from France: 3.2 billion CFA F; OFID: 5.5 billion CFA F; 12 WADB loan (EFSP) 13 data unavailable; 14 of which CDP: 3,176 tons; 15 of which CDP: 511 tons; 16 calculated as follows: average purchase price + local costs divided by quantity of fertilizer sold that year; 17 cannot be calculated in the absence of data on quantities sold; 18 calculated based on estimated local costs and assuming that the entire quantity imported, or 35,000 tons, will be sold; 19 dispute with the MEF over unpaid customs duties not taken into account; 20 calculated as follows: (estimated cost of the 50 kg sack sold – selling price of the 50 kg sack) x quantities sold that year; dispute with the MEF over unpaid customs duties not taken into account. Source: CAGIA

66
117. The strong correlation between increased imports and increased sales noted in recent years seems to indicate that actual demand for fertilizer in Togolese agriculture is not being met at current import levels. A certain number of findings corroborate this assumption:
i. The collection of data on fertilizer needs is the responsibility of ICAT agents, who today are working with fewer than 10% of farmers (see Chapter 6); under these conditions, the data collected must be considered with caution, as it excludes the vast majority of producers. Moreover, the inadequate presence of ICAT in the field is also a hindrance to the dissemination of improved technologies;
ii. CAGIA distributes fertilizer to its own warehouses, which numbered 50 in 2008 and 113 in 2011, with one-off deliveries to partner ATAs, of which there are 155.35 It estimates that the average distance between any producer and a source of fertilizer is currently between 15 and 20 km, which is still a considerable distance to travel considering local transport conditions;36
iii. In addition, CAGIA estimates that 20% to 25% of the fertilizer it sells is bought by farmers with more than 5 ha of land, and in some cases several dozen hectares. It is obvious that these farmers are unable to purchase enough fertilizer in a rationed system unless they enjoy special treatment or they buy some of their neighbors' allocations;
iv. Lastly, although it is not precisely known, it is likely that the rate of chemical fertilizer use is still very low overall in Togo. It is estimated that about 16% of the land area is fertilized, and an average application of 6 kg/ha is often cited.37 If we take as base an arable land area of 2.135 million ha (excluding permanent crops and cotton, which have their own fertilizer supply channels),38 fertilizer consumption of 25,000 tons (2009 and 2010) of 46% urea and NPK 15-15-15 gives an average application of 5.3 kg of fertilizer per hectare; consumption of 35,000 tons (2011 target) would give an average application of 7.4 kg of fertilizer per hectare (assuming—optimistically, as will be seen below—that all the fertilizer sold in Togo is utilized there). The FAO gives the intensity of fertilizer use as 3.0 kg of fertilizer per hectare, taking into account all of the arable land and permanent crops, which seems to indicate that the intensity of fertilizer use is even lower for coffee and cacao than for the food crops. This intensity puts Togo under the average for West Africa (5.1 kg/ha) and very far from the average for Africa (19.2 kg/ha), not to mention other regions of the world (Figure 30).
35 The 113 warehouses are distributed as follows: Maritime: 21, Plateaux: 23, Centrale: 17, Kara: 31 and Savanes: 21; and the 155 one-off deliveries to ATAs: Maritime: 21, Plateaux: 34, Centrale: 48, Kara: 11 and Savanes: 41. Source: CAGIA. 36 By way of comparison, liberalization of the fertilizer sector in Kenya has reduced the average distance between farmer and fertilizer seller from 8.1 km in 1997 to 3.4 km in 2007, with distances of less than 2 km in certain high-potential farming regions like the Central Highlands. Source: Ariga et al. 2009. 37 In particular, World Bank 2010b. 38 Source: FAOSTAT (consulted on 04/11/11).

67
Figure 30. Intensity of fertilizer use, 2008 (kg fertilizer/ha)
Note: No data available for Benin. Source: FAOSTAT (consulted on 04/11/11)
118. Fertilizers are sold by CAGIA at a price announced each year by the president of the republic, identical all over the country. According to the figures released by CAGIA (Table 11), the selling price for the 2005–2010 period corresponded to an average subsidy estimated at around 33% of the actual cost of import and distribution. Moreover, a legal dispute is under way between MEF and CAGIA, because apparently the latter did not pay all the duties on some of its imports (Box 8). While this cannot be precisely determined at this stage, it is likely that the subsidy factor, taking into account the unpaid import duties, was actually around 35%–40% on average for the 2005–2010 period.
0.4
2.2
2.3
3.0
3.9
5.2
6.8
7.1
7.2
7.4
7.5
9.0
12.4
23.9
24.6
29.9
38.2
46.6
5.1
19.2
90.9
116.0
119.3
178.5
106.1
0 50 100 150 200
Nigeria
Uganda
Senegal
Togo
Ghana
Tanzania
Rwanda
Cameroun
Ethiopia
Ivory Coast
Mali
Burkina Faso
Nigeria
Zimbabwe
Malawi
Kenya
Zambia
South Africa
West Africa
Africa
North America
South America
European Union
Asia
World
kg of nutrients/ha

68
119. The subsidy level for the 2005–2010 period varied significantly according to the selling price to farmers and, most of all, fluctuations in the purchase price of fertilizers in world markets (Figure 31). The subsidy was especially high in 2008 and 2009 (37% and 49%, respectively, excluding unpaid customs duties, and hence probably in reality over 40% and 50%), because of the sharp rise in the price of fertilizer in the international markets. The cost to the State for these two years of subsidies, excluding unpaid customs duties, is estimated at 1.4 and 5.3 billion CFA francs; the cost was much higher in 2009, as the
Box 8. Import duties on agricultural inputs: a topic in need of clarification
Agricultural inputs are listed in Category 1 of the Common External Tariff (CET) of
WAEMU (and of ECOWAS, introduced in 2008 with an identical structure) and therefore
their import into Togo from countries outside WAEMU should be taxed as follows:
- Customs duties: 5% on CIF value - Statistical fee: 1% on CIF value - WAEMU community solidarity levy: 1% on CIF value - ECOWAS community levy: 1% on CIF value - Computer verification fee: 0.75% on CIF value - Entry toll tax: 2,000 CFA F/ton - Industrial and commercial profits: 1% on owned resources - Computer fee: 5,000 CFA F per declaration - Customs stamp: 4% of the statistical fee and toll
which is equivalent to a combined rate of about 10% of the CIF value.
Fertilizers are exempt from VAT (18%) and, in 2008, WAEMU adopted a provision also
exempting them from customs duties (WAEMU 2008).
The other agricultural equipment and inputs are also part of Category 1 of the CET and
are also subject to VAT (18%). Farm groups are exempt from customs duties and VAT;
NGOs are exempt only from customs duties.
While the Customs Office confirms that the duties exemption provided by WAEMU for
fertilizers is well applied in Togo, the operators' opinions differ on that subject. It also
seems that taxation of the other inputs (pesticides) involves some inconsistencies and in
some cases ends up in abnormally high taxation, especially according to the size of the
packaging.
The situation with agricultural input taxation needs to be cleared up and made
transparent and fair for all operators. To encourage development of the
agricultural sector, all agricultural inputs should be reclassified as Category 0
(exemption from customs duties) at the WAEMU and ECOWAS level. In Togo, in
order not to distort the inputs market, especially in the event that it is deregulated,
it would also be preferable for all agricultural inputs to be exempt from VAT
regardless of the importer's status.

69
fertilizer cost more; the selling price to farmers had been reduced; and, most of all, the quantity of fertilizer imported tripled to almost 30,000 tons (taking into account the CDP). In contrast, the subsidy was much lower in 2010 (10% excluding unpaid customs duties, for an estimated cost of around 600 million CFA francs) because of the drop in the fertilizer purchase price in the international markets to half its 2009 level. The subsidy was also weak or even negative in 2006 and 2007. For the 2005–2010 period as a whole, it is estimated that the subsidy, excluding unpaid customs duties, represented 33% of the actual cost of the imports and distribution and cost the State 8.4 billion CFA francs, or 1.4 billion CFA francs per year on average. For 2011, a 27% subsidy level and a cost to the State of 2.9 billion CFA francs (excluding unpaid customs duties, as usual).
Figure 31. Evolution of the fertilizer purchase price and selling price (thousands of CFA francs/ton) and the level of subsidy (excluding unpaid customs duties), 2005–2010 and forecasts for 2011
Sources: CAGIA, CDP
120. The subsidy granted by the State for fertilizers is a general subsidy with no targeting mechanism, aside from the “maize/rice” operation for which ICAT selects farmers with higher potential with at least one hectare devoted to these crops.39
121. Although 28% of agricultural public expenditures were devoted to this in the 2002–2010 period (Figure 12), this fertilizer supply strategy has not yet been subjected to any in-depth evaluation study. In particular, we do not know precisely who the beneficiaries are. CAGIA estimates that 30% of the fertilizer it distributes is used by farmers cultivating around 0.5 ha, 30% by farmers cultivating 1 ha, 15% to 20% by farmers with between 1 and 5 ha, and 20% to 25% by farmers with more than 5 ha, but these estimates have not been confirmed by a specific analysis.
122. Furthermore, today setting the price for fertilizer is a policy decision detached from the microeconomic reality of the various categories of potential beneficiary farms; we do not know what effect incentivizing the use of fertilizer has in these various categories, and we do not know what impact the subsidy has in terms of increased yields; consequently its cost/benefit ratio is completely unknown. The microeconomic
39 As part of this operation, which started in 2008 and was picked up by the CDP in 2009, farmers selected by ICAT receive 300 kg of fertilizer per hectare, half of it on credit (free, to be repaid after harvest) and half to be paid in cash.
-10%
0%
10%
20%
30%
40%
50%
60%
0
50
100
150
200
250
300
350
400
450
2005 2006 2007 2008 2009 2010 2011
Tho
usa
nds o
f C
FA
fra
ncs Average CIF for purchase
of fertilizer
Sales price to farmers
Subsidy rate

70
information available on Togolese farms is in fact fragmentary and not the result of systematic surveys: some studies (World Bank 2010b) cite the high profitability of growing rice in irrigated perimeters, even without subsidies, but the impact of the fertilizer subsidy on rain-fed agriculture, by far the most widespread form, has been little documented.
123. Lastly, persistent rumors, not confirmed by concrete observation, indicate that some Togolese fertilizer is diverted to neighboring countries. According to CAGIA, which has set up committees at its warehouses that are responsible for overseeing the proper receipt and utilization of the fertilizer, this diversion concerns no more than 5% of the total. Other sources cite a figure of 30%. The available information shows that there is no longer a price differential between Togo and Benin for the 2011–2012 season, and that the subsidized fertilizer is sold in Ghana at a price that is almost 20% lower than in Togo. In contrast, the subsidized fertilizer is sold at a higher price in Mali and Niger, and especially Burkina Faso; it seems that the selling-price differential in fact leads to a very lucrative trafficking (Figure 32). This information should be verified and complemented by data on available quantities which, beyond the price considerations, can also be a source of trafficking between countries. Therefore an overall study should be done on the fertilizer market in the subregion; this study could ideally lead to subregional management of this problem.
Figure 32. Selling price of fertilizer in the countries of the subregion, 2010–2011 and 2011–2012 seasons (CFA francs per 50 kg sack)
Note: in Ghana, the price for a 50 kg sack of subsidized fertilizer was set at GHS 27 for NPK and GHS 25 for urea in 2010–2011 (average exchange rate used: 1 GHS = 345 CFA francs) and GHS 30 for NPK and GHS 29 for urea in 2011–2012 (average exchange rate used: 1 GHS = 305 CFA francs). Sources: Ghanaian newspapers online for Ghana (www.modernghana.com and www.ghananewsnow.com), Réseau des Chambres d’Agriculture du Niger (RECA Niger) 2011 for the other countries
0
2,000
4,000
6,000
8,000
10,000
12,000
14,000
16,000
18,000
20,000
Togo Benin Ghana BurkinaFaso
Mali Nigeria
CF
A f
rancs/5
0 k
g b
ag
2010-2011
2011-2012

71
The de facto monopoly of the State, which has limited resources, in the fertilizer market thus
leads to a limitation on the quantities available that is certainly well under the country's
potential absorption capacity. In addition, disconnecting how the subsidy is determined from
the microeconomic realities of the farms, its lack of targeting and gaps in terms of the
program's monitoring and evaluation lead to questions about the effectiveness of such a
strategy for developing the use of fertilizers and support for the most vulnerable populations.
Many studies have demonstrated that the impact on agricultural growth of an untargeted
subsidy on inputs was well below an investment of the same level aimed at providing public
goods (infrastructure and improved access for rural areas, research and development,
education, etc.).1
A targeted subsidy can be justified in terms of redistribution in favor of the more vulnerable
populations and of growth, but it is generally very difficult to put in place in areas where the
farming population is very heterogeneous and where the target group is engaged in a near-
survival strategy: there is often a major risk that the subsidized inputs will be resold, and that
part of the subsidy is picked up by better-off segments of the population, or even producers in
neighboring countries, or the target group does not have the means (technical skills,
manpower, etc.) to turn subsidized inputs into additional production with at least an
equivalent value; in these cases the impact of the subsidy in terms of additional production
and improved living conditions for the target population is limited, and other types of targeted
intervention, like the distribution of cash subsidies to women, may be more effective while
having lower operating costs.
However that may be, the priority in Togo is not today to call the subsidy into question but to
move on to a system for implementing this subsidy that encourages the development of
private distribution networks. This is a confirmed, medium-term objective of the GoT (MAEP
2010c), as proved also by the mission conducted by a recent high-level MAEP delegation to
Malawi (MAEP, 2010d). This is also recommended by ECOWAS (ECOWAS, 2006) and the AU
following the African Summit on Fertilizers in Abuja in 2006 (AU 2006).
In addition to an increase in quantities of fertilizer (and other inputs) available, privatizing the
supply should appreciably reduce the producer-warehouse distance2 and provide greater
consistency between the availability of fertilizers and the agricultural calendar, which is
essential for rainfed agriculture in which increasingly significant inter- and intra-annual
fluctuations in precipitation need to be managed. Privatization should also make different
types of fertilizers available to farmers that are better adapted to the various food crops and
soils other than the NPK 15-15-15 and 46% urea which have been imported up to now, and
eventually more varied packaging that better suits user needs and resources.
___________________
1 In particular Lopez 2005, Fan and Saurkar 2006, Fan and Brzeska 2007.
2 Ariga et al. 2009.

72
124. The use of improved seed is still less widespread than the use of fertilizer. It is estimated that improved seed is used on only 3% of the area planted in food crops. ITRA produces pre-base and base seed of varieties adapted to Togo's agro-ecological
The compatibility between privatizing supply and continuation of the subsidy could be ensured
by introducing a system of vouchers distributed to the target groups and used to buy
subsidized fertilizer from private distributors. Such a voucher system is already being used in
many countries (Malawi, Tanzania, Kenya, Ghana, Rwanda, etc.) and is considered a better
way of implementing a subsidized-input strategy without compromising the development of a
sustainable distribution network.3
The State could thus disengage itself and focus on managing the subsidy, and particularly on its
targeting, assessing its impact and its gradual reduction as called for in the MAEP medium-
term strategy (MAEP, 2010c), and its primary mission as monitor, especially of the quality of
the imported inputs.
It is therefore recommended that a study be launched as quickly as possible to determine how
to implement such a system based on the current system; it would be desirable to implement
this system for the 2013–2014 season. In particular, this study should identify the needs of
private operators (local importers and manufacturers, promoters of input supply shops, ATAs
wanting to be involved in wholesale buying and distribution4), especially in the area of training
and financing. On this last point, support from the IFC or the African Mechanism for Financing
Fertilizer Development run by BAD (if operational by then) to ensure a line of credit with local
banking institutions, could certainly be a worthwhile option.
This study will also need to clarify the situation in terms of import duties on inputs; it will need
to specify what impact the current subsidy has, its cost-benefit ratio and any ways of making it
more effective (targeting), and of gradually getting the GoT out of the picture, as planned;
finally, it will have to shed light on the subregional fertilizer market and the measures to be
taken to avoid leaks to neighboring countries and to promote harmonization of agricultural-
input strategies.
Lastly, it is obvious that liberalization of fertilizer supply should not be seen as the only
solution for developing Togolese agriculture but as a part of a more global strategy that
includes many other structural reforms that will reinforce its potential success (development
of rural transport, communications, production and marketing infrastructure, resolution of the
land issue, organizing producers and inter-branch organizations, development of private
financing for agriculture, enhanced research and extension work, availability of other inputs
(seed, pesticides), expansion and reinforcement of outlets, etc.).
___________________
3 Mindi et al. 2008, Minot et al. 2009, Morris et al. 2009, FAO 2009, World Bank 2010c, Dorward
et al. 2011.
4 CDP 2010.

73
conditions and produces commercial seed in limited quantities at its farm in Sotouboua. Most of the multiplication is done by seed producers under ICAT's supervision. Production was 353 tons of maize, rice, and sorghum seed in 2009; 533 tons in 2010; and 700 to 800 tons in 2011. A small share of the improved seed produced is purchased by CAGIA (250 tons, or one-third of production, in 2011) and is then re-sold at a well-subsidized price (purchase price: 400 CFA francs/kg, selling price: 100 CFA francs/kg), with the remainder being sold at the market price. This intervention by CAGIA is intended to promote improved varieties by demonstrating their superiority among high-performing farmers, but like all of the MAEP's interventions up to now, it suffers from a complete lack of evaluation.
125. The absence of appropriate legislation, the lack of resources in ITRA, ICAT, and the Seed Directorate of the MAEP, leading in particular to the non-certification of all the improved seed produced, and shortfalls in private financing for agriculture, have led in recent years to a stagnation in the industry and an invasion of the market by seed of dubious quality and provenance, creating unfair competition for local improved seed.
126. An effort to boost the industry is however currently under way, with the Strengthen Food Security for Vulnerable Households project, funded by the EU/Food
Facility and implemented by the FAO, and the FAO TCP Support for Revival of the Seed Sector project, aimed at formulating a national seed policy accompanied by a strategic development plan, the formulation of a legal and regulatory framework, implementation of a plan and capacity building in the area of monitoring and certification, and, finally, the organization of seed producers.
127. Finally, several programs are under way concerning the distribution of free kits of seed/fertilizers/pesticides to vulnerable populations on a demonstration basis. These are mainly projects funded by the EU's Food Facility (implemented by the Spanish Red Cross and the French Red Cross, the Strengthen Food Security for Vulnerable Households project implemented by the FAO and concerning 20,000 families) and the “Quick Start” operation as part of PADAT, through which 50,000 small producers should receive maize kits and 15,000 small producers rice kits for 0.5 ha from 2011–2013. These programs will need to be carefully evaluated to determine whether they can convince their target population
It is extremely important that more resources be allocated in the future to developing
domestic seed production and to raising producer awareness about the joint use of
fertilizers and improved seed.
In particular, this means more resources allocated to ITRA, ICAT, and the MAEP Seed
Directorate in order to supply, oversee, stabilize, and promote the domestic industry.
This also means evaluating the subsidized price policy on limited quantities applied up
to now, and the formulation of a new strategy in this area. The FAO TCP Support for
Revival of the Seed Sector project should provide concrete information on these
various points.
Furthermore, it may be thought that the distribution of improved seed, like that of
other inputs, will be promoted by liberalization of the fertilizer supply and
multiplication of the points of sale for inputs in rural areas (input supply shops, ATA).

74
that using improved technologies is worthwhile and enabling them, as planned, to achieve an increase in income that will let them afford the inputs in the following years.
5.2. Food Security Strategy (ANSAT's role)
128. Established in 2008, ANSAT came in the wake of a series of State agencies set up to attempt to consolidate food security and regulate the grains market (Togograin starting in 1971, and then the Togo Food Security Observatory [OSAT] starting in 1997), all of which had a relatively limited impact. ANSAT's mandate includes the following:
i. Evaluating and establishing the necessary security reserves each year;
ii. Making available to economic agents information allowing inter-regional trade in food crops;
iii. Guaranteeing profitable prices to producers of food crops;
iv. Stimulating local and regional initiatives aimed at promoting management of the food reserves held by groups, unions, and federations of groups of food-crop producers;
v. Promoting the marketing of the production surplus at profitable prices in the domestic, subregional, and international markets.
129. Note that “security reserves” at point (i) above is understood as a sufficient reserve of grains (mainly maize) at harvest time (September to January, depending on the region) to maintain a profitable price for producers; this reserve is intended to be sold during lean periods to keep the price affordable for consumers in urban areas. As the country has a deep-water port enabling it to import in reasonably short times, the GoT does not consider it necessary to establish strategic reserves in the event of a shortage of staple foods.
130. When some of its grain purchases are made, ANSAT distributes what it calls school credits: the products that will be picked up after harvest receive an advance in September–October that enables vulnerable households to meet the costs of sending their children back to school. This effort, which is very popular with the recipients and the political authorities because of its media impact, actually has a very limited impact (a few thousand beneficiary families).
131. ANSAT has 67 warehouses throughout the country, with a total potential storage capacity of 25,000 tons. However, the scant financial resources it has received (3% of agricultural public expenditures for the 2002–2010 period; see Figure 12) have not enabled it to play a significant role in the markets (Table 12).
132. From 2005 to 2010, OSAT and ANSAT purchased less than 19,000 tons of grains, or 0.3% of domestic production for the period (grains production in Togo is estimated at around 1 million tons/year, or 6 million tons for the period in question). In 2005 and 2006, OSAT's grain purchases rose to around 3,000 tons per year, and there were no purchases in 2007 and 2008; in 2009, the surplus maize from the 2008/09 season was estimated at 32,500 tons, and ANSAT proceeded to make its biggest intervention ever by taking 10,000 tons, or 31% of the surplus; in 2010, it bought slightly less than 3,000 tons, or about 3% of the surplus maize for the 2009/10 season estimated at 90,000 tons. Except for 2009, then, it seems unlikely that the efforts of OSAT and then of ANSAT could have had a real influence in terms of stabilizing prices to the producer.
75
133. The same is true for prices to the consumer, especially as the security reserve was far smaller for the period than it would seem from the figures reported by ANSAT, because of substantial waste. Table 12 shows that between 2005 and 2008, 8,157 tons were bought or received as donations, 4,489 tons were sold, and the rest (3,669 tons, or 45% of the reserve) was written off in 2008 as it had spoiled. These major losses are explained by the fact that for two years ANSAT did not have the resources to deal with the reserves.
Table 12. Purchases and sales of grains by OSAT, then ANSAT, 2005–2010
2005 2006 2007 2008 2009 2010
Purchases (tons) 2,727 3,000 - - 10,059 2,994
Chinese donation (tons) - 2,430 - - - -
Security reserve (tons) 2,727 8,157 7,581 6,145 10,059 7,579
Sales (tons) - 400 1,399 2,690 5,474 855
Purchase price CFA F/100 kg sack
12,000 12,000 - - 18,000 18,000
Selling price CFA F/100 kg sack) 12,000 14,000 9,000 to 12,000
16,000 and
14,000 16,000 16,000
Source: ANSAT
134. The fact remains that by announcing a purchase price of 18,000 CFA francs per 100 kg sack at the time of harvest, at a time when the market price varies between 13,000 and 16,000 CFA francs and its financial resources are far too limited to be able to keep this promise on a significant scale, ANSAT is creating a distortion and generating a great deal of frustration among the producers, who wait in vain for it to pass. This frustration was the main cause of the significant arrears on the inputs credits distributed as part of the agricultural component of the CDP (Box 7).
135. This disruption in the markets comes from the fact that ANSAT sets its intervention price as a target price, very profitable for the producers, whereas it does not have the financial resources to buy a sufficient proportion of the quantities sold in order to effectively pull prices towards the target price. If it is desired that ANSAT should continue to intervene in the markets, its role should rather be to buy at a floor price, a minimum price below which it is felt that the producer is losing money and risks turning his back on the strategic crop in question. Otherwise, ANSAT's purchases should be made at a maximum price that is considered dangerous to exceed for the vulnerable urban consumer, and not at a price that is too low with no relationship to market prices in the lean season. Such a mechanism would also make it possible to tend towards a financial balance in interventions, since the purchase price would then be lower than the selling price, in contrast to what ANSAT has been doing in recent years (Table 12).
136. It should be noted that in 2011 for the first time ANSAT began to draw closer to such a system: its purchase price was set at 15,000 CFA francs per 100 kg sack, generating much less expectation since the prices in the markets were naturally kept near this threshold; moreover, to avoid creating distortions upon resale, ANSAT decided to close some of its direct-sales warehouses and to work instead with established marketplace merchants, to whom the grains were delivered for a price of 16,0000 CFA francs per 100 kg sack.

76
137. ANSAT's poor ability to mobilize its inventory was also apparent when regional maize purchases were made by WFP during the 2010 food crisis in Niger: the first two orders of 2,000 and 3,357 tons were delivered at a price of 17,000 CFA francs per 100 kg sack, but a third delivery of 10,000 tons could not be made because the reserves could not be called up quickly enough. At the same time, Benin managed to send 29,000 tons, Burkina Faso 21,000 tons, and Ghana 13,000 tons (WFP 2010).
138. ANSAT also oversees private maize exports, which are currently the focus of a regulatory tangle that needs to be straightened out: at OSAT's recommendation, the GoT was able to decide to temporarily prohibit exports of food products considered sensitive, including maize and cassava, and it is not known today whether these two exports are prohibited or not. ANSAT makes certain that they are officially authorized by obtaining three certificates: a phytosanitary certificate from DPV/MAEP, a certificate of origin from the Chamber of Commerce and a certificate of export from ANSAT. ANSAT ensures that these formalities can be easily completed in a few days and can even be done at the border posts for the phytosanitary certificate and by phone for operators based in remote areas. However, it seems that the situation is not quite as clear and expedited in practice: several contradictory regulatory texts coexist in this area and may give rise to different interpretations by the various administrative departments concerned, which for private operators represents a lack of visibility that prevents them from formally investing in these outlets, even though they likely participate actively in the informal cross-border trade that is traditionally important in the subregion.
139. Finally, in keeping with component (v) of its mandate, ANSAT also carries out a certain number of promotional efforts to market local production and participate in particular in a promising program for developing local rice in relation to imported rice, in cooperation with a private operator, some ATAs, and NGOs.

77
ANSAT's positioning is therefore extremely ambiguous today and needs to be clarified: in order
to improve the country's food security, it acts by buying and selling in the domestic market
but, because of a lack of resources, these interventions are ineffective in terms of mitigating
year-to-year price variability; the inappropriate nature of its intervention prices (target prices
instead of floor purchase prices for and ceiling price for sales) also generates distortions and
frustrations in the markets, which many operators complain about; a significant portion of its
reserves is wasted in the absence of adequate storage facilities; lastly, the regulatory
framework for exports, which has not been adequately clarified and communicated to
operators, weighs down prices to the producer without preventing informal exports. The
current strategy therefore leads to results that conflict with its own goals: in fact, it is
unfavorable to increasing production and income for producers, without however yielding the
expected results for urban consumers.
A country like Togo, which regularly has a cereals surplus, with a very small domestic market,
traditionally very much involved in cross-border trade, including in a free-trade community
with an overall cereals deficit,1 should be positioned as a regular maize exporter in the
subregion. In such a context, the best strategy for price stabilization and food security remains
trade liberalization. It is therefore urgent to clear up the ambiguity regarding whether
exporting is or is not prohibited, and to check that export-related procedures are not
restrictive and to so inform the operators.
With regard to ANSAT, consideration might be given to making it more of an agency that
supports the marketing of farm products in domestic and foreign markets. Such an agency
would no longer intervene in the markets, except under extraordinary circumstances (collapse
or spike in prices), at floor purchase prices for and ceiling prices for sales, set in advance; it
could be given responsibility for consolidating procurement of the State's needs (schools,
hospitals, prisons, etc.) through bid solicitations and contracts with ATAs; its main mission
would be to actively support—through studies, training and promotional activities, seeking
financing, etc.—initiatives to develop markets for local products and to reorganize domestic
production (ATA, inter-branch organizations). This would breach the significant gap in terms of
resources allocated to the issues of processing and marketing in the MAEP budget cited in
Section 3.2.
The precise form of such an agency would need to be worked out by a further study.
___________________
1 It is estimated that the maize deficit in the WAEMU countries could be more than 1.3 million tons by
2020; in addition, the fact that production is increasingly used for purposes other than human
consumption (aviculture, industrial uses, etc.) increases the possibilities for replacing imported maize by
locally produced corn, obviously on the condition that the local maize is competitive, and hence the
need to resolve the issues that are impeding modernization of cropping systems, including the poor
availability of improved seed and fertilizer and the lack of access to credit (World Bank 2010b). The
planned establishment of strategic reserves by ECOWAS could also be a worthwhile opportunity for
Togolese producers.

78
5.3. Farm Mechanization
140. In Togo, crop work is basically done by hand; only 10% of land area is worked by animal draft cultivation, and 90% of that is in the northern part of the country (Savanes) and 1% with motorized equipment. The great incidence of animal draft cultivation in the north is due primarily to cultural reasons (greater tradition of animal production) and to soils that are easier to work (the lands being less wooded initially so there are fewer stumps).
141. In the 1970s and 1980s, the GoT imported relatively large numbers of tractors and agricultural equipment (in particular, in 1976 and 1977: 400 tractors, more than 1,000 accessories, 31 bulldozers) and gave them to various successive companies (Société
Togolaise d’Exploitation du Matériel Agricole – SOTEXMA, Société pour la Gestion du
Matériel Agricole – GEMAG), set up especially to manage this equipment and lease it out at subsidized prices. These various experiments all failed for the following reasons:
i. Prices set by the State at a level that does not cover real costs;
ii. Problems acquiring replacement parts;
iii. Inadequate skills (no tractor drivers);
iv. Plots to be worked have not had their stumps removed, leading to premature wear and tear on the equipment.
142. In 2006, Togo received a donation of 60 tractors from India (estimated amount of the donation: 600 million CFA francs) and bought 100 additional tractors (28 small ones (25–30CV) and 72 large ones (50–60CV), for a total of 1 billion CFA francs). Deployment of these tractors in the field was relatively slow. The initial idea was to stimulate the formation of private companies to manage them, but this excessively top-down idea was not accepted by the private sector. Consequently, the situation with the imported tractors is currently this:
i. Five years after they were purchased, the 28 small tractors are not yet deployed, as they are not powerful enough to work land that has not been cleared; it is planned that they will be deployed in the Planned Agricultural Development Zone (ZAAP) currently being created;
ii. Of the 132 large tractors, 25 were assigned to State agencies for their own use (ITRA, University, INFA, etc.);
iii. 90 large tractors were assigned to MAEP agencies at the prefectural level, DPAEP, and it is estimated that 74 are working.
iv. the remaining 17 large tractors have either not been deployed or are broken down.
143. Note that while the purchased tractors benefit from the presence of a dealer in Accra for the supply of spare parts, there is no chance of purchasing parts in West Africa for the donated Indian tractors. For that matter, the same problems found in the 1970s and 1980s continue to apply: the lack of qualified tractor drivers (quick training was provided by the vendor but it was insufficient), lack of maintenance centers, and the problem of the concentration of stumps left on the plots.

79
144. The tractors deployed at the prefectural level began working in 2008 at a highly subsidized price until 2010: although the private companies that come to plow the fields in Togo from Ghana, especially in the Savanes region, charge 35,000 to 45,000 HCA francs/ha, the State charged 20,000 CFA francs/ha, which did not even cover fuel costs (30 liters/ha, or 18,000 CFA francs/ha), and the driver's wages (3,000 CFA francs/ha), not to mention upkeep and depreciation costs.
145. Since 2010, the DPAEPs have sought to involve groups of producers with at least 50 ha to be plowed; they are asked to pay 500,000 CFA francs (or 10,000 CFA francs/ha) and to pay for the fuel. For the beneficiaries, the cost of plowing has thus increased to 25,000–35,000 CFA francs/ha but this is subsidized at around 30%.
146. The land areas worked by the deployed tractors remain small (Table 13). In 2010, the 74 tractors in service worked 27 ha each on average, which represents fewer than 15 days of actual work (based on 2 ha per day for plowing).
Table 13. Land area worked by imported tractors in 2006, 2008–2010
Season Number of
tractors deployed
Number of tractors that
worked
Areas worked1 (ha)
2008 70 63 1,307 2009 75 75 2,542 2010 90 74 2,010
Notes: 1 Plowing, seeding, spraying. Source: DAER/MAEP
It is striking to note that the mistakes that led to the failure of the mechanization
programs in the 1970s and 1980s were repeated almost identically in managing the
new mechanization program initiated in 2006 (State management of a service that
should be provided by the private sector, as the price does not cover the actual costs
without sufficient additional resources being allocated by the State to cover the costs
of upkeep, unavailability of spare parts and maintenance services, lack of qualified
drivers, and difficulty in mechanizing lands that have not been cleared). The
sustainability and economic viability of the program under way can legitimately be
questioned.
Today there is talk of importing 200 additional tractors that would be financed by a
concessional loan from India. It is imperative first to conduct an in-depth study on
feasibility and how private mechanization centers can be developed like the ones in
Ghana; this study should also find solutions for the allocation of the existing
equipment. With an eye on sustainability and economic viability, the State must
absolutely get out of this activity. Consequently, even its involvement in importing
future equipment is cause for caution, inasmuch as the selection of their equipment
should be a matter for private operators alone.

80
6. THE INCIDENCE AND IMPACT OF AGRICULTURAL EXPENDITURES
148. As has been seen in Section 3.1, the economic breakdown of public agricultural
expenditures in the 2002−2010 period is typical of a sector that has enjoyed little
support for most of the period: payroll expenditures and other operational expenditures
occupy an unreasonable proportion of expenditures (42%), and capital expenditures, which
rose significantly only after 2010, only represent 27%, the remainder being reserved for the
purchase of inputs (28%) and grains (3%).
149. In this context, it is to be expected that public expenditures would have a low rate
of impact, all the more so because the delays involved mean that a large part of capital
committed has not been actually implemented in the field.
150. In the absence of a more detailed study of the matter, the rates of incidence of
public expenditures can be observed by studying which of the various MAEP
interventions have actually percolated down to the beneficiaries. These interventions can
be divided into four categories:
i. Agricultural extension services: due to its limited human resources and
equipment, ICAT estimates the number of beneficiaries of their extension activities at
no more than 60,000 to 130,000, or less than 10% of the estimated number of
farmers in Togo (1.5 million);
ii. Fertilizer supply: CAGIA estimates that 30% of the fertilizer it distributes is
used by farmers planting 0.5 hectare, 30% by farmers planting 1 hectare, 15% to 20%
by farmers having between 1 and 5 hectares, and 20% to 25% by farmers having more
than 5 hectares. Based on the recommended application of 300 kg per hectare and
assuming (optimistically) that 35,000 tons were used in 2011 in Togo, we arrive at an
approximate number of 120,000 beneficiaries. If we decrease the range of the
producer base (40% at 0.5 hectare, 40% at 1 hectare, 10% between 1 and 5 hectares,
and 10% at above 5 hectares), we arrive at roughly 150,000 beneficiaries. The
distribution of subsidized fertilizer affects no more than 10% of farmers, and the
majority are certainly already included in the calculation of the numbers of farmers
working with ICAT;
iii. Projects: the many development projects included in the MAEP budget have seen
long delays, as shown above, and most have not advanced beyond the preliminary
study period. PBVM and PARTAM have achieved the greatest progress. PBVM,
launched in 1998, has to date rehabilitated only 89 hectares out of an anticipated 585
ha of surface area under irrigation, and these 89 hectares are farmed by approximately
250 beneficiaries. PARTAM started operations in 2004 with the development of 320
hectares farmed by approximately a thousand farmers. A few PMU projects were

81
implemented more quickly but with a very limited incidence by comparison with
the total agricultural population: this applies particularly to the agricultural
component of the CDPs (Box 7), of which 14,000 farmers have benefited, including
some already working with ICAT. In the Program for Enhancing Food Security for
Vulnerable Households, which involves some 20,000 farmers, only the STABEX
COM 90–94 and COM 95–99 (Box 2) programs have had a greater impact because
they include an extensive feeder road element. The number of direct and indirect
beneficiaries of the programs is estimated at 2.4 million persons, or approximately
400,000 to 500,000 families;
iv. Rural infrastructure, particularly roads: as seen in Section 2.8, the estimated
requirements for feeder roads amount to 50 billion CFA francs for rehabilitation work
and 10 billion CFA francs for maintenance. A budget of 5 billion CFA francs for
rehabilitation and 1.8 billion CFA francs for maintenance thus leads to an estimate
that the 2011 program will satisfy only 10% of the needs and benefit only 10% of the
population at most.
151. It is interesting to note that, in spite of limited agricultural public expenditures,
the food crop production subsector experienced a relatively constant growth at an
average of about 3.8% per year in the period under review (Figure 33). In the same
period, it is estimated that the livestock subsector grew on average by 6.5% per year, while
the forestry and fisheries subsectors stalled. The GDP of the commercial crop subsector
dropped on average by about 21% per year from 2001 to 2005, then stalled until 2009, and
thereafter increased by 22% on average.
Figure 33. Trends in the different agricultural subsectors’ GDP in constant terms,
2002−2011 (baseline 2002)
Source: DE/MEF
0
50
100
150
200
250
300
350
400
450
500
2001 2002 2003 2004 2005 2006 2007 2008 2009 2010 2011
Bill
ions o
f C
FA
fra
ncs
Forestry, fishing
Livestock breeding
Commercial crops
Food crops

82
7. CONCLUSIONS AND RECOMMENDATIONS
152. Public expenditure on agriculture in Togo falls far short of the Maputo Declaration,
even though it has increased significantly from 2010, which is an indication of a strong
political will to further support the sector. In 2010, agricultural expenditures represented
about 6% of the national total (6.4% taking disbursements into account, 5.7% if the total net
cost to the State of the fertilizer subsidy is included) and only 3.9% of agricultural GDP.
153. The increase in the MAEP budget initiated in 2010 must now be followed up and
supported by a significant improvement in terms of effective implementation. The
implementation rate of the agricultural budget is far below that of the State budget for the
period 2002–2010 (55% compared with 77%). Improved implementation rates are possible
with better programming and planning of initiatives before their inclusion in the budget, as
well as closer collaboration with donors to better understand the availability and feasibility of
external resources on the one hand, and actual implementation on the other. By following
WAEMU directives, numerous reforms are underway with regard to the management of
public finances, which should also result in improved implementation rates (reform of the
budget planning procedure, expenditure flows, public procurement procedures, introduction
of the MTEF and so on).
154. The increase in resources managed by the MAEP must also be supported by the
development and implementation of maintenance strategies for implemented capital projects,
both for equipment placed at the disposal of State agents and for infrastructure transferred to
beneficiaries.
155. The main risk facing the success of these reforms and PNIASA implementation in
general, and of the recommendations of this review in particular, stems from present
deficiencies in MAEP capabilities. Capacity building in the ministry must not only involve
the training of existing staff, but also an increase in their numbers, greater stability, a
reevaluation of and very serious consideration given to the distribution of means and
Even though no assessment study is available, one can conclude that until now the
impact of public agricultural expenditures has been low. Despite this minimal impact,
the strength and sustained growth of the food crop and livestock subsectors
nevertheless augurs well for Togolese agriculture to respond well to the reforms and
structural programs targeting a greater number of beneficiaries, such as liberalization
of the input sector, the re-organizing of rural areas, the resolution of the land question
and agricultural financing issues, the expansion of research and extension services,
capital spending on rural infrastructure, the development of domestic and regional
markets, etc.

83
responsibilities between the central and regional levels, and between the various institutions
present on the ground.
156. To ensure better “ownership” of these interventions by MAEP, it is important MAEP
be more involved in all agricultural projects agreed to by the GoT, even those to be
implemented by another ministry, to avoid the numerous current inadequacies, in particular
relating to alignment with national agricultural policies, the transfer of expertise, and
capitalizing on experience. The PMU formula should be progressively abandoned in favor of
direct project management by MAEP when its fiduciary management capabilities are proven
through the implementation of PASA.
157. Implementation rates will also improve by significantly strengthening M&E capacities
at all levels. At the MAEP level: monthly monitoring of the financial implementation of all
projects in the DF/MAEP budget, effective M&E of projects completed by DPCA/MAEP,
technical services, and autonomous agencies with the implementation of the PNIASA M&E
plan. At the State level: effective establishment of the Court of Auditors, drafting a Budget
Review Act, enhancing the capacity of the National Assembly regarding sectoral themes.
158. These different elements—extensive and realistic planning preparation, closer
collaboration with donors, ownership of all agricultural projects, effective MTEF
implementation, and a successful M&E system—form the foundation for the development of
a Sector Wide Approach (SWAp) which will place effective leadership for PNIASA
implementation in the hands of MAEP.
159. Furthermore, an analysis of the operational composition of the provisional and
implemented MAEP budgets has shown that livestock production, fishing and fish farming,
and the DRAEP research and extension services were neglected over the last decade and will
require additional support in the future. Also, problems concerning processing and marketing
do not appear to have been sufficiently addressed either at the institutional level or in capital
expenditure programs; it seems essential to transfer this responsibility to a directorate within
MAEP or to a new agency to replace ANSAT.
160. The analysis has also illustrated that better regional distribution of resources is
necessary, because the Maritime region has, until now, absorbed a disproportionally large
part of capital expenditures to the detriment of other regions.
161. Privatization of supply chains is recommended for agricultural inputs, as well as
greater support for domestic seed production to increase the availability of inputs and the
effectiveness of their distribution. Subsidies should be target-oriented and their precise
impact should be evaluated, and should be granted though a voucher system. A fuller study is
required to determine the methods for implementing a system as a transition from the existing
system, with a preferable launch date during the 2013–2014 season. This study must identify
the needs of private operators (importers and local manufacturers, input store suppliers,
ATAs wanting to be involved in wholesale and distribution) principally for training and

84
financing purposes. This study must clarify the situation of import duties on inputs, shed light
on the impact of the actual subsidy, its cost-benefit ratio, and possible means of increasing its
effectiveness, as well as on the subregional market for fertilizer and steps to prevent outflows
to neighboring countries, and recommend ways to align agricultural input.
162. For a country in Togo’s situation, the best food security strategy to adopt is market
liberalization. Uncertainties about the legality of maize export must be addressed and non-
restrictive export procedures implemented. It is suggested that ANSAT make the transition
towards a support agency for marketing agricultural products on domestic and external
markets, and that its principal mandate should be to give active support, through reports,
training and promotion, research and financing etc., to initiatives for the development of
markets for local products and structuring national production (through ATAs and inter-
disciplinary cooperation). The exact form such an agency takes must be defined in a later
study.
163. It is essential that an in-depth study be conducted on the feasibility of mechanization
methods for establishing private mechanical repair centers before proceeding with any further
State imports of agricultural equipment. In the interests of sustainability and economic
viability, and to avoid repeating earlier mistakes, the State must withdraw entirely from this
activity.
164. Finally, the impact of public agricultural expenditures has been considered extremely
limited until now, affecting only 10% of farmers. This must be given priority to structure
programs which benefit the greatest number, such as the liberalization of the inputs sector,
structuring the rural environment, resolving the land issue and the problem of financing
agriculture, support for research and training, investment in rural infrastructure, development
of domestic and regional markets, etc.
165. These different avenues are summarized in the table at the beginning of the report
(Table E2).

85
REFERENCES
Ariga J. and T. S. Jayne. 2009. Private Sector Responses to Public Investments and Policy Reforms – The Case of Fertilizer and Maize Market Development in Kenya, IFPRI Discussion Paper 00921, 2020 Vision Initiative, IFPRI, November 2009. AU. 2006. Abuja Declaration on Fertilizer for an African Green Revolution, Africa Fertilizer Summit, Abuja, Nigeria, 13 June 2006. AU/NEPAD. 2005. Guidance Note for Agriculture Expenditure Tracking Systems in African Countries, September 2005. AU/NEPAD. 2010. African Innovation Outlook 2010, 2010. CDP. 2010. Etude pour la Mise en Place d’un Mécanisme Novateur d’Accès aux
Intrants Agricoles et d’Entreprises Industrielles dans les Bassins de Production de
Riz au Togo et au Bénin - Rapport Principal Togo, Study financed by the World Bank, August 2010. CDP. 2011. Rapport d’Audit Technique de la Composante “Augmentation de la
Production Céréalière”, February 2011. Dorward, A. and E. Chirwa. 2011. The Malawi Input Subsidy Programme: 2005/06 to 2008/09, International Journal for Agricultural Sustainability (IJAS), Volume 9:1, January 2011. ECOWAS. 2006. Stratégie Régionale de Promotion des Engrais en Afrique de
l’Ouest, Préparée dans le Cadre du Sommet Africain sur les Engrais, Abuja, Nigeria, 9-13 June 2006, April 2006. EU. 2004. Rapport Final des Activités en Agroforesterie, Foresterie et en Matière
de Lutte contre les Feux de Brousse dans le Cadre du PAFVI (7 ACP TO 084), APAF report, December 2004. EU. 2007. Evaluation Finale du 5
ème Programme Pluriannuel de Micro-
Réalisations (PPMR) (7 ACP TO 091 et 7 ACP TO 092) et du Projet Renforcement
du 4ème
PPMR (7 ACP TO 081), SAFEGE review, November 2007. EU. 2009. Evaluation des Finances Publiques selon la Méthodologie PEFA (Public
Expenditure and Financial Accountability), Ecorys-Sofreco study, March 2009. EU. 2011a. Chaîne de Programmation Budgétaire au Togo: Liens Méthodologiques
et Rôles des Acteurs, étude réalisée dans le cadre du Programme d’Appui
Institutionnel à l’Etat Togolais, February 2011. EU. 2011b. Final STABEX COM 90-94 et 95-99 Evaluation, HTSPE, February 2011. EU. 2011c. Termes de Référence pour l’Evaluation de l’Appui Budgétaire au
Gouvernement du Togo dans le Cadre de la Food Facility, Convention n° DCI-

86
FOOD/2009/022-043.
EU. 2011d. Evaluation du Système d’Information Agricole, étude conduite en
relation avec l’appui budgétaire au Gouvernement du Togo dans le cadre de la
Food Facility, August 2011. Fan S. and A. Saurkar. 2006. Public Spending in Developing Countries: Trends, Determination and Impact, IFPRI, June 2006. Fan S. and J. Brzeska. 2007. Growth and Poverty Impact of Agriculture Related Public Expenditure, IFPRI, June 2007. FAO. 2009. Malawi: Determinants of the Renewed Maize Surplus and Potential Lessons of the Acclaimed Success Story, Document N°SFE-PRS-09/01/01, May 2009. GDPAS. 2010. Document de Préparation de la Première Réunion Formelle, May 2010. IFAD. 2010. Projet d’Appui au Développement Agricole au Togo (PADAT) –
Rapport de Conception Finale, November 2010. IFDC/UNDP/FENU. 2010. Etude d’Amélioration de l’Intervention des Institutions
de Microfinance en Milieu Rural au Togo, August 2010. IMF. 2010. PRSP-F – Document Complet de Stratégie de Réduction de la Pauvreté
2009-2011, Report N° 10/33, February 2010. Lopez, R. 2005. Why States Should Stop Non-Social Subsidies: Measuring the Consequences for Rural Latin America, University of Maryland, February 2005. MAEP. 2010a. Programme National d’Investissement Agricole et de Sécurité
Alimentaire (PNIASA) – Plan d’Investissement, June 2010. MAEP. 2010b. Revue du Secteur Agricole, SG/MAEP, July 2010 . MAEP. 2010c. Note d’Orientations Stratégiques, d’Information et de
Communication sur la Mise en Œuvre du PNIASA, August 2010. MAEP. 2010d. Rapport de la Mission d’Etude d’une Délégation du Gouvernement
Togolais au Malawi, 26-31 July 2010, August 2010. MAEP. 2010e. Projet d’Amélioration de la Productivité Agricole en Afrique de
l’Ouest – Composante Togo (PPAAO/WAAPP Togo), Draft, November 2010. MAEP. 2011. Rapport de Mission sur l’Etat des Lieux des Activités du Volet
Agricole du Programme de Développement Communautaire (PDC), dans le Cadre
de la Vérification des Données au 31/12/2010 et leur Actualisation au 15/08/2011, August 2011.

87
MDMAEPIR. 2011. Procès Verbal de la Réunion Technique du 26 Avril 2011 avec
le Cabinet CAPRAD sur le futur organigramme du MDMAEPIR, April 2011. MEF. 2011. Etude de Réorganisation du Circuit des Dépenses – Résumé des
Observations, March 2011. Minde I., T.S. Jayne, E. Crawford, J. Ariga and J. Govereh. 2008. Promoting Fertilizer Use in Africa: Current Issues and Empirical Evidence from Malawi, Zambia and Kenya, ReSAKSS Working Paper N° 13, ReSAKSS, November 2008. Minot N. and T. Benson. 2009. Fertilizer Subsidies in Africa – Are Vouchers the Answer? IFPRI Issue Brief 60, IFPRI, July 2009. Morris M., L. Ronchi and D. Rohrbach. 2009. Building Sustainable Fertilizer Markets in Africa, Banque Mondiale, June 2009
Republic of Togo. 2010. Déclaration de Politique Générale de Son Excellence
Monsieur Gilbert Fossoun Houngbo, Premier Ministre de la République Togolaise,
devant l’Assemblée Nationale Togolaise, 07 June 2010. ReSAKSS. 2009. Evolution du Secteur Agricole et des Conditions de Vie des
Ménages au Togo, February 2009. ReSAKSS. 2010. Diagnostic du Secteur Agricole de Pays : Dépenses Publiques –
Burkina Faso, Sénégal, Niger, Mali, Bénin, Togo, Côte d’Ivoire, October 2010. Réseau des Chambres d’Agriculture du Niger (RECA Niger). 2011. Prix des
Engrais et Tonnages Prévus dans Certains Pays de la Zone CFA pour la Campagne
2011-2012, Note d’Information/Intrants N°16, 22 April 2011. UNDP. 2010a. Rapport sur l’Aide Publique au Développement 2006-2008, February 2010. UNDP. 2010b. Cadre d’Accélération des OMD – OMD 1 : Réduire la Pauvreté –
Amélioration de la Productivité Agricole des Petits Producteurs, August 2010. UNDP. 2011a. Mission d’Audit Stratégique et Organisationnel de 3 Ministères –
Ministère de l’Agriculture, de l’Elevage et de la Pêche (MAEP), avec le Ministère
Délégué auprès du MAEP, chargé des Infrastructures Rurales, CAPRAD study, January 2011. UNDP. 2011b. Rapport sur l’Aide Publique au Développement 2010, February 2011. WFP. 2010. The WFP in Africa – 2010 Facts and Figures, 2010.
Word Bank. 2010c. Fertilizer Subsidies: The View from AFTAR, AFR Economists
88
Retreat, November 2010. World Bank. 2008. Food Price Crisis Response Trust Fund Grant Agreement, FCPR TF Grant N° TF093124 related to Grant N° H409-TG (CDP agricultural component), 23 October 2008 World Bank. 2010a. Uganda: Agriculture Public Expenditure Review, Report N° 53702-UG, February 2010. World Bank. 2010b. Togo – Relancer les Secteurs Traditionnels et Préparer
l’Avenir: Une Stratégie de Croissance Tirée par les Exportations – Mémorandum
Economique du Pays et Etude Diagnostique pour l’Intégration du Commerce,
Report N° 53711-TG, September 2010. World Bank. 2011a. Manuel d’Analyse des Dépenses Publiques dans l’Agriculture
Destiné aux Professionnels, Rapport N° 60015-GLB, prepared with UKaid, March 2011. World Bank. 2011b. Document d’Evaluation du Projet d’Appui au Secteur
Agricole, Report N° 55565-TG, March 2011. World Bank. 2011c. Communication to the Minister of Economy and Finance re. Community Development Project – Amendment to the Financing Agreement Grant N° H409-TG and Food Price Crisis Response Trust Fund Grant Agreement (FPCR TF Grant N° TF093124) related to Grant N° H409-TG, 03 May 2011. World Bank. 2011d. Mission d’Appui à la Réforme du MAEP 27 Juin - 08 Juillet et
13 – 15 Juillet 2011 – Projet d’Aide-Mémoire, July 2011. World Bank/AfDB/EU. 2009. Revue des Dépenses Publiques et de la
Responsabilité Financière de l’Etat (PEMFAR), Report N° 47766-TG, March 2009. World Bank/AfDB/UNDP/Coopération française. 2006. Revue des Dépenses
Publiques et de la Gestion Financière de l’Etat (PEMFAR), June 2006.

89
APPENDIX 1: METHODOLOGY
1. Period of study:
1. The terms of reference of the analysis provided for a six-year study period, running from 2005 to 2010, to which the estimated budget for 2011 were to be added. It was suggested that the study instead cover the 2000–2011 period, considering that international assistance started up again in 2006, dividing the 2000s into two distinct periods. The 2002–2011 period was ultimately retained, given that data on operating expenditures of the various State administrations were only available as of 2002.
2. Provisional and implemented State budgets:
2. The provisional State budget was obtained from DF/MEF (personnel, operating, and transfer expenditures) and DFCEP/MEF (investments). 3. Implemented budgets were provided by DF/MEF (personnel, operating, and transfer expenditures) and DFCEP/MEF (investments). The analysis is also based on the hypothesis that the investment budget implementation rate was 50% in 2006 and 2007, two years in which this statistic was not available. This hypothesis is considered reasonable and prudent, considering the implementation rates in terms of investment observed in previous and subsequent years: 2002: 38%; 2003: 33%; 2004: 54%; 2005: 70%; 2008: 52%; 2009: 61%; 2010: 61%. 4. Budgets revised in the course of the year were considered as provisional budgets in 2008, 2009, and 2010 (2008 and 2009 Supplementary Budget Law, and the informal revision of 2010). 3. MAEP provisional and implemented budgets:
5. The MAEP provisional budgets for the period were provided by DAF/MAEP. The MAEP implemented budgets were provided by DF/MEF (personnel, operating, and transfer expenditures) and DFCEP/MEF (investments). A number of incoherencies between the data provide by the various departments were clarified and/or subjected to arbitration with the collaboration of DAF/MAEP and DB/MEF.
6. Expenditures on purchase of inputs (CAGIA) and grains (ANSAT) figure in the MAEP budgets either under the “transfers” or “investments” heading depending on the year. For this study, these headings were combined with investments and treated separately in order to analyze the economic composition of agricultural expenditures.
7. Expenditures on feeder roads were excluded from the MAEP provisional and implemented budgets and treated separately for the following reasons (i) firstly, they are not included in the analysis of the COFOG methodology recommended by NEPAD (see the following section); (ii) secondly, they are not under the ministry in charge of agriculture in all countries (effectively, until 2010 these expenditures used to be a prerogative of the Ministry of Infrastructure and Public Works in Togo); their inclusion in the MAEP budget would therefore render international comparisons ineffective, especially since these expenditures represent significant amounts over the study period.
4. Analysis of the level of support to the agricultural sector using the COFOG methodology:

90
8. With the 2003 Maputo Declaration, African States pledged to increase the share of their national budgets dedicated to agriculture, with a 10% minimum target. Following this commitment, NEPAD specified the methods for calculating the share of agricultural expenditure in national budgets through a methodological note (AU/NEPAD 2005): effective State expenditure (not allocated budgets), as defined by United Nations’ Classification of the Functions of Government (COFOG), in the broadened agricultural sector, including the fields of agriculture (livestock and plant production), forestry and hunting (including forestry production other than wood), and fishing. Applied research expenditures in each of these sectors must be taken into account. However, NEPAD excludes feeder road expenditures.
9. In order to calculate Togo’s support to agriculture as defined by NEPAD, the following elements were collected from concerned organizations and added on to the on-budget MAEP implemented expenditures, excluding feeder roads:
i. Public agricultural expenditures not recorded in the national budget and implemented with a more or less important involvement of MAEP:
- Internal resources allocated “off budget” (following instructions from Presidency) to autonomous agencies of MAEP;
- Own and external resources of ICAT and ITRA, which have heretofore never been recorded in the national budget;
- So-called “emergency” projects implemented following the 2008 crisis and not recorded in the national budget: the agricultural component of the Community Development Program (CDP) funded by the World Bank in 2009–2010, the food security support project funded by the IsDB in 2009 and 2011, the Seed Emergency Program funded by WARDA in 2010, and the agricultural capital component of the Emergency Food Security Program (EFSP) funded by WADB in 2010–2011 (the commercial seed component executed in 2009 was recorded in the State budget);
- Projects funded by the French Development Agency (AFD) until 2005 and budgetary support from France in 2008 for fertilizer imports (5 million €);
- Projects, studies and technical assistance actions funded by the FAO and UNDP and not recorded in the State budget (some programs funded by these institutions are recorded in the national budget and others are not);
- Programs and studies funded by the EU not recorded in the State budget, particularly agriculture expenditures funded with STABEX COM 90–94 and MOF 95–99 funds;
- Programs funded by China (fertilizer donations estimated at roughly 300 and 400 million CFA francs in 2004 and 2005, construction of an agricultural training center near Lomé for 2.8 billion CFA francs in 2010, manager training program in China estimated at 200 million CFA francs per year).
ii. Agricultural development actions undertaken by Ministries other than MAEP, namely by the Ministry of Planning, Development and Land Use Planning (MPDAT) and the Ministry in Charge of Grassroots Development (MDB), for which implementation data over the review period were collected from the competent offices of each ministry or donor concerned:
91
- For MPDAT: the Support Program for Agroforestry and Forestry Village Initiatives in Southwest Togo (PAFVI), implemented from 2001 to 2004 with EU/EDF funding; an estimate of the agricultural accomplishments of the Pluri-annual Micro-projects Program (PPMR), implemented from 2001 to 2009 also funded by the EU/EDF; an estimate of the agricultural component of the UNDP-funded Millennium Villages Project launched in 2009;
- For the MDB: the Support Program for Economic Activities and Producer Associations (PSAEG) launched in 2009; the market hall construction component of the Social and Community Infrastructure Program, launched in 2010, and the Roots and Tuber Development Project, launched in 2010 with the collaboration of the Anié sugar refinery (SINTO).
iii. Public spending on forestry development, managed in Togo by the Ministry of Environment and Forest Resources (MERF, see the following section).
10. In line with NEPAD (AU/NEPAD 2005) directives concerning State-owned companies, only State subsidies to SOTOCO (for the settlement of its debts) and NSCT (as social capital) have been considered and not their entire budget: “State-owned enterprises which produce
profit and loss accounts and pay taxes should not be added to total State expenditures even if
they are active in agriculture sector. However, in the event that a State provides additional
funds to these companies to compensate their operational losses or in the form of capital
injection (…), these should be included in the State expenditures.”
Implemented MAEP budget
+
Off-budget expenditures on agriculture supervised by MAEP
+
Agricultural expenditures by other ministries
+
MERF expenditures on forestry and agricultural development
=
State support to agriculture according to the COFOG methodology, as defined by
NEPAD

92
5. Determining the share of the expenditures implemented by MERF that should be considered in the analysis using COFOG methodology:
11. It is not always easy to distinguish between forestry and environmental components in the actions implemented by MERF. A thorough analysis was carried out with the representatives of this ministry in order to isolate forestry development (and in some cases agricultural: agro-forestry, management of territories, etc.) expenditures in the ministry’s implemented budget.
12. It was specifically decided that the coefficients in Table A1 below be applied on personnel and functioning implemented expenditures (provided by DF/MEF).
Table A1. Coefficients applied to MERF personnel and operating expenditures to determine the share of expenditures that can be attributed to forestry and agricultural development
Directorate Coefficient
applied Minister’s Residence 50% Cabinet and SG 50% Directorate of Administration, Finance and Planning
50%
Directorate of Community Affairs 50% Directorate of Planning 50% Directorate of Fauna and Hunting 10% Directorate of Forest Production 100% Directorate of Water and Forests 100% Directorate of General Ecology 0% Directorate of Environment 0% Directorate of Plant Protection and Control 100% Directorate of Green Spaces 0% Inspectorate of Forestry and Environment 85% Directorate of Tourism Development 0% Regional Directorates 75% ODEF State Subsidy and Autonomous Budget 100%
Note: the Directorates listed above existed during the period of study, but not necessarily simultaneously; some no longer exist. Source: consultation between the authors and representatives of MERF.
13. For implemented investment expenditures (provided by DFCEP/MEF), the offices of MERF determined the share that ought to be allocated to forestry and/or agricultural development activities for each project.
14. The autonomous budget of the Office for the Development and Exploitation of Forests (ODEF) was taken into consideration as recommended by NEPAD (AU/NEPAD 2005): “In
some countries, extra-budgetary institutions (such as a Forestry Fund) finance their
operations through their own self-generated revenues by an act of law or an executive branch
decision. Note that unlike public corporations, these extra-budgetary funds are State
institutions and constitute part of the general State expenditure, which should be included in
reporting of State expenditures.”

93
6. The specific case of public expenditures in the purchase of fertilizer: various amounts considered
15. Three different figures coexist for the State program for the purchase of fertilizer. These figures correspond to three different ways of understanding the level of State involvement:
i. First, the total amount of annual purchases (amount A in Table A2 below); this amount was funded as follows:
- until 2008, through a revolving fund managed by CAGIA, an offshoot of the KR1 and KR2 project. The fund was eventually complemented by extra contributions from the State that became necessary when funding dried up (also used to finance CAGIA operating costs) and fertilizer prices rose;
- directly by the Public Treasury starting in 2009;
ii. Second, effective disbursements made by the State (amount B), generally recorded in its annual budget. These disbursements served to complement the fund until 2008 and to directly pay the costs of obtaining fertilizer starting in 2009;
iii. Third, the net amount of the fertilizer subsidy (amount C). This amount cannot be seen in the CAGIA and State accounts, but it represents the real net cost of subsidized fertilizer to the State: this figure is obtained by deducting income from the sales of fertilizers to farmers from the purchase price and distribution costs of fertilizer; unfortunately, this figure is not readily available, since imported fertilizers are not all sold within the same year (and inversely, there are years in which the amount sold is greater than the amount imported). Moreover, farmers do not necessarily pay for fertilizer in the same year in which it was distributed to them; the following method was therefore used to calculate the approximate cost of the subsidy:
Table A2. Procurement of fertilizer: Various approaches to understanding State involvement
2003 2004 2005 2006 2007 2008 2009 2010 Total cost of operations (A) 2.0 1.9 1.2 2.5 0.3 3.5 11.2 6.5 State disbursements (B) 1.1 0.0 1.0 1.2 0.0 14.3 2.9 3.2 Estimated total cost of subsidy (C)
0.3 ? 0.8 0.2 0.0 1.4 5.3 0.6
Note: it was not possible to calculate the cost of the subsidy in 2004 due to the lack of data on the quantity of fertilizer sold. Source: calculated by authors based on data from CAGIA and DFCEP/MEF.
Cost of subsidy in year n
=
(CAF unit purchase price of fertilizer in year n + (total1 internal cost/quantity of
fertilizer sold in year n)) x quantity of fertilizer sold in year n
1 Total internal cost means all local costs: CAGIA operating costs, internal transport, etc.

94
16. Consequently, two estimates of the level of support to agriculture were calculated, one using the amount of disbursements (B, see section 2.4) and the other the estimated amount of the subsidy (C, see section 2.5).

95
APPENDIX 2: BASELINE DATA
(Millions CFA Franc) 2002 2003 2004 2005 2006 2007 2008 2009 2010 2011 Average
A. Provisional national budget révisé révisé
Personnel (DF/MEF) 55,472 54,803 52,684 51,728 56,945 64,062 72,168 76,434 83,740 99,640 66,768
Other operating expenditures ((DF/MEF) 36,069 39,207 41,883 36,886 49,878 54,568 53,715 66,350 68,561 73,186 52,030
Transfers (DF/MEF) 23,420 25,337 24,383 29,079 41,753 63,055 65,717 76 678 67,228 70,316 48,696
RI Investments (DB/MEF) 2,865 3,937 15,345 38,370 11,392 25,422 51,792 51,260 83,758 28,414
RE Investments (DB/MEF) 37,470 28,513 43,826 36,113 38,570 46,232 55,541 94,193 151,912 146,344 67,871
Total Investments 37,470 31,378 47,763 51,458 76,940 57,624 80,963 145,985 203,172 230,102 96,285
National debt and life annuities (DF/MEF) 30,771 28,456 33,031 33,624 28,586 20,319 54,352 54,641 77,024 75,504 43,631
Total 183,202 179,181 199,743 202,774 254,101 259,627 326,915 420,088 499,726 548,748 307,410
B. Implemented national budget
Personnel (DF/MEF) 51,595 51,517 51,525 49,065 59,274 64,328 69,389 75,759 82,576 61,670
Implementation rate 93.0% 94.0% 97.8% 94.9% 104.1% 100.4% 96.1% 99.1% 98.6% 97.7%
Other operating expenditures (DF/MEF) 29,823 34,177 24,522 31,256 38,893 45,878 47,015 57,707 57,250 40,725
Implementation rate 82.7% 87.2% 58.5% 84.7% 78.0% 84.1% 87.5% 87.0% 83.5% 82.0%

96
Transfers (DF/MEF) 16,509 19,201 22,693 25,226 39,168 57,159 51,355 57,300 65,583 39,355
Implementation rate 70.5% 75.8% 93.1% 86.8% 93.8% 90.6% 78.1% 74.7% 97.6% 85.0%
Investments (DF/MEFCEP) 14,379 10,252 25,832 36,219 38,470 28,812 42,254 88,969 123,485 45,408
Implementation rate 38.4% 32.7% 54.1% 70.4% 50.0% 50.0% 52.2% 60.9% 60.8% 55.8%
National debt and life annuities (DF/MEF) 4,905 13,659 25,512 13,426 15,516 19,794 37,364 68,806 57,477 28,496
Implementation rate 15.9% 48.0% 77.2% 39.9% 54.3% 97.4% 68.7% 125.9% 74.6% 71.1%
Total 117,210 128,806 150,084 155,193 191,321 215,971 247,377 348,542 386,371 215,653
Implementation rate 64.0% 71.9% 75.1% 76.5% 75.3% 83.2% 75.7% 83.0% 77.3% 76.9%
Note: Data on the 2011 implemented budget were not available, or only partially available at the time of the Review.
Source: Author’s calculations using data provided by the organizations mentioned in parentheses.

97
(Millions CFA Franc) 2002 2003 2004 2005 2006 2007 2008 2009 2010 2011 Average
C. Provisional MAEP budget (DAF/MAEP)
Personnel 1,765 1,721 1,549 1,518 1,490 1,492 1,426 1,335 1,611 1,801 1,571
% Total National personnel budget 3.2% 3.1% 2.9% 2.9% 2.6% 2.3% 2.0% 1.7% 1.9% 1.8% 2.4%
Other operating expenditures 226 230 236 317 380 380 408 455 822 804 426
% Total other operating expenditures budget 0.6% 0.6% 0.6% 0.9% 0.8% 0.7% 0.8% 0.7% 1.2% 1.1% 0.8%
Transfers 90 130 1,060 1,378 2,390 13,090 3,330 5,930 2,675 2,915 3,299
% Total National transfers budget 0.4% 0.5% 4.3% 4.7% 5.7% 20.8% 5.1% 7.7% 4.0% 4.1% 6.8%
RI investment and inputs 285 1,175 180 2,110 3,365 300 8,530 6,160 17,691 15,199 5,500
% Total State RI investment and inputs budget 41.0% 4.6% 13.8% 8.8% 2.6% 33.6% 11.9% 34.5% 18.1% 19.4%
RE investment and inputs 4,941 3,924 5,250 3,375 5,415 5,884 10,798 7,037 26,313 11,881 8,482
% Total State RE investment and inputs budget 13.2% 13.8% 12.0% 9.3% 14.0% 12.7% 19.4% 7.5% 17.3% 8.1% 12.5%
Total investment and inputs 5,226 5,099 5,430 5,485 8,780 6,184 19,328 13,197 44,004 27,080 13,981
% Total investment and inputs budget 13.9% 16.3% 11.4% 10.7% 11.4% 10.7% 23.9% 9.0% 21.7% 11.8% 14.5%
Total 7,307 7,181 8,275 8,698 13,040 21,146 24,492 20,918 49,112 32,601 19,277
% Total Provisional National Budget 4.0% 4.0% 4.1% 4.3% 5.1% 8.1% 7.5% 5.0% 9.8% 5.9% 6.3%

98
D. MAEP provisional budget excluding feeder roads
Feeder roads in the provisional budget (DAF/MAEP) 0 0 0 0 0 0 0 0 14,600 7,312 -
Total excluding feeder roads 7,307 7,181 8,275 8,698 13,040 21,146 24,492 20,918 34,512 25,289 17,086
% Total Provisional National Budget 4.0% 4.0% 4.1% 4.3% 5.1% 8.1% 7.5% 5.0% 6.9% 4.6% 5.6%
Note: Data on the 2011 implemented budget were not available, or only partially available at the time of the Review.
Source: Author’s calculations using data provided by the organizations mentioned in parentheses.

99
(Millions CFA Franc) 2002 2003 2004 2005 2006 2007 2008 2009 2010 2011 Average
E. Implemented MAEP budget
Personnel (DF/MEF) 1,775 1,658 1,595 1,438 1,481 1,413 1,403 1,794 1,975 1,615
Implementation rate 100.6% 96.3% 103.0% 94.8% 99.3% 94.7% 98.4% 134.3% 122.6% 104.5%
Other operating expenditures (DF/MEF) 125 125 140 187 241 257 285 345 735 271
Implementation rate 55.3% 54.1% 59.4% 59.1% 63.4% 67.5% 70.0% 75.8% 89.4% 70.6%
Transfers (DF/MEF) 45 65 1,238 1,378 2,109 13,841 3,193 4,183 2,747 3,200
Implementation rate 50.0% 50.0% 116.8% 100.0% 88.3% 105.7% 95.9% 70.5% 102.7% 95.8%
RI investment and inputs (DF/MEFCEP) 245 1,183 85 74 1,959 8,037 2,464 15,537 3,287
Implementation rate 86.0% 100.7% 47.0% 3.5% 58.2% 0.0% 94.2% 40.0% 87.8% 74.3%
RE investment and inputs (DF/MEFCEP) 621 524 146 214 1,669 1,957 8,283 2,290 6,823 2,503
Implementation rate 12.6% 13.4% 2.8% 6.3% 30.8% 33.3% 76.7% 32.5% 25.9% 30.9%
Total investment and inputs 866 1,707 230 288 3,628 1,957 16,320 4,755 22,360 5,790
Implementation rate 16.6% 33.5% 4.2% 5.3% 41.3% 31.6% 84.4% 36.0% 50.8% 46.2%
Total 2,811 3,554 3,204 3,292 7,458 17,467 21,201 11,077 27,817 10,876
Implementation rate 38.5% 49.5% 38.7% 37.8% 57.2% 82.6% 86.6% 53.0% 56.6% 61.1%
Implemented MAEP Budget/Implemented National Budget 2.4% 2.8% 2.1% 2.1% 3.9% 8.1% 8.6% 3.2% 7.2% 5.0%
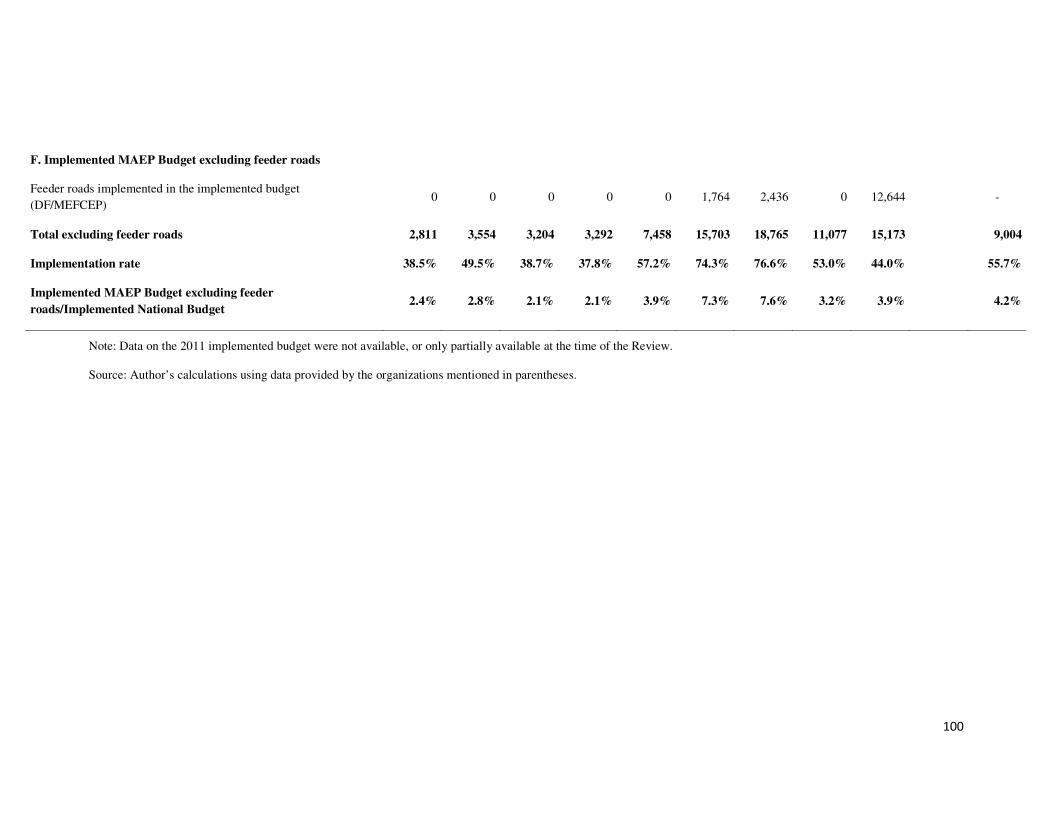
100
F. Implemented MAEP Budget excluding feeder roads
Feeder roads implemented in the implemented budget
(DF/MEFCEP) 0 0 0 0 0 1,764 2,436 0 12,644 -
Total excluding feeder roads 2,811 3,554 3,204 3,292 7,458 15,703 18,765 11,077 15,173 9,004
Implementation rate 38.5% 49.5% 38.7% 37.8% 57.2% 74.3% 76.6% 53.0% 44.0% 55.7%
Implemented MAEP Budget excluding feeder
roads/Implemented National Budget 2.4% 2.8% 2.1% 2.1% 3.9% 7.3% 7.6% 3.2% 3.9% 4.2%
Note: Data on the 2011 implemented budget were not available, or only partially available at the time of the Review.
Source: Author’s calculations using data provided by the organizations mentioned in parentheses.

101
(Millions CFA Franc) 2002 2003 2004 2005 2006 2007 2008 2009 2010 2011 Average
G. Implemented expenditures in coordination with MAEP
excluding State budget
CAGIA Off-budget RI subsidies (CAGIA) 1 000 -
CAGIA Off-budget RE resources1 (CAGIA) 313 393 3 173 -
ICAT Off-budget RE subsidies (ICAT) 785 289 -
ICAT Own resources (ICAT) 150 138 180 204 20 125 34 96 149 185 128
ITRA Off-budget RI subsidies (ITRA) 426 408 -
ITRA Own and external resources (ITRA) 542 518 373 252 216 163 148 159 183 238 279
AfricaRice emergency seed program (DPCA/MAEP) 30 -
AFD Coffee-cocoa project MAEP/FUPROCAT (AFD) 303 303 303 303 -
IsDB Support for food security (DPCA/MAEP) 70 150 -
WB CDP agricultural component (CDP) 1,400 300 -
World Bank PASA PPF (WB) 301 -
WADB EFSP Agricultural equipment (DPCA/MAEP) 210 401 -
China (Embassy of China) 200 200 200 200 200 200 3,000 200 440
FAO Off-budget programs (FAO) 40 40 160 160 100 100 160 160 185 350 146
UNDP AT MAEP (UNDP) 10 8 -

102
UNDP MTEF-Country Office Support (UNDP) 5 -
UNDP MAEP Audit (UNDP) 41 -
UNDP MDGs Acceleration Framework (UNDP) 17 -
EU Stabex COM 90-94 et 95-99 (EU) 2 026 2 026 -
EU Study MAEP M&E (EU) 66 -
Total 2,247 1,696 1,530 2,513 536 587 3,715 4,112 6,115 1,940 2,499
Implemented agricultural budget excluding national budget /
Implemented State budget 1.9% 1.3% 1.0% 1.6% 0.3% 0.3% 1.5% 1.2% 1.6% - 1.2%
H. Total expenditures impl. in coord. MAEP excl. Feeder roads 5,058 5,250 4,734 5,805 7,995 16,290 22,480 15,189 21,288 11,565
Impl. Budget in coord. w/ MAEP excl. f. rds. / Impl. nat. budget 4.3% 4.1% 3.2% 3.7% 4.2% 7.5% 9.1% 4.4% 5.5% 5.4%
Notes: 1 Chinese donations in 2004 and 2005. French budgetary support in 2008;
Data on the 2011 implemented budget were not available, or only partially available at the time of the Review.
Source: Author’s calculations using data provided by the organizations mentioned in parentheses.

103
(Millions CFA Franc) 2002 2003 2004 2005 2006 2007 2008 2009 2010 2011 Average
I. Agricultural expenditures made by other ministries
EU/EDF APAF PAFVI (EU) 325 325 325 -
EU/EDF MPDAT/AE PPMR agricultural intervention estimate (EU) 350 350 350 350 350 350 350 350 -
UNDP Millennium municipalities (UNDP) 46 170 62 -
MPDAT Sub-total 675 675 675 350 350 350 350 396 170 62 405
MDB RI Stalls and markets (MDB) 560 560 -
MDB RI Roots and tubers / SINTO Reserve Fund (MDB) 300 -
RI (+UNDP. FAO. IFDC) MDB PSAEG (MDB) 745 745 745 -
Sub-Total MDB 0 0 0 0 0 0 0 745 1 605 1 305 -
Total agricultural expenditures by other ministries 675 675 675 350 350 350 350 1 141 1 775 1 367 771
Agricultural exp. by other ministries / Implemented nat. budget 0.6% 0.5% 0.4% 0.2% 0.2% 0.2% 0.1% 0.3% 0.5% - 0.3%
Note: Data on the 2011 implemented budget were not available, or only partially available at the time of the Review.
Source: Author’s calculations using data provided by the organizations mentioned in parentheses.

104

105
(Millions CFA franc) 2002 2003 2004 2005 2006 2007 2008 2009 2010 2011 Average
J. Provisional MERF budget forest sector ODEF incl. (MERF)
Personnel 518 520 462 638 713 747 877 836 1,012 878 720
% Total National Personnel budget 0.9% 0.9% 0.9% 1.2% 1.3% 1.2% 1.2% 1.1% 1.2% 0.9% 1.1%
Other operating expenditures 190 183 181 772 309 328 373 309 524 429 360
% Total other operating expenditures budget 0.5% 0.5% 0.4% 2.1% 0.6% 0.6% 0.7% 0.5% 0.8% 0.6% 0.7%
Transfers 0 0 0 0 0 0 0 0 0 0 0
% Total National Transfers Budget 0.0% 0.0% 0.0% 0.0% 0.0% 0.0% 0.0% 0.0% 0.0% 0.0% 0.0%
RI Investments 3 0 57 150 0 39 13 8 147 217 63
% Total RI National Investment Budget 0.0% 1.4% 1.0% 0.0% 0.3% 0.1% 0.0% 0.3% 0.3% 0.2%
RE Investments 501 407 494 454 171 28 75 34 177 1,238 358
% Total RE National Investment Budget 1.3% 1.4% 1.1% 1.3% 0.4% 0.1% 0.1% 0.0% 0.1% 0.8% 0.5%
Total Investments 501 407 551 604 171 67 88 41 324 1,455 421
% Total National Investment Budget 1.3% 1.3% 1.2% 1.2% 0.2% 0.1% 0.1% 0.0% 0.2% 0.6% 0.4%
Total 1,209 1,110 1,194 2,014 1,193 1,141 1,337 1,186 1,860 2,762 1,501
% Total Provisional National Budget 0.7% 0.6% 0.6% 1.0% 0.5% 0.4% 0.4% 0.3% 0.4% 0.5% 0.5%
K. Implemented MERF budget, forest sector ODEF included
Personnel (DF/MEF) 587 570 557 736 880 870 1,009 1,010 1,060 809

106
Implementation rate 113.3% 109.6% 120.6% 115.4% 123.4% 116.5% 115.1% 120.9% 104.7% 115.1%
Other operating expenditures (DF/MEF) 137 108 97 467 159 215 278 234 399 233
Implementation rate 72.3% 59.1% 53.7% 60.4% 51.5% 65.7% 74.6% 75.7% 76.1% 66.1%
Transfers (DF/MEF) 0 0 0 0 0 0 0 0 0 0
Implementation rate -
RI Investments (DF/MEFCEP) 1 0 52 105 0 0 13 8 141 36
Implementation rate 50.0% 90.7% 70.2% 0.0% 99.1% 100.0% 95.9% 76.9%
RE Investments (DF/MEFCEP) 151 187 350 295 65 24 5 34 165 142
Implementation rate 30.2% 45.9% 71.0% 65.0% 38.1% 86.3% 6.9% 100.0% 93.4% 54.6%
Total Investment 152 187 402 401 65 24 18 41 306 177
Implementation rate 30.4% 45.9% 73.0% 66.3% 38.1% 36.4% 20.5% 100.0% 94.6% 58.0%
Total 877 865 1,056 1,603 1,105 1,110 1,305 1,285 1,765 1,219
Implementation rate 72.5% 77.9% 88.5% 79.6% 92.6% 97.2% 97.6% 108.4% 94.9% 89.6%
Implemented MERF Budget / Implemented National Budget 0.7% 0.7% 0.7% 1.0% 0.6% 0.5% 0.5% 0.4% 0.5% 0.6%

107
(Millions CFA Franc) 2002 2003 2004 2005 2006 2007 2008 2009 2010 2011 Average
L. Total COFOG public agricultural expenditures 6,609 6,790 6,465 7,758 9,450 17,750 24,135 17,615 24,828 13,489
% COFOG 5.6% 5.3% 4.3% 5.0% 4.9% 8.2% 9.8% 5.1% 6.4% 6.3%
M. Exp. impl. in cord. w/ MAEP excl. fertilizer subsidy
CAGIA on-budget fertilizer expenditures 1,080 1,161 11,148 2,864 3,150 -
CAGIA off-budget fertilizer expenditures 313 1,393 3,173 -
CAGIA Transfers (civil servant salaries included) 10 10 10 10 10 10 10 10 85 -
CDP fertilizer expenditures 1,129 -
Estimated amount of fertilizer subsidy 800 200 0 1,400 5,300 600 1,3831
Total exp. impl. in coord. w/ MAEP with fertilizer subsidy 5,201 7,024 16,280 9,549 16,486 18,653 12,1991
N. Total public agricultural expenditures with fertilizer
subsidy 7,155 8,479 17,740 11,204 18,912 22,193 14,2811

108
% COFOG with fertilizer subsidy 4.6% 4.4% 8.2% 4.5% 5.4% 5.7% 5.5%1
Notes: 1 averages calculated over the 2005-2010 period;
Data on the 2011 implemented budget were not available, or only partially available at the time of the Review.
Source: Author’s calculations using data provided by the organizations mentioned in parentheses.

109
(Millions CFA Franc) 2002 2003 2004 2005 2006 2007 2008 2009 2010 2011 Average
O. Impl. Non-governmental-entity public expenditures.
AFD AVSF Family livestock farming support program (PAEF) 214 214 214 -
EU AVSF ANPAT Promotion of poultry farming (PROMAT) 32 32 -
EU AVSF ASATO 129 129 129 129 129 -
EU/FF AVSF/INADES/CPC Dev. grains sector 404 404 -
EU CFSI/ECHOPPE Dynam. solidarity village-camp. Marit.-Plat. 75 75 75 75 -
EU CIDR Creation of Togo-Benin ESOP 49 49 49 49 49 -
EU CIDR/ETD Cos. w/ access to urban markets Kara-Centr.-Plat. 108 108 108 -
EU CIDR/WAGES-FECECAV Rur micro-cred. zones. Centr.-Marit. 163 163 163 -
EU/FF Spanish Red Cross/CRT Improve nutrition in Marit. 416 416 -
EU RD Fr./UNICEF/PAM Project ECHO post-flood 2007 in Savanes 485 -
EU French Red Cross Rehab. post-flood 2007 in Savanes 722 -
EU/FF French Red Cross/CRT/Rafia Food Insecurity Savanes 488 488 -
EU GRADSE Food security and land management Central-Kara 98 98 98 -
EU TIMPAC Support eco activities for women in marg. Savanes 30 30 30 -
AVSF Support organic cocoa production 63 -
MAE AVSF Support for pork farming 16 16 -

110
AVSF/INADES Support for grains sector Savanes 40 40 40 -
CIDR/ETD Promotion and distribution for ESOP 65 65 65 65 65 65 -
CIDR/ETD Companies with access to urban markets (with. EU) 83 83 83 83 -
CIDR/ETD Improved prod. and marketing of boiled rice in Centrale 24 24 24 -
CIDR/ETD Capacity building for producers in Blitta 50 50 -
GRED PEDC agricultural component 50 50 -
PTM Development of agricultural sectors in Bassar 25 25 -
GRADSE Market gardening in Centrale and Kara 56 56 -
INADES Restructuring the grains sector 27 27 27 27 27 27 27 27 -
USDA OIC PARAT 257 257 257 257 257 -
Note: Data on the 2011 implemented budget were not available, or only partially available at the time of the Review.
Source: Author’s calculations using data provided by the organizations mentioned in parentheses.

111
(Millions CFA Franc) 2002 2003 2004 2005 2006 2007 2008 2009 2010 2011 Average
O. Impl. Non-governmental-entity public expenditures (cont.)
UAR Plateaux 35 35 35 -
JARC Savanes 25 25 25 25 25 25 25 25 25 25 -
Rafia Fuelwood sector 36 36 -
Rafia SAE 25 25 25 -
CECODRI 80 80 80 80 80 80 80 -
MVCP Support to inhabitants of the Abdoulaye forest 46 46 46 -
CCFCC 151 213 232 218 173 219 268 336 269 -
Total Impl. public sector exp. by non-governmental entities. 712 823 869 720 707 1,195 946 2,107 2,763 2,226 1,307
P. Feeder roads (MDMAEPIR) 1,488 1,424 1,033 722 1,857 780 5,110 5,343 14,135 7,312 3,920
Note: Data on the 2011 implemented budget were not available, or only partially available at the time of the Review.
Source: Author’s calculations using data provided by the organizations mentioned in parentheses.

112