reproduction charging models and rights policy for digital ... · pdf filereproduction...
TRANSCRIPT
www.kcl.ac.uk/kdcs/
Reproduction charging models & rights policy for digital images in American art museums
A Mellon Foundation study
Simon Tanner
King’s Digital Consultancy Services

Simon Tanner www.kcl.ac.uk/kdcs/
August 2004 2
©Tanner 2004
Contents Acknowledgements ....................................................................................... 4 1 Introduction ............................................................................................ 5 2 Confidentiality Agreement ....................................................................... 7 3 Methodology ............................................................................................ 8
3.1 Participants ........................................................................................ 8 3.2 Study Instruments .............................................................................. 9
3.2.1 Online survey .................................................................................. 9 3.2.2 Structured interview......................................................................... 9
3.3 Study Activities................................................................................... 9 3.3.1 Devise instruments .......................................................................... 9 3.3.2 Survey ........................................................................................... 9 3.3.3 Structured Interviews..................................................................... 10 3.3.4 Report writing and dissemination ..................................................... 11
4 Survey Results ....................................................................................... 12
4.1 Overview of the Survey...................................................................... 12 Figure 1: overview of survey museums ........................................................ 12
4.2 Digital Imaging Activity in Art Museums................................................ 13 4.2.1 Image availability and asset fees .................................................. 13 Figure 2: Image availability and fees ........................................................... 13 4.2.2 Digitization activity ..................................................................... 14 Figure 3: Digitization activity ...................................................................... 14
4.3 Service Profiles ................................................................................. 14 4.3.1 Methods used to find images ........................................................... 14 Figure 4: Methods of finding images ............................................................ 15 4.3.2 Payment methods and turnaround times ........................................... 15 Figure 5: Acceptable payment methods........................................................ 16
4.4 Rights and Licensing Services ............................................................. 16 4.5 Primary Driving Factors for Service Provision......................................... 17
Figure 6: Primary Driving Factors for Providing Services ................................. 19 Figure 7: Primary Driving Factors for Providing Services by Museum Governance19
4.6 Differential Charging.......................................................................... 20 4.7 Comparison of survey with UK and Europe............................................ 20
5 Interview Results .................................................................................. 21
5.1 Profile of the Museums....................................................................... 21 5.1.1 Collection focus ............................................................................. 21 5.1.2 Museum budgets, attendance and staff ............................................. 22 5.1.3 Museum audience, revenue and expenditure...................................... 22 Figure 8: Maximum areas of museum expenditure......................................... 23 Figure 9: Maximum areas of museum revenue .............................................. 23
5.2 Profile of the Imaging and Rights Services ............................................ 24 5.2.1 Service structures .......................................................................... 24 Case Study 1: an imaging and rights service................................................. 24 5.2.2 Transactions and processes ............................................................. 25 Case Study 2: a typical transaction ............................................................. 25 5.2.3 Criteria for image creation and denial ............................................... 26

Simon Tanner www.kcl.ac.uk/kdcs/
August 2004 3
©Tanner 2004
5.2.4 Serving the museums mission ......................................................... 28 5.2.5 Primary audience for imaging and rights services................................ 28 5.2.6 Relationships with other museum activities........................................ 28
5.3 Problem Areas for Service Provisio5.3.1 Rights services and unauthorised image use ........................................ 29
n ..................................................... 29
5.3.2 Fair Use........................................................................................ 31 5.3.3 Barriers to imaging and rights service provision.................................. 31
5.4 Business practices for imaging and rights ............................................. 32 5.4.1 Volume of sales and revenue gained................................................. 32 5.4.2 Pricing structures........................................................................... 33 5.4.3 Why differentiate in pricing? ............................................................ 34 5.4.4 Assignment of revenue ................................................................... 35 5.4.5 Recouping costs............................................................................. 35
5.5 Pricing: motivations and policies.......................................................... 36 5.5.1 Pricing motivation .......................................................................... 37 Case Study 3: Establishing pricing and policy................................................ 38 5.5.2 Success and evaluation................................................................... 38
5.6 The Future ....................................................................................... 39 6 Final Analysis and Conclusions............................................................... 40
6.1 Motivations and objectives .............................................................. 40 6.2 Centralizing the rights function ........................................................ 40 6.3 Assignment of revenue ................................................................... 41 6.4 Differential charges and the consumer .............................................. 41 6.5 Generating a price ......................................................................... 42 6.6 Digital divide ................................................................................. 42 6.7 The commitment gap ..................................................................... 42
7 A Way Forward and Recommendations .................................................. 43
7.1 Defining Museum Priorities ................................................................. 43 7.2 Management Structures ..................................................................... 44 7.3 Make the Rights Activity Professional ................................................... 44 7.4 Revenue Assignment ......................................................................... 44 7.5 Pricing ............................................................................................. 44
Case Study 4: Applying the pricing formula .................................................. 46 7.6 Digital Imaging ................................................................................. 47 7.7 Future Funding for Digital ................................................................... 47
Appendix A: Museums that Responded to the Survey................................... 49 Appendix B: Interviewed Museums.............................................................. 52 Appendix C: The survey ............................................................................... 53 Appendix D: The Structured Interview......................................................... 55

Simon Tanner www.kcl.ac.uk/kdcs/
August 2004 4
©Tanner 2004
Acknowledgements The author would like to thank the Andrew W. Mellon Foundation for enabling this work to be done through their funding and support. In particular, thanks are due to Donald Waters and Suzanne Lodato for their support, guidance and patience. Thanks also to Nancy S. Allen, Gretchen Wagner and Louise Kelly.
Two people were instrumental in enabling the study to be completed and deserve special thanks. Angela Spinazze of ATSPIN Consulting1 assisted at the pilot stage getting the interview questions optimized, did six of the museum interviews and provided expert help and insight at many points. Rebecca Finkel of King’s College London, with tenacity and good humour, made sure the museum surveys were completed and that the study got 100 responses.
Without the help of the art museums this study would be nothing. To maintain the promised confidentiality (and to keep this section shorter than 10 pages) the names of individuals are not mentioned here. The museums that took part are listed in Appendix A and B. The author, in these acknowledgements, can only begin to express his thanks and gratitude for all the time and effort that interviewed museum staff gave up in support of the study. The community is richer because you care so much.
Thanks are due the team at HEDS Digitisation Services and the University of Hertfordshire. Brian Robinson was instrumental in planning and proposing the study and gave stalwart support to the project. Julie Mitchell made sure the author arrived where he was supposed to and in one piece. Bill Worthington programmed the online survey form. Geoff kept everything sane.
Additional special thanks are due to the team at the Centre for Computing in the Humanities at King’s College London. Harold Short is more than just a good boss and continues to provide unparalleled support and guidance. Jasmine Kelly kept me in the right airspace. Marilyn Deegan provided much help throughout as she inspired and co-authored the European study and thus started this whole ball rolling. Thanks also to John Bradley, Damien Doherty, Paul Spence and Paul Vetch.
Thanks to Jane and Joseph just for being there.
1 www.atspin.com

Simon Tanner www.kcl.ac.uk/kdcs/
August 2004 5
©Tanner 2004
1 Introduction This study explores the cost and policy models adopted by art museums in the USA in arriving at pricing structures for delivering surrogates of unique or rare artworks and artefacts as digital objects. This study aims to examine the new market-based sensibilities and issues art museums face due to the transition towards digitized collections.
The transition to digitized collections provides cultural institutions with a new set of opportunities to share, aggregate and link content across institutional boundaries. As most collections represent only part of the corpus of any single artist, subject area or era, the need to pull together cultural resources from across many institutions has always been an intellectual imperative for those studying or researching art and culture. The transition to digital representation makes this aggregation and linking easier to achieve in a technical sense, and there is a demonstrable consumer desire for resources to be gathered together in a coherent and logical fashion that is not bounded by any single institution. However, there are barriers that have sometimes prevented this from happening easily, such as perceived loss of revenue or ownership, licensing issues and museum policy. This study aims to examine the new market realities and opportunities cultural institutions face due to the transition to digitized collections. Further, it aims to discover the key factors that affect the willingness to collaborate and enable digital content to be shared.
There is much theoretical information and opinion written about these issues in the abstract. However, there are few published resources that explore the current state of art museum imaging and rights provision and motivation. The 2003-4 RARIN Rights and Reproductions Survey2 provides excellent survey-based information on prices charged in the marketplace. This study does not seek to repeat or challenge the RARIN Surveys findings, but to explore deeper into the underlying museum policy and service objectives that motivate the pricing schedules.
This study explores the thresholds that determine the point when an organization charges for the sale of content and other rights and the reasons given for such charges. The study further investigates the proportion of commercial to non-commercial licensing and the differentials between these activities. Further research is presented into the motivating factors behind such charging policies and the state of the marketplace.
This study provides the following information:
The various factors - institutional, market and technical - that affect the cost of service provision, the price charged and the revenue received.
Evidence that the ownership/gatekeeper function is very important to museums and information upon the application of copyright and rights management.
The primary driving forces behind imaging and rights service existence.
How museums derive costs for imaging and rights service delivery.
How museums define and set prices for asset and rights fees.
The way revenue is assigned affects the investment and development of the services provided.
The driving forces behind digital content creation.
2 http://www.panix.com/~squigle/rarin/RARINSurveyannounce.html

Simon Tanner www.kcl.ac.uk/kdcs/
August 2004 6
©Tanner 2004
The factors that affect the policy decisions regarding issues of revenue assignment and content creation policies.
This study was wholly funded by the Andrew W. Mellon Foundation and was carried out by Simon Tanner as Principal Investigator (PI). The planning and first half of the study was achieved while the PI was employed at the University of Hertfordshire and the second half completed at King’s College London. Section 3.1 gives further information upon the study participants. This study forms an extension of previous work funded by the Mellon Foundation which looked into pricing policy within the United Kingdom and other European libraries and museums3.
3 Exploring Charging Models for Digital Cultural Heritage. Simon Tanner and Marilyn Deegan, HEDS Digitisation Services, June 2002. http://heds.herts.ac.uk/mellon/charging_models.html

Simon Tanner www.kcl.ac.uk/kdcs/
August 2004 7
©Tanner 2004
2 Confidentiality Agreement Before detailing the method and results gained from the study it is essential to emphasise that all the respondents to the interviews were offered a confidentiality agreement. This was necessary in some cases to secure an interview and was essential to gain financial and pricing policy information.
This report includes detailed information about the interview responses, but the institution is not identified without their express permission.
The confidentiality agreement offered was as follows:
US Art Museums: charging models & policy for digital resources
The Andrew W. Mellon Foundation has made a grant to KDCS for a study of USA art museum policy and practice regarding the market for digital resources.
The study for the Mellon Foundation aims to examine the new market realities and opportunities cultural institutions face due to the transition to digitized collections. The project will explore the cost and policy models adopted in arriving at pricing structures for delivering surrogates of unique or rare items as digital objects. Further, it aims to discover the key factors that affect the willingness of museums to collaborate and enable digital content to be shared. The results will provide a unique examination of a fast evolving market of international cultural significance. Further information may be found at: http://www.kcl.ac.uk/kdcs/content/USart.htm
We would like to thank you for agreeing to take part in our research and we will be pleased to acknowledge you and your organisation as valued contributors to the work in reports and publications unless you instruct us to the contrary.
KDCS understands and respects the sensitivity and confidentiality of the information that might be provided by you. We value your participation and give the following assurances:
1. The association between you and your organisation and the information you provide will be known only to the members of the research team and the funding body (the Andrew W. Mellon Foundation).
2. Towards the end of the research, a private invitation-only seminar will be held to which all participants in the study will be invited. This seminar will explore the results of the study findings and seek participants’ feedback prior to delivery of our final report. Any results shared at the seminar will be presented in a manner that precludes direct association with you and your organisation.
3. If the information you provide contributes to any publication, it will be presented in a manner which precludes any association with you and your organisation.

Simon Tanner www.kcl.ac.uk/kdcs/
August 2004 8
©Tanner 2004
3 Methodology The method of study used a combination of survey and interview. The reason for this method of information gathering was to enable an overview of activity through the survey and then to explore the reasons behind this activity through the in-depth interviews. The interviews were necessary due to the extent of the information sought (~70 questions) and to instil confidence in the respondents regarding the confidentiality of the answers provided.
3.1 Participants Donald Waters was the primary representative of the Mellon Foundation to the study.
This study was planned, proposed and implemented by Simon Tanner as Principal Investigator (PI).
The PI gained significant support in the planning and proposal for this study from Brian Robinson (Deputy Director Research and Development, STRC4 and HEDS Service Manager5) at the University of Hertfordshire6, UK. This study is a follow up to one on UK/European activity carried out previously by Simon Tanner and Marilyn Deegan and managed by Brian Robinson.
Simon Tanner left the University of Hertfordshire to create King’s Digital Consultancy Services (KDCS) at King’s College London7 in September 2003. The University of Hertfordshire co-operated to allow the remainder of the study to pass to KDCS and thus ensure that the study would be completed. Harold Short, Director of the Centre for Computing in the Humanities8 at King’s College London, ensured the project was given excellent management support and facilities at King’s.
Bill Worthington9 at University of Hertfordshire programmed the online survey form. Paul Vetch and John Bradley from CCH at King’s College London implemented Bill’s programme on the KDCS website.
Angela Spinazze of ATSPIN Consulting10 was commissioned by the study to carry out museum interviews in the USA and to analyse and formally report these findings to the Principal Investigator. Spinazze interviewed 6 museums (2 jointly with the PI).
Rebecca Finkel, a PhD research student at King’s College London, carried out phone surveys to augment the results gained through the online survey.
Layna White and her team at the San Francisco Museum of Modern Art11 provided the venue for the private participants’ seminar in August 2004.
4 http://strc.herts.ac.uk/ 5 http://heds.herts.ac.uk/ 6 www.herts.ac.uk 7 www.kcl.ac.uk 8 www.kcl.ac.uk/cch/ 9 [email protected] 10 www.atspin.com 11 www.sfmoma.org

Simon Tanner www.kcl.ac.uk/kdcs/
August 2004 9
©Tanner 2004
3.2 Study Instruments The study used the following set of instruments to facilitate the gathering of information for this report. The combined results of the instruments of study provide over 3,000 data points for comparison and analysis.
3.2.1 Online survey
An online request for information about services provided with 19 questions. This was followed up by further web research and phone surveys to fulfil the basic query set for the survey. The survey sought information upon the service models in place for digital images and asked about general issues such as licensing practice, content creation purpose and the nature of their consumer base. See Appendix C for the online survey form. 100 responses were received.
3.2.2 Structured interview
A set of structured questions created a framework for the interviews. The interview contained 70 questions. See Appendix D for the list of questions. 20 interviews were done.
3.3 Study Activities
3.3.1 Devise instruments
A questionnaire (Appendix C) was created and implemented as an online form for research across a wide base of US art museums. This is designed to provide a wide numeric evidence base and overview.
A set of structured questions was then created to provide a framework for the interviews with art museums (Appendix D).
A suitable confidentiality clause was created to cover the interview and case study participants.
3.3.2 Survey
Desk research Research of the public information was provided by art museums regarding the services/prices they offer to their consumers for digital and analogue images. This research augmented the questionnaire approach to information gathering.
Online questionnaire and survey Art museums discovered as part of the desk research or via mailing lists and other dissemination routes were invited to complete the electronic form. The results were compiled and augmented with further desk research.
When the response to the online survey was lower than had been expected, then the survey was conducted by phone to ensure that at least 100 responses were received.
Survey results collation and QA The results of the survey and desk research were collated into an Excel spreadsheet and cross checked for accuracy. The textual information collected was also collated to allow for direct correlation between the institutions and cultural sectors.
Survey analysis and report writing The correlated results were analysed to discover any trends or significant factors that define certain activities. These have been compared with the

Simon Tanner www.kcl.ac.uk/kdcs/
August 2004 10
©Tanner 2004
results found in the interviews and used as the basis for the final analysis and reporting.
3.3.3 Structured Interviews
Recruit US consultant To carry out some interviews within the art museum sector, the project recruited the services of a suitable person with significant background experience in the US museum sector. This brought local knowledge and relevant experience to the project and ensured that the tasks in this part of the plan were executed cost efficiently.
Identify museums and schedule visits The results of the initial desk research and the survey provided a list of potential candidate art museums for interview. Museums divided by service, size, type of collection, geography and governance were identified. As there were more suitable museums in some sectors than others, the project interviewed no more than 20 museums to ensure one type of museum did not overly skew the results. The list of identified museums was much greater than 20 as a contingency against institutional refusal to partake or other barrier to successful study participation. Once identified, the museums were approached and asked to take part in the study. A schedule of visits was drawn up.
Pilot interview process Once a set of instruments was drafted then they were tested and refined with 2 appropriate art museums. This activity was done jointly by the PI and the US consultant. The results of this validation exercise made it possible to gather information from the remaining museums and the interviews were revised slightly in the light of this pilot process.
Interviews and case studies 20 museums were interviewed. The information was discovered during visits through structured interviews and case study work with people directly involved in establishing and developing rights, reproductions and digital image services within each of the target art museums. Prior to the visits the museums were delivered the structured interview to enable them to gather the relevant information. Where possible a visit included the photographic studio, digital image laboratory and licensing departments. Where practicable, further contact with the strategic management of the museums digital activities was sought to find overview information upon policies and institutional goals. Museums were asked to nominate staff who would take part in the interviews from the following stakeholder categories:
a person responsible fro rights negotiations with external consumers a distributor of images a creator of images a requester of images (such as curators) strategy maker - a person who defines higher level museum strategy
It is notable that in many cases these categories were encompassed by one or two people and in others by many more.
Some museums were not able to provide all of the answers to all of the questions, but the key issues regarding the motivations, objectives and purpose of service provision were covered by all respondents.
Interview results collation and QA The results of the interviews were collated and cross checked for accuracy and consistency. All numeric results were collated into an Excel spreadsheet to

Simon Tanner www.kcl.ac.uk/kdcs/
August 2004 11
©Tanner 2004
enable statistical analysis. The textual information was collated to allow for direct correlation between the museums and sectors.
Some follow up phone conversations were made to clarify items or to chase outstanding information that a museum had promised to provide.
Results analysis The correlated results were analysed to discover any trends or significant factors that define the activities of art museums. These were compared with the results found in the survey and used as the basis for the final report writing and presentation at the seminar for interview participants.
Seminar and feedback A private seminar was offered to enable the interview participants to potentially meet and discuss the study results and findings in confidence. This took place in August 2004 at the San Francisco Museum of Modern Art. This provided valuable feedback and helped to shape the final report for the study.
3.3.4 Report writing and dissemination
All of the results collated from the interviews, survey and seminar feedback have been analysed and written into a final report for the whole study activity. Upon review and acceptance by the Mellon Foundation, it has been made freely available via the KDCS website in a number of formats to allow browsing and printing. The report will be distilled to provide the basis for a number of upcoming articles for the museum community and as presentations at museum related conferences, such as the MCN 32nd Annual Meeting, held in Minneapolis on 10-13 November, 2004.
Simon Tanner www.kcl.ac.uk/kdcs/
August 2004 12
©Tanner 2004
4 Survey Results
4.1 Overview of the Survey The survey asked basic questions about the museum itself to provide a context for the remaining questions which focus upon imaging and rights service provision and pricing policy. The survey itself is available in Appendix C.
The museums that took part in the survey are listed in Appendix A.
The survey questions asked for the following information:
Museum name Web address Description Governance Operating Budget Attendance Number of staff Whether the museum supply digital and/or printed copies of images Availability of price sheet What the primary driving factors are behind providing services Whether rights and licenses for the publication/other use of images are
managed in-house or by external agents Whether rights and licensing rates are charged differently for education and
commercial use How images are found and selected by consumers The standard turnaround time offered Payment methods available Whether the majority of images are scanned/digitized in-house or mainly
outsourced Personal details of respondent
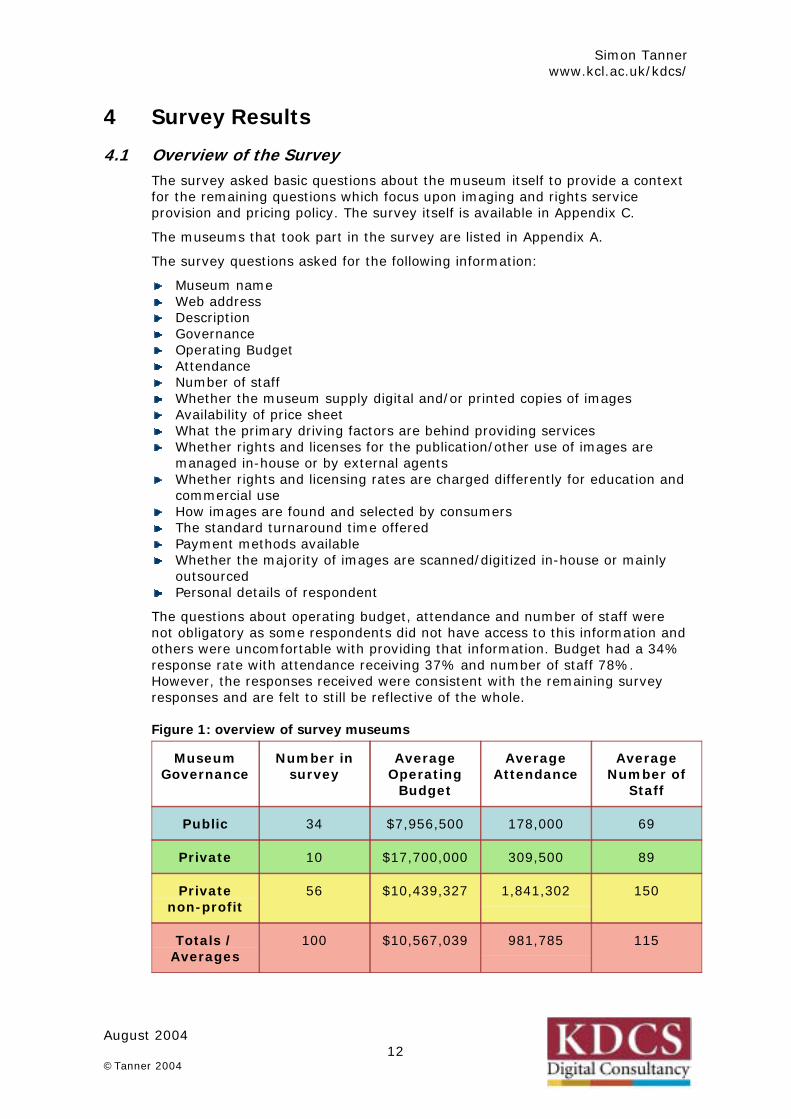
The questions about operating budget, attendance and number of staff were not obligatory as some respondents did not have access to this information and others were uncomfortable with providing that information. Budget had a 34% response rate with attendance receiving 37% and number of staff 78%. However, the responses received were consistent with the remaining survey responses and are felt to still be reflective of the whole.
Figure 1: overview of survey museums
Museum Governance
Number in survey
Average Operating
Budget
Average Attendance
Average Number of
Staff
Public 34 $7,956,500 178,000 69
Private 10 $17,700,000 309,500 89
Private non-profit
56 $10,439,327 1,841,302 150
Totals / Averages
100 $10,567,039 981,785 115
Simon Tanner www.kcl.ac.uk/kdcs/
August 2004 13
©Tanner 2004
The survey results show distinct differences according to museum governance. Private museums are clearly shown to have more resources than public ones in terms of staff and budgets. Private museum average attendance is also higher then the other governances. The main differences in operating budget appear to be acquisitions, exhibitions and buildings/operations maintenance expenditure. With close inspection the detailed results appear to show a very high level of efficiency in art museums (born out by interviews) with high levels of service and attendance being delivered by relatively small numbers of staff in all types of museum.
The average results shown in this report are merely indicative of the relative proportions of budget, attendance and staffing to be expected in the respective museum governances – these results should not be read as delivering a target volume for any of these factors. What remains clear is that museum governance is a good indicator of likely differentials in budget, attendance and staff.
The responding museums were able to choose their own description of their governance from a number of options. The public museum result includes 2 responses of “affiliated” to the governance question which are actually university based collections. These have been included as public in this study as the majority of university based museums claimed to be public.
There were far more non-profit private museums in the survey than any other type and the proportions of the different governances have been reflected in the 20 art museums interviewed.
4.2 Digital Imaging Activity in Art Museums The volume of digital activity is high and appears to be growing. There is certainly a desire shown to create and deliver more digital images.
4.2.1 Image availability and asset fees
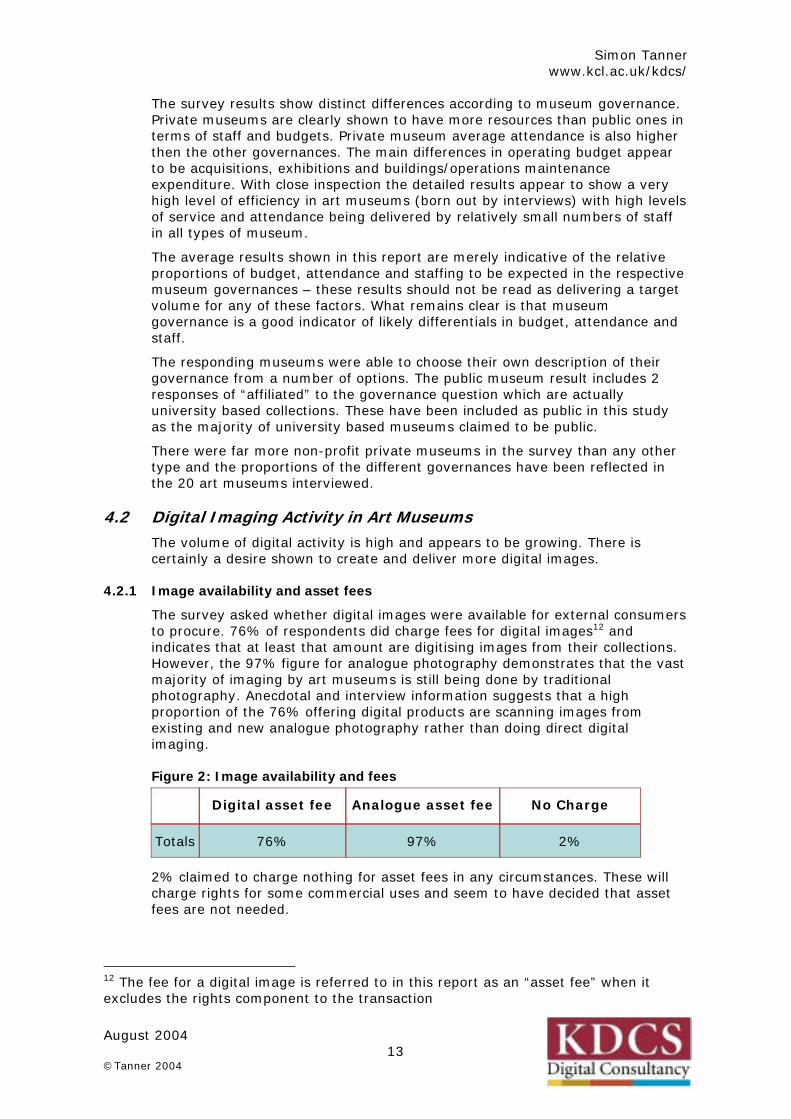
The survey asked whether digital images were available for external consumers to procure. 76% of respondents did charge fees for digital images12 and indicates that at least that amount are digitising images from their collections. However, the 97% figure for analogue photography demonstrates that the vast majority of imaging by art museums is still being done by traditional photography. Anecdotal and interview information suggests that a high proportion of the 76% offering digital products are scanning images from existing and new analogue photography rather than doing direct digital imaging.
Figure 2: Image availability and fees
2% claimed to charge nothing for asset fees in any circumstances. These will charge rights for some commercial uses and seem to have decided that asset fees are not needed.
12 The fee for a digital image is referred to in this report as an “asset fee” when it excludes the rights component to the transaction
Digital asset fee Analogue asset fee No Charge
Totals 76% 97% 2%

Simon Tanner www.kcl.ac.uk/kdcs/
August 2004 14
©Tanner 2004
4.2.2 Digitization activity
The vast majority of digitization activity is happening within museums own facilities (66%). This reflects two aspects of the activity. There are many museums that are scanning from transparencies, and this can easily be accomplished in-house as an adjunct to traditional photography. Other museums that are moving heavily towards direct digital capture can only achieve this on site and thus believe having ones own facility makes very good sense. Where there is an established photographic department in place, it is very likely that this department will transition to direct digital capture rather than the museum outsourcing this activity.
Figure 3: Digitization activity
A further 8% are using a mixture of in-house and outsourcing methods for imaging. This is a good model for keeping equipment costs low and only procuring services as and when needed rather than trying to maintain experience and activity over leaner periods in a demand driven market. These figures are most likely to reflect scanning from transparency and will be most prevalent in museums that are already using contract photographers.
The 9% that are using a pure outsourcing model is suggestive of the transition period between analogue and digital technologies where it is more efficient to outsource large volumes of scanning from transparencies for retro-capture of a collection. Imaging services in museums are also aware of the benefits in terms of image fidelity provided by drum-scan technologies, and traditionally drum-scanning has been an outsourced activity with few examples in-house due to equipment cost and space.
The 8% gap, represented by the 17% of responses that are doing no digitization activity compared to the 76% charging digital asset fees, suggests there is digitization occurring for purely internal museum reasons. Whether these digital images will continue to be available for internal use only or will eventually become an externally consumable product is not clear. There are a number of potential reasons to digitize for internal use only. Foremost might be accession type digital photography that records the artefacts existence in the collection but would be considered of not high enough standard for external or publication use. Another possibility is that the service model for delivering images to external consumers is modelled around the loan of a transparency and that services are not yet willing or able to change their service model to include providing digital images.
4.3 Service Profiles The survey also sought out information that defined the way that consumers used the services to gain images. The survey asked about payment, about the turnaround times offered and how the consumers found out what images they wanted from the collection.
4.3.1 Methods used to find images
The survey found that there was a wide variety of methods used by consumers to identify images they would wish to procure for personal, scholarly, non-profit
Digitization Activity
In-house
Outsourced
Mix of both
None
Totals
66%
9%
8%
17%

Simon Tanner www.kcl.ac.uk/kdcs/
August 2004 15
©Tanner 2004
and commercial uses. The method that was most identified by respondents was use of the museum website with a 56% response rate. The web is obviously perceived as being important in driving use of the collection and the 56% response suggests that orders are driven by web use. It is worth noting here that the interview results showed that hardly any interviewees could show recorded evidence of additional image orders being received because of images being available on the web – thus, for many, this makes the importance of the web to image orders an article of faith based on personal experience rather than an empirically proven fact.
Surprisingly high proportions (43%) still find images for consumers. This may often be driven by the consumer making contact with a vague request (e.g. “I saw the sculpture of the dancing girl in your travelling exhibition”) or the picture editor approach (e.g. “anything by Monet” or “an Etruscan vase”). What it clearly demonstrates, and is upheld by the interviews, is the strong service ethic in place and the high levels of personal interaction expected in the provision of images.
Figure 4: Methods of finding images
Images listed in the museum catalogues (37%), in print publications and seen at exhibitions (26%) were also perceived as being popular means by which consumers select desirable images from the collection. A sizeable number (24%) also registered that they did not really know how the consumer identified the image and associated it with the museum and this is represented in the personal research. Many scholars, for example, will just know from long experience that the artefact they want to represent is held at a certain museum. This type of request would also be represented by the personal research figure.
4.3.2 Payment methods and turnaround times
Payment is an area of some difficulty for museums and the study received much anecdotal evidence of the consumer base requesting images with no intent of actually paying for the service received. From the interview results, an average of 15% of all requests were estimated to fail to be completed; the most frequent reason for failure being the lack of payment from the consumer. This explains the survey results which showed that 85% of all respondents expected payment in advance of delivering the image. 20% were willing to accept payment after delivery and the 5% overlap is represented by those museums prepared to do both approaches depending upon the circumstances and the requester.
Many museums seem to maintain some form of errant list of consumers with a poor payment record and these could never expect to receive image delivery prior to payment. However, for some regular consumers or for a request with a genuine need for a speedy turnaround time then payment after delivery may be acceptable to enable the business activity to flow freely.
85% require payment before delivery
20% will accept payment after delivery
Website
Catalogue & library
Locate for client
Personal research
Publications & exhibitions
Totals 56% 37% 43% 24% 26%
Simon Tanner www.kcl.ac.uk/kdcs/
August 2004 16
©Tanner 2004
5% overlap where the payment term is determined by circumstance and requester reliability
Average 2 week turnaround time offered to consumers
A link between payment and turnaround time was found in the survey. The average turnaround time was 2 weeks (with a range of response from less than 24 hours to 6-8 weeks). All of the turnaround times are for items within stock and many commented that they frequently beat the deadlines offered. It should also be noted that the turnaround time offered is usually measured from the point of either payment being received or the licence agreement being signed. Turnaround times may therefore be longer if the consumer is slow to return payment or to sign agreements but this is not a reflection on the efficiency of the museum. If the museum has to make a new photographic image to facilitate the request, then there is no fixed timescale for most museums as this may involve so many variable factors of artefact availability, studio space and photographic timescales/backlogs, that offering a guaranteed turnaround time would be folly.
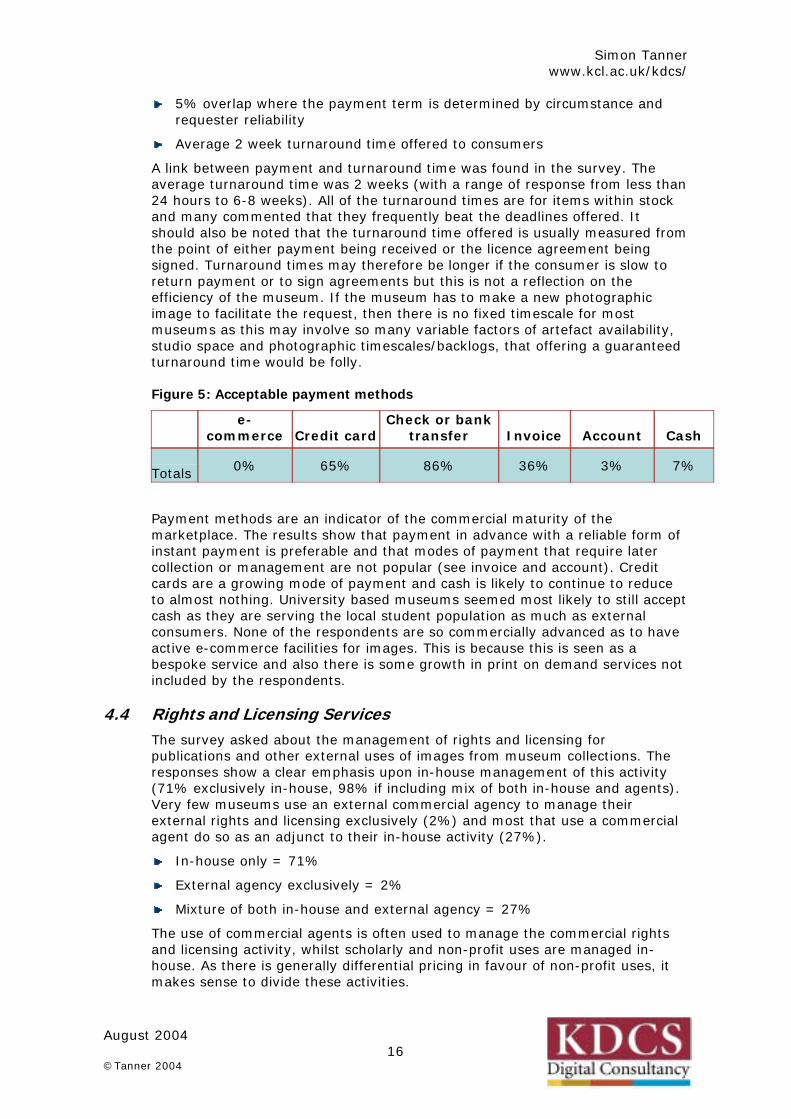
Figure 5: Acceptable payment methods
Payment methods are an indicator of the commercial maturity of the marketplace. The results show that payment in advance with a reliable form of instant payment is preferable and that modes of payment that require later collection or management are not popular (see invoice and account). Credit cards are a growing mode of payment and cash is likely to continue to reduce to almost nothing. University based museums seemed most likely to still accept cash as they are serving the local student population as much as external consumers. None of the respondents are so commercially advanced as to have active e-commerce facilities for images. This is because this is seen as a bespoke service and also there is some growth in print on demand services not included by the respondents.
4.4 Rights and Licensing Services The survey asked about the management of rights and licensing for publications and other external uses of images from museum collections. The responses show a clear emphasis upon in-house management of this activity (71% exclusively in-house, 98% if including mix of both in-house and agents). Very few museums use an external commercial agency to manage their external rights and licensing exclusively (2%) and most that use a commercial agent do so as an adjunct to their in-house activity (27%).
In-house only = 71%
External agency exclusively = 2%
Mixture of both in-house and external agency = 27%
The use of commercial agents is often used to manage the commercial rights and licensing activity, whilst scholarly and non-profit uses are managed in-house. As there is generally differential pricing in favour of non-profit uses, it makes sense to divide these activities.
e- commerce
Credit card
Check or bank transfer
Invoice
Account
Cash
Totals 0% 65% 86% 36% 3% 7%
Simon Tanner www.kcl.ac.uk/kdcs/
August 2004 17
©Tanner 2004
There are many different ways to work with commercial agencies. Some museums have an exclusive deal for all the commercial work, so even if the museum is contacted they will pass the work to the agent; in other cases the museum will take any work that comes to them directly and the agent gain only that which comes directly to them. Some museums have deals with more than one agency and many museums have a selected number of images sited with their agent(s) rather than all their available images.
The following agents were mentioned by respondents: Art Resource, Bridgeman, Corbis, Davis and Scala.
4.5 Primary Driving Factors for Service Provision A key question within the survey was to find the primary driving factors defining the reasons for services to exist. This was a difficult question for respondents as the survey was designed with 9 answers provided and requiring the respondent to pick up to, and no more than, 4 answers. It is clear that most museums could have answered positively to all of the answers and four museums refused to answer this question as they felt it was unfair to be made to select only 4 answers. However, the question was designed deliberately to force respondents to make choices and to consider their own motivations more deeply than a generalised question could have achieved. The 96 responses did provide a clear indication of the motivating factors.
The question that was asked was: What are the primary driving factors behind providing your service? (select up to 4 from this list of 9)
The answers that the respondents had to choose from were:
serve the public and educational use †
serve publishers and/or commercial picture use †
meet public demand for services †
provide services for the museum ‡
make money for the museum ‡
recover the costs of service provision ‡
promote the museum and its collections †
manage the museums image collections ‡
to protect the museum from copyright infringement ‡
As can be seen, there are overlapping motivations in the answers available and they divide into 2 key factors. Those marked with † are answers that are about promoting the museum or servicing external demand. Those marked with ‡ are answers reflecting the need for the service to react to internal museum priorities such as managing collections or financial issues.
The results of this question are represented in Figures 6 and 7. The grouped results in Figure 6 show that the clear top three primary driving factors are:
1st Serve public and educational use
2nd Promote the museum and its collections
3rd Serve publishers and/or commercial picture use
In equal 4th place (with either 30 or 31 responses) are several answers
4th Provide services for the museum

Simon Tanner www.kcl.ac.uk/kdcs/
August 2004 18
©Tanner 2004
4th Recover the costs of service provision
4th Manage the museums image collections
4th To protect the museum from copyright infringement
These results indicate that the key driving factors for service existence in the grouped results are due to external factors (60%) according to the survey.
However, when the results are analysed according to the governance of the museum, then some significant differences become apparent. Figure 7 shows the results grouped by governance and represented as percentages of that governances total response.
Private non-profit museums are driven by the top three externally focussed factors (public/educational use; publisher/commercial use; promotion) followed by serving the museum. Serving the public and educational use is an extremely strong driving factor with a 93% response rate.
Private museums are driven in equal measure by internal and external drivers. Promoting the museum is placed first, followed by the internal factors of protecting copyright and recovering service costs and then serving publishers/commercial use. It is notable that protecting copyright and recovering service costs are significantly more important to private museums than to any of the other governance types.
Public museums are very similar to private non-profit museums as their top three driving factors are identical (public/educational use; publisher/commercial use; promotion). However, promoting the museum is given more prominence than with public museums. Where they differ is that the next most important factor for public museums is to recover service costs rather than to serve the museum use.
Public museums were least interested of all the museums in meeting public demand or in making money, although neither of these factors scored well with any governance sector. This may be because there is no perceived public demand for the imaging and rights services, as they are normally accessed via an intermediary (publisher, educator etc). Also making money, as will be shown in the interview segment of this study, is seen as unlikely, politically unpopular and is thus subsumed by those responses promoting a desire to recover the costs of service provision. Private non-profit museum services seemed the least interested in financial matters as opposed to service factors.

Simon Tanner www.kcl.ac.uk/kdcs/
August 2004 19
©Tanner 2004
0 10 20 30 40 50 60 70 80
serve public & educational use
serve publishers / commercial picture use
meet public demand
services for the museum
make money
recover service costs
promote the museum / collections
manage the image collection
protect copyright
0 10 20 30 40 50 60 70 80 90 100
Private
Public
Private Non-profit
serve public & educational use
serve publishers / commercial picture use
meet public demand
services for the museum
make money
recover service costs
promote the museum / collections
manage the image collection
protect copyright
Figure 6: Primary Driving Factors for Providing Services
Figure 7: Primary Driving Factors for Providing Services by Museum Governance

Simon Tanner www.kcl.ac.uk/kdcs/
August 2004 20
©Tanner 2004
4.6 Differential Charging The survey asked whether charges for educational use would normally be less than, equal or more than charges for commercial use. This is a question with an exceptionally obvious answer, but one that the Principal Investigator is unsure has ever been systematically measured before.
99% of survey respondents charge less for education than for commercial use
1% charge the same for both
Any initial surprise at not receiving a 100% response rate to differential charging in favour of education can be allayed by a closer look at how the 1% charge for services. Their charging scheme does not differentiate on the basis of who the consumer is but does have a sliding scale of costs according to volume of usage/print run etc. Thus commercial consumers will be charged more as their usage/print run is normally higher (especially for text book publications which are a high proportion of museum publication use).
One aspect of this study’s findings, which will be explored through the interviews, is that differential charging is just assumed to be the right and fair approach to charging. Thus the question asked here of “do you differentiate?” gains a resounding “yes” response but the question “why do you differentiate?” is less clear cut. Further queries about when to start differentiating and by how much should one differentiate (10%, 50%, 100% less or no charge at all) are even less easily defined or thought through by museum service providers and policy makers. These issues regarding what drives the pricing and motivates the service provision are the focus of the interviews reported in the next section of this study.
4.7 Comparison of survey with UK and Europe This report follows on from another Foundation study looking at UK and other European charging practices13. The results of the 2 studies are comparable and have many similarities. The European study identified that prices were set mainly in relation to the perceived market value and that a differential pricing policy was in place for most respondents. None of the European counterparts were making money from the asset fee but some were making money from rights and licensing. European e-commerce activity was found in almost 10% of respondents but this study found none in the survey at all and this represents a useful comparative indicator for maturity of commercial intent.
The main difference found in the 2 studies was that professionalization of the rights management function, particularly in the UK, was more widespread than that found in this US study. UK museums have taken innovative approaches to raising revenue. Some UK museums have outsourced commercial activities and rights negotiations to a wholly museum owned subsidiary company that allows them to benefit from a fully commercial approach whilst not diverting the museums main purpose. This approach was not seen in any US museum studied.
13 Exploring Charging Models for Digital Cultural Heritage. Simon Tanner and Marilyn Deegan, HEDS Digitisation Services, June 2002. http://heds.herts.ac.uk/mellon/charging_models.html
Simon Tanner www.kcl.ac.uk/kdcs/
August 2004 21
©Tanner 2004
5 Interview Results During the interview segment of the study 20 museums were interviewed and 70 questions were asked of each (see Appendix D). Not all museums could offer answers to all the questions but all gave of their time, with enthusiasm and great openness.
The interviews are a form of opinion based research. Whilst in many museums the interviewers met with several different stakeholders, it is noted for the record that the interview results are the participants’ opinions or a description of activity, not a formal record of museum policy. This study strives to maintain the confidentiality of all the participants (unless their permission has been expressly given) but should the reader assume a certain response relates to a certain museum they should be wary of assuming that it represents formal policy.
The 20 museums that took part in the interview portion of the study are listed in Appendix B. Many more museums were invited or offered to take part but were not interviewed either because of logistical barriers, geographic location (i.e. would cause too much bunching) or because they represented a museum governance or type that had already been well represented.
The museums interviewed represent the same overall distribution of governance, size, type and geographic spread as discovered from the survey responses. Obviously, as the study wanted to look at practices including digital activity, this pushed towards a narrower set of respondents but there are also museums with little or no digital activity in the interview set for balance.
The interview results are divided into the following sections:
Profile of the museums
Profile of the imaging and rights services
Problem areas for service provision
Business practices for imaging and rights
Pricing: motivations and policies
5.1 Profile of the Museums The governance of the 20 museums interviewed is:
11 private non-profit museums
6 public museums
3 private museums
5.1.1 Collection focus
The collection focus of the museums spans over 6,000 years and includes all forms of art such as: fine art; crafts; subject or region specific art; contemporary and modern art. The number of works in the collections ranged from 2,000 – 2 million+ works and the 20 museums interviewed could account for in excess of 4 million works altogether. The collections include some of the most well known artworks and artists in the world and some of the most important art for education, scholarship art history and the human record.
60% have <5% of collection on public display
85% have <20% on public display

Simon Tanner www.kcl.ac.uk/kdcs/
August 2004 22
©Tanner 2004
15% have 21%-100% on public display
5.1.2 Museum budgets, attendance and staff
The 20 museums had operating budgets ranging from $3 million to $160 million dollars per year. Attendance ranged from 30,000 to 10 million visitors per year and the number of staff ranged from 25 to 350. The majority receive significant endowment support. All public and some non-profit museums received money from the local city or county community. The profiles exhibited by the museums were mainly in line with those discovered in the survey.
5.1.3 Museum audience, revenue and expenditure
The museums audience (in order of precedence):
1. Local community and citizens
2. Tourists and general public
3. Academe - scholars and students
4. Education – schools and colleges
5. Other museums
Who the museum as an entity perceives itself as serving and where it gains its main revenue from are important indicators of the overall goals of the museums interviewed. The museums were asked to identify 2-3 main areas of revenue generation and expenditure (see Figure 8: Maximum areas of museum expenditure and Figure 9: Maximum areas of museum revenue). This is an empirical measure and is strongly indicative of the operating priorities of each museum. The results were usually made with direct reference to the annual report or accounts of the museum in question.
The maximum areas of expenditure are in the general and administration elements of running the museum including building maintenance and utility bills. This is closely followed by salaries and staff costs (such as benefits). Both of these are normal business costs that would be predicted as major expenditures for any sizeable institution. The next biggest expenditure is museum community specific and is the cost of operating exhibitions. These three expenditures were mentioned the most. Other museum specific expenditures were frequently stated including: curatorial and conservation work; education programmes; and acquisitions.
The maximum areas of revenue are clear with the museums’ shop and retail activities sharing top priority with membership, admissions/ticket sales and fundraising. Many of the smaller museums (in terms of budget and attendance) relied upon membership and an annual fundraiser for a very significant proportion of their revenue. Endowments are an important backbone to many of the museums and some of the museums also find significant revenue from rental of the museum space for events etc.
Most museums could identify costs and revenues from all of the areas mentioned by the interviewees. What is significant is the emphasis given to certain expenditures and revenues over others and their perceived importance to the museum. Even though the interviews were conducted mainly with staff working with image and rights, only one museum stated that image and right sales was a major contributor of revenue to the museum. It was also noticeable that exhibitions appeared more frequently as an area of major expenditure than it did for revenue and two or three museums mentioned they had reduced their exhibitions to one or less per year to reduce the overhead costs involved.

Simon Tanner www.kcl.ac.uk/kdcs/
August 2004 23
©Tanner 2004
0 1 2 3 4 5 6 7 8
Number of responses
Acquisitions
Curatorial / conservation
Development / fundraising
Education
Exhibitions
General & administration
Publications
Salaries & staff
Storage
Technology
0 1 2 3 4 5 6 7 8 9
Number of responses
Admissions / tickets
Endowment / grants
Exhibitions
Fundraising
Image sales
Membership
Publications
Rental of museum space
Retail & shop
Sponsorships
Figure 8: Maximum areas of museum expenditure
Figure 9: Maximum areas of museum revenue

Simon Tanner www.kcl.ac.uk/kdcs/
August 2004 24
©Tanner 2004
5.2 Profile of the Imaging and Rights Services The study asked detailed questions about how the imaging and rights services served the museum’s mission, who are the primary audiences for the services and how those audiences are served. The study also sought information about staffing, resources and the services relationship to other parts of the museum.
5.2.1 Service structures
The imaging and rights services come in many shapes and sizes. In some museums rights and serving images is literally a part time activity for one person with contract photography dealing with the imaging. In others the activity is divided across distinct departments each with several staff to manage the imaging and rights as separate activities.
Museums are fairly evenly divided according to the number of transactions, the number of museum staff, collection and operating budgets. The two typical structures seen were:
1-1.5 full-time photographer or contract photographer plus a part-time rights and reproductions activity for a member of staff (such as Assistant Registrar). [8 museums observed]
2-3 or more full-time in-house photographers plus 2-3 (occasionally more) full-time rights persons and a management position (both full-time and part-time observed) [10 museums including one with over 23 staff in total]
2 museums did not indicate their staffing
Budgets are obviously very variable and mainly made up of salary costs. It is not possible to make generalizations about these apart from that most museums interviewed assume their operating costs will be higher than their revenue. Operating costs include services to both external and internal clients, but internal requests are usually not charged for and the number of transactions means they generally represent the largest service cost. Case Study 1 is indicative of many of the museums with a medium number of transactions and the desire to work digitally.
Case Study 1: an imaging and rights service
Governance = Private non-profit museum.
Transactions = Number of external image request transactions is in excess of 350 per year plus at least the same number from inside the museum. Each transaction can account for many images.
Staff = 3 FTE photographers, 1 FTE scanning operator, 1 x rights and reproductions officer, 1 PT manager and 1 PT financial assistance.
Photography = 1 primary studio but also take shots of art installations and in the gallery. 3 x digital cameras plus one high quality production scanner. Image files created normally exceed 150Mb and all images are delivered digitally now.
Budgets = ~$400,000 for staff costs plus ~$55-70,000 for operating costs annually. Estimated cost of each digital camera setup is approximately $75,000 once all the camera, lights, computing and ancillary items are accounted for. Major equipment is not accounted for within the core budget but financed and funded separately.
Revenue from image and rights sales = partial cost recovery that exceeds the operating costs but does not fully recover staff costs. Is not intended as

Simon Tanner www.kcl.ac.uk/kdcs/
August 2004 25
©Tanner 2004
primarily a revenue generating operation and mainly exists to serve non-profit, scholarly use and the internal market.
5.2.2 Transactions and processes
A transaction is defined as a single request for images requiring a single licensing agreement. Therefore the number of transactions does not necessarily translate into an estimation of the number of images delivered or the amount of new photography required. It does give a good indication of the rate of work and thus shows the required resource commitment from the museum to provide services.
The number of external transactions recorded by the museums was as follows. Note that most museums below the 1,000 mark expected at least the same number of internally generated requests.
20% <50 transactions
5% 50-100 transactions
40% 101-500 transactions
15% 501-1000 transactions
20% >1000 transactions [1 museum reported >4000 transactions]
Thus, with approximately 2/3 of interviewed museums carrying out less than 500 transactions per year this indicates that for many museums the imaging and rights activity is one which demands museum resources but is not quite big enough to become a major museum department with the prestige and power that might convey.
Most of the museums are using either a paper system or a combination of Microsoft Word and Excel to record and manage transactions. If there are a low number of transactions there is little incentive to automate or process information electronically – 4 use paper systems. Many (6) are using Word for forms and Excel to manage the financial information. 5 museums are using a module or plug-in to the museum collection management system to track and record transactions. 5 museums are using home grown databases in Filemaker Pro, MS Access or similar.
The receipt and processing of requests follows a clear path that is very similar across the majority of museums. This process may differ in terms of negotiations over pricing; usage policies and new photography, but the steps are basically the same.
The following case study readily describes the stages in a typical request for image use. What is notable is the amount of work that is required even before it is clear that the transaction will be successful. The interview results show an average transaction completion rate of 86% and so there is a heavy initial investment of time with no guarantee of success or revenue.
Case Study 2: a typical transaction
The imaging services for the museum primarily exists for internal publications such as catalogues, brochures and for publicity. External requests most often originate from textbook publishers, other commercial publishers and from individual researchers.
An internal request:
1. Receive request

Simon Tanner www.kcl.ac.uk/kdcs/
August 2004 26
©Tanner 2004
2. Check that an image is in stock
3. Identify the intended use for the image
4. Check that the museum has permission to reproduce image
5. If under copyright, then attempt to secure permission to reproduce image
6. If image is not in stock, then have the object photographed
7. Deliver image to whomever has requested image
An external request:
1. Receive request in writing – by online form or other correspondence
2. If client does not have specific image in mind, search collections database and suggest possible images
3. Check whether the requested image is in stock and if so then follow steps 5-10.
4. If image is not in stock then follow steps 11-
5. Identify the intended use for the image
6. Assess whether the intended use is acceptable to museum
7. Check that the museum has right to grant permission to the client to reproduce image
8. If image is outside the museums right to grant permission, then client must secure permission to reproduce image from copyright holder
9. Once rights have been resolved and museum is satisfied that transaction will proceed then send licence agreement and invoice for image and reproduction fees
10. Once payment and signed agreement has been received then deliver the image
11. If the image is not in stock, then assess whether it is acceptable to museum to photograph the object and ensure that steps 5-9 have been completed
12. If object will be photographed then arrange for photography once the customer has signed agreement and made payment
13. Upon completion of photography accession image into the museum system
14. Deliver the image
3rd party rights are usually dealt with by directing the requestor to contact the rights holder directly to gain permission. About half of those interviewed will ask for documentary evidence of the right to reproduce from 3rd parties work before releasing the image. The remainder do not usually check the permission status but place the onus upon the requestor via clauses in the license agreement that they are required to sign. Many services feel this is a difficult area for museums and that controlling their own use is sometimes more difficult than controlling external uses.
5.2.3 Criteria for image creation and denial
The following criteria were most frequently given for creating images:
New acquisitions or accessions photography
Fulfil requests and orders for images
Internal demand

Simon Tanner www.kcl.ac.uk/kdcs/
August 2004 27
©Tanner 2004
The charges for new imaging (whether analogue or digital photography) range from $25 to $250 for 2D images. The pricing of new photography depends upon the pricing policy of the museum. Some are trying to recover the full cost of new photography, whilst others will only do new images if that serves the museums purpose and as such will share the cost with the consumer. One museum, charging $250 for new photography, had done strict cost measurements and assessed that the costs of moving an art object to the studio in terms of curator time, photography, accessioning and servicing the request was between $350 and $500. This museum decided this price was so far above the market rate that it couldn’t charge the real cost and adjusted the price downwards with the hope of recouping it across a number of sales or potential internal uses by the museum.
The coverage of museum collections by images in stock (whether digital or analogue):
9 museums have < 25% of collection imaged
4 museums have between 25 – 50% of collection imaged
5 museums have more than 50% imaged
2 museums have 100% imaged
Museums may deny an image request from an external source for a number of reasons. As shown above few museums have either the resources or desire to image everything in their collection. Therefore, when an external request is received, it may be rejected for reasons outside of straightforward rights reasons. The most frequently cited reasons to refuse a request to create or license an image are:
No payment
Inappropriate use – there are many definitions of inappropriate use and some are listed below
Intent to alter the image – for example by cropping, overprinting or otherwise changing the colours or content
If use would mock or otherwise disrespect the artist, artwork or museum
If use would contradict the values of the museum
If the intended use would compete with another commercial/retail endeavour (such as a calendar that would compete with the museums own calendar)
If the use is purely for profit and will not benefit the museum – for example t-shirts or mugs (not sold in museum)
If endorses a product, political party or person; or is for advertising or corporate branding
The artworks donor or gift may stipulate acceptable uses
If the artwork is in storage and it would be too costly or onerous to move to the studio (one museum had storage in a different state, another had storage over 100 miles away)
If the artwork will not fit in the studio
If the artwork is too fragile to image
Simon Tanner www.kcl.ac.uk/kdcs/
August 2004 28
©Tanner 2004
5.2.4 Serving the museums mission
The services interviewed were asked how they served the museums core mission by delivering images. All of the interviewees made statements about serving the core mission by seeking to educate and advance the knowledge and appreciation of art.
Some quotes from interviewees include: “bringing art to life”; “to tell stories of the American experience through images as well as physical objects on display in the galleries”; “what is an image without context?”
Other means of serving the museums mission include:
Serve scholarly research and teaching (12 responses)
Promote and publicize the collections (10)
Disseminate widely - especially to new audiences (9)
Improve access to the collection for everyone (8)
Provide images for publication (4)
To be a leader in the local community (3)
Enable museum retail and revenue (2)
To ensure use is appropriate (1)
To help administer the collection (1)
5.2.5 Primary audience for imaging and rights services
The museums stated that the primary audience for the imaging and rights services are (in order of precedence):
1. Internal to museum – the biggest audience is internal
2. Text book publishers
3. Scholarly publishers
4. Commercial publishers
5. Scholars including art historians and individual research
6. Web use
7. Museum to museum – to support exhibitions etc.
8. K-12 and other education use
This list is in sharp contrast to most museums’ core audiences of the local community, tourists and the general public. The imaging and rights services are thus always placed one step distant from the museums primary audience. These services are mainly serving intermediaries, whether museum curators or publishers, who form the first line of attention from the museums’ core audience. Most imaging and rights services did not receive the credit they deserved for enabling the wide dissemination, retailing and publication of the collection because of this disconnect between service and audience.
5.2.6 Relationships with other museum activities
This observation about the general disconnect between the imaging and rights services and the museum audience leads to questions about how the services interact and relate to other museum activities such as curation, retailing, public relations, marketing and publishing.

Simon Tanner www.kcl.ac.uk/kdcs/
August 2004 29
©Tanner 2004
The majority of museums responded that imaging and rights services are centralized with all requests going through one person or distinct unit. This provides a clear advantage over those where the services and rights activity were distributed across many departments. It was clearly more efficient and focused experience, especially for rights and licensing, in a distinct and defined unit. This enables more control and reduces the risk for the museum from “rogue curator actions”, such as giving away rights to images the museum does not own. It also allows for the possibility of an internal market with charging for service provision across departments. The interview results demonstrated conclusively that those museums with a centralised rights activity returned more revenue against expenditure. Those museums without a centralised service all reported conflicts, difficulties in controlling use or in effective management.
Common conflicts reported included:
Rights given away for free unnecessarily
Digital images are often considered less desirable for printing by marketing and public relations due to inexperience with the formats
Non sharing of revenue or credit for activity
3rd party rights are sometimes abused in-house more than by external users
The issue of credit and revenue sharing is key to ensuring the future growth and improvement of imaging and rights services. At present the disconnect between the services and the museum audience can easily lead to an attitude that suggest that the imaging and rights services are expensive to run but generate inadequate returns. As will be discussed in a later section on revenue assignment this issue is akin to an automobile manufacturer criticising the factory for not selling enough cars because they do not directly interact with the primary audience and generate primary revenue like the showrooms or sales force.
5.3 Problem Areas for Service Provision The following problem areas were identified and explored during the interviews
Rights services and unauthorised image use
Fair use
Barriers to imaging and rights service provision
5.3.1 Rights services and unauthorised image use
The unauthorised use of digital images is a concern for museums, both in terms of how they prevent this from happening and in terms of the reduced control and revenue it represents. All the museums interviewed reported knowledge of unauthorised use of their digital images; they also reported that copyright and licensing rules were complicated and often difficult to apply in practice. This section reflects the concerns and opinions of those services interviewed and does not represent a legal judgement either by them or the author; this is an issue heavily dependant upon precedent and the individual circumstances of each case.
Museums deal with artworks that are both within copyright and in the public domain. When an artwork is within copyright those rights are most usually held by the artist or some other 3rd party. The museum has to get permission from the copyright owner for their own use and may also look to protect those 3rd

Simon Tanner www.kcl.ac.uk/kdcs/
August 2004 30
©Tanner 2004
party rights from misuse to retain the goodwill of the artist and their estates. In these circumstances, where the work is clearly in copyright, declaring an unauthorised use has occurred is more straightforward than with an image of an artwork in the public domain. The line between unauthorised use against license and copyright infringement is blurred where the content of a digital image may be from an artwork that is now out of copyright. The digital image may, in many cases, be the property of the museum whether the content is copyrighted or not. There may, however, be circumstances where, despite the fact that the original item is out of copyright and the museum has created a digital image of it, that no copyright resides in that digital image. This can occur when a court decides that there was insufficient skill or originality involved in creating the image14. When a museum believes it does own copyright to an image, it can exercise a monopoly on use of the digital image by licensing agreements authorising certain uses. Unauthorised use is then any use which falls outside of that defined in the license.
The question remains as to what a museum can do about unauthorised use? Only 10% of the museums interviewed actively chased unauthorised use and did spot checks to look online and in publications for examples of misuse. The remaining museums mainly do not chase unauthorised use (unless particularly obvious or egregious) due to a lack of staff resources.
Most museums will send a letter from the General Counsel’s office for blatant misuse. For lesser abuses the museum may look for retro-payment of the licensing fee, possibly order a cease and desist on the unauthorised use or just aim for a proper credit of the museum. However, such letters are frequently ignored by the infringers and the museums themselves never expressed a great sense of optimism about chasing infringement once it has happened. Many museums operate an Errant List and find this useful for closing off further abuses or controlling the transaction more closely. A large number of the museums interviewed also stated that none would be prepared to litigate even in clear cut cases and this may have much to do with the blurred lines between unauthorised uses against the license as opposed to a strict breach of copyright.
There is a distinct sense among many that control of the image use is an important duty to ensure the artist and their art work is treated with due respect and that the museum gains proper credit. In some of the services interviewed, unauthorised use against licence agreement creates a sense of being beleaguered. Rights services are constantly bombarded (sometimes by colleagues from within their own institution) by counter claims about the copyright law and how it doesn’t apply to that individual, that scholarly publisher or corporation. Knowledge of copyright is inconsistent, often misrepresented or complicated to apply and thus leads rights services to be more careful and conservative in their approach.
Some other key barriers to effective rights management were reported to be:
The museum risks being exposed where 3rd party rights are concerned
Payment in advance is necessary to ensure licensing is properly managed and this delays service provision
14 Reference to the following legal case is recommended: BRIDGEMAN ART LIBRARY, LTD. v. COREL CORP., 36 F. Supp. 2d 191 (S.D.N.Y. 1999) The RARIN site contains a useful explanation from the April 1999 American Association of Museums Annual Meeting by Barry G. Szczesny, AAM Government Affairs Counsel www.panix.com/~squigle/rarin/corel2.html

Simon Tanner www.kcl.ac.uk/kdcs/
August 2004 31
©Tanner 2004
There are not enough resources and staff – is time consuming
Lack of understanding of copyright within museum staff in general
Acting as agents or intermediaries for artists is demanding and it is important to maintain a good relationship with the artists
Quote: “have to be cleaner than clean as seen as a rich target for litigation”
The high levels of antagonism experienced from clients
An assumption that museums should provide images for free – even for commercial uses
Making legal judgements are demanding
Quality of use – if the museum is not happy with the quality of publication reproduction then may have to refuse permission and this is never popular
Artists and their estates can be very aggressive and commercially minded. Mostly this is not a problem but occasionally dealing with artists’ estates is very demanding, difficult and time consuming. One interviewee was so frustrated by these issues they stated, “there are three types of artists - the alive, the dead and the good and dead”.
One museum made a statement which encompasses many of the sentiments expressed by other museums:
Copyright law is complicated and sometimes conflicting and in many museums licensing is the responsibility of staff (like me) who have no prior knowledge of these issues and are learning as they go. The prevailing view at our museum for many years was that because we owned the artwork, we also own the copyright. Although our overall attitude has changed, it is still difficult to get other staff members to understand and take copyright seriously.
5.3.2 Fair Use
Fair use is obviously a contentious issue and remains one with some leeway as to its definition and application. The interviewees were asked whether the museum would chase unauthorized educational use of public domain works or is this "fair use".
90%+ of respondents felt that it is probably fair use as long as the museum is properly credited. All would defend educational use as a good thing, but many interviewees were concerned about losing control over the way the artwork might be depicted and also losing the credit line. All felt that text book uses are commercial use and thus not fair use in any circumstances.
One museum stated that they do not chase unauthorized educational use but feel it is definitely not fair use. Another museum stated that if used in a publication then it doesn’t matter if it is educational or not; they would be chased and would not be considered fair use.
5.3.3 Barriers to imaging and rights service provision
The museums reported a wide range of barriers and downsides to providing imaging and right services over and above those mentioned previously:
Lack of staff and resources
Lack of investment in equipment and infrastructure
Creating, managing and storing digital images is extremely demanding

Simon Tanner www.kcl.ac.uk/kdcs/
August 2004 32
©Tanner 2004
Delivering high volumes of digital images at high fidelity is challenging
Validation of metadata for descriptions and images must be good before putting resources online
Lack of adequate studio space for imaging
Digital equipment lifecycle is short – the need to buy more equipment more frequently is a large and continual investment. Although analogue film costs rise year by year, the cost of maintaining a digital studio is still higher due to equipment obsolescence
Technology reliability is an issue today that imaging services did not previously have to face with traditional analogue photography
Lack of technical infrastructure and current infrastructure is inefficient
A negative perception change of the imaging services now they are using digital imaging. Due to the ubiquity of digital cameras and the mistaken assumption that if it digital it must be easier and therefore less skilful.
Lack of web presence
Need for better online resources to enable researchers to find images on their own
Providing a speedy service is difficult to achieve but is demanded more often as digital makes it possible
Inherent difficulty of where to place the rights and reproductions within the museum management structure
Payment gathering is onerous and sometimes difficult
Gaining curatorial buy-in and support to the services
Keeping up with demand is challenging
Services are not seen as a priority for the museum
Keeping up-to-date with the law and the need to update licenses frequently
5.4 Business practices for imaging and rights Having laid out the overall profile and the processes of the services, it is possible to focus on the business practices such as volume of sales, revenue gained, what is charged, to whom and how the revenue is assigned and costs recouped.
5.4.1 Volume of sales and revenue gained
As stated in detail earlier (5.2.2), 80% of services process far less than 1,000 transactions per year. Commercial transactions account for an average of 31% of the total volume but are responsible for far higher amounts of revenue. One museum reported that commercial activity accounted for 84% of the total revenue from 40% of the transactions. In another example, commercial revenue was 90% of the total from 53% of transactions.
Most of the transactions are for non-profit and educational use and the majority (88%) of scholarly and educational use is for publication use.
The revenue recorded for both image and rights activities (from 14 responses):
< $2,500 = 14%
< $5,000 = 7%

Simon Tanner www.kcl.ac.uk/kdcs/
August 2004 33
©Tanner 2004
< $10,000 = 7%
< $50,000 = 28%
< $100,000 = 7%
> $100,000 = 28%
Most of the museums report that they have a top 10 list of images that attract the most attention. In one example, the top 100 used images account for 60% of all requests and >90% of revenue. In another example, the top 10 images were used 30 times more than next 90 images in their top 100 list.
The actual amount of revenue raised appears to be irrelevant as an indicator of potential profitability. None of the museums interviewed claimed to make any significant surplus or profits against their expenditure. Plus, how revenue is measured and assigned within the museum means that some services are recording retail rights as part of their revenue, but most do not. Thus, the higher revenue figures should not be viewed by other museums with any sense of competition or jealousy since the higher revenues are most likely a result of a higher number of transactions. Thus, if museums seek to compete about image sales they should look to compete on number of transactions rather than amount of revenue. As will be shown later in this report, the volume of use of a museums collection is actually more important than the profitability of the transactions.
5.4.2 Pricing structures
The first factor to consider in the pricing structures investigated is that the majority of service use is internal. Thus, the services would exist whether they served external consumers or not. Only 2 of the interviewees reported an internal market where service costs were charged to the requesting department. In one other case the requesting department would be informed of the costs of the service provided but no actual money was moved across departments (a virtual internal market). In this way the financial value of the service was made clear with each transaction.
There are two price tags to explore for external consumers. These are the asset fee paid for the actual image itself, whether a transparency loan or provision of a digital file. The second price is that quoted to licence the intended use. The price for the right to use the image is generally the higher of the two and is frequently negotiated on a case by case basis. Asset fees are generally publicly available, but many museums often closely guard rights fees. This study did not explore the actual amounts charged for rights use - only the reasons for the pricing structure. There is good guidance information contained in the RARIN report15 for those interested in specific prices. Many museums charge very little or waive the rights fees completely for scholarly, educational or non-profit uses, and thus the rights pricing is aimed mainly at the commercial sector or at scholarly publishing.
Asset fee pricing is usually set according to market prices and not the cost of service provision. The one exception is new photography, which is either charged wholly or in part to external consumers.
In most cases interviewed there was no active measurement or accounting of the cost of service provision and the respondents were not able to break down
15 2003-4 RARIN Rights and Reproductions Survey http://www.panix.com/~squigle/rarin/RARINSurveyannounce.html

Simon Tanner www.kcl.ac.uk/kdcs/
August 2004 34
©Tanner 2004
the price tag into component cost elements. Those few (3) that did measure the cost of creation then generally ignored this information as they were differentiating to keep prices low for education and scholars.
For rights and reproduction fees, 90% of those interviewed set their prices by direct reference to the market. Most compared prices with the RARIN 2003-4 or Isabella Stewart Gardner Museum 1995 surveys or through informal surveys of other museums. A couple of museums simply reused a neighbouring museum’s price structure with their permission rather than construct their own. Most services made other minor adjustments to enable some direct visible costs (like materials, postage) to be recouped. Only one made very open reference to prices charged by commercial agents as they sought to emulate the French museum model of charging high commercial rates to enable almost zero cost scholarly rates.
By market pricing, museums are making decisions about where they would like to be positioned on the scale of prices charged in the marketplace. Many factors drive this decision – would lowering prices drive more sales; higher prices might convey more prestige or efficiency; a mid price might show fairness? These motivating issues are explored in more detail in section 5.5. Most of the museums claimed to be pricing towards the bottom or middle of the market price range. What was not found in the interviews was a museum that perceived itself as leading the market price or defining the upper price limits (whatever other museums may think of their pricing). It is thus difficult to see how prices change over time to any significant degree if the norm is to aim at the mid-market price and everyone is basing their price on the market.
5.4.3 Why differentiate in pricing?
The reasons behind the differential charging by museums are wholly altruistic and in favour of non-profit and scholarly use. Notably all consider text books to be a commercial and not a non-profit educational use (as the publishers frequently claim) due to the very high print runs and intent of the publishers to profit from their sale. Reasons for differential charging given included:
To help scholars and education
Quote: to “profit from the profit made by commercial uses”
Quote: it’s “same principle as the graduated income tax”
To focus upon the integrity of the art and thus the museum wants education to use the best possible image
To use commercial rates to subsidise service costs and enable non-profit rates to be lower
Museums have not been forced into differential pricing by the market; they have actively sought to cater to this market at great financial cost to themselves. This is part of their remit to reach out to their communities and, as shown previously, the provision of images does serve the core museum mission. However, it must be reiterated that museums do not have to do this or at least do not have to be so generous in their differentiation - even for those with non-profit or public governance. When asked why they charge at all for non-profit use, over half stated that they don’t charge for rights most of the time (depending on the print run) and ask for just the asset fee to cover direct costs and two copies of the publication for the museum.
It is slightly sad to report that most of the service providers felt that scholars, education and other non-profit consumers generally do not show the slightest appreciation of the discounts or the services provided. There is clearly a lot of

Simon Tanner www.kcl.ac.uk/kdcs/
August 2004 35
©Tanner 2004
aggravation surrounding the charging of money for images, even if just for asset fees, and museum services spend an imbalanced amount of time servicing requests that will not generate revenue and gain little thanks for their efforts (either externally or internally). One museum with a perceived reputation for commercial acuity has a strict policy of treating all requests the same whether commercial or non-profit and will spend as much time serving a scholarly request as a commercial request even if that will generate less than 5% the revenue.
Museums appear to be caught between their desire to promote scholarly and educational use of the collections and the pressure to tap into previously unrealized sources of revenue and to recoup service costs.
5.4.4 Assignment of revenue
The interviews found that the way revenue is assigned is a key indicator of the importance the museum places upon the service and is also an accurate measure of the likelihood of recouping service costs.
In >60% of museums interviewed the revenue received from rights and reproductions sales is assigned outside of the departments delivering the services. It is usually funnelled into the general museum operating budget. In most of these cases it will show up as a budget line item, but it cannot be used or accessed. In these cases, should an internal department (such as publications, retail or public relations) have images provided and rights negotiated on their behalf then it is highly unlikely that the serving department will receive assignment or credit for any revenue directly generated. So although this system is good in that it credits achievement, it does so only partially.
For the remaining interviewed museums (<40%) the revenue is assigned directly back to the department providing the services. The largest revenue earners were those museums where money was assigned directly back to the service department to be offset or recouped against costs. Those museums that operated an internal market (even if virtual) were most likely to recoup the most against costs although no-one actually appeared to recoup all costs.
This is a significant result and shows that the assignment of revenue back to the department/unit is the key to service efficiency. It suggests that having a distinct department that acts as a centralised servicing entity with its own costs and revenue streams is the most likely to generate more transactions, more revenue and to recoup more costs.
5.4.5 Recouping costs
Everyone interviewed wants to recoup costs but almost none claimed to actually achieve or expected to achieve this. Internal transactions often account for 50-75% of service activity and are usually uncharged. Thus, recouping costs from external transactions usually only offsets direct and visible cost items such as contract photography or materials. Commercial transactions are therefore vital to offset the costs of providing discounted services to education and non-profit sectors.
Even those services that claimed to recoup full costs generally did not account fully for salary costs or overhead expenses. Many had gained their equipment through special funding and thus equipment was again not a direct cost item in relation to the price tag offered.
There is pressure from senior museum management for all aspects of the museum to make more money. However, the way that money gained by more

Simon Tanner www.kcl.ac.uk/kdcs/
August 2004 36
©Tanner 2004
commercial aspects of the museum is assigned means that some departments are credited for revenue streams at the expense of others. This is important in defining the political and power structures within a museum; rights and reproductions seem to be poorly served in some of the museums interviewed. The RARIN report also comments upon this dichotomy of responsibility and power: “the independence of this position [rights and reproduction], along with the power to make decisions often contradicts its status on the museum totem pole”16.
Without a clearly understood museum-wide rights policy, a centralised unit with direct access to senior managerial structures and careful financial planning, then recouping costs is not feasible.
5.5 Pricing: motivations and policies What motivates most pricing structures is the need to recoup costs and yet the pricing and management policies in place actively prevent that from being possible. This was further investigated and the interviewees were asked why the imaging and rights services existed and to what purpose.
Most felt the services existed to provide images for internal museum needs such as exhibitions, education, collection management, publications and retail activities. In other words, even if there were no external consumers the service would still need to exist.
To meet the demand from external publishers was the next most popular response and is the main externally oriented activity.
To promote the museum and use of its collections was frequently stated. The Internet is seen as of increasing importance and one museum commented “if we do not have a presence on the web, then the institution does not exist to a certain extent”.
To protect copyright as described in section 5.3.1 is a key responsibility for these services.
To support collections management is an important role and one that was generally understated in relation to the actual effort made in this arena.
To control the way the art works are represented was also a key underlying role. As eloquently stated by one interviewee “we want the best possible image of our object to be available for reproduction. We want people to come and see our collections and they wont come if the images they see are ugly”.
The results are an interesting contrast to those given for the primary driving factors found in the survey. In the survey (see section 4.5) the key driving factors for service existence, with 60% of responses, are due to external factors such as serving publishers or promoting the museum collection. Serving the museum’s needs came in equal fourth place in the survey but in all the museums interviewed it is clear that providing services to the museum is the primary reason for the service to exist. It also explains the pricing structure to a certain extent. While there is no internal market and external requests are a smaller proportion of activity then the service itself becomes a sunk cost for the museum.
16 2003-4 RARIN Rights and Reproductions Survey, page 49. http://www.panix.com/~squigle/rarin/RARINSurveyannounce.html

Simon Tanner www.kcl.ac.uk/kdcs/
August 2004 37
©Tanner 2004
5.5.1 Pricing motivation
What motivates pricing is clearly influenced by many factors outside of financial balance sheets and profits. Many of the museum staff interviewed demonstrated a great commitment within the services and from their immediate line management, but the overall impression was that the museum as a whole viewed the sale of images to 3rd parties as a necessary evil and not worthy of formalized policies, management structures and a unified museum-wide approach. Rights activities in particular are given contradictory messages: to make collections widely available; to protect the museum and restrict use; to make money; to not charge too much.
In the above context it is not surprising that the main motivations driving pricing policy are varied. The following motivations behind pricing were given:
to make images affordable and accessible
to recoup direct costs and to offset some service costs
to charge those who can afford it as much as the market can bear
to make it easy to use the collection
money is not highly important as the service exists for internal reasons
What provides a strong insight into motivations is to question why it is worth charging anything at all for non-profit use. Although differential pricing keeps prices affordable for non-profit use there is also a level at which it costs more to administer than the payment received. In which case, why charge anything? Many of the interviewees were surprised by the question and had never queried their own charging policy; pricing was just something traditionally set or inherited. The reasons given for charging for non-profit use were:
avoids over use of service and acts as a natural break
many waive all rights fees but have to charge for visible costs
the service must be seen to make some money for political reasons, even if it is not profitable
some revise prices yearly to maximise academic levels of use
Quotes from interviewees on this subject:
“image quality is the foremost concern, though we hope to make some profit”
“do not wish to restrict use – have evidence to suggest that price does effect the amount of use”
“charges act as a natural break on the activity level”
“review the market prices and charge slightly lower to encourage more use”
prices recognise that “scholars and educational use deserve a lower barrier to access to images”
“to be fair but to be part of the market”
“providing images helps educate the public and reach beyond the museum”
“don’t like to charge people money, it makes me nervous”
Simon Tanner www.kcl.ac.uk/kdcs/
August 2004 38
©Tanner 2004
Case Study 3: Establishing pricing and policy
One notable museum had an excellent managerial approach to establishing pricing and policy by involving all stakeholders across the whole museum. This is a major public museum with an operating budget, attendance and staff levels that are similar to the average across the survey; the collection contains over 40,000 works and processes between 600 and 700 transactions per year.
The pricing structure was gained through a collaborative process that included the entire museum. There was a working group tasked with Rights and Reproductions with representation from all museum departments and stakeholders. This group developed a pricing structure for materials and permissions. They established common outline procedures, workflow and processes plus made policy decisions to define what types of reproduction would be allowed and what types denied.
This work ensured a cohesive approach across all parties involved. The working group started from the existing fee structures, looked at comparable institutions and their fees, and came to consensus about what worked for the museum as a whole. Decisions and new pricing determined as a result of this group’s work went into affect about 5 years ago and remain in affect now.
The services are evaluated on a monthly and annual basis to ensure they remain on track and continue to deliver efficient and effective services. The manager reviews:
what was reproduced in a given year
the number of transactions per year
the revenue versus expenses per year
how many objects were photographed
what percentage of the collection has been photographed and how that relates to the number of staff involved in new photography and image processing
total number of new images added to the collections database and the website
5.5.2 Success and evaluation
All the interviewees were asked whether their services were evaluated within the museum. Many individuals have appraisals, but the services themselves are rarely evaluated in any formal or structured manner. The only museum that reported to the study formal evaluation is described in Case Study 3 above. Individuals running services do self evaluate to find ways to improve services and educate colleagues about images and rights management. The difficulty with evaluating a service is there needs to be enough management information to enable a proper assessment. Those museums that set out with good transaction recording mechanisms and kept detailed information were better able to do analysis later and have an easier time of evaluating achievement and managing change.
Most of the museums also did not work to fixed targets since the services are generally a sunk cost. This leads to an annual budget mentality that suggests success is defined as spending less or the same as last year and raising at least the same revenue. Very few reported management criteria or goals that could be referenced to demonstrate success. The services were quite self analytical and defined success for themselves in a variety of terms as follows:
Simon Tanner www.kcl.ac.uk/kdcs/
August 2004 39
©Tanner 2004
the amount of new images created
whether the museum gained suitable credit on its images
has the service simply remaining available
improved service efficiency in terms of promptness in meeting demands
increased number of transactions received and processed
increased revenue against previous year
The lack of formal evaluation or success criteria again indicates the level of senior management interest and commitment to imaging and rights services. To move beyond a service with very localized priorities and that serves the core mission of the museum, can best be achieved with formal evaluation leading to achievable targets and success criteria.
5.6 The Future When looking to the future the services expressed the following desires and plans:
Most want to increase the amount of images available or to improve access to images through the museum website.
Many also want to get more of their application forms and processes online to streamline requests and workflows.
A few (<5) want to move towards print on demand services
Many who are currently using a mixed model for imaging want to move to a totally digital format imaging service but funds to invest in technology is scarce.
When asked where the funding for future developments and service improvements would come from, over 2/3 see external grants and project-based funding as the only way develop technology and services. The remainder will look to some internal museum money, revenue from sales and specific fundraising to try to improve services.
Simon Tanner www.kcl.ac.uk/kdcs/
August 2004 40
©Tanner 2004
6 Final Analysis and Conclusions 6.1 Motivations and objectives
It is clear from the results of this study that the level of revenue raised by museums through imaging and rights is small relative to the overall revenue earning capacity of the museum from retail, ticket sales, membership and fundraising. A museum does not carry out image creation or rights and reproduction activity because of its profitability. These services exist because of the internal need for image creation and rights clearance matching up with an external desire to publish and use museum images. The need to promote the museum collections, to gain appropriate credit and to honour the artist and their work are the real driving factors that underlie these services.
Most of these services are sunk costs to their museums that exist on budgets set according to the internal need for services and augmented with some external commercial and non-profit based usage. There are notable exceptions, but these museums do not represent the norm found in the survey or the interviews; and even here the success of the rights revenue is often based upon a small number (between 10 and 50) works which are iconic either to art history or the public sensibility.
The main financial goal of all the services interviewed is to make enough money to offset direct and visible costs like materials and new photography. However tempting it is for museums to look upon colleagues with 6 figure revenues with envy this would be a mistake. All those interviewed were spending as much or more money to provide services as they received in revenue and a high revenue generally represents large numbers of transactions or new imaging. If museums wish to compete in this market they should aim for more transactions that recoup a higher level of service costs as a measure of success not necessarily more illusory profit.
6.2 Centralizing the rights function
The rights function has much leeway to make decisions, set prices and negotiate for the museum. The job functions that were discovered in the survey and interview for the rights activity were many and various and are generally found on a lower tier of the remuneration and management scale. The activity seems highly distributed with responsibility for image production, management and sales usually handled by different departments, each with different goals and objectives, and ultimately, each answering to different upper level management directives. For example, photography often is associated with collections and curatorial, while merchandising falls under the umbrella of marketing and public relations, while rights and licensing might fall under the legal council's domain or publications. In many of the museums interviewed any or all of the above departments would feel it was within their remit to cede rights for external use or believe they didn’t have to clear rights for their internal purposes. Without some type of faceted, collective vision, the situation will continue to function within the chaotic fashion it currently exists. This exposes the museum to a large and continued risk of litigation and loss of artists’ good will if 3rd party rights are not respected or misunderstood in this haphazard model.
The imaging and rights functions in some museums feel they are a Cinderella service - essential but not especially valued for what they achieve. There is a clear reason for this in analysing the museums key audiences in relation to the imaging or rights function. The museums’ core audience is generally the local

Simon Tanner www.kcl.ac.uk/kdcs/
August 2004 41
©Tanner 2004
community, tourists and the general public. Imaging and rights services are thus always placed at least one step distant from the museums primary audience. These services are mainly serving intermediaries, whether museum curators or publishers, who form the first line of attention from the museum’s core audience. Most imaging and rights services did not receive the credit they deserved for enabling the wide dissemination, retailing and publication of the collection because of this disconnect between service and audience.
The study provides conclusive evidence that more revenue is raised by centralising the rights service function. Only those museums which have centralised were able to manage the processes and policies well enough to raise sufficient revenue to significantly offset costs.
6.3 Assignment of revenue
The largest revenue earners were those museums where money was assigned directly back to the service department to be offset or recouped against costs. Those museums which operated an internal market (even if virtual) were most likely to recoup the most against costs, even though no-one actually appeared to recoup all costs. This is a significant result and shows that the assignment of revenue back to the department/unit is the key to service efficiency. It suggests that having a distinct department that acts as a centralised servicing entity with its own costs and revenue streams is the most likely to generate more transactions, more revenue and to recoup more costs.
6.4 Differential charges and the consumer
The study was also suggestive that the primary beneficiaries of differential pricing were not particularly grateful for this benefit and tend towards expecting free images from museums. As far as can be gathered in this report, the museums interviewed had no obligation to provide differential pricing and even if they did feel obliged there is no requirement to make those differentials so deeply advantageous for the consumer. Museums have shown a strong instinct for making images available at a low price for education, scholarly and other non-profit use and only ask for a proper credit and respect to the artwork in return.
In all business transactions there are responsibilities on both sides of the contract but there seems to be scant respect from the consumer with regard to museums non-profit activities. Images are widely and unnecessarily pirated and used without proper credit; consumers continually try to circumvent the rights function or to expend inordinate amount of time negotiating a $5 reduction on a $20 price. The consumer seems to forget that although their governance might be non-profit their use of museum images is profitable even if only in the low profile terms of enhancing scholarly reputations, gaining additional research grants, added value to student study or assisting career progression. The consumer seems to forget that differential pricing is not their right but a privilege conveyed by the museum for their own ends.
Museums are partly responsible for this problem themselves. Some interviewees saw other museums as the most difficult to negotiate with and also as among the most likely to misuse images with permission. Museums also are not acting in a centralized enough way with full managerial support from the top of the museum to prevent the rights function being subverted either externally or internally. Finally, the lack of business planning and clear cost accounting for the actual cost of service provision makes it more difficult to argue the moral high ground that museums undoubtedly possess.
Simon Tanner www.kcl.ac.uk/kdcs/
August 2004 42
©Tanner 2004
6.5 Generating a price
Although the interview process went to great lengths to breakdown the price tag offered for asset fees or for rights activities the museums interviewed did not often know this information. The pricing generally had not been set with the costs of service provision in mind. Where it had been set that way the costs were usually only direct or visible costs items and not inclusive of all the cost factors involved.
Most museums based their costs on the perceived market rate. This was generally gained through informal surveys of neighbouring museums, reference to other surveys such as the RARIN and IGSM reports and also through anecdotal evidence gathered at conferences etc. Some just reuse other museums price sheets (mostly with permission but not always). Everyone is carrying out some form of market adjustment to their prices to make them advantageous to their priorities, such as to sell more images to publishers, text book or non-profit uses.
What this approach to setting prices leads to is a lot of suspicion that some museums are taking advantage of the market and others are being disadvantaged as a result. There is little but anecdotal evidence for this in actuality, and the interviews show very consistent pricing and priorities across a wide range of museum governance, type and size. If museums were able to make their prices more visibly relative to their costs for service provision, then much of this suspicion would be alleviated.
6.6 Digital divide
The museums are more defined by their digital activity and achievement than by any other measure. The large private non-profit museums are generally far in advance of other museums in terms of their adoption of direct digital capture techniques. This leads to a differing set of service costs, sense of acceptable image quality and priorities, which can be problematic in museum-to-museum transactions. Some can find their own images considered substandard by another museum, and some might find their services are perceived as expensive by others. This digital divide is likely to get wider in the next 2-3 years before contracting again as more museums move to a totally direct digital capture method.
6.7 The commitment gap
All of the staff interviewed in this study showed the highest levels of commitment and professionalism. Unfortunately, there is a demonstrable commitment gap between some of the museums and these staff. They are placed in a position of great responsibility as the gatekeeper of the museums rights and reproductions, but remunerated often in the lower tier and may be positioned within a variety of departments. Market forces define remuneration so that in itself is not the point – the issue is that it represents the museums overall lack of interest and commitment to this activity and the lack of actual power within the museum chain of command that is conveyed to the individuals who carry so much responsibility. A frequent anecdote told by rights managers in the interviews is of an external commercial consumer going directly to a senior member of staff and that senior member of staff allowing the rights to go for free without thinking about the licensing implications or the foregone revenue.
The recommendations of this report will detail the changes needed to rectify this circumstance.
Simon Tanner www.kcl.ac.uk/kdcs/
August 2004 43
©Tanner 2004
7 A Way Forward and Recommendations In the introduction to this report the proposition was put forward that the transition to digitized collections provides a new set of opportunities to share, aggregate and link content and resources across institutional boundaries. For education, especially for K-12 and college level, this sort of resource availability would be of great and lasting benefit.
This study has identified the perceived barriers of revenue, licensing and control. It seems clear that control is the most important factor: crediting and promoting the host museum and honouring the artist and their work are the non-negotiable and noble goals of art museums.
This report now makes a set of recommendations that are hoped to be both practical and strategic to benefit the community as a whole.
7.1 Defining Museum Priorities It is recommended that museums review their priorities in providing imaging and rights services using this report as a guide. This would ensure that the whole museum has a clear understanding of the purpose of the services and the way they link to the museums mission.
It is also important to have a better understanding of the museums priorities to enable proper management structures to be put in place. The priorities it is recommended that need to be considered most carefully are:
Is control over the way an image of an artwork owned by the museum used, represented and credited the most important priority to the museum?
Is the fidelity of the image to the original artwork as important a priority as controlling its use?
Is promotion of the museums collections as important a priority?
Does scholarly and educational use of an artwork (especially one in the public domain) ever contradict or supersede the need to control its representation and use?
Does serving the internal needs of the museum ever contradict or supersede the need to control the representation of artworks?
Does recouping service costs or making a surplus ever contradict or supersede the need for control? Is there a sum of money at which the museum would relax such control?
Are providing high fidelity images with an appropriate license for the museum and the wider communities use more important than how much the service costs to run?
These are very hard questions to ask at the museum policy level but the answers will provide a ranked set of priorities that will help a museum to set policy and to think strategically about an issue that is sometimes relegated to a backwater.
Museums are recommended to consider this activity in a holistic, museum-wide context as the intellectual, information and visual assets contained within digital and photographic images are not just about publications but about how the museum interacts with its whole audience.

Simon Tanner www.kcl.ac.uk/kdcs/
August 2004 44
©Tanner 2004
7.2 Management Structures The conclusions from this study are very clear about the need to centralise the rights service function and to ensure the museum management is structured to ensure that all rights activity is routed through this function. Doing this will increase revenue and reduce the litigation exposure for the museum.
It would not be enough, however, to just place the responsibility into the hands of a central unit or one person – this action should be backed up with museum-wide policy to make it functionally impossible for any other part of the museum (at whatever level of seniority) to give or license rights. Just as Human Resources departments are responsible for deploying the organisation’s human assets, so it is recommended that the rights function be responsible for the use and licensing of the intellectual, information and visual assets.
7.3 Make the Rights Activity Professional The consequence of the above recommendation is to visibly vest responsibility in a centralized function. This responsibility has previously been hidden or unappreciated in some museums and as such the rights activity is often given to a lower-tiered position within the museum.
It is recommended that the activity be given a full-time position (or more depending upon transaction levels) that is considered as a professional activity in its own right rather than an adjunct to any other function. Training and qualifications should be encouraged and sought for this position wherever possible.
It is recommended that the rights position be required to operate and plan in a business-like fashion, to be evaluated and have measurable success criteria. It will be an even more demanding position to hold.
What is also needed is further understanding within museums of the implications of rights and reproductions. A training programme for museum staff (possibly at induction) that presents the rights and reproduction as an integral part of the museums function is recommended.
7.4 Revenue Assignment Revenue should, wherever possible, be assigned back to the department that was responsible for making the revenue possible for the museum. This will provide incentives to increase the number of transactions processed and to proactively seek out further opportunities for image use. New photography costs should be returned to the photographic department. Revenue from licensing should be returned to the rights function, which in turn should pass on a proportion to the imaging function to cover the image creation costs. If revenue is assigned accurately then the respective departments have a much better chance of demonstrably recouping more service costs.
An internal market (even just a virtual one, where costs are visible but uncharged to the museum staff) ensures a higher level of efficiency and reduces wasteful make-work activities that can sometimes occur in sunk cost activities like photography or imaging.
7.5 Pricing Fixing prices across the museum community is not the task of this report. However, it is clear that a better way for museums to account for their costs

Simon Tanner www.kcl.ac.uk/kdcs/
August 2004 45
©Tanner 2004
and to charge accordingly is needed for the majority of museums with lower than 500 transactions per year. Fixing prices according to the market does not allow for an appropriate amount to be recouped to cover to any significant extent the costs of service provision. Pricing where the cost of service provision has not been defined is unlikely to ever recoup service costs.
The following formula provides a straightforward and effective means of pricing. This simplifies into one price the asset and rights fees and makes differentials for non-profit or scholarly use easier to apply.
C x V x R x NP x D = price offered consumer
C = the actual cost of providing the service in dollars. This should include:
the cost of imaging data or photograph storage curatorial time getting object to and from studio the averaged cost of staff time for a transaction overheads depreciation materials management costs.
This is the only figure that once set has to be reviewed and updated regularly; all the other values in the formula can remain fixed unless museum policy changes.
V = the viewer figure or print run size. This multiplier is given whole number values according to the amount of use of the image. If the image is going to be in a print run or viewed less than 100 times then the multiplier could be set to 1. Increments according to museum policy can then be set to multiply the base C value according to usage. Other increments for multiple languages, etc. could be introduced if desired.
R = the revenue figure. This multiplier is given an incremental number according to the revenue that the use will generate. If it will generate no revenue then the value would be 0.5 to discount the consumer cost. If the use will generate more revenue then the figure can incrementally rise in line with museum policy to multiply the price accordingly. This provides a figure that can easily be applied for commercial uses and is the item that the rights function would negotiate in commercial transactions to agree the point on the scale at which the license is set.
NP = the non-profit value. If the transaction is with a commercial entity then this figure is set to 1 and offers no benefit. However, if the requestor is from a non-profit organisation then any figure set by the museum at less than 1 will deliver a discount for non-profit use. The recommended level for this discount is 0.5.
D = the discount value. For certain types of consumer a discount may be offered over and above any other factor already set. Any figure less than 1 would deliver a benefit. Scholarly and educational use or another museum may receive the highest discount (0.25 or 0.5). Text book publishers, although commercial in nature, might be given a small discount (e.g. 0.8) to represent the beneficial market to whom they sell books.
The key to applying this formula is that the value C must represent the museums best estimate of the actual cost of service provision. If the museum is willing to put in the effort (using standard business techniques) to work out the actual cost of service provision, this would enable a figure to be accurately set and improve considerably the chances of recouping service costs. This

Simon Tanner www.kcl.ac.uk/kdcs/
August 2004 46
©Tanner 2004
report recommends museums use the Business Planning for Cultural Heritage Institutions 16 report as an effective method to improve business planning and to providing a full cost accounting to formulate the C value.
There is one further advantage to making visible the actual costs of service provision. In negotiating with non-profit and educational consumers, if one can point to the actual cost of providing the service and then explain that the cost to their community is considerably lower than the cost of provision as a matter of museum policy, it gives the moral high ground to the museum and reduces the potential aggravation experienced in dealing with this consumer group.
Case Study 4: Applying the pricing formula
The above formula is derived from the method of setting prices devised and used by Alisa Schwartz17 Assistant Director, Imaging at The Art Institute of Chicago18. With her kind permission this report reproduces an example of how the pricing model works in practise.
1 0-100 no revenue 0.52 100-10k breakeven 24 10k-100k moderate revenue 46 100-500k significant revenue 87 500k+ very significant revenue 12
Base Price
Viewer Multiple Revenue Factor
Academic Discount
NFP Discount TOTAL
indy film $150 2 2 1 1 $600 commercial large print run $150 7 2 1 1 $2,100 annual report, public company $150 1 2 1 1 $300
book interior $150 2 2 1 1 $600
aol disc $150 7 12 1 1 $12,600
museum $150 4 0.5 0.5 0.5 $75 school/classroom presentation $150 1 0.5 0.5 0.5 $19 newspaper - lower base cost $100 6 0.5 0.5 1 $150 exhibit of reproductions $150 6 8 1 1 $7,200 large size lustre/matte for home use $150 1 0.5 1 1 $75
Academic / museum / scholar 0.5
non profit 0.5sa Sc a t 00
[email protected] business 1 business 1
Viewer Multiple Revenue Factors
The base price referenced here does not include all of the costs factors indicated as being required to set value C in the above formula. What this case
16 Business Planning for Cultural Heritage Institutions: A framework and resource guide to assist cultural heritage institutions with business planning for sustainability of digital asset management programs by Liz Bishoff and Nancy Allen. January 2004, CLIR pub124 www.clir.org/pubs/reports/pub124/contents.html 17 Contact: [email protected] 18 www.artic.edu/aic/rights

Simon Tanner www.kcl.ac.uk/kdcs/
August 2004 47
©Tanner 2004
study example does show is the principle with non-profit uses being heavily discounted and various types of commercial use being priced at commercially competitive rates.
7.6 Digital Imaging The work of the Direct Digital Image Capture of Cultural Heritage Research Program19 should be referenced as the most important source of recommendations and advice on digital imaging for American Museums. The project concentrates on practices of digital photography as they are used for reproducing and documenting paintings and 3D works.
This report has some recommendations focusing upon those museums found within the survey and interviews, who are using traditional photography and wish to transition to providing digital images. A range of concern was expressed that only those with direct digital capture using high end digital camera equipment could enter the digital arena and be proud of their activity. This perception is considered erroneous and might prevent initiatives to move to digital.
Some thoughts and recommendations:
It is recommended that high specification digital images be provided by museums as this will enhance the variety and ease of use.
Direct digital capture should be done with high end cameras.
Those not using direct digital capture can still use their high end traditional photography to create excellent analogue 4x5 transparencies from which digitization can take place.
Digitization from 4x5 transparencies using digital drum scanner technologies can produce an image with pixel dimensions, fidelity and colour correctness to rival direct digital capture systems. However, most flatbed scanners are not capable of providing this equivalency from transparencies.
Although time, materials and scanning costs make this option costly; in the medium term (3-4 years) this is far more cost efficient for a small collection or museum with low image transaction numbers than direct digital capture with its fast equipment depreciation and high start up costs.
It is recommended that waiting another 3-5 years before moving to a totally direct digital capture mechanism is a viable strategy for many museums.
It is not recommended to scan from 35mm duplicates or old stock for publication purposes, as this will not provide an equivalent quality.
7.7 Future Funding for Digital External funding will be essential to the expansion of digital activities in museums. There is clearly not enough revenue in current activities for most museums to reinvest surpluses into developing a direct digital capture studio or an infrastructure to store digital resources. Without external funding in the form of grants, project funds or special fundraising activities, it seems likely
19 http://www.cis.rit.edu/museumSurvey/

Simon Tanner www.kcl.ac.uk/kdcs/
August 2004 48
©Tanner 2004
that many museums will lag behind the current activity curve to the detriment of society as a whole.
Funding bodies are recommended by this report to continue to fund digitization programmes and to help museums afford the new infrastructures necessary to move to direct digital capture. It is also recommended that funding bodies require the museum to have reviewed and responded to the recommendations in 7.1-7.5 as part of the obligations of the funding.

Simon Tanner www.kcl.ac.uk/kdcs/
August 2004 49
©Tanner 2004
Appendix A: Museums that Responded to the Survey 100 museums responded to the survey either online or by phone poll. The author is extremely thankful for all the help provided by the respondents to the survey.
Ackland Art Museum
Akron Art Museum
Albright-Knox Art Gallery
Amon Carter Museum
Art Institute of Chicago
Asian Art Museum
Baltimore Museum
Bass Museum of Art
Berkeley Art Museum
Birmingham Museum of Art
Brigham Young University Museum of Art
Brooklyn Museum
Carnegie Museum of Arts
Cheekwood Museum of Art
Chrysler Museum
Cleveland Museum of Art
Columbus Museum
Contemporary Museum, Honolulu
Corcoran Gallery of Art
Crocker Art Museum
Cummer Museum
Dallas Museum of Art
Dayton Art Institute
Delaware Art Museum
Denver Art Museum
Des Moines Art Center
Detroit Institute of Arts
Elvehjem Museum
Fine Arts Museums of San Francisco
Georgia Museum of Art
Grand Rapids Art Museum
Harvard University Art Museums
Heard Museum of Native Indian Art

Simon Tanner www.kcl.ac.uk/kdcs/
August 2004 50
©Tanner 2004
Henry Art Gallery
Herbert F. Johnson Museum of Art
Hood Museum of Art
Indiana University Art Museum
Indianapolis Museum of Art
Iris & B. Gerald Cantor Arts Center for Visual Art at Stanford University
Isabella Stewart Gardner Museum
J. Paul Getty Museum
Jack S. Blanton Museum of Art
John and Mable Ringling Museum of Art
Joslyn Art Museum
Kimbell Art Museum
Krannert Art Museums
Los Angeles County Museum of Art
Lowe Art Museum
McNay Art Museum
Memorial Art Gallery of the University of Rochester
Metropolitan Museum of Art
Milwaukee Art Museum
Minneapolis Institute of Arts
Modern Art Museum of Fort Worth
Montgomery Museum
Morris Museum of Art
Museum of Contemporary Art
Museum of Fine Arts Houston
Museum of Fine Arts, Boston
Museum of Modern Art, New York
Museum of the American West
National Academy of Design
National Gallery of Art
Nelson-Atkins Museum of Art
New Orleans Museum of Art
North Carolina Museum
Oklahoma City Museum of Art
Orlando Museum of Art
Palm Springs Desert Museum
Palmer Museum of Art
Parrish Art Museum

Simon Tanner www.kcl.ac.uk/kdcs/
August 2004 51
©Tanner 2004
Philadelphia Museum of Art
Phillips Collection
Pierpont Morgan Library and Museum
Portland (Oregon) Art Museum
Portland Museum of Art (Maine)
Princeton University Art Museum
Salvador Dali Museum
San Antonio Museum of Art
San Diego Museum
San Francisco Museum of Modern Art
San Jose Museum of Art
Seattle Art Museum
Smith College Museum of Art
Smithsonian American Art Museum
Solomon R. Guggenheim Museum
Spencer Museum of Art
Sterling & Francine Clark Art Institute
Studio Museum in Harlem
Tampa Museum of Art
University Art Museum CSULB
Utah Museum of Fine Arts
Virginia Museum of Fine Arts
Walker Art Center
Wandsworth Art Museum
Weisman Art Museum
Whitney Museum of American Art
Wichita Art Museum
Williams College Art Museum
Worcester Art Museum
Simon Tanner www.kcl.ac.uk/kdcs/
August 2004 52
©Tanner 2004
Appendix B: Interviewed Museums 20 museums were interviewed for the study. The museums gave very large amounts of their time and have been extremely supportive throughout. The author thanks them for taking part in this demanding part of the study.
Art Institute of Chicago
Asian Art Museum
Fine Arts Museums of San Francisco
Harvard University Art Museums
Isabella Stewart Gardner Museum
Jack S. Blanton Museum of Art
Los Angeles County Museum of Art
Metropolitan Museum of Art
Minneapolis Institute of Arts
Modern Art Museum of Fort Worth
Morris Museum of Art
Museum of Fine Arts Houston
Museum of Fine Arts, Boston
Museum of Modern Art, New York
Museum of the American West
Pierpont Morgan Library and Museum
San Antonio Museum of Art
San Francisco Museum of Modern Art
Smithsonian American Art Museum
Tampa Museum of Art

Simon Tanner www.kcl.ac.uk/kdcs/
August 2004 53
©Tanner 2004
Appendix C: The survey The following questionnaire, with 19 questions, seeks to find basic information that is publicly available about your museum's pricing activity. It should take no more than 25 minutes of your time to complete. Please complete as many questions as possible. All questions with selections/choices are mandatory. Thank you for your time and participation in this study. Simon Tanner
Museum Information Q1. Museum Name:
Q2. Website/URL for Museum:
Q3. Description of collection:
Q4. Governance of museum:
(choose from: public, private, private/non-profit, affiliated)
Q5. Operating Budget (for year 2002/03) in US dollars:
Q6. Attendance (for year 2002/03):
Q7. Number of staff (for year 2002/03):
Service and Pricing Information Q8. Does your museum charge for supplying digital copies of images from
the collection? Respond either Yes or No
Q9. Does your museum charge for supplying printed copies of images from the collection? Respond either Yes or No
Q10. Is the price sheet of client charges for images available to KDCS? Respond either Yes or No
Q11. If you answered 'yes' to question 10, please identify the website / URL / source where the price sheet may be found or attach the price sheet to your email.
Q12. What are the primary driving factors behind providing your service? (select up to 4 from this list)
serve the public and educational use
serve publishers and/or commercial picture use
meet public demand for services
provide services for the museum
make money for the museum
recover the costs of service provision
promote the museum and its collections
manage the museums image collections
to protect the museum from copyright infringement

Simon Tanner www.kcl.ac.uk/kdcs/
August 2004 54
©Tanner 2004
other, please specify:
Q13. Are rights and licenses for the publication/other use of images managed in-house or by external agents? (choose from in-house, external, other [please specify])
Q14. When comparing the rights and licensing rates charged for education and commercial use, which of the following is normally true?
the rates are the same for both
the rates for education are less than commercial
the rates for education are higher than commercial
Q15. What methods may clients use to select images? Select as many as are relevant.
website with thumbnails
catalogue of images
service will locate image for client
other, please specify:
Q16. What is the standard turnaround time offered clients for image delivery from existing stock?
Q17. What payment methods are available? Select as many as are relevant.
payment in advance required
payment on delivery
e-commerce
credit card
check / bank transfer
purchase order / invoicing
client account
other, please specify:
Q18. Are the majority of images scanned/digitized in-house or is this activity mainly outsourced? (choose from: in-house, outsourced, other [please specify])
Personal details Q19. a) Name:
b) Job title:
c) Telephone number:
d) Email address:
e) Would your museum be willing to take part in a further survey or answer more questions? Respond either Yes or No

Simon Tanner www.kcl.ac.uk/kdcs/
August 2004 55
©Tanner 2004
Appendix D: The Structured Interview
Mellon Project: Structured Interview Please ensure the museum has completed the Survey Questionnaire. As the interview proceeds, please refer back to the survey and seek further clarification and description of the reasons behind decisions made.
1 Museum Information (Q1-Q7, Q12) Define the size and scope of the museum in terms of its collections. Describe the features of the museum that set it apart from other museums in
the community. What are the outstandingly important works in the collection.
What percentage of works are on display, in-storage, off-site at any given time?
Define the museum’s core audience(s). Define the location/physical orientation of the museum. Is it a single building,
single site, distributed site, etc.? What proportion of the museum’s activities are funded by private funds or
endowment? What is the museum’s mission? What aspects of the museum’s mission are served by making available
images(digital or analogue) of the works of art? Does the museum offer e-commerce activities such as an on-line store? Name two or three primary areas of maximum expenditure for the museum Name two or three primary areas of maximum revenue generation for the
museum
2 Service and Pricing Information
2.1 Service Profile (Q16, Q17, Q18, Q19) Describe imaging services at the museum.
Describe the size and scope of services provided. How did the service start? How long has the museum provided imaging services internally?
externally? Describe the primary audience for imaging services. Describe the process and timetable for requesting an image. (internal
request/external request) What criteria are used to determine if an image will be created? Are all requests for images granted? Does the museum ever deny an image request? If so, why? Describe the process and timetable for creating an image. (internal
request/external request) Describe the process and timetable for delivering an image
(internal/external) What is the volume and coverage (with regard to the total collection) of images
currently on offer through imaging services?
Simon Tanner www.kcl.ac.uk/kdcs/
August 2004 56
©Tanner 2004
What image formats are offered? (analogue = 35mm, 4x5 transparency, digital = TIFF, JPG, ...)
Customer Service – check ease of ordering and use of service What is the relationship between imaging services and other business
processes in the museum such as marketing, museum shop, on-line store, etc.
2.2 Service Pricing (Q8, Q9, Q10, Q11, Q15) Note1: Record the actual costs if available and do calculations later. If actual figures are unavailable (especially for reasons of confidentiality) then go for estimates based upon percentage of total.
Note2: These figures should exclude the revenue from copyright and licensing, see later sections for that information
Note 3: Review price sheet provided with on-line questionnaire at this point of the interview.
Gain a breakdown of the price tag offered for the analogue and digital surrogate and record as a percentage of the total price (to enable comparisons).
What is the cost of creating the surrogate as a percentage of the price tag. What is the cost of service provision as a percentage of the price tag.
Include storage and preservation costs if known. Record the profit element – i.e. the proportion (%) of the price tag which is
retained over and above the cost of providing the service and creating the content.
Record how the museum assigns the revenue gained from the sale of the surrogate – e.g. does it all go to the dept/area providing the service, is it split between various Depts. or assigned in other ways by the museum?
Volume of sales - number of transactions in a year (commercial/non-commercial or, other based on categories tracked by museum)
What is the percentage of requests vs. completed transactions? Breakdown of sales - proportion of commercial to non-commercial sales Breakdown of payment methods used (review questionnaire entry). Breakdown of purpose of request - scholarly publication, on-line resource, k-12
educational use, higher education use, etc. Amount of image only revenue raised in a specified year - proportions as
commercial and non-commercial. Cost of service provision – number of staff, budget, equipment etc. What mechanism or software is used to record sales transactions and financial
information? What service or museum costs are offset against image only revenue raised?
2.3 Copyright and licensing (Q13, Q14) Note: All questions in relation to the sale of rights and licenses
Does the museum have a specific section/dept that deals with the sale of image rights and licenses?
In-house or external agency for this activity? Number of copyright/licensing requests/transactions in a year What percentage of total requests does this figure represent? (i.e., what
percentage of total requests require copyright/licensing activities?) When making available images for educational purposes, are the majority of
such licenses for publication or non-publication purposes?
Simon Tanner www.kcl.ac.uk/kdcs/
August 2004 57
©Tanner 2004
Cost of copyright and licensing activities – number of staff, budget, equipment etc.
Amount of copyright/licensing revenue raised in a specified year - proportions as commercial and non-commercial.
What mechanism or software is used to record copyright/licensing transactions and financial information?
What service or museum costs are offset against copyright/licensing revenue raised?
When licensing, does the museum ever demand royalties (as seen in French museums), or is it always through a one-time, up front fee? If they do collect royalties, under what circumstances?
How does the museum deal with piracy concerns? Are they aware of piracy of their images? --- Does the museum actively chase piracy - why?
Does the museum chase unauthorized educational use of public domain works or is this "fair use"?
What are the barriers or downsides to rights and licensing for a museum? How are third party intellectual property rights taken into account? Does the
museum contact the IP owner(s) directly, or make the licensee contact the IP owners directly?
2.4 Policy and strategy What is the motivation and objective for providing the service? What is the motivation and objective behind the pricing structure? How was the pricing structure gained – what method was used to define price?
Was reference to other services/competitors made in the design of the pricing structure?
Does the museum expect to recoup costs? Does the museum in fact recoup costs? If so, is the majority of revenue coming from rights and licensing or from other activities?
Does having images available on the Web increase the number of sales transactions and/or revenue gained?
Does the museum charge differently for different classes of client - if so what are the definitions used to differentiate the clients - e.g. educational, private, non-US etc
What is the purpose and policy behind differential charging? Are certain images sold or licensed more than other images? Is there a “life cycle” for images? In other words, do the number of sales for an
image decrease over time? How does the museum handle a request for an image when it is not available?
Does the museum charge differently for new imaging?
3 Miscellaneous How does imaging services define success in their yearly reporting - number of
transactions, number of clients, new images made, revenue raised, profit made etc.
Is the service evaluated? If so, what are the criteria. What are the barriers to service provision (e.g. technology, copyright, pricing,
experience, institutional investment, payment gathering etc.)? Are there any planned changes or developments to the service in the future
(next 12-18 months)? Where do you think the funding for future digital activity will come from?