reprint 1350 automation of lysimeter for potential
TRANSCRIPT

Reprint 1350
Automation of Lysimeter for Potential Evapotranspiration
Measurements in Hong Kong
Olivia LEE Shuk-ming, David LAM Hok-yin,
YAU Lai-kin and WONG Kam-ming
WMO Technical Conference on Meteorological and Environmental
Instruments and Methods of Observation (CIMO TECO 2016),
27-30 September 2016, Madrid, Spain

1
Automation of Lysimeter for
Potential Evapotranspiration Measurements in Hong Kong
Olivia LEE Shuk-ming, David LAM Hok-yin, YAU Lai-kin and WONG Kam-ming
Hong Kong Observatory
134A Nathan Road, Tsim Sha Tsui, Kowloon, Hong Kong, China
Tel:+852 2926 8421, Fax: +852 2311 9448, Email: [email protected]
Abstract
The Hong Kong Observatory has been employing three identical lysimeters installed at the
King’s Park Meteorological Station in Hong Kong for measuring Potential Evapotranspiration (PE) since
1951. Each lysimeter is non-weighable (percolation-type) and equipped with an overflow tank. The
lysimeters were operated manually in the past through manually irrigating the grass of each lysimeter
and manually taking overflow measurement. PE was deduced from these measurements through the
formula PE = Irrigation + Rainfall – Overflow.
To streamline operation, the Observatory developed automated instruments in recent few
years for irrigating and carrying out overflow measurements of the lysimeters. The design and
implementation of the automatic lysimeters are described in this paper. PE measurements obtained
from the automated instruments under different weather conditions in 2014 and 2015 were compared
with those from the manual observations. Conclusion was drawn and full automatic operation of the
lysimeters started from 1 January 2016.
1. Introduction Three square lysimeters (Figure 1) were installed on a flat ground at the King’s Park
Meteorological Station in October 1951 to measure PE (Chen, 1976). Each lysimeter is built of bricks
and surfaced in cement plaster. They are all of the same size, each with an internal side of 2.0 m and
an inside depth of 0.7 m. The three lysimeters are set in line with their rims just above the ground.
Outlet pipes lead from the bottom of each lysimeter to respective overflow tanks (see Tank 1, 2 and 3
in Figure 2), which are located on a concrete step at a lower level. Each lysimeter is filled with ordinary
local light soil turfed with local grass, but the bottom 10 cm are filled with granite chips in order to avoid
clogging the output pipes.
Before 1 January 2016, operation of lysimeters was totally manual. It involved:
i) manually irrigating the grass of each lysimeter with fixed volume of water to provide an
equivalent amount of 7.5 mm of rainfall through a lysimeter1 at fixed time slot (set at 3 p.m.)
every day;
130 litres of water through the grass field of a lysimeter with area 2m x 2m = 4 m2 is equivalent to 7.5 mm of rain.
2
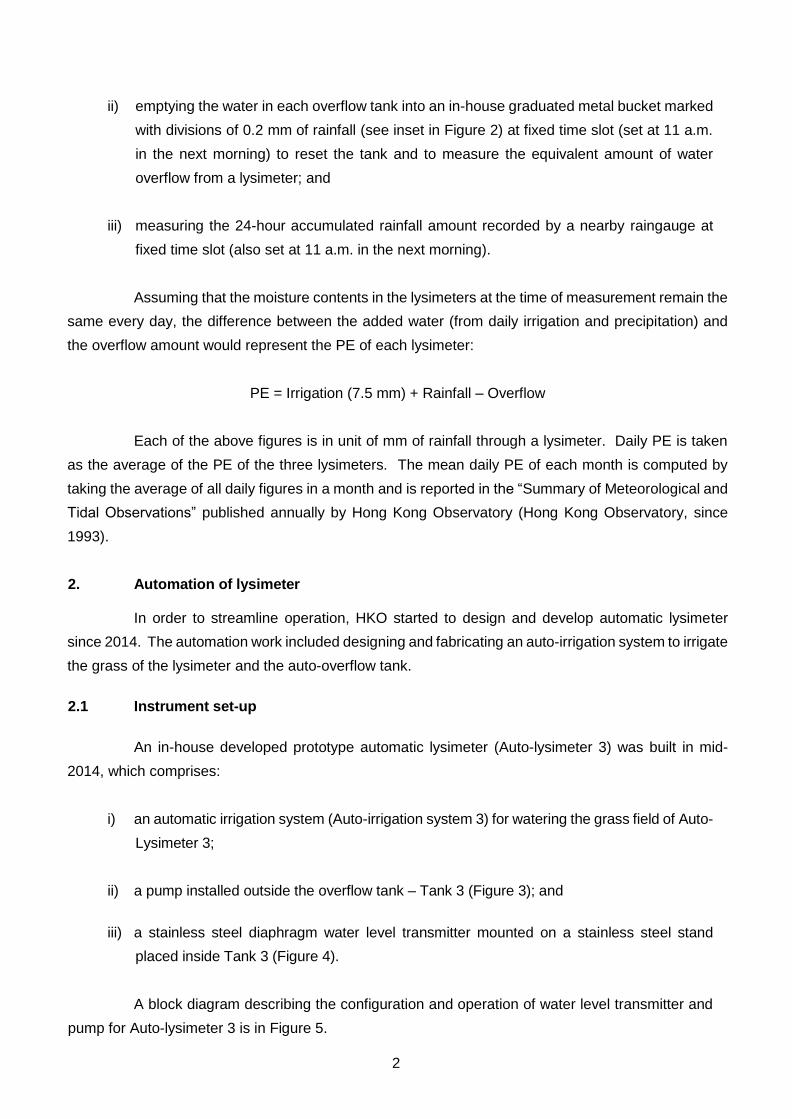
ii) emptying the water in each overflow tank into an in-house graduated metal bucket marked
with divisions of 0.2 mm of rainfall (see inset in Figure 2) at fixed time slot (set at 11 a.m.
in the next morning) to reset the tank and to measure the equivalent amount of water
overflow from a lysimeter; and
iii) measuring the 24-hour accumulated rainfall amount recorded by a nearby raingauge at
fixed time slot (also set at 11 a.m. in the next morning).
Assuming that the moisture contents in the lysimeters at the time of measurement remain the
same every day, the difference between the added water (from daily irrigation and precipitation) and
the overflow amount would represent the PE of each lysimeter:
PE = Irrigation (7.5 mm) + Rainfall – Overflow
Each of the above figures is in unit of mm of rainfall through a lysimeter. Daily PE is taken
as the average of the PE of the three lysimeters. The mean daily PE of each month is computed by
taking the average of all daily figures in a month and is reported in the “Summary of Meteorological and
Tidal Observations” published annually by Hong Kong Observatory (Hong Kong Observatory, since
1993).
2. Automation of lysimeter
In order to streamline operation, HKO started to design and develop automatic lysimeter
since 2014. The automation work included designing and fabricating an auto-irrigation system to irrigate
the grass of the lysimeter and the auto-overflow tank.
2.1 Instrument set-up
An in-house developed prototype automatic lysimeter (Auto-lysimeter 3) was built in mid-
2014, which comprises:
i) an automatic irrigation system (Auto-irrigation system 3) for watering the grass field of Auto-
Lysimeter 3;
ii) a pump installed outside the overflow tank – Tank 3 (Figure 3); and
iii) a stainless steel diaphragm water level transmitter mounted on a stainless steel stand
placed inside Tank 3 (Figure 4).
A block diagram describing the configuration and operation of water level transmitter and
pump for Auto-lysimeter 3 is in Figure 5.

3
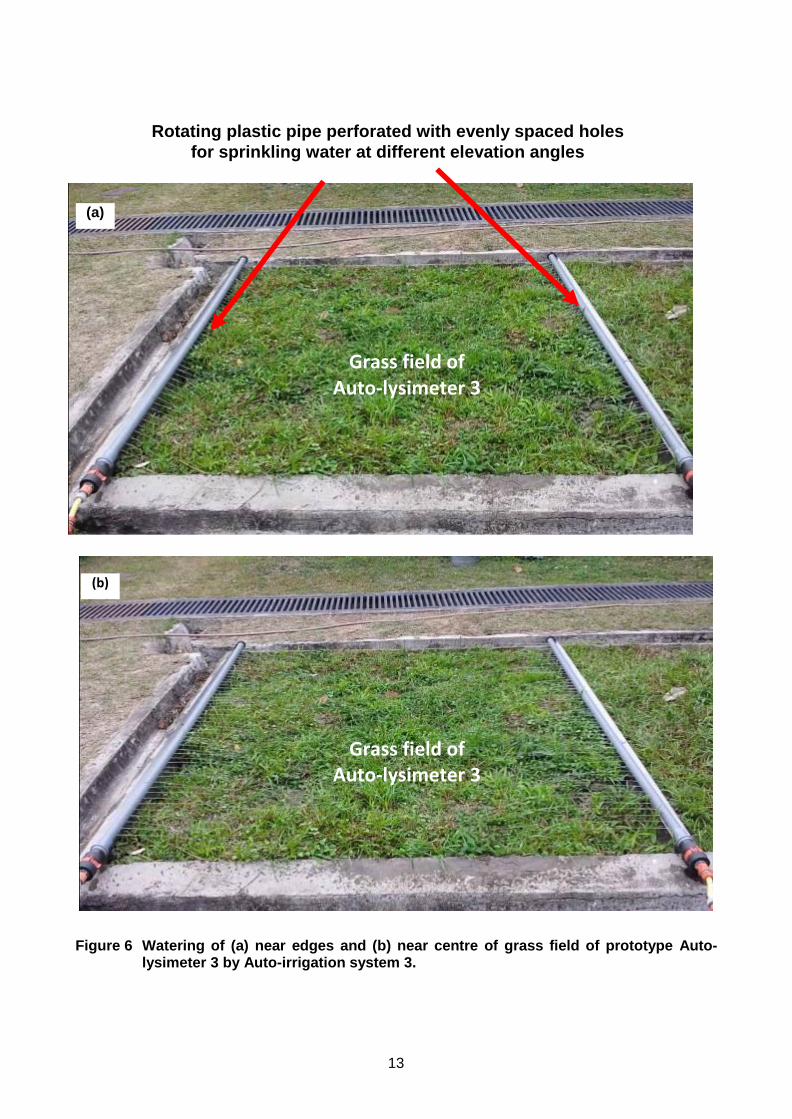
The Auto-irrigation system 3 comprises:
(i) two plastic pipes installed on two opposite sides of the grass field of Auto-lysimeter 3
(Figure 6);
(ii) a water storage tank for holding 30 litres of water for irrigation (Figure 3);and
(iii) a pump for removing water from storage tank to irrigate grass field of Auto-lysimeter 3
(Figure 3).
Each plastic pipe is perforated with evenly spaced holes and can be rotated so that water
from the storage tank can come out at different elevation angles in order to evenly irrigate both the
edges and centre of the grass field (Figure 6). There is an outlet at the side of the water storage tank
and the position of the outlet has been determined by filling exactly 30 litres of water in the tank. Water
in excess of 30 litres will be overflown through the pipe connected to the outlet. The pump is controlled
by a computer to remove water from the 30 litre-tank to sprinkle the grass field at 3 p.m. every day. A
block diagram describing the configuration and operation of Auto-irrigation system 3 is in Figure 7.
The water level transmitter uses differential pressure level measurement technology to
infer water level by measuring the pressure generated by the water inside the overflow tank. It also
features digital temperature compensation, achieving an accuracy of ±0.1%.
2.2 Working Principle and measurement sensitivity of automatic lysimeter
A computer program is responsible for automatically logging the water level (in units of mm
in height) registered by the water level transmitter inside Tank 3. The pump is also controlled by the
computer program for automatically removing water from Tank 3. Water will be removed from Tank
3 to a lower level (set at 100 mm) in two scenarios:
(i) at 11 a.m. for daily reset (Figure 8); and
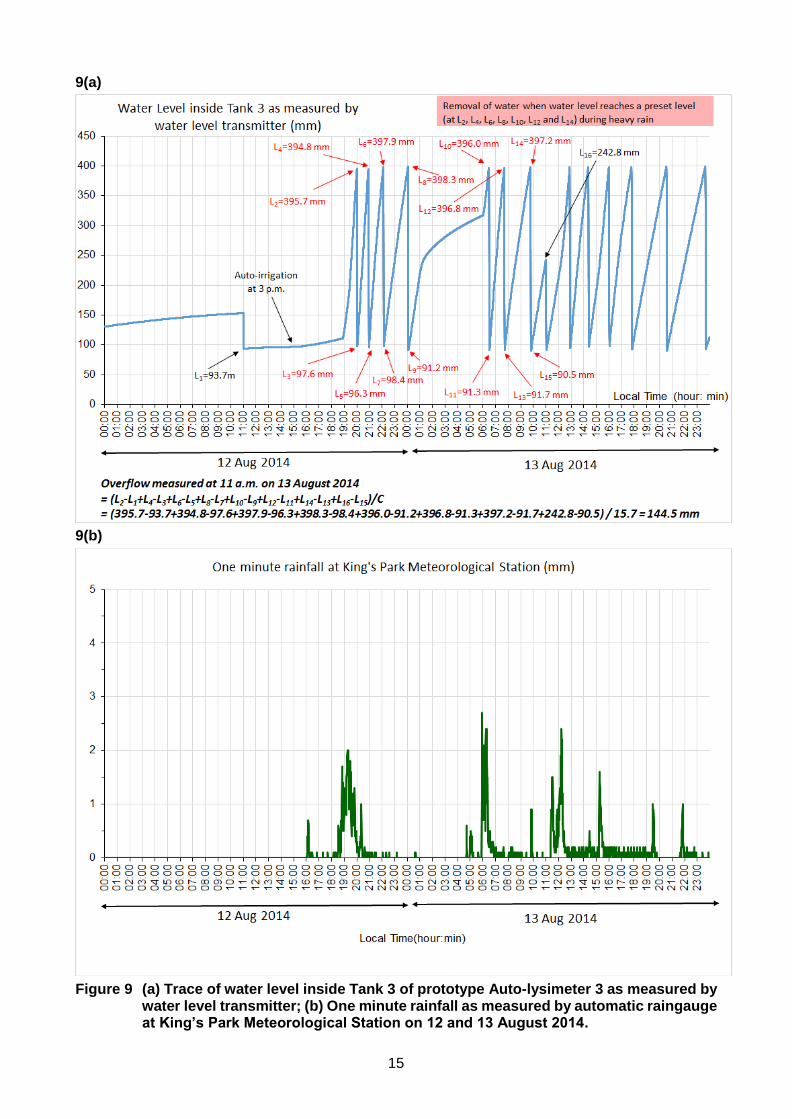
(ii) when water reaches a preset upper level (set at 400 mm) (Figure 9) so that tank overflown
can be avoided during heavy rain.
The operation of the Auto-lysimeter 3 is such that there is no need to empty the tank during
measurement at 11 a.m. By continuously logging the water level in Tank 3, the overflow water
amount (in unit of mm of rainfall) can be deduced from the increase in water level recorded by the
water level transmitter (in unit of mm height) from 11 a.m. in previous day.
To achieve this the change in water level (C) as measured by the water level transmitter
4
per mm of overflow from lysimeter has to be determined. As 1 mm of rainfall is 1 litre of rain water
falling through 1 m2 of area, 1 mm of overflow from lysimeter (area 2m x 2m = 4 m2) is 4 litres of
water. The radius of Tank 3 is 28.5 cm. Hence
C = 4000/(πx28.5x28.5) = 1.57 cm = 15.7 mm
Overflow of Auto-lysimeter as measured at 11 a.m. can be deduced from the followings
(see Figure 8)
Overflow = (L2-L1)/C
where L1 is water level inside tank at 11 a.m. in the previous day after reset; and
L2 is water level inside tank at 11 a.m. in current day before reset.
For the case illustrated in Figure 8, namely PE measured at 11 a.m. on 23 April 2014:
Overflow = 5.0 mm
Irrigation = 7.5 mm
Rainfall = 6.0 mm
Hence PE = Irrigation + Rainfall – Overflow = 7.5 + 6.0 – 5.0 = 8.5 mm
Automatic lysimeter has additional benefit compared to manual observations. Tank
overflown due to heavy precipitation can be avoided, resulting in higher PE data availability in rainy
weather. For instance, in respect of the heavy rain episode on 12 and 13 August 2014, water was
removed 7 times during the 24-hour period before PE measurement was made at 11 a.m. on 13 August
(Figure 9). In this case, manual PE observation was not possible due to tank overflown. PE of Auto-
lysimeter 3, however, could be deduced as follows:
Overflow = 144.5 mm
Irrigation = 7.5 mm
Rainfall = 152.0 mm
PE = 7.5 + 152.0 – 144.5 = 15.0 mm
2.3 Comparison of manual and automatic overflow measurements
In order to compare the performance of the manual and automatic PE measurements, both
manual and automatic overflow measurements from Tank 3 were taken during the period from 24
January to 29 March 2014. To achieve this, the pump of the prototype Auto-lysimeter 3 was
temporarily shut down during the period and Tank 3 was emptied manually at 11 a.m. Comparison
results (see Table 1, Comparison No. 1) indicated that the automatic overflow measurements
generally agreed with the manual observations from the same overflow tank (Tank 3).

5
As the comparison aforesaid confirmed the accuracy of the automatic instrument, Auto-
lysimeter 3 commenced operation since 1 May 2014. Meanwhile, automation work of Lysimeter 1
based on the same design and equipment as Auto-lysimeter 3 proceeded. PE measurements of
Auto-lysimeter 1 were then compared with manual PE measurements of Lysimeter 2 and PE
measurements from Auto-lysimeter 3 for the period from 3 September to 15 October 2014. The
comparison results are summarized in Table 1, Comparison No. 2 and 3.
Again the automatic measurements from Auto-lysimeter 1 generally agreed with the
manual observations from Lysimeter 2 and the automatic measurements from Auto-lysimeter 3.
Auto-lysimeter 1 was declared operational backdating to 3 September 2014.
To ascertain the reliability and accuracy of the automatic lysimeters, Auto-lysimeter 1 and
3 were put on parallel run operation with manual Lysimeter 2 for one year. After the parallel run,
manual PE observations of Lysimeter 2 were compared with measurements of Auto-lysimeter 1 and
3 for the yearly period from 1 October 2014 to 30 September 2015. The comparison results are
summarized in Table 1, Comparison No. 4 to 6.
Automatic measurements from Auto-lysimeter 1 and 3 generally agreed with manual
observations from Lysimeter 2. In addition, the automatic measurements from the two auto-
lysimeters also agreed well with each other.
Concerning data availability of the manual and automatic lysimeters, availability figure of
Auto-lysimeter 1 and 3 were 98% and 96% respectively over the aforesaid yearly period. The two
availability figures compared favourably with that of the manual PE observation from Lysimeter 2
(98%).
As accuracy and reliability of PE measurements from the automatic lysimeters were
ascertained after one year of parallel run with manual PE observations, automation work of the last
lysimeter – Lysimeter 2 proceeded based on the same setup as Auto-lysimeter 1 and 3. The work
was completed on 9 November 2015. PE measurements from Auto-lysimeter 2 were compared with
that of Auto-lysimeter 1 and 3 for the period 9 November to 31 December 2015. The comparison
results are summarized in Table 1, Comparison No. 7 and 8. The PE measurements from Auto-
lysimeter 2 agreed well with those from Auto-lysimeters 1 and 3.
Full automation of all three lysimeters started on 1 January 2016.
3. Conclusion
An automatic lysimeter was developed to automatically irrigate the grass field of the
lysimeter as well as to automatically measure overflow inside overflow tank. The instrument
6
consisted of a water level transmitter to log down water level inside the overflow tank, and a pump
to remove water from the tank during daily reset or during heavy rain. Both the water level transmitter
and pump were controlled by computer program for operation.
PE measurements obtained from automatic lysimeters were compared with manual
observations. Results indicated that they were in good agreement with each other. In addition to
streamlining PE observations, automatic lysimeters also allow PE measurements during heavy rain
which was previously not possible for manual observation owing to tank overflown.
4. Acknowledgements The authors would like to thank their colleague Mr. S.M. Yu, Artisan, for designing and
constructing the Auto-irrigation system. The authors would also like to thank Mr. K.C. Tsui for his
invaluable advice and comments.
5. References Chen, T.Y. (1976). Evaporation and Evapotranspiration in Hong Kong. Hong Kong Observatory
Technical Note No. 42.
Hong Kong Observatory (since 1993). Summary of Meteorological and Tidal Observations in Hong
Kong (available at http://www.weather.gov.hk/publica/pubsmo.htm).

7
Table 1 Comparison of PE measurements from two lysimeters
Comparison No.
Time period
Lysimeter X to be compared
(PE measurements denoted by PEx)
Lysimeter Y to be compared
(PE measurements denoted by PEy)
Mean difference in
PE
= (PEx-PEy)#
(mm)
1 24 January to 29 March 2014
Automatic measurements from Auto-lysimeter 3
Manual measurements from Auto-lysimeter 3
-0.3
2 3 September to 15 October 2014
Automatic measurements from Auto-lysimeter 1
Manual measurements from Lysimeter 2
-0.5
3 3 September to 15 October 2014
Automatic measurements from Auto-lysimeter 1
Automatic measurements from Auto-lysimeter 3
-0.5
4 1 October 2014 to 30 September 2015
Automatic measurements from Auto-lysimeter 1
Manual measurements from Lysimeter 2
-0.4
5 1 October 2014 to 30 September 2015
Automatic measurements from Auto-lysimeter 3
Manual measurements from Lysimeter 2
+0.2
6 1 October 2014 to 30 September 2015
Automatic measurements from Auto-lysimeter 1
Automatic measurements from Auto-lysimeter 3
-0.7
7 9 November to 31 December 2015
Automatic measurements from Auto-lysimeter 2
Automatic measurements from Auto-lysimeter 1
+0.3
8 9 November to 31 December 2015
Automatic measurements from Auto-lysimeter 2
Automatic measurements from Auto-lysimeter 3
-0.5
#The difference is computed only when PE measurements from both Lysimeters X and Y are available.

8
Figure 1 Three square lysimeters at King’s Park Meteorological Station of Hong Kong Observatory.
Lysimeter 3
Lysimeter 2
Lysimeter 1
9
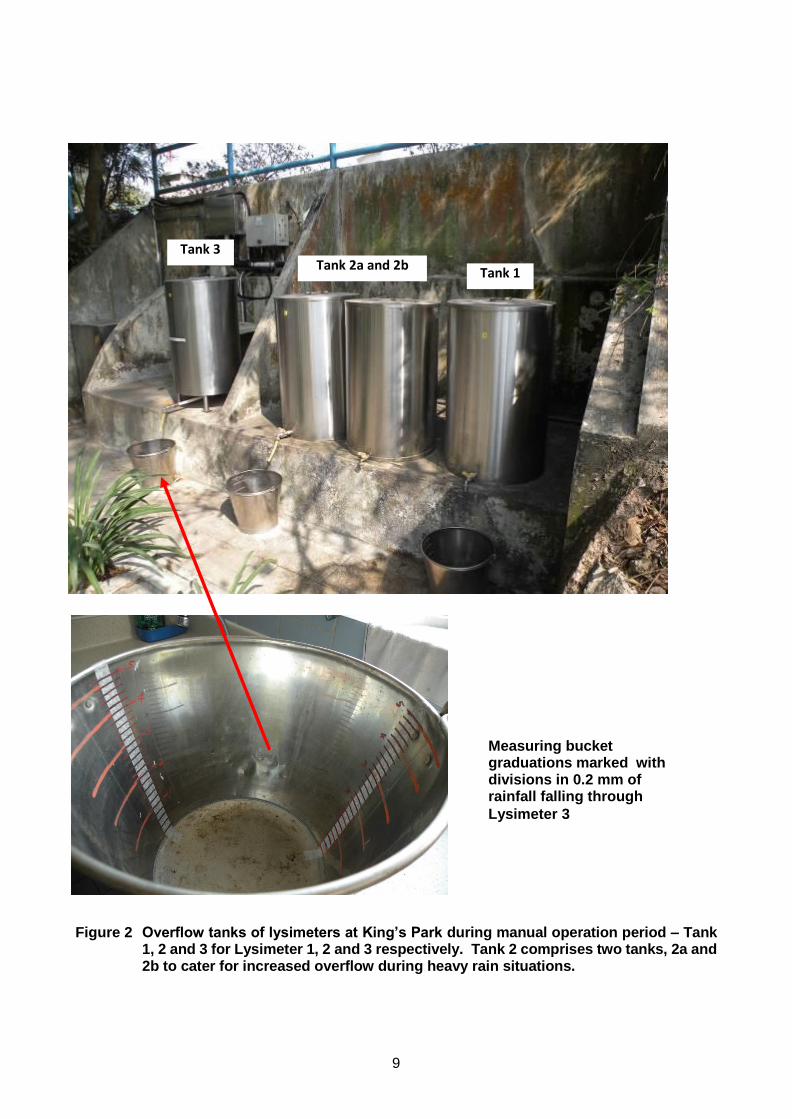
Figure 2 Overflow tanks of lysimeters at King’s Park during manual operation period – Tank 1, 2 and 3 for Lysimeter 1, 2 and 3 respectively. Tank 2 comprises two tanks, 2a and 2b to cater for increased overflow during heavy rain situations.
Tank 3 Tank 2a and 2b
Tank 1
Measuring bucket graduations marked with divisions in 0.2 mm of rainfall falling through
Lysimeter 3

10
Figure 3 Pumps and water storage tank for Auto-irrigation system 3 of prototype Auto-lysimeter 3.

11
Figure 4 Stainless steel diaphragm water level transmitter (4a) mounted on a stainless steel stand (4b) and placed inside Tank 3 (4c) of prototype Auto-lysimeter 3.

12
Figure 5 Block diagram of configuration and operation of water level transmitter and pump of prototype Auto-lysimeter 3.
13
Figure 6 Watering of (a) near edges and (b) near centre of grass field of prototype Auto-lysimeter 3 by Auto-irrigation system 3.
Grass field of Auto-lysimeter 3
Rotating plastic pipe perforated with evenly spaced holes
for sprinkling water at different elevation angles
Grass field of Auto-lysimeter 3
(a)
(b)

14
Figure 7 Block diagram of configuration and operation of Auto-irrigation system 3.
Figure 8 Trace of water level inside Tank 3 of prototype Auto-lysimeter 3 on 22 and 23 April 2014 as measured by water level transmitter.
Water tank
Manual Valve
Computer
Pump with
Electronic Flow
Control
A.C Timer set to pump water out to
irrigate grass field of Auto-lysimeter 3
at 3 p.m. local time.
Water out to irrigate
the grass field of
Auto-lysimeter 3
Water In for
Filling
30 L
water
15
9(a)
9(b)
Figure 9 (a) Trace of water level inside Tank 3 of prototype Auto-lysimeter 3 as measured by water level transmitter; (b) One minute rainfall as measured by automatic raingauge at King’s Park Meteorological Station on 12 and 13 August 2014.