representational difference analysis (rda) for detection …
TRANSCRIPT

REPRESENTATIONAL DIFFERENCE ANALYSIS (RDA) FOR DETECTION OF
GENETIC ELEMENTS ASSOCIATED WITH INCREASED INCIDENCE OF
SEROGROUP C NEISSERIA MENINGITIDIS INFECTION
Leah M. Kostelnik
B.S. in Biology, Indiana University of Pennsylvania, 2003
by
Master of Science
of the requirements for the degree of
Graduate School of Public Health in partial fulfillment
Department of Infectious Diseases and Microbiology
Submitted to the Graduate Faculty of
2006
University of Pittsburgh

UNIVERSITY OF PITTSBURGH
Graduate School of Public Health
This thesis was presented
by
Leah M. Kostelnik
ii
and approved by
Thesis Advisor: Lee H. Harrison, MD
Professor Department of Medicine and Department of Infectious Diseases and Microbiology
School of Medicine and Graduate School of Public Health University of Pittsburgh
Committee Member:
Jeremy Martinson, PhD Assistant Professor
Department of Infectious Diseases and Microbiology Graduate School of Public Health
University of Pittsburgh
Committee Member: Yuan Chang, MD
Professor Department of Pathology
School of Medicine University of Pittsburgh
It was defended on
April 7, 2006

Copyright © by Leah M. Kostelnik
2006
iii

REPRESENTATIONAL DIFFERENCE ANALYSIS (RDA) FOR DETECTION OF GENETIC ELEMENTS ASSOCIATED WITH INCREASED INCIDENCE OF
NEISSERIA MENINGITIDIS SEROGROUP C INFECTION
Leah M. Kostelnik, M.S.
University of Pittsburgh, 2006
Previous studies have demonstrated that the increased incidence of invasive disease caused by
serogroup C Neisseria meningitidis in the United States during the 1990s was attributed
primarily to strains belonging to the ST11 clonal complex. Subcapsular genotyping of a subset
of isolates from Maryland identified distinct “early” and “late” clones defined by antigenic shift
at the FetA outer membrane protein. Representational difference analysis (RDA) was used to
identify additional genetic differences that may have contributed to the emergence of the late
clone. A collection of serogroup C isolates representative of the early and late clone was
subjected to pulsed field gel electrophoresis (PFGE) to determine genetic relatedness among the
isolates and to identify a candidate tester/driver pair for RDA. RsaI-digested tester genomic
DNA (late clone) was ligated to specific adaptors followed by two rounds of subtractive
hybridization with RsaI-digested driver genomic DNA (early clone). PCR amplification of
subtracted tester DNA with adaptor specific primers generated at least three late clone-specific
bands that were absent from the early clone. These products were cloned and sequenced and
confirmed by Southern blotting with tester and driver digoxigenin-labeled genomic DNA probes
to be tester specific. A BLAST search of late clone-specific sequences identified homology to
either IS1301 or pJS-B plasmid N. meningitidis sequences. PCR with primers specific to either
IS1301 or pJS-B plasmid sequences amplified these elements from late clone isolates but not
from early clone isolates. Thus, RDA successfully identified two unique genetic elements
present in an emergent N. meningitidis serogroup C ST-11 clone that had undergone antigenic
iv

shift at FetA. Further investigation is required to determine the potential role of these elements
in clonal emergence and N. meningitidis pathogenesis. The public health significance of this
project stems from increased incidence of meningococcal disease being a major concern:
morbidity and mortality increase, outbreaks produce panic and disruption in communities, public
health agencies must respond for control and prevention, and mass immunization and antibiotic
prophylaxis are often required.
v

TABLE OF CONTENTS
PREFACE....................................................................................................................................XI
1.0 INTRODUCTION........................................................................................................ 1
1.1 EPIDEMIOLOGY OF MENINGOCOCCAL DISEASE................................ 1
1.2 SEROGROUP C ANTIGENIC SHIFT............................................................. 3
1.3 REPRESENTATIONAL DIFFERENCE ANALYSIS (RDA) ........................ 6
2.0 SPECIFIC AIM............................................................................................................ 8
3.0 MATERIALS AND METHODS ................................................................................ 9
3.1 STUDY ISOLATES............................................................................................. 9
3.2 PFGE................................................................................................................... 10
3.3 RDA..................................................................................................................... 11
3.4 CLONING OF RDA-GENERATED FRAGMENTS..................................... 15
3.4.1 Cloning of RDA Secondary PCR Product ................................................ 15
3.4.2 Cloning of RDA Gel-Purified PCR Bands................................................ 16
3.4.3 DNA Sequencing ......................................................................................... 17
3.5 SOUTHERN HYBRIDIZATION..................................................................... 18
3.5.1 Labeling of Tester and Driver DNA Probes ............................................. 18
3.5.2 Southern Blot............................................................................................... 19
3.6 GENETIC ELEMENT PCR............................................................................. 20
3.6.1 DNA Extractions ......................................................................................... 20
3.6.2 pJS-B Plasmid PCR .................................................................................... 21
3.6.3 IS1301 PCR.................................................................................................. 21
4.0 RESULTS ................................................................................................................... 23
4.1 SELECTION OF RDA TESTER AND DRIVER........................................... 23
4.2 RDA ADAPTOR LIGATION EFFICIENCY ANALYSIS ........................... 25
vi

4.3 RDA-GENERATED TESTER SPECIFIC SEQUENCES ............................ 26
4.4 CLONING OF RDA GENERATED TESTER PCR PRODUCTS............... 28
4.5 SOUTHERN BLOT ANALYSIS...................................................................... 30
4.6 HOMOLOGIES OF RDA-SUBTRACTED TESTER-SPECIFIC
SEQUENCES...................................................................................................................... 31
4.7 PCR DETECTION OF PJS-B PLASMID ...................................................... 37
4.8 PCR DETECTION OF IS1301......................................................................... 38
5.0 DISCUSSION ............................................................................................................. 40
BIBLIOGRAPHY....................................................................................................................... 46
vii

LIST OF TABLES
Table 1: Aligned deduced peptide sequences for PorA variable region (VR) 1 and VR2, FetA
VR, and PorB loops V and VII, ST11 complex serogroup C meningococcal isolates, Maryland,
1992-2001. ...................................................................................................................................... 6
Table 2: Sequences of the BD PCR-Select adaptors and PCR primers used for RDA. ............... 15
Table 3: PCR primers for detection of genetic elements generated by RDA. .............................. 22
Table 4: Top homology hits for tester-specific sequences............................................................ 34
viii

LIST OF FIGURES
Figure 1: Average annual incidence of serogroup C infection among 15-24 year olds in
Maryland, 1992-2001, by OMP sequence profile........................................................................... 5
Figure 2: Schematic diagram of BD PCR-Select bacterial genome subtraction kit. .................... 14
Figure 3: PFGE clustering of serogroup C, ST11, porB 2-2, porA 5-2 isolates into early and late
clones. ........................................................................................................................................... 24
Figure 4: PFGE comparison of driver (early clone) and tester (late clone) used for RDA. ......... 24
Figure 5: RDA ligation efficiency analysis by PCR amplification............................................... 26
Figure 6: Nested PCR amplification of subtracted and unsubtracted tester DNA........................ 27
Figure 7: PCR amplification of RDA-subtracted fragments with M13 primers........................... 29
Figure 8: Preparative gel of secondary PCR products from N. meningitidis subtracted tester
DNA.............................................................................................................................................. 29
Figure 9: Gel-purified secondary PCR products from N. meningitidis subtracted tester DNA.... 30
Figure 10: Southern blots of 58 secondary PCR products with either tester or driver DIG-labeled
genomic DNA probes. .................................................................................................................. 31
Figure 11: pJS-B plasmid map with aligned RDA-generated fragments and RsaI restriction sites.
....................................................................................................................................................... 35
Figure 12: IS1301 insertion sequence map with aligned RDA-generated fragments and RsaI
restriction sites. ............................................................................................................................. 36
Figure 13: PCR amplification of RDA tester and driver DNA with pJS-B primers..................... 37
Figure 14: PCR amplification of N. meningitidis serogroup C ST11 early and late clone isolates
with pJS-B primers. ...................................................................................................................... 38
Figure 15: PCR amplification of N. meningitidis serogroup C ST11 early and late clone isolates
with IS1301 primers...................................................................................................................... 39
ix

Figure 16: PCR amplification of N. meningitidis serogroup C ST11 early and late clone isolates
with LMK56-2 primers. ................................................................................................................ 39
x

PREFACE
I would like to thank Dr. Lee Harrison, my thesis advisor, for his continued guidance and support
on this project as well as Dr. Yuan Chang and Dr. Jeremy Martinson for being part of my
committee. I appreciate all of the time and expertise that you have lent to this project. I would
also like to thank Dr. Jane Marsh for her daily guidance in the laboratory and always being
available to answer my never-ending questions. A very special thank you to Alicia Price, my
“partner in crime”, for our daily conversations, the many hours we spent in lab together, and the
tremendous support you have given me throughout graduate school. Lastly, I would like to
thank my family and friends for being behind me every step of the way and always having faith
in me to take the next step forward.
xi

1.0 INTRODUCTION
1.1 EPIDEMIOLOGY OF MENINGOCOCCAL DISEASE
Neisseria meningitidis is a major cause of bacterial septicemia and meningitis worldwide. This
gram-negative, capsulated bacterium colonizes mucosal surfaces of the nasopharynx and is
transmitted through direct contact with large droplet respiratory secretions from patients or
asymptomatic carriers (1, 2). N. meningitidis is an obligate human pathogen causing meningeal
infection similar to other forms of acute purulent meningitis and is characterized by sudden onset
of fever, headache, and stiffness of neck sometimes accompanied by nausea, vomiting,
photophobia, and an altered mental status. In the case of meningococcal sepsis, noted in 5-20%
of patients, purpuric rash, hypotension, acute adrenal hemorrhage, and multi-organ failure can
occur. The overall case fatality rate has remained stable over the past 20 years, at 9-12%, with a
rate up to 40% among patients with meningococcal sepsis (3). N. meningitidis has been
classified into five major pathogenic serogroups (A, B, C, Y, and W135) based on chemical
composition of distinctive capsular polysaccharides (2). There are currently two licensed
meningococcal vaccines in the U.S.; both cover serogroups A, C, Y, and W135. The
polysaccharide-based vaccine licensed in 1982 has immunologic limitations while the protein-
conjugate vaccine licensed in 2005 for 11-55 year olds is now recommended for routine use in
adolescents (1).
1

There are substantial fluctuations in meningococcal disease incidence, outbreaks, and
epidemics. Each year, an estimated 1,400-2,800 cases of meningococcal disease occur in the
U.S., a rate of around 0.5-1.0/100,000 population (1). The rates of disease are highest among
infants although rates drop after infancy then increase during adolescence and early adulthood.
Serogroups A, B, and C account for most cases of meningococcal disease throughout the world
with serogroups B and C responsible for the majority of cases in the Americas and Europe and
serogroups A and C predominating throughout Asia and Africa (3).
In the U.S., there was an increased incidence of disease observed in the 1990s that was
accompanied by a dramatic surge in meningococcal outbreaks, mostly caused by serogroup C
strains. By the mid-1990s, the incidence of meningococcal infection was nearly 3-fold higher
than earlier in the decade followed by a subsequent decline in the late 1990s and early 2000s.
There were also changes in serogroup distribution during the 1990s with an increased incidence
of serogoup Y and C infections (4, 5).
The substantial epidemiologic fluctuations of meningococcal disease are dramatic and
poorly understood. Increased incidence of meningococcal disease is a major public health
concern: morbidity and mortality increase, outbreaks produce panic and disruption in
communities, public health agencies must respond for control and prevention, and mass
immunization and antibiotic prophylaxis are often required. Changes in serogroup distribution
are also important because the meningococcal vaccines licensed in the U.S. are serogroup-
specific and do not provide protection against serogroup B, which is responsible for around a
third of all meningococcal disease in the U.S. (1, 2). One instance of meningococcal capsular
switching from serogroup C to W-135 in a W-135 vaccine naïve population occurred during the
Hajj pilgrimage in Mecca, Saudi Arabia causing extensive public health impacts due to lack of
2

immunological protection (3). The genetic mechanisms for these changes in incidence and
serogroup distribution are not known and will be explored further in this paper among serogroup
C isolates.
1.2 SEROGROUP C ANTIGENIC SHIFT
Multi-locus sequence typing (MLST) is one application used to study the molecular
epidemiology of N. meningitidis by identifying major clonal complexes that are associated with
meningococcal disease worldwide (6). MLST defines an isolate’s genetic background based on
the DNA sequence of 7 housekeeping genes not under selective pressure. The MLST sequence
type (ST) is defined by the combination of alleles at all 7 of these genes. An ST complex is
defined as a set of STs that have identity at 5 or more of the 7 housekeeping genes. MLST is a
highly objective genotyping method and is portable for global strain comparisons. While MLST
is a useful genotyping tool for global epidemiology, it is not sufficiently discriminatory for
outbreak detection or investigations of clonal fluctuations within ST complexes (6). Sequencing
of outer membrane proteins (OMPs) provides an assessment of bacterial antigenic properties as
these proteins are under selective pressure and therefore can provide information regarding the
emergence of meningococcal clones within ST complexes (4).
In a previous study conducted by Harrison, et al., the increased incidence of invasive
serogroup C meningococcal disease in Maryland during 1992-2001 was identified by population-
based surveillance (4). Molecular characterization of 97 N. meningitidis serogroup C isolates
was performed by MLST. Subcapsular genotype was determined by sequence typing of the
genes encoding 3 OMPs: porA variable regions (VRs) 1 and 2, porB, and fetA VR. MLST
3

revealed that the majority of serogroup C isolates (92%) belonged to the ST11 complex. It was
also noted that ST11 complex isolates with the 2:P1.5,2:F.1-30 (porB protein class:P1.porA VR1
allele, porA VR2 allele:F.fetA allele) subcapsular genotype predominated early in the 1990s
(early OMP profile) while isolates with the 2:P1.5,2:F.3-6 subcapsular genotype predominated
late in the 1990s (late OMP profile) (Figure 1). There was complete homology between amino
acid sequences examined for PorA and PorB proteins from the early and late clones. In contrast,
early and late clone deduced FetA VR sequences differed by 23 amino acids (Table 1). These
results indicated that the increased incidence of serogroup C meningococcal disease in Maryland
during the 1990s was associated with antigenic shift at the fetA locus (4).
The genetic recombination event at fetA resulted in antigenic shift that may be
responsible for the emergence of the serogroup C ST11 complex late clone in Maryland during
the late 1990s. This genetic event may be associated with the introduction or deletion of genetic
elements that may have provided a selective advantage and contributed to the late clone
emergence. Representational difference analysis (RDA) can be used to identify the genetic
changes associated with OMP antigenic shift in serogroup C isolates and to help examine the
molecular epidemiology of clonal complexes associated with meningococcal disease.
4

00.10.20.30.40.50.60.70.80.9
1
1992-1993 1994-1995 1996-1997 1998-1999 2000-2001
Year
Cas
es p
er 1
00,0
00
Figure 1: Average annual incidence of serogroup C infection among 15-24 year olds in Maryland, 1992-2001, by OMP sequence profile. The dark gray area represents infection caused by isolates bearing the early OMP profile (ST11, 2:P1.5,2:F.1-30), the light gray area represents infection causes by isolates bearing the late OMP profile (ST11, 2:P1.5,2:F.3-6), and the black area represents infection caused by isolates with other OMP profiles. The striped areas represent the subset of early and late strains with porA deletions (4).
5

Table 1: Aligned deduced peptide sequences for PorA variable region (VR) 1 and VR2, FetA VR, and PorB loops V and VII, ST11 complex serogroup C meningococcal isolates, Maryland, 1992-2001. PorA
Strain Variable Region 1 Variable Region 2
Serogroup C Allele Deduced Sequence Allele Deduced Sequence
Early 5 PLQNIQPQVTKR 2 HFVQQTPKSQPTLVP
Late 5 PLQNIQPQVTKR 2 HFVQQTPKSQPTLVP
PorB
Loop V Loop VII
Allele Deduced Sequence Deduced Sequence
Early 2-2 KYADLNTDAERVAVNTANAHPVKDY KVNGVKDANYQYDQ
Late 2-2 KYADLNTDAERVAVNTANAHPVKDY KVNGVKDANYQYDQ
FetA
Allele Deduced Sequence
Early 1-30 GEFKI-----KD-KSGATQAEKQ-KNRDDENIVKAYRLT
Late 3-6 SQFSIPKTEKKDGKDVAKSSEQQTKDRKDETIVHSYKLS
Some of the isolates were porA nontypable. For PorB, the predominant alleles are shown. Amino acid differences are shown in red (4).
1.3 REPRESENTATIONAL DIFFERENCE ANALYSIS (RDA)
Representational difference analysis (RDA) is a method used to detect regions of DNA that
differ between two closely related genomes that may be involved in genomic evolution. RDA
was developed as a tool in eukaryotic organisms to identify genetic polymorphisms in human
neoplasia and is built upon subtractive hybridization techniques (7, 8). This technique has also
been used to discover the presence of human herpesvirus 8 in the tissues of patients with
Kaposi’s sarcoma (9).
6

RDA is a method in which one DNA population (driver) is hybridized in excess against a
second population (tester), to remove common sequences, thereby enriching for “target”
sequences unique to the tester population. RDA combines a subtractive hybridization approach
with positive selection of target sequences by taking advantage of the second-order kinetics of
DNA reannealing (8). This approach can be used as a tool for the identification of both
differences in gene content and in gene expression (10). For example, Tinsley, et al. used RDA
to investigate the differences between N. meningitidis and Neisseria gonorrhoeae pathogenic
species to determine the genetic basis for their varying pathogenicities (11). RDA has also been
used to identify sequences that are specific to N. meningitidis hyper-virulent lineage III clone
that has caused increased incidence of meningococcal disease in many countries in Europe and in
New Zealand since the 1980s (12). Based on these studies, RDA was selected as a method to
identify genetic polymorphisms among N. meningitidis serogroup C isolates that underwent
antigenic shift at fetA.
7

2.0 SPECIFIC AIM
The increased incidence of serogroup C meningococcal disease in Maryland during the 1990s
was associated with the emergence of an ST11 clone that had undergone antigenic shift at the
fetA gene locus. The specific aim of this project is to identify genetic differences between N.
meningitidis serogroup C ST11 early and late clones that may have contributed to this emergence
by representational difference analysis (RDA).
8

3.0 MATERIALS AND METHODS
3.1 STUDY ISOLATES
The N. meningitidis serogroup C isolates for this study were obtained through active, laboratory-
and population-based surveillance for meningococcal infection from January 1, 1992-December
31, 2001 as part of the Maryland Active Bacterial Core Surveillance (ABCs) component of the
multi-state Emerging Infections Program Network. A case was defined as isolation of N.
meningitidis from a usually sterile site (e.g., blood, cerebrospinal fluid) in Maryland as described
(13). Meningococcal serogrouping, serosubtyping, and MLST and OMP gene sequence analysis
were performed as previously described (4). Out of 97 N. meningitidis serogroup C isolates, 89
isolates belonged to the ST11 clonal complex. Of these 89 ST11 complex isolates, 31 had the
early clone subcapsular genotype (2:P1.5,2:F.1-30) and 39 had the late clone subcapsular
genotype (2:P1.5,2:F.3-6). 13 of the 70 total early/late clone isolates had to be eliminated from
the study group because they were not porA typable (4). 34 total early/late clone isolates were
finally chosen for further analysis by PFGE because they differed in subcapsular genotype only
at the fetA locus (OMP profile: ST11; porB 2-2; porA 5-2; fetA 1-30 or 3-6). 16 of the 34
chosen study isolates were from the early clone while the remaining 18 isolates were from the
late clone.
9

3.2 PFGE
N. meningitidis isolates were streaked from frozen glycerol stocks onto chocolate agar plates
(Becton, Dickinson, and Company, Sparks, MD) and incubated overnight at 37°C with 5% CO2.
The next day, an isolated colony was selected for subculture onto chocolate agar plate under the
same growth conditions as previously described. Bacteria were suspended in 2 ml 1X TE Buffer
(1.0M Tris-HCl, 0.1M EDTA, Sigma, St. Louis, MO) and the bacterial concentration was
adjusted to 3-5% transmission using a Vitek Special DR100 colorimeter (Hach Company,
Loveland, CO). A 200 μl volume of the bacterial suspension was mixed with 200 μl melted 2%
SeaPlaque® agarose (BioWhittaker Molecular Applications, Rockland, ME) and added to
reusable plug molds. Digestion of plugs was performed by soaking plugs in ESP buffer (final
concentration, 1% sarkosyl [Fisher Scientific, Pittsburgh, PA], 1 mg/ml Proteinase K [Sigma],
0.43M EDTA) in a 50°C waterbath overnight. The plugs were washed 4 times in 1X TE Buffer
(Sigma) in a 37°C waterbath for 30 minutes each. Plugs were cut into thirds and incubated with
the restriction enzyme NheI (New England Biolabs, Ipswich, MA) in a 37°C waterbath
overnight. Plugs were inserted into a 1% SeaKem® Gold (Cambrex Bio Science Rockland, Inc.,
Rockland, ME) agarose gel prepared with 0.5X Tris-borate-EDTA buffer (Sigma). Gels were
run on a CHEF-DR® III apparatus (BioRad Laboratories, Hercules, CA) at 14°C for 18 hours
(initial pulse time 1 sec., final pulse time 30 sec.) then 8 hours (initial pulse time 5 sec., final
pulse time 9 sec.). Gels were stained in ethidium bromide (final concentration, 2 μg/ml, Sigma),
destained in fresh distilled water, and digitally photographed on a BioRad GelDoc 2000. Gel
analysis and banding pattern interpretation was performed with BioNumerics software (Applied
Maths Inc., Austin, TX). Cluster analysis was based on unweighted pair grouping (UPGMA)
10

and the Dice similarity coefficient while Tenover, et al. criteria for genetic relatedness was used
for PFGE banding pattern interpretation (14).
3.3 RDA
The extraction of high-quality chromosomal DNA from tester and driver isolates was performed
using a phenol-chloroform extraction method previously described (10). The BD PCR-Select™
Bacterial Genome Subtraction Kit (BD Biosciences, Palo Alto, CA) used for RDA in this study
(Figure 2) is based on the suppression subtractive hybridization method and selectively amplifies
differentially expressed sequences present in tester DNA but absent from driver DNA (15). E.
coli genomic DNA was spiked with Hae III-digested φX174 DNA and used in parallel to the N.
meningitidis experimental isolates as a positive control for the following RDA procedure.
Tester and driver genomic DNA (2 μg each) was digested with RsaI restriction enzyme
(10 units/μl) and 10X restriction buffer (included in the subtraction kit) and incubated overnight
at 37°C. Tester DNA was divided into 2 reaction tubes containing T4 DNA ligase (400 units/μl)
and 5X DNA ligation buffer (250 mM Tris-HCl, 50 mM MgCl2, 10 mM DTT, 0.25 mg/ml
BSA), both provided in the kit. 2 μl of either Adaptor 1 or Adaptor 2R (Table 2) was added to
the ligation mixtures and incubated overnight at 16°C. 1 μl of 0.2M EDTA (Sigma) was added
to stop the reaction and the tubes were heated at 72°C for 5 min. to inactivate the ligase. To
verify adaptor ligation efficiency, PCR primer 1 (Table 2), which is specific to adaptor 1 and 2R
sequences, was used in combination with N. meningitidis ctrA forward primer (Table 2) to
amplify the fragment that spans the adaptor and N. meningitidis tester DNA junction. A similar
adaptor ligation efficiency PCR was performed on positive control E. coli tester DNA using PCR
11

primer 1 and 23S RNA primers (Table 2) that were provided in the subtraction kit. The Clontech
Advantage cDNA PCR kit (BD Biosciences) was used with the following PCR conditions: 72°C
for 2 min. and 94°C for 30 sec. followed by 23 cycles of 94°C for 10 sec., 65°C for 30 sec., and
68°C for 1 min.
In the first round of subtractive hybridization, 2 μl of RsaI-digested driver DNA was
added to each of the 2 tester DNA ligation reactions (Adaptor 1 and 2R) for both experimental
and positive control samples. This DNA mixture was denatured at 98°C for 1.5 min. and
allowed to hybridize by incubating at 63°C for 1.5 hours. In the second round of subtractive
hybridization, the two hybridizations with different adaptor ligations (from the first round) were
mixed together and 1 μl of fresh, denatured driver DNA (incubated at 98°C for 1.5 min.) was
added. This DNA mixture was allowed to hybridize overnight at 63°C. 200 μl dilution buffer
(20 mM HEPES-HCl, 2 M NaCl, 0.2 mM EDTA) provided in the subtraction kit was added to
the hybridization mixture and incubated at 63°C for 7 min.
Primary amplification of N. meningitidis tester-specific sequences was performed on 1 μl
of the subtracted DNA reaction in a final reaction volume of 25 μl including 19.5 μl sterile
water, 2.5 μl 10X PCR buffer, 0.5 μl dNTP mix (10 mM), 1.0 μl adaptor-specific PCR Primer 1
(10 μM), 0.5 μl 50X BD Advantage cDNA Polymerase Mix (BD Biosciences). PCR primer 1
anneals to sequences common to both adaptor 1 and adaptor 2R, thus, the primary amplification
reaction amplifies all sequences harboring any adaptor combination (Figure 2). Unsubtracted
RsaI-digested, adaptor-ligated N. meningitidis tester DNA was amplified in parallel as a control.
In addition, the primary amplification reaction was performed on subtracted and unsubtracted E.
coli DNA spiked with Hae III-digested φX174 DNA and the PCR Control Subtracted DNA
provided in the genome subtraction kit as controls for the subtractive hybridization reactions and
12

the PCR reaction. The primary PCR conditions were as follows: 72°C for 2 min. then 25 cycles
of 94°C for 30 sec., 66°C for 30 sec., and 72°C for 1.5 min. The primary PCR products were
diluted 1:40 in sterile water.
Both undiluted and diluted primary PCR products were used as DNA template in
secondary PCR amplifications. The 25 μl secondary PCR reaction included 18.5 μl sterile water,
2.5 μl 10X PCR buffer, 0.5 μl dNTP mix (10 mM), 1.0 μl adaptor-specific nested primers 1 and
2R (10 μM) (Table 2), 0.5 μl 50X BD Advantage cDNA Polymerase Mix (BD Biosciences), and
1.0 μl diluted or undiluted primary PCR product. Nested PCR conditions were as follows: 12
cycles of 94°C for 30 sec., 68°C for 30 sec., and 72°C for 1.5 min.
13

Figure 2: Schematic diagram of BD PCR-Select bacterial genome subtraction kit. Type e molecules are formed only if the sequence is present in the tester DNA, but absent in the driver DNA. Solid lines represent the RsaI-digested DNAs. Solid boxes represent Adaptor 1 and 2R DNA sequences that are homologous to PCR Primer 1. Open boxes represent unique Adaptor 1 DNA sequences and are homologous to Nested Primer 1. Shaded boxes represent unique Adaptor 2R and are homologous to Nested Primer 2R sequence (16).
14

Table 2: Sequences of the BD PCR-Select adaptors and PCR primers used for RDA.
Adaptor or Primer Sequence
Adaptor 1 CTAATACGACTCACTATAGGGCTCGAGCGGCCGCCCGGGCAGGT
Adaptor 2R CTAATACGACTCACTATAGGGCAGCGTGGTCGCGGCCGAGGT
PCR Primer 1 CTAATACGACTCACTATAGGGC
Nested Primer 1 TCGAGCGGCCGCCCGGGCAGGT
Nested Primer 2R AGCGTGGTCGCGGCCGAGGT
ctrA Forward TGTGTTCCGCTATACGCCATT
ctrA Reverse GCCATATTCACACGATATACC
23S RNA Forward CTACCTTAGGACCGTTATAGTTAC
23S RNA Reverse GAAGGAACTAGGCAAAATGGTGCC
All primers and adaptors except ctrA forward and reverse primers were provided in the Clontech Bacterial Genome Subtraction kit (16).
3.4 CLONING OF RDA-GENERATED FRAGMENTS
3.4.1 Cloning of RDA Secondary PCR Product
A 10 μl aliquot of the final RDA tester-specific secondary PCR product was added to 1 μl of
pCR®-XL-TOPO® cloning vector (Invitrogen, Carlsbad, CA) and incubated at room
temperature for 5 min. Either 1 μl, 2 μl, or 4 μl of the cloning reaction was transformed into One
Shot® TOP10 E. coli electrocompetent cells (Invitrogen). E. coli cells were electroporated with
a BioRad MicroPulser™ and 450 μl of S.O.C. medium (2% tryptone, 0.5% yeast extract, 10 mM
sodium chloride, 2.5 mM potassium chloride, 10 mM magnesium chloride, 10 mM magnesium
sulfate, 20 mM glucose, Invitrogen) was immediately added to cells. The bacterial solution was
shaken at 37°C for 1 hour to allow expression of the antibiotic resistance genes. 50 μl, 150 μl,
and a resuspended cell pellet in 150 μl S.O.C. medium were each streaked on 50 μg/ml
kanamycin (Sigma) Luria-Bertani (LB) agar plates and incubated overnight at 37°C.
15

A total of 184 colonies were selected at random, sub-cultured onto kanamycin LB/agar
plates, and incubated overnight at 37°C. Of the 184 colonies, 132 were screened for the insertion
of an RDA-generated fragment by colony PCR with M13 primers (M13 forward, 5’-
GTAAAACGACGGCCAG-3’ and M13 reverse, 5’-CAGGAAACAGCTATGAC-3’)
corresponding to the pCR-XL-TOPO vector. Briefly, isolated colonies were resuspended in 50
μl dH2O and 1 μl of this bacterial suspension was added to a 50 μl AmpliTaq Gold® PCR
reaction (Applied Biosystems, Foster City, CA) for amplification. PCR conditions were as
follows: 95°C for 5 min. then 30 cycles of 95°C for 1 min., 55°C for 1 min., and 72°C for 1 min
followed by 72°C for 7 min. Resulting PCR products were electrophoresed on 1% agarose
(Sigma) and ethidium bromide gels with 200 ng of 100 bp (Invitrogen) or φX174/Hae III ladder
(Invitrogen) to determine the size of the cloned fragments. Gel images were digitally captured
on a BioRad GelDoc 2000.
3.4.2 Cloning of RDA Gel-Purified PCR Bands
A 50 μl reaction of RDA tester-specific secondary PCR product was divided into 5 aliquots (10
μl/lane) and run on a 1% agarose/ethidium bromide gel. 4 prominent bands of sizes 1200, 1000,
900, and 850 bp (Bands 1, 2, 3, and 4) were excised from each lane with a scalpel for gel
purification with the QIAquick gel extraction kit (Qiagen, Valencia, CA) using the
manufacturer’s protocol. Duplicate samples were pooled, vacuum-dried, and resuspended in 5 μl
of sterile water in order to maximize DNA concentrations. 4 μl of the gel-purified product from
each of the 4 bands was added to 1 μl of TOPO TA Cloning® vector (Invitrogen) and incubated
for 30 min. at room temperature. 2 μl of the cloning reaction was transformed into One Shot®
TOP10 E. coli electrocompetent cells (Invitrogen). E. coli cells were electroporated and 250 μl
16

of S.O.C. medium (Invitrogen) was immediately added to cells. The bacterial solution was
shaken at 37°C for 1 hour to allow expression of the antibiotic resistance genes. 50 μl and 150 μl
of the bacterial solution were each streaked on kanamycin LB/agar plates and incubated
overnight at 37°C.
A total of 80 colonies from the Band 1 transformation, 87 from Band 2, 57 from Band 3,
and 87 colonies from Band 4 were selected at random, sub-cultured onto kanamycin LB/agar
plates, and incubated overnight at 37°C. These colonies were then screened for the insertion of a
RDA-generated fragment into the TOPO TA vector using M13 PCR primers corresponding to
the vector. Briefly, isolated colonies were resuspended in 50 μl dH2O and 1 μl of this bacterial
suspension was added to a 50 μl AmpliTaq Gold® PCR reaction (Applied Biosystems) for
amplification. PCR conditions were as follows: 95°C for 5 min. then 30 cycles of 95°C for 1
min., 55°C for 1 min., and 72°C for 1 min followed by 72°C for 7 min. Resulting PCR products
were electrophoresed on 1% agarose/ethidium bromide gels to determine the size of the cloned
fragments as previously described.
3.4.3 DNA Sequencing
DNA sequencing was performed on PCR products using M13 forward and reverse primers with
the ABI PRISM® BigDye Terminator Cycle Sequencing Kit v3.1 (Applied Biosystems). PCR
products were prepared for sequencing by precipitation with 20% polyethylene glycol (PEG,
Sigma) in 2.5M NaCl for 1 hour at room temperature. The precipitated product was centrifuged
for 1 hour at 2750 x g and washed with 150 μl 70% ethanol twice. The cleaned PCR product was
resuspended in 15 μl dH2O and 1 μl of the PCR product was used as template in the cycle
sequencing reactions. Sequencing conditions were as follows: 30 cycles of 96°C for 10 sec.,
17

50°C for 5 sec., and 60°C for 2 min. Sequence analysis was performed with DNAstar SeqMan
and MegAlign software (DNAstar, Madison, WI). Resulting DNA Sequences were screened for
homologies with known sequence entries at the National Center for Biotechnology Information
database (Bethesda, MD) by BLASTN analysis (17).
3.5 SOUTHERN HYBRIDIZATION
3.5.1 Labeling of Tester and Driver DNA Probes
The DIG High Prime random-primed DNA labeling and detection kit (Roche, Mannheim,
Germany) was used for digoxigenin labeling of tester and driver genomic DNA and subsequent
detection of tester specific hybrids by Southern Blotting. 1 μg of purified tester and driver
genomic DNA was digested with EcoR I restriction enzyme (10 U/µl, Invitrogen) and 10X
REact®3 buffer (Invitrogen) and incubated overnight at 37°C. After restriction digest clean-up
by phenol-chloroform precipitation, the DNA pellet was resuspended in 16 μl sterile water and
added to 4 μl DIG-High Prime (Roche). Roche DIG-High Prime is a labeling mixture containing
optimal concentrations of random primers, nucleotides, DIG-dUTP (alkali-labile), Klenow
enzyme, and buffer components for the efficient random primed labeling of DNA. The probe
was incubated overnight at 37°C then heated to 65°C for 10 min. Probe yield was determined by
blotting serial dilutions of resulting DIG-labeled tester or driver genomic DNA on a positively-
charged nylon membrane (Roche) and subjecting the membrane to immunologic detection with
anti-digoxigenin-alkaline phosphatase conjugate (Roche) and CSPD (chemiluminescent substrate
for alkaline phosphatase, Roche) followed by exposure of X-ray film for 1 – 2 hours (Kodak,
Rochester, NY). The relative intensities of the dilution series were compared to serial dilutions
18

of the DIG-labeled control DNA (pBR328 DNA, 5 μg/ml) to estimate probe yields. The
resulting DIG labeled tester and driver genomic DNA probes were diluted to approximately 25
ng/ml in DIG Easy Hyb buffer (Roche) for subsequent Southern Blot analysis.
3.5.2 Southern Blot
The RDA-generated cloned PCR products representing potential tester-specific sequences were
denatured at 96°C for 5 min. and immediately placed on an ice bath. 1 μl of PCR product was
blotted in duplicate on 2 separate positively-charged nylon membranes designated for tester and
driver probes. Membranes were allowed to dry completely then placed on Whatman® filter
paper #3 (Whatman International Ltd., Maidstone, England) soaked with 2X AccuGENE® SSC
(3.0M NaCl and 0.3M sodium citrate, Cambrex Bio Science Rockland, Inc.). Each membrane
was placed face-down on a UV transilluminator (GelDoc 2000, BioRad) for approximately 4
min. to crosslink the dotted RDA-generated PCR products. Prehybridization was performed by
placing each membrane in a sealed plastic bag with DIG Easy Hyb buffer (Roche) and
incubating at 42°C in a rotating waterbath for 30 min. Hybridization solutions for each DIG
labeled probe was made by denaturing the probes in boiling water for 5 min. then immediately
adding the denatured probe to 4 ml of DIG Easy Hyb buffer (25 ng random-primed labeled
probe/1 ml DIG Easy Hyb buffer). The prehybridization buffer was poured off each membrane
and hybridization buffer containing either tester or driver DIG-labeled probes was added. The
membranes were incubated overnight in a 42°C rotating waterbath. The next day, the hybridized
membranes were washed twice for 5 min. at room temperature in 200 ml low stringency buffer
(2X SSC, 0.1% SDS) and twice for 15 min. at 65°C in 200 ml high stringency buffer (0.5X SSC,
0.1% SDS) to eliminate non-specific probe.
19

Immunologic detection of bound probes was performed according to the manufacturer’s
instructions (Roche). Briefly, the hybridized membranes were rinsed in 100 ml 1X washing
buffer (0.1M Maleic acid, 0.15M NaCl, 0.3% [v/v] Tween 20) for 2 min. followed by incubation
in 100 ml blocking solution (supplied in kit) for 30 min. at room temperature. The membranes
were incubated for 30 min. in 20 ml anti-digoxigenin-AP solution (1:10,000 dilution), rinsed 2
times in 100 ml 1X washing buffer for 15 min. and equilibrated 2-5 min. in 20 ml 1X detection
buffer (0.1M Tris-HCl, 0.1M NaCl). Approximately 1 ml of ready-to-use CSPD was added until
membranes were evenly soaked and incubated for 5 min. at room temperature. Membranes were
sealed in plastic bags and placed in a 37°C waterbath for 10 min. to enhance the luminescence
reaction. The blots were exposed to X-ray film for 1-3 hours at room temperature and film was
developed to reveal detection.
3.6 GENETIC ELEMENT PCR
3.6.1 DNA Extractions
DNA extractions were performed on 16 early clone and 18 late clone serogroup C ST11 isolates
including RDA tester (MD 1400) and driver (MD1097) isolates using a boil preparation method.
N. meningitidis isolates were streaked from frozen glycerol stocks onto chocolate agar plates
(Becton, Dickinson, and Company) and incubated overnight at 37°C with 5% CO2. The next
day, a thick suspension of organisms was placed in 0.5 ml of BioWhittaker™ phosphate buffer
saline (Cambrex Bio Science, Inc., Walkersville, MD), boiled for 20 min., centrifuged, and the
supernatant was kept for use. Plasmid preparations were also performed on RDA tester
20

(MD1400) and driver (MD1097) isolates using the Wizard® Plus Minipreps DNA purification
system by following the manufacturer’s protocol (Promega, Madison, WI).
3.6.2 pJS-B Plasmid PCR
Primers were designed based on the published pJS-B plasmid sequence (18) (Genbank accession
no. AJ277475) using the DNAstar Primer Select software and are listed in Table 3. 1 μl of
template DNA from phenol-chloroform, plasmid, or boil preparations of 34 total early and late
clone isolates was added to a 25 μl AmpliTaq Gold® PCR reaction (Applied Biosystems) for
amplification. Each 25 μl PCR reaction included 16.2 μl sterile water, 2.5 μl 10X buffer, 2.5 μl
MgCl2 (25mM), 0.5 μl dNTP mix (10 mM), 1.0 μl forward and reverse primers (10 μM), and 0.5
μl AmpliTaq Gold polymerase (5 U/μl). PCR conditions were as follows: 95°C for 5 min. then
35 cycles of 95°C for 1 min., 54°C for 1 min., and 72°C for 1 min. followed by 72°C for 7 min.
3.6.3 IS1301 PCR
Primers were designed based on published insertion sequence IS1301 data (19) (Genbank
accession no. Z49092) and are listed in Table 3. 1 μl of phenol-chloroform or boil prep template
DNA from 34 total early and late clone isolates was added to a 25 μl AmpliTaq Gold® PCR
reaction (Applied Biosystems) for amplification. Each 25 μl PCR reaction included 16.2 μl
sterile water, 2.5 μl 10X buffer, 2.5 μl MgCl2 (25mM), 0.5 μl dNTP mix (10 mM), 1.0 μl
forward and reverse primers (10 μM), and 0.5 μl AmpliTaq Gold polymerase (5 U/μl). PCR
conditions were as follows: 95°C for 5 min. then 35 cycles of 95°C for 1 min., 54°C for 1 min.,
and 72°C for 1 min. followed by 72°C for 7 min.
21

LMK56-2 forward and reverse primers were created using the LMK56 RDA-generated
fragment sequence that had partial homology to IS1301 (Table 3, Figure 12). 1 μl of phenol-
chloroform or boil prep template DNA from 34 total early and late clone isolates was added to a
25 μl AmpliTaq Gold® PCR reaction (Applied Biosystems) for amplification. Each 25 μl PCR
reaction included 16.2 μl sterile water, 2.5 μl 10X buffer, 2.5 μl MgCl2 (25mM), 0.5 μl dNTP
mix (10 mM), 1.0 μl forward and reverse primers (10 μM), and 0.5 μl AmpliTaq Gold
polymerase (5 U/μl). PCR conditions were as follows: 95°C for 5 min. then 35 cycles of 95°C
for 1 min., 54°C for 1 min., and 72°C for 1 min. followed by 72°C for 7 min.
Table 3: PCR primers for detection of genetic elements generated by RDA.
Primer Set Sequence Product Size (bp) Anneal. Temp
pJS-B F 5’-GTGCAAATGGGTCTAAAAATGAAC-3’ 1051 54°C pJS-B R 5’-AAAAACGCCGCTTGTATCT-3’
IS1301 F 5’-AGAACCGCAATAACTGACAACATA -3’ 484 54°C IS1301 R 5’-GCGATAAAATACTGGGCTTCTT -3’
LMK56-2 F 5’-CATTCTCAGCCGCGTATTTCTTCA-3’ 363 54°C LMK56-2 R 5’-CTAGTAACGGCCGCCAGTGTGCT-3’
22

4.0 RESULTS
4.1 SELECTION OF RDA TESTER AND DRIVER
Thirty-four N. meningitidis serogroup C ST11 early/late clone isolates were chosen for analysis
by PFGE because they differed in subcapsular genotype only at the fetA locus (OMP profile:
ST11; porB 2-2; porA 5-2; fetA 1-30 or 3-6). PFGE was performed to determine genetic
relatedness among the isolates and to identify a candidate tester/driver pair for RDA. With a few
exceptions, the majority of the isolates clustered into either early or late clonal groups (Figure 3)
which correlates with the subcapsular OMP genotyping data defined by porA, porB and fetA.
The early clonal group was further subdivided into 2 clusters by PFGE. In order to maximize the
number of tester-specific sequences generated by RDA, tester/driver pairs with substantial band
differences by PFGE were chosen for RDA. Based on the number of band differences and the
percent similarities within the PFGE dendrogram, isolate MD1097 was chosen as the
representative early clone isolate and MD1400 as the representative late clone isolate for RDA.
These isolates exhibit a 10-band difference by PFGE (Figure 4). It is possible that the PFGE
defined genetic differences may be due to recombination events involved in the observed
emergence of the late clone which may be detected by RDA.
23

100
9590858075
.
.
.
.
.
.
.
.
.
.
.
.
.
.
.
.
.
.
.
.
.
.
.
.
.
.
.
.
.
.
.
.
.
.
.
.
.
.
.
.
.
.
.
.
.
.
.
.
.
.
.
.
.
.
.
.
.
.
.
.
.
.
.
.
.
.
.
.
1.301.301.301.301.301.303.63.6
3.6
3.63.63.63.63.63.63.63.63.63.63.63.63.6
3.63.6
55
5
5555555555555
55
22
2
2222222222222
22
2.22.2
2.2
2.22.22.22.22.22.22.22.22.22.22.22.22.2
2.22.2
1997-02-131997-03-20
1996-06-19
1999-04-242001-08-232000-03-052000-09-152001-02-012001-05-081999-11-292000-01-051999-02-221999-02-231999-03-061999-07-041999-08-20
1995-05-092000-12-12
.
.
.
.
.
.
.
.
.
.
.
.
.
.
.
.
.
.
.
.
.
.
.
.
.
.
.
.
.
.
.
.
.
.
.
.
MD01230MD01241
MD01194
MD01320MD01410MD01353MD01370MD01382MD01400MD01345MD01350MD01307MD01308MD01311MD01329MD01337
MD01137MD01373
1.301.301.30
1.30
1.30
1.301.301.301.301.30
555555
555
5
5
55555
222222
222
2
2
22222
2.22.22.22.22.22.2
2.22.22.2
2.2
2.2
2.22.22.22.22.2
1995-12-141997-01-111997-06-191999-03-241994-05-081992-06-08
1997-03-221993-06-241993-06-24
1994-09-05
1992-10-26
1993-02-241993-03-071993-04-061993-04-061994-02-05
.
.
.
.
.
.
.
.
.
.
.
.
.
.
.
.
.
.
.
.
.
.
.
.
.
.
.
.
.
.
.
.
.
.
.
.
.
.
.
.
.
.
.
.
.
.
.
.
MD01161MD01221MD01254MD01315MD01100MD01031
MD01243MD01068MD01069
MD01112
MD01040
MD01050MD01054MD01060MD01059MD01097
fetA porA porB Date ID#
Early
Early
Early
Early
Early
Late
Late
Late
Late
Tester
Driver
.
.
.
.
.
.
.
.
.
.
.
.
.
.
.
.
.
.
.
.
.
.
.
.
.
.
.
.
.
.
.
.
1.301.301.301.301.301.30
1.301.301.30
1.30
1.30
1.301.301.301.301.30
555555
555
5
5
55555
222222
222
2
2
22222
2.22.22.22.22.22.2
2.22.22.2
2.2
2.2
2.22.22.22.22.2
1995-12-141997-01-111997-06-191999-03-241994-05-081992-06-08
1997-03-221993-06-241993-06-24
1994-09-05
1992-10-26
1993-02-241993-03-071993-04-061993-04-061994-02-05
.
.
.
.
.
.
.
.
.
.
.
.
.
.
.
.
.
.
.
.
.
.
.
.
.
.
.
.
.
.
.
.
.
.
.
.
.
.
.
.
.
.
.
.
.
.
.
.
MD01161MD01221MD01254MD01315MD01100MD01031
MD01243MD01068MD01069
MD01112
MD01040
MD01050MD01054MD01060MD01059MD01097
fetA porA porB Date ID#
100
9590858075
.
.
.
.
.
.
.
.
.
.
.
.
.
.
.
.
.
.
.
.
.
.
.
.
.
.
.
.
.
.
.
.
.
.
.
.
3.63.6
3.6
3.63.63.63.63.63.63.63.63.63.63.63.63.6
3.63.6
55
5
5555555555555
55
22
2
2222222222222
22
2.22.2
2.2
2.22.22.22.22.22.22.22.22.22.22.22.22.2
2.22.2
1997-02-131997-03-20
1996-06-19
1999-04-242001-08-232000-03-052000-09-152001-02-012001-05-081999-11-292000-01-051999-02-221999-02-231999-03-061999-07-041999-08-20
1995-05-092000-12-12
.
.
.
.
.
.
.
.
.
.
.
.
.
.
.
.
.
.
.
.
.
.
.
.
.
.
.
.
.
.
.
.
.
.
.
.
MD01230MD01241
MD01194
MD01320MD01410MD01353MD01370MD01382MD01400MD01345MD01350MD01307MD01308MD01311MD01329MD01337
MD01137MD01373
Early
Early
Early
Early
Early
Late
Late
Late
Late
Tester
Driver
Figure 3: PFGE clustering of serogroup C, ST11, porB 2-2, porA 5-2 isolates into early and late clones. Early clone isolates are fetA 1-30 and late clone isolates (red and italicized) are fetA 3-6. The isolates selected for Tester (MD1400) and Driver (MD1097) for RDA are denoted.
fetA DateID#100
908070
.
.
.MD01097
MD01400
....
.
.
.
.
.
.
.
.
.
.
.
.
.
.
.
.
.
.
.
f1-30
f3-6
.
.
.
.
.
.
1994-02.
2001-05.
.
.
.
.
.
.
Driver
Tester
fetA DateID#100
908070
.
.
.MD01097
MD01400
....
.
.
.
.
.
.
.
.
.
.
.
.
.
.
.
.
.
.
.
f1-30
f3-6
.
.
.
.
.
.
1994-02.
2001-05.
.
.
.
.
.
.
Driver
Tester
Figure 4: PFGE comparison of driver (early clone) and tester (late clone) used for RDA. Isolate MD1097 was chosen as driver and isolate MD1400 was chosen as tester for RDA. The red arrows denote the 10 band differences between tester and driver isolates by PFGE.
24
4.2 RDA ADAPTOR LIGATION EFFICIENCY ANALYSIS
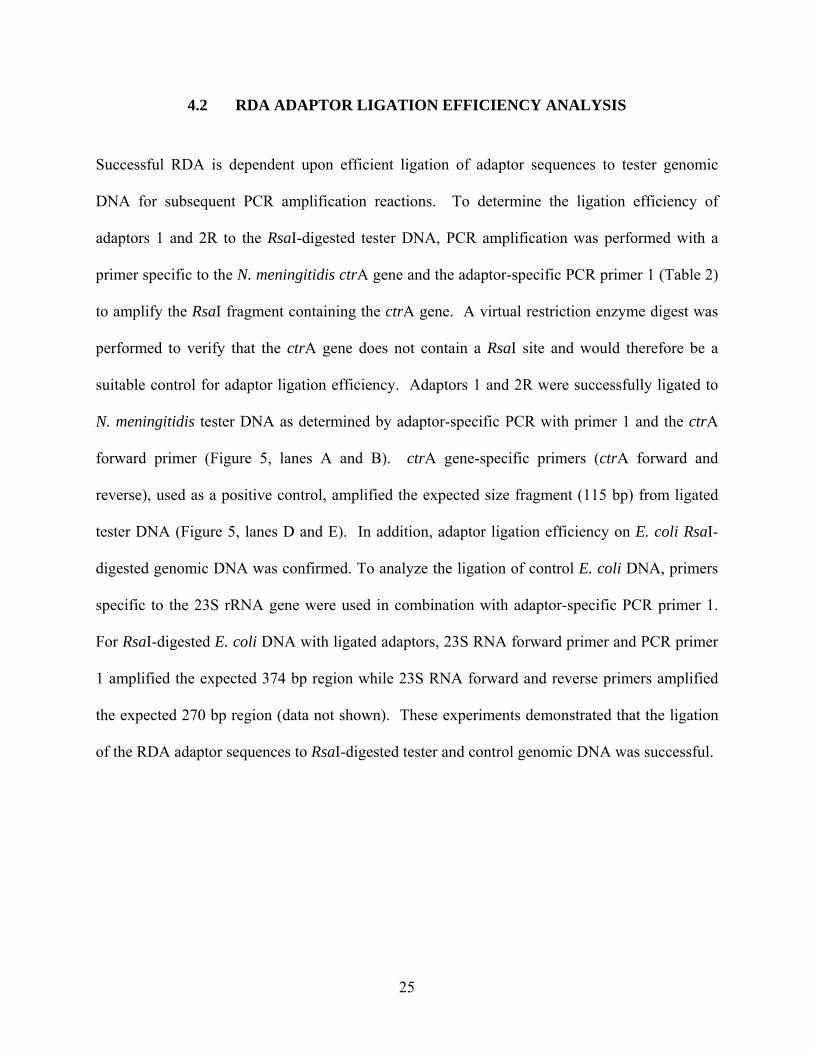
Successful RDA is dependent upon efficient ligation of adaptor sequences to tester genomic
DNA for subsequent PCR amplification reactions. To determine the ligation efficiency of
adaptors 1 and 2R to the RsaI-digested tester DNA, PCR amplification was performed with a
primer specific to the N. meningitidis ctrA gene and the adaptor-specific PCR primer 1 (Table 2)
to amplify the RsaI fragment containing the ctrA gene. A virtual restriction enzyme digest was
performed to verify that the ctrA gene does not contain a RsaI site and would therefore be a
suitable control for adaptor ligation efficiency. Adaptors 1 and 2R were successfully ligated to
N. meningitidis tester DNA as determined by adaptor-specific PCR with primer 1 and the ctrA
forward primer (Figure 5, lanes A and B). ctrA gene-specific primers (ctrA forward and
reverse), used as a positive control, amplified the expected size fragment (115 bp) from ligated
tester DNA (Figure 5, lanes D and E). In addition, adaptor ligation efficiency on E. coli RsaI-
digested genomic DNA was confirmed. To analyze the ligation of control E. coli DNA, primers
specific to the 23S rRNA gene were used in combination with adaptor-specific PCR primer 1.
For RsaI-digested E. coli DNA with ligated adaptors, 23S RNA forward primer and PCR primer
1 amplified the expected 374 bp region while 23S RNA forward and reverse primers amplified
the expected 270 bp region (data not shown). These experiments demonstrated that the ligation
of the RDA adaptor sequences to RsaI-digested tester and control genomic DNA was successful.
25

A B C D E F MW MW
1078 1353 100
200
Figure 5: RDA ligation efficiency analysis by PCR amplification. N. meningitidis RsaI-digested tester DNA with ligated adaptors 1 or 2R was amplified with adaptor-specific primers (PCR primer 1 and ctrA forward) (lanes A-C) or gene-specific primers (ctrA forward and reverse) (lanes D-F) and run on a 1% agarose/ethidium bromide gel. Lanes: A, tester with adaptor 1; B, tester with adaptor 2R; C, water; D, tester with adaptor 1; E, tester with adaptor 2R; F, water. Molecular weight (MW) markers listed are in base pairs (bp). φX174 RF DNA/Hae III ladder is on the left side of the figure and a 100-bp ladder is on the right side.
4.3 RDA-GENERATED TESTER SPECIFIC SEQUENCES
After being ligated to adaptors 1 and 2R, subtracted N. meningitidis tester DNA (late clone)
underwent two rounds of subtractive hybridization with driver DNA (early clone). Primary PCR
amplification with adaptor-specific PCR primer 1 was used to exponentially amplify only ds
DNAs with adaptor sequences on each end (Figure 2). Diluted (1:40) and undiluted primary
PCR products were used as DNA template for a secondary PCR amplification with adaptor-
specific nested primers 1 and 2R to further reduce background and enrich for tester-specific
sequences. The secondary PCR amplification generated at least 3 late clone-specific bands that
were absent from the early clone as defined by RDA (Figure 6, lanes A & B). Unsubtracted
RsaI-digested, adaptor-ligated N. meningitidis tester DNA amplified in parallel generated an
26

expected smear of PCR product representative of the many adaptor-ligated RsaI fragments from
the unsubtracted sample (Figure 6, lanes C & D). In addition, the secondary amplification
reactions were performed on subtracted and unsubtracted control E. coli tester DNA containing 1
copy of Hae III-digested φX174 DNA per E. coli genome. PCR amplification of the subtracted
E. coli tester DNA with adaptor specific primers generated major bands that corresponded to the
φX174/Hae III fragments on the molecular weight ladder (Figure 6, lanes E & F) while the
unsubtracted E. coli DNA appeared as an expected smear (Figure 6, lanes G & H). The PCR
Control Subtracted DNA from the genome subtraction kit provided a positive PCR control
containing a successfully subtracted mixture of Hae III-digested φX174 DNA fragments (Figure
6, lanes I & J). Thus, PCR amplification with primers specific to the ligated adaptors 1 and 2R
successfully amplified at least 3 RsaI fragments from the subtracted N. meningitidis late clone
tester DNA which may represent late clone specific DNA.
MW A B C D GE F IH J
13531078872
603
MW A B C D GE F IH J
13531078872
603
Figure 6: Nested PCR amplification of subtracted and unsubtracted tester DNA. Lanes: A & B, N. meningitidis subtracted tester DNA undiluted and diluted; C & D, N. meningitidis unsubtracted tester DNA undiluted and diluted; E & F, E. coli subtracted tester DNA containing Hae III-digested φX174 DNA undiluted and diluted; G & H, E. coli unsubtracted tester DNA containing Hae III-digested φX174 DNA undiluted and diluted; I & J, PCR control subtracted DNA containing Hae III-digested φX174 DNA undiluted and diluted. Molecular weight (MW) markers of φX174 RF DNA/Hae III ladder are listed in base pairs (bp).
27

4.4 CLONING OF RDA GENERATED TESTER PCR PRODUCTS
The N. meningitidis tester PCR products generated by RDA were cloned in 2 separate
experiments. In the first experiment, the entire tester-specific RDA secondary PCR reaction was
cloned into pCR®-XL-TOPO®. One hundred eighty-four transformants were randomly selected
and sub-cultured onto kanamycin LB/agar plates. Of these transformants, 132 colonies grew and
were screened for fragment insertion using M13 primers. PCR with the M13 primers identified
119 M13 PCR products with varying fragment insert sizes. Figure 7 shows 40 of these M13
PCR products run on a 1% agarose/ethidium bromide gel displaying fragment sizes ranging from
400-2000 base pairs. These PCR products were further screened by Southern blotting with tester
and driver digoxigenin-labeled probes and DNA sequenced to determine if these sequences were
tester specific which is described in the next section.
For the second cloning experiment, a 50 μl reaction of RDA tester-specific secondary
PCR product was divided into 5 aliquots (10 μl/lane) and run on a 1% agarose/ethidium bromide
gel (Figure 8). The 4 most prominent bands of sizes 1200, 1000, 900, and 850 bp (Bands 1, 2, 3,
and 4) were excised, gel-purified, concentrated, and cloned into a TOPO TA Cloning® vector
(Figure 9). A total of 80 colonies from the Band 1 transformation, 87 from Band 2, 57 from
Band 3, and 87 colonies from Band 4 were selected at random, sub-cultured onto kanamycin
LB/agar plates, and screened by colony PCR for fragment insertion using M13 primers. One
colony from the Band 1 transformation, no colonies from the Band 2 transformation, 5 colonies
from the Band 3 transformation, and 1 colony from the Band 4 transformation were positive for
fragment insertion into the vector. These 7 total M13 PCR products were DNA sequenced to
determine their identity by BLAST analysis.
28

20721500
600
200
20721500
600
200 Figure 7: PCR amplification of RDA-subtracted fragments with M13 primers. The entire tester-specific RDA secondary PCR reaction was cloned into pCR®-XL-TOPO® vector and transformants were screened for fragment insert by PCR with M13 primers. Forty M13 PCR products were run on a 1% agarose/ethidium bromide gel. Molecular weight (MW) markers of a 100 bp ladder are listed in base pairs (bp).
1353
1078872
603
Band 1
Band 3Band 2
Band 4
1353
1078872
603
Band 1
Band 3Band 2
Band 4
Figure 8: Preparative gel of secondary PCR products from N. meningitidis subtracted tester DNA. A 50 μl reaction of RDA tester-specific secondary PCR product was divided into 5 aliquots (10 μl/lane) and run on a 1% agarose/ethidium bromide gel. 4 prominent bands of sizes 1200, 1000, 900, and 850 bp (Bands 1, 2, 3, and 4) were excised, gel-purified, duplicates pooled together, vacuum-dried, and cloned into a TOPO TA Cloning® vector. Molecular weight (MW) markers of φX174 RF DNA/Hae III ladder are listed in base pairs (bp).
29

13531078
872
AMW C DB MW
603
1353135310781078
872872
AMW C DB MW
603
Figure 9: Gel-purified secondary PCR products from N. meningitidis subtracted tester DNA. 4 prominent bands from the 5 lanes in Figure 7 were excised and gel-purified using the Qiagen QIAquick gel extraction kit then duplicate samples were pooled together. 10 μl of gel-purified pooled products for Bands 1-4 was run on a 1% agarose/ethidium bromide gel. Lanes: A, Band 1; B, Band 2; C, Band 3; D, Band 4. Molecular weight (MW) markers of φX174 RF DNA/Hae III ladder are listed in base pairs (bp).
4.5 SOUTHERN BLOT ANALYSIS
After cloning the entire RDA secondary PCR reaction into a pCR®-XL-TOPO® cloning vector,
119 M13 PCR products with fragment insert were screened by Southern blotting with tester and
driver digoxigenin-labeled probes to determine if the inserted fragments were tester-specific. A 1
μl aliquot of each M13 PCR product was blotted in duplicate on 2 separate positively-charged
nylon membranes for hybridization with either tester or driver probes. Of the 119 M13 PCR
products, 17 (14.3%) were more reactive to the tester DIG-labeled probe in comparison to the
driver DIG-labeled probe. Figure 10 shows a representative Southern blot of 58 secondary PCR
products blotted in duplicate with either tester or driver DIG-labeled genomic DNA probes.
Some background hybridization from the driver probe was observed for all the M13 PCR
products and was most likely due to non-specific hybridization from the EcoR I-digested DIG
labeled genomic DNA. The percentage of clones in the subtracted library corresponding to
tester-specific DNA by Southern blotting is typically >50% for the Clontech Bacterial Genome
Subtraction kit as stated by the user’s manual (16). Therefore, the RDA experiment for the N.
meningitidis ST11 serogroup C late clone was not optimal.
30

A. MD1400 Tester DIG-labeled Probe B. MD1097 Driver DIG-labeled ProbeA. MD1400 Tester DIG-labeled Probe B. MD1097 Driver DIG-labeled Probe
Figure 10: Southern blots of 58 secondary PCR products with either tester or driver DIG-labeled genomic DNA probes. 1 μl of M13 PCR product was blotted in duplicate on 2 separate positively-charged nylon membranes designated for tester and driver digoxigenin-labeled probes. The red boxes outline 7 M13 PCR products that were more specific to the tester probe in comparison to the driver probe.
4.6 HOMOLOGIES OF RDA-SUBTRACTED TESTER-SPECIFIC SEQUENCES
The 17 RDA-subtracted tester-specific M13 PCR products identified by Southern blot were
sequenced and a BLAST search was performed on the resulting sequences to find homologies
(Table 4). The sequenced insert fragments varied in size from 500 to >1500 bp and all 17 of
tester-specific sequences were homologous to either N. meningitidis IS1301 insertion sequence
(Genbank accession no. Z49092) or N. meningitidis pJS-B plasmid sequence (Genbank accession
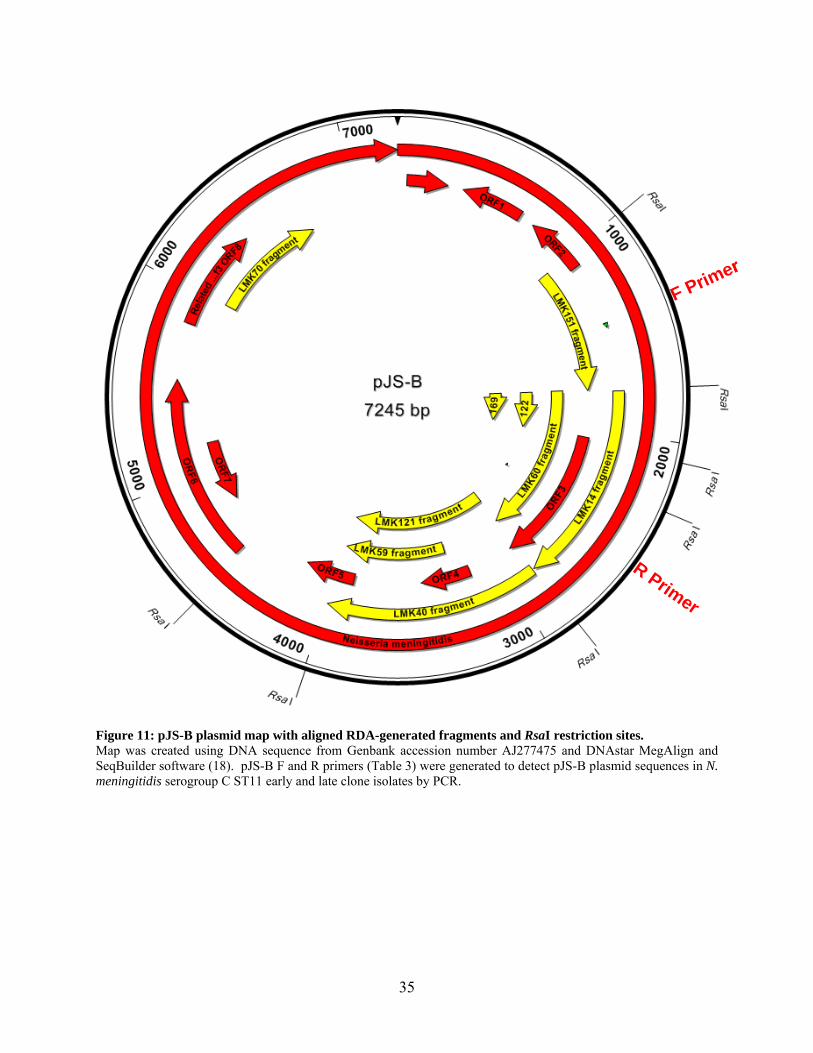
no. AJ277475) with percent homologies ranging from 92.4% to 100%. The 7.2 kb pJS-B
plasmid has 8 open reading frames (ORFs) and was first described in N. meningitidis clones of
the electrophoretic type (ET)-37 complex and the A4 cluster (18). A virtual map of pJS-B
plasmid was created using published sequence and DNAstar MegAlign and SeqBuilder software
(Figure 11). The 9 RDA-generated fragments aligned at different locations on pJS-B plasmid.
Eight of the cloned fragments corresponded to the predicted RsaI restriction fragments for pJS-B
31

and spanned the 1000-4000 bp area of the plasmid. Some of these predicted RsaI fragments
were cloned multiple times and corresponded to the predicted RsaI restriction enzyme pattern for
pJS-B (e.g. LMK 14 and 60, or LMK 40, 59 and 121, Figure 11). One RDA-generated fragment
(LMK70, 809 bp) demonstrated 92% homology to 800 nucleotides in the 6000 bp region of the
plasmid. This fragment did not have corresponding RsaI restriction sites predicted on the pJS-B
plasmid map (Figure 11, LMK70). This RDA experiment did not generate clones specific to the
RsaI fragments between 4000 bp and 4500bp or between 4500 and 1000 bp on the pJS-B
plasmid.
The insertion sequence element, IS1301, is present in multiple copies scattered over the
meningococcal genome and is known to be involved in N. meningitidis genomic recombination
(19). There were 8 RDA-generated fragments that showed homology to IS1301. The majority
of the fragments had homology to the 180-844 bp region of this element and corresponded to the
predicted RsaI restriction fragments for IS1301 (Figure 12). There were 3 overlapping fragments
(LMK56, 132, 141, Figure 12) that extended 585 bp past the end of IS1301. This 585 bp region
had no known homology to any other sequence in the BLAST database. The 5’ ends of the
LMK 132 and 141 fragments corresponded to the predicted RsaI restriction sites in IS1301.
While the LMK56 fragment showed approximately 200 bp homology to the 3’ end of the IS1301
element, there was no predicted RsaI site corresponding to the start of the LMK56 sequence.
To determine potential locations of IS1301 in the serogroup C genome, a search of the
unannotated serogroup C FAM18 genomic sequence was performed (http://www.sanger.ac.uk/ ).
The 844 bp sequence corresponding to IS1301 (accession no. Z49092) was not found in the
FAM18 genome. This result indicates that the IS1301 element identified by RDA on the
serogroup C ST11 late clone is not present in all serogroup C strains.
32

In order to determine the identity of the 585 bp region of unknown homology from LMK
fragments 56, 132 and 141, we searched the FAM18 genome with this sequence. A 500 bp
fragment with 99% nucleotide identity was identified at ~890 kb region of the serogroup C
FAM18 genome. BLAST analysis of 5kb flanking regions of this region of the FAM18 genome
did not identify any DNA homologies. Thus, RDA identified a unique IS1301 element from the
ST11 serogroup C late clone whose 3’ flank is homologous to a 500 bp region of unknown
function in the serogroup C FAM18 genome.
All 7 M13 PCR products obtained from the second cloning experiment with the 4 gel-
purified RDA bands produced ~700 bp band when gel electrophoresed. After being DNA
sequenced, it was noted that all 7 sequences aligned with each other, were 415 bp in length, and
were homologous to N. meningitidis serogroup A, strain Z2491 complete genome, segment 6/7
(Genbank accession no. AL162757). After locating the homologous region of the RDA-
generated fragments (26-403 bp) on the Z2491 genome, it was also noted that this area was
97.9% homologous to a partial region of the nusA gene or N utilization substance protein A
(159837-159460 bp). NusA is a transcription elongation factor that binds to RNA polymerase
and RNA, stimulates rho independent termination by promoting hairpin formation, and also
interacts with N protein and prevents hairpin formation thereby preventing termination (Genbank
Gene ID no. 907527).
33

Table 4: Top homology hits for tester-specific sequences.
Top Blast Hit Colony ID M13 PCR Band Sequenced Insert % Homology (bp) Fragment (bp)
N. meningitidis LMK3 500 235 99.5% IS1301 LMK50 1000 754 97.1% insertion sequence LMK56 1300 938 94.9% Genbank Acc. No. LMK132 1300 986 100% Z49092 LMK140 >1500 1157 99.7% LMK141 >1500 1179 99.7% LMK180 500 235 99.5% LMK186 500 236 100% N. meningitidis LMK14 1300 1100 99.5% ORF 1-8 from LMK40 1400 1169 100% pJS-B plasmid LMK59 1400 719 100% Genbank Acc. No. LMK60 1400 1111 99.5% AJ277475 LMK70 >1500 809 92.4% LMK121 1500 1180 99.8% LMK122 800 350 99.7% LMK151 1200 803 99.9% LMK169 600 350 99.4%
34
F Primer
R Primer
F Primer
R Primer
Figure 11: pJS-B plasmid map with aligned RDA-generated fragments and RsaI restriction sites. Map was created using DNA sequence from Genbank accession number AJ277475 and DNAstar MegAlign and SeqBuilder software (18). pJS-B F and R primers (Table 3) were generated to detect pJS-B plasmid sequences in N. meningitidis serogroup C ST11 early and late clone isolates by PCR.
35

Unk
now
n R
egio
n: N
o kn
own
hom
olog
y
IS13
01 F
IS13
01 R
LMK
56-2
F
LMK
56-2
R
Unk
now
n R
egio
n: N
o kn
own
hom
olog
y
IS13
01 F
IS13
01 R
LMK
56-2
F
LMK
56-2
R
Figure 12: IS1301 insertion sequence map with aligned RDA-generated fragments and RsaI restriction sites. Map was created using DNA sequence from Genbank accession number Z49092 and DNAstar MegAlign and SeqBuilder software (19). Short arrows denote forward and reverse primer pairs generated to detect IS1301 sequences and the 585 bp extended region of unknown homology in N. meningitidis serogroup C ST11 early and late clone isolates by PCR.
36

4.7 PCR DETECTION OF pJS-B PLASMID
pJS-B plasmid PCR primers (Table 3) were generated to determine whether the pJS-B plasmid
sequences were tester-specific by PCR amplification on N. meningitidis late clone isolates.
These primers were specific to a 1051 bp region spanning nucleotides 1400-2450 on the pJS-B
published sequence (Figure 11, F Primer, R Primer). Genomic and plasmid DNA prepared from
the tester strain (MD1400) amplified a 1051 bp band corresponding to the predicted pJS-B
product. In contrast, no PCR product was obtained from the corresponding DNA preparations
from the driver strain (MD1097) (Figure 13). The same pJS-B primers were also used to amplify
boil prep DNA from N. meningitidis serogroup C ST11 early and late clone isolates (34 total
including RDA tester and driver) to determine if pJS-B plasmid sequences were specific to the
late clone. pJS-B plasmid specific products were amplified from 17 out of 18 (94%) late clone
isolates. In contrast, none of the early clone isolates amplified pJS-B plasmid sequences (Figure
14). These data indicate that pJS-B is specific to strains of the late clone lineage.
13531078
872
MW B EC D MWA
13531078
872
MW B EC D MWA
Figure 13: PCR amplification of RDA tester and driver DNA with pJS-B primers. Lanes: A, MD 1400 (RDA tester) phenol-chloroform preparation; B, MD1400 (RDA tester) plasmid preparation; C, MD1097 (RDA driver) phenol-chloroform preparation; D, MD1097 (RDA driver) plasmid preparation; E, water. Molecular weight (MW) markers of φX174 RF DNA/Hae III ladder are listed in base pairs (bp).
37

Early Clone Isolates Late Clone Isolates
13531078872
MW MW
Early Clone Isolates Late Clone Isolates
13531078872
MW MWB PH B PH
Early Clone Isolates Late Clone Isolates
13531078872
MW MW
Early Clone Isolates Late Clone Isolates
13531078872
MW MWB PH B PH
Figure 14: PCR amplification of N. meningitidis serogroup C ST11 early and late clone isolates with pJS-B primers. 16 early clone and 18 late clone boil preparations including RDA driver (early) and tester (late) and phenol-chloroform preparations of driver and tester were amplified with pJS-B primers and the products were run on a 1% agarose/ethidium bromide gel. Boil preparations (B) and phenol-chloroform preparations (PH) of driver DNA (early) are denoted while the same preparations for tester DNA (late) are denoted in red (B and PH). Molecular weight (MW) markers of φX174 RF DNA/Hae III ladder are listed in base pairs (bp).
4.8 PCR DETECTION OF IS1301
IS1301 PCR was performed to determine whether IS1301 was specific to DNA from the tester
strain and other late clone isolates. The IS1301 primers are specific to a 484 bp region spanning
nucleotides 87-570 bp on the IS1301 published sequence (Figure 12, IS1301-F, IS1301-R).
IS1301 specific sequences were amplified from 18 out of 18 (100%) late clone isolates including
the RDA tester isolate (MD1400). In contrast, none of the early clone isolates or the RDA driver
isolate (MD1097) were IS1301 positive by PCR (Figure 15). These data indicate that the IS1301
element identified by RDA is specific to the N. meningitidis serogroup C ST11 isolates of the
late clone lineage.
To determine whether the 585 bp region of unknown homology was specific to the late
clone, primers specific to the LMK56 sequences were designed (Figure 12, LMK56-2F, LMK56-
2R). This primer set was unsuccessful in amplifying the expected 363 bp fragment from all 34
early and late clone isolates including boil and phenol-chloroform preparations of RDA tester
(MD1400) and driver (MD1097). Instead, a 200 bp band or no band at all was observed when
38

the LMK56-2 PCR products were run on a 1% agarose/ethidium bromide gel (Figure 16). As a
result, it could not be determined if the 585 bp region of unknown homology was specific to the
late clone isolates. The optimization of PCR conditions and/or the creation of new primer sets
spanning this region are needed to further explore this result.
Early Clone Isolates Late Clone Isolates
500400
MW MWEarly Clone Isolates Late Clone Isolates
500400
Early Clone Isolates Late Clone Isolates
500400
MW MWB PH B PH
Early Clone Isolates Late Clone Isolates
500400
MW MWEarly Clone Isolates Late Clone Isolates
500400
Early Clone Isolates Late Clone Isolates
500400
MW MWB PH B PH
Figure 15: PCR amplification of N. meningitidis serogroup C ST11 early and late clone isolates with IS1301 primers. 16 early clone and 18 late clone boil preparations including RDA driver (early) and tester (late) and phenol-chloroform preparations of driver and tester were amplified with IS1301 primers and the products were run on a 1% agarose/ethidium bromide gel. Boil preparations (B) and phenol-chloroform preparations (PH) of driver DNA (early) are denoted while the same preparations for tester DNA (late) are denoted in red (B and PH). Molecular weight (MW) markers of a 100 bp ladder are listed in base pairs (bp).
Early Clone Isolates Late Clone Isolates
200300400
B PH B PH
MW MWEarly Clone Isolates Late Clone Isolates
200300400
B PH B PH
MW MW
Figure 16: PCR amplification of N. meningitidis serogroup C ST11 early and late clone isolates with LMK56-2 primers. 16 early clone and 18 late clone boil preparations including RDA driver (early) and tester (late) and phenol-chloroform preparations of driver and tester were amplified with LMK56-2 primers and the products were run on a 1% agarose/ethidium bromide gel. Boil preparations (B) and phenol-chloroform preparations (PH) of driver DNA (early) are denoted while the same preparations for tester DNA (late) are denoted in red (B and PH). Molecular weight (MW) markers of a 100 bp ladder are listed in base pairs (bp).
39

5.0 DISCUSSION
In this study, RDA was successful in identifying two unique genetic elements, pJS-B plasmid
and IS1301, that were present in an emergent N. meningitidis serogroup C ST11 clone that had
undergone antigenic shift at FetA. In addition, RDA identified a partial region of the nusA gene
and a 585 bp fragment with homology to a region of unknown function on the serogroup C
FAM18 genome. PFGE identified clusters of temporally distinct isolates designated early and
late clones which correlated with subcapsular OMP genotyping data defined by porA, porB, and
fetA. Candidate tester and driver isolates were chosen for RDA based on PFGE band differences
in order to maximize the number of tester-specific sequences generated by RDA. RsaI-digested
tester genomic DNA (late clone) was successfully ligated to specific adaptors followed by two
rounds of subtractive hybridization with RsaI-digested driver genomic DNA (early clone). PCR
amplification of subtracted tester DNA with adaptor specific primers generated at least three late
clone-specific bands that were absent from the early clone. After cloning these products,
Southern blotting with tester and driver DIG-labeled probes confirmed a percentage to be tester-
specific. Tester-specific products were DNA sequenced and a BLAST search revealed that all
late-clone specific sequences were homologous to either pJS-B plasmid or IS1301 sequences.
PCR with primers specific to either IS1301 or pJS-B plasmid sequences amplified these elements
from late clone isolates but not from early clone isolates therefore these elements may play a role
in the emergence of the serogroup C ST11 late clone in Maryland during the 1990s.
40

The pJS-B plasmid was originally identified by RDA comparing N. meningitidis ET-37
(analogous to ST11 complex defined by MLST) and ET-5 complexes (analogous to ST32
complex defined by MLST) (18). Both ET-37 and ET-5 complexes include a number of
different serogroups. In Europe, serogroup B disease is caused mainly by ET-5 whereas
serogroup C disease is caused by the ET-37 complex and the A4 cluster (18). The pJS-B
plasmid was identified in most ET-37 complex strains (88%) and in many of the A4 cluster
strains (58.3%) that were tested. Among the ET-37 complex strains negative for pJS-B was
strain FAM18 from serogroup C, which is currently undergoing genomic annotation at the
Sanger Centre (18). An ET-37 complex variant was known to cause increased incidence of
serogroup C disease in various regions of the world during the 1990s while the A4 clone-
complex has been associated with global epidemics and hyperendemic waves of disease (20). In
this same study, Southern Blot analysis demonstrated that the pJS-B occurred as a plasmid and as
a chromosomal integration in isolates of the ET-37 complex (18). In the current study, the
location of pJS-B could not be determined based on the PCR and Southern blots since pure
plasmid and genomic DNA preparations could not be assured. Future experiments with Southern
blots similar to those described by Claus et al. are necessary to determine if pJS-B is integrated
into the late clone genome. In addition, these experiments will enable cloning of the pJS-B
insertion site. Interestingly, the LMK70 fragment does not correspond to any predicted RsaI
restriction sites on the pJS-B plasmid suggesting that this 800 bp plasmid fragment may
represent a chromosomal insertion site (Figure 11). It is possible that the RDA fragments that do
not correspond to RsaI sites on the published sequence contain RsaI recognition sites (5’-GTAC-
3’) at the ends of the fragments requiring further analysis. In addition, no clones were identified
that corresponded to the predicted RsaI restriction fragment between ~4000 and ~ 4500bp on the
41

pJS-B plasmid map. These discrepancies are suggestive of genomic recombination but further
studies will be required to investigate these regions as potential integration sites. Future
experiments also include generating primers to the 3.5 kb region (4500 -1000 bp) of the pJS-B
plasmid that does not contain an RsaI site to determine if the entire pJS-B sequence is present in
late clone isolates. In addition, the epidemiology of late clone isolate MD1373 needs to be
examined because it is the only late clone isolate that did not amplify pJS-B sequences.
The role of pJS-B to N. meningitidis virulence is not known. Claus, et al. were unable to
classify pJS-B plasmid type and were unclear whether it contributes to pathogenicity because no
homology to virulence genes could be found by comparison with public databases. Furthermore,
not all pathogenic ET-37 strains carry the pJS-B plasmid, indicating that it is not required for
virulence (18).
IS1301 has been classified as a member of the IS5-family, group IS427 of insertion
sequences and was first described as occurring in 12 copies in N. meningitidis serogroup B strain
B1940 (21). IS1301 consists of 844 bp and includes two overlapping open reading frames,
which are flanked by inverted repeats of 19 bp. It exhibits site-specificity for the target sequence
5’-AYTAG-3’, and its insertion results in duplication of the central AT (22). Through
insertion/excision, IS1301 has been shown to promote a reversible inactivation of an essential N.
meningitidis sialic acid biosynthesis gene, siaA (or synA), that regulates both capsule expression
and endogenous LOS (lipooligosaccharide) sialylation (19). This is important because the
bacterium’s penetration of the mucosal barrier may require a down-regulation or off-switching of
capsule expression, enabling passage through the mucosal epithelium, followed by a re-
expression of the cell surface sialic acids to resist the host’s immune defenses (19). IS1301 has
also been found to cause insertional inactivation of N. meningitidis PorA expression. PorA is a
42
major antigen of the meningococcus and target for bactericidal antibodies making it a useful
immunogen for vaccines (23).
In a study examining the distribution of IS1301 in clonal lineages of N. meningitidis,
IS1301 was detected in only 13-20% of serogroup A, B, and C strains, which are the serogroups
causing more than 90% of the disease worldwide, but in 46-89% of serogroup W135, 29E, X,
and Y strains. More importantly, IS1301 was found in only 3% of serogroup C ET-37 complex
strains which by MLST are analogous to the serogroup C ST11 early and late clone isolates that
were the basis of this study (22). These data correlate with the observation that IS1301 was
absent from the serogroup C FAM18 genome and all serogroup C ST11 early clone isolates in
this study. Because IS1301 occurs most frequently in meningococcal serogoups other than A, B,
and C, it is interesting that we found 100% of serogroup C ST11 late clone isolates to be positive
for IS1301. By Southern blotting and hybridization of a macrorestriction assay of the N.
meningitidis serogroup C late clone genome with an IS1301-specific probe, the copy number of
IS1301 could be determined as described by Hilse et al. (21). The genomic restriction fragments
that hybridized to IS1301 sequence could then be cloned and sequenced to determine the
different target site specificities for this element. Previous studies have described IS1301
insertion within siaA, the first gene of the capsule biosynthesis pathway, while one insertion site
was located upstream of frpC, a gene encoding an iron-regulated protein in N. meningitidis (21).
In order to examine the role of IS1301 in the emergent N. meningitidis serogroup C ST11
late clone, the insertion site of this element would need to be located, which is beyond the scope
of this project. Genome insertion location is important in determining IS1301’s effect on gene
expression therefore shedding light on a possible role in N. meningitidis pathogenesis. Virtual
mapping of the RDA-generated LMK56 fragment on the serogroup C FAM18 genome helped to
43

approximate the insertion location of IS1301 at ~890 kb region. A BLAST search determined
the capsular synthesis genes (e.g. ctrA, synA, synB, synC) in FAM18 to be located at ~68 kb
region. Therefore, it is assumed that IS1301 does not play a role in the inactivation of synA gene
as described because the probable insertion site is distant from synA and other capsular synthesis
genes. PCR could not determine if the 585 bp fragment with homology to a region of unknown
function on the serogroup C FAM18 genome is specific to the late clone lineage. Southern
blotting of early and late clone isolates with a LMK56 DIG-labeled probe could help determine
late clone specificity of this region.
RDA also identified a partial region of the N. meningitidis nusA gene after cloning 4 gel-
purified RDA bands of size 1200, 1000, 900 and 850 bp. All colonies from these individually
cloned bands produced ~700 bp band when amplified with M13 PCR primers and the same 415
bp sequence after removing TOPO TA vector sequence. We expected inserted fragments of
varying size with homologies to different locations spanning the nusA gene because RDA bands
of varying size were cloned. Future experiments should include performing plasmid mini-prep
extractions on transformed colonies, cutting with EcoR I restriction enzyme, and separating the
digest by gel electrophoresis. The resulting bands should correspond to the size of the cloned
RDA band determining if the cloning experiment was successful.
Future experiments for this project include using early and late clones in an animal model
to test for virulence to provide a more definitive answer regarding the role of RDA-generated
elements in N. meningitidis pathogenesis. In addition, Southern blotting and cloning can be
performed to determine pJS-B and IS1301 copy number and insertion locations to gain insight on
their possible regulation of gene expression and/or antigenic variation. Finally, early and late
clones for this study were defined based on antigenic shift at the fetA gene locus although fetA
44

differences were not identified by RDA. This is probably due to the lack of RsaI restriction sites
in the fetA 1-30 and 3-6 alleles making it difficult for RDA to identify fragments in the fetA
region.
Mobile genetic elements, like plasmids and insertion sequences, are found in many
different bacterial species in which they play a role in genetic rearrangement and genomic
plasticity. The transposition of insertion elements is known to cause a number of effects,
including insertions, deletions, and the fusion of two genetic elements, resulting either in silent
mutations, in knockout of gene expression, or in the regulation of downstream-located genes
(21). In this study, RDA identified two genetic elements, pJS-B plasmid and IS1301, that may
play a role in the emergence of N. meningitidis serogroup C ST-11 late clone in Maryland during
the 1990s. In addition, RDA identified a partial region of the nusA gene and a 585 bp fragment
with homology to a region of the serogroup C FAM18 genome. Genetic rearrangements with
these elements could help create bacterial diversity and may have assisted the emergent late
clone in preadapting to environmental changes and evading the host’s immune response.
Additional studies are needed to examine the role of these genetic elements, if any, in N.
meningitidis pathogenesis and their association with increases in serogroup C meningococcal
disease incidence.
45

BIBLIOGRAPHY
1. Biluka, O. O. and N. Rosenstein. 2005. Prevention and control of meningococcal disease: recommendations of the Advisory Committee on Immunization Practices (ACIP). MMWR Recomm. Rep. 2005 54:1-21.
2. Pizza, M., V. Scarlato, V. Masignani, M. M. Giuliani, B. Arico, M. Comanducci, G. T. Jennings, L. Baldi, E. Bartolini, B. Capecchi, C. L. Galeotti, E. Luzzi, R. Manetti, E. Marchetti, M. Mora, S. Nuti, G. Ratti, L. Santini, S. Savino, M. Scarselli, E. Storni, P. Zuo, M. Broeker, E. Hundt, B. Knapp, E. Blair, T. Mason, H. Tettelin, D. W. Hood, A. C. Jeffries, N. J. Saunders, D. M. Granoff, J. C. Venter, E. R. Moxon, G. Grandi, and R. Rappuoli. 2000. Identification of vaccine candidates against serogroup B meningococcus by whole-genome sequencing. Science 287:1816-1820.
3. Rosenstein, N. E., B. A. Perkins, D. S. Stephens, T. Popovic, and J. M. Hughes. 2001. Meningococcal disease. N. Eng. J. Med. 344:1378-1388.
4. Harrison, L. H., K. A. Jolley, K. A. Shutt, J. W. Marsh, M. O’Leary, L. T. Sanza, M. C. J. Maiden, and the Maryland Emerging Infections Program. 2006. Antigenic shift and increased incidence of meningococcal infection. J. Infect. Dis. In press.
5. Rosenstein, N. E., B. A. Perkins, D. S. Stephens, L. Lefkowitz, M. L. Cartter, R. Danila, P. Cieslak, K. A. Shutt, T. Popovic, A. Schuchat, L. H. Harrison, A. L. Reingold, and the Active Bacterial Core Surveillance Team. 1999. The changing epidemiology of meningococcal disease in the United States, 1992-1996. J. Infect. Dis. 180:1894-1901.
6. Maiden, M. C. J., J. A. Bygraves, E. Feil, G. Morelli, J. E. Russell, R. Urwin, Q. Zhang, J. Zhou, K. Zurth, D. A. Caugant, I. A. Feavers, M. Achtman, and B. G. Spratt. 1998. Multilocus sequence typing: a portable approach to the identification of clones within populations of pathogenic microorganisms. Proc. Natl. Acad. Sci. USA 95:3140-3145.
7. Calia, K. E., M. K. Waldor, and S. B. Calderwood. 1998. Use of representational difference analysis to identify genomic differences between pathogenic strains of Vibrio cholerae. Infec. Immun. 66:849-852.
8. Lisitsyn, N., N. Lisitsyn, and M. Wigler. 1993. Cloning the differences between two complex genomes. Science 259:946-951.
46

9. Chang, Y., E. Cesarman, M. S. Pessin, F. Lee, J. Culpepper, D. M. Knowles, and P. S. Moore. 1994. Identification of herpesvirus-like DNA sequences in Kaposi’s sarcoma. Science 266:1865-1869.
10. Bowler, L. D., A. Bart, and A. van der Ende. 2001. Representational difference analysis. In: Pollard, A. J. and M. C. J. Maiden, eds. Meningococcal Disease: Methods and Protocols. Totowa, NJ: Humana Press, 231-256.
11. Tinsley, C. R. and X. Nassif. 1996. Analysis of the genetic differences between Neisseria meningitidis and Neisseria gonorrhoeae: Two closely related bacteria expressing two different pathogenicities. Proc. Natl. Acad. Sci. USA 93:11109-11114.
12. Bart, A., J. Dankert, and A. van der Ende. 2000. Representational difference analysis of Neisseria meningitides identifies sequences that are specific for the hyper-virulent lineage III clone. FEMS Microbiol. Lett. 188:111-114.
13. Schuchat, A., T. Hilger, E. Zell, M. M. Farley, A. Reingold, L. Harrison, L. Lefkowitz, R. Danila, K. Stefonek, N. Barrett, D. Morse, R. Pinner, for the Active Bacterial Core Surveillance Team of the Emerging Infections Program Network. 2001. Active bacterial core surveillance of the emerging infections program network. Emerg. Infect. Dis. 7:92-99.
14. Tenover, F. C., R. D. Arbeit, R. V. Goering, P. A. Mickelsen, B. E. Murray, D. H. Persing, and B. Swaminathan. 1995. Interpreting chromosomal DNA restriction patterns produced by pulsed-field gel electrophoresis: Criteria for bacterial strain typing. J. Clin. Microbiol. 33:2233-2239.
15. Diatchenko, L., Y. F. Lau, A. P. Campbell, A. Chenchik, F. Moqadam, B. Huang, S. Lukyanov, N. Gurskaya, E. D. Sverdlov, and P. D. Siebert. 1996. Suppression subtractive hybridization: a method for generating differentially regulated or tissue-specific cDNA probes and libraries. Proc. Natl. Acad. Sci. USA 93:6025-6030.
16. BD Biosciences. BD PCR-Select™ Bacterial Genome Subtraction Kit User Manual. Published Jan. 10, 2005. Protocol No. PT3170-1. Version No. PR4Z702.
17. Altschul, S. F., W. Gish, W. Miller, E. W. Myers, and D. J. Lipman. 1990. Basic local alignment search tool. J. Mol. Biol. 215:403-410.
18. Claus, H., J. Stoevesandt, M. Frosch, and U. Vogel. 2001. Genetic isolation of meningococci of the electrophoretic type 37 complex. J. Bacteriol. 183:2570-2575.
19. Hammerschmidt, S., R. Hilse, J. P. M. van Putten, R. Gerardy-Schahn, A. Unkmeir, and M. Frosch. 1996. Modulation of cell surface sialic acid expression in Neisseria meningitidis via a transposable genetic element. EMBO J. 15:192-198.
20. Caugant, D. A. 2001. Global trends in meningococcal disease. In: Pollard, A. J. and M. C. J. Maiden, eds. Meningococcal Disease: Methods and Protocols. Totowa, NJ: Humana Press, 273-292.
47
21. Hilse, R., S. Hammerschmidt, W. Bautsch, and M. Frosch. 1996. Site-specific insertion of IS1301 and distribution in Neisseria meningitidis strains. J. Bacteriol. 178:2527-2532.
22. Hilse, R., J. Stoevesandt, D. A. Caugant, H. Claus, M. Frosch, and U. Vogel. 2000. Distribution of the meningococcal insertion sequence IS1301 in clonal lineages of Neisseria meningitidis. Epidemiol. Infect. 124:337-340.
23. Newcombe, J., K. Cartwright, S. Dyer, and J. McFadden. 1998. Naturally occurring insertional activation of the porA gene of Neisseria meningitidis by integration of IS1301. Mol. Microbiol. 30:453-454.
48