report spring 2015 recycle and reward pilot projects
TRANSCRIPT

Report
Spring 2015 Recycle and Reward Pilot Projects Overview Report

2 |Recycle and Reward Pilot Projects
Contents 1 Executive summary 4
2 Introduction 7
2.1 The pilot projects and their purpose 7
2.2 The wider policy context 8
2.3 The pilots 8
2.4 Overview of the monitoring and evaluation approach 14
3 Key findings and lessons 16
3.1 Overall scheme performance and use 16
3.2 Public reaction to the schemes (awareness, attitudes) 31
3.3 Perceived benefits, key motivations and reward redemptions 34
4 Practical lessons 39
4.1 Data and reporting 39
4.2 Ownership and resourcing issues 39
4.3 Machine reliability and rejection rates 40
4.4 Communications and promotion 42
4.5 The effectiveness of incentives 44
4.6 Competing recycling facilities 46
4.7 The impact of machine location and convenience 46
4.8 Legacy: potential improvements and scheme extensions 47
5 Conclusions and observations 49
5.1 Public acceptability 49
5.2 Machine use and recycling behaviour 49
5.3 Material quality 49
5.4 Impact on litter 50
5.5 Effect on footfall and retail sales 50
5.6 Awareness and understanding 50
5.7 Other barriers to use and voucher redemption 50
5.8 Motivation and rewards 51
5.9 Communications 51
5.10 Resourcing and costs 52
5.11 Machine reliability and specification 52
5.12 Machine location and convenience 52
5.13 Competing with other recycling facilities 53
5.14 Legacy: future developments and expansion 53
6 Glossary of terms 55

Appendix: monitoring methodology 56
Strand A 56
Strand B 57
General 59
Zero Waste Scotland works with businesses, individuals, communities and local authorities to help them reduce waste, recycle more and use resources sustainably.
Find out more at zerowastescotland.org.uk
Written by: SKM Enviros, Nicki Souter Associates, and Zero Waste Scotland
Acknowledgements
Zero Waste Scotland would like to thank all the sites taking part in the pilots for their help and assistance in providing data, access, and support to the pilot monitoring process, as well as the equipment providers who supported the pilot sites. Zero Waste Scotland would also particularly like to thank Marion Croy for her unflagging commitment to managing the pilots, and her invaluable contribution to the monitoring and reporting process.

4 |Recycle and Reward Pilot Projects
1 Executive summary The Recycle and Reward pilots explored incentivised recycling of drinks containers (primarily plastic bottles and aluminium cans) in “on the go” contexts – in universities, schools, retail locations, a festival, and a recycling centre. Eight organisations were supported, providing nine schemes across twelve different sites around Scotland. Two of the schemes were deposit return schemes, where consumers pay extra when purchasing an item, and have that amount refunded when they return the container to be recycled. The other schemes all offered a simple reward for returning a container. All the schemes primarily relied on a machine-based take back system.
Each pilot scheme was a tailored recycling solution for the site in question. The details of each, and how they performed, are described in individual case study reports. This overview report highlights how sites managed the schemes and how the public reacted, with a focus on common patterns, or lessons that can be observed by comparison between sites. The pilots were not delivered as an experiment – they were practical hands-on solutions delivered in real operational environments, and the first pilots of their kind in Scotland. They provide insight for other sites considering an on-site recycling solution (incentivised or not) and may also inform wider discussions of the best recycling systems for the targeted containers. This report however focuses on describing the actual pilot experience, and what can be learnt from it at site level.
So how did they do? The volumes of containers sold and recycled across sites varied enormously, as did the relationship between the two. Some sites were quite isolated, or only accepted containers sold on site into the scheme, while others very open, and saw on-site containers taken away, and off-site containers brought in. These contextual factors influenced scheme performance just as much as the actual scheme design. One consistent measure of scheme performance is the capture rate of containers for recycling as a proportion of those sold on site and most performance ranged from 18% to 40% on this measure, though there were some outliers. At the top end these included the three day HebCelt festival (63%) and one of the school sites which recorded over 100%.
The latter figure shows one of the drawbacks of this measure, which is that if products (or empty containers) are imported onto the site, this measure of performance can be misleading. We believe “leakage” in or out of the scheme occurred at all locations, reflecting both how users of the sites behave, as well as scheme design. This highlights that no site-specific solution will ever be a closed system, a factor that needs to be factored into scheme design. Equally, the recycling rate within the scheme may not reflect recycling rates for the site as a whole; target materials may be collected via other recycling systems on site, and some lower performing sites already had extensive recycling provision.
Both weight data and user survey data suggest that the schemes did lead to more material being recycled, but at least some material captured in the schemes was not additional, and does reflect diversion from other recycling routes (typically pre-existing on site facilities). Where the scheme offered a recycling solution where one had not existed before, it is likely to have had the biggest impact. The overall impact of the schemes on site waste is difficult to determine, but given the low per-item weight of the targeted containers, and the large and complex material flows on many of our sites, it is unlikely to be large as a percentage of the total – plastic and aluminium are very light compared to other waste or recycling streams like paper or food.
The material that was collected by the schemes was typically of very high quality. Contamination was low, as the machines reject incorrect materials that people try to recycle (unlike a conventional recycling bin, where users may leave the wrong item by mistake, causing problems for waste management or reprocessing further down the line). In principle this higher quality of material should save sites money (reducing recycling management fees) or even generate revenue (where material can be sold directly). The pilot period was too short for any site to benefit from this directly, as a change of this nature necessitates changes to overall waste contracting. Material rejects do however lead to a novel user experience – people are made immediately aware if they try to recycle an inappropriate item, as it is returned to them.
All the schemes received intensive communication support, and this in itself may account for some of the performance seen. Communication focused on what could and could not be recycled (as with all recycling solutions, but especially relevant to users given the way incorrect items are rejected), how to use the scheme, and the nature of rewards. Typically however users recalled the machines themselves as being the most prominent factor in promoting the system and bringing it to their attention.

Interestingly, most people surveyed (with the exception of school pupils) did not tend to rate the reward as being a key factor in choosing to recycle, though the rate at which rewards were reclaimed was generally very high. The schemes were extremely popular with users, and, as a concept, often with non-users, with support for their continuation at the sites in the pilots, and often more widely. All but one site chose to continue with their scheme after the end of the pilot period, though performance declined markedly at two of the school sites at this point too. Zero Waste Scotland ceased formal monitoring in early 2014, but as of April 2015, six pilot sites are confirmed to be still operating as planned1.
The rewards were typically considered appropriate – though given the range of rewards on offer this seems somewhat surprising. It may be that all sites had a perfectly tailored reward (though variations within sites suggest this is not quite so simple), but it seems likely that as incentivised recycling was a new experience for many, respondents often had little to compare their experience to. There is definitely scope for further work to explore how to maximise the cost effectiveness of incentives in any future schemes of this nature, whether they are deposit based, or focused on a simple reward.
The machines were unfamiliar to both sites and users initially, and in some cases there was a steep learning curve. The experience gained in the pilots in how to specify requirements and design a scheme should help any future site-specific rollouts significantly. However initial set up was time consuming for some sites, and teething problems may have led to a perception of unreliability for some users. Some survey feedback about unreliability is however hard to assess – as discussed above, if an item is returned to a user as a reject, they may often blame the machine, whereas it may in fact be correct. While machines do require set up, maintenance, and servicing, as well as emptying, so too do all waste management systems, even simple bins. The work involved in setting up and running a Recycle and Reward scheme should be contrasted to those for another waste management solution – and the same can also be said of the effort spent on communication.
Prior to the pilot, one area of investigation suggested was whether schemes like this deter or encourage sales as participating outlets. No evidence was found to suggest this was happening in the pilots. It was though suggested by some users that if a site specific solution created a significant price differential for a product that could easily be brought elsewhere, then this might generate a problem. This was not the case in the pilot contexts.
Another area of interest was whether the pilots would have an impact on litter. In practice, several sites felt litter was not a significant issue for them, so any impact might be expected to be small. However, several were interested in this question. Organisers at the HebCelt festival felt litter was significantly less of a problem than in previous years and did attribute this in part to the scheme. Visitors too thought the scheme was likely to have an impact on litter. At other sites, the message in regard to litter was less clear, though some members of the public typically did consider this to be an actual or potential benefit of schemes of this nature.
Methodologically, these were challenging pilots to monitor and evaluate. Most sites have only a partial understanding of their waste and recycling performance in the level of detail we desired, and while all our pilot sites made a great effort to provide the data we wanted, they were often limited by operational constraints. Limitations are highlighted as appropriate in this report, and the methodology is described in more detail as an appendix (as well as in the individual case studies). The pilot monitoring requirements also imposed a burden on sites, and some of the costs and resourcing requirements associated with these pilots were because they were pilots, rather than being an inevitable element of scheme management. We have tried to distinguish between the two throughout our reporting.
The pilots show that incentivised recycling can be made to work, but also that in considering a site-specific solution the planning stage is essential. Some of the challenges and opportunities encountered would apply to any site implementing incentivised, or machine based recycling, whether alone, or as part of a wider scheme. Some insights may be useful to any site considering on site recycling for users, such as a conventional Recycle on the Go scheme. But it should be remembered that some challenges encountered were down to the fact these were standalone solutions, and would not be encountered in a wider, more consistent scheme.
1 Two further sites have discontinued their scheme, and one (Hebcelt) was a one-off. The status of two sites was pending confirmation at the time of writing.

6 |Recycle and Reward Pilot Projects
This report is one of a suite of reports looking at how Scotland can best achieve its recycling goals for the targeted materials at both a site and a national level. If you don’t have time to read them all, we would suggest:
• If you are mostly interested understanding the pilots – how they worked and what they did, then read this report
• If you are interested in your own site specific recycling solution, then read this report, and the case studies that are closest to your own situation or intended scheme. You might also want to consider reading our report on Recycling on the Go experience to date in Scotland.
• If you are more interested in the policy options for government around recycling of the targeted items, then read the policy option papers published in May 2015.

2 Introduction
The pilot projects and their purpose The Scottish Government committed in 2011 to pilot systems to increase recycling of single use containers (for plastics, glass and aluminium containers) and at the same time increase the quality of this material, to support the development of ‘home-grown’ closed loop re-processing infrastructure in Scotland. More broadly, the government’s Zero Waste Plan commits the country to ambitious recycling targets, and the government is interested in exploring a range of options that will help us on a journey to a zero waste society, where the value of resources is realised and maximised.
The aim of the pilot projects was therefore to test the efficacy of different incentivised recycling models and their impact on packaging recycling, specifically drinks containers. Key objectives included observations on the quantity and quality of material collected using innovative technology and public acceptability of the model. The projects were localised site specific solutions, though some of the learnings may have wider applicability.
To support organisations and partnerships to develop the pilot projects, Zero Waste Scotland (on behalf of the Scottish Government) provided innovation funding for the installation of new equipment, the operation of each pilot project, the development of communication materials to support the widespread and appropriate use of the pilot facilities, and the monitoring of its performance and success. During 2013, Zero Waste Scotland funded eight Recycle and Reward pilot projects at 12 locations across Scotland. The pilots were undertaken at three Scottish universities, four schools, one household waste recycling centre (HWRC), two IKEA stores, a small organic food shop, and the HebCelt music festival on the Isle of Lewis. The case study reports are split to present each of the universities as separate cases (all ran differing schemes); the IKEA stores as a single case (while highlighting operational differences between the two stores involved); three schools in North Ayrshire as a single case (while highlighting performance differences); and the school in South Ayrshire, the HWRC, the HebCelt Festival and the organic food shop as separate cases.
Two of the pilot projects were based on deposit return systems. In its simplest form, the deposit-return model charges a fully refundable deposit on each container at the point of sale. The consumer can then have the deposit refunded when the empty container is returned to the system. This provides an immediate economic incentive for waste materials to be returned, source-segregated, to locations from which they are ultimately recycled. These pilots were undertaken at a small organic retailer (Whitmuir the Organic Place) and at the Heriot-Watt University campus, based at Riccarton, on the outskirts of Edinburgh.
The other projects were based on a purely incentivised recycling system, without the deposit. These systems allow containers to be taken back in exchange for a reward. Reverse vending machines (which take back an empty container and provide, for example, a receipt enabling money to be reclaimed) were used for both types of pilot.
The messaging and graphics used to promote both deposit-return and incentivised recycling pilot projects were developed and market-tested by Zero Waste Scotland. The brand developed for the pilot projects, known as Recycle and Reward, is referred to during this report, when discussing both deposit return and pure reward schemes.

8 |Recycle and Reward Pilot Projects
Figure 1 Recycle and Reward machines at Glasgow Caledonian University and at the HebCelt Festival
The wider policy context The pilots were undertaken, in part, to provide learning on how incentivised recycling can contribute to the wider policy goals of the Scottish Government’s Zero Waste Plan, and related recycling targets. Scotland’s Zero Waste Plan sets out the Scottish Government’s vision for a zero waste society whereby all waste is seen as a resource, waste is minimised, valuable resources are not disposed of in landfills and most waste is sorted, leaving only limited amounts to be treated. One key target is 70% recycling and composting of all waste by 2025.
The Scottish Government is also keen to tackle litter, particularly in busy city centres, and has already initiated Recycling on the Go facilities to reduce litter levels and normalise recycling behaviour. The Recycle and Reward approach can potentially complement the Recycle on the Go facilities, adding an additional incentive to recycle on the go.
Finally, Scotland also has to meet the EU Packaging Waste Directive targets, as implemented through the Producer Responsibility Obligations (Packaging Waste) Regulations, with ever higher targets for individual materials. By targeting packaging in the form of various containers (cans, bottles and cups), the Recycle and Reward approach might have the potential to help Scotland to meet these obligations.
Notwithstanding the wider context, each pilot was designed and proposed by the organisations or partners that were to run it. The pilot reports therefore reflect a series of localised solutions, not direct models for wider policy.
The pilots The pilots have covered a wide range of organisations to gain insights into the efficacy of the Recycle and Reward approach across a range of circumstances and scheme models. The main characteristics are summarised in Table 1. Detailed case studies are also available for each of the individual pilot projects.

Pilot project
Organisation type
Location Target population
Population size*
Scheme type
Data period (weeks)**
Materials accepted
Total number of machines
Location of machines
Reward type and size
Glasgow Caledonian University (GCU)
Public sector Glasgow city centre
Students, staff, general public
17,000 students and 1,800 staff
Reverse vending
29 (March to September). It should be noted that use was lower during the summer break
Aluminium drinks cans, PET plastic bottles and paper cups
6; 3 per site; 2 Flex Interactive machines, one each for cans and bottles, and an Ecovend for paper cups
Refectory and Students’ Association bistro
Vouchers worth 5p that could be redeemed in any of the campus catering outlets; in addition, users of the machines could win a ‘Golden Ticket’; these tickets were distributed randomly by the machines (6 tickets per week) which entitled the winners to one free meal on campus
Heriot-Watt University (HWU), Edinburgh
Public sector Self-contained campus south-west of Edinburgh
Students, staff, general public
7,487 students and 1,666 administrative staff
Deposit-return
20 (May to September). It should be noted that use was lower during the summer break
Aluminium drinks cans and PET plastic bottles
4 Tomra 63 machines, all accepting aluminium cans and PET plastic bottles except the one at the Sports Academy (which accepted bottles only, as only bottles sold here)
Hugh Nisbet Building upper canteen and outside the student shop; Student Union and Sports Academy
Campus outlets and vending machine operators added bespoke bar codes to all aluminium cans and plastic bottles sold on campus. A 10p deposit was added to the cost of all PET plastic bottles and aluminium cans sold in the student shop, catering outlets and vending machines on campus. When these items were recycled using the machines, a voucher for 10p per item was issued, which could be either donated to charity or redeemed over the till at any one of the retail outlets on campus
University of Dundee
Public sector Dundee city centre
Students, staff,
19,000 students and
Reverse vending
30 (end February to
Aluminium drinks cans
7; 2 Flex Interactive
Dalhousie Building ground floor
Voucher worth 5p per aluminium can or 3p

10 |Recycle and Reward Pilot Projects
(UoD) general public
3,000 staff end September). It should be noted that use was lower during the summer break
and PET plastic bottles
machines per site (one for PET bottles, one for aluminium cans) with exception of Belmont Tower (one for PET only)
(teaching rooms and lecture halls); Matthew Building (part of College of Art and Design) ground floor; Students’ Union Building external under walkway linking buildings; Belmont Tower external under overhanging upper storey, next to existing Recycle on the Go banks
per PET bottle inserted; redeemable against purchases at the on-campus Premier Store run by Students’ Association. One voucher was given per use of the machine, so there could be many containers per voucher, with the voucher having a variable value
Troon Household Waste Recycling Centre (HWRC)
Public sector Troon Recycling Centre, South Ayrshire
General public/local residents
One of 4 HWRCs serving 48,748 households
Reverse vending
16 (May to September)
Aluminium cans and PET bottles
1 Revendit C1500 machine
Clear Perspex shelter on site
For each plastic bottle or aluminium can recycled, one reward point was allocated and a voucher was printed corresponding to the number of items recycled. When 50 points had been accrued, the customer could exchange this for a token which could then be redeemed for compost, normally costing £2 per bag for 70 litres
Marr College
Public sector Ayr, South Ayrshire
Students, staff
1,300 students and 100 staff
Reverse vending
13 (May to September – excluding summer holidays 29 June to 16 August)
Aluminium drinks cans and PET plastic bottles
1 Ecovend machine
Main foyer For each unit (bottle or can) a voucher for leisure activities was issued; 40 unit vouchers were required for a swim voucher and 100 unit vouchers were required for a cinema voucher

North Ayrshire Council (NAC) Schools
Public sector 3 schools: Ardrossan, Garnock and Largs, North Ayrshire
Pupils, staff Approximately 1,000 pupils in each school
Reverse vending
14 (early May to September – excluding summer holidays 29 June to 16 August)
Aluminium drinks cans and PET plastic bottles
1 Revendit C1500 machine per school
School canteen Voucher for 5p which could be redeemed in the school canteen, with a maximum of 50p spend in one transaction
IKEA Edinburgh
Business Edinburgh Customers Average footfall per month of 139,000
Reverse vending
34 (end February to end September)
Aluminium drinks cans, glass bottles and PET bottles
2 Reverse Vending Corporation 112 series machines
In the upstairs restaurant/café area
Customers could select from one of the following three rewards for each item recycled: • 10p voucher redeemable against any purchases in store; • 10p donation to one of the following charities: WWF, Save the Children, The Woodland Trust or Unicef; or • during July and August only, vouchers to redeem any of the following sustainable products: torch (2 vouchers); recycling bin (4 vouchers); and a light-emitting diode light bulb (6 vouchers)
IKEA Glasgow
Business Glasgow Customers Average footfall per month of 177,000
Reverse vending
31 (end February to end September)
Aluminium drinks cans, glass bottles and PET bottles
2 Reverse Vending Corporation 112 series machines
Exit foyer near to the Swedish Food Market and drinks vending machines located at the entrance and exit foyers
Customers could select from one of the following two rewards for each item recycled: • 10p voucher redeemable against any purchases in store; or • 10p donation to one of the following charities: WWF, Save the Children, The Woodland Trust or Unicef
12 |Recycle and Reward Pilot Projects
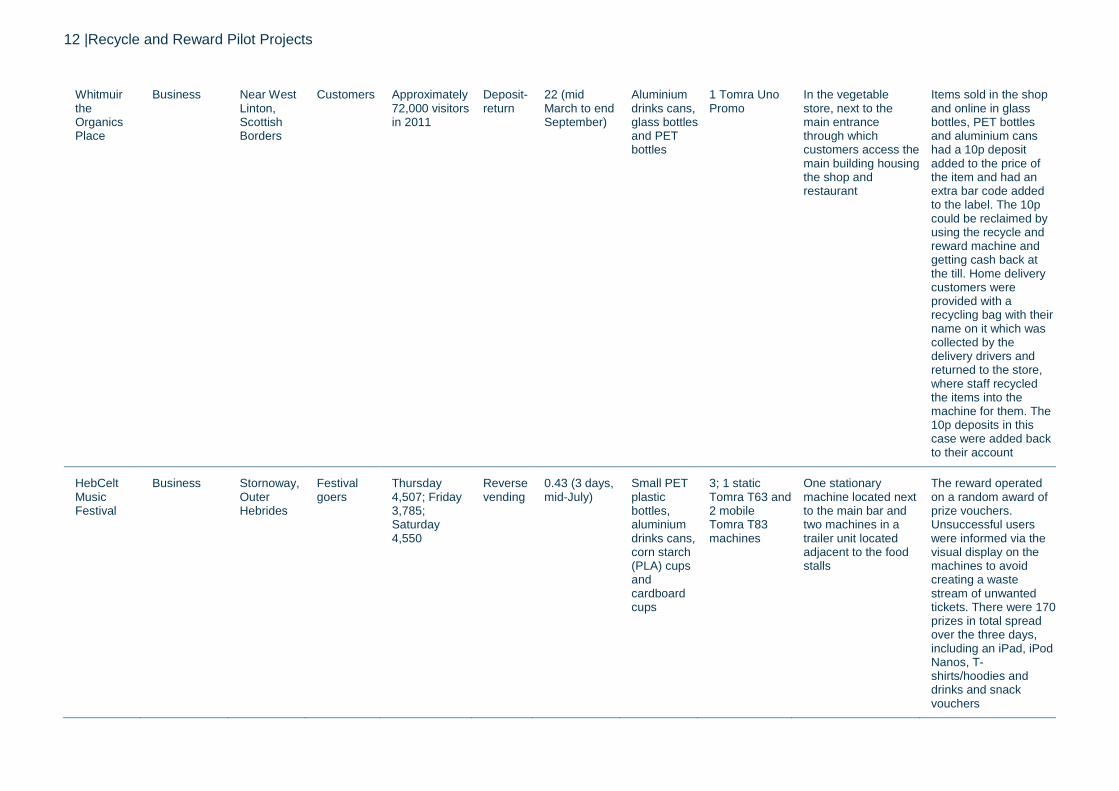
Whitmuir the Organics Place
Business Near West Linton, Scottish Borders
Customers Approximately 72,000 visitors in 2011
Deposit-return
22 (mid March to end September)
Aluminium drinks cans, glass bottles and PET bottles
1 Tomra Uno Promo
In the vegetable store, next to the main entrance through which customers access the main building housing the shop and restaurant
Items sold in the shop and online in glass bottles, PET bottles and aluminium cans had a 10p deposit added to the price of the item and had an extra bar code added to the label. The 10p could be reclaimed by using the recycle and reward machine and getting cash back at the till. Home delivery customers were provided with a recycling bag with their name on it which was collected by the delivery drivers and returned to the store, where staff recycled the items into the machine for them. The 10p deposits in this case were added back to their account
HebCelt Music Festival
Business Stornoway, Outer Hebrides
Festival goers
Thursday 4,507; Friday 3,785; Saturday 4,550
Reverse vending
0.43 (3 days, mid-July)
Small PET plastic bottles, aluminium drinks cans, corn starch (PLA) cups and cardboard cups
3; 1 static Tomra T63 and 2 mobile Tomra T83 machines
One stationary machine located next to the main bar and two machines in a trailer unit located adjacent to the food stalls
The reward operated on a random award of prize vouchers. Unsuccessful users were informed via the visual display on the machines to avoid creating a waste stream of unwanted tickets. There were 170 prizes in total spread over the three days, including an iPad, iPod Nanos, T-shirts/hoodies and drinks and snack vouchers

Table 1 The pilot projects and their main characteristics
Notes on table *Population at the universities dropped during the summer recess, although many students were still present. **This period included school holidays and university vacations. PET, polyethylene terephthalate, which is commonly used in plastic drinks bottles

14 |Recycle and Reward Pilot Projects
In the case of the educational institutions (universities and schools), Zero Waste Scotland continued to collect and collate monitoring data after the period assessed by SKM, to gain the full data for the autumn term (i.e. to the end of 2013). Zero Waste Scotland also checked the status of the pilot schemes prior to publication of this report, though this check focused on scheme continuity, and did not analyse further performance data.
Overview of the monitoring and evaluation approach The monitoring and evaluation work for the pilots was led by SKM Enviros (SKM), working in partnership with Nicki Souter Associates (NSA). At the educational sites, Zero Waste Scotland undertook additional data collection outside the pilot period, so a complete dataset could be obtained for the autumn term. Further details of the monitoring and evaluation methodologies are included in the appendix and in the individual case studies.
The work was undertaken in two complementary strands: • Strand A was undertaken by SKM and involved the monitoring of the ‘hard’ quantitative data around
waste and recycling at the sites, both through the Recycle and Reward machines and more widely, the related sales data for relevant containers, the issuing of vouchers by the machines, and redemption of vouchers and deposits. The aim was to compare baseline (pre-pilot) with in-pilot data where possible. In some cases pre- and post-pilot waste compositional analysis was undertaken to help clarify the impact of the schemes.
• Strand B was the social research element and included face-to-face surveys across seven of the projects. Online surveying was used in cases where it was considered more cost-effective (the organic food store and the schools projects). In addition, observations of machine users and a variety of focus groups and in-depth interviews were undertaken to investigate the experiences and opinions of scheme users, non-users and staff at the sites.
It should also be noted that SKM, NSA and Zero Waste Scotland staff also regularly attended the projects and added a wide range of supplementary information and clarification to the overall monitoring process.
The starting point for analysis was the data recorded by the machines around transactions, which provided a comprehensive record. The machines generally provided data on total quantities collected, the number of units per transaction (and in some cases the timing of transactions), and the vouchers issued and charity donations made. Sales data, and information on rewards issued, were also gathered, though these could not always be collected in as much detail, as data collection was dependent on pre-existing systems, such as till stock control systems. While a wide range of data was gathered, it is important to acknowledge the data limitations of both aspects of the monitoring.
In strand A the main data limitations were as follows: • The waste/recycling data for the sites as a whole was generally poor in that very little weight-based
information was available at an appropriate level of granularity (i.e. for the targeted material types, independently of overall recyclate or waste). In part this was because the waste was collected on mixed rounds, i.e. on a vehicle with waste from other organisations, before being weighed. This meant that some of the data had to be estimated from volume observations and the application of bulk densities.
• At some pilots, the amount of material collected through the machines was very low in weight compared with the overall weight of recyclable waste and residual waste (reflecting the relative weights of the most commonly targeted materials, plastic and aluminium, relative to other frequently recycled materials, such as paper) making it very difficult to discern the impact of the pilot on overall waste produced at the site.
• Sales data for the target containers were not always readily available because of the type of till systems used and the ease with which data could be disaggregated by product type. The same

applied to voucher redemptions through the tills. In some cases, manual analysis of a sample of transactions from a more limited period had to be undertaken.
• Waste compositional analysis and litter studies could be undertaken at only a few key sites because of budgetary constraints and could be done only as a snapshot, one day before the pilot and one day during it, although often with several days’ worth of collected waste. In the case of litter, where natural variability is poorly understood, this is a more significant limitation than with collected recyclables, for example.
In strand B the main data limitations were as follows: • The survey sample size at some sites was small. This was not a problem with methodological
design or fieldwork but related to the lower than expected frequency of use at certain sites, restricting the number of interviews that could realistically be obtained (e.g. IKEA and Whitmuir). The value of some of the observational work was also limited by the small number of users during the fieldwork periods, for a similar reason. It should be noted, however, that many sites had a statistically significant sample, although in some cases sub-group analysis was limited by small sample sizes in these sub-groups.
• The timing of some of the survey work, of necessity, may not have been fully representative of normal use (e.g. very early in the term time at a university, possibly before ‘normal’ student behaviour was fully established).
• Mixed methods were employed across the sites to fit their context. However, this makes direct comparison more difficult in some cases.
It is likely that the most robust strand B data are those for the universities, the North Ayrshire schools and HebCelt, where the sample sizes for the survey work were reasonably large (counted in hundreds). The least robust strand B data are for the IKEA sites and Whitmuir, where the very small number of users (in some cases fewer than 10 per day) severely limited data collection opportunities, and a decision was made that it was not cost-effective to seek to gather larger quantitative datasets on behaviour under the circumstances.
The pilots took place in diverse and complex real-world environments with the aim of delivering the best possible scheme for each specific site with the time and resources available. Therefore, direct comparison between sites can be misleading if these wider contextual factors are not considered. In isolation neither strand A nor strand B provides a comprehensive description of pilot performance. However, considered side by side, across the range of pilot sites, the two strands provide a range of evidence to give a good indication of the effectiveness of the various schemes, to illustrate the various factors at play in influencing behaviour and around the related practical issues such as machine location and reliability. There is no single ‘best’ approach suggested by this study, but there is significant and valuable insight into what worked both for sites, and for customers, and what would need to be considered in continuing or replicating initiatives like this in the future.

16 |Recycle and Reward Pilot Projects
3 Key findings and lessons
Overall scheme performance and use
3.1.1 Use models – container flows on and off the sites There are essentially five use models, depending on the site context:
1 Members of the public recycle on site the drinks containers bought on site (self-contained). 2 Site staff collect items that have been left by others on site and put them in the machines on their
behalf, usually as a bulk transaction (bulk self-contained). 3 Members of the public buy drinks containers on site but consume and/or dispose of them off site
(export). 4 Members of the public recycle containers on site that were bought off site (import) – these may be
brought on to the site as products for consumption, or theoretically, as empty packaging for the express purpose of recycling.
5 Members of the public collect the items they have used at home and bring the items in multiples to the site for recycling (bulk import).
In practice most sites displayed a mix of these patterns, though it is hard to quantify their relative significance in most cases.
Some schemes (those at IKEA and Whitmuir) accepted only material purchased on site, so only models 1 and 2 above were possible in terms of material collection (in theory material could be exported and then re-imported, but there was very little evidence this occurred in practice). Similarly, the deposit-return scheme at Heriot-Watt University returned a deposit only for containers purchased on site, though other containers were accepted for recycling without a reward being offered.
The first model is what might be expected on a very self-contained site with little movement across the boundaries (either of items being taken off site for consumption – though these may still be returned later – or of items being brought on site from elsewhere). This was expected to apply largely to the schools during the day and to some of the universities (Heriot-Watt University, for example, being more self-contained than the other two universities). However, the survey data suggests that containers were brought onto these sites nonetheless, as do the machine data at one of the schools (where returns significantly exceeded 100% of sales at one point in the pilot). The balance of evidence (dealt with in more detail in the case studies) suggests this was typically import of products to be consumed on site, rather than of empty packaging to be recycled.
Some of the sites, such as the University of Dundee and Glasgow Caledonian University, are close to town centres, and it is very easy to buy beverages off site and hence there is the likelihood of ‘import’ of containers onto site. Most sites (with the exception of Whitmuir) have shops within walking distance. At Heriot-Watt University around 10% of containers collected were brought in from outside the campus, despite its relative isolation. As return of imported containers was not incentivised, it seems likely this understates the true level of import to the site as a whole. This ‘import’ of containers also happened at the HebCelt festival, where beverages were brought on site for consumption at the festival, in addition to those sold within the venue. Similarly, export is very easy in these circumstances where people are walking off site with a beverage container to drink as they go or at a later stage.
At sites such as IKEA and Whitmuir, the customers are only visiting occasionally and will buy items there that are often consumed off site - and potentially some considerable time later. Given that the sites are quite isolated single sites, returning the items requires a further journey to the site (which may not normally occur until some months later), or return by the delivery driver in the case of Whitmuir.

Data for individual pilots can be seen in the individual case reports accompanying this study. In this overview we focus on those with most to add to the bigger picture. There is a particular focus on Heriot-Watt in some places because its data are more granular than those for some other sites.
3.1.2 Machine use statistics The basic throughput data (containers returned) for the machines (and taken from the machine counters/telemetry data) are shown in Table 2, giving an overall indicator of machine use.
Group Pilot project
Material Total collected (units)
Data period (weeks)
Average units per week
% of those surveyed saying they are repeat users of the machines
Universities GCU Cans 1,819 29 63 7
Plastic bottles
4,861 29 168
Paper cups 5,098 29 176
Total 11,778 29 406
HWU Cans 6,788 20 339 17
Plastic bottles
34,022 20 1,701
Total 40,810 20 2,040
UoD Cans 20,610 30 687 9
Plastic bottles
13,878 30 463
Total 34,488 30 1,150
HWRC Troon Cans 3,931 16 246 n/a
Plastic bottles
2,974 16 186
Total 6905 16 432
Schools Marr Cans 2,498 13 192 39
Plastic bottles
2,498 13 192

18 |Recycle and Reward Pilot Projects
Total 4,995 13 384
NAC Cans 597 14 43 15
Plastic bottles
4,425 14 316
Total 5,022 14 359
Retail IKEA Edinburgh
Cans 192 34 6 0
Plastic bottles
1,774 34 52
Glass bottles 2,299 34 68
Total 4,265 34 125
IKEA Glasgow
Cans 1,505 31 49 0
Plastic bottles
3,520 31 114
Glass bottles 2,010 31 65
Total 7,035 31 227
Whitmuir Aluminium cans
330 22 15 n/a
Plastic bottles
26 22 1
Glass bottles 341 22 16
Total 697 22 32
Festival HebCelt Bio Cups 14,684 0.43 34,263 Not asked
Bottles/Cans 1,840 0.43 4,293
Total 16,524 0.43 38,556
Table 2 Machine use by containers collected until end September 2013
Note: We have put n/a where the survey sample was too small to generate a valid percentage.

With the exception of HebCelt, which was very well used but a special case as a three-day festival (hence no question about regular use), Heriot-Watt University and the University of Dundee were the most well used schemes in absolute terms, followed by Glasgow Caledonian University, the schools and Troon HWRC. These data have to be taken in the context of the potential user population, however. Use of the machines at Heriot-Watt University was high given that the university has only around 7,500 students (at full complement) compared with Glasgow Caledonian University and the University of Dundee, which have more than double this number. While the container per student/staff numbers are relatively low across the universities, it has to be noted that the pilots largely ran across late spring/summer and hence during exams and out of the main term times, with far fewer students on campus than would normally be the case (despite certain events and summer schools).
At the universities, use of the Recycle and Reward machines increased (more than doubling at Heriot-Watt University, for example) once the new term had begun in September, building over freshers’ week as more students presumably became more aware of the machines and their benefits. Subsequent monitoring conducted by Zero Waste Scotland shows that this increase was largely sustained for the remainder of the autumn term at Heriot-Watt (with rates consistently exceeding the late term-time levels of May). Figure 2 shows performance for the entire period monitored. The average rate per student/staff member during the SKM pilot period therefore underestimates the real rate and the full potential demonstrated during the new term.
Figure 2 Variation in machine use across the pilot period and the autumn term at Heriot-Watt University (post-September data shown in pale colours)
The University of Dundee also showed a significant increase in returns early in the autumn term, though this showed much greater variation than the data for Heriot-Watt above as the term progressed.
It is worth noting that at Glasgow Caledonian University the café containing three of the six machines was closed for refurbishment from early May to the middle of September, with no user access to these machines during this time, preventing use during the vast majority of the pilot monitoring period. As a result of staff illness, consistent data are unavailable for the autumn term, so no commentary can be offered on performance after late September.
Heriot-Watt University stands out, however, as being by far the most well used scheme per student/staff member amongst the universities, and possibly the most-well-used of all the pilots given the relatively small number of people on campus during the summer. The machines at the schools were also relatively well used, given that there are only 1,300 pupils at Marr College and 3,000 across the three North Ayrshire schools, though it is worth noting that performance diverged markedly between the three North Ayrshire schools in the new term according to data subsequently collected by

20 |Recycle and Reward Pilot Projects
Zero Waste Scotland. Marr College had the greatest use per member of the target public of all the pilots excluding HebCelt, which collected 1.29 containers per festival goer.
Troon HWRC was less well used given that it theoretically serves around 12,000 people, although it must be noted that not all will use the HWRC, and perhaps relatively few will do so on a regular basis. Visitor numbers were not consistently recorded during the pilot period and equally the number of containers realistically available for this scheme is hard to estimate.
The least used machines were in the retail sector. Given that more than 35,000 visit the IKEA stores every week, use was at a very low level, though it should be considered that many of these will not use the restaurant cafeteria (and in particular not buy the targeted product lines), and thus the true target market is arguably much smaller. Perhaps the sales capture rate below therefore gives a more meaningful measure – especially at this site, where ‘import’ was not possible, as external items were not accepted by the machines. Whitmuir, with ~1,400 visitors per week, was proportionally better used than IKEA, with a comparable rate to Glasgow Caledonian University, although in absolute terms use was very low and bolstered by the use of the home delivery return sacks, which were not available to IKEA customers for return of containers taken off site.
Figure 3 shows some of the absolute return numbers compared across a selection of sites. It focuses on the educational institutions, as these typically have good matched time series data and a relatively high flow rate of material.
Figure 3 Comparative weekly returns across universities and schools
3.1.3 Link to sales – capture rate and import/export effects High levels of use require the material to be available to recycle. Consequently it is useful to reflect on the equivalent proportion of the relevant containers sold on site that are returned to the machines. We have termed this the ‘sales capture rate’ and the data are shown in Table 3. This is a very useful indicator of effectiveness where the site is quite self-contained and isolated from other shops and recycling facilities (e.g. Heriot-Watt University) but less so where drinks are often bought off site and

consumed on site or conversely bought on site but consumed elsewhere. In some cases internal versus external origin can be seen in the machine data, but in most cases it cannot.
Group Pilot Project Material Average capture rate – whole pilot period (%)
Comment on range
Universities GCU Cans 12 Recycling rates from week to week fluctuated significantly; for all containers the highest weekly figure was 32% and
the lowest 7% Plastic bottles
21
Paper cups 14
Total 18
HWU Cans 42 Recycling rates from week to week fluctuated; for all containers the highest
weekly figure was 73% (week 2) and the lowest 9% (week 1). Excluding these
abnormal figures, the highest was 56% and the lowest 30%. Performance in
the Autumn term was, if anything marginally better.
Plastic bottles
37
Total 40
UoD All sales 13 Retail data was supplied monthly, so no weekly variation has been calculated.
HWRC Troon n/a n/a There is no sales data associated with this trial
Schools Marr Cans 158 Figures fluctuated significantly, but the return rate was typically in excess of
100%, illustrating a consistent flow of products onto the site Plastic
bottles 123
Total 158
NAC Total 39 Variation between sites is a significant factor in this trial and is addressed in the
case study report
Retail IKEA Edinburgh
Total 4 Return rates varied, peaking at 20% in Edinburgh, and 25% in Glasgow, but as
the average figures show, this was not sustained IKEA Glasgow Total 7
Whitmuir Cans 21 Volumes were relatively low, so week to week variation was quite high.
Plastic bottles
33
Glass bottles
17

22 |Recycle and Reward Pilot Projects
Total 19
Festival HebCelt Cups 64 As a three day event, there is no long term data to analyse
Bottles/ cans
52
Total 63
Table 3 Sales capture rate
Sales and returns data were captured at all sites, but with differing degrees of granularity. Typically sites provided returns data weekly (Heriot-Watt was an exception, where more granular time data were available) but sales data were more variable, reflecting the dependence on (sometimes multiple) retail outlets reporting the data, and the need for these reporting periods to be convenient and practical for them.
Once again, on this measure, Heriot-Watt University, the schools and HebCelt stand out as having the highest performances.
It should be noted, however, that at Marr College the pupils were initially encouraged to bring empty containers from home as well as recycling those containers bought on site; in practice we think many of the imported containers were in fact brought from home as products and consumed on site. Both factors lead to a capture rate exceeding 100%. It could be argued that some of these containers would have been diverted from existing domestic recycling schemes and hence do not provide net additional recycling.
At the universities it appears that, while machine use increased sharply as the new term started in September, capture rate dropped below summer levels, at least during freshers’ week (Figure 4). This is interesting in that the volume of potential users has increased greatly (along with sales) but a smaller proportion of these potential users are actually using the machines. This is illustrated by the capture rate data from Heriot-Watt University (Figure 4), although this was also seen at other university sites. It may be that freshers’ week is just a busy time with many distractions for new students; that new (and perhaps returning) students need time to learn the system; and/or that undergraduate students are less conscientious than the staff and postgraduates who make up the majority of the population of the campus during the summer months.

Figure 4 Capture rate at Heriot-Watt University over the monitoring period, showing the impact of the new term starting
The data indicate that capture rate may have been on an upwards trend again after freshers’ week at this site. Subsequent monitoring by Zero Waste Scotland confirmed that this was indeed the case, with a return rate (based on unit sales versus returns) of 45% from the end of the pilot period until the end of December, slightly higher than that for May to September.
Post-September sales data for the other sites are lacking so no comments can be made in these cases.
HebCelt performed very well in terms of capture rate. 64% of biodegradable cups sold (i.e. for beer, cider etc.) were captured through the machines across the three days of the festival and 79% on the first two days, when the crowd appeared to be more family and visitor oriented than the Saturday night crowd (which is perhaps more of a ‘night out’ atmosphere). Observations at the festival indicated that this was largely driven by two factors: • cups are easy to stack in large numbers, especially for the children, who were doing the majority of
the collecting; and • the incentive was a prize draw arrangement with good prizes, and the greater the number of single
items returned the greater the chance of winning.
Had the reward been less for cups than cans and bottles, in line with the actual material value, the focus on cups might have been reduced. As it was, the incentive structure helped greatly to reduce littering, since cups were by far the most common waste item on site.
It should be noted that the bottle and can figure of 52% at HebCelt overstates the actual capture of all the materials actually disposed of on site, as it was clear that many visitors brought their own bottled and canned drinks rather than buying drinks on site. By weight (plastic bottles/cans via the machines as a percentage of the total collected including those in litter/general waste), capture was 19%.
0%
10%
20%
30%
40%
50%
60%
70%
80%
16 May
23 May
30 May
6 Jun
13 Jun
20 Jun
27 Jun
4 Jul
11 Jul
18 Jul
25 Jul
1 Aug
8 Aug
15 Aug
22 Aug
29 Aug
5 Sep
12 Sep
19 Sep
26 SepC
aptu
re r
ate
Simple recycling rate, all deposits vs sales
Retail recycling rate, deposit vouchers vs sales
Freshers' week
24 |Recycle and Reward Pilot Projects
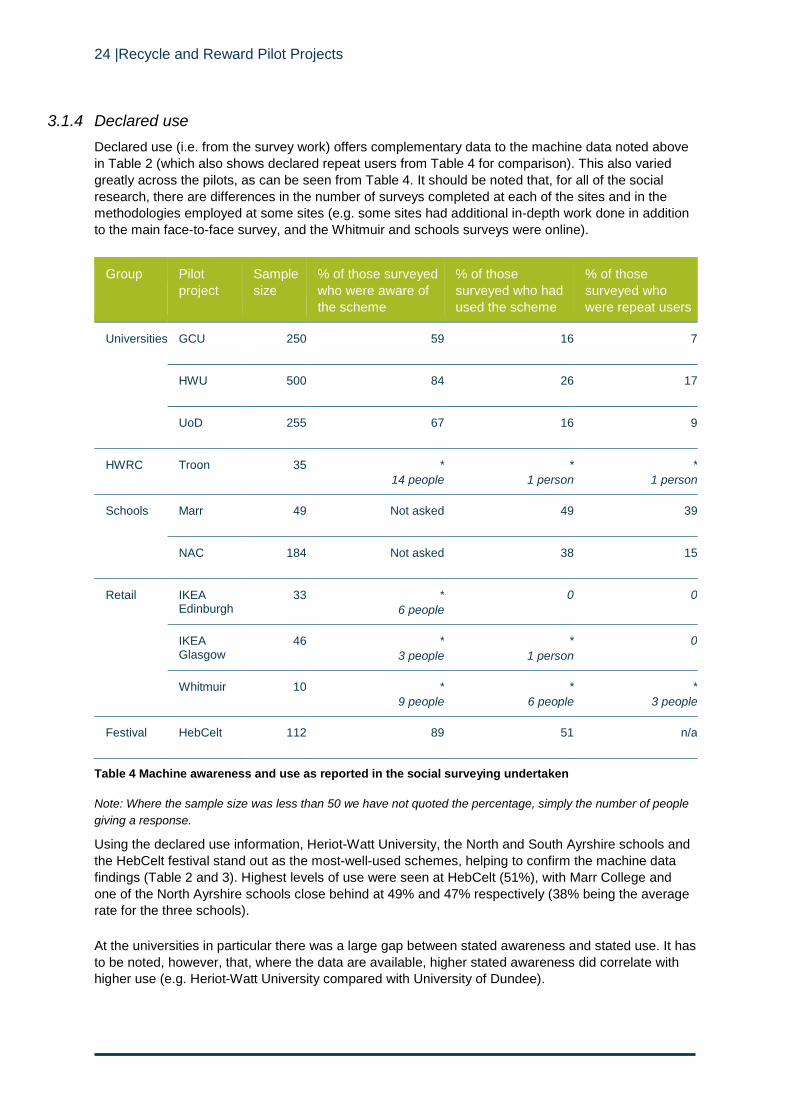
3.1.4 Declared use Declared use (i.e. from the survey work) offers complementary data to the machine data noted above in Table 2 (which also shows declared repeat users from Table 4 for comparison). This also varied greatly across the pilots, as can be seen from Table 4. It should be noted that, for all of the social research, there are differences in the number of surveys completed at each of the sites and in the methodologies employed at some sites (e.g. some sites had additional in-depth work done in addition to the main face-to-face survey, and the Whitmuir and schools surveys were online).
Group Pilot project
Sample size
% of those surveyed who were aware of the scheme
% of those surveyed who had used the scheme
% of those surveyed who were repeat users
Universities GCU 250 59 16 7
HWU 500 84 26 17
UoD 255 67 16 9
HWRC Troon 35 * 14 people
* 1 person
* 1 person
Schools Marr 49 Not asked 49 39
NAC 184 Not asked 38 15
Retail IKEA Edinburgh
33 * 6 people
0 0
IKEA Glasgow
46 * 3 people
* 1 person
0
Whitmuir 10 * 9 people
* 6 people
* 3 people
Festival HebCelt 112 89 51 n/a
Table 4 Machine awareness and use as reported in the social surveying undertaken
Note: Where the sample size was less than 50 we have not quoted the percentage, simply the number of people giving a response.
Using the declared use information, Heriot-Watt University, the North and South Ayrshire schools and the HebCelt festival stand out as the most-well-used schemes, helping to confirm the machine data findings (Table 2 and 3). Highest levels of use were seen at HebCelt (51%), with Marr College and one of the North Ayrshire schools close behind at 49% and 47% respectively (38% being the average rate for the three schools).
At the universities in particular there was a large gap between stated awareness and stated use. It has to be noted, however, that, where the data are available, higher stated awareness did correlate with higher use (e.g. Heriot-Watt University compared with University of Dundee).

Repeat use (and average rates per person, see Table 2) was lower, below 22%, although some people did bulk containers at home, thereby reducing the frequency of machine use but increasing the number of items returned on each occasion. At most sites, however, a majority of users had used the machines only once, indicating curiosity rather than commitment. It has to be remembered, however, that not everyone will buy beverages in bottles and cans and that some will not consume then on site if they do, so these figures alone should not be taken as a measure of the popularity or effectiveness of the scheme.
Marr College is the clear exception, with the highest rate of stated repeat users at 39%. From observation we also know that HebCelt saw repeat use (within the short festival time period), although this was not asked as a question. Table 3 gives a useful alternative measure in terms of sales ‘capture’ as explained above.
3.1.5 User group characteristics At the vast majority of sites there was no statistically significant male or female bias (once corrected for the population split), although in the Ayrshire schools more girls than boys used the machines. At the University of Dundee and Heriot-Watt University a disproportionate number of postgraduates and staff (mainly catering and cleaning staff) used the machines, although this may have been partially because most of the monitoring was undertaken out of term time.
At Marr College, use amongst the younger children (S1 and S2) was far higher than among the older children, though the placement of the machines within the school may account for this. At the HebCelt festival, the observational analysis indicated that the machines were especially popular with young children of primary school age, who were also observed collecting containers with the explicit aim of recycling them. Further details of the user profiles can be found in the individual case reports.
3.1.6 Transaction sizes Based on observations across the sites, and supported by the more detailed data collected by the machines at Heriot-Watt (which recorded the size of every transaction for the full pilot period, giving an extensive dataset), the most common form of use was just to use the machines in passing, when an empty container needed disposal. The majority of machine transactions were just one or two containers. While use was throughout the day at all sites, several sites saw a clear peak in machine use around lunchtime, when people are consuming beverages on the go and looking to recycle the containers.
At a number of sites, however, for example IKEA, Heriot-Watt University, the University of Dundee and some of the schools, bulk returns were observed and recorded by the machines. During the social research five transactions of over 14 units were observed at Heriot-Watt University, for example, and one of 82 containers. This suggests stockpiling, and the incentive may be significant in encouraging this. See section 3.2 for more on motivation and incentives. However, over the course of the pilot project as a whole, the vast majority of transactions at Heriot-Watt (the only site where the machines recorded transaction size) involved just one or two items (see Figure 5), and these also accounted for the majority of containers returned. At this site it seems very likely that larger transactions were at least sometimes being made by cleaning staff. This was observed during site visits, and is also suggested in the machine data (Figure 5), which show some larger transactions very early in the morning, when only cleaning staff are likely to be on site.

26 |Recycle and Reward Pilot Projects
Figure 5 Machine returns at Heriot-Watt University
While staff were not the primary target audience, this behaviour may help to increase overall recycling levels where staff were not previously segregating recyclables. In contrast, at IKEA Edinburgh for example, staff were already recycling containers left on customer trays; hence use of the machine by these staff would not increase overall recycling levels, and was not encouraged during the pilot.
Only the HWRC pilot was expected to gain most containers as part of bulked transactions, and it is notable that this pilot saw relatively low levels of returns, though a number of other factors are likely to contribute to this.
3.1.7 Effect on overall waste and recycling rates The impact on overall waste and recycling rates was generally very difficult to establish because of a lack of accurate and complete baseline weight data with which to compare in-pilot data and/or a lack of disaggregated weight data for the sitef. Often the quantities going through the machines would be too small to be easily discernible compared with the much greater quantities of other waste, especially with natural variations from week to week. The target materials were all light by nature (tens of grams) as against relatively heavy general waste items such as food waste; hence the impact on general waste was always likely to be small. More generally, recycling away from home is much less well understood than in-home recycling, so it is also hard to use any more general reference points for recycling rates from elsewhere.
Hour of day
Uni
ts p
er tr
ansa
ctio
n, 1
to 8
2

At Heriot-Watt University, while overall weight data were not available, the composition of residual waste and litter before and during the pilot was analysed. These data show that, overall, the proportion of polyethylene terephthalate (PET) bottles in waste sampled across site was 8.4% in the baseline case and 2.7% during the in-pilot period. The proportion of aluminium cans remained at ~2% in each case. This may suggest that the pilot had some success in diverting PET bottles from residual waste, consistent with the fact that plastic bottles dominated the machine returns at Heriot-Watt University. Analysis of the recycling stream in the Student Union also suggested a reduction in PET bottles and hence a shift to the Recycle and Reward machines from unrewarded recycling. A note of caution is required, however, since (a) these were snapshots of before and after data taken in one day on each occasion (25 April and 24 October) and (b) the quantities analysed were quite small. It is also not clear that behaviour at Easter, during exams, would be comparable to that during term time in October.
Taking into account the difference in visitor numbers, HebCelt in 2013 had a like-for-like reduction in general waste of 37% compared with the 2012 event. There is no reason to think that a lot of waste prevention occurred, since no specific new initiatives were in place; hence, this implies that this material has been diverted into the compostable and recyclable streams. This in turn implies that the machines, combined with the Green Team volunteers, were more effective at diverting waste than the Green Team alone (as deployed in 2012). The overall festival recycling rate was 67%, very impressive for a festival and especially without the aid of a materials recycling facility (MRF, as used on site to sort waste at the Glastonbury Festival for example), though the family-oriented and smaller scale of HebCelt may also contribute to this.
The survey work also gives an indication of the potential net increase in recycling (Table 5).
Project Sample size
% saying that they recycle more plastic bottles
% saying that they recycle more cans
% saying that they recycle more cups
GCU 250 4 2 3
HWU 500 11 4 n/a
UoD 255 3 5 n/a
Troon 35 No increase No increase n/a
Marr 49 All materials: 60
NAC 184 All materials: 35
Whitmuir 10 All materials: no increase
Table 5 Stated increase in recycling behaviour from social survey responses
Taken at face value, these survey results indicate that additional recycling was limited at Glasgow Caledonian University and the University of Dundee but greater at Heriot-Watt University and very significant at the North Ayrshire schools and Marr College. It should be remembered that questions of this type may invite an overclaim of socially desirable behaviour, but this might be expected to be consistent across comparable sites.

28 |Recycle and Reward Pilot Projects
At the schools the machines represented a significant improvement in recycling capacity (irrespective of method) and a significant increase would be expected from a low baseline. It may therefore not be appropriate to attribute the change entirely to the fact that recycling was incentivised. In addition, at these sites, the data indicates that containers were being brought in from outside the sites, hence potentially reflecting in part a diversion from recycling at home (though the way this question was asked related to overall recycling behaviour, and other evidence suggests it was often products, rather than simply packaging, that were being imported).
At the University of Dundee, while the project survey work showed that 3% of the population claimed to have recycled more plastic bottles since the machines were introduced, and 5% claimed to have recycled more cans, the university’s own annual environmental survey (conducted towards the end of the summer term, rather than early in the autumn term, though with a somewhat different respondent base) showed that 13% of those surveyed claimed to be recycling more.
Self-reported changes in behaviour measured only after the fact can be treated as indicative only (people may not remember clearly what they previously did, leading to both over- and under-reporting), but the suggestion that there has been a small increase in people’s recycling behaviours seems reasonable on the evidence presented.
3.1.8 Quality of material captured One of the key benefits of this type of equipment is that a very high quality of material should be collected with little contamination (Figure 6). The more sophisticated machines are very effective at accepting only what they have been programmed to collect. This can, however, lead to quite high levels of rejection if only a narrow material range is accepted; and, unlike most schemes, the reject is returned directly to the consumer, which may have an impact on the user experience. An effective scheme needs to be able to recognise and accept all appropriate items, and it will also be beneficial that users understand exactly which containers are accepted to avoid frustration, should they try to recycle items that cannot be accepted.
Figure 6 Compacted plastic bottles (Glasgow Caledonian University) and low levels of bottle contamination in cups (HebCelt)
Most of the pilot projects used machines that were technically capable of recognising and segregating different material types into appropriate storage bins which were located within the machine fabric. Some machines had two (or more) storage bins, one for each material accepted, with internal sorting apparatus. Although this operation was observed to be effective within most pilots, there was a temporary malfunction observed during the HebCelt festival, during high volume use of the machines. In that case machines were temporarily programmed to accept all containers (including those from multipacks without bar codes) to reduce queuing caused by high rejection rates, and this temporarily increased the contamination of previously ‘clean’ segregated waste streams.

Where machines use bar code recognition, there can be ‘teething’ problems when the project starts, if machines are not fully programmed to accept all the target containers (for example, if the bar code for a particular product line has been omitted during programming). This can require subsequent adjustment too if new sales lines are added. If machines reject items that should be accepted, this can be frustrating for users and site managers. However, some complaints about rejection may result from users attempting to recycle unsuitable items without realising this. Under other systems the user would not be made aware of their mistake.
It is interesting to note that the machine at Marr College was not as sophisticated as in some pilots and identified containers by weight rather than more sophisticated shape and bar code sensors. Despite this the staff at the college reported that the material was of better quality than that obtained through the commingled recycling bins at the school. It may be that the simple act of using a reverse vending machine encourages greater care from users, i.e. it is not just a ‘bin’ and there is perhaps felt to be a moral duty to provide clean material when there is a reward involved. That said, some pupils at one school were seen trying to trick the machines, for example by attaching string to containers to allow their retrieval after they were placed in the machine entrance, allowing several vouchers to be obtained per container. It is relatively easy to set machines up to prevent this.
The improved quality of material should in theory save sites money, or even generate a revenue stream, since the materials do not need to go via a material recycling facility for separation, incurring a gate fee as a result, and sites may be able to realise some of the material value directly. In reality none of the pilots realised this potential benefit, because of the small quantities of materials involved and the limited pilot period. Larger-scale operations, for example where all recyclables are collected this way at a university, could see a tangible financial benefit, especially with changes to waste management contracts to allow valuable material to be stockpiled and collected separately. However, realising this additional value would require collecting sufficient material to justify separate collections, and sufficient storage space on site to store separated material in the meantime. The practicality of this might vary across different locations. So, while there is potentially a higher revenue stream or reduced costs from the higher quality of material, a site would need to consider carefully its ability to benefit from this according to its specific circumstances.
3.1.9 Effect on litter In general, the surveys found that the reduction of litter was seen as a minor benefit of the schemes. This was largely borne out by anecdotal evidence that suggested that the impact on litter was small in most cases. The survey responses (where available) are shown in Table 6.

30 |Recycle and Reward Pilot Projects
Project Sample size % of total population seeing litter reduction as a benefit (unprompted)
GCU 250 23
HWU 500 12
UoD 255 3
Troon 35 People mentioned that the HWRC team were good at keeping the site tidy
Marr 49 4
NAC 184 6
IKEA Edinburgh 33 6
IKEA Glasgow 46 15
Table 6 Survey responses around litter benefits
Note: Italics indicate a small sample size, and the percentage figure should be treated as indicative only.
At the retail sites, IKEA and Whitmuir, litter was not a significant problem in the first instance so the impact of the machines was not noticeable for staff. The same can be said of the Troon HWRC, where site staff are constantly on hand to clear up. At the schools those responding to the survey perceived the impact on littering to be small. It has to be remembered, however, that pupils may now be doing, or negating the need for, the job that staff or volunteers had done previously through litter picking.
At the university sites, the evidence was not clear whether or not the Recycle and Reward machines had reduced litter, as various contrasting opinions were evident. At the University of Dundee, litter had been a problem in the past but various other facilities had already been put in place to try and reduce litter (e.g. Big Belly bins and Recycle on the Go bins, with the former installed just before the introduction of the Recycle and Reward scheme). Zero Waste Scotland analysed the composition of litter at the University of Dundee in relation to the Big Belly bin installation, but also bridging the introduction of the Recycle and Reward machines, and concluded that a better understanding of natural variability in litter over time was required to determine if changes should be considered significant.
The response at Glasgow Caledonian University was interesting in that: • when asked about the benefits of the scheme, 23% of participants mentioned a reduction in litter
(unprompted); • when asked directly ‘Do you think the scheme has made a difference to litter levels at the
university?’, 18% said yes; this view was supported by some people during the focus group work.
The difference here (23% vs. 18%) may be because people imagine that the scheme should reduce litter, even though in practice fewer people actually observed any difference. Generally the opposite was seen in surveying: more mentioned litter when prompted than when unprompted, as would be expected.
The litter collection and compositional analysis at Heriot-Watt University (although only a limited snapshot, on a single day before the pilot started and one after) did show a significant litter reduction (~40%) after the introduction of the pilot. In both analyses, the areas covered by the sampling were identical; however, the sample period was small and it is not possible to draw any firm conclusions on whether the pilot has led to less littering or whether there were extenuating circumstances on the days the samples were taken. One member of staff at Heriot-Watt University suggested there might have been an increase in the amount of litter around the machines due to rejected items being left at the side of the machines. In contrast it was also observed at a number of sites that quite often people would take the rejected item to another recycling bin or waste bin.
One clear success in litter terms was the HebCelt festival, where litter was almost entirely eliminated in the arena (one exception being Saturday evening at the main stage) as children and adults picked up any containers that had been dropped to allow the chance of winning a prize in the machines. The anecdotal evidence at HebCelt was that litter had been a problem in previous years, requiring a lot of effort from Green Team volunteers to keep the site respectably clean. Unprompted, 12% of the Recycle and Reward machine users identified that the positive impact of a decrease in littering motivated them to use the machine. In addition a further 17% of respondents commented that the festival site was cleaner than other festivals or than previous years at HebCelt (though the former may also reflect the nature of the HebCelt festival as a small, family-friendly festival).
3.1.10 Effect on footfall and retail sales None of the pilot sites evidenced any noticeable effect on footfall or retail sales as a consequence of the pilots, either boosting or depressing site sales. Given the number of factors that potentially affect these metrics, the impact of the Recycle and Reward pilot was always going to be very difficult to discern.
For schemes that are solely based on a reward, that are well used and where the reward is a significant driver, it may well be that (all else being equal) purchasing behaviour tends to favour the outlets that are linked to the reward. For example, a school or campus shop may benefit from this effect at the expense of a local shop selling the same thing. However, there was no evidence that this occurred in practice, and, in the pilot schemes, the main driver for this would be people going to the shop to claim a reward, rather than preferentially purchasing drinks containers there, as most schemes of this nature in the pilots accepted containers bought both on and off site.
There are, however, potential concerns around deposit return where this is applied only at the one site. As some focus group participants observed at Heriot-Watt University, adding 10p to a beverage at the campus shop might make this shop less competitive than local shops, driving trade away. Based on focus group feedback, some customers did notice the change in price, and not all had understood that it was refundable. In practice there was no evidence of sales diversion during the pilot at Heriot-Watt (all retail outlets on site charged a deposit, and other shops off site are not as convenient), but clearly a scheme where alternative (or identical) products are readily available without a deposit, or where the deposit is higher, might see changed purchasing behaviour. This concern about the immediate purchase price was also expressed by one customer at Whitmuir.
Wider application of a reward or deposit return system would, dependent on design and coverage, be expected to negate this displacement effect.
Public reaction to the schemes (awareness, attitudes)
3.2.1 Public perceptions – do people like or dislike the scheme? Across the vast majority of schemes, the machines were very well received by the majority of the target audience, including users and non-users. Overall satisfaction and ease of use were both rated
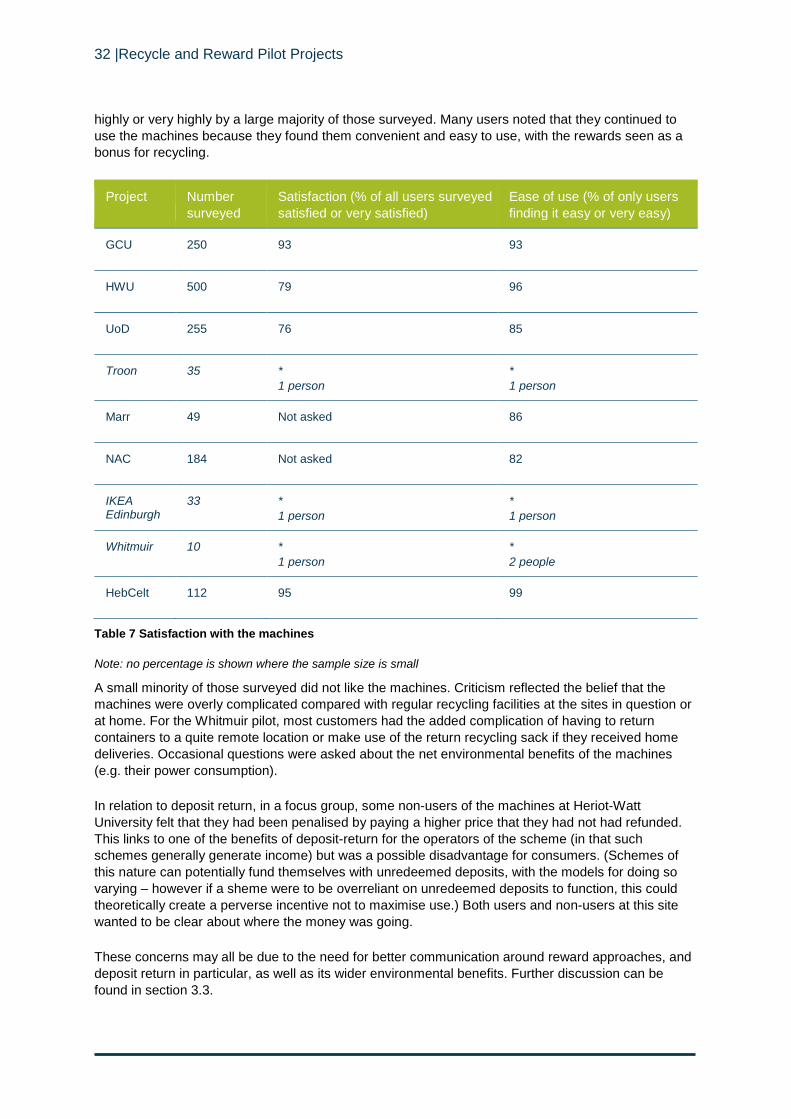
32 |Recycle and Reward Pilot Projects
highly or very highly by a large majority of those surveyed. Many users noted that they continued to use the machines because they found them convenient and easy to use, with the rewards seen as a bonus for recycling.
Project Number surveyed
Satisfaction (% of all users surveyed satisfied or very satisfied)
Ease of use (% of only users finding it easy or very easy)
GCU 250 93 93
HWU 500 79 96
UoD 255 76 85
Troon 35 * 1 person
* 1 person
Marr 49 Not asked 86
NAC 184 Not asked 82
IKEA Edinburgh
33 * 1 person
* 1 person
Whitmuir 10 * 1 person
* 2 people
HebCelt 112 95 99
Table 7 Satisfaction with the machines
Note: no percentage is shown where the sample size is small
A small minority of those surveyed did not like the machines. Criticism reflected the belief that the machines were overly complicated compared with regular recycling facilities at the sites in question or at home. For the Whitmuir pilot, most customers had the added complication of having to return containers to a quite remote location or make use of the return recycling sack if they received home deliveries. Occasional questions were asked about the net environmental benefits of the machines (e.g. their power consumption).
In relation to deposit return, in a focus group, some non-users of the machines at Heriot-Watt University felt that they had been penalised by paying a higher price that they had not had refunded. This links to one of the benefits of deposit-return for the operators of the scheme (in that such schemes generally generate income) but was a possible disadvantage for consumers. (Schemes of this nature can potentially fund themselves with unredeemed deposits, with the models for doing so varying – however if a sheme were to be overreliant on unredeemed deposits to function, this could theoretically create a perverse incentive not to maximise use.) Both users and non-users at this site wanted to be clear about where the money was going.
These concerns may all be due to the need for better communication around reward approaches, and deposit return in particular, as well as its wider environmental benefits. Further discussion can be found in section 3.3.

3.2.2 Awareness and promotion All pilots had a communications plan developed in conjunction with Zero Waste Scotland. While these were not always fully implemented, a wide range of communication activities were undertaken for each pilot including the machine branding, posters, shelf talkers, newsletters, social media, websites, email and announcements (e.g. by staff at schools and universities). In addition, extra activities were undertaken at some pilot sites, either where the initial launch appeared not to have sufficiently engaged customers or, in the universities, at the start of the new term.
Stated awareness of the machines varied greatly across the pilots as noted in Table 4. At most sites, including the schools, universities and HebCelt festival, awareness was stated as being over 60%, although use rates at most sites were far below this. For example, at the University of Dundee, awareness amongst those surveyed was 67% but use was 16%, and at Heriot-Watt University they were 86% versus 26%. This gap between awareness and use may be for a number of reasons: • some people are not buying beverages in containers and thus are not really in the target audience; • people are not aware of how to use the machines and the materials accepted; and • people are not aware of the benefits of using the machines compared with other recycling facilities.
Awareness amongst IKEA customers was low at both stores - under 20% at Edinburgh, and under 10% at Glasgow, where less promotional work was undertaken. This low level of awareness may be because the majority of customers at IKEA are occasional, unlike other pilot project sites, where there is repeated exposure to the communication messages. It also has to be seen in the context of a wide range of other commercial promotions at a large store such as IKEA. Customers go to these stores to buy various items and recycling is not a priority. That said, it is worth noting that Edinburgh saw more promotional activity than Glasgow, and also saw higher awareness and use. It is also interesting to note that an extra communication push at Edinburgh did coincide with increased use of the machines, though not all of this change can necessarily be attributed to the communications, as some other elements of the scheme were also modified at the same time.
It is worth noting that a small minority of those surveyed were confused about what materials could be recycled, sometimes naming materials (such as glass bottles or milk containers) that could not be recycled. At Glasgow Caledonian University, awareness of the ability to recycle paper cups (56%) was far lower than awareness of the ability to recycle plastic bottles (93%) and aluminium cans (88%), despite the fact that the machines and the promotional material made it very clear that all three materials could be recycled in the machines. This may relate to what people are familiar with recycling at home and elsewhere rather than any reflection on the communication materials used for the scheme. In practice, as the machines reject any ‘incorrect’ items, misunderstanding will not lead to contamination as it would in a normal recycling scheme, though it may impact the user experience.
In the deposit-return system employed at Whitmuir and Heriot-Watt University, it is worth noting that some of those surveyed were not aware that a deposit had been added. At Heriot-Watt University 40% of users surveyed, and 29% of non-users, were not aware that a 10p deposit had been added to certain beverages bought on site. In relation to this, it is interesting that 63% of containers that had a deposit at Heriot-Watt University were not recycled through the scheme (though they may have been recycled in the general recycling bins); this implies that at least some people did not knowingly fail to reclaim a deposit, lack of awareness being the issue. As a corollary of this, at Heriot-Watt University the fact that the machines did not issue a voucher for items not bought on the campus also seemed to cause confusion. The focus groups at Heriot-Watt underlined that the mechanics of the scheme were not universally understood. It may be that the Recycle and Reward message used across the pilot sites fitted better with the reward systems than with deposit return. Equally, though, it may be that customers of established deposit schemes elsewhere do not understand all the cashflows in the system. Both users and non-users in focus groups at Heriot-Watt stressed that transparency was important.
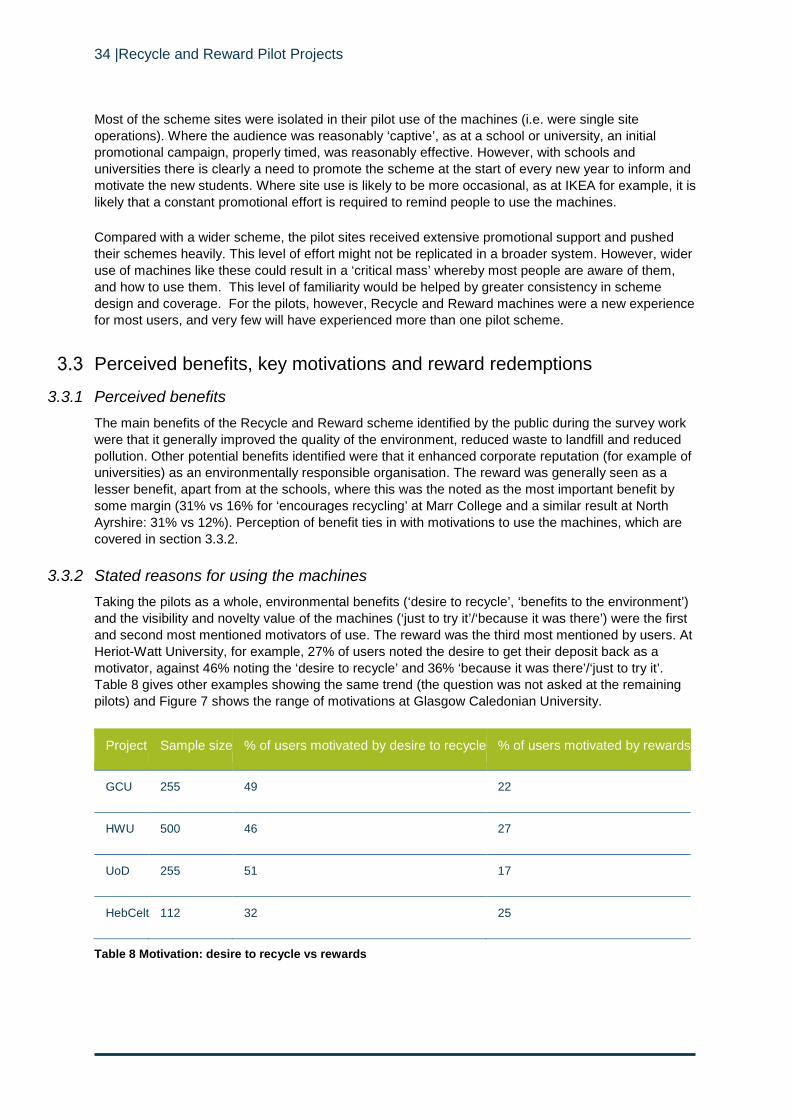
34 |Recycle and Reward Pilot Projects
Most of the scheme sites were isolated in their pilot use of the machines (i.e. were single site operations). Where the audience was reasonably ‘captive’, as at a school or university, an initial promotional campaign, properly timed, was reasonably effective. However, with schools and universities there is clearly a need to promote the scheme at the start of every new year to inform and motivate the new students. Where site use is likely to be more occasional, as at IKEA for example, it is likely that a constant promotional effort is required to remind people to use the machines.
Compared with a wider scheme, the pilot sites received extensive promotional support and pushed their schemes heavily. This level of effort might not be replicated in a broader system. However, wider use of machines like these could result in a ‘critical mass’ whereby most people are aware of them, and how to use them. This level of familiarity would be helped by greater consistency in scheme design and coverage. For the pilots, however, Recycle and Reward machines were a new experience for most users, and very few will have experienced more than one pilot scheme.
Perceived benefits, key motivations and reward redemptions
3.3.1 Perceived benefits The main benefits of the Recycle and Reward scheme identified by the public during the survey work were that it generally improved the quality of the environment, reduced waste to landfill and reduced pollution. Other potential benefits identified were that it enhanced corporate reputation (for example of universities) as an environmentally responsible organisation. The reward was generally seen as a lesser benefit, apart from at the schools, where this was the noted as the most important benefit by some margin (31% vs 16% for ‘encourages recycling’ at Marr College and a similar result at North Ayrshire: 31% vs 12%). Perception of benefit ties in with motivations to use the machines, which are covered in section 3.3.2.
3.3.2 Stated reasons for using the machines Taking the pilots as a whole, environmental benefits (‘desire to recycle’, ‘benefits to the environment’) and the visibility and novelty value of the machines (‘just to try it’/‘because it was there’) were the first and second most mentioned motivators of use. The reward was the third most mentioned by users. At Heriot-Watt University, for example, 27% of users noted the desire to get their deposit back as a motivator, against 46% noting the ‘desire to recycle’ and 36% ‘because it was there’/‘just to try it’. Table 8 gives other examples showing the same trend (the question was not asked at the remaining pilots) and Figure 7 shows the range of motivations at Glasgow Caledonian University.
Project Sample size % of users motivated by desire to recycle % of users motivated by rewards
GCU 255 49 22
HWU 500 46 27
UoD 255 51 17
HebCelt 112 32 25
Table 8 Motivation: desire to recycle vs rewards

Figure 7 Stated motivations at Glasgow Caledonian University
Focus group feedback and in-depth interviews helped to elaborate on the motivations. In general, the reward was seen as a ‘welcome bonus for recycling’ rather than as a prerequisite. The desire to ‘try out’ the machines was certainly a driver for many of the users. At the schools, however, while the motivation question was not asked directly, the reward was seen as the main benefit, as noted above, with environmental reasons regarded as less important. At the HebCelt festival, children in particular seemed to enjoy the novelty of using the machines and the opportunity of winning a prize. Many turned it into a game, collecting as many cups as possible.
An overwhelming number of survey respondents (users and non-users) across the pilots thought that the rewards (of whatever size or type) were appropriate, although it has to be noted that this may have been stated without consideration of any reference (such as the price of the original item) or of whether or not the reward was enough to affect their behaviour. This high level of approval seems somewhat odd given the variability of rewards across sites. It may be that all schemes were well tailored for their context and customers, but equally it may be survey that respondents had little experience with which to compare and contrast the proffered rewards.
At IKEA Edinburgh, it appeared that the use of the machine increased, in part, because the value of the reward increased midway through the pilot (vouchers being exchangeable for ‘green’ products). Majorities of those surveyed at IKEA and Heriot-Watt University also liked the idea of being able to donate to a charity. At Heriot-Watt University, 20% of users stated that they chose to donate to charity rather than redeeming a voucher, and the majority of users within the focus groups also claimed they usually donated the 10p to charity and would continue to do so. In reality, once the option to donate to charity was introduced (after the summer break), only 4.9% of the transaction rewards were donated.
As none of the machines provided cash rewards, users had to redeem vouchers or prize tickets, which required some effort. The redemption of vouchers therefore gives some indication of just how important the rewards were to users. Section 3.3.3 discusses redemption rates across the pilots and the link to motivation.

36 |Recycle and Reward Pilot Projects
3.3.3 Vouchers/deposits redeemed Redemptions of vouchers (as discounts off new goods) or deposits may indicate the degree to which people are motivated to recycle by the financial reward offered or perhaps (as some of the focus group work suggested) the desire just to claim a reward that is offered, as a by-product of recycling rather than as the main motivator to recycle. Convenience may also be a factor in redemption. Interestingly, at the universities, redemption rates are far higher than would be expected from the stated motivations noted in Table 8. Reward redemption rates are shown in Table 9.
Group Pilot project
Reward type
Rewards/deposits issued (units apart from UoD)
Rewards claimed/deposits refunded (units apart from UoD)
Redemption rate (%)
Universities GCU Vouchers 11,778 5,976 51
Golden Tickets
123 84 68
HWU Vouchers 36,473 31,115 85
Donations made – proportion of total
2.4% n/a n/a
UoD Financial value
£1,447 £1,228 85
HWRC Troon Vouchers 6,905 2,250 33
Schools Marr Vouchers 4,995 793 16
NAC Vouchers 5,022 1,188 24
Retail IKEA Edinburgh
Vouchers 897 335 37
Donations made
360 n/a n/a
IKEA Glasgow
Vouchers 1,792 351 20
Donations made
5,245 n/a n/a
Whitmuir Deposits 697 598 86
Festival HebCelt Prize vouchers
n/a n/a 92
Table 9 Redemption rates

Rewards were noted as the main benefit of the schemes at the schools, in contrast to other sites. However, redemption rates are some of the lowest (24% in North Ayrshire), which is counterintuitive. At the North Ayrshire schools, the voucher is for 5p off a healthy meal, which for some children may not be a sufficient enticement. This may tie in with the fact that just over 50% of pupils at the North Ayrshire schools said that they had used the machines only once, perhaps out of curiosity. At Marr College, the redemption rate seems to be very low (16%) but in fact there may be a long lag evident here in that the pupils have to collect a large number of vouchers (40–100) to trade in for swim tickets or cinema tickets.
It is interesting to note the high redemption rates at the two deposit return pilots (Heriot-Watt University and Whitmuir), which may be linked in part to the awareness among the majority of users that they had already paid an additional amount at the point of purchase. That said, certain other pilots also had high redemption rates even though they did not use a deposit return system.
The high redemption rate at the University of Dundee is perhaps surprising compared with the other universities. However, it needs to be noted that the 85% redemption rate is by value, not by number of vouchers, which was a lower figure, but for which precise numbers are not available. The machine transaction records, observations and focus group work all show that a number of users at most sites brought collected materials in quite large quantities, thus obtaining a higher-value voucher (often for several pounds), which is likely to be seen as more worthwhile to redeem. Those who obtain just a smaller-value voucher, worth 5p or 10p for example, may not be so motivated.
The social research at Glasgow Caledonian University gives an example of stated behaviour. From the survey results, the majority (76%) of scheme users stated that they had not redeemed the vouchers at that time. Of that group, 45% were saving them up, 13% had lost them and 10% had not received (or taken?) a voucher. The actual overall redemption rate at Glasgow Caledonian University was 51%, suggesting that (if the claimed behaviour is correct) some of the 76% of stated non-redeemers did indeed eventually cash in their vouchers.
There is also a very practical point here in that paper vouchers can easily be lost or misplaced when they are not used immediately. In focus groups, more convenient alternatives were suggested such as loyalty cards (where rewards could be banked until they were worth claiming) or, at universities, an ability to use rewards more flexibly (for example for photocopying and printing costs, or to pay library fines). There was also a suggestion of potential embarrassment at both being seen to be recycling for such a small amount (5p at Glasgow Caledonian University) and the ‘need’ to claim such an amount.
At the University of Dundee, of those who had redeemed vouchers, approximately half saved the vouchers up for some time before redeeming them. Others used them either straight away or the next time they bought something in the campus shop.
At HebCelt (92% redemption rate) the reward was the opportunity to win one of many prizes, including T-shirts and iTunes vouchers as well as high-value prizes such as a weekend ticket for the 2014 festival and an iPad. It is worth noting that the reward in this case is not guaranteed, but still offers a very good incentive for many. As with any lottery, a chance of winning a high-value prize is generally more attractive than the certainty of claiming, say, a 10p discount off a future purchase. At HebCelt the prizes were most often won by children, who were keen (and generally excited) to claim their prize.
This can be contrasted with Glasgow Caledonian University, where the Golden Ticket for a free meal had a significantly higher redemption rate (68%) than the regular voucher (51%). This was a low-cost incentive that seemed to work well and received very favourable user feedback. It is worth remembering that, for the sites, there is a trade-off between the cost of the reward and its effectiveness. See section 4.5 for more on motivation.

38 |Recycle and Reward Pilot Projects
3.3.4 Reasons for not using the machines The most common reasons given for not using the machines were a lack of awareness (which varied considerably, as noted above), not having the containers that the machine takes, not finishing the drink near enough to the machines to allow convenient disposal, and already recycling elsewhere. At Heriot-Watt University, for example, around 33% of non-users claimed that they did not have empty bottles and cans to recycle, although this figure might be considered high. There is likely to be overclaim here as those surveyed seek to rationalise an ‘undesirable’ behaviour; however, the reality is not known. Use of reusable bottles was another factor, although affecting only a small minority.
Convenience was clearly a very significant factor. The majority of people were not prepared to go out of their way to recycle, even with an incentive to do so. Reliability is also a key issue; some users at some sites had been put off by machines being offline. Reliability right from the start of a pilot might be considered important in this regard. Container rejection is another key factor that can prevent use. Generally reliability problems, as seen from the site management side, were greater near the start of the pilot (as teething problems with machines were identified and fixed) but it may be that early bad experiences are a barrier to repeat use. It may also be that legitimate rejections are seen as faults by users who are unaware they are trying to recycle the wrong items. There is no way to discern the accuracy of rejections in our pilot data beyond anecdotal site feedback.
The Heriot-Watt University approach is helpful in minimising perceived unreliability. A wide range of containers is accepted even though some (those not sold on campus) do not receive a refund. Further discussion of machine location, reliability and convenience is given in section 4.7.
During some focus groups, several non-users were critical of the machines and queried their benefit over normal recycling bins. While it was suggested that the visual impact of the machines would increase awareness of the need to recycle and the sense that recycling was being taken seriously, these non-users seemed to need more reassurance on this and on any other benefits of the machines, e.g. better-quality materials and greater capacity as the machines compacted the items. Interestingly, a large majority of non-users, once better informed of the scheme and its benefits, said that they would at least consider now using the machines. This indicates that better communication can turn non-users into users.

4 Practical lessons
Data and reporting Data provision was a contractual obligation for the pilot projects. Most of what follows in this section is more relevant to future pilots than to wider schemes given that it is mostly about answering research questions rather than day-to-day operational monitoring.
An introductory monitoring and evaluation workshop was undertaken for the organisations, explaining the data needs and providing a form. Unfortunately, several of the pilots struggled to provide reliable waste and sales data for the monitoring and evaluation process. That reduced the learning value of certain pilots.
In part, this lack of data provision was due to the impracticality of weighing materials (by the host sites or their waste contractors) within the constraints of existing operational practice, or other technical barriers, for example around the way till systems recorded data and could be interrogated. In several cases, staff resource limitations prevented regular measurement, observation and reporting. Future pilots would benefit from project staff being more explicitly aware of data needs before they apply for the funding. That would allow resourcing around data gathering and reporting to be more fully considered (see section 4.2). However, it seems likely that, on complex sites, a comprehensive understanding of all waste flows will be hard to capture comprehensively and affordably over both a baseline and the pilot period for site pilots of this nature. These challenges are far from being unique to this project.
The machine providers themselves provided good-quality and timely data, generally through telemetry links and web pages. While this varied in the level of granularity (for example, some detailed transaction times and the number of units deposited, and some did not, depending on the technology used), overall return numbers and vouchers issued were collated. One issue that caused problems, however, was around the powering down of the machines overnight, which reset the counter on certain machines, causing the loss of cumulative data at some sites (generally earlier in the pilot, before this concern was identified). Specifying machines that can retain data in this situation would be one solution. This was predominantly a pilot problem, although it could be important in a wider scheme depending on how it works and any required validation of transactions.
Ownership and resourcing issues None of the pilots employed additional staff for the implementation of the pilot, although Heriot-Watt University did have project management support from the equipment supplier and additional staff resource from the Student Union, catering and estates. This does not mean, however, that there was no additional work. It has to be noted, however, that much of the additional effort was related to data gathering and reporting for the pilot rather than operational issues that would affect a wider scheme.
4.2.1 Setup and launch The pilot sites required considerable time to implement communication plans and carry out ongoing promotion of the schemes. Zero Waste Scotland also provided significant support with this process, and in developing communications materials to support the pilots. Most projects hosted a formal launch for their project, which involved organising an official to launch the project, briefing media about the project, providing supporting staff during the event, providing displays and explaining the benefits and purpose of the projects with assistance from Zero Waste Scotland volunteers. For example, two projects had local MSPs to attend the launch events and several had local councillors and dignitaries.
All machine providers also gave on-site training and support for setup and launch. Setup of the machines involved considerable work at each site, for example providing a three-phase electrical

40 |Recycle and Reward Pilot Projects
supply, shelter (e.g. the Perspex shelter at Troon HWRC) or heaters for the equipment (e.g. at Whitmuir) to ensure that the machine worked properly over the colder months of the pilot.
4.2.2 Ongoing management For the deposit return pilots at Heriot-Watt University and Whitmuir, considerable effort went into labelling the relevant items with additional bar codes and price information to reflect the deposit added and to allow the machines to distinguish between containers with and without the deposit added. This requirement was because of the site specific nature of the pilots.
The machines are inherently more complex than a passive waste recycling bin and do need regular preventative maintenance and, in some cases, corrective maintenance, though the intention is that this should be more than offset by improved waste management practices on site. Day-to-day activities would largely revolve around ensuring that the machines were operating correctly and being emptied as necessary. Regarding the regularity of emptying, it is worth noting that most of the machines shredded or otherwise compacted the containers, meaning that needed to be emptied less often than a regular recycling bin. This in turn reduces the demands put on the site’s waste and facilities management staff. This helped to counterbalance any additional maintenance work created by the machines.
Zero Waste Scotland and the machine providers also gave significant time and support in resolving issues that arose on site. The key lesson here is having machines with the correct specification from the outset, and ensuring high reliability, as discussed in section 4.3. It is worth noting that the machines could be dealt with in a similar fashion to regular vending machines, for example under a facilities management contract.
These pilots were the first of their kind in Scotland. Subsequent site specific schemes of this kind would perhaps be less resource-intensive for sites, particularly if they followed an established model.
Machine reliability and rejection rates
4.3.1 Machine reliability and user difficulties The data for the University of Dundee and Glasgow Caledonian University are given to illustrate the possible scale of the difficulties encountered: • full or broken machines that were out of operation (20% of those surveyed at both universities); • materials rejected (7% of those surveyed at both universities); and • no vouchers issued (2% of those surveyed at the University of Dundee; 10% at Glasgow
Caledonian University).
Note that these figures relate to people experiencing a problem at any point, rather than the number of transactions affected. The actual downtime experienced is detailed below.
At Heriot-Watt University, just over one third of those surveyed reported encountering similar problems. At the University of Dundee and Glasgow Caledonian University, these responses do tie in with periods of downtime, but this is less true of Heriot-Watt University, where average downtime was low. We do not know to what extent material rejection problems were down to user error in presenting the wrong materials rather than machine faults per se.
These various difficulties may have presented a significant barrier to continued or frequent use for some, and were seen as contrary to encouraging habit-forming recycling behaviour. While these issues were clearly very real for some, machine reliability was reported as being very good by the large majority of users.

Downtime data were not available for the machines at all sites. However, at Heriot-Watt University, overall downtime was just 3.4%, although there was one week in July when a machine was out of use for 11% of the time. This was investigated immediately and was because staff members at the university were unavailable to empty the machine, because of holiday leave. Improved communication measures were put in place and this problem did not recur.
At Glasgow Caledonian University, the machines had some downtime (the length of this was not recorded). This was in part because one site was closed for refurbishment over an eight-week period during the summer, and use was low during student exams for a further six-week period. Staff at the university have reported that they found the machines to be generally reliable.
The machines at the University of Dundee had some reliability issues that was frustrating for users and site staff alike. The equipment manufacturer investigated the poor performance of the equipment in early August, and prepared a report, which led to some elements of the machines’ technical set up being changed. Following the investigation, performance improved.
At Whitmuir, the machine indicated that the downtime was almost nil, 0.0% to 0.1% for most weeks, although the staff perception was that the machine reliability was poor. This was in part down to problems with the printed bar codes, but perceived reliability does matter, both to site managers and users. At HebCelt, one of the four pilot machines did not work on delivery and could not be fixed during the three days of the festival, although the other machines were generally very reliable.
One aspect of downtime is the need to empty the storage bins once they become full. While many of the machines compact materials by shredding and crushing, there is still a need to make bin switchover quick and easy to reduce downtime. Some machines can also send a telemetry message when they are full or need maintenance, another feature that can reduce downtime and user frustration. At Glasgow Caledonian University, there was also a power failure across the university campus in mid-June, during the summer vacation, meaning that the Recycle and Reward machines were temporarily unavailable. This was beyond the control of the pilot project.
4.3.2 Material rejects Poor perceived machine recognition of materials was a common theme in the pilots, although it is worth noting that this was often a case of user error, or the failure of site staff to empty the machine, rather than a machine fault per se. Most machines were programmed to accept only the particular target containers sold on site, for example a variety of PET beverage containers rather than high-density polyethylene (HDPE) milk containers. This was done by a combination of some or all of the following criteria: weight, size, shape and bar code. This is one of the potential key benefits of using the machines, as the waste that is collected is carefully controlled and should contain very little contamination, as noted in section 3.1.8.
At Heriot-Watt University, 20% of machine users claimed that the machines would not accept some items that they were trying to recycle (again, this relates to an experience at any time, rather than telling us about the proportion of transactions affected). At the University of Dundee, 27% of users experienced some problems when attempting to use the machines. At the University of Dundee and Heriot-Watt University some students had tried the machines and felt embarrassed when they did not work. At several sites, users noted, and observations confirmed, that it often took several attempts to get the machines to accept an item, despite it being of the correct type and properly bar-coded etc.
Excluding containers not sold on site inevitably leads to some container rejection – and potential user frustration – particularly at the more ‘porous’ sites, where beverages are often bought off site. At some sites, e.g. Heriot-Watt University and Glasgow Caledonian University, all containers were allowed regardless of origin, as a way to address this; however, only those sold on site were eligible for a deposit refund or reward, which in turn caused some confusion. The machine operator at Heriot-Watt

42 |Recycle and Reward Pilot Projects
University was given any rejected container bar codes from targeted containers to add to the database, allowing continual update, e.g. for seasonal and rebranded lines. At HebCelt, the rejection problem was exacerbated by traders (illegally) reselling from multipacks which did not have a bar code on individual bottles and cans.
It should also be noted that rejecting non-target materials runs the risk that the other recyclables are not recycled at all. It takes a good degree of motivation to take a rejected item and find another recycling bin to put it in, although some people were observed doing this at some sites. This is partly down to consumer awareness, which will increase with familiarity and particularly if a wider scheme is adopted across Scotland. Equally, conventional recycling facilities for non-target materials can be placed near or at the machines.
In terms of the machines themselves, a balance has to be achieved that minimises both the rejection of containers and the commingling of different materials (e.g. plastic polymers) in the machine collection bins. The latter can defeat one of the key benefits of reverse vending in that mixed materials still need sorting and so have to be passed through an MRF of some kind to maximise recycling rates. That said, even a mixed stream from a Recycle and Reward machine should be cleaner, with fewer non-recyclables, than that from a regular commingled recycling stream, and in practice the materials collected in all the pilots were of high quality.
Communications and promotion From the start of the project, communications were identified as a critical factor for success. Each of the sites was introducing not only a new way of recycling, but a system that was likely to be completely novel for the majority of users. To the extent that the reward was going to motivate behaviour (rather than other motivations), awareness of what it was in each scheme was also key. As the schemes and contexts were unique, so too were some of the communications requirements. However, all schemes were presented under the common Recycle and Reward brand.
Communications around the Recycle and Reward brand were developed using an integrated approach with key messaging around incentivised recycling systems. This was used for both fully refundable deposit and non-deposit reward schemes. Although all written communication materials used for the deposit-return pilot projects clearly identified that a deposit had been applied to the drinks containers included in the project, this was not well understood by the users of these systems when the subject was discussed in focus groups. Further research around the key messages and media required to promote deposit-return systems, and the extent to which users need to understand the mechanics of the system for it to alter behaviour, would be beneficial for future initiatives based on deposits, including any wider scheme.
The site-specific nature of each scheme meant that developing appropriate communications was very resource-intensive; factors ranging from the nature of the rewards to the instructions for using the machine had to be tailored in each case. Some sites also had their own branding requirements. More standardised pilots would have reduced the resource requirement around the communications, but it would also have required a smaller variety of ideas being tried. In a wider scheme, this challenge would not exist; and it seems likely that communications might be broader (less centred on the locations of machines) but also less intense (with less effort put in by host sites themselves). This would significantly change the resource requirements for communications, and would be very likely to require much less of the host site.
It seems reasonable to suggest that the localised nature of the communications may also affect user awareness. Users are exposed to the communications only through on site channels, but may be spending very little of their time at the site in some cases. As an example, university students may visit the same locations every day during term time, whereas customers at the IKEA sites are likely to be less frequent visitors. At the educational institutions, however, the new academic year posed its own

challenge, with new students needing to be informed of the schemes (and, perhaps, returning students reminded). Media channels such as TV or radio are clearly inappropriate for pilots of this nature, but this can mean that high levels of awareness are harder to achieve than in some other recycling campaigns.
The unique nature of the pilots also means it is hard to compare the success of different communication strategies; the communications are just one of many variables. Nonetheless, there is some evidence that intensive bursts of communication employed during the pilot projects had a positive effect on engagement and subsequent use, whether this was using refresher materials or promoting new materials. For example, additional communications used at IKEA Edinburgh, following the introduction of sustainable products as rewards for recycling, led to increased engagement and participation immediately after implementation. Similarly, at the universities and schools, intensified communications introduced around the start of the new term led to more containers being recycled (although this was not always reflected as a proportion of the overall sales of containers on sites).
There is also some evidence that face-to-face communications and demonstrations of the Recycle and Reward equipment were particularly effective to encourage use of the schemes. This was particularly evident at the HebCelt festival, where high levels of participation and container recycling were observed, and volunteers were available throughout the festival. Similarly, increased container recycling was observed at schools, following in-situ demonstrations. Although they were resource-intensive, face-to-face communications were very effective at removing barriers to use the Recycle and Reward machines, particularly when the equipment was unfamiliar to the user.
In most recycling schemes the user is unaware if they have made a mistake. If communications are misunderstood or unclear, the user may continue ‘recycling’ an incorrect item indefinitely, and be none the wiser. In an incentivised scheme, whether with manual or mechanical handling, the user is likely to be made immediately aware of their mistake, as the item is likely to be rejected. As this can lead to user frustration, and perhaps put them off future recycling, especially if the reason for rejection is not clear to them, the challenge of accurately communicating what can and cannot be recycled could be considered more critical than with other schemes. However, it should be remembered that user confusion in other schemes can cause contamination problems and ‘rejects’ elsewhere in the reprocessing chain. Although the user is not directly affected, clear communications are arguably just as important in those cases too.
While the aim of the various pilot communications was awareness raising rather than recollection of the communication methods themselves, with various channels designed to be mutually supportive, it is interesting to note the most common means by which people said that they became aware of the machines. These were: • seeing the branded machines; • being told about the machine (word of mouth); and • posters.
Other means of communication were less effective, according to survey responses. It is interesting to note that, even at the Ayrshire schools, person-to-person communications (of various kinds) dominated all other means of communications in terms of effectiveness. Electronic communications such as email, websites and social media appear to have made very little impact.
The survey and focus group work indicated a number of potential communication improvements that would help users to recycle using the machines: • clearer use instructions as part of the machine branding; • clearer information on the rewards and wider benefits; • greater transparency about how deposit return systems operate (where they are used); • clearer information in terms of what materials are accepted and the reasons why some materials
are not accepted (although this of course applies to some degree to any recycling scheme);

44 |Recycle and Reward Pilot Projects
• better staff training on how to use the schemes and explain the benefits of them more clearly to potential users; and
• better alignment with existing brands, including corporate branding; this was a potential issue at IKEA, where the Recycle and Reward pilot was competing with a wide range of IKEA-branded advertising.
Throughout the pilot periods, communications were updated where specific issues came to light in site contexts.
Generally, the project monitoring team felt that the communications material could have provided more instructional information and clearer information around the rewards on offer and the benefits of using the Recycle and Reward scheme.
The effectiveness of incentives
4.5.1 The reward as a motivator Recycle and Reward incentivised recycling schemes varied in the type of reward offered. They included money-off vouchers against future purchases (3p–10p per container); donations to charity (10p per container); cinema and swimming tickets (4p per container); compost (4p per container); money-off vouchers against green product purchases; and a chance to win a prize in a lottery (e.g. a T-shirt or iPad at HebCelt and a Golden Ticket for a meal at Glasgow Caledonian University).
With the exception of the schools and HebCelt, most people reported that the reward was insufficient in itself to make people go out of their way to recycle. It was a welcome bonus for recycling rather than a primary motivator. That said, some people, depending on their personal circumstances and attitudes, may be more motivated than others to take advantage of the price reduction offered by the vouchers. However, it was interesting that, in focus groups (all of students) at Heriot-Watt, the extent to which people noticed paying the deposit, or cared about redeeming it, was variable. Cash-consciousness may not be simply linked to actual disposable income.
Most of the money-off rewards were significant as a percentage of the original product price, but small in absolute terms (e.g. 5p or 10p for an empty container). The machine vouchers also had to be spent in a particular place, which also reduced their usability and hence the desirability of the reward. Convenience (both of the machines and of the reward) is certainly an important factor and is discussed further in section 4.7.
Some students and school children collected containers for bulk deposit, indicating a good degree of motivation. The extent to which staff (mainly catering, cleaning and maintenance staff) used the schemes, bulking items collected around the campus to place in the machines, is not known, although this was both observed and indicated by the machine transaction data at some locations.
The size of the reward did seem to be important in a number of pilots. The Golden Ticket (for free meals) at Glasgow Caledonian University, for example, had a significantly higher redemption rate (68%) than the regular 5p reward (51%). While none of the students (users and non-users) in the focus groups were aware that they could win a ‘Golden Ticket’ for free meals on campus, the idea was very enthusiastically received by all respondents, so much so that non-users claimed they might now be inclined to seek out the Recycle and Reward machines. This does suggest that the chance of a prize, rather than a (smaller) guaranteed payout, may be an effective motivator in some circumstances.
The study also indicated that better rewards at IKEA Edinburgh (halfway through the pilot, a change was made, allowing vouchers to be used to buy green products) also helped to increase participation, although admittedly from a low base.

At the University of Dundee, the higher reward for cans (5p) than for plastic bottles (3p) may have had an impact on machine returns. In the two campus shops and the art college café, run by Dundee University Students’ Association, bottles outsold cans by 1.8 to 1. However, for every bottle deposited, 1.5 cans were deposited (in spite of there being one more machine accepting bottles) and, for every bottle reward redeemed, 2.9 can rewards were claimed. Another factor, however, is the number of cans versus plastic bottles brought on site. The estimated data for the other recycling facilities suggests that more cans than bottles were disposed of on site, although the data are incomplete.
The size of the reward at HebCelt, with a wide range of very substantial prizes on offer, certainly seemed to have a strong impact on the enthusiasm for taking part, and was almost certainly a factor in the success of the pilot (i.e. high overall capture and recycling rates and extremely high voucher redemption rates.)
The ability to donate to a charity also seems to have been popular and a good alternative motivator to a financial or prize reward for some users. While survey and focus group work at IKEA and Heriot-Watt University showed that a majority were in favour of the charity option, only 4.9% of the transaction rewards at Heriot-Watt University were donated after its introduction. It is also worth noting that donating to charity at the machine is perhaps more convenient, avoiding the need to keep and redeem a paper voucher at a retail outlet.
Generally, the data on rewards and motivation are hard to interpret, as the scheme contexts were quite varied. In particular, people’s sensitivity to different levels of reward might benefit from further exploration.
4.5.2 Deposit return versus reward only Deposit return was used at Heriot-Watt University, which had by far the highest use rate of any of the universities and also a high user satisfaction score. It was recognised in the University of Dundee focus group discussions that deposit return systems would have some power to motivate recycling. Respondents at University of Dundee were quick to report, however, that they would be inclined to buy drinks off site to avoid paying the deposit if this were introduced only on the campus, and that the city-centre geographical location of the university made this easy. They concluded that this sort of deposit return scheme would work well only where all accessible retailers participated. There was more support for incentivised recycling than for a deposit return system in this location.
Similar views were expressed at Glasgow Caledonian University. Again, it was noted that students might stop buying their drinks at the campus outlets if they knew that they had 5p added to the price. Although these observations are of interest, they need to be treated with caution, as the views expressed by University of Dundee and Glasgow Caledonian University users are speculative, since they have no real experience of deposit return systems.
At the HebCelt festival, the incentivised recycling approach was very effective at encouraging recycling. It should be noted, however, that simple cash-based deposit return, with manual or automated return of drinks containers, also works very effectively at outdoor festivals and events. To give an example, the Latitude festival in Suffolk uses re-usable polypropylene beer mugs and a deposit return system to ensure their return. A similar approach is used at many of the UK’s Christmas markets, including Edinburgh. While this has not been tested in the HebCelt context, it has worked very effectively at other festivals, children again playing a large part in collecting the plastic mugs and keeping litter to a minimum. Given washing facilities behind the bar, this allows continuous re-use, and even re-use from one year to the next. While it also requires investment in the long-life cups and mugs, this may warrant further examination and testing in a festival context.

46 |Recycle and Reward Pilot Projects
Competing recycling facilities At many of the pilot sites, the machines were in addition to existing recycling facilities rather than a replacement. This in effect meant that many of the pilots were testing the ability of the machines to attract both new recyclers (those who would normally litter or place containers in general waste bins) and existing recyclers (who already used other recycling facilities on site).
At the University of Dundee for example, before the machines were introduced, the repeat users of the machines claimed to have disposed of their plastic bottles in the following ways: • put their bottles in a residual waste bin on campus (36%); • recycled their bottles elsewhere (45%); and • re-used them by refilling them (18%).
Repeat users claimed to have disposed of their cans in the following ways: • put their cans in a residual waste bin on campus (47%); and • recycled their cans elsewhere (47%).
Although it is not explored in the fieldwork for this study, it may be the case that where committed recyclers are already in the habit of recycling they are perhaps more likely to continue to recycle in the existing facilities that they normally use than switch to a new method, particularly when that new method is (a) selective in terms of the containers allowed and (b) potentially perceived as unreliable. This might benefit from further exploration.
It is worth observing that the lack of competing recycling facilities on site at HebCelt may have been a factor in the success of the machines at the festival. This may also have been a factor in the success of the pilots at the school sites, where other recycling facilities were absent or incomplete (e.g. only in one building at Marr College).
The impact of machine location and convenience Machine location and convenience were seen to be critical in a number of ways. In terms of convenience, many of those surveyed at various sites noted that recycling drinks containers, even with a small incentive, was not something that they would go out of their way to do. This may be different for school children, as indicated by the high rate of use at the Ayrshire schools and by children at the HebCelt festival. Even at HebCelt, the queues that sometimes formed at the machines were reported as being a barrier to some non-users. Queues were not reported as being a significant barrier to use at any other sites (but these also typically saw less intensive use).
At the University of Dundee and at Heriot-Watt University, the location of some of the machines was identified as inconvenient or sub-optimal by a number of respondents to the survey and in focus group work. At Heriot-Watt University, the machines at the Hugh Nisbet Building were far more heavily used than those at either the Student Union or the sports centre. The Hugh Nisbet Building is the largest on campus, housing the majority of shops, food services and social areas, and it is the area where most beverages are likely to be consumed.
The implication of the responses to the social surveys and some of the use data is that the machines have to be placed not just where there is good footfall or where drinks are purchased, but where people are most likely to consume drinks and/or have a need to dispose of the containers. It also seems important that the machines stand out rather than getting mixed in with a wide range of other waste and recycling facilities.
At a university, for example, the machines would perhaps be best placed next to seating and grassed areas, where people may have their lunch, and at student residences, where multiple containers, collected at home, can be conveniently returned. A suggestion during several of the focus groups, at

several sites, was for the machines to be widely spread but all at major crossing points and thoroughfares.
It should also be noted that, where a charity donation is not being made, vouchers have to be redeemed and this could be done at only one or two places in each pilot context. Machine proximity to this redemption point is therefore helpful in allowing quick redemption before the voucher is lost or forgotten.
It is worth noting that the machines are more constrained in terms of possible locations than regular recycling bins, since there is a need for a power source (three-phase in some cases), with wifi or internet connection if data telemetry is required (potentially for maintenance, not just pilot purposes), and a need to protect the unit from exposure to the elements. Once installed, they are more complicated to move. As a result, very careful consideration should be given to the best locations, and the machine specification to match.
The IKEA sites are interesting in that most people go to IKEA only occasionally and hence are unlikely to return beverage containers bought on site but consumed at home. Having the machine in the café area maximises the chance to capture cans and bottles that are consumed on site. Placing the machine at the exit/entrance area, as in Glasgow, makes this more difficult in that people who have used the café are unlikely to be prepared to carry the empty containers down to the machine.
Closing the gap between user expectations and convenience, on the one hand, and practical aspects of machine location, on the other, may not be straightforward, but has certainly been highlighted as an issue to be aware of in future schemes. At the same time, it is very possible that similar levels of pre-planning would also improve performance of conventional recycling schemes, so it is not clear that many of these requirements are in fact unique to Recycle and Reward approaches.
Legacy: potential improvements and scheme extensions A large majority of those surveyed wanted to see the Recycle and Reward approach continue (Table 10), even where machine use had been at a low level (e.g. IKEA). One exception was the pupils at North Ayrshire schools, who were less enthusiastic about the scheme continuing, despite quite high machine use rates (up to 47% of pupils at one school). Although it was more popular than in North Ayrshire, only 63% were keen to see it continue at Marr College in South Ayrshire, despite this being one of the best-used schemes. Only at Whitmuir, however, was there a clear and strong consensus (staff and most of the few customers who provided feedback) against the continuation of the Recycle and Reward scheme in its present form. Following the pilot Whitmuir explored the option of continuing to use their machine as a reward only system, which also accepted containers originating off site, but have now removed the machine entirely. Whitmuir had extensive recycling provision prior to the pilot, and continues to do so.
Pilot Sample size
% that said they would like to see the scheme continue (of total surveyed)
% that would like to see it elsewhere in Scotland (of total surveyed)
GCU 250 92 85
HWU 500 86 85
UoD 255 93 88

48 |Recycle and Reward Pilot Projects
Troon 35 77 89
Marr 49 63 Not asked
NAC 184 38 Not asked
IKEA Edinburgh
33 94 52
IKEA Glasgow
46 91 57
Whitmuir 10 * 2 people
Not asked
HebCelt 112 100 99 (nb: question was
relating to “other festivals”)
Table 10 Support for further use of Recycle and Reward machines
A large majority also wanted to see the machines used more widely across Scotland. Some suggested appropriate locations, the most popular suggestions being town centres, supermarkets and shopping centres; bus and railway stations, schools and universities were suggested less often.
As noted earlier, the use of paper vouchers presents a difficulty for some, in that the vouchers are easy to lose or misplace. A number of respondents suggested that reward/loyalty cards could be used (as at least one UK supermarket has done). At universities it was suggested that student matriculation cards could be used as loyalty cards.
This reward card idea was considered an improvement by both users and non-users in that it removed the waste paper as well as alleviating any concerns about losing the vouchers; it also seemed more modern and contemporary. Many people also responded positively to the concept of donating the reward to charity, indicating that it could be worth more to others than to them and that there would be an additional feel-good factor in donating.
It was also suggested that rewards could be reclaimed in a wider range of outlets, e.g. more shops, and for services such as printing and photocopying at a university. Clearly, having schemes that operate across larger areas of Scotland would: • increase awareness of the use and benefits of incentivised recycling; and • allow a wider range of convenient redemption options.
It is worth reflecting that the value of the reward to users may relate as much to the convenience of keeping and claiming the reward as to its financial value.
5 Conclusions and observations While the data for individual pilot projects are imperfect and incomplete in some cases, the overall body of research gives a good indication of the outcomes from the pilots and the factors affecting performance. The key points are summarised below.
Public acceptability The vast majority of schemes were popular and well received by the public, students and site staff.
A small number of people questioned the need for a seemingly complex recycling solution.
There was strong support from the public for the machines to remain at almost all sites and to become more widespread across Scotland.
As of April 2015, six sites were confirmed to still be running schemes. Choices to continue or discontinue a scheme at a pilot site have typically been for operational reasons not customer reactions.
Machine use and recycling behaviour The schemes at the universities, the Ayrshire schools and the HebCelt festival were well used in terms of absolute container numbers.
At some sites, such as Glasgow Caledonian University and the University of Dundee, practical implementation issues (such as the location of half of the machines in an area being refurbished at Glasgow Caledonian University) reduced the effectiveness of the pilots.
The least well used schemes were at IKEA, where awareness was also very low, and Whitmuir. Possible reasons for this are discussed in greater detail in the case reports.
There is some evidence to suggest that the machines had a positive impact on recycling behaviour, with a net increase in recycling at some sites; however, the data quality does not allow robust conclusions in several cases.
Generally users returned one or two items at a time to the machines, in passing, rather than making a special journey.
Another pattern, seen less frequently, was users depositing larger numbers of items in one transaction. This seemed to be students/pupils who had collected items at home or staff on site (catering or cleaning staff etc.) who were effectively recycling on behalf of others.
At most sites, there were significant flows of containers on or off site. Typically this appears to be where people transport products, rather than simply packaging for disposal.
Material quality Material quality was very high at all sites, with virtually no contamination from non-target materials. The only reported issue here was at the HebCelt festival, where some cross-contamination occurred when bar code restrictions were relaxed to try and reduce rejection rates of multipack containers (which lacked bar codes). It is possible to change machine set up to manage this better.

50 |Recycle and Reward Pilot Projects
In theory this better material quality could lead to a revenue stream rather than a disposal cost given sufficient scale on a site (i.e. all recycling by this route rather than just some recycling). This results, in part, from avoiding the need for a materials recycling facility to sort the waste. However, realising the value of higher-quality material may require changes to storage and collection arrangements on site, and this may not be straightforward in all contexts.
It should be noted that a balance has to be struck between maximising material quality and minimising the rejection rate. The latter results in material being potentially lost from the recyclables stream if other recycling containers are not present nearby, as well as a potentially poorer use rexperience.
Impact on litter The impact on litter was seen as a small benefit by most users (but was identified, unprompted, at all sites, even those where the logic of the site would suggest a litter impact might not be expected).
There was some evidence that the schemes had reduced litter at the university sites, though other factors may have contributed, and further work would be needed to understand variations in littering.
In some cases the machines may have reduced the burden on site staff in terms of litter picking. The primary example of this was the HebCelt festival, where it was felt litter-picking requirements were significantly reduced compared with previous years.
Effect on footfall and retail sales None of the pilots noted any noticeable effect on footfall or retail sales (either positive or negative) as a consequence of the pilots.
In schemes that are well used, and where the reward is a significant driver, it may well be that (all else being equal) purchasing behaviour tends to favour the outlets that are linked to the reward. There was no clear evidence to support this, however.
There are some concerns around deposit and return where this is applied at only the one site. Adding 10p to a beverage at a university campus shop, for example, might make this shop less competitive than local shops, driving trade away. There was, however, no evidence that this had occurred in the two schemes piloting deposit return. This effect would be minimised where non-deposit alternative items were not available locally.
Awareness and understanding Awareness and understanding of the schemes varied greatly. Awareness seemed to vary depending on whether the population was ‘captive’ (e.g. at a school) or transient (e.g. IKEA).
At some sites, where awareness levels were high, there was often a large gap between awareness and use rates, caused by a number of factors. Some were behavioural (such as people not purchasing the targeted items, or consuming them away from the site), while others related to understanding and a lack of familiarity with the scheme.
Other barriers to use and voucher redemption Machine downtime was generally very low in reality, but machines were perceived as unreliable for other reasons - including user error in presenting items that were not accepted.
Containers were rejected (again, often because of user misunderstanding) or needed to be inserted repeatedly (mainly at one site and because of poor bar code quality on the containers).
Some machine locations were sub-optimal, i.e. too ‘hidden’ or not near where people wanted to dispose of empty containers.
Some people lost paper vouchers before they could be ‘spent’ – there was support from users for a better method to store and claim rewards.
Motivation and rewards The primary stated motivations across schemes were the desires to recycle and to try out the machines.
The reward was seen as a bonus rather than a primary motivator at most sites, although at the schools and HebCelt the reward seemed to be a stronger driver than recycling and environmental benefit.
Generally the rewards were popular, regardless of their type or value; however, the size and type of reward do appear to have an impact on use and redemption rates, a larger reward seemingly motivating greater redemption rates. The general view that rewards were ‘appropriate’ despite their diversity may also reflect the fact that most respondents will have had little experience for comparison.
The scheme performance at Heriot-Watt appears higher than at the other university sites, which might suggest that the deposit was a stronger motivator than receiving a reward alone. However, it is worth bearing in mind the differing scheme design and location context before reaching such a conclusion. It is also noticeable that a significant proportion of users surveyed at Heriot-Watt University did not even realise they had paid a deposit; thus the system may anyway not be seen differently from a reward-based incentive in some cases.
An option to donate to charity was popular and avoided the need to keep and redeem a paper voucher, so it was also a convenience driver. However, charity donations were a small share of overall transactions.
Communications The submitted communications plans were detailed, but there was variation in how they were implemented across the projects. This may have caused some of the variation in awareness.
The timing of communication is important; for example it needs to be repeated at the start of every school or university year, when new students arrive.
There is some evidence that higher levels of communication did result in higher awareness and use rates.
Where people visit a site irregularly, for instance a store such as IKEA, communications need to ongoing to ensure awareness.
Potential improvements to future communications would include: • clearer use instructions as part of the machine branding; • clearer information on the rewards and wider benefits; • greater transparency about how deposit return systems operate (where they are used); • clearer information about what materials are accepted and why some materials are not accepted;

52 |Recycle and Reward Pilot Projects
• better staff training on how to use the schemes and how to explain the benefits more clearly to potential users; and
• better alignment with existing brands, including corporate branding; this was a potential issue at IKEA, where the Recycle and Reward branding was placed alongside IKEA advertising.
Greater communication around the principle of the deposit-return system would be beneficial to the public. Some people thought they were getting a reward and did not understand they were getting their deposit back.
Resourcing and costs Staff time and resources required to implement and run the pilots were higher than initially expected especially for: • machine setup; • data collation and reporting; • stock bar-coding/labelling for deposit-return schemes.
The time required to implement communication plans as well as to carry out ongoing promotion of the schemes also needs to be incorporated into future communication planning.
Zero Waste Scotland and the machine providers gave significant site support. This reflects both the fact that these were pilots, but also that they were unique, site-specific schemes. More standardised approaches and greater experience of running such schemes in Scotland would reduce the requirement for such detailed site support in future
Many of the resourcing requirements noted above applied only to the pilot projects. Regular operational resourcing requirements were quite low in most cases. Zero Waste Scotland is undertaking additional analysis of the range of costs for the schemes.
Machine reliability and specification Most machines were very reliable, although some models, and servicing arrangements were less reliable than others, with considerable downtime at a small number of sites.
Material rejection was a significant problem in some cases. Reasons for this varied. In some cases, machines were specified to accept a very narrow range of containers (e.g. only those sold on site); in others, they proved temperamental (e.g. not recognising bar codes of legitimate containers, though this was sometimes a problem with container labelling rather than machines). Finally, the machines did of course consistently reject incompatible items. Whether they are rejected rightly or wrongly, this can cause a problem for users, especially if they do not understand the reason.
It is important to ensure that machines are of the correct specification, are very reliable, and accept the required materials from the outset, to prevent users from being put off after an initial try.
Machine location and convenience Convenience, and hence machine location, was identified in the social research as very important.
Location needs to be based on a balance of key criteria. Machines should ideally be placed, not just where there is good footfall or where drinks are purchased, but where people are most likely to consume drinks and/or need to dispose of the containers.
It is worth noting that the machines are more constrained in possible locations than regular recycling bins, since there is a need for a power source (three-phase in some cases), with wifi or internet

connection if data telemetry is required (potentially for maintenance, not just pilot purposes), and the need to protect the unit from exposure to the elements.
Practical health and safety issues are also clearly very important.
At universities, the machines ideally need to be well spread and placed: • near to areas where people may consume beverages (e.g. have their lunch); • at major crossing points and thoroughfares.
This may be difficult in practical terms because power supply requirements and the need for the machines to be covered, which may add to the cost.
It also seems important that the machines stand out rather than being hidden among a wide range of other waste and recycling facilities.
Where vouchers are used, it is helpful if the machine is close to the redemption point so the voucher can be redeemed quickly before it is lost or forgotten.
Competing with other recycling facilities At many of the pilot sites, the machines were an addition to existing recycling facilities rather than a replacement.
Where committed recyclers are in the habit of recycling they are perhaps more likely to continue to recycle in the existing facilities that they normally use than switch to a new method, particularly when that new method is (a) selective in terms of the containers allowed and (b) potentially unreliable.
Recycle and Reward approaches should really be considered in contrast to other on site recycling solutions – which also require careful planning, sound communication, and significant set up and servicing resource to maximise effectiveness.
Legacy: future developments and expansion At the vast majority of sites, users and staff wanted the machines to remain in long-term use at the completion of the formal pilot period. Subsequent follow up by Zero Waste Scotland shows that as of April 2015, six sites were confirmed to still be running schemes. Three sites had discontinued their scheme. One site (Hebcelt) had been a one-off in any case – replicating this annually would require the availability of machines on a business model suitable for a short-term festival, which is not currently the case. The status of two further sites was pending confirmation at the time of writing. Choices to continue or discontinue a scheme at a pilot site have typically been for operational reasons.
Affordability of the schemes will be a primary consideration in terms of continued use. Machine leasing costs and the potential benefits of revenue from higher-quality materials need further consideration in this regard.
There was wide support for the expansion of the Recycle and Reward approach across Scotland, both the range of materials accepted and where items can be purchased and returned. The most commonly suggested locations from the public included town centres, supermarkets and shopping centres. Bus and train stations, universities and schools were also suggested.
In terms of materials accepted, a balance has to be achieved that minimises the rejection of containers but does not lead to too much commingling of different materials.

54 |Recycle and Reward Pilot Projects
Consideration should be given to replacing paper vouchers with a reward/loyalty card (such as a student card or Nectar card) redeemable at a variety of outlets against a variety of products across a wider area (e.g. regionally or nationally). Further work is required to look at the operation, management and costs associated with this approach.

6 Glossary of terms • Capture rate: the proportion of targeted containers that are recycled through the system.
• Collection: the return of containers to the reverse vending machine.
• Deposit: the 10p charge placed on an in-scheme container.
• In-scheme: a container that was sold within the university with a deposit charged.
• Non-user: person who has not used the Recycle and Reward scheme, or has used it but does not intend to again.
• PET: polyethylene terephthalate.
• Reverse vending: accepting an item for recycling in a machine that issues a reward or other incentive.
• Shelf talker: card or sign attached to a shelf to highlight a product or promotion.
• Transaction: a visit to the reverse vending machine by a user placing one or more collected containers in the machine.
• Units/containers: the aluminium cans, PET plastic bottles or cups.
• User: person who has used the Recycle and Reward scheme more than once.

56 |Recycle and Reward Pilot Projects
Appendix: monitoring methodology The monitoring and evaluation work for the pilots was led by SKM Enviros (SKM), working in partnership with Nicki Souter Associates (NSA). At the educational sites, Zero Waste Scotland undertook additional data collection outside the trial period, so a complete dataset could be be obtained for the autumn term in 2013. This data was analysed by Zero Waste Scotland, with updates made to the case study reports, and the current overview report, where appropriate. In April 2015 all sites were re-contacted by Zero Waste Scotland to check the current status of their projects. No analysis was undertaken at this point, though in some cases additional site data is available, and may be further analysed in future.
The range and number of data collected varied somewhat by site, reflecting constraints on what sites knew, and the cost-effectiveness of obtaining certain types of data in some contexts. As the pilots progressed, the balance of monitoring was adapted to concentrate on those sites which would be most likely to provide useful learning. This particularly affected strand B, where it was felt that, firstly, concentrating some resources on key sites could help offset some of the limitations on the strand A data and, secondly, some sites were experiencing relatively low footfall and would be far less cost-effective to target in data collection terms.
Data collected and methods employed included the following. Some differences between sites are highlighted here, whilst the approach for specific sites is in tabular form below.
Strand A Baseline retail sales data for the site – some sites had only annual data, others monthly and some only partial data. In one case (HebCelt) there were no historic data, and in another (Troon HWRC) no sales data were collected either before or during the trial, as the target area was too broad.
Pilot period retail data – all sites but Troon HWRC provided these data. Typically data were either weekly or monthly depending on the sales systems and number of outlets that were relevant to the site.
Baseline waste management data for the site – some sites had monthly data and one site (Dundee) sought to estimate weekly information. However, several sites had no baseline data. All sites struggled to provide detailed waste information (e.g. the composition of drinks containers by stream, or weights rather than volume-based estimates).
These are common challenges in trials of this type, and could be comprehensively tackled only by a year-long resource intensive pre-pilot monitoring period. In an attempt to improve understanding, in two cases (Heriot-Watt and the North Ayrshire schools) waste compositional analysis was undertaken before and during the trial. Site visits in all cases where it was appropriate also included visual estimates of container fill rates and contamination, and discussion with site staff to understand collection frequency, but, while this improved our understanding of material flows, it was insufficiently sensitive in itself to highlight change over the trial period.
Waste management data during the pilot period was available for all sites, but granularity and quality varied. Most sites knew their overall waste arisings and some knew recyclates within that. In two cases (as noted above) compositional analysis was undertaken to try to understand residual composition. Sites provided data from a mix of volume-based measures, weight information, and site and waste contractor information.
Returns data from the recycle and reward machine(s) and/or manual data during the trial period were collected. Where both were available they were sense-checked against each other. Typically the

manual data were preferred in those cases where there was a contradiction (for example, switching the power on and off was found to have led to the machine resetting the count at one site).
Machines recorded transaction data in different levels of detail (daily, weekly or by individual transaction). Most machines recorded data by container type; in one case the machine collected mixed plastics and cans in a single receptacle and in this case the split of material was estimated during site visits.
The level of analysis that these data could be subjected to varied according to the format obtained.
Downtime data during the pilot period – some machines also provided telemetry data when they were offline (either for servicing or emptying, or because of a problem), and some sites provided these data. However, it was not always clear at all sites how long machines were down for.
Redemption rates during the trial period – the machines identified how many vouchers were issued (where this differed from the number of containers returned, e.g. where some containers did not attract a reward, or rewards were given to charity). Voucher redemption data were collected from the retail outlets either monthly or weekly. The level of analysis that these data could be subjected to varied according to the format obtained, and how closely they matched the machine data in time periods covered.
Site visits were conducted to understand waste management practice, to help gather baseline data and to build a relationship with the sites to facilitate the overall monitoring. SKM staff originally proposed to visit each site (with the exception of HebCelt, which it was sensible to visit only during the pilot) at least twice (once before the pilot and once during it). However, for some sites the number of visits was increased, where it was felt this would enable the collection of better baseline data, addressing some of the gaps in pre-existing records.
Although not formally part of the monitoring process recorded here, all sites (except HebCelt, though other Zero Waste Scotland staff were present) received multiple visits from the Zero Waste Scotland project manager. Especially during the early trial period, these were often weekly for some of the bigger sites. Zero Waste Scotland staff were also available to troubelshoot problems remotely (by phone and email) and this also means we obtained data on much of the learning around set-up and installation. These visists were therefore invaluable both in delivering the pilots and also in providing insight into how they were functioning on the ground, and what was and was not working well. Visits included an assessment of reliability, and material quality, on several occasions. Zero Waste Scotland also made several other visits to sites to assess communiocations and scheme performance; these included informal ‘mystery shopper’-style use of the machines. NSA also visited all sites where they conducted fieldwork at least once, and provided feedback on how well the scheme was functioning at the time of their visits.
Throughout the pilot period SKM, NSA and Zero Waste Scotland liaised closely on issues encountered.
In some cases, site visits included visual (including photographic) inspection of residual bins, recycling bins or the recyclate collected from the machines. In a few cases, site waste management staff were able to supplement data gathered this way independently of a visit from the monitoring team.
Strand B Focus groups were concentrated on the university sites, which saw relatively high levels of use, and an audience that was accessible for this form of research. Despite the variation in scheme design,

58 |Recycle and Reward Pilot Projects
these three institutions are of course broadly similar in function, so it was also felt cross-site comparison would add most value to focus groups conducted in these contexts.
Face-to-face (and online) surveying was concentrated on the university sites and HebCelt, as these saw the highest footfall and were thus most appropriate for an in-situ survey technique. Thanks to patterns of use at these sites, an in-situ technique also has a good chance of reaching a representative set of users, and (albeit to a somewhat lesser extent) relevant non-users (i.e. those who use the public areas targeted, but not the scheme). The samples obtained in these cases do allow for quantitiative analysis.
At Dundee, an online survey to students managed by the university also asked about reactions to the Recycle and Reward scheme, and the results were kindly shared with Zero Waste Scotland. These provide an interesting perspective, as the respondent base and time period differ somewhat from the external monitoring undertaken.
At the Ikea stores and Troon Household Waste Recycling Centre an interviewer was placed on site for a day in each case, but, as expected, relatively few interviews were obtained because of the lower footfall. The responses obtained here provide customer insight, but are too small to be analysed quantitatively.
In the school context it was felt that an online survey was a cost-effective alternative to face-to-face surveying (all students can be contacted in this way, and can be encouraged to participate by staff). Numbers were relatively small, but can be considered quantitatively (with caution).
An online survey was made available at Whitmuir (using its customer database), as it was felt that on site surveying would yield too few users to be worthwhile. Very little feedback was obtained via this route (which is also a somewhat selective sampling method, as not all customers are on the database – though regular customers, which the scheme expected to target primarily, were).
Observations were also concentrated on sites where footfall was highest, but were employed to some extent at all sites except Marr (as Zero Waste Scotland considered the schools in North Ayrshire to provide sufficient insight) and Whitmuir (where machine use was very low). The extent to which the observations can be analysed quantitively is dependent on the number of transactions actually observed in each case.
Insight from formal observations is supplemented by the insight gained during site visits by SKM, NSA and Zero Waste Scotland throughout the trial period, and feedback from site staff (about both what they have observed, and what customers have told them). This provides a useful perspective, in conjunction with other sources, both on changing behaviour over time (in particular the extent to which the observed periods at the universities may have been atypical, as they were near the start of term) and on behaviour outwith the monitoring period (for example, use by cleaning staff at some sites particularly in the early morning).
In-depth interviews were carried out by NSA at a smaller number of sites. These sites were selected by Zero Waste Scotland on the basis that they would provide most additional insight. The interviews targeted a range of site staff including management, cleaning and retail staff. The excluded sites were those where Zero Waste Scotland had had particularly extensive contact throughout the trial period, and it was felt staff insight and reactions were already well understood. Zero Waste Scotland has fed into the reporting process in all cases.

General Although presented as strands A and B in research design, with SKM undertaking the fieldwork and analysis for strand A and NSA doing so for strand B, the final reporting and analysis for all cases, and the overview report, have been led by SKM, working closely with both NSA and Zero Waste Scotland. Throughout the process, the project team across the three organisations met regularly to exchange information and insight, and, particularly in terms of insight into site management and scheme performance, all three organisations gained insight from their respective site visits. The reporting should thus be seen as an integrated report, drawing on both technical data and analysis, and quantitiative and qualitative social research. Key challenges in interpretation and analysis are highlighted in the main report at section 2.4, and where appropriate when presenting specific findings. Table A1 shows the detail of monitoring across sites, including variation.

60 |Recycle and Reward Pilot Projects
Table A1 Breakdown of monitoring activity undertaken at each site
Pilot Project Baseline retail data Baseline waste management dataRVM data manual record RVM data telemetry Retail data Voucher data Waste Management data Machine downtime Site visits Other in depth analysis Focus Groups
Depth interview (days)
Observational analysis (days)
Face-to-face surveys (total number)
Site Specific data limitationsOther supporting information
GCUSupplied approximately weekly
by the General Manager of Catering Services
Supplied as monthly data by the Sustainabil ity Coordinator
Supplied approximately weekly by the General Manager of Catering
Services
Machine supplier provided data
approximately weekly.
Supplied approximately weekly by the General Manager of Catering
Services
Supplied approximately weekly by the General Manager of Catering
Services
Supplied monthly by the Sustainabil ity Coordinator
Limited data from machine supplier
(machine ID but not date/duration)
5
Photographic/ observational bin
audits (6: 5 by SKM staff; 1 by GCU staff)
2 0 3 250
Early weeks recorded as a total value. No machine downtime data provided by GCU. Procurement of
drinks containers based on existing process rather than sensitive to current patterns.
HWU Comparable data not available Annual data available N/A
Machine supplier provided weekly; data available at an hourly
level
Supplied weekly by the Hospitality Services
Manager and Student Union Manager
Supplied weekly by the Hospitality Services
Manager and Student Union Managers; machine supplier
provided weekly data on vouchers issued
Unavailable so waste compositional analyses
undertaken
Machine supplier provided weekly 3
2 waste compositional analyses (prior and
during trial)3 1 2.5 500
The data provided by Hospitality Services of units sold in retail outlets was initially understood to be
PET bottles only as no cans were sold in retail outlets. However it became apparent in the latter stages of the trial that a small quantity of cans is
indeed sold in retail outlets. This has led to an unidentifiable but small number of cans sales being
reported as PET bottle sales
UoD
Provided by DUSA based on actual sales in the two campus
shops during one term-time week, an estimated figure for
weekly term-time vending machine sales and an estimate for expected sales (from shops and vending machines) during
holiday periods.
Estimated weekly data on segregated recyclables provided by
University based on container fullness rather than weight;
estimated annual tonnages of segregated recyclables from
teaching and admin buildings supplied by University waste
manager; also monthly residual data excluding May to July 012
Supplied approximately weekly by the
Environment and Sustainabil ity Officer
Machine supplier provided data
approximately weekly.
Supplied monthly by the Environment and
Sustainabil ity Officer/DUSA Shop and
Vending Manager
Environment and Sustainabil ity Officer provided data on the
total amount invoiced by DUSA (variable
frequency)
Data on for reycling from RotG banks, Halls of Residence supplied
monthly by Dundee City Council; University Waste Manager supplied weekly
data on University residual waste
Supplied approximately weekly by the
Environment and Sustainabil ity Officer;
l imited data from machine supplier
(machine ID but not date/duration)
1 N/A 2 0 3 250
HWRC Troon N/A No data available
Total units data provided weekly by
Council staff; data on bottle:can split only provided as overall
ratio provided at end of trial
N/A N/AMonthly data provided by HWRC staff at end of
trial
Material collected in combination with other
recyclates so no data available
No data 2 N/A 0 1 1 1 day
Marr College Baseline vending sales data
was available from DC7 Ltd but not from the school canteen
No data availableWeekly data provided
by the community policeman
N/A
Weekly data supplied by canteen staff and monthly data for the
vending machine was provided by DC7 Ltd
Data provided by the community policeman and the eco-committee
Only estimated data available No data 2 N/A 0 1 0 50
NAC Schools Monthly data supplied by each
school's canteen staff No data available
Janitor from each school provided a
weekly record excluding summer
holiday period
N/AMonthly data supplied
by each school's canteen staff
Monthly data supplied by each school's
canteen staff
Only estimated data available so waste
compositional analyses undertaken
Janitor from each school provided a weekly record
excluding summer holiday period
32 waste compositional
analyses (prior and during trial)
0 0 1 50 per school
IKEA EdinburghMonthly data for Britvic
vending machine sales only
Very l ittle data available; initial visual inspection/weighing of
recyclables to provide indicative daily data undertaken by SKM staff
but access l imited latterly
N/ADaily data provided by
machine supplier
Approximately four weekly provision of
weekly data for relevant items sold in the restaurant and the Swedish Food Market
by sustainabil ity staff; data for store sales
have been provided for PET and glass bottles
Approximately four weekly provision of
weekly data for voucher redemption figures
provided by sustainabil ity staff
Some data on recyclables for a proportion of the trial
period onlyNo data provided 4
Granular level telemetry data analysis 0 1 2 1 day per store
IKEA GlasgowMonthly data for Britvic
vending machine sales only
Monthly average residual waste data estimated based on volumes
provided by storeN/A
Daily data provided by machine supplier
Approximately four weekly provision of
weekly data for relevant items sold in the restaurant and the Swedish Food Market
by sustainabil ity staff; data for store sales
have been provided for PET and glass bottles
Approximately four weekly provision of
weekly data for voucher redemption figures
provided by sustainabil ity staff
Weekly residual data provided No data provided 1
Granular level telemetry data analysis 0 1 2 1 day per store
Whitmuir 2012 unit sales provided for
same period as pilot
Very l ittle data available; initial visual inspection/estimation by volume of recyclate and residual bins to provide indicative daily
data undertaken by SKM staff; not possible to estimate fullness of
glass banks (opaque)
N/AMachine supplier
provided at a weekly level
Weekly data provided by WO staff every few
weeks
Machine supplier provided data on
issued at a weekly level; weekly data on
total redemptions provided by WO staff
every few weeks
Weekly observations by WO staff of bags in the dry
recyclables storage shed and residual bins where
practicable
Machine supplier provided at a weekly level 1 N/A 0 1 0
Online - no target
Machine downtime data conflicting with staff experience due to issues with the quality of barcode
stickers applied causing difficulty in machine reading
Festival HebCelt None available General waste and organics only for the 2012 festival
N/AMachine supplier
provided at a daily level
Hebcelt (beer cups; via Caroline) and 4 other vendors (bottles and
cans); Based on stock purchased and left at
end
Festival and machine supplier provided data on vouchers issued for
prize winners
Council provided weighbridge data;
supporting waste data gathered by SKM/Hebcelt team during festival via
waste analyses
Manual observations only
Staff on-site the duration
of entire festival
General waste analysis from litter pick /
general waste0 0 2 100
Other informationHard' Performance Data - baseline (pre-pilot)
Universities
Schools
Retail
Strand BHard' Performance Data - during pilot

Recycle and Reward Pilot Projects | 61