report on workshop to incorporate basin response … · report on workshop to incorporate basin...
TRANSCRIPT

Report on Workshop to Incorporate Basin Response in the Design of Tall Buildings in the Puget Sound Region, Washington
By Susan W. Chang, Arthur D. Frankel, and Craig S. Weaver
Open-File Report 2014–1196
U.S. Department of the Interior U.S. Geological Survey

ii
U.S. Department of the Interior SALLY JEWELL, Secretary
U.S. Geological Survey Suzette M. Kimball, Acting Director
U.S. Geological Survey, Reston, Virginia: 2014
For more information on the USGS—the Federal source for science about the Earth, its natural and living resources, natural hazards, and the environment—visit http://www.usgs.gov or call 1–888–ASK–USGS
For an overview of USGS information products, including maps, imagery, and publications, visit http://www.usgs.gov/pubprod
To order this and other USGS information products, visit http://store.usgs.gov
Suggested citation: Chang, S.W., Frankel, A.D., and Weaver, C.S., 2014, Report on Workshop to Incorporate Basin Response in the Design of Tall Buildings in the Puget Sound region, Washington: U.S. Geological Survey, Open-File Report 2014–1196, 28 p. http://dx.doi.org/10.3133/ofr20141196.
Any use of trade, firm, or product names is for descriptive purposes only and does not imply endorsement by the U.S. Government.
Although this information product, for the most part, is in the public domain, it also may contain copyrighted materials as noted in the text. Permission to reproduce copyrighted items must be secured from the copyright owner.
ISSN: 2331-1258 (online)

iii
Contents Introduction .................................................................................................................................................................... 1 Presentations ................................................................................................................................................................. 1
Seismology: Development of 3D Velocity Models and Observations and Modeling of 3D Basin Effects .................... 3 Seattle Area by Art Frankel ..................................................................................................................................... 3 Los Angeles Area by Rob Graves ........................................................................................................................... 7 San Francisco Bay Area by Brad Aagaard ............................................................................................................. 9
Basin Factors in the Next Generation of Attenuation Relations ................................................................................ 11 Campbell–Bozorgnia (2008 and 2013) by Ken Campbell ..................................................................................... 11 Abrahamson and Silva (2008 and 2013) by Norman Abrahamson ....................................................................... 12 Site Response as a Function of VS30 and Basin Depth From NGA West 2 Data Set by Jon Stewart .................... 14
Project Experience–Puget Sound Region ................................................................................................................ 14 1823 Minor Avenue, Seattle, Washington by Walter Silva and King Chin ............................................................. 14 Rufus 2.0, Seattle, Washington by King Chin ....................................................................................................... 16 Recommended Design Response Spectra for 2030 8th Avenue by Doug Lindquist ............................................. 18 Incorporation of Basin Effects in the Design of the Tacoma Narrows Bridge, Alaskan Way Viaduct, and SR 520 Bridge Replacement by Bob Mitchell .................................................................................................................... 20
Project Experience–California .................................................................................................................................. 20 Basin Amplification Design–Ground Motion Case History in Santa Monica by Paul Somerville ........................... 20 Caltrans Incorporation of Basin Amplification for Design Response Spectrum Specification by Tom Shantz ....... 21 Basin Depth Effects for Shallow Soil Sites in the Bay Area by Norman Abrahamson ........................................... 21
Discussion .................................................................................................................................................................... 22 Applicability of NGA Basin Terms to Seattle Basin and Choosing Basin Parameters Z1.0 and Z2.5 ........................... 22 Handling Effects of Seattle Basin for Cascadia Subduction Zone Megathrust and In-Slab Earthquakes ................. 22 Appropriate Lower Limit for the MCE Design Spectrum for High-Rise Buildings in Downtown Seattle ..................... 22 Basin Response Due to Small and Large Magnitude Earthquakes .......................................................................... 23
Recommendations by the Workshop Participants for the Seattle Basin ....................................................................... 23 Acknowledgments ........................................................................................................................................................ 23 References Cited ......................................................................................................................................................... 25 Appendix ...................................................................................................................................................................... 27
Agenda ..................................................................................................................................................................... 27
Figures 1. Plots of design response spectra for peer-reviewed high-rise projects in downtown Seattle compared to Site Class C spectra from ASCE 7-05 and ASCE 7-10 ......................................................................... 2 2. Maps of gravity residuals and sediment thickness showing the Seattle and Everett sedimentary basins . 4 3. Map of depth to S-wave velocities of 2.5 km/s in the Seattle area ............................................................ 5 4. Plot of amplification of spectral accelerations determined for sites within the Seattle Basin relative to a thin soil-and-rock site outside the basin, based on two earthquakes ........................................................ 6 5. Vertical cross section through two 3D velocity models of the Los Angeles sedimentary basin ................. 7 6. Plots showing amplification as a function of period and depth to S-wave velocities of 1.5 km/s derived from earthquake simulations in 3D and 1D models of the Los Angeles Basin .......................................... 8 7. Observed velocity seismograms of the 2010 M 7.2 El Mayor–Cucapah earthquake and synthetics from two different 3D velocity models ............................................................................................................... 9 8. Map of depth to S-wave velocities of 2.5 k/s in the San Francisco Bay Area .......................................... 10

iv
9. Map of ratios of 3-s spectral accelerations between the synthetics from the 3D model versus the prediction of the Boore and Atkinson ground-motion prediction equation ............................................... 10 10. Plot comparing basin amplification factors (2008 model and preliminary 2013 model) ........................... 12 11. Plots of within-event residuals as a function of Z1.0 over Z1.0 reference case .......................................... 13 12. Plot of uniform hazard spectra with and without basin effect .................................................................. 15 13. Plot of recommended design spectrum for 1823 Minor Avenue, compared to ASCE spectrum for site class C .................................................................................................................................................... 16 14. Plot of basin amplification factors computed for Rufus 2.0...................................................................... 17 15. Plot of site-specific spectrum for Rufus 2.0 ............................................................................................. 18 16. Plot of recommended design spectrum for 2030 8th Avenue .................................................................. 19

v
Conversion Factors Inch/Pound to SI
Multiply By To obtain
Area acre 4,047 square meter (m2)
acre 0.4047 hectare (ha)
acre 0.4047 square hectometer (hm2)
acre 0.004047 square kilometer (km2) SI to Inch/Pound
Multiply By To obtain
Length meter (m) 3.281 foot (ft)
kilometer (km) 0.6214 mile (mi)
meter (m) 1.094 yard (yd)

Report on Workshop to Incorporate Basin Response in the Design of Tall Buildings in the Puget Sound Region, Washington
Susan W. Chang1, Arthur D. Frankel2, and Craig S. Weaver2
Introduction On March 4, 2013, the City of Seattle and the U.S. Geological Survey (USGS) convened a
workshop of 25 engineers and seismologists to provide recommendations to the City for the incorporation of amplification of earthquake ground shaking by the Seattle sedimentary basin in the design of tall buildings in Seattle. The workshop was initiated and organized by Susan Chang, a geotechnical engineer with the City of Seattle Department of Planning and Development, along with Art Frankel and Craig Weaver of the USGS. C.B. Crouse of URS Corporation, Seattle made key suggestions for the agenda. The USGS provided travel support for most of the out-of-town participants.
The agenda and invited attendees are given in the appendix. The attendees included geotechnical and structural engineers working in Seattle, engineers with experience utilizing basin response factors in other regions, and seismologists who have studied basin response in a variety of locations. In this report, we summarize the technical presentations and the recommendations from the workshop.
Presentations Susan Chang opened the workshop by explaining that the motivation for the workshop was to
provide specific recommendations to the City of Seattle. She showed the range of design response spectra (fig. 1) for recent high-rise projects in Seattle and pointed out the different amplification factors and methods of analyses to account for basin response. The majority of the high rises built from 2006 to early 2013 have design response spectra ranging from 80 to 100 percent of Site Class C (ASCE 7-05 and ASCE 7-10), with one project designed for values higher than Site Class C (ASCE 7-05). Given this variation in design response spectra, there is a need for more consistent standards for the treatment of basin amplification.
Sedimentary basin amplification is included in three of the Next Generation Attenuation (NGA) West 1 relations published in 2008: Abrahamson and Silva (2008), Chiou and Youngs (2008), and Campbell and Bozorgnia (2008). NGA West 1 was a major effort of the Pacific Earthquake Engineering Research Center to develop improved Ground Motion Prediction Equations (GMPEs) for earthquakes on crustal faults in tectonically active areas.
1City of Seattle, Department of Planning and Development 2U.S. Geological Survey

2
Figure 1. Plots of design response spectra for peer-reviewed high-rise projects in downtown Seattle (colored lines) compared to Site Class C spectra from ASCE 7-05 and ASCE 7-10 (solid and dashed black lines).

3
For Abrahamson and Silva (2008) and Chiou and Youngs (2008), the basin terms are based on the depth to a shear-wave velocity (VS) of 1.0 km/s, denoted as Z1.0. Campbell and Bozorgnia (2008) applied a sedimentary basin term based on depth to VS of 2.5 km/s, denoted as Z2.5. These basin amplification terms are factors that are applied to the ground motions after accounting for the amplification from shallow soils derived from the VS averaged over the top 30 m (VS30). The NGA West 1 relations were updated in May 2013, and another focus of the workshop was to hear about changes in the basin amplification terms in the recently updated NGA West 2 relations.
Seismology: Development of 3D Velocity Models and Observations and Modeling of 3D Basin Effects
The first part of the workshop concerned how seismologists develop and validate three-dimensional (3D) velocity models of sedimentary basins, so that accurate predictions of basin response for future earthquakes can be made. It is important to stress that different strategies were used in the Puget Sound, Los Angeles, and San Francisco Bay regions to construct 3D models of P-wave velocities (VP), S-wave velocities (VS), and densities.
Seattle Area by Art Frankel Art Frankel described 3D velocity models for the Puget Sound region, focusing on the Seattle
Basin (fig. 2). The 3D model assembled by Stephenson (2007) was the basis of the simulations used to make the Seattle urban seismic hazard maps (Frankel and others, 2007). For the Seattle Basin, this model used P-wave tomography results from earthquakes and explosions, which were converted to S-wave velocities using standard relations that varied with depth. Frankel pointed out that Z2.5 was also constrained by seismic refraction studies in the area, as well as gravity data. The maximum value of Z2.5 for the Seattle Basin in the Stephenson (2007) model is about 7 km (fig. 3). Z1.0 in the model essentially tracks the top of bedrock as determined by reflections in marine seismic profiles and a few deep boreholes, and has a maximum depth of about 1.0 km. One problem with using Z1.0 for basin amplification in Seattle is that some shallow deposits of glacial till have VS near 1.0 km/s, so that that the depth for first reaching VS of 1.0 km/sec does not represent the true thickness of the sedimentary basin. In some cases there are velocity reversals beneath the glacial sediments.
Frankel also described a newer 3D velocity model of the Seattle Basin from Delorey and Vidale (2011) that used seismic noise correlation to determine the group velocities of surface waves over various paths. They then applied tomography to develop a 3D model of VS for the Seattle Basin. This model has somewhat slower VS values in the deeper portion of the Seattle Basin than the Stephenson (2007) model, but it has a similar maximum value of Z2.5 of about 7 km. The Delorey and Vidale velocity model (2011) does not have a discrete jump in VS at the top of bedrock, but is gradational. The use of surface waves in their procedure does not provide much resolution of Z1.0 above depths of about 2 km.
Frankel mentioned the various physical causes of basin amplification: conversion of incident S waves into basin surface waves at the edges of basins, focusing of S waves by the structure at the edges of the basin and within the basin, and amplification of S waves by the lower velocities in the basin. He discussed observations and computer simulations of amplification within the Seattle Basin (Frankel and others, 2007; 2009). He showed the key observation of surface waves in the Seattle basin from the 2001 M 6.8 Nisqually earthquake that were produced by conversion of incident S waves at the southern edge of the Seattle Basin (Frankel and others, 2002). These surface waves dominated the observed waveforms at Seattle Basin sites at 1-s period and increased the amplitude and duration of shaking in the basin.

4
Figure 2. Maps of A, gravity residuals and B, sediment thickness, showing the Seattle and Everett sedimentary basins. Figure from Brocher and others (2001)

5
Figure 3. Map of depth (m) to S-wave velocities of 2.5 km/s (Z2.5) in the Seattle area in the Stephenson (2007) 3D velocity model.

6
Figure 4. Plot of amplification of spectral accelerations determined for sites within the Seattle Basin relative to a thin soil-and-rock site outside the basin, based on two earthquakes. These stations have similar values of (VS30).

7
Frankel then presented newly calculated ratios of spectral accelerations from 1- to 10-s periods that show strong amplification factors of 2 to 4 for sites in the Seattle Basin relative to two sites outside of the basin to the south (fig. 4). He also showed plots of how well the 3D simulations reproduced the amplitudes and azimuthally dependent amplifications that have been observed for several earthquakes. Finally, he described the Seattle probabilistic seismic hazard maps (Frankel and others, 2007) for 1-Hz spectral accelerations based on 3D simulations of 541 earthquakes. These included earthquakes on the Seattle and Southern Whidbey Island Faults and the Cascadia Subduction Zone, as well as random shallow and deep earthquakes in the Puget Sound region.
Los Angeles Area by Rob Graves Rob Graves described the community velocity models (CVM) for southern California, focusing
on the Los Angeles sedimentary basin. Two CVMs have been developed (fig. 5). The first model (CVM-S; Magistrale and others, 2000) assigns VP values to various stratigraphic units in the Los Angeles Basin and has distinct changes in VP across age boundaries in the sediments, which are calibrated with sonic logs. The velocities are smoothly varying within stratigraphic units. Velocities within the near-surface geotechnical layer are calibrated with shallow VS logs and geology.
The second model (CVM-H) interpolates VP values from sonic logs and seismic reflection surveys using kriging. This CVM has a more complex set of velocities within the stratigraphic units and does not have coherent changes in VP across stratigraphic age boundaries. Velocities of the geotechnical layer for the near surface were taken from CVM-S. Both models assume VP/VS ratios to calculate a VS model from the VP model. The maximum value of Z2.5 in the Los Angeles sedimentary basin is about 5 km.
Day and others (2008) used the CVM-S in 3D finite-difference and finite-element simulations to determine theoretical amplification factors as a function of the depth to a VS of 1.5 km/s (fig. 6). These amplification factors were used to help constrain the basin amplification terms in some of the NGA West 1 relations. The key point is that the amplification predicted from the 3D model of basin structure is much larger than that predicted from a flat-layered (1D) velocity model.
Figure 5. Vertical cross section through two 3D velocity models of the Los Angeles sedimentary basin. Figure from Rob Graves of the U.S. Geological Survey.

8
Figure 6. Plots showing amplification as a function of period and depth to S-wave velocity of 1.5 km/s derived from earthquake simulations in 3D and 1D (flat-layer) models of the Los Angeles Basin. Figure from Day and others (2008).

9
Figure 7. Observed velocity seismograms (black, low-pass filtered at 0.5 Hz) of the 2010 M 7.2 El Mayor–Cucapah earthquake and synthetics from two different 3D velocity models (red and blue traces). Note the smaller peak velocities (bold numbers in black) at the station outside the Los Angeles sedimentary basin compared to those within the basin. Figure from Graves and Aagaard (2011).
Graves described recent observations of long-period amplification of ground motions in the Los Angeles Basin from the 2010 M 7.2 El Mayor–Cucapah earthquake by Hatayama and Kalkan (2011). This study showed large amplifications at 4–10 s periods that correlated with basin depth.
Graves summarized recent work he did with Brad Aagaard (Graves and Aagaard, 2011) on modeling the waveforms of the El Mayor–Cucapah earthquake using 3D simulations (fig. 7). They found that both 3D models (CVM-S and CVM-H) do reasonably well at predicting the observed long-period waveforms. Both models predict amplification factors of 3–4 in the Los Angeles Basin for periods greater than about 2 s.
San Francisco Bay Area by Brad Aagaard Brad Aagaard first showed the strong correlation of ground-motion amplitude with thickness of
sediments for the Cotati and Windsor sedimentary basins near Santa Rosa, California (McPhee and others, 2007). He described the development of the San Francisco Bay area velocity model that combines a 3D geologic block model with (1) stratigraphic units defined from geophysical surveys and (2) fault surfaces defined from seismicity. Empirical rules were used to assign elastic properties based on the stratigraphic unit and depth (Aagaard and others, 2010). Figure 8 is a map of Z2.5 in the bay area.

10
Figure 8. Map of depth to S-wave velocities of 2.5 k/s in the San Francisco Bay area. Figure from Brad Aagaard of the U.S. Geological Survey.
Figure 9. Map of ratios of 3-s spectral accelerations between the synthetics from the 3D model versus the prediction of the Boore and Atkinson ground-motion prediction equation (2008). Figure from Brad Aagaard of the U.S. Geological Survey.

11
Aagaard presented animations and maps of long-period (greater than 2.0 s) ground motions from 3D simulations of M 6.8 and M 7.0 earthquakes on the Hayward Fault. The simulations show strong correlation between shaking intensity and Z1.0. He emphasized that the 3D basin effects also increase the duration of shaking. Aagaard showed that synthetic waveforms match the observations for the 2007 M 5.4 Alum Rock earthquake in the Cupertino Basin west of San Jose, California (Aagaard and others, 2010). He noted the relatively poor correlation between VS30 and Z1.5 in the San Francisco Bay area. He described how synthetics in the 3D velocity model produced higher ground motions in areas with large Z1.5 values, compared to the Boore and Atkinson (2008) GMPEs (fig. 9), which relied on an implicit correlation between VS30 and basin depth (Aagaard and others, 2010).
Basin Factors in the Next Generation of Attenuation Relations
Campbell–Bozorgnia (2008 and 2013) by Ken Campbell Ken Campbell described the basin-response factors used in Campbell and Bozorgnia (2008) and
their preliminary 2013 update for NGA West 2. He described the functional form of the basin response, which is based on Z2.5. They found that observed amplitudes were sensitive to Z2.5 for values of Z2.5 less than 1 km and values greater than 3 km. For Z2.5 larger than 3 km, they used the functional form from the theoretical study by Day and others (2008) and the amplitude was determined from Campbell and Bozorgnia’s regression analysis of the data.
Campbell and Bozorgnia (2008) chose Z2.5 as a basin response variable because it is less strongly correlated with VS30 (a shallow site-response predictor variable) than Z1.0. It can also be estimated from gravity inversions and deep seismic profiles.
New data has been added for the 2013 update, including data from Japan, and the San Gabriel and Imperial Valleys in California. The older data is limited primarily to the Los Angeles and San Fernando sedimentary basins. Campbell reported that the deep basin amplification terms in the 2013 update average a factor of about 2 (fig. 10) and increase with increasing period. They are smaller than those in the 2008 paper, but still substantial. He does not think that inclusion of the Japan data lowered the basin amplification factors since the factors for deep sedimentary units do not show strong regional dependence.

12
Figure 10. Plot comparing basin amplification factors from Campbell and Bozorgnia (2008; CB08) and the preliminary basin amplifications from Campbell and Bozorgnia (2013; CB13). Figure from Ken Campbell of EQECAT, Inc. Used with permission.
The 2008 and 2013 studies found that the amplification increases with Z2.5 for values greater than 3 km and decreases with decreasing periods. Campbell stressed that the amplification term for a basin site is a combination of the VS30 term and the basin response term, with the latter incorporating additional basin effects that are not included in the former.
Abrahamson and Silva (2008 and 2013) by Norman Abrahamson Norman Abrahamson described the basin-response factors in Abrahamson and Silva (2008).
They used Z1.0 as the variable in their basin response terms because it is a number that can be measured by engineers and is often considered to be the depth to the top of bedrock (that is, thickness of soil). However, they had low confidence in the measured Z1.0 values for the 2008 study. Since the correlation between VS30 and Z1.0 is not reliable, they used a correlation described as “similar to Chiou and Youngs.” The scaling was constrained by analytical modeling, using 1D results from Walling and others (2008) for Z1.0 less than 200 m and 3D simulation results from Day and others (2008) for deeper soil depths.
At this point, the group discussed the methods used to measure VS and C.B. Crouse asked whether the methods are different in Japan than in the United States. Rob Graves answered that the 3D basin models for Japan use gravity to define the deeper parts; shallower methods were not known, but they likely include some downhole measurements. Abrahamson expressed concern that the new models are relying on empirical data rather than analytical solutions. It is hard to determine how measurements

13
of Z1.0 are extracted from the data used to develop basin models, and therefore difficult to recommend what methods should be used in practice to measure Z1.0.
For 2013, Abrahamson and Silva used Z1/Z1ref as a controlling variable. They found that Z1ref varies with region and is a function of VS30. Z1ref is shallower in Japan than California for a given VS30. For the 2013 study, the basin amplification factors are based on empirical evaluation. There is a significant dependence of within-event residuals as a function of Z1/Z1ref, for values between 1 and 10 km and for sites with similar VS30 values (fig. 11).
Figure 11. Plots of within-event residuals as a function of Z1.0 over Z1.0 reference case. Figure from Norman Abrahamson of PG&E and Walter Silva of Pacific Engineering. Used with permission.

14
Site Response as a Function of VS30 and Basin Depth From NGA West 2 Data Set by Jon Stewart Jon Stewart described the basin-response factors in Boore and others’ GMPEs (2013) for NGA
West 2. First he discussed amplification terms for different VS classes as a function of peak ground acceleration. This study identified nonlinear trends of decreasing amplification for sites with VS30 values less than about 310 m/s. Stewart described the basin amplification term based on Z1.0. This study found a significant trend of residuals as a function of Z1.0 for periods of 3 and 10 s. They reported that this basin amplification had minimal dependence on VS30 and found minimal regional dependence of the basin amplification terms. They also developed the parameter delta Z1.0, which is the difference between Z1.0 and models that fit Z1.0 as a function of VS30. They used models of Z1.0 as a function of VS30, as developed by Brian Chiou. These models are region dependent, similar to the approach described by Norman Abrahamson in the previous talk at the workshop. Stewart found that residuals as a function of delta Z1.0 were regionally dependent: they are stronger for Japan, intermediate for the San Francisco Bay area, and weaker for southern California.
Project Experience–Puget Sound Region
1823 Minor Avenue, Seattle, Washington by Walter Silva and King Chin The 0.4-acre site at 1823 Minor Avenue will be redeveloped into a 40-story-tall residential tower
and will extend 19 m below existing grade. The mat foundation will sit on soils that have been overridden by glaciation. The site is located about 3 km north of the Seattle Fault Zone and is within the Seattle Basin. The building period ranges between 5 and 6 s.
The Maximum Considered Earthquake (MCE) ground-motion spectrum was developed with a site-specific probabilistic seismic hazard assessment (PSHA) based on the USGS 2008 source characterization and used a fully probabilistic adjustment for site-specific conditions. These adjustments included the following. The rupture directivity model was applied by selecting 10 hypocenters equally spaced down dip and
computing the resulting motions using Somerville and others’ equations (1997). Each estimated motion was weighted equally.
Site response analyses were performed using the program RASCAL. The soil VS profiles, the ratio of shear modulus over linear modulus, and damping curves were all randomized about base-case values.
Two alternative basin models were considered because of uncertainty about the deeper VS values in the region. Z1.0 was modeled at 400 ft (~120 m; Pratt and others, 2003) and at 3,200 ft (~975 m; Frankel and others, 2007). Z2.5 was taken as 1 km (Pratt and others, 2003) and 7 km (Frankel and others, 2007). Equal weights were assigned to the site-specific hazard curves computed for both the shallow and deep basin models.
Figure 12 from Silva and Chin’s presentation shows the substantial difference in the uniform hazard spectra for periods of about 1 s and longer owing to the difference in the assumed basin depth (Z1.0 = 400 ft and 3,200 ft or ~120 m and ~975 m).

15
Figure 12. Plot of uniform hazard spectra with and without basin effect. Figure from King Chin of GeoEngineers and Walter Silva of Pacific Engineering. Used with permission.
16
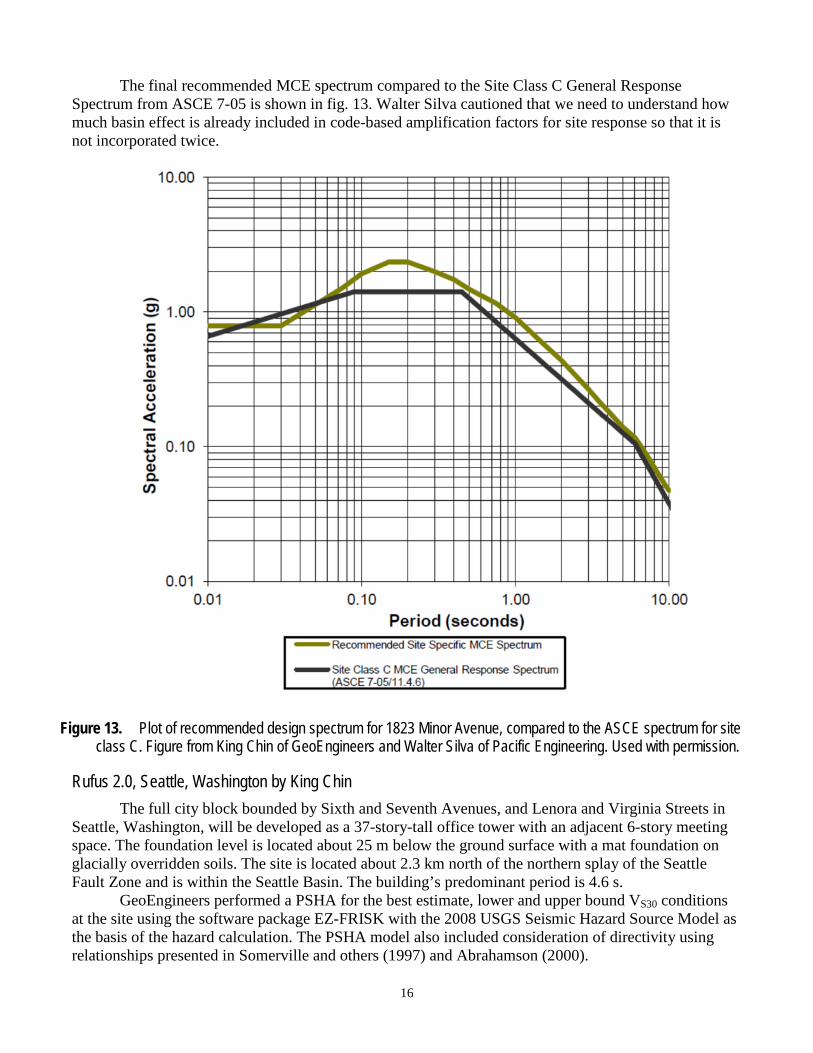
The final recommended MCE spectrum compared to the Site Class C General Response Spectrum from ASCE 7-05 is shown in fig. 13. Walter Silva cautioned that we need to understand how much basin effect is already included in code-based amplification factors for site response so that it is not incorporated twice.
Figure 13. Plot of recommended design spectrum for 1823 Minor Avenue, compared to the ASCE spectrum for site class C. Figure from King Chin of GeoEngineers and Walter Silva of Pacific Engineering. Used with permission.
Rufus 2.0, Seattle, Washington by King Chin The full city block bounded by Sixth and Seventh Avenues, and Lenora and Virginia Streets in
Seattle, Washington, will be developed as a 37-story-tall office tower with an adjacent 6-story meeting space. The foundation level is located about 25 m below the ground surface with a mat foundation on glacially overridden soils. The site is located about 2.3 km north of the northern splay of the Seattle Fault Zone and is within the Seattle Basin. The building’s predominant period is 4.6 s.
GeoEngineers performed a PSHA for the best estimate, lower and upper bound VS30 conditions at the site using the software package EZ-FRISK with the 2008 USGS Seismic Hazard Source Model as the basis of the hazard calculation. The PSHA model also included consideration of directivity using relationships presented in Somerville and others (1997) and Abrahamson (2000).
17
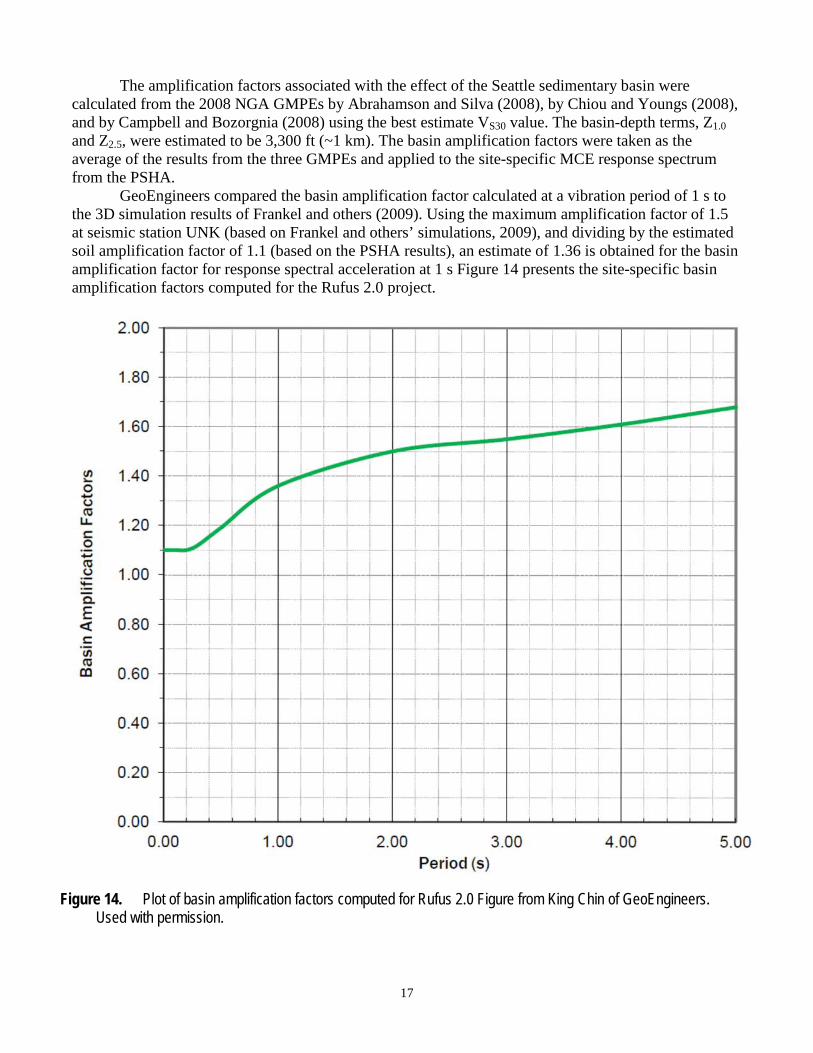
The amplification factors associated with the effect of the Seattle sedimentary basin were calculated from the 2008 NGA GMPEs by Abrahamson and Silva (2008), by Chiou and Youngs (2008), and by Campbell and Bozorgnia (2008) using the best estimate VS30 value. The basin-depth terms, Z1.0 and Z2.5, were estimated to be 3,300 ft (~1 km). The basin amplification factors were taken as the average of the results from the three GMPEs and applied to the site-specific MCE response spectrum from the PSHA.
GeoEngineers compared the basin amplification factor calculated at a vibration period of 1 s to the 3D simulation results of Frankel and others (2009). Using the maximum amplification factor of 1.5 at seismic station UNK (based on Frankel and others’ simulations, 2009), and dividing by the estimated soil amplification factor of 1.1 (based on the PSHA results), an estimate of 1.36 is obtained for the basin amplification factor for response spectral acceleration at 1 s Figure 14 presents the site-specific basin amplification factors computed for the Rufus 2.0 project.
Figure 14. Plot of basin amplification factors computed for Rufus 2.0 Figure from King Chin of GeoEngineers. Used with permission.

18
GeoEngineers developed the site-specific Risk-Targeted Maximum Considered Earthquake (MCER) response spectrum by multiplying the site-specific MCE response spectrum by the maximum component adjustment factors (developed per the 2009 edition of the National Earthquake Hazards Reduction Program Recommended Provisions) and the risk coefficients calculated using Method 2 (per ASCE 7-10 Section 21.2.1.2). Figure 15 presents the site-specific, MCER response spectrum developed for the site and the recommended site-specific, MCER response spectrum (smoothed response spectrum developed using the procedure outlined in ASCE 7-10 Section 21.4) for use in the structural design. Figure 15 also includes the ASCE 7-10 Site Class C generalized response spectrum for comparison.
Figure 15. Plot of site-specific spectrum for Rufus 2.0. Figure from King Chin of GeoEngineers. Used with permission.
Recommended Design Response Spectra for 2030 8th Avenue by Doug Lindquist The quarter-block site on the eastern corner of Eighth Avenue and Lenora Street in Seattle will
be developed as a 41-story-tall residential tower with retail space at grade and five levels of below-grade parking. The site is located within the Denny Regrade area and had about 3 to 6 m of fill placed on it during the regrade. At the foundation level (15 m below grade) the site soils are classified as Site Class C. The site is located about 5 km north of the northern splay of the Seattle Fault Zone and is within the Seattle Basin. The building period is about 5 s.
The seismic design of this project was based on the ASCE 710 MCER. In place of site-response analyses, the spectrum from the 2008 USGS PSHA for Site Class C conditions was used as the starting point and modified for basin considerations.

19
Basin effects were estimated using the 2008 NGA West 1 GMPEs including Campbell and Bozorgnia (2008) for Z2.5 = 1, 3, 4, and 6 km; Chiou and Youngs (2008) for Z1.0 = 400, 800, and 3,200 ft; and Abrahamson and Silva (2008) for Z1.0 = 400, 800, and 3,200 ft (~120 m, ~245 m, and ~975 m). The Z1.0 value of 400 ft is based on near-surface downhole VS measurements at a number of downtown Seattle sites. In contrast, the velocity model by Stephenson (2007) and Delorey and Vidale (2011) would indicate Z1.0 is approximately 1 km. It is likely that the Stephenson (2007) and Delorey and Vidale (2011) velocity models are more consistent with the VS data used to develop the NGA West 1 GMPEs.
In addition to the basin factors from GMPEs, Hart Crowser considered simulations of M 9.0 Cascadia Subduction Zone events by Yang (2009) that show amplification ratios greater than 1.6 at a period of 5 s. They also considered amplification factors from 3D numerical simulations for the Seattle Basin by Frankel and others (2009) and basin amplification factors used on nearby recent projects. The recommended spectrum includes a basin amplification factor of 1.0 for periods less than or equal to 0.5 s and 1.15 for periods greater than or equal to 2 s with linear interpolation between 0.5 and 2 s. For periods longer than 1 s, Hart Crowser recommended that the MCER spectrum not fall below the ASCE 7-10 code spectrum for Site Class C. This results in a basin amplification factor of up to 1.6 for periods between 5 and 6 s (relative to the 2008 USGS PSHA spectrum for Site Class C) with lower basin amplification factors at other periods. Figure 16 presents a comparison of the recommended design spectrum and the code spectrum.
Figure 16. Plot of recommended design spectrum for 2030 8th Avenue. Figure from Doug Lindquist of Hart Crowser. Used with permission.

20
Incorporation of Basin Effects in the Design of the Tacoma Narrows Bridge, Alaskan Way Viaduct, and SR 520 Bridge Replacement by Bob Mitchell
Shannon & Wilson, Inc. incorporated basin effects into the ground motion estimates developed for the Tacoma Narrows Bridge, the Alaskan Way Viaduct, the Seawall Replacement program, and the SR 520 Bridge Replacement and HOV (SR 520) program. Different approaches were used over the five-year period of these design projects, based on the published literature available at the time of each project.
Between 2000 and 2005, Shannon & Wilson, Inc. developed ground motion estimates for the Tacoma Narrows Bridge and the Alaskan Way Viaduct. Design criteria for these projects required 2,500-year- and 1,000-year-return-period ground motions, respectively. A site-specific probabilistic seismic hazard analysis was performed to develop soft rock uniform hazard spectra and soft rock time histories for the projects. Site response analysis was conducted, using the soft rock time histories, to develop ground surface response spectra at representative sites along the alignments.
Effects from the Seattle Basin were not commonly incorporated into projects in the Seattle area between 2000 and 2005. However, during this time preliminary published reports suggested that amplified ground surface motions could result from basin effects. Also during this period, the GMPEs used in the PSHA did not include terms that considered basin effects. Given the relative infrastructure significance of the Tacoma Narrows Bridge and the Alaskan Way Viaduct, basin effects were incorporated into the smoothed ground surface design response spectra using a deterministic method developed as part of the Brookhaven National Lab report (Silva and others, 1997). Based on this report, basin effects were incorporated into the smoothed ground surface design response spectrum using a basin amplification factor of 1 for periods less than or equal to 0.5 s and 1.2 for periods greater than or equal to 1 s with linear interpolation between 0.5 and 1 s.
In 2009 Shannon & Wilson, Inc. developed the ground motions for the SR 520 program and project design criteria required 1,000-year-return-period ground motions. The site-specific PSHA performed for the project included the NGA West 1 equations. The Z1.0 and Z2.5 terms required for the crustal GMPE were based on correlations between VS30 (measured at several sites along the alignment), Z1.0, and Z2.5, as developed by Campbell and Bozorgnia (2008).
The PSHA results were compared to the 3D Seattle Basin effects results presented in Frankel and others (2007). In contrast to the GMPE used in the 2002 USGS maps and in the Frankel and others study (2007), the NGA West 1 equations used in the SR 520 program PSHA include rock/soil amplification and basin effects. Considering the results from the PSHA and the Frankel and others study (2007), the smoothed ground surface design response spectrum was modified to have a basin amplification factor equal to 1 for periods less than 0.5 s and 1.3 for periods greater than 1 s with linear interpolation between 0.5 and 1 s.
Project Experience–California
Basin Amplification Design–Ground Motion Case History in Santa Monica by Paul Somerville Paul Somerville presented a case history for design of a low-rise building in downtown Santa
Monica, California. The building is located to the north of the Santa Monica City Hall free-field station and is near the edge of the Los Angeles Basin. At the site, VS30 = 400 m/s, Z1.0 = 580 m, and Z2.5 = 2,760 m.
Somerville showed a comparison of the 1994 M 6.8 Northridge earthquake recording at Santa Monica City Hall and the NGA West 1 geometrical mean of the two horizontal components. The recorded ground motions are higher than the NGA West 1 relationship, which Somerville attributed to basin-edge amplification.

21
CyberShake, a high-performance computing platform of the Southern California Earthquake Center, was used to perform a PSHA calculation using 3D ground-motion simulations. CyberShake showed higher spectral amplification than Abrahamson and Silva’s GMPEs (1998), which did not include a basin amplification term. The recommended design spectrum was based on the MCE, not two-thirds of the MCE, to account for basin amplification.
Caltrans Incorporation of Basin Amplification for Design Response Spectrum Specification by Tom Shantz For the design of structures since 2009, Caltrans uses an envelope of the deterministic and
probabilistic spectra. The deterministic spectrum is based on the average of the Campbell and Bozorgnia (2008) and the Chiou and Young (2008) GMPEs. The probabilistic spectrum is based on the 5 percent chance of exceedance in 50 year USGS hazard calculations including the effects of soil amplification. The design spectrum is then modified by adjustment factors for near-fault effects and basin amplification. In southern California the basin amplification factor is based on an average of the Campbell and Bozorgnia (2008) and Chiou and Youngs (2008) GMPEs with no basin deamplification allowed. To obtain the parameters Z1.0 and Z2.5, Caltrans uses the Southern California Earthquake Center model (Magistrale and others, 2000) in the form of isovelocity contour maps. The maximum Z2.5 value is about 6 km while the maximum Z1.0 value is about 1 km. For northern California, reliable Z1.0 information is not available. Thus, for basin amplification Caltrans relies on the Campbell and Bozorgnia GMPE only. An approximate Z2.5 contour map was estimated using the Lin and others tomography study (2008), which has a maximum Z2.5 of about 4 km.
A complication in determining Z1.0 and Z2.5 is that the velocity profiles in some locations do not steadily increase. Instead, the velocity increases and then decreases before increasing again, resulting in several depths that correspond to a particular velocity. This inverted velocity structure was observed in the Imperial Valley, resulting in three different depths with VS value of 2.5 km/s. Generally, Caltrans will use the deepest Z2.5 if there is a significant inversion. If the inversion is relatively small, as in the Imperial Valley, Caltrans uses the shallowest Z2.5. NGA West 1 developers used the shallowest Z2.5 for their model development.
The Campbell and Bozorgnia (2008) and Chiou and Youngs (2008) basin amplification models are primarily based upon southern California data. The Snelson and others (2007) velocity model shows that the Seattle Basin has a Z2.5 of about 5 km for an east-west transect just north of the Lake Washington Ship Canal, and the velocity profiles for the Seattle and Los Angeles basins are somewhat similar. The similarity of velocity profiles suggests that NGA-based basin amplification models using the Z2.5 parameter may be applicable to the Seattle region although this needs further investigation. Tom Shantz believes that Z2.5 is easier to obtain than Z1.0 because tomographic studies are better at constraining Z2.5 than Z1.0. Using a Z2.5 of 5 km and the Campbell and Bozorgnia (2008) GMPE yields an amplification factor of 1.4 to 1.5 for periods greater than 0.7 s. Caltrans has been using these factors in design of their structures for many years.
Basin Depth Effects for Shallow Soil Sites in the Bay Area by Norman Abrahamson Norman Abrahamson presented two case histories from the San Francisco Bay area. A base
isolation project in Oakland, California is located on a site with shallow depth to rock and is classified as Site Class D. The periods of interest ranged from 3 to 4 s. The basin parameter Z1.0 is 50 m. For very small Z1.0 and periods greater than 2 s, the basin effect according to Abrahamson and Silva (2008) is negligible. The predominant effect was computed from 1D site response analyses for the shallow soil profile, using SHAKE software, which showed that the response spectra at long periods could be reduced by a factor of 2.2 relative to the code spectrum for Site Class D. The project received a waiver from the building department to use long-period ground motions below the code minimum (i.e., below 80 percent of Site Class D).

22
For a rail extension project from Fremont to San Jose, California, some structures are sensitive to periods of up to 4 s. The alignment crosses the Evergreen sedimentary basin; however, Abrahamson stated that there are no authoritative maps of basin depths in the San Jose area. Thus basin depth scaling was ignored in the current phase of design but will be revisited later.
Abrahamson expressed the opinion that for deeper basins, Z2.5 is the better parameter to use, while for shallow basins, Z1.0 is better. He would like to see a website where you can get basin depth values by entering latitude and longitude values.
Discussion C.B. Crouse summarized the agenda points and asked for feedback from the structural engineers
in attendance about their fundamental period band of interest. John Hooper replied that most high rises are of concrete core wall design with typical fundamental periods of 5–6 s, and period bands of interest between 1 and 8 s. Joe Maffei added that we occasionally have longer fundamental periods (up to 8.5 s) for residential buildings with smaller or more flexible cores.
Applicability of NGA Basin Terms to Seattle Basin and Choosing Basin Parameters Z1.0 and Z2.5 There was no consensus as to whether the NGA West 1 basin terms apply to Seattle. There were
suggestions to (1) make plots of velocity profiles to compare the mostly southern California data used to develop the NGA West 1 basin terms to Seattle area velocity profiles and (2) compare the basin models and simulations of the Seattle Basin to the Los Angeles Basin. Norman Abrahamson suggested that we keep in mind the limitations of GMPEs and to not overestimate their capabilities. VS30 is not a replacement for site response analyses, and NGA basin factors are not a replacement for 3D models.
Art Frankel stated that VS inversions in the Seattle Basin complicate our attempts to determine Z1.0. Ken Campbell suggested that since basin response is regional, spot data for estimating Z1.0 is not the best variable for modeling basin response. He added that velocity inversions are not common in the Los Angeles Basin.
Frankel suggested that Z2.5 is the better basin-depth parameter to use for Seattle at the present time. Z2.5 values from the Stephenson velocity model (available from the USGS; 2007) are plotted on the map in fig. 2. Campbell cautioned that even if a map of Z2.5 is provided, engineers might still want to use Z1.0.
Handling Effects of Seattle Basin for Cascadia Subduction Zone Megathrust and In-Slab Earthquakes
Art Frankel pointed out that initial results from 3D simulations for Cascadia M 9 megathrust earthquakes by Andrew Delorey indicate substantial amplification (factors of 2 to 3) in the Seattle Basin for periods of 3 and 5 s. Observations of basin amplification from the Nisqually earthquake (Frankel and others, 2002) demonstrate that these effects can be important for deep in-slab earthquakes as well. Current GMPEs for Cascadia Subduction Zone megathrust and in-slab earthquakes do not include basin amplification factors.
Appropriate Lower Limit for the MCE Design Spectrum for High-Rise Buildings in Downtown Seattle
Susan Chang asked whether it is unusual to see tall buildings designed for 80 percent of the code value in California. John Hooper replied that the calculated design spectrum typically needs to be brought up to 80 percent to meet code at longer periods.

23
Basin Response Due to Small and Large Magnitude Earthquakes Ken Campbell asked whether small and large magnitude earthquakes have different basin
response. Small and large magnitude events were used to derive the basin response term in the 2013 update of Campbell and Bozorgnia (2008). Art Frankel thought the basin response would not be magnitude dependent. Rob Graves noted that a large magnitude event on the San Andreas Fault could produce a different basin response because of possible coupling of directivity with surface-wave generation, as found in the Shakeout scenario. Campbell will look closer at the smaller versus larger magnitudes to see if there is a difference in basin response.
Recommendations by the Workshop Participants for the Seattle Basin The workshop participants agreed on the following recommendations. Note that these do not
constitute policy recommendations by the USGS. 1. The workshop participants recommended that the starting point for the uniform hazard spectrum
used in the design of tall buildings in Seattle should be from either the International Building Code, the USGS national seismic hazard maps, or site-specific probabilistic seismic hazard assessment. For the last option, workshop participants recommended that the most current, published NGA West values should be used.
2. Workshop participants recommended that basin amplification factors should be required in the design of tall buildings in Seattle. These factors could initially be based on Z2.5 from the Stephenson (2007) model and the most current, published NGA relations. For GMPEs with basin factors that are given as a function of Z1.0, the Z2.5 value could be converted to Z1.0 using the equation in Campbell and Bozorgnia (2007) based on California correlations. The participants recommended that very shallow values of Z1.0 based on surficial VS measurements should not be used to estimate basin amplification factors because of inversions in some of the VS profiles of the Seattle Basin. The intention is to capture a regional effect.
3. Until basin amplification factors are developed for subduction zone earthquakes, basin amplification factors from crustal-earthquake GMPEs would typically be applied to the uniform hazard spectrum after site effects are taken into account.
4. The USGS will provide values of Z2.5 from the Stephenson (2007) velocity model, upon request for a limited number of locations.
5. The USGS should compare amplification factors derived from Puget Sound earthquake simulations with those derived in the Los Angeles Basin by Day and others (2008) and with those in the corresponding NGA relations.
6. Over the long term (2–4 years), USGS should improve the 3D velocity model for the Seattle area using new measurements of VS from seismic-noise studies and other investigations. In addition, the participants recommended that the USGS should create long-period (2–10 s) probabilistic seismic hazard maps for Seattle and other areas based on 3D simulations, similar to the 1-s hazard maps for Seattle in Frankel and others (2007).
Acknowledgments We thank all the attendees of the workshop for their participation, insights, and guidance. We
thank Brad Aagaard, Tom Shantz, King Chin, Ken Campbell, Bob Mitchell, and Doug Lindquist for providing portions of text and for their editorial suggestions on the report. We thank the presenters for supplying figures from their presentations for this report. John Vidale and Mark Petersen reviewed this

24
report and provided many helpful comments that improved it. We thank Pat McCrory and Keith Knudsen for their editorial comments.

25
References Cited Aagaard, B.T., Graves, R.W., Rodgers, Arthur, Brocher, T.M., Simpson, R.W., Dreger, Douglas,
Petersson, N.A., Larsen, S.C., Ma, Shuo, and Jachens, R.C., 2010, Ground-motion modeling of Hayward Fault scenario earthquakes, Part II: simulation of long-period and broadband ground motions: Bulletin of the Seismological Society of America, v. 100, no. 6, p. 2,945–2,977, available at http://dx.doi.org/10.1785/0120090379.
Abrahamson, Norman, 2000, Effects of rupture directivity on probabilistic seismic hazard analysis, in Sixth International Conference on Seismic Zonation, Palm Springs, Calif., November 12–15, 2000, Proceedings: Oakland, Calif., Earthquake Engineering Research Institute.
Abrahamson, Norman, and Silva, Walter, 2008, Summary of the Abrahamson & Silva NGA ground-motion relations: Earthquake Spectra, v. 24, no. 1, p. 67–97, available at http://dx.doi.org/10.1193/1.2924360.
Boore, D.M., Stewart, J.P., Seyhan, Emel, and Atkinson, G.M., 2013, NGA-West2 equations for predicting response spectral accelerations for shallow crustal earthquakes: Pacific Earthquake Engineering Research Center PEER Report 2013/05, 106 p.
Boore, D.M., and Atkinson, G.M., 2008, Ground-motion prediction equations for the average horizontal component of PGA, PGV, and 5%-Damped PSA at Spectral Periods Between 0.01 s and 10.0 s: Earthquake Spectra, v. 24, no. 1, p. 99–138, available at http://dx.doi.org/10.1193/1.2830434.
Brocher, T.M., Parsons, Tom, Blakely, R.J., Christensen, N.I., Fisher, M.A., Wells, R.E., and the SHIPS Working Group, 2001, Upper crustal structure in Puget Lowland, Washington: Results from the 1998 Seismic Hazards Investigation in Puget Sound: Journal of Geophysical Research, v. 106, no. B7, 13,541–13,564. [Also available at http://dx.doi.org/10.1029/2001JB000154.]
Campbell, K.W., and Bozorgnia, Yousef, 2007, Campbell-Bozorgnia NGA ground motion relations for the geometric mean horizontal component of peak and spectral ground motion parameters: Pacific Earthquake Engineering Research Center PEER Report 2007/02, 120 p.
Campbell, K.W., and Bozorgnia, Yousef, 2008, NGA ground motion model for the geometric mean horizontal component of PGA, PGV, PGD and 5% damped linear elastic response spectra for periods ranging from 0.01 To 10 s: Earthquake Spectra, v. 24, no. 1, p. 139–171, available at http://dx.doi.org/10.1193/1.2857546.
Chiou, B.S.J., and Youngs, R.R., 2008, An NGA model for the average horizontal component of peak ground motion and response spectra: Earthquake Spectra, v. 24, no. 1, p. 173–215, available at http://dx.doi.org/10.1193/1.2894832.
Day, S.M., Graves, Robert, Bielek, Jacobo, Dreger, Douglas, Larsen, Shawn, Olsen, K.B., Pitarka, Arben, and Ramirez-Guzman, Leonardo, 2008, Model for basin effects on long-period response spectra in southern California: Earthquake Spectra, v. 24, no. 1, p. 257–277, available at http://dx.doi.org/10.1193/1.2857545.
Delorey, A.A., and Vidale, J.E., 2011, Basin shear-wave velocities beneath Seattle, Washington, from noise-correlation Rayleigh waves: Bulletin of the Seismological Society of America, v. 101, no. 5, p. 2,162–2,175, available at http://dx.doi.org/10.1785/0120100260.
Frankel, A.D., Carver, D.L., and Williams, R.A., 2002, Nonlinear and linear site response and basin effects in Seattle for the M 6.8 Nisqually, Washington, Earthquake: Bulletin of the Seismological Society of America, v. 92, no. 6, p. 2,090–2,109, available at http://dx.doi.org/10.1785/0120010254.
Frankel, A.D., Stephenson, W.J., Carver, D.L., Williams, R.A., Odum, J.K., and Rhea, Susan, 2007, Seismic hazard maps for Seattle, Washington, incorporating 3D sedimentary basin effects, nonlinear site response, and rupture directivity: U.S. Geological Survey Open-File Report 2007–1175, 70 p., available at http://pubs.usgs.gov/of/2007/1175/.

26
Frankel, Arthur, Stephenson, William, and Carver, David, 2009, Sedimentary basin effects in Seattle, Washington: ground-motion observations and 3D simulations: Bulletin of the Seismological Society of America, v. 99, no. 3, p. 1,579–1,611, available at http://dx.doi.org/10.1785/0120080203.
Graves, R.W., and Aagaard, B.T., 2011, Testing long-period ground-motion simulations of scenario earthquakes using the Mw 7.2 El Mayor–Cucapah mainshock: Evaluation of finite-fault rupture characterization and 3D seismic velocity models: Bulletin of the Seismological Society of America, v. 101, no. 2, p. 895–907, available at http://dx.doi.org/10.1193/1.2894832.
Hatayama, Ken and Kalkan, Erol, 2012, Spatial amplification of long-period (3 to 16 s) ground motions in and around the Los Angeles Basin during the 2010 M7.2 El Mayor–Cucapah Earthquake, in Proceedings of the Fifteenth World Conference on Earthquake Engineering, Lisbon, Portugal, September 24–28, 2012: Tokyo, International Association for Earthquake Engineering. [Also available at http://www.iitk.ac.in/nicee/wcee/article/WCEE2012_0770.pdf.]
Lin, Guoqing, Thurber, C.H., Zhang, Haijiang, Hauksson, Egill, Shearer, P.M., Waldhauser, Felix, Brocher, T.M., and Hardebeck, Jeanne, 2010, A California statewide three-dimensional seismic velocity model from both absolute and differential times: Bulletin of the Seismological Society of America, v. 100, no. 1, p. 225–240, available at http://dx.doi.org/10.1785/0120090028.
Magistrale, Harold, Day, Steven, Clayton, R.W., and Graves, Robert, 2000, The SCEC southern California reference three-dimensional seismic velocity model Version 2: Bulletin of the Seismological Society of America, v. 90, no. 6B, p. S65–S76. [Also available at http://dx.doi.org/10.1785/0120000510.]
McPhee, D.K., Langenheim, V.E., Hartzell, S., McLaughlin, R.J., Aagaard, B.T., Jachens, R.C., and McCabe, C., 2007, Basin structure beneath the Santa Rosa Plain, northern California: Implications for damage caused by the 1969 Santa Rosa and 1906 San Francisco Earthquakes: Bulletin of the Seismological Society of America, v. 97, no. 5, p. 1,449–1,457, available at http://dx.doi.org/10.1785/0120060269.
Pratt, T.L., Brocher, T.M., Weaver, C.S., Creager, K.C., Snelson, C.M., Crosson, R.S., Miller, K.C., and Trehu, A.M., 2003, Amplification of seismic waves by the Seattle Basin, Washington State: Bulletin of the Seismological Society of America, v. 93, no. 2, p. 533–545, available at http://dx.doi.org/10.1785/0120010292.
Silva, W., Abrahamson, N., Toro, G., and Costantino, C., 1997, Description and validation of the stochastic ground motion model: El Cerrito, Calif., Pacific Engineering and Analysis, Report prepared for Brookhaven National Laboratory, Upton, New York, Contract number 770573, 700 p.
Snelson, C.M, Brocher, T.M., Miller, K.C., Pratt, T.L., and Trehu, A.M., 2007, Seismic amplification within the Seattle Basin, Washington State: Insights from SHIPS seismic tomography experiments: Bulletin of the Seismological Society of America, v. 97, no. 5, p. 1432–1448, available at http://dx.doi.org/10.1785/0120050204.
Somerville, P.G., Smith, N.F., Graves, R.W., and Abrahamson, N.A., 1997, Modification of empirical strong ground motion attenuation relations to include the amplitude and duration effects of rupture directivity: Seismological Research Letters, v. 68, no. 1, p. 199–222. [Also available at http://dx.doi.org/10.1785/gssrl.68.1.199.]
Stephenson, W.J., 2007, Velocity and density models incorporating the Cascadia Subduction Zone for 3D earthquake ground motion simulations: U.S. Geological Survey Open-File Report 2007–1348, 24 p., available at http://pubs.usgs.gov/of/2007/1348/.
Walling, Melanie, Silva, Walter, and Abrahamson, Norman, 2008, Nonlinear site amplification factors for constraining the NGA models: Earthquake Spectra, v. 24, no. 1, p. 243–255, available at http://dx.doi.org/10.1193/1.2934350.
Yang, Jing, 2009, Nonlinear responses of high-rise buildings in giant subduction earthquakes: Pasadena, California Institute of Technology, Ph.D. dissertation, 167 p., 93 figs.

27
Appendix Agenda
USGS Workshop Incorporating Basin Effects in Design of Tall Buildings
March 4, 2013 Room 4901, Seattle Municipal Tower, 700 5th Avenue, Seattle, Washington
8:00 Room opens Coffee available 8:30 to 8:45 Welcome, Introductions, Charge Susan Chang Basin Velocity Models, Observations, and 3D Modeling 8:45 to 9:00 Seattle area Art Frankel 9:00 to 9:15 Los Angeles area Rob Graves 9:15 to 9:30 Santa Clara area Brad Aagaard 9:30 to 9:50 Discussion of seismological aspects of basin response All participants Basin Factors in NGA 9:50 to 10:05 Campbell–Bozorgnia Ken Campbell 10:05 to 10:20 Abrahamson and Silva 2008 and changes in the 2013 model Norman Abrahamson 10:20 to 10:35 Site response as function of VS30 and basin depth from NGA West 2 dataset Jon Stewart 10:35 to 10:45 Break Project Experience: Puget Sound Region 10:45 to 11:00 1823 Minor Avenue Walter Silva 11:00 to 11:15 Amazon Rufus 2.0 King Chin 11:15 to 11:30 2030 8th Avenue Doug Lindquist 11:30 to 11:45 SR 520/Alaskan Way Viaduct Bob Mitchell 11:45 to 12:45 Lunch Provided by City of Seattle Department of Planning and Development (DPD) Project Experience: California 12:45 to 1:00 Basin amplification design ground motion case history in Santa Monica Paul Somerville 1:00 to 1:15 Consideration of basin effects at Caltrans Tom Shantz 1:15 to 1:30 Basin depth effects for shallow soil sites in the bay area Norman Abrahamson 1:30 to 3:00 Roundtable discussions All participants 1:30 to 1:45 Summary of issues for the Puget Sound region C.B. Crouse Suggested topics for discussion:
Applicability of basin terms in NGA to Seattle Basin; how to choose values for basin parameters, Z1.0 and Z2.5?
How should effects of Seattle Basin be handled for Cascadia Subduction Zone megathrust and deep CSZ in-slab earthquakes?
What is an appropriate lower limit to the level of the MCE design spectrum for high risehigh-rise buildings in downtown Seattle? Foundations typically on glacial till (Site Class C approaching the B/C boundary).
Recommended procedures for Seattle Basin
Technical issues with 3D basin models and use of results in long period response spectra maps for building code
Short-term (1 year) research? Long-term research? 3:00 to 3:15 Break

28
3:15 to 4:15 Roundtable discussions continued All participants 4:15 to 5:00 Group recommendations All participants 5:00 End of workshop
Attendees: Brad Aagaard, Ph.D. (USGS Menlo Park) Norman Abrahamson, Ph.D. (PG&E) Paul Bodin, Ph.D. (University of Washington-Pacific Northwest Seismic Network) Kenneth Campbell, Ph.D. (EQECAT, Inc.) Mehmet Celebi, Ph.D. (USGS Menlo Park) Susan Chang, Ph.D., P.E. (City of Seattle DPD–geotechnical group) King Chin, P.E. (GeoEngineers) C.B. Crouse, Ph.D., P.E. (URS Corporation, Seattle) Arthur Frankel, Ph.D. (USGS Seattle) Claire Gibson, P.E. (Seattle Public Utilities) Robert Graves, Ph.D. (USGS Pasadena) John Hooper, P.E., S.E. (Magnusson Klemencic Associates) Steven Kramer, Ph.D., P.E. (University of Washington) Douglas Lindquist, P.E., G.E. (Hart Crowser) Joseph Maffei, P.E., S.E. (Maffei Structural Engineering)* in Oakland Robert Mitchell, P.E. (Shannon & Wilson, Inc.) Steven Pfeiffer, P.E., S.E. (City of Seattle DPD–structural engineer) Kristin Phillips-Alonge, Ph.D. (USGS Seattle)) Thomas Shantz (Caltrans), P.E., G.E. Walter Silva, Ph.D. (Pacific Engineering)* in El Cerrito Jon Siu, P.E., S.E. (City of Seattle Principal Engineer and Building Official) Paul Somerville, Ph.D. (URS Corporation, Pasadena) in Sydney* Jonathan Stewart, Ph.D., P.E. (UCLA) John Vidale, Ph.D. (University of Washington–PNSN) Craig Weaver, Ph.D. (USGS Seattle) *participating via WebEx.