report on trucking industry
TRANSCRIPT

Competition Issues in the Road Goods Transport Industry in India with special reference to
The Mumbai Metropolitan Region
S.Sriraman Walchand Hirachand Professor of Transport Economics
Department of Economics, University of Mumbai
with Anand Venkatesh Manisha Karne Assistant Professor Reader in Economics, Institute of Rural Management, Anand S.N.D.T. University, Mumbai
and assistance from Vidya Mohite
Final Report (Revised)
submitted to The Competition Commission of India, New Delhi
September 2006

Competition Issues in the Road Goods Transport Industry in India with special reference to
The Mumbai Metropolitan Region
S.Sriraman Walchand Hirachand Professor of Transport Economics,
Department of Economics, University of Mumbai
with Anand Venkatesh Manisha Karne Assistant Professor, Reader in Economics, Institute of Rural Management, Anand S.N.D.T. University, Mumbai
and assistance from Vidya Mohite
Research Fellow, Department of Economics, University of Mumbai
Final Report (Revised) submitted to
The Competition Commission of India, New Delhi September 2006
2
PREFACE The road transport mode serves as one of the key factors in the developmental process of any economy. While historically, the railways have played a dominant role in the overall transport system of many countries, the road transport mode has, over a period of time, come to occupy a pivotal role by virtue of certain inherent advantages. Over the past few decades, the share of road transport in the total surface traffic movement in India has been gradually increasing with a distinct shift away from the railways being observed. Most recent estimates give the road mode a share of nearly 63 per cent in freight movement compared to its share of just about 10 per cent in the early fifties. According to these estimates, this percentage share is likely to stabilize around 85 per cent. Given this emerging significant role, many issues have been raised in the context of road freight movements, which apart from many others relate to efficiency of operations, the competitiveness of the market, etc. Given the huge number of suppliers and the apparent ease of entry into the sector, it was widely believed that the market was very nearly competitive. However, it has been an emerging feeling that the organisation of the structure of the industry as well as some unimaginative policy measures and tardy implementation of even the limited but fairly well designed regulatory measures have resulted in inefficient provision of services which when viewed in the context of a liberalized and globalised framework of economic activities affects competitiveness. It is against this background that an attempt has been made, in this study, to examine and understand the nature of competitiveness in the road goods transport industry in India. The study has been undertaken at the instance of the Competition Commission of India. We gratefully acknowledge the opportunity given to us by the Commission. We are particularly thankful to Shri. Vinod Dhall, Member, Shri.Amitabh Kumar, Director-General, Shri.G.R.Bhatia, Additional Director-General of the Commission and to Dr. Vijay Kelkar, Chairman, Advisory Committee on Research and Market Studies and Members of the Advisory Committee for initiating us into the study. Thanks are also due to Shri.Vyasji, Secretary, Shri. Augustine Peter, Economic Advisor, Shri.Sain, Deputy Director, Shri. Rakesh Vashist, Assistant Director General, and other officials of the Competition Commission for the encouragement and support during the course of the study. We are also thankful to Shri. Srinivas of the Monopolies and Restrictive Trade Practices Commission, New Delhi for making available material on case laws in the Indian context. We are grateful to all the persons whom we met in connection with the study- the truck operators, the brokers, the booking agents, financiers and Trucking Association officials for the help rendered in regard to our surveys and other information relating to the industry. We would also like to acknowledge the inputs received at the Workshop organised by the Competition Commission of India along with the World Bank and DFID in Delhi in March 2006. The insights gained from the discussions at the Workshop and those following presentations of the Draft and Final Reports of the Study before the Commission’s Advisory Committee on Research and Market Studies have been useful in many ways in guiding us in unearthing some of the intricacies and complexities of trucking operations in India.
3
My colleagues at the Department of Economics, University have been kind enough to provide some very useful inputs at the time of conceptualization of the study and during the course of the study. We take this opportunity to express our gratitude to them. The work put in by my students Anand, Manisha (who are now researchers on their own right but were kind enough to put efforts into the study) and Vidya (who is still an infant researcher but one who is learning fast) has been most effective. I would take this opportunity to apoligise for the delay in submitting this Report, which was due to additional commitments to the University by way of Directorship of a Management Institute (between June 2005 and April 2006) with attendant responsibilities on numerous high level Committees of the University and other Institutions. Despite more than a decade of active interaction with the industry, there have been a lot of new lessons learnt. For a teacher and researcher like me, the learning goes on. (S.Sriraman) Walchand Hirachand Professor of Transport Economics, Department of Economics, University of Mumbai, Mumbai 400098. September 8, 2006
4

ABBREVIATIONS
ACCC Australian Competition and Consumer Commission AITD Asian Institute of Transport Development AMH Association of Malaysian Hauliers AP Andhra Pradesh BGTA Bombay Goods Transport Association BRS British Road Services BTC British Transport Commission BTKM Billions Tonne Kilometers CHAM Containers Hauliers Association of Malaysia CIRT Central Institute for Road Transport CONCOR Container Corporation of India CVLB Commercial Vehicle Licensing Board DGIR Director General of Investigation and Registration FTC Federal Trade Commission FTL Full Truck Load GDP Gross Domestic Product GOI Government of India GVW Gross Vehicle Weight HGV Heavy Goods Vehicle ICC Interstate Commerce Commission IHM&W Indiana Household Movers and Warehousemen, Inc. IRHA Irish Road Haulage Association ITA Intelligent Transport Systems JNPT Jawaharlal Nehru Port Trust KFTC Korean Fair Trade Commission LTL Less than Truck Load MET Ministry of Entrepreneur Development MIDC Maharashtra Industrial Development Corporation MMRDA Mumbai Metropolitan Region Development Authority MOT Ministry of Transport MOW Ministry of Works MRFTA Monopoly Regulation and Fair Trade Act MRTP Monopolies and Restrictive Trade Practices MRTPC Monopolies and Restrictive Trade Practices Commission MV (Act) Motor Vehicles Act NAFTA North Atlantic Free Trade Association NCA Norwegian Competition Authority
5
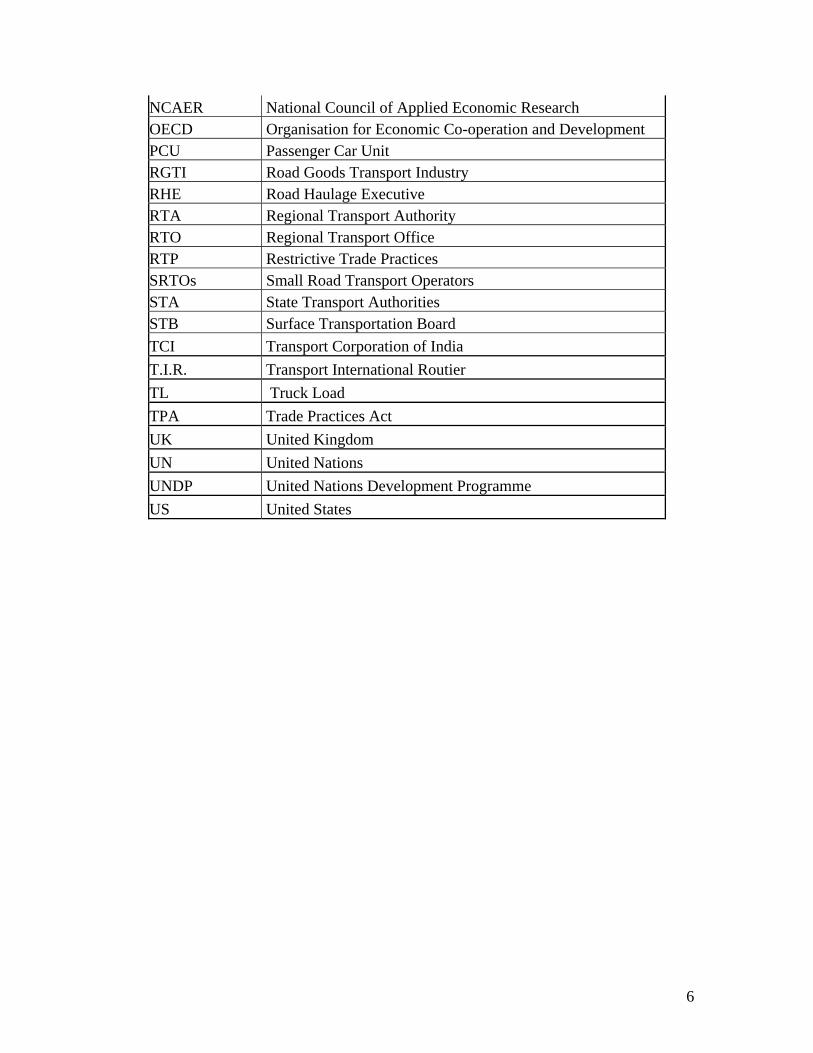
NCAER National Council of Applied Economic Research OECD Organisation for Economic Co-operation and Development PCU Passenger Car Unit RGTI Road Goods Transport Industry RHE Road Haulage Executive RTA Regional Transport Authority RTO Regional Transport Office RTP Restrictive Trade Practices SRTOs Small Road Transport Operators STA State Transport Authorities STB Surface Transportation Board TCI Transport Corporation of India T.I.R. Transport International Routier TL Truck Load TPA Trade Practices Act UK United Kingdom UN United Nations UNDP United Nations Development Programme US United States
6

CONTENTS
SECTIONS Page
1. Introduction 8
2. Insights from Literature and Case-Studies / Laws 15
Part I Competition and Regulation: An Overview 15
Part II International Insights, National Insights, Our Remarks 20
Part III Case Studies/ Case Laws: International, National
35
3. Freight Rates, Operator Costs and Industry Profitability 49
Part I Analysis of Freight Rates 50
Part II Analysis of Operator Costs 56
4. The Industry - Its Structure, Market Surveys and Analysis 63
Part I The Industry Structure: the Market Players 63
Part II Market Surveys and Analysis 70 Part III The Competition Act, 2002 and the Findings of the Study 88 5. Effects of Policy and Regulatory Regimes on Competitiveness of the Industry
93 6. Competition Advocacy Measures and Initiatives 99
Bibliography 110
ANNEXURES I - VI
I Format of the Model of Costs of Operations of a Truck- An Example 118
II A Case Study of Trucking Operations in Satara 119
III A Case Study of Trucking Operations in Goa 122
IV Information Exchanges 125
V Data Issues 135
VI List of People / Parties contacted 137
7

SECTION 1
Introduction
Background
The Road Goods Transport Industry (RGTI) (the terms RGTI/ trucking
industry/trucking sector have been used interchangeably) has played a pivotal role in
trade and commerce in India especially in the past few decades. Its rising share in relation
to the railways is an indication of its popularity. A recent study (Deloitte, 2003) observed
that the share of the road made in total freight movement has been increasing over the
past 3 decades – the share having been estimated to have increased from 34.5 per cent in
1970-71 to around 63 per cent in 2001-02. During the period 1991-92 to 1998-99, road
freight is supposed to have grown at a compounded annual growth rate of 11.9 per cent
while rail freight movement grew only at about 1.5 per cent. However, in the past few
years, the shift to road transport has been slower with the road share having only
increased gradually from 59 per cent in 1995-96 to 63 per cent in 2001-02- indicating a
slowdown in the growth of road transport market share over the rail share. However, it is
expected that this share would go up, albeit gradually, to stabilize around 85 per cent.
Though emerging as a dominant mode, the industry has not been able to emerge out
of the traditional unorganized framework, being as it is (still) dispersed in terms of a large
number of small operators. In other words, the dominant feature even today is that a
significant part of the road fleet is under Small Road Transport Operators (SRTOs).
According to a study conducted in the late 1990s (AITD, 1999), almost 77 per cent of the
fleet was under operators who owned up to a maximum of 5 trucks while about 10 per
cent was under those who owned between 6 to 10 trucks. Further, 4 per cent were under
those owning 11 and 15 vehicles while 3 per cent belonged to truckers with 16 to 20
trucks. Only about 6 per cent of the vehicles were with operators owning more than 20
trucks. The situation has, no doubt, been changing when we compare the situation in the
early 1990s when it was claimed that 95 per cent of the vehicles belonged to those
operators who had less than 5 vehicles (UN Mission, 1993).
8

The large number of operators constituting a fairly large unorganized proportion of
the Industry (in terms of supply) has been traditionally the result of lower capital
requirements, ease of obtaining truck driving licenses and permits, low mental skills as
compared to physical abilities and easy availability of freight. The organised component
of the industry consisting of the fleet operators is small in number and has a fleet with
varying payloads. The fleet is primarily used for general goods transportation with the
operators working on the basis of a hub and spoke distribution model.
The unique ownership profile in the industry has created middlemen who act as
liaison agents for small trucking operators who do not have the geographical reach to tap
business on a continuous basis and hence are forced to rely on these middlemen. With
transportation companies (big fleet operators) gradually moving from an asset based to a
non asset based model, it is widely recognized that dependence of small fleet operators
and small operators on brokers is expected continue to have an impact on the physical as
well as the financial performance of these operators.
Profitability of truck operations depends on the following factors:
a) Capacity Utilisation
b) Freight Trips
c) Fuel Prices
d) Other Operating Costs
In order to maximize their profitability, truck operators can:
1. Increase their revenue by overloading the vehicles in general
2. Maintain a suitable vehicle mix according to payload capacity of the vehicles, based
on the freight availability, type of freight carried and long term contracts with customers.
In recent years, freight movement by road has not kept up with BTKM (Billion
Tonne Kilometers) capacity – leading to lower capacity utilisation. For example the
9

average capacity utilisation has gone down from nearly 64 per cent in 1993-94 to 57
percent in 2001-02 (see Figure 1).
Figure 1: BTKM Capacity Vs Freight Movement
0100200300400500600700800900
1000
90-91
91-92
92-93
93-94
94-95
95-96
96-97
97-98
98-99
99-00
00-01
00-02
BTK
M
52.00
54.00
56.00
58.00
60.00
62.00
64.00
per c
ent
BTKM Capacity(BTKM)
Freightmovement byroad (BTKM)
Averagecapacityutilisation (percent)
Source: Deloitte Study (2003)
This has affected the profitability of operators. Further, the average freight rate
(Rs/ Tonne) has gone up only marginally from Rs 1267 to 1395 over the period 1995-96
to 2001-02. Combined with about a three-fold increase in the diesel price, inability of the
operators to shift these cost to customers, the profitability has declined significantly.
Between 1995-96 and 2001-02 the average profit (Rs/ Tonne Km) has gone down from
0.40 to less than 0.20.
Issues
Though emerging as a dominant mode the road goods transport sector has, it is
observed, hardly been able to emerge out of the traditional unorganized framework over a
period of time. Earlier studies (NCAER, 1979) have observed that due to intense
competition, profitability was rather low in the case of small truck operator. Accordingly,
it has been a widespread feeling that the market structure of the industry in terms of the
supply of services is very highly competitive. {In fact, such a structure, it has always
been felt, has resulted in viability of operations being a persistent problem. But the
10

National Transport Policy Committee (GOI, 1980) contested this point. In fact, Sriraman
et.al. (1998) had observed that non-viability was not an issue since exit was possible and
that supply of services had, in reality, increased}. But in the case of fleet owners the
return is considered satisfactory mainly due to economies of scale and certain other
advantages. However, we have noted earlier that profitability has been declining in the
past decade due to a variety of factors including falling capacity utilisation, rising price of
diesel etc. On the other hand, freight rates have gone up very gradually.
Given the dominance of small operators, it is natural to expect a competitive
regime to prevail. However, given the segmentation of the industry in terms of market
players and market makers, it has been an emerging feeling that this is a sector, which is
prone to be dominated by some of the players and makers. In the general goods market,
the market is observed to be competitive with each player having a certain well-defined
role and being compensated for playing that role effectively. However, in the case of
specialized traffic like movement of petroleum products, routine contractual traffic (big
ones), it is most likely that there is absence of competition. For example, in the case of
petroleum products it is most likely that the buyers of services are basically monopsonists
– single buyers faced with number of sellers of services. Given that there are only three
or four such monopsonists in the country, the result might well be a price far removed
from that in a competitive market even in the absence of cartelisation. Initial observations
reveal that even in this segment a dominant influence can be exercised at two levels- one
at the level of purchase of services where the monopsonists deals with the fleet operators
and second – at the operating level where the fleet owner deals with the smaller operators
who are involved in significant movements in their specialized vehicles. This argument
can perhaps be extended to manufactured items like chemicals, pharmaceuticals, which
are supplied in bulk all over the country. Even in the case of general freight where the
small operators dominate (in terms of numbers), it is recognised that the role of the
middlemen is crucial in price fixation as well as in allocation of quantum of movement as
far as the small operators are concerned. In other words, it has been an evolving feeling
that a significant part of the sector may not be really operating within a competitive
market structure as is normally thought out to be. It is against this background that we felt
the need for a detailed study on possible anticompetitive practices in the RGTI in India.
11

Objectives of the Study
1. To examine the supposedly competitive nature of the market for general road goods
transport services with a view to examining the role of the different players in the
industry in fixation of tariffs.
2. To examine the possible use of supply/ area restrictions by the different players to
derive some benefit.
3. To look at the possibilities of a limited but possible dominating role in price fixation
of the supplier of bulk services such as the fleet operator in the context of subcontracting
orders to smaller operators to handle a part of the movement.
4. To examine the role of bulk buyers of road goods transport services especially
specialized services in the fixation of prices.
Methodology of the Study
To begin with, it was perceived necessary to look at the existing literature dealing
with the RGTI, in general, and with the issues being examined, in particular. Given the
enormity of the problem at hand, it was accordingly decided to undertake a limited but
focused review, which would keep in view the need for an international as well as a
national perspective.
Literature at the international level almost exclusively talked about the impact of
the deregulatory process in different situations most appropriately reflected in a
competitive price regime hitherto not observed under a system of regulation whose
objective is to ensure ‘efficiency’ in the use of scarce resources. The review at the
national level provided a more definite basis in terms of some useful insights for further
conduct of the study in terms of elements of the framework that need to be examined.
Since a basic objective of the study was to examine the issue of tariffs and their
fixation on a competitive basis, it was felt necessary to understand the movements in
freight rates over a period of time from 2002 with a focus on some point-to-point
movements between Mumbai and other metropolitan areas in the country. A weekly
average gives us a good picture of the fluctuations in freight rates. We have attempted to
examine these closely with a view to tracing the immediate impact of changes in fuel
12
costs on rates. This exercise was also undertaken with a view to examine the nature of
returns of the operators given that they are engaged in different routes (different
distances) with varying loads (as permitted by law and more - of their own accord). To do
this, a simple analytical model of costs of trucking operations in EXCEL format was
developed. This model looks into the various cost components of fixed and variable
categories and has provided the basis for a simulation exercise which takes into to
account the varying loads, the distances undertaken, the fuel costs, the capital costs, the
repayment issue, etc.
Intensive surveys have been carried out right from the inception of the study. More
than a hundred and fifty players including operators (small and fleet), brokers, booking
agents (transport companies) and some users have been interviewed – mostly in the
Mumbai Metropolitan Region and to a very small extent in Goa and Satara. It is on the
basis of a detailed analysis of the data and the information collected from the surveys that
we have attempted to look at the role of each player in terms of the areas of operations,
the nature of the market, the degree of competition. This has enabled us to delineate
different models that reflect the presence or absence of competition in the different
markets constituting the trucking industry. Such a description and the resulting analysis
has enabled us to provide some guidelines for competition advocacy from the point of
view of the policy framework as well as the regulatory framework, which are in place but
which may require some changes to prevent anticompetitive practices from being
sustained.
Scheme of the Report
Having provided the backdrop in Section I, we proceed to review the relevant
literature in Section II. In Part I of this Section, we begin with an overview of
competition issues and the traditional approach to these in the form of a regulatory
framework and its implications over a period of time. As suggested earlier, though this
may not be all relevant, we attempt (in Part II ) to draw insights from the deregulatory
process that has been in motion for quite some time in a number of countries with a focus
on its impact on the market structure. Further, the organizational structures in the context
of some of these countries have been examined, as it can be relevant in determining the
13

market structure. Also included in this Part is a review of work done on theses issues in
the past in the Indian context. The objective was to understand the evolving market
structure and also the policy framework especially in regard to some of the dimensions
such as legislation, taxation and the regulatory framework within which the industry has
grown. In Part III, we attempt a description of some case laws / studies, both at the
international and national levels relating to competition issues in the RGTI. Section 3
looks at the freight rates between certain Metropolitan Cities in India over the past four
years or so and analyses their movements in relation to the cost of trucking operations. In
Section 4, we present, in Part I, the structure of the industry in terms of the various
players and their role or otherwise in attempting to fix tariffs which could be deviations
from the competitive benchmark price as a result of their preeminence. In Part II, this so-
called dominant role is analysed in terms of areas of operations some of which are
exclusive domains of some of the different players who may be large thereby enabling, at
least in some cases, the possibility of anticompetitive pricing possibilities. Further in Part
III, we attempt to understand the issues relating to the study within the framework of
provisions of the Competition Act, 2002. Section 5 examines the regulatory and policy
frameworks from the point of view of their effects on competitiveness of the industry and
finally in Section 6, an attempt is made to provide some guidelines for competition
advocacy measures and initiatives on the part of the Government, which need to be
initiated for more effective competition in the industry.
14
SECTION 2
Insights from Literature and Case-Studies / Laws
In Part I of this Section, an overview of the literature related to issues in
competition and regulation is attempted. In Part II, to begin with, the literature pertaining
to various international scenarios particularly relating to the RGTI is examined. The rest
of Part II of the Section looks at literature pertaining to the industry in the Indian context
and our own remarks. Finally, in Part III, we attempt to provide, rather sketchily, a
description of some cases both at the national and international levels, relating to
competition issues that have been handled in the past by the relevant competition
authorities.
Part I
Competition and Regulation: An Overview
Theory suggests that prices and quantities in a competitive market will equilibrate
to a level that generate efficient outcomes at any given point of time, given that there are
no governmental interventions, asymmetries of information, impediments to the entry and
exit of firms or anticompetitive practices by a firm. In such a situation, the price that
consumers pay for a good will be equal to the marginal costs relating to the last unit of
good produced by the firm. Given the magnitude of market, competition is beneficial
because it gives the consumers a wide choice and attempts to provide sellers with strong
incentives to keep costs to a minimum. There is also the likelihood that cost savings will
be passed on to the customers who may be either final consumers or those using the
product as inputs. There is ample empirical evidence that supports these arguments
(ADB, 2005). Yet competition is not automatic and is not the same as laissez faire.
According to Anderson and Jenny (2005) there are reasons to believe that less mature
markets tend to be more, rather than less, vulnerable to anticompetitive practices than the
markets of developed countries. The reasons obviously include high entry barriers such
15

as intrusive regulatory regimes, asymmetries of information, non-tradable nature of
markets, etc.
For maximum efficiency gains to accrue to any economy, new and efficient firms
must be able to enter the market with relative ease while forcing old and less-efficient
ones to upgrade or quit. In such a dynamic context, firms need to constantly innovate and
adapt quickly to the changing environment thus creating dynamic efficiency. Competition
also serves to diffuse socioeconomic power, broadening participation in economic, social
and political advances while ensuring opportunities for new entrepreneurs. It also can
facilitate in the realisation of benefits for the domestic economy of integrating into
international trade and investment patterns.
When markets are not competitive, whether due to policy-induced distortions,
technological characteristics or anticompetitive behaviour on the part of market players,
an economy can miss out on many potential benefits. Equally well, government
regulation efforts that are intended to take care of consumer interests’ result in just the
opposite of what was intended to be achieved.
Different kinds of market structure frameworks operate in the different sectors.
They range from highly fragmented markets to natural monopolies or oligopolistic
markets. Examples of fragmented services include restaurants, retailing and road
transport while communication and railways fall under the latter category. The
fragmented sectors are characterized by monopolistic competition, the nature of which
can be influenced by government regulations, or rules imposed by concerned professional
associations.
Hoj et.al. (1995) argue that the traditional rationale for government intervention
and regulation is largely related to market failures. Market conduct of firms can be
regulated if there are significant externalities or if governments believe that there is a
need to control some industries to stabilize economy wide developments in prices or
employment. Also, the high information content in a product makes it possible for
16
information asymmetries to arise. Thus to ensure smooth functioning of markets,
governments may impose standards and other requirements on the provision of product
information by suppliers. Further, it is observed that the trend of regulatory policy has
shifted towards deregulation over the past two decades with an increasing emphasis on
promoting competition. This trend appears to have taken place taking cognizance of the
fact that traditional regulatory instruments have resulted in serious efficiency losses. Such
losses result either from regulations that restrict entry, thereby reducing output and
increasing costs. Also, globalisation of economies is forcing various countries to adapt
and adjust to changing circumstances.
A main objective of recently evolving regulatory mechanisms has been to restrict
the formation of cartels. Png (2001) defines cartels as agreements to restrain competition.
A seller cartel is an agreement among sellers to restrain competition in supply, while a
buyer cartel is an agreement among buyers to restrain competition in demand. A seller
cartel sets a maximum sales quota for each participant. By limiting each participant’s
sales, the cartel restricts the quantity supplied and raises sellers’ profit above the
competitive level. The more effectively the cartel suppresses competition; the closer will
its profits be to the monopoly level. A seller cartel restrains sales to raise the market price
above competitive level. The higher the price, however, the more attractive will it be for
an individual seller to sell more than its quota, thereby raising the supply and reducing
the price. So, to be effective, a cartel must have some way to compel each participant to
abide by the quota. If a cartel succeeds in raising the price above the competitive level, it
will attract new sellers to enter the market. Hence, another issue for a cartel is how to
keep out new entrants. Therefore, the main requirement for a cartel to function effectively
is enforcement against existing sellers exceeding their quotas and against the entry of
new competitors. The legal systems of most countries attempt to ensure against the
formation of cartels. Thus, cartels that are not legal must rely on private enforcement.
This in turn depends upon a number of factors, particularly the number of sellers in the
market. A cartel would be more effective in a market with few sellers than in a
fragmented market.
17

Competition Issues in the Road Goods Transport Industry
Road transport is undeniably the most dominant mode of transport in countries all
over the world today. Over the past fifty years or so, growth in road transport has
accounted for virtually all of the growth in land-based transport modes. Road transport
competes with other transport modes but the extent to which transport modes are
substitutes in any given case has depended on a number of factors such as the type of,
say, goods to be transported, the distances involved, the importance of timeliness, the
level of charges for infrastructure use, and so on.
It is conventional to divide the road transport sector into two, largely unrelated
parts- the road goods industry and the road passenger industry. We focus on the road
goods industry, which basically consists of transportation by road of goods between
economic enterprises and between enterprises and consumers, including the
transportation of bulk goods and goods requiring special handling, such as refrigerated
goods and dangerous goods. This industry merges, at its boundary, with the parcel service
industry. It is also conventional to make a distinction between the market for self-
provided transport services and the market for transport services for hire or for reward.
The latter market is the focus of our study.
The provision of road transport services, like all other transport modes, requires two
complementary inputs – infrastructure and vehicles that make use of the infrastructure. In
the case of the roads, the infrastructure consists of the network of roads. Traditionally, the
ownership and operation of the road infrastructure has always been separated from the
ownership and operation of vehicles, which use that infrastructure. This has often raised
questions relating to proper charges for use of the infrastructure becomes important when
considering the nature and extent of inter-modal competition.
Like other transport modes, the operation of vehicles over the road infrastructure
creates risks and nuisances for other vehicles, pedestrians, local residents and the
environment. The control of suck risks and nuisances comes under the domain of safety
18

and environmental regulations. But historically, there have been economic regulations,
which have been impediments on the conditions for entry, exit, prices, services and
ownership resulting in efficiency losses.
The scope for effective competition, and correspondingly, the need for regulation
differ significantly between sub sectors in the system. Given that economies of scale are
low, there are virtually no sunk costs and that there are hardly problems of coordination,
the road goods transport industry comes closest to lacking any structural barrier to
competition or being virtually contestable (Kessides, 1993). However, the industry in
many countries has traditionally been a heavily regulated one, often as a device for
protecting the rail industry. Regulation here refers to “economic regulation” which
means control over pricing and entry, replacing competitive forces. In recent decades
especially the 1970’s academic economists questioned the rationale for regulation of the
motor carrier industry. Their basic tenet was that the industry did not exhibit a natural
monopoly type of market structure; rather there were repeated findings of constant
returns to scale for the overall industry. They further argued that regulation itself had led
to various economic inefficiencies that resulted in higher costs of providing truck services
(Friedlaender and Spady, 1981). Deregulation of the tucking industry was predicted to
increase competition, lower costs and thus rates, benefiting shippers. Thomas Moore
(1995) claimed that the major beneficiaries of trucking regulation were the trucking firms
themselves who earned large profits under regulation, and unionized labor, which was
able to extract wages almost, double those available in jobs of similar skills elsewhere in
the economy. As a result, many countries liberalized their road goods market following
which very few controls on prices, services or quantities remain. We now turn to a more
detailed account of the effects of deregulation of the road goods transport industry in
some countries as well as in India.
19
Part II
International Insights
Smith (1995) studied the deregulation of trucking in the U.K. As per the Transport
Act, 1947, the British Transport Commission (BTC) was set to co-ordinate the
development of a nationally integrated transport network. This intention was pursued
until 1979, but at the expense of productive efficiency in road freight movements. All
land transport was controlled by the BTC through four executives. The Road Haulage
Executive (RHE) was responsible for road haulage activities and traded as British Road
Services (BRS). Nationalisation of such a fragmented industry proved difficult, and it
was possible to nationalise only long distance hauliers. Private hauliers were limited to a
radius of 25 miles. At the end of 1951, when the final take-overs were completed, BRS
had acquired over 3,700 firms, owned some 41,000 vehicles, based on 1,000 depots, and
employed over 75,000 people. BRS’s monopoly was consolidated by BTC’s control over
the issuing of new licences to competitors. Subsequent legislations moved, albeit slowly,
towards deregulation. However, the legislation, which ushered in deregulation, was the
1968 Transport Act. The Act created a system of licensing (quality licensing), and
removed the restrictions on numbers of vehicles which could carry freight unless vehicles
were carrying the company’s own goods (own account), in which case the company had
to have a permit. Under the new system, anyone operating Heavy Goods Vehicles (HGV)
was required to hold an operator’s license (O license) - a license granted by the Traffic
Commissioner to those of good repute. In order to operate, firms have to show that they
have sufficient financial standing and resources to maintain vehicles. The system
therefore changed from quantity to qualitative regulation in terms of promise to promote
reasonable business standards thus lowering barriers to entry to the industry. Ultimately
in 1982, the National Freight Corporation, U.K’s largest freight company was privatized
by means of an employee buyout thereby effectively completing the deregulation and
privatization in U.K. freight. There is current dominance of common carriers, which have
been successful in offering attractive services to customers.
20
Yamauchi (1995) studied trucking operations in Japan. The Road Transport Law
had regulated the trucking industry in Japan until the end of 1990, when the new laws
covering freight transport came into effect. The purpose of the new laws was to relax the
trucking regulation.. The new version of the law provided the license system of new
entries and approval system of rates and this authority was basically in the hands of the
Ministry of Transport (MOT). The Road Transport Law had in the fifties centralized the
decision-making authority, and the regulation of road transport was carried out based on
this version until the end of 1990. The Road Transport Law provided that new entries
could be licensed only if the balance of supply and demand in that market would not be
disturbed by those entries. In the trucking industry, it was possible for new operators to
enter into that market if it could prove that there was a demand for their service The new
laws pertaining to road freight movements in Japan are the Motor-Truck Transport
Business Law and the Freight Forwarding Business Law. The former provides new
regulation of the trucking business, and the latter deals with freight forwarders. The most
important feature of the Motor-truck Transport Business Law was the relaxation of
regulations of entry and price setting; that is, the so-called reform of economic
regulations. Under the Road Transport Law, no one could begin to operate a trucking
business without a license, and the law provides the standard on which the regulator
judged whether or not a license should be issued. Of these standards for new licenses, the
most important and the most influential standard was the so-called supply-demand
balancing clause. This clause said that a new license could be issued if and only if the
balance of supply and demand in the market would not be disturbed by the new entry.
This is a quantitative control of supply. One point at issue is that the new law has a
safeguard clause for excessive supply. Under this clause, regulators can sustain
operational permission, in case supply of truck services is judged to be very excessive.
With respect to fares and charges, the new law changed the regulation from an approval
system to a filing system.
Deregulation of non-urban buses and trucking in Chile was implemented during the
1970s as part of a series of measures taken in response to the economic crisis that the
country was facing at that time. It is therefore difficult to distinguish changes in transport
21

attributable to the deregulation measures themselves from changes attributable to broader
economic or policy changes. Previously the transport sector was heavily regulated. This
resulted in a multitude of government- approved local trucking associations, whose
members were small truck operators, who were allowed to monopolise local freight
markets and were subject to tariff controls. The import of trucks was restricted in order to
support a local truck manufacturing venture supported by the government. Trucking
deregulation in 1975 freed tariffs and allowed entry into the business without having
approval from the government or membership of any particular trucking association.
Simultaneously, the government the importation of truck which, combined with other
economic reform, contributed to a sharp increase in the number of truck operator, often
financed by foreign credit. An economic crisis in 1982 had disastrous effects on the
trucking sector. Rates fell and the government had to intervene to help repay foreign
loans. In subsequent years, the traditional small operators with one truck have been
replaced to some extent by trucking companies who offered specialised services. Despite
financial problems of the past, the trucking industry remains profitable. This was
especially true of the larger companies. For deregulation to be sustainable, it was
suggested in the early nineties that the government should develop antimonopoly controls
to prevent collusion between operators and predatory action by financially strong
operators (Carbajao, 1993).
Thompson (2000) reviewed the U.S. regulation of the trucking sector and its
subsequent deregulation. The Motor Carriers Act of 1935 effected regulation in U.S.
trucking. The main objective of this Act was to restrain competition and regulate rates.
For instance, common carriers had to operate under a certificate of public convenience
and necessity (referred to as “grandfather clause”) and charge “just and reasonable”
published rates. The stability of membership and lack of free entry created huge
economic rents, which made trucking, certificates a finance able commodity. However,
an interesting point to be noted is that “Exempt” services, which were by and large
outside the purview of regulation constituted about 60 per cent of intercity traffic. The
main proponents of this Act were large truckers and the Interstate Commerce
Commission while the opponents were larger shippers and smaller truck operators. The
22
author pointed out that ironically the trucking sector did not suffer as much as perhaps
expected from the regulatory mechanism because the competing mode, viz. railroads,
were subject to tighter regulation and hence there was no “crisis” to change the regulatory
mechanism at least in trucking. The year 1980 proved to be a landmark year as far as
transport deregulation in the U.S. was concerned. The Motor Carriers Act, 1980 marked
the deregulation of U.S. trucking. The Act deregulated entry into the trucking market,
rates to be set and replaced regulatory controls by antitrust provisions. Deregulation
yielded interesting results for the trucking market. Physical output was at an all time high
as was net income. Initially, several firms had to close down due to financial failures but
over time, the number of carriers doubled since 1980. Also, there was an increase in the
average hourly trucking earnings. It has been estimated by Winston et.al. (1990) that the
economy benefited to the extent of about $8.1 billion from trucking deregulation, of
which $3 billion is in reduced private carriage costs, $4.3 billion is in lower rates to
shippers (primarily in the LTL area), and the value of better service is about $0.8 billion.
Dutz et.al. (2000) analyzed the deregulation of trucking operations in Mexico.
Since the 1940s, trucking operations in Mexico were regulated. However, the regulatory
framework was seriously implemented only with effect from 1977. It is interesting to
note that the rationale for regulation in Mexico was provision of reliable transport
services and effective utilization of transport infrastructure. It was believed that
competition would introduce unnecessary price and service variations and also
encourages sub-optimal cost cutting behaviour thereby affecting safety and non-
adherence of environmental standards. The study, however notices that the main reason
for regulation was to protect the interests of the few family owned businesses involved in
trucking. Market power emerged, not necessarily from the ownership of trucks but from
the control of freight terminals. Contrary to regulatory regimes studied earlier, trucking in
Mexico was not subject to restrictions on vehicle weight and vehicle dimensions, vehicle
safety or emissions. Since transport undertakings were exempt from taxation, there was a
perverse incentive for manufacturers to start trucking services to evade corporate
taxation. Also, there was restriction on entry in that any new operator, in order to get a
concession from the central regulatory authority, had to tie up with an existing company,
23

which obviously was far from straight forward. This in turn led to strengthening of
existing firms and formation of cartels. Deregulation of trucking movements in Mexico
was a direct offshoot of the trade liberalization in 1989, after Mexico joined the North
Atlantic Free Trade Association (NAFTA). Deregulation was carried out in three stages.
The first stage involved evolving a draft proposal by a select group without consulting
key stakeholders. Garnering of support for deregulation from the national trucking
association followed this. The second stage involved elimination of most entry
restrictions thereby abandoning the “public service” notion for trucking that was behind
the concept that truck operators require concessions. The third stage involved removal of
pricing restrictions; particularly tariff ceilings and truck operators were free to negotiate
freight rates with customers. Deregulation had several favourable impacts- there was an
increase in output and hence, a reduction in price. There was increase in productivity
levels of trucking firms and there were new entrants due to relative ease of entry. There
was favourable impact on industries’ performance where transport was an input. It is
estimated that the cost of regulation was 0.5 per cent of the Gross Domestic Product
(GDP). Certain interesting features emerge from Mexico’s deregulation experience.
Successful reforms require high-level political support. For instance, the deregulation of
trucking took place in Mexico took place by means of presidential decree. Secondly,
reforms need to be packaged effectively to gain acceptance among key stakeholders. In
Mexico, the reforms were projected as means to modernize trucking operations without
any reference to oligopoly or competition. Though it is a debatable policy measure,
particularly from the ethical standpoint, it has proved to be highly successful in Mexico.
Thirdly, it is important to be aware of the right time for discussion of reforms with
stakeholders. Only after the draft proposal was formulated, were the stakeholders
consulted else, the whole process could have been derailed right at the outset. Also, the
reform processes could take time to yield the desired results due to the inertia prevailing
in the system. For instance, in Mexico, since various operators were used to formation of
cartels and other such anti-competitive practices during the regulatory regime, they had a
tendency to resist competition even when the policy framework encouraged the same.
Hence, competition was attempted to be subverted by means of inter-company
24

agreements. Thus, one needs to be patient while studying the results of deregulation,
especially in economies with high degree of controls.
According to OECD (2001), road freight regulation in Australia took the form of
reservations of specific freights to rail transport. Pockets of economic regulation in the
form of operator licensing for road freight operators existed but were not universal. After
the 70s, the Government moved to deregulate the industries. Almost all the regulations
have now been removed. However, there have been concerns about the safety
performance of road freight operators particularly in relation to long distance services.
These concerns have been based on suggestions that returns in the long distance sectors
are so small as to provide significant incentives to operators to violate safety and
infrastructure protection regulations such as controls on speed, driving hours, etc. As a
result there have been suggestions within industry to introduce economic regulation in the
form of operators licensing or accreditation systems that place controls on industry entry
and rate protection, in order to improve safety performance. Currently, a firm wishing to
provide road freight services is not subject to any specific regulation other than those
applying to all businesses and safety and infrastructure protection standards applying to
the design and operation of heavy vehicles. No license is required to operate road freight
services. No price controls apply to these services.
According to Lee (2002), in Malaysia competitive regulation in most sectors (
except energy and telecommunications) has traditionally been undertaken at the sectoral
level via control over prices and entry conditions (for example, permits and licenses).
Competition in the transport sector is affected by regulations imposed under the three
ministries, namely, the Ministry of Transport (MOT), the Ministry of Works (MOW) and
the Ministry of Entrepreneur Development (MET). Overall, the MOT is the sector
regulator and concentrates on transport infrastructure development (other than roads and
highways) and their regulation. For example, the Ministry sets port tariffs and airport
tariffs. The MOW is responsible for regulating roads and highways including private
sector roads. The entry conditions in private commercial vehicle markets are controlled
by the MOW via the Commercial Vehicle Licensing Board, which is responsible for issue
of licenses in these markets. Most of these controls are subservient to socio-economic
25

objectives other than promoting the process of competition in markets. Due to the
absence of formal competition in these sectors, regulators either do not recognize or often
do not know how to deal with competition related problems. Most of the prominent
related cases in recent years have occurred in commercial vehicle markets such as the
truck (haulage) industry.
Arrunada et.al. (2004) have studied the organizational structure of both the
European and American trucking markets. It is observed that as opposed to their U.S.
counterparts, the European trucking industry comprises mainly of owner operators, i.e.
independent contractors who own and drive their own trucks. The average number of
employees appointed by a U.S. truck operator is 14.7 while that of the European truck
operator is only 3.9. Using a regression model to analyze ownership, they dispel the
popularly held notion that differences in technology and transaction costs are two
possible reasons for the difference in ownership pattern and conclude that difference in
institutional environments, especially labour and tax laws, provide the most likely
explanation for disparity in ownership patterns. These variables, the authors suggest,
could act as “shift parameters” that affect the relative forms of governance in a way that
cause similar transactions to be organized differently. Also, carriers are more likely to
own their trucks if there are important hold-up problems related to the existence of
specific assets and when monitoring drivers is relatively easy. Since conventional
economic theory links integration to reaping the benefits of economies of scale, the
authors believe that removal of institutional impediments is likely to facilitate integration
of fleet.
National Insights
The RGTI in India has been, in the past, the subject matter of many High-Powered
Committees most of which examined issues relating to the regulation of the industry with
taxation being an important element for consideration and discussion. It is only during the
past three decades that specialized studies on the industry were taken up with a view to
examine its operations in a more comprehensive way. These have included issues relating
to fixation of rates and the competitive nature of the market of the industry. We now
26

attempt to briefly review the Committee reports and the specialized studies with a view to
deriving some guidelines for the specific purpose of our study.
Among the earliest reports were those of the Mitchell- Kirkness Committee (GOI,
1932) and the Wedgewood Committee (GOI, 1932). The recommendations of these
Committees provided the basis for a framework of regulation in the form of the Motor
Vehicle Act (MV Act) of 1939 which has been amended significantly in 1956, 1969
and in 1988. This Act attempted to create machinery for the administration and control
of road transport in the country at the State level since the executive responsibility for
road transport vests with the States under provision to Article 73 (1) of the constitution of
India read with entry 35 in the Concurrent List (list III) of the seventh Schedule. While
safety regulations were inherent, there were elements that tried to take care of the
competition between road and rail. To begin with, road movement was to be confined to
parts of a State with some relaxation coming later in the form of zonal permits. However,
by the late 1960s, given the inability of the railways to handle movements, the process
was set in motion to permit national movements. It has always been a debatable point as
to whether the initial restriction on movement was to ensure that the railways were
protected or it was on the basis of a consideration of the resource costs of movement
which indicated that road movement must be confined to short distances. Under Section
67 of the MV Act, 1988 (earlier Section 43 (i) (i) of the MV Act of 1939 as amended in
1956), State governments may issue directives to the State Transport Authority and
Regional Transport Authority regarding the fixing of freight rates including maximum
and minimum thereof.
Among the first of the Committees set up after Independence was the Motor
Vehicle Taxation Enquiry Committee (GOI, 1950). With its focus on the taxation part,
its general conclusion “is that the present taxation policies of the central and State
Governments do not conform with their overall policy of developing road transport as a
national enterprise” (p.127). But their observation that the permit system for goods
carriers that is based on merit would not really prove to result in competition to the
railways which were already beginning to show signs of strains in handling the
27

requirements. As for fixation of minimum tariffs as provided by the MV Act of 1939, the
Committee did not across any example of a minimum freight rate having been fixed.
“The difficulty lies in enforcement as payment of less than the minimum fares or freight
could generally be detected with the assistance of agent provocateurs a method of
detection that must be repugnant to any democratic government” (P.41). Again, the fixing
of minimum rates would appear to partake of undue interference with the market
mechanism in terms of the private sector trying to establish new routes and services. The
Taxation Enquiry Committee (GOI, 1953) had a limited role in the context of the
transport sector but went into the aspect of financing of road development in detail
besides advocating statutory regulation of all intermediaries in the roads goods transport
industry. This latter aspect has been the subject matter of almost all the studies
undertaken later. Needless to say, while some regulatory provision was made, it has not
been implemented. The Road Transport Reorganisation Committee (GOI, 1958) was
concerned with the administrative machinery for regulation and control of motor
transport in the States. However, to the extent that it looked at the permit system it
provided useful guidelines on the issue of permits and its expected impact on competition
within the sector and with the other modes especially the railways. In the early sixties,
the Committee on Transport Policy and Coordination (GOI, 1966) was set up to
formulate a long-term transport policy for the country with a focus on the need for
coordination and accordingly regulation of the different modes of transport. In regard to
the road transport sector, the Committee was of the firm view that existing regulatory
framework “has failed to secure the development of the industry along sound and
efficient lines, or to achieve proper coordination between rail and road transport. Instead,
it has provided the basis for a restrictive and unintegrated approach to the development of
road transport” (p. 203). The issue was: whether there was too much regulation or very
little? From the Committee’s recommendations, it appeared that the framework was
inadequate either in its provision or in its implementation. Accordingly, one
recommendation was that State governments should specify minimum freight rates,
which could be sought to be enforced by associations of goods carriers. Their idea of a
minimum rate was to take into account the objective of rail- road coordination. This is an
aspect, which needs serious consideration, but from an altogether different perspective
28

even in the present time when operators there have told us they are in favour of a
minimum freight rate. However, other important recommendations useful from our
viewpoint relate to reorganisation of the industry in terms of viable units and to provision
of legislation for formation of associations with specific functions and responsibilities
which included among many others an important role to provide booking and forwarding
facilities especially for the small operators. The next in line was the Road Transport
Taxation Committee (GOI, 1967), which was given the task of comprehensively
looking at the question of taxation of motor vehicles in India. In the process of attempting
to examine the burden of taxation on costs of operations, the Committee had a fairly
detailed look at the returns of the operators wherein it was observed that hardly 22 per
cent got adequate returns – which was partially due to the stagnation of freight rates and
also in part due to, the Committee felt, the somewhat excessive margins retained by the
booking agents. Though some States had prescribed some rates by 1966 it was generally
found that these rates had no relationship to prevailing market rates, which was being
driven by demand, and supply forces. Further, in regard to margins of booking agents, the
Committee observed ” It has been alleged that at times the margins of booking agents
from truck operators is as much as 50 per cent of the freight they charge from clients”(p.
49). Though this alleged figure seemed to be on the high side, it was considered desirable
that in the matter of freight charges, the agencies should get a fixed percentage by way of
commission and ought not to be free to keep back any amount as commission. The
Committee, therefore, recommended the regulation of booking agents who would accept
goods for transport at fairly reasonable rates. Accordingly, a provision was incorporated
into the MV Act in 1969 (Section 93 as provided for in the MV Act of 1088). The report
of the National Transport Policy Committee (GOI, 1980) was the most comprehensive
document that was ever brought out till then. The Committee rightly observed the need to
give the railways a larger role to play especially form the point of view of efficiency
considerations. However, at a practical level, the Committee felt that no restrictions ought
to be place on truck movements all over the country, given the need to upgrade the
railway system significantly only after which a rightful role to the two modes could be
assigned based on considerations of resource costs. For the Committee, the viability of
truck operations was never an issue since ease of exit (as an option) allowed players to
29

move out without much difficulty. It is to be noted that while this option is normally
expected to be available, it is most often not resorted to due to the inability of an
alternative occupation. This aspect is especially important at present when there appear to
be too many operators who have entered the market due to ease of entry.
The first among the specialised studies on the trucking sector was undertaken by the
National Council of Applied Economic Research (NCAER, 1979). The study observed
that the contribution of road transport to the process of economic development can be
greatly enhanced by the ability of this industry to provide superior quality service and
reduce total distribution costs through reduction in freight charges. The key elements,
which make this reduction in cost and superior service possible, are of two types, namely,
external and internal. Among the significant external factors are high levels of taxation,
road conditions, detention at check posts and problems related to inadequate and high
cost of finance. The internal element is mainly in the form of organisation of the structure
of the industry. The study pointed out that the low profitability of small operators is
partly due to their low net freight realisation. This was a consequence of the relatively
high margins retained by booking agents on freight bookings as a result of the operators’
heavy dependence on these agents. While any legislation formalising the role of booking
agents would be useful, it was felt that only the formation of viable units could ensure
optimum utilisation of truck and higher net freight realisation. The study undertaken by
the Central Institute of Road Transport, Pune (CIRT, 1994) was equally
comprehensive in its approach and examined a number of dimensions relating to the
industry. Given the restrictive approach under a permit scheme of things, the study
observed that a wholly different method was required whereby there is a qualitative
character given to the holder of permits in terms of minimum qualitative requirements to
be fulfilled by goods vehicle operators preceding their entry in the transport business.
This was an immediate requirement given the preponderance of small operators and its
implications in terms of dependence on other players, the low system output in terms of
quality and efficiency of operations resulting from fragmentation. A major
recommendation calls for registration of all operators under an appropriate legislation on
the basis of a minimum fleet strength and other entry qualifications. The study observed
30

that the productivity of the system was likely to improve under such a situation which
provided the promotion of undertaking of as many transport activities as possible by
viable units and not merely confined to the haulage function only as has been the
dominating feature of operations. Towards the late nineties, the Asian Institute of
Transport Development, New Delhi undertook a comprehensive study of trucking
operations in India (AITD, 1999) at the instance of the Ministry of Surface Transport,
Government of India. It was conducted under the supervision of a Steering Committee
with the help of a number of Sub- Committees (one of which dealt with Financing,
Taxation, Pricing and Insurance was under the Chairmanship of the Principal Investigator
of the present study). The surveys that were undertaken as part of this study were taken
up by the Central Institute of Road Transport, Pune and were far more comprehensive
than those undertaken in 1994. A review of this study reveals some useful findings and
recommendations though it must be admitted that most are only reiteration of past
findings. Among other things, the study recommended the setting up of a Transport
Regulatory Authority with a basic function being the enforcement of the provision of the
MV Act and the rules framed there under. Given the Constitutional provisions, it is not
quite clear what would be the effective role of such an Authority. However, an important
conclusion was that there was no need to regulate freight tariffs by fixing minimum and
maximum rates Accordingly, it was even recommended that the relevant provisions
contained in Section 67 (1) and section 79 (2) (iv) may be dropped from the Act since
they are redundant. It was, however, suggested that in order to ensure reasonable returns
to operators, associations should be given the responsibility of fixing a commission
payable to the intermediaries. As part of its recommendations, the study emphasised the
need for regulation of intermediaries through a process of registration. A modification of
Section 93 of the MV Act would, accordingly, be required to define brokers and booking
agents and mandate their registration. In the context of a study undertaken to examine the
different dimensions of modernisation in the context of the trucking industry in India, a
more recent study (Deloitte, 2003) also discussed the issue of low profitability of small
operators arising not only from excess availability (resulting in declining freight rates and
low utilisation) and increasing fuel costs but also due to a continuous move of large fleet
operators towards a non-asset based model as a consequence of which a larger number of
31

small operators are depending on intermediaries thereby affecting their profitability. The
study also observed that a certain usage profile – long hauls, medium hauls and short
hauls and ownership profile – new buyer, second third owner, etc also have an impact on
profitability. In the case of long hauls and short hauls, new trucks and much older trucks
were being used respectively with only marginal returns resulting (slightly higher in
longer hauls) due to a large number of operators competing for the same freight. In the
case of medium halls, three-year old vehicles were used in a not so competitive market to
earn good operating cash profit. The most recent work was undertaken by The World
Bank (2005) wherein the efficiency of trucking operations in India has been examined in
some detail. A useful observation is that India has achieved a highly competitive, low-
cost road freight transport industry for basic services, with highway freight rates being
among the lowest in the world. The industry is deregulated and highly fragmented with
many small operators. The industry’s structure, comprising transporters, broker agents
and small operators, is market driven and appears to be serving the market reasonably
well. Given the very low freight rates, the study attempts to conclude but very hesitantly
that it is an effective industry structure. There are reasons. Trucking freight rates are so
low that on some occasions, truckers make even losses even it appears in the longer run
but continue to remain in business due to lack of any other opportunity. It is also pointed
out that while the freight rates are low, the quality of service is indeed poor with low
reliability and high transit times. Also, the equipment utilization rates are a quarter of
those of developed economies, mainly because of undue delays at check points. Truck
delays at checkpoints have been estimated to cost the economy anywhere between Rs.9
billion and Rs.23 billion a year in lost truck-operating hours. To reduce delays at border
crossings, particularly for high value or time-sensitive goods, the report recommends
consideration of a system such as the European T.I.R., to permit sealed trucks which elect
to use the system to operate without en-route inspections on the basis of a certificate
issued at origin by a duly authorized and bonded issuing entity. It has been pointed to us
during the course of our surveys that the typical user insisted on low tariffs even at the
expense of quality of service – meaning that there was willingness to accept the trade-off.
This indeed has implications for the healthy growth of the sector, which would obviously
32

require reasonable returns on haulage while attempting to reduce other implicit road
costs.
Our Remarks
Deregulation in the transport sector has taken place in many countries in the past
two decades or so. It has been observed that the effects of deregulation have depended on
the extent to which the industry was regulated earlier. However, broadly the effects have
been as follows:
The capacity available for common use has increased significantly with
increasing dominance by highly competitive small operators
Rates have fallen considerably as a result of more capacity and introduction
better technological features
Falling rates have benefited customers but with costs not reducing to such an
extent, profit levels have fallen though operators offering higher levels of service
have achieved higher profit levels.
The roads goods transport industry in India has never been regulated the way it has
been in many other countries. But as mentioned earlier, a regulatory framework in the
form of the MV Act has been in place since 1939. This did provide for restrictions on
permits but over a period of time these have been relaxed to a very large extent
permitting easy entry into the industry and for movement all over the country. This is
perhaps the only deregulatory move that taken place in India as far as the trucking sector
goes. And the credit for this development goes to the Indian railways, which had no
capacity to offer on a regular basis even with regard to bulk items. But as observed by
the various Committees and pointed out by the different studies, the Motor Vehicle
departments of the States have mainly focused on the collection of revenue (tax and
otherwise) rather than on effective enforcement of the provisions of the MV Act. As a
result, an effective regulatory framework has, in our opinion, never been attempted to be
put in place. This has emerged over the years as a major external impediment (in terms of
a number of dimensions) to the effective growth of the trucking industry in India. This is
33
a matter of concern especially when viewed in the context of an emerging globalised
competitive economy. In this context, it becomes imperative to point out the major
internal impediment that the industry faces in the form of its internal organisational
structure, which has implications for efficient operations. It was observed earlier that the
industry offered low rates in India. Basically, the industry is characterized by skews-
large number of operators and users and sufficiently large number of intermediaries
between these two players. The question – what are the agreements between the various
players? Some are formal while most seem to be informal. These informal agreements
appeared to be often highly iniquitous as a direct consequence of the intermediaries’
access to information. The power the intermediaries exert over the industry is not,
however, matched by the capital employed by them. This suggests that there is an
imbalance here in the way the revenue is being shared by the various players in the
industry. Clearly, there is a need to bring the intermediaries under the purview of
regulation. However, effective interaction between the various elements of the industry
needs to be encouraged by government policies, which are necessary for the healthy
growth of the industry.
A survey of the literature related to the trucking sector put our study in the proper
perspective. The study team believed that it needed to fill certain gaps. First of all, it was
pertinent to take a critical look at the supply chain related to trucking, in the sense of who
actually determined the price of trucking services and more specifically, the role of the
operators and other intermediaries in determination of the price. The basic objective was
to examine the possibility of price fixation at levels not really reflecting competitive
benchmark rates. Thus, a related objective was to take a look at various costs related to
operations and the returns derived thereby. Given the state of the market and knowledge
of the cost structure, it was possible to make conjectures related to breaking even, earning
of positive or negative economic profit, the rationale for overloading, and so forth.
However, this required some understanding of policy and regulatory elements, which
would ultimately have an impact on fixation of tariffs.
34

Part III Case Studies / Case Laws
International
United States
As pointed out earlier, for more than three decades inter-state trucking was heavily
regulated by the Interstate Commerce Commission (henceforth ICC). The ICC reviewed
rates, on complaint, that common carriers were required to file, and the ICC strictly
limited entry. Beginning in the late 1970s, a series of administrative and legislative
actions, more specifically the Motor Carrier Act of 1980, liberalized regulation of the
industry. These, and similar initiatives deregulating the rail industry, led to the abolition
of the ICC in 1995 (ICC Termination Act of 1995). On January 1, 1996 the Surface
Transportation Board (STB) was established as an independent adjudicatory body housed
within the U.S. Department of Transportation, with jurisdiction over certain surface
transportation economic regulatory matters.
Though inter-state trucking movement is almost fully deregulated with nine States
having more or less fully deregulated intra-state movement, it is reported that 41 States
continue to regulate most aspects of intra-state trucking (Taylor, 1995). Studies of inter-
state deregulation according to Taylor suggest that it is saving shippers and consumers as
much as $20 billion per year in transportation and logistics costs. Further deregulation of
States trucking entry and rates could save shippers and consumers an additional $11
billion dollars a year. Opponents of intra-state deregulation have argued that it would lead
to destructive competition and predatory pricing, loss of rural service, and deterioration in
safety. However, neither theory nor experience with inter-state deregulation and intra-
state deregulation in several states supports those claims (Taylor, 1995).
It is in the context of intra-state deregulation that some cases relating to
anticompetitive practices have arisen. More recently, a merger between two trucking
firms involved in LTL movement had come under scrutiny. We report these below.
35

One case related to the Indiana Household Movers and Warehousemen, Inc.
(IHM&W) which represents approximately 70 household goods movers doing business
in Indiana. The Federal Trade Commission (FTC) of the U.S., which is the competition
authority, pursued the complaint that this agency was engaged in price fixation on the
basis of collusion amongst its members. It was understood that the rate that was to be
filed with the State Rate Bureau by individual operators was based on the common rate
fixed by the members of the agency collectively. Overall, the acts, policies and practices
of the respondent (namely the agency), its members and others, were to the prejudice and
injury of the public and constituted and constitute unfair methods of competition in or
affecting commerce in violation of Section 5 of the Federal Trade Commission Act, as
amended. The question before the Commission in this case was whether the state action
defense immunized IHM&W's conduct. "This case provides guidance to the business
community regarding the standards that must be met to immunize anticompetitive
conduct as an activity of the state," said Joe Simons, Director of the FTC's Bureau of
Competition. "The Commission concluded that IHM&W's price fixing was not actively
supervised by the State of Indiana, and thus, did not qualify for immunity." The FTC
settlement barred the Indiana Association from filing collective tariffs with State (FTC,
2003).
The other cases related to very similar complaints against the Alabama Trucking
Association, Inc., Iowa Movers and Warehousemen's Association, File No. 021-0115
(Aug. 1, 2003), and Minnesota Transport Services Association, File No. 021-0115 (Aug.
1, 2003). Here again the Commission barred the associations from filing collective tariffs
with the State (Federal Register, 2003).
The merger case related to two trucking firms, Yellowstone Corporation and
Roadway Corporation – both motor carriers active in the LTL market in 2003. There
are important differences between the Truck Load (TL) and LTL businesses. To carry
truckload-quantity freight efficiently, all one needs is a rig, a map, a telephone, and
perhaps an internet connection. LTL carriage, defined conventionally as shipments of less
36

than 10,000 pounds, is very different. The amount of handling required to provide this
kind of service is much greater than the handling needed on truckload shipments, and as a
result, LTL rates for a given distance are several times higher per hundredweight than TL
rates. One key requisite of an LTL specialist is a network of terminals. According to their
reports, Yellow had 345 terminals, with an average shipment size of 1000 pounds and
average shipping distance of 1200 miles; Roadway had 371 terminals and reports an
average shipment length of 1301 miles. In this context, it will be useful to report some of
the comments of Professor F.M. Scherer (AAI, 2003), an academician of international
repute on possible anticompetitive effects of the merger. According to Scherer, given the
high localization that takes place in the LTL segment, there has been a tendency for
oligopolistic structures to emerge. He held that “There must be many parts of the United
States, typically more than 50 miles from large cities, in which the number of competing
LTL carriers can be counted on the fingers of one hand, with some fingers to spare”.
According to the 1997 Economic Census of Transportation and Warehousing, Subject
Series, the four largest long-distance LTL companies, two of which were almost surely
Yellow and Roadway, generated 39.3 percent of total category revenues. They operated
1271 establishments or an average of 318 each -- a bit less than half the number of
terminals reported separately by Yellow and Roadway. Scherer held that it is possible or
even likely that the merger leads to a consolidation of viable LTL terminal-operating
rivals with much larger market share impacts. A merger with substantial market share
impacts could strengthen adherence to some sort of a price leadership. And in an industry
with a long tradition of overt collusion in rate-setting, it was not inconceivable that there
could be actual collusion. Further concentration of the market structure could reduce
remaining proclivities toward independent pricing. Further, in tightly oligopolistic
localized markets, a merger from say three to two rivals could also have an adverse
impact on service competition. It was concluded that the expected efficiency gains (as a
result of a merger) need not necessarily be passed on to the consumer, if the evidence
shows pricing to be formulaic.
According to the United States Department of Justice, Yellow Corporation's $1.1
billion acquisition of Roadway Corporation, seemed when it was announced, like a big
37
deal. Yellow and Roadway were the two largest trucking companies that focus on long-
haul LTL freight. LTL carriers consolidate smaller shipments from many customers,
often using hub and spoke systems. Long-haul LTL carriers serve the entire continental
United States and generally transport shipments 1,000 or more miles. After closely
examining the industry, the FTC determined that this transaction did not warrant a
challenge. It was concluded that post merger there would remain sufficient LTL
alternatives, including truckload consolidation, large multi-regional carriers,
regional LTL partnerships, small package carriers, as well as three other long-haul
LTL competitors. These alternatives collectively would prevent a combined
Yellow/Roadway from imposing a rate increase or reducing service.
Australia Australia’s competition laws, the Trade Practices Act 1974 (TPA), applies in full to
the road transport sector without exemption or exception. Although specific exemption
can be granted under the TPA to conduct that might otherwise breach the law if public
benefits from the conduct would outweigh the anticompetitive detriments also arising
from the markets. The TPA is administered by Australia’s national competition regulator
– the Australian Competition and Consumer Commission (ACCC). We now turn to a few
case studies
1. Horizontal arrangements – Misuse of Market Powers
In 1995, misuse of market power involved a case against three major
companies in Australia’s overnight freight express industries-TNT Australia Pty
Ltd (TNT), Ansett Transport Industries (Operations) Pty Ltd (Ansett) and Mayne
Nickless Ltd. (Mayne Nickless) initiated by the Trade Practices Commission. The
Commission alleged that TNT, Ansett and Mayne Nickless had formed, and given
effect to, an arrangement to fix prices and regulate market shares in the express
freight market in contravention of the TPA. It was held that the arrangement had
continued for many years and was held together by meetings between senior
officials of each of the companies. These meetings resolved ‘ownership’ of
38
particular customers, disputes over which companies had breached agreements.
They were also found to be involved in what is known as collusive tendering. As
these three companies accounted merely 90 per cent of all sales in the industry,
the economic significance of such an arrangement was obvious. It was ordered
that TNT pay a penalty of $A4.1 million, Ansettset $A900000 and Mayne
Nickless $A 6million. Total penalties and costs ordered by court amounted to
over $A 14.1 million. This case was regarded as a watershed in the history of
TPA in Australia as it marked coming of age of competition law as a law
requiring the utmost serious compliance by all corporations, large and small.
In 1998, Australia’s Federal court imposed penalties totaling $A 4 million
against J.McPhee and Sons (providing freight services) and four of company’s
executives for breaches of Part four of the TPA. The court had found that the
company had attempted to reach a collusive tendering arrangement with a
competitor, Discount Freight Express in 1995. Earlier in 1994, the court had
found McPhee engaged in price fixing and ordered a penalty of $A 750000.
2. Merger –
In August 2000, the ACCC announced that it would not intervene in the
proposed acquisition of Finemores Holdings Ltd by Toll Holdings Ltd. Both are
providers of transport and logistics services. They operate across a broad range of
transport segments, including refrigerated transport, bulk liquid transport and
general freight. In logistics they provided warehousing, tracking and inventory
control. The ACCC conducted extensive market inquiries during its investigations
and found that there were a large number of small operators providing transport
and logistics services but a relatively small number of large, national providers.
For example, it was estimated that there were around 40000 transport providers of
which roughly 70 per cent operated a single vehicle. While the merger proposal
was considered to result in further concentration at the top tier of providers, there
was very little concern among the competitors and the customers as to the
potential lessening of competition as a result of the merger. The ACCC found that
39

competition among transport and logistics providers is fierce. The reasons
included relatively low barriers to small scale entry and countervailing powers
that resides with the customers.
Ireland
In Ireland competition laws apply to the road freight sector without exception. As
with other sectors the competition authority enforces competition law.
In 1997, the competition authority began an investigation into a possible cartel in
the road haulage industry following complaints that the Irish Road Haulage Association
(IRHA) had written to various firms indicating that its members had agreed to minimum
rates for transport of freight to and from Dublin port and would not provide services to
any customer below these rates. A month later a large number of hauliers began
blockading sections of Dublin port. The Competition Authority applied for an ex parte
injunction because it believed that the blockade was intended to secure customer
agreement to the proposed rates. In 1998 the case was settled when the defendants agreed
to a court declaration that they had engaged in a concerted practice to fix prices. They
also gave undertakings to the court that they would not engage in price fixing contrary to
Section 4 (1) of the Competition Act.
Korea
Currently, the Monopoly Regulation and Fair Trade Act (MRFTA), Korea’s
competition law (administered by the Korean Fair Trade Commission- KFTC), does not
provide the exemptions in the road transport sector. As such, the services are covered by
the MRFTA just as other industries. However, there is in effect little room for application
of MRFTA, since the sectoral regulator has imposed far reaching regulations regarding
entry, prices, operations etc. All the same, KFTC has been paying keen attention to
reforms, focusing on anti- competitive conducts that may arise in the process of
liberalization.
40

In regard to road freight services, there were 10 Merger and Acquisition cases
between 1997 and 1999. In examining the proposed business combination, the scope of
the geographic market was determined to be national. This was because road freight
services offer nationwide coverage without restrictions on operating territories. All the
cases concerned involved negligible market shares and had no anti-competitive effects.
Thus, the KFTC did not ban or propose remedies concerning these business
combinations.
Norway
The Competition Act of 1993 applies to undertakings in road transport in the same
way as undertakings in other sectors in Norway. The Norwegian Competition Authority
(NCA) has however, granted exemptions in number of individual cases. Most of the
individual exemptions granted have been given to associations of companies that are
small with respect to the market, created for the purpose of bidding on large contracts.
The exemptions are usually granted because cooperation enhances competition or
because its impact on competition is negligible.
The NCA has uncovered horizontal arrangements in the road freight sector; though
no formal sanctions have been imposed. One case involved removal companies, allegedly
having reached a nationwide agreement on minimum prices. Another case involved a
price fixing agreement between three truck drivers situated around the city of Bergen.
Malaysia
The haulage (trucking) industry was liberalized in 1997 to increase the efficiency of
the industry. With this liberalization, the number of goods haulage firms increased from 5
in 1997 to about 60 in 2003. The incumbent five firms were members of the Containers
Hauliers Association of Malaysia (CHAM) which had a total number of six firms in
2003. Most of the new entrants (about 30 firms) were members of another association,
41
namely, the Association of Malaysian Hauliers (AMH). Subsequent to the continual entry
of new firms into the market since 1997, a price war broke out in 2000. By 2003,
container haulage rates had fallen between 20 to 40 percent. To end the price war, the two
industry associations met to agree to stop giving rebates to their customers from 1st
January, 2004. Since prices were regulated and the absence of a price war meant that
prices would be at par with price ceiling set by the Commercial Vehicle Licensing Board
(CVLB) , the question arose whether the industry association seemingly “explicit
collusion” could be construed as an anti-competitive practice. The industry regulator,
CVLB did not intervene in the matter even though it set price ceilings for the
industry. The market share of the association members was fairly significant with
CHAM members’ market share in container haulage being 55 per cent. According to Lee
(2004), the failure to address competition related problems in these sectors reveal the
insufficiency and inadequacy of sectoral regulatory reforms in Malaysia.
National
Indian Case laws / studies
We now report cases relating to RGTI in India, which came up before the MRTPC
over a period spanning 1984 to 1994. All these cases related to restrictive and unfair trade
practices in the context of RGTI. This description given below is based on a limited
reading and understanding of relevant MRTP Commission papers and a book by Dugar
(1997).
1. In 1977, an enquiry (RTP Enquiry No. 32 of 1977) was instituted against Truck
Operators Union (Place/ location not mentioned in Dugar, 1997). It was held that the
Constitution of the Union enabled the existing members to keep out new entrants from
the market of transportation of fruits and vegetables on arbitrary grounds. It was alleged
before the Commission that if any transporter attempted to enter the market and offered
to transport fruits and vegetables, he was restrained to do so by force. While ordering
42

modification of the impugned clause of the constitution of the Union, a ‘cease and desist’
order was passed against the Union, inter alia, prohibiting it from stopping any truck
operator, whether member of the Union or not, from entering the fruits and the vegetable
market and offering to undertake the transportation services (Order No. 20th February,
1978).
2. In 1982 an enquiry (RTP Enquiry No. 10 of 1982) was instituted against the Bharatpur
Truck Operator’s Union, Naimandi, Bharatpur, Rajasthan and its members
(Respondents).
The allegations related to the following practices:
(a) Acting in concert in fixing, maintaining and increasing freight rates;
(b) Forcing the customers to hire trucks from members of the Union only for
transportation of goods at the rates which are ex-orbitant, unreasonable
and disproportionate to the services rendered;
(c) Restricting non-members from lifting the goods from within the city of
Bharatpur and its surrounding areas;
Accordingly the following issues were framed for trial:
(i) Whether the respondent is trade association and if so whether the
respondent has been indulging in the trade practice / practices mentioned
in the Notice of Enquiry, dated 20.10.1982.
(ii) If the answer to issue No. 1 is in the affirmative, whether the said practice/
practices are restrictive trade practices within the meaning of section 2 (0)
of the Monopolies and Restrictive Trade Practices Act, 1969.
(iii) To what relief, if any, are the parties entitled?
In regard to the first issue, the commission held that the operator’s union was a
trade association (as defined under Section 2(t)) and not a trade union thereby not being
covered by the exemption set out in Section 2 (d). As to the second sub issue of the first
issue, it was decided against the Respondents while holding that they are indulging in all
43

the three trade practices such as price fixing, maintaining and increasing freight rates. On
the second issue also the Commission decided against the Respondents and directed them
to cease and desist from the restrictive trade practices, which were the subject matter of
the enquiry. The Respondents were also directed to file an affidavit of compliance within
three months from the date of the order (dated 24th Aug., 1984).
3. In 1983, an enquiry (RTP Enquiry No. 25 of 1983) was instituted against the Rohtak
Public Goods Motor Union and its office bearers (Respondents) on a complaint received
from the President of Rohtak Mandi Foodgrain Dealers’ Association. The allegation was
that the Respondents did not allow non Union truck operators to carry goods and they
even indulge in rowdyism. As a result customers were forced to use trucks from the
Union which definitely charge higher rates.
Accordingly the following issues were framed for trial:
(i) Restricting non members from lifting goods there by hampering free flow
of trade.
(ii) Restricting lifting of goods by nonmembers up to permissible capacity with
the result the customers had to incur extra expenditure which imposed
unjustified costs and restrictions on the consumer of services.
The Respondents did not appear to context the issues in the Notice of Enquiry. So
ex-parte proceedings were ordered against the Respondents. The evidence before the
commission showed that
(a) the Respondents prevented the non-member operators to carry on their
transport business freely with a view to eliminate competition in the market
in the transport business and to achieve their object they resorted to man-
handling and assaulting the non-member truck operators,
(b) whereas the member of truck operators were permitted to carry FTL from
Rohtak, others who are not members of the respondent Union were not
allowed to carry more than 20 quintals of load with the result that they were
44
at a disadvantage in competition with their brethren truck operators who
were members of the Union, and
(c) all this resulted in compelling the customers to engage the trucks for
transportation of goods only through the respondent Union and pay
whatever rates they demanded.
The Respondents were held to be guilty and a ‘cease and desist’ order (dated
25thAug. 1984) was passed by the Commission.
4. In 1986, two enquiries (Nos. 29 of 1988 and 109 of 1986 in RTPE No. 1/87) were
instituted against Bhilwara District Trust Transport Union, Bhilwara and its office bearers
(Respondents). The allegations filed by the Mewar Chamber of Commerce and Industry,
Bhilwara related to restrictive trade practices being followed by the Respondents. The
preliminary findings of the Director General of Investigation and Registration (DGIR) of
the MRTPC revealed these practices. Accordingly a Notice of Enquiry was issued to the
Respondents. It was observed that even when DGIR was conducting preliminary
investigations the Respondents continued to indulge in such practices as mentioned
above.
The Respondents contested the issues raised in the Notice of Enquiry. They denied
indulgence in restrictive trade practices. They admitted that freight rates were been
displayed at their Union office but that was for the guidance of the public with a view to
safeguard them against exploitation and overcharging. They also denied the contention
that the rate list was the outcome of any concerted action on a part of its members.
Having form a prima facie case against the respondent, the Commission issued an
interim temporary injunction restraining the Respondent from carrying on the restrictive
trade practices (dated 10th May, 1988). (We have not been able to look at the final
order relating to the Enquiry).
45

5. In 1983, an Enquiry (RTP Enquiry No. 30 of 1983) was instituted against India Truck
Union, Mahwa, Rajasthan and its Office bearers (Respondents). The allegations were as
follows:
a. Forcing customers to hire trucks from members only.
b. Preventing non –members from loading goods.
c. Imposing and charging an extra levy for supply of trucks for certain
destinations.
d. Maintaining transport charges at unreasonable levels by limiting supply of
services.
While the Respondents admitted to the first three charges, the last one was proved
to the extent that the Respondent had been fixing, maintaining and revising (increasing)
freight rates. Accordingly the Commission passed the ‘cease and desist’ order (dated 11th
Feb, 1989) against the Respondent Union. It may be useful to note some observations of
the Commissions in this regard. One observation related to the contention of the
Respondent that its impact was minimal in terms of the area covered. However, the
Commission pointed out that the restrictions extended over the entire area in which the
Respondent Union was operating as a result of which an impact of their practices could
not be taken as marginal or nominal. Further, the fact that the union was associated with
the Directorate of Agriculture and Marketing, Government of Rajasthan did not clothe
the impugned restrictive trade practices with the authority of any law. This observation
was made in the face of the contention that the Union was actively associated with a
department of the State Government thereby being authorized by any law. In fact, it was
pointed out that there was nothing to indicate that the rates fixed by the Respondent union
had the approval of the State Government in the manner provided under Section 43 of the
Motor Vehicle Act, 1939 (i.e., to say under the directions of the State Transport Authority
duly notified in the Official Gazette, inter alia, in the interest of preventing un-economic
competition among motor vehicles).
46

6. In 1987, an Enquiry (RTP Enquiry No. 1313 of 1987) was instituted against Goods
Truck Operators’ Union, Faridabad and its Office bearers (Respondents) against attempts
at price fixation and indulging in restricted trade practices. The evidence pointed out that
the Union had in fact been attempting to eliminate competition in the market by fixing
the freight rates without liberty to the union members to negotiate individually. Further,
the Union had not been allowing non-members of the Union to carry goods. Accordingly,
a ‘cease and desist’ order (dated 13th Dec, 1989) was issued by the Commission.
7. Over the period 1988-89, Enquiries (RTP Nos. 402 of 1988, 97, 98 and 99 of 1989)
were instituted against Motor Lorry Owners and Operators Union, Pithapuram (A.P.) and
three other Lorry Owners’ Associations (Respondents). It was alleged that the four Lorry
Associations at four places in Andhra Pradesh were resorting to restrictive trade practices
by acting in concert in fixing the freight rates and dislocating public distribution system
in Andhra Pradesh, inter alia, by not allowing the transport contractors of Civil Suppliers
Corporation to hire other lorries at the existing market rates, further that the Associations
is not allowing the transport contractors to place even their own lorries in the sugar
factories and the Associations is forcing the transport contractors to hire lorries from its
members on the rates fixed by it. In the absence of specific allegation relating to
restrictive trade practices and in the absence of clear cut evidence relating to price
fixation by the Associations, the Commission held (order dated 3rd dec, 1990) that it was
not possible to issue any order restraining the Respondents from indulging in any
particular restrictive trade practices.
8. In 1994 Enquiries (RTP Enquiry Nos. 97,101,103 of 1990) were instituted against the
Taraorimandi Goods Transport Union, Taraori, Karnal, Haryana and its Office bearers
(Respondents). The complainants who were dealers in paddy and rice alleged that the
Respondent union was not allowing any transporter to lift goods in the mandi unless they
became members of the union and even owners of trucks were not allowed to load the
trucks. The Union contended that the complainants were not engaged in the transport
business but carried their own goods and that even if it was established that the alleged
practice did exist, it would nor affect practice. The Commission held that prohibiting
47

rivals from entering into a particular territory, completely eliminates the possibility of
competition in that area and is therefore highly prejudicial to public interest. The
Commission was of the firm view that prohibitory tactics adopted by traders excluding
rivals from entering into what they regarded as their exclusive territory of business was
one of the worst examples of restrictive trade practices. The fact that the complainants
themselves were not engaged in the business of transport would make little difference as
once the Respondents were left free to drive out non-members from entering their
exclusive territory there would be no chance of any competition surviving among truck
operators in that area.
In the result, a ‘cease and desist’ order was to be issued against the respondents in
all the three Enquiries prohibiting them from engaging in the impugned trade practices in
future (order dated 28th March, 1994).
9. In 1990, an Enquiry (RTP Enquiry No.98 of 1990) was instituted against Truck
Operators’ Union, Karnal, Haryana and its members (Respondents). The allegation was
that the Union compelled non-member Truck Owner to become member of the Union
failing which the Union will prevent manufacturers from using their trucks in Karnal
district. This was preventing, distorting and restricting competition and obstructing flow
of capital in the stream of the production. Based on response to the Notice of Enquiry
relating to the concerned issues, the basic issue for examination related to whether the
Respondent had indulged in restrictive trade practices.
From the evidence produced on behalf on the complainant and the DGIR which was
not otherwise rebutted by the Respondents, the Commission was of the considered view
that the Respondents had indulged in restrictive trade practices. Accordingly, a ‘cease and
desist’ order was issued against the Respondents (order dated 9th Sept., 1994).
48

SECTION 3
Freight Rates, Operator Costs and Industry Profitability According to World Bank (2005), India has achieved a highly competitive, low cost
RGTI for basic services, with freight rates being among the lowest in the world – see
Table 1.
Table 1: Truck Load Freight Rates in Different Countries
Country Average Unit per ton Km. (Rs)
Pakistan 0.75-1.05
India 0.95-1.35
Brazil 1.20-2.20
United States 1.25-2.50
Central Asian Republics 1.75-4.25
Australia 1.75
China 2.00-3.00 Source: World Bank 2002
Section 67 (1) of the MV Act, 1988 gives power to the State Governments to issue
directives to the State Transport Authorities (STA) regarding fixing of freight and fare
rates. Under Section 79 (2) (iv) of the Act, the Regional Transport Authority (RTA)
granting a public carrier permit, may provide that goods shall be carried at specified rates.
However, the States have neither had an objective basis for fixation of freight rates nor
any separate agency for enforcing freight rates (whenever it was attempted). Thus,
despite the provision in MV Act regarding fixing of fare and freight, no definite
mechanism has been evolved for their determination and enforcement. Consequently, at
present, there is no State, which has fixed the freight rates for the industry. We now turn
an examination of freight rates and operator costs in the Indian context with a view to
assessing the profitability of operations.
49

Part I
Analysis of Freight Rates In this Part of the Section, we attempt to examine in some detail freight rates that
have been prevalent on important point to point movements between Mumbai and cities
such as Ahmedabad, Delhi, Kolkata, Bangalore and Chennai over the period 2002–05.
These rates are those obtained by the operators and not the ones paid by the Consignor /
User and are rates for a FTL. According to local market sources, these are the rates that
are normally quoted in some of the daily newspapers such as The Economic Times,
Business Line etc. We have obtained these figures of rates from the information posted on
a website namely, www.infreight.com. Another website namely,
www.infobanc.com/logtruck.htm also gives truck freight rates between the major cities
though the site is not being updated on a regular basis. Given below in Tables 2, 3 and 4
are rates for the years 2002, 2005 and 2006 respectively (mid year).
Table 2: Published Long Distance Road Freight Rates in India (mid 2002)Rate for FTL
From To Freight Rate
(Rs./ Truck) Distance Km
Freight rate (Rs./ ton km)
Delhi Mumbai 12000-12,600 1,408 0.97 Delhi Kolkata 14,400-15,000 1,474 1.11 Mumbai Delhi 14,000-15,000 1,408 1.14 Mumbai Kolkata 22,000-23,500 1,987 1.27 Mumbai Chennai 14,500 1,367 1.18 Chennai Delhi 25,020 2,095 1.33 Source: World Bank 2005
50

Table 3: Long Distance Road Freight Rates in India (mid 2005) Rate for FTL
From To Freight Rate (Rs./ Truck)
Distance Km
Freight rate (Rs./ ton km)
Mumbai Delhi 19071 1408 1.50 Delhi Mumbai 13000 1408 1.03 Mumbai Ahmedabad 6500 551 1.31 Ahmedabad Mumbai 8200 551 1.65 Mumbai Kolkata 25500 1981 1.43 Kolkata Mumbai 20000 1981 1.12 Mumbai Chennai 18000 1329 1.50 Chennai Mumbai 14800 1329 1.24 Mumbai Bangalore 13714 998 1.53 Bangalore Mumbai 11200 998 1.25 Mumbai Aurangabad *6000 400 1.67 Mumbai Ahmednagar *4500 320 1.56 Mumbai Belgaum *8500 499 1.89 Mumbai Satara *4000 280 1.59 Source: www.Infreight.com *These are figures derived from the surveys
Table 4 : Long Distance Road Freight Rates in India (mid 2006) Rate for FTL
From To Freight Rate (Rs./ Truck)
Distance Km
Freight rate (Rs./ ton km)
Mumbai Delhi 19000 1408 1.50 Delhi Mumbai 15498 1408 1.22 Mumbai Ahmedabad 6498 551 1.31 Ahmedabad Mumbai N.A 551 N.A Mumbai Kolkata 25992 1981 1.46 Kolkata Mumbai 24480 1981 1.37 Mumbai Chennai 18999 1329 1.59 Chennai Mumbai 18999 1329 1.59 Mumbai Bangalore 14994 998 1.67 Bangalore Mumbai N.A 998 N.A
Source: Business Line,June 19, 2006.
The objective behind this examination is to look at the trend in movement – in
terms of increase or decrease in freight rates and then examine profitability of operators.
Figure 1A below shows the interrelationships between various factors driving operator
profitability.
51
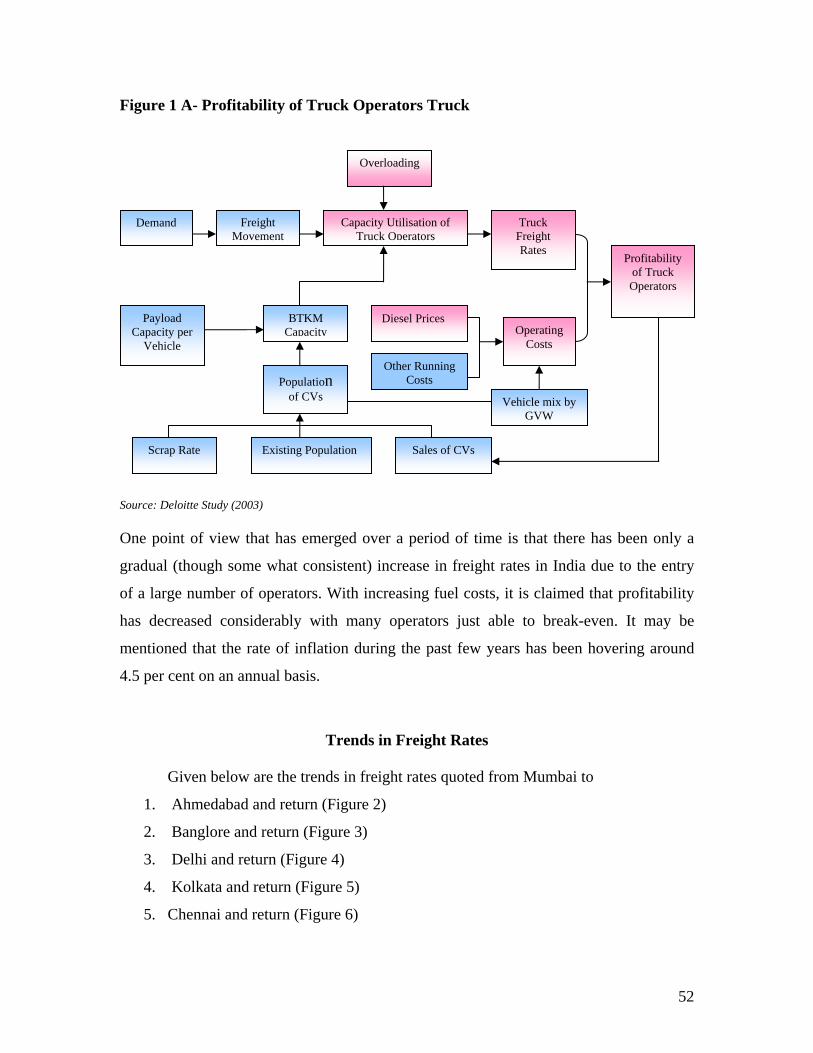
Figure 1 A- Profitability of Truck Operators Truck
Overloading
Freight Movement
Capacity Utilisation of Truck Operators
Truck Freight Rates
Profitability of Truck Operators
Payload Capacity per
Vehicle
BTKM Capacity
Diesel Prices
Vehicle mix by GVW
Population of CVs
Operating Costs
Other Running Costs
Demand
Scrap Rate Sales of CVs Existing Population
Source: Deloitte Study (2003) One point of view that has emerged over a period of time is that there has been only a
gradual (though some what consistent) increase in freight rates in India due to the entry
of a large number of operators. With increasing fuel costs, it is claimed that profitability
has decreased considerably with many operators just able to break-even. It may be
mentioned that the rate of inflation during the past few years has been hovering around
4.5 per cent on an annual basis.
Trends in Freight Rates Given below are the trends in freight rates quoted from Mumbai to
1. Ahmedabad and return (Figure 2)
2. Banglore and return (Figure 3)
3. Delhi and return (Figure 4)
4. Kolkata and return (Figure 5)
5. Chennai and return (Figure 6)
52

F i g u r e 2 - M u m b a i - A h m e d a b a d a n d R e t u r n
0
2 0 0 0
4 0 0 0
6 0 0 0
8 0 0 0
1 0 0 0 0
2 0 0 22 0 0 3
2 0 0 42 0 0 5
Y e a r
Mon
thly
Avg
. Fr
eigh
t Rat
esM u m b a i -A h m e d a b a d
A h m e d a b a d -M u m b a i
F i g u r e 3 - M u m b a i - B a n g l o r e a n d R e t u r n
0
2 0 0 0
4 0 0 06 0 0 0
8 0 0 0
1 0 0 0 0
1 2 0 0 01 4 0 0 0
1 6 0 0 0
1 8 0 0 0
2 0 0 22 0 0 3
2 0 0 42 0 0 5
Y e a r
Mon
thly
Avg
. Fr
eigh
t Rat
es
M u m b a i -B a n g a l o r e
B a n g a l o r e -M u m b a i
F ig u r e 4 - M u m b a i - D e lh i a n d R e t u r n
0
5 0 0 0
1 0 0 0 0
1 5 0 0 0
2 0 0 0 0
2 5 0 0 0
2 0 0 22 0 0 3
2 0 0 42 0 0 5
Y e a r
Mon
thly
Avg
. Fr
eigh
t Rat
es
M u m b a i -D e l h i
D e l h i -M u m b a i
53

F ig u r e 5 - M u m b a i - K o lk a t a a n d R e t u r n
0
5 0 0 0
1 0 0 0 0
1 5 0 0 0
2 0 0 0 0
2 5 0 0 0
3 0 0 0 0
2 0 0 22 0 0 3
2 0 0 42 0 0 5
Y e a r
Mon
thly
Avg
. Fr
eigh
t Rat
es
M u m b a i -K o l k a ta
K o l k a ta -M u m b a i
F ig u r e 6 - M u m b a i - C h e n n a i a n d R e t u r n
0
5 0 0 0
1 0 0 0 0
1 5 0 0 0
2 0 0 0 0
2 5 0 0 0
2 0 0 22 0 0 3
2 0 0 42 0 0 5
Y e a r
Mon
thly
Avg
. Fr
eigh
t Rat
es
M u m b a i -C h e n n a i
C h e n n a i -M u m b a i
The numbers for these Figures are monthly averages for the years 2002-05.
From Figure 2, which gives the Mumbai- Ahmedabad and return rates, it is
observed that the return rates have been consistently higher than the onward rates till mid
2005 after which there has been an increase in onward rates with a convergence towards
the end of the year. The higher return rates in the past have been attributed to lesser
availability at Ahmedabad indicating a much narrower supply base when compared to
Mumbai. Given a fairly large market for local transport (State) movement, it is pointed
out by some observers that there are very few locally available national truck permit
holders which possibly explain the low level of supply for inter-State movement. From
the point of view of growth rates, it was observed that in both the directions freight rates
have grown at just about 1 per cent (taken on a monthly basis) with the figures being 10
per cent and 6.5 per cent for the onward and return trips respectively.
54

In the case of Mumbai- Bangalore route the rates (seen in Figure 3) have been more
buoyant as reflected by the compounded annual growth rate of nearly 13 per cent though
the return rates have been growing much less (2-3 per cent only). It must be admitted
here that the latter growth rate has been computed only for three years due to non-
availability of data for 2005.
Figure 4 gives the trend for Mumbai – Delhi and return. It can be seen that there has
been a steady increase in the onward direction with the return reflecting a much lesser
increase. While the annual growth rate for onward direction is nearly 8 per cent, it is only
about 2.5 per cent in the reverse direction. This may reflect reverse trips to be more in the
nature of return trips while imports constitutes a major demand as far as onward
movement is concerned. This is quite the reverse when we observe the trend in the
Mumbai – Kolkata and return direction (Figure 5). Though freight rates are higher on
onward movements, the growth rate is about 3.5 per cent compared to more than 10 per
cent on the return movements, rates for which were lower by nearly 60 per cent in 2002
but which had narrowed to 42 per cent in 2005. Figure 6 gives the trend for the Mumbai –
Chennai route and return. In this case the growth of freight rates is higher at nearly 11 per
cent and 9 per cent respectively.
In the case of intra-State movements, the rates are not very different when consider
on a unit basis though the element of distance comes into the picture. For example, for a
distance of 500 kms., the rate for a FTL is around Rs.5000 – 5500/- with the rates being
proportionately higher for a lesser distance and lower for a longer movement.
We now turn to an examination of operators’ costs with a view to understanding the
profitability of trucking operations.
55

Part II Analysis of Operator Costs
In this Part, we attempt to examine, in some detail, costs of operations of a truck
operator. The exercise has been done for a standard 16 tonne GVW (Gross Vehicle
Weight) Truck.
Cost of operations of a truck can be categorized into the following:
a. Fixed Costs mainly comprise of interest payments, crew charges,
administrative overheads, maintenance repairs, wayside expenses and
amounts by way of contract amount, insurance payment, road taxes and
permit charges.
b. Variable Costs mainly consist of cost of fuel and lubricants, tyres, spare parts
etc.
c. Terminal Costs and Line Charges relate to commissions paid, loading and
unloading charges.
Given in Annexure I is a format of the model of cost of operation of a truck
specified the way it is in MS Excel. The model provides for an estimation of base year
(2005) relationships in terms of the various cost categories.
The data for this analysis is based on surveys conducted during the past six months
or so. We understand that the interest rates on borrowings for vehicles have come down
substantially in the past decade. Though the rates have fallen much more in the case of
nationalized banks, since the dependence on these institutions is only marginal, the rates
that we have considered in the analysis range between 12 and 14 per cent – currently
being charged by co-operative banks, non-banking financial companies, etc. With some
dependence on private sources of financing continuing, the cost implications can be more
significant in certain cases. Almost all the truck operators reported that finance is easily
available given that the operator has a license, required permit and the registration in
order. In regard to insurance, under the MV Act Third Party Liability Risk is necessarily
to be covered. A policy covering this risk is called the Act Only Policy. Most of the
operators who were interviewed admitted that they provided only for insurance relating to
risk of damages to the vehicle called the Own Damage Cover and not for the third party
56

coverage. As for the number of State permits, an operator normally obtained permits for
three or four States besides the home State.
Diesel prices have increased substantially during the last ten years or so. While in
1995-96 it was Rs.7.40 per litre, it went up to nearly Rs.20 in 2002 and by December
2005 it reached a level of Rs.38. From Figure 7, we can compare the trends in freight
rates and diesel prices (in Mumbai) over a period 2002-05.
Figure 7- Index no. of Diesel prices and Freight rate (Mumbai-Ahmedabad)
0.00
50.00
100.00
150.00
200.00
1 5 9 13 17 21 25 29 33 37 41 45
Index No.F.Rate Index No. Diesel Price
The annual compound growth rate of diesel prices has been around 16 per cent. For
the purposes of comparison, both the series have been converted into indices with
January 2002 as the base month. It is seen that for the first one and half years of the
period diesel prices moved at the same pace after which they have been much higher for
the rest of the period.
As far as terminal and line charges are concerned, they mainly relate to loading and
unloading charges and facilitation payments. It was reported that the loading and
unloading charges are nearly 75 to 100 per cent more in Mumbai compared to Pune and
Satara. Facilitation payments involved those required to expedite clearances and / or to
avoid payment of taxes and fines. According to many operators, this may normally
constitute 10 to 15 per cent of the freight revenue realised.
57
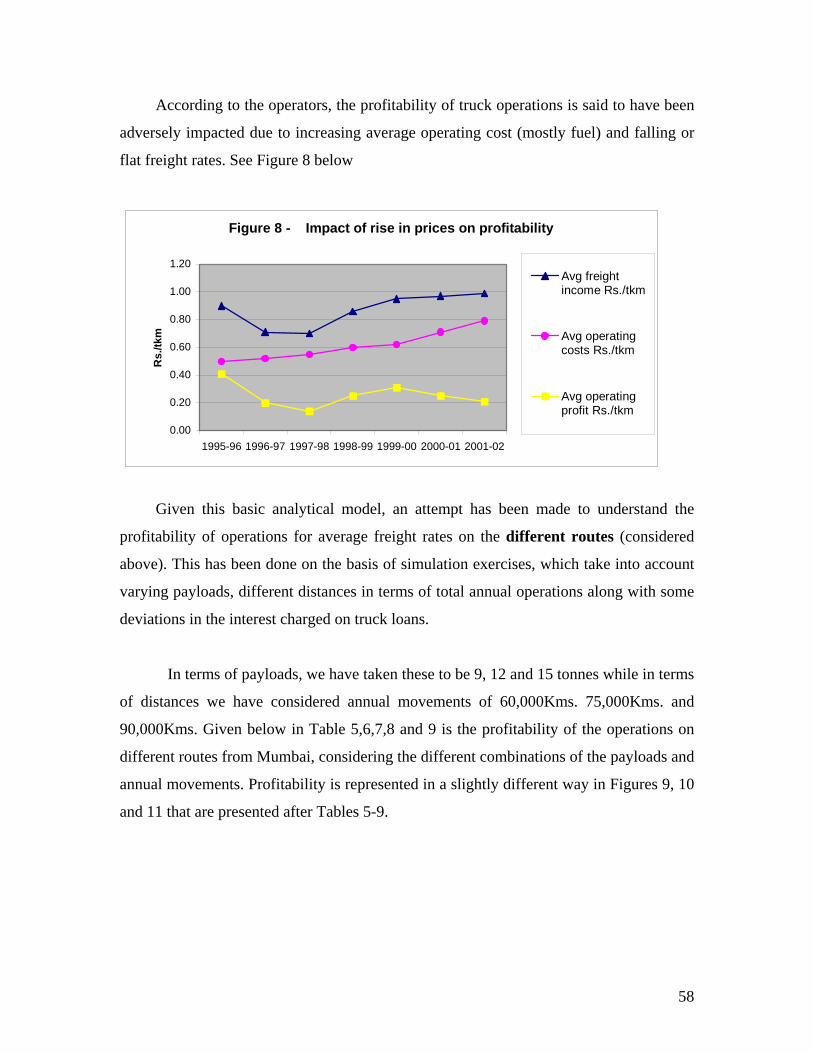
According to the operators, the profitability of truck operations is said to have been
adversely impacted due to increasing average operating cost (mostly fuel) and falling or
flat freight rates. See Figure 8 below
Figure 8 - Impact of rise in prices on profitability
0.00
0.20
0.40
0.60
0.80
1.00
1.20
1995-96 1996-97 1997-98 1998-99 1999-00 2000-01 2001-02
Rs.
/tkm
Avg freightincome Rs./tkm
Avg operatingcosts Rs./tkm
Avg operatingprofit Rs./tkm
Given this basic analytical model, an attempt has been made to understand the
profitability of operations for average freight rates on the different routes (considered
above). This has been done on the basis of simulation exercises, which take into account
varying payloads, different distances in terms of total annual operations along with some
deviations in the interest charged on truck loans.
In terms of payloads, we have taken these to be 9, 12 and 15 tonnes while in terms
of distances we have considered annual movements of 60,000Kms. 75,000Kms. and
90,000Kms. Given below in Table 5,6,7,8 and 9 is the profitability of the operations on
different routes from Mumbai, considering the different combinations of the payloads and
annual movements. Profitability is represented in a slightly different way in Figures 9, 10
and 11 that are presented after Tables 5-9.
58

Table 5: Profitability on Mumbai-Ahmedabad Route (in %) Mumbai-Ahmedabad 9 tonnes 12 tonnes 15 tonnes 60000Kms. -0.45 -0.27 -0.09 75000Kms. -0.37 -0.16 0.05
90000Kms. -0.30 -0.07 0.16
Table 6: Profitability on Mumbai- Bangalore Route (in %)
Mumbai- Bangalore 9 tonnes 12 tonnes 15 tonnes 60000Kms. -0.42 -0.22 -0.03
75000Kms. -0.33 -0.11 0.12
90000Kms. -0.26 -0.01 0.24
Table 7: Profitability on Mumbai- Delhi Route (in %)
Mumbai- Delhi 9 tonnes 12 tonnes 15 tonnes 60000Kms. -0.51 -0.34 -0.18
75000Kms. -0.43 -0.24 -0.05
90000Kms. -0.37 -0.16 0.05
Table 8: Profitability on Mumbai- Kolkata Route (in %) Mumbai- Kolkata 9 tonnes 12 tonnes 15 tonnes 60000Kms. -0.49 -0.32 -0.15 75000Kms. -0.41 -0.22 -0.02
90000Kms. -0.35 -0.13 0.09
Table 9: Profitability on Mumbai- Chennai Route (in %)
Mumbai-Chennai 9 tonnes 12 tonnes 15 tonnes
60000Kms. -0.48 -0.30 -0.13
75000Kms. -0.40 -0.20 0.00
90000Kms. -0.33 -0.11 0.11
59

Figure 9- Profitability on Different Routes (9 tonnes)
-0.60 -0.50 -0.40 -0.30 -0.20 -0.10 0.00
M-Ahe M-Ban. M-Del M-Cal M-Che
60000Kms. 75000Kms. 90000Kms.
Figure10- Profitability on Different Routes (12 tonnes)
-0.40
-0.30
-0.20
-0.10
0.00 M-Ahe M-Ban. M-Del M-Cal M-Che
60000Kms. 75000Kms. 90000Kms.
Figure 11- Profitability on Different Routes (15 tonnes)
-0.20 -0.10 0.00 0.10 0.20 0.30
M-Ahe M-Ban. M-Del M-Cal M-Che
60000Kms. 75000Kms. 90000Kms.
It is observed from the Tables given above that only for an aggregate distance of
90,000Kms. (around 300kms. per day) and loading to the extent of 15 tonnes, there is a
reasonable return on almost all the route except to Bangalore in which case the return is
almost double. Our surveys of truck operators indicate that, on an average, a truck moves
60

around 250-300 Kms. per day especially when they are involved in inter-regional
movements. Given the lower limit of moving around 250Kms. (or even slightly less)
there is a financial loss. Even with a possibility of covering a slightly greater distance,
say, 275 kms., there may be only a very modest profit level if not a break-even situation
for the industry. This was also pointed out by World Bank (2005). On a comparison of
freight rates and estimated costs, it was then suggested that only in a competitive market,
one could expect freight rates to vary little from costs. It was also pointed out that
Pakistan’s trucking industry was facing a similar situation. Given the cost profile, it is
noted that there is provision to meet the schedule of repayment of the loan obtained to
buy a truck. But it is seen that depreciation is not provided for, in which case the operator
in most cases is not in a position to replace the vehicle.
The question arises: How does an operator survive? To do so, the operator is
required to overload – a common feature on Indian Highways. Though the MV Act is
against overloading (the statutory provisions dealing with overloading are set out in
Sections 113,114,194 and 200 of the Act), the provisions for the compounding of this
offence have encouraged the continuance of overloading at least still very recently. The
MV Act empowers the MOT, Government of India to specify maximum GVW and
maximum safe axle weight of all transport vehicles. Accordingly, the Government laid
down these specifications in the fifties with provision for some ad hoc increase since the
sixties. The legal axle load limit in India is currently 10.2 tonnes as provided under the
Section 58 of MV Act of 1988 (as amended in 1996). However, most Indian highways
have been constructed for an axle load of 8.16 tonnes, the legal limit before the 1996
amendment. AITD (1999) had observed that a majority of goods transport vehicles that
are two axle rigid vehicles are overloaded beyond the prescribed GVW. The study also
pointed out that the consignor of bulk commodities such as fertilizers, steel, cement etc.
were overloading their vehicles in order to get economies in buying of freight services.
Thus, the study noted that there has been a tendency not only on the part of truck
operators also on the part of consignors to overload vehicles without regard for the law.
However, World Bank (2005), on the basis of an analysis to asses optimal axle load on
two road sections in India, concluded that the present legal axle load limit of 10.2 tonnes
61
is acceptably close to optimality. It is obvious that any excess beyond the legal limit
could have serious implication for the deterioration of roads, and for the funding required
to keep roads maintained at an acceptable level.
Given the pressures on margins, it is very clear that it is only with a certain level of
overloading that operations turn out to be viable. This is a wide spread practice with axle
loads well in excess of the legal limit – a practice aided significantly by laxity of
enforcement of axle load controls by the concerned regulatory authorities in different
States. Though it must be noted that a higher level of movement to the extent of 108000
or even 120000 Kms. could enable operations to be viable with the registered payload
(simulation exercises relating to these figures revealed the trend towards viability of
operations). Given a situation where overloading is no longer expected to be a possibility
(as a result of Judicial intervention- judgment of Supreme Court on overloading,
November 9,2005- and strict implementation), it is more likely that the overall demand
for trucking services (in terms of vehicles) at any point of time would increase there by
shifting the demand curve for such services. This can no doubt result in a higher freight
rate in the market. But the issue is: whether this higher realization would eventually reach
the operators? It is also a moot question whether a higher level of movement by trucks
on a daily basis is possible given the existing barriers to free trade flows on an inter-State
basis. In order to understand these issues, we examine, in the next Section, the structure
of the industry in terms of the market, its players, the relationships and the implications
for the different players. Our entire analysis is based on surveys mainly conducted in the
Mumbai Region and to a small extent in Goa and Satara. Further in the following Section
an attempt has made to examine the policy and regulatory impacts on inter-State
movement, which ultimately effect competitiveness on the domestic as well as
international fronts.
62

SECTION 4
The Industry – Its Structure, Market Surveys and Analysis
Part I The Industry Structure: the Market Players The structure of the road goods transport industry in India is very complex as it has
always been identified (and continues to be so) as a system comprising of many players
in the field which include among many but mainly the transport operators (who could be
small or fleet operators providing the real haulage services), the user/ consignor
(constituting the ultimate demand for services), the intermediaries – booking agents /
transport companies (who could be operators also) and brokers (who could be placed at
either side of the booking agents and normally work for a commission). Figure 12 gives
the most general picturisation of the structure of the industry in terms of the market
players and their functions.
Figure 12- Market Players and their functions
Players Functions
User needs specialized or general vehicles to transport goods. He represents the demand side of the market.
.
Collecting, forwarding, distributing goods and haulage.
Ensures supply of trucks to the transport contractor.
Transport Companies/contractors/ Booking
Agents (including Fleet Operators)
Brokers/ Trans.Suppliers
Intermediaries
User
Providing haulage Service
Transport Operator
63
Small Operator
Large Operator

Users: The users of road goods transport are the manufacturers, distributors, retailers of
goods and the general public who are typically expected to represent the demand side of
the market. Their choice of road transport, it appears, is influenced by a number of
considerations including the inability of its main competitor, namely, the railways to
provide wagons for loading on time. Above all, a relatively better customer orientation
also provides the cutting edge. This gets reflected by lower transit time, reliability, etc.
though freight rates may be marginally higher.
Intermediaries: The intermediaries seem to play a significant role in the provision of
road goods transport services. These can be normally of two categories, namely,
a) Booking agents/Transport companies/transport contractors: Booking agents are
firms or persons who accept and store goods, both parcels and bulk and arrange for their
movement through operators. This agent is really the person who represents the demand
i.e. he negotiates with and on behalf of the users. He is responsible for collecting,
forwarding or distributing goods carried by goods carriages and also for cargo loss and
damage claims while performing other customer service functions. In some cases, the
agents own trucks and also function as operators. In addition to these services, the agents
also advance money to operators (especially small ones) to help meet their working
capital requirements and by discounting bills on unloading. As regards the volume of
business handled by this category of intermediaries, it is generally accepted that they
have a virtual monopoly of most inter-State and long-distance movement.
b) Brokers / Commission agents/ Suppliers of Vehicles: A Broker is normally
expected to represent the supply side i.e. the truck operators, though in the past there have
been booking brokers who have represented user interests for a commission. The broker
takes a commission from the truck owners and ensures the supply of trucks to the
transport company/booking agent. Given that the dependence on small operators is
significant, there are issues of reliability of the operators, the movement etc. from the
perspective of the User which is supposedly taken care of by the broker who normally is
sought out by truck operators for loads. World Bank (2005) also observed the necessary
64

role played by brokers in terms of ensuring a quality control on the reliability of the
operator and also as a means of facilitating prompt loading by the operators. Large fleet
operators depend on these brokers for moving a certain volume of traffic over and above
what their own fleet would permit.
In the course of our surveys and discussions with different players, we made an
attempt to find out the number of intermediaries – brokers and transport agents/
contractors- who operated in the Mumbai Region. Broadly speaking, there are three areas
from which most of these intermediaries operate. A significant location is the Masjid
Bunder/ Wadi Bunder/ P.D’Mello (city) area. This has traditionally been the area of their
operations especially till the last decade since when only limited movement of trucks in
the city (in terms of area and timings) have been permitted. With the shifting of some of
the major wholesale markets to the New Mumbai area and emergence of warehousing
facilities in New Mumbai and Bhiwandi, intermediaries have been operating from these
two areas as well. Though the market in the city area (in terms of intermediaries) is still
significant, their number in the other two areas is increasing fast. Though a provision for
a major truck terminal has been made by the MMRDA at Wadala, the lack of facilities
here has been a major factor inhibiting truckers from using this facility. As a result, the
intermediaries have also not moved into this area from the city. MMRDA sources say
that work on readying the terminal for use is in full swing and is expected to be over by
end 2006.
As for booking agents/ transport companies, it estimated that there are around 5000
of them operating in the Mumbai region. About 1200 of these are formally associated
with the Bombay Goods Transport Association (BGTA) as members. On further queries,
we understand that most of these members were partnership or proprietary concerns with
the remaining being private limited companies. Most of them are involved as booking
agents only while a good number are operators with limited fleet capacity. Some of them
are also custom agents and multimodal operators in addition to being booking agents.
Custom agents are all registered with the Bombay Customs House and are all members
(totaling 1162 presently) of the Bombay Custom House Agents Association.
65

Operators: Operators are expected to provide the services in terms of movement. The
truck ownership profile in India as brought out in the CIRT study (1998) is given in
Figure 13.
Figure 13 - Truck Ownership Profile in India
10%
77%
4%3% 6% Operators own up to 5
trucksOperators own 6 to 10trucksOperators own 11 to 15trucksOperators own 16 to 20trucksOperators own morethan 20 trucks
Source: Deloitte (2003)
The current ownership profile is somewhat different from what existed in1971 (as
given by NCAER, 1979) when the number of operators owning up to 5 vehicles
constituted nearly 98 per cent of the fleet. The situation was only slightly different in the
early 1990s when it was estimated that the 95 per cent of the vehicles belong to those
operators who had less that 5 vehicles. This reflects a definite change in the pattern of
ownership though it is still true that small owner operators dominate the same. We have
not been able to get any idea regarding the relevant ownership profile in the context of
vehicles registered in the Mumbai region. The number of goods vehicles in the region
totaled nearly 200,000 in 2001. Given that there are a number of operators from other
66

States plying their vehicles in the region, it was considered neither feasible nor necessary
to examine this profile. However, some figures are available in terms of the regular
operators who ply their vehicles between JNPT and different locations. There are nearly
100 operators who own around 25 vehicles while there are 50 of them who own around
50 vehicles and 10 to 15 operators own around 100 vehicles. There are very few of them
owning much more than 100 vehicles. These figures were based on discussion with some
of the port based container truck operators.
Broadly, the operators can be categorized as follows:
1. Small Truck Operators: This category includes single (or small truck operators
owning 1-5 trucks) truck operator, which are very large in number. Entry barriers are low
in the sense that a) there are low capital requirements, b) Ease of availability of capital
though at high cost, c) very little expertise required in terms of educational skills, and d)
ease of obtaining driving licenses and permits. The presence of a large number of
operators has led to a fragmented industry structure. Moreover, though the entry into this
market is supposedly easy, information regarding availability of freight is a formidable
problem. There is dependence on the brokers who give them business. The small
operators as can be seen from the above Figure just give the haulage service. The small
operators are involved mainly in the physical movement of goods and depend on brokers
and other fleet operators who in turn depend on the booking agents for obtaining
business. The small operators are not in a position to perform functions of aggregating,
handling, delivering of cargo and marketing. These operators do not have the
geographical reach and necessary infrastructure to tap business on a continuous basis
hence forced to rely on brokers. They do not come into direct business contact with the
users. This was the feedback from all most all the small operators interviewed so far.
Though the exit option also seems likely in regard to these operators, it is observed it is a
very difficult one since there is no alternative to this work. Therefore, there is hardly any
scope for easy exit.
67

2. Fleet operators: The Large fleet1 operators are small in number even in a region like
Mumbai. The large fleet operators generally operate throughout the country, and have the
capacity to even transport a single parcel in any part. These fleet operators primarily
work on a hub and spoke model. Large operators are also in position to bid for the
contracts with companies. They utilize the services of the smaller operators when they
need to have additional vehicles. Accordingly, the volume of business handled by them is
normally several times more than the capacity of their own fleet. Some fleet operators do
encourage their own employees to own trucks with some financial assistance but on the
condition that these vehicles should be permanently attached to their fleet. It is
understood that fleet operators attempt to derive considerable advantage in their
interaction with users, brokers and others on the basis of their larger size and bargaining
strength derived from size. But an emerging feature is the move from an asset-based
model of operations to a non-asset based model.
The Industry Structure: The Market Makers? The unique ownership profile has created middlemen who act as a liaison. Our
review of the sector in the Indian context revealed the sustained role of the middlemen.
GOI (1966) pointed out the growing role of booking agencies which act as intermediaries
and accept consignments for transport. GOI (1967) observed “the bulk of the trucks
engaged in inter-city transport, which carry commodities which are comparatively and in
smalls, have necessarily to depend on booking agencies” (p.48). GOI (1980) also
observed the dependence of a majority of operators on goods booking agencies for their
operations. Though the NCAER study (1979) found that more than 80 per cent of the
small operators depended on booking agents, subsequent studies by CIRT (1994) and
AITD (1999) revealed that about 70 per cent and 65 per cent of the operators depended
fully on middlemen for their business. This is only one part of the story. Almost all the
Reports/ Studies emphasize a significant role especially for the booking agents and a
somewhat limited role for the broker (except for the CIRT study (1994) which reports a
role for the broker in price fixation). In the context of booking agents, GOI (1980)
specified three main types of their operations. The first relates to an agreement between
1 A fleet comprises of a number with varying payloads.
68

the agent and the operator for a stipulated period during which the former arranges
guaranteed freight at rates fixed in advance. Secondly, booking agents have day-to-day
arrangements and offer goods to operators at prevailing market rates. Thirdly, the agent
acts an intermediary between the consignor and the operator charging commission from
both. Having received representations that booking agents have been exploiting the
smaller operators by retaining margins of commission on freight and charging exorbitant
interest rates wherever they act as financiers, the Committee (GOI, 1980) looked into the
issue but concluded that “we have not come across any concrete evidence to show that
booking agents exploit operators as they seem to be operating in a competitive market”
(p.197). This was quite contrary to the opinion of an earlier Committee (GOI, 1967)
which admitted the existence of high margins though these may not have been as much as
suggested by the operators.
The evidence that has emerged over quite some period of time is that the
middlemen/ intermediaries, which include the booking agents and the brokers, are the
dominant players in the market and they in fact are the real “makers” of the market.
Given this feature, the issue is: who and / or what determines the freight rates? NCAER
(1979) indicated that the booking agents, besides other functions, also had a role in fixing
freight rates i.e. the rate charged to the user and the rate given to operators. AITD (1999)
was more emphatic in observing that these two categories acted as the real power centers
(‘powerful agents’) in the industry and therefore had a major role to play in determining
freight rates. One emerging view is that as a result of significant increase in the number
of operators in the industry, the competitive nature of the market has been strengthened
as a result of which competitive rates prevail. However, it must be recognized that since
the early nineties, freight movement in general has not been in tune with the growth in
capacity in the trucking sector as a result of which average capacity utilisation over the
period 1990-91 to 2001-02 has been only in the range of 57 per cent to 63 per cent which
along with a manifold increase in diesel prices has seriously affected profitability of
operators (Deloitte, 2003). This situation has reflected an excess supply, which has
depressed freight rates. For instance, over the period 1995-96- 2001-02, freight rates have
increased only marginally by 10 per cent on the Mumbai- Delhi route. But equally
69

significant if not more important was the observation “that the freight charges paid to the
truck owners have no relationship with the rate settled between the consignor and the
booking agent” (AITD, 1999 p.45). It is widely believed that the rate paid by the
consignor is a competitive one based on market forces of demand and supply. Even the
most recent study of the World Bank (2005) brought out this feature clearly while
admitting at the same time that the low cost to the user was at the expense of quality. This
really brings us to the question: if the consignor is being offered a competitive rate, which
is low, how much lower is the final rate offered to the operator given that the final rate
has no relationship to the consignor rate? Would the rate to the consignor be lower given
reasonable margins to the booking agents?
These are some of the questions that we examined among the many others on the
basis of surveys conducted mainly in Mumbai but to a smaller extent in Goa and Satara.
The analyses of these surveys are presented in Part II of this Section.
Part II
Market Surveys and Analysis
Any attempt to understand a market for a product / service and its characteristics
would necessarily have to begin with the relevant definitions, which can be primarily in
terms of the product/ service that is offered, the geographic area which it serves, the
nature of substitution possibilities within and outside and the ease of entry and /or exit
into the sector in terms of policy/ regulatory elements and factors within the sector. All
these features can ultimately affect the quantity and quality of services offered as also the
price that is charged to the consumer and the revenue realisation of the producer. We
attempt below some relevant definitions in the context of the RGTI in India.
Service Differentiation
In the context of trucking operations in India, there is a reasonable variety of
services that is offered by the industry. One service relates to the parcel or smalls
business. These mainly refer to small packages booked by different customers, which are
70

consolidated into a truckload for dispatch (this is possibly most equivalent to the LTL
segment in the context of countries like the United States and those of the European
Union). Another relates to larger consignments, which could constitute a FTL or a
number of FTL. The emergence of Containers has only sought to provide some
consolidation in these two product categories. Given that the parcels are smaller units and
there is need to consolidate these, their charges are invariably higher per unit of weight.
A third category may take the form of specialised traffic moving in Specialised Vehicles
such as tankers etc. According to CIRT (1994), specialised movement accounted for less
than 10 per cent with parcels traffic accounting for about 20 per cent. According to
market sources, currently the parcels traffic might account for about 25 per cent of the
movement.
Areas of Operation
Trucking operations can also be classified into Local, Regional and National on
the basis of the spread and the extent of operations. We now examine these in some
detail.
There are some operators who operate at the local level only. Many more seem to
be operating on specific routes on an inter-regional basis. Some others operate on a
national basis. Figure 14 gives this delineation.
Figure 14 - Areas of Operation
Areas of operation
National Operation Route based Operation Route based Operation Local Operation (Inter-regional) (Intra-regional)
1. National Operation
In the case of national operations, the transport companies play a significant role
not only that of operators (fleet operators) but also plays the role of booking agents for
other smaller operators. The geographical area covered by these operators is large and
71

they have a fairly wide network of branches throughout the country. Here we observe the
hub and spoke model is likely to evolve as the market matures. The large transportation
companies are expected to increase their investments in setting up hubs across the
country. The hub and spoke distribution system enables optimisation of costs and higher
revenues for the transport companies/ fleet operators. These transport companies
generally have formal contracts with the users, which is very rare in the case of small
operators.
2. Specific Route based operation (Inter- regional)
It has been observed during the surveys that most brokers and operators concentrate
on certain specified routes such as between the following points:
1. Mumbai- in and around Delhi, Panipat etc.
2. Mumbai- in and around Banglore
3. Mumbai – in and around Ahmedabad
4. Mumbai- in and around Chennai
5. Mumbai – in and around Cochin
6. Mumbai- in and around Kolkata The main factors responsible for the focus on a particular route are:
• Market expansion requires finance.
• Requirement of permits for operating in different States and costs involved in
obtaining these permits.
• The requirement of additional staff and hence staff costs will be higher.
• Infrastructure (or offices at different location, information to establish contact for
return trip etc.) is also a constraint.
Due to these factors, there does appear to be a segmentation of markets on a
route wide basis. Another factor that seems to have contributed to this trend is the
information flow being controlled by few or two groups i.e. the booking agents and the
brokers.
3. Intra-regional operations
In this category, the operators restrict their movement to intra-State operations.
72

4. Local operations
In this case, the geographical area of movement is very limited i.e. only local
operations as for example, movement in and around Mumbai.
Substitution Possibilities
In almost all the categories of services offered and distances moved (exceptions
being local movements), choice of railways as a mode has always been a possibility. This
is especially true in the case of long-distance movements in which case the railways have
inherent advantages, which get reflected in lower tariffs. However, the railway system in
India has been consistently under performing in terms of its potential as reflected by the
inefficiency on the system (Rao and Sriraman (1985), Sriraman (2000)). As a result,
significant movement of bulk items over very long distances has been a common feature
since the late 1960s. With the trucking industry offering the advantages of customer-
tailored schedules, easy availability of equipment, easier maneuverability, smaller cargo
acceptance, flexibility in operation and organisation, door-to-door service, etc., there has
been a continuous shift to road movement despite the higher explicit costs of movement
by road (See Table 10).
Table 10: Road -Rail Rate Differential
2001-02
Particulars Road Railway Difference1
(per cent)
Distance (Mumbai-Delhi) Km 1,407 1,389 - Average freight rate Rs.per tonne 1,395 805 73.2 Loadings/unloadings in truck Nos. 2 4 - Loadings/unloadings in railway Nos. 0 2 - Loading/unloading charges for truck Rs.per tonne 90 90 - Loading/unloading charges for railway Rs.per tonne 0 50 - Handeling loss per loading/unloading Per cent 2 2 - Effective freight cost Rs.per tonne 1,631 1,362 19.7 Effective freight cost Rs.per t-km 1.16 0.98 18.2 1 Percentage differential between road and rail freight rates over rail freight rates. Note: 1) Road freight rate is the average freight rate on the Mumbai-Delhi route. 2) Railway freight rate is for the distance slab of 1,400 Km. Source: Deloitte (2003). With the development of high quality roads in different parts of the country
including the up gradation of important sections of the National Highway network, it is
73

expected that share of road movement would go up further. However, the emergence of a
different railway approach in the past year or so in meeting the demands of the market in
terms of different strategies involving tariffs, insistence on high utilisation of assets,
development of exclusive freight corridors can be expected to restrict shifts to some
extent. The Indian Railways have begun offering highly competitive services in regard to
parcel movement by going in for lease of space for parcel movement on scheduled trains
running from different cities on the network. More recently, the space being offered has
been increased in terms of provision for higher loads (4tonnes), which still comes within
the category of ‘smalls’ or ‘parcels’. Though dedicated freight corridors may take quite
some time to emerge, their emergence (which is expected to be fast) will definitely
slacken the move towards roads if not divert back movement to the railways.
Ease of Entry and Exit
The absence of barriers to entry and exit reflect a fairly competitive market. There
could arise private barriers in the form of structural barriers (product differentiation,
extent of sunk costs, etc.) and strategic barriers in the form of particular behavioral
strategies of incumbents (in the form of threats, pre-emptive behavior, etc.) while public
barriers in the form of licensing and other regulations imposed by the Government.
“There are no entry barriers to this industry; almost anyone who can manage to own a
rickety truck gets into it” (CIRT, 1994, p.8). This observation is perhaps true to a large
extent. Low entry barriers can be attributed to some of the following factors:
• Low capital requirement as compared to other self-employment options
(particularly for buying not so new trucks)
• Easy availability of capital (through unorganised financiers although at a
significantly higher cost for the small operator)
• No expertise required in terms of business or educational skills. A basic driving
skill is the only prerequisite coupled with the fact that driving licenses and
clearances are simple to obtain.
74

• Liberal issue of permits – at State and National levels- has enabled emergence of
the perception that the market for these services is huge.
Given the low entry barriers in the Indian context (in terms of both private and
public ones), the normal consideration for entry into any economic activity, at least on a
priori basis would be the existence of good (or more than good) returns. Our surveys did
reveal such a consideration on the part of operators especially the smaller ones. This was
based on the observation (rather cursory) that other operators were fairly successful in
terms of the financial performance. At the same time, there was only little awareness of
their own limitations in terms of their ability to identify demand for their services. This
fear was to some extent removed on the possibilities of attachment to the larger ones or
other intermediaries. In other words, the new entrants would not normally know where
the demand for their services lay except through the players they are attached to. Thus
even basic information requirements are not available to new entrants. Though this is not
perceived to be a barrier to entry, the problem is formidable and gets resolved only by an
almost complete surrender to other significant players by which time exit is also ruled out
an option. Thus, there are information asymmetries to contend with. Given the lack of
alternative employment opportunities, exit was not considered. Many of the smaller
operators confessed that hung on to the business and given that their families were all
located at their native villages, as single individuals, they managed to continue their
operations especially in urban areas.
As for competition within the industry, we examine these issues below in some
detail taking into account the areas of operations and the extent of involvement of the
different players in terms of different relationships in different operations.
Interrelationships
The surveys focused on different supply linkages with a view to examine the inter-
relationships between various players in this market. Following patterns have emerged
from it. This has been explained in form of flowcharts below
75

1st Model
User Operator
The above model is applicable only in case of local (within a particular city or
peripheral areas of the city) market. Given the geographical spread of operation is very
limited, and the informational requirements are minimal, there is almost no role for
intermediaries in these operations. The contract is mostly informal except in the case of
specialised requirements in terms of vehicles for a long period (case considered later).
The surveys indicated that there is hardly any scope for middlemen. Generally in this
market the operators and users are in a position to determine the freight rate and this
seems to be the most competitive market. This is especially the case relating to
movement of household items on a local basis. However, even in the case of local
movements, we have come across instances wherein there are attempts to fix rates at
higher than the market level as a result of forming associations/unions. AITD (1999)
observed, “The practice of truckers forming cartels particularly in important industrial
locations would need to be discouraged and competition encouraged” (p.53).
In the Mumbai context, our surveys reveal the possibilities of such control on
freight rates mostly in case of light commercial vehicles (mostly tempos) in and around
the ports (Dock Local Unions), in and around Industrial Estates like Andheri Industrial
Estate (MIDC) in Mumbai, Wagle Industrial Estate in Thane and industrial area in
Bhiwandi. Some operators also mentioned existence of price fixing unions in place like
Daman. On the basis of our discussion with some local operators we understand that in
the context of setting up new economic activity like industrial estates there are informal
provisions to make use of locally available skills and services including trucking services.
In fact, some water tanker operators pointed out that even for more formal contracts
involving water supply on a long-term basis, there is priority provision for operators
from the local area. It has been pointed out to us on many occasions that there are such
76
cartels of operators in different parts of the country. The CIRT study (1994) observed the
existence of strong associations of operators such as Calcutta Truck Owners
Associations, Durgapur –Bilaspur Truck Owners Associations, which prevent other
trucks from entering their areas of jurisdictions. It is not quite clear whether these
associations also ‘fixed’ prices. In another context, it was pointed out that truck owners in
some regions of Himachal Pradesh do not allow entry of outside operators for movement
of apples. Once again it appears that the provisions for a priority clause in favour of the
local, to begin with, may have led to this kind of attempts to fix prices. And the practice
would have been continued. But we feel that these are attempts to price fixation on a
highly localised basis. A reference to the MRTP cases (almost all) cited earlier in the
Indian context emphasises this point.
The local markets where there does seem to be some attempts at price fixation is
not based on the strengths of any formal combined efforts since we did not notice the
existence of formal associations which are registered with any authority based on a
memorandum of association. Given that the entry of tempos and light commercial
vehicles (which normally take care of local movements) has been very significant in the
past two decades, one would expect a competitive situation with a large number of
operators competing for a set of loads at the local level. However, this is not happening.
Let us digress a little and consider the market for taxi or auto rickshaw services. These
operators have to take a permit and are allowed to be based at certain specified location
where they could wait for passengers. These locations are all specified by the RTA. With
the number of locations for parking not having increased (with increased number of
permits), taxis and auto rickshaws have, over a period of time, begun to operate from a
number of areas (parking spaces which run into hundreds- being based they are at ever
street corner). With a few at every location, they invariably allocate areas which they
would head for – though not necessarily get involved in some price bargaining. Local
trucks have virtually no allotted parking spaces. As a result, they have been following the
pattern of the Taxis, etc. in basing themselves in small numbers wherever possible to get
loads. Being small in number and with no possibility of a return load, they attempt to fix
price maybe at more than typical expected market levels.
77
One exporter who fabricates wooden furniture in the city and exports
manufactured furniture items mentioned that he found operators near his unit in Reay
Road often quoted a relatively high rate of Rs 500/- for moving a tempo loaded with
goods to a place in Masjid Bunder – situated about 4 kilometres away and which takes
about an hour to cover on a normal day. His view was that people were being charged
nearly twice (or even more) the one that would be based on a fair consideration of costs
with a reasonable return. The modus operandi was to quote a certain rate when business
operations began at day time which would then be the quote for the rest of the day for
almost everyone who operates from the locality. This situation prevailed all over the city
in terms of a number of localities. We need to emphasise that such a situation exists only
for movement of industrial items/ export items over short distances – within the city or in
the suburbs and was based mostly on informal arrangements between the operators who
had the full support of the local politician.
Some users also referred to the dominant role of a single operator or a set of
operators in the context of local movements within, say, the Jawaharlal Nehru Port, New
Mumbai. Given that a lot of stuffing and de-stuffing that takes place and given the time
considerations between arrival at the gate and possible loading on to vessels and thereby
the need to use the buffer yard for waiting, etc., the local movement is handled by
operators hand-picked by the port authorities. This is done by a tendering process – the
disadvantages, problems faced are examined elsewhere. Apparently, the local movements
which are based on rates (as per the lowest bid) are handled so very inefficiently by the
appointed operator(s) resulting in the costs of movement (which includes delays) being
much more.
We noted in the Pithampura (A.P) case (MRTP Enquiry: RTP Nos. 402 of 1988, 97,
98 and 99 of 1989), the MRTPC had argued that this was more in the nature of a criminal
case for which the police needed to be informed. A similar cartel like arrangement is
supposed to be in operation at the Jawaharlal Nehru Port at Nhava Sheva. Though
informal, the operators are being organised as the Pagote Prakalpagrasta Truck Tempo
Malak Association Maryadit which does not allow other operators to lift anything of
78

the order of 4.5 tonnes or less without paying a hefty amount. According to some of the
office bearers of the Bombay Goods Transport Association, this problem arises once in a
while only, of late, due to active role of the local police in attempting to curb this
practice.
2nd Model
Owner operator
Broker User
The market for this service is seem to be perfectly competitive with large number of
users and a large number of operators but it can be seen in the above structure that there
is an intermediary who is a broker here who gets a certain fixed commission for his
service. This type of model is prevalent mainly in the where the area of operation is
limited i.e. area of operation is mainly within the state. In this case, the informational
and other requirements are limited and hence provided by the broker. The final user price
appears to be based on the market forces of demand and supply because there are large
number of brokers (some operators in Vashi mentioned that they depend on 4-5 brokers
for their intra-state operations). But as these brokers have tie-ups with brokers in other
parts of the state, the broker in other parts of the states is likely to receive a higher
commission by paying the driver a lower rate for the return load. A part of this
commission would be passed to the broker in the original destination. Thus, the brokers
are not as innocuous as they seem, in the sense they are not just benign search agents
charging fixed commissions for uniting an operator and a user. In some cases even the
driver who fixes for the return load gets the commission for the return load. But given the
large number of brokers, the commissions that they receive are likely to be a normal one
in the range Rs.300-500 for one transaction. This does not seem any different from the
figure quoted by the World Bank (2005).
The Goa case study (see Annexure III) reveals such a relationship in the context of
movements of iron ore from the mines to the port. These are purely short distance
79
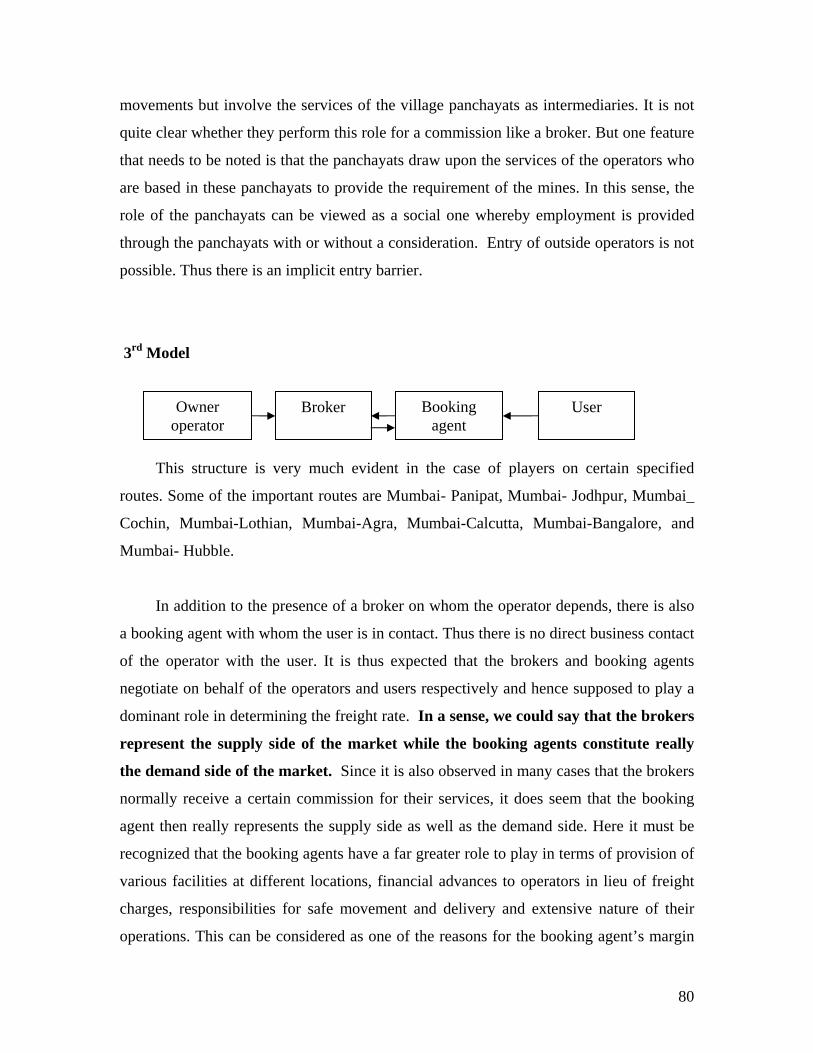
movements but involve the services of the village panchayats as intermediaries. It is not
quite clear whether they perform this role for a commission like a broker. But one feature
that needs to be noted is that the panchayats draw upon the services of the operators who
are based in these panchayats to provide the requirement of the mines. In this sense, the
role of the panchayats can be viewed as a social one whereby employment is provided
through the panchayats with or without a consideration. Entry of outside operators is not
possible. Thus there is an implicit entry barrier.
3rd Model
Owner operator
Broker User Booking agent
This structure is very much evident in the case of players on certain specified
routes. Some of the important routes are Mumbai- Panipat, Mumbai- Jodhpur, Mumbai_
Cochin, Mumbai-Lothian, Mumbai-Agra, Mumbai-Calcutta, Mumbai-Bangalore, and
Mumbai- Hubble.
In addition to the presence of a broker on whom the operator depends, there is also
a booking agent with whom the user is in contact. Thus there is no direct business contact
of the operator with the user. It is thus expected that the brokers and booking agents
negotiate on behalf of the operators and users respectively and hence supposed to play a
dominant role in determining the freight rate. In a sense, we could say that the brokers
represent the supply side of the market while the booking agents constitute really
the demand side of the market. Since it is also observed in many cases that the brokers
normally receive a certain commission for their services, it does seem that the booking
agent then really represents the supply side as well as the demand side. Here it must be
recognized that the booking agents have a far greater role to play in terms of provision of
various facilities at different locations, financial advances to operators in lieu of freight
charges, responsibilities for safe movement and delivery and extensive nature of their
operations. This can be considered as one of the reasons for the booking agent’s margin
80

not being fixed and it is the difference between the freight rate charged to the user and the
rate, which is paid to the operator. But there are limited situations in which the broker can
play a very significant role in determination of freight rate in which case he represents the
supply side. In general, it does appear that the booking agents have a dominant role to
play in determining the freight rates. Normally, given the existence of a number of
booking agents, the freight rates seem to be determined competitively. The assumption is
that there is good information flow to the users regarding the market. However, during
the peak season (October to December and March to June) when there is a tremendous
pressure from the demand side, the information flows appear inadequate. As a result, the
intermediaries are in a position to hike the freight rates well over and above the normally
expected bench market rates. A number of brokers revealed this to us.
In Satara, it was observed that a group of small operators were organised in
such a way so as to not only take care of information requirements but also provides for
allocation for movement on a day-to-day basis. However, it is to be noted that this did not
really result in a price different from the prevailing market.
4th Model
User Booking Agent
Fleet Operator
Broker Operator This is a variant of the third model in that there is demand for a fleet of vehicles for
handling movements perhaps on a continuous basis. This model is also evident in case of
specific routes. The large fleet operators get the freight through the booking agents but
outsource it through the brokers to the small operators. Thus, the fleet operators in a way
also play the role of intermediaries here for which they either take commission or just pay
lower freight to the small operators. Here again the booking agent does seem to have a
significant role. The issue is: whether the intermediaries dominate the scene?
One observation (made by many Committees in the past) that is pertinent here is
that the freight charges paid to the truck owners have no relationship to the rate settled
between the user/consignor and the booking agent. With the broker being a more passive
81

player relative to the booking agent, we suspected a fairly high margin for the booking
agent. GOI (1967) observed ‘It has been alleged that at times the margin of profits
realised by booking agencies from truck operations is as much as 50 per cent of the
freight they charge from clients’ (p.49). The operators quoted the margins of booking
agents to be 25 to 35 per cent on the freight realised. More specifically, a figure of
Rs.4000/- on freight realisation of Rs.10000/- was quoted by a number of operators
especially the smaller operators. The booking agents themselves admitted only to a
margin of 10 to 15 per cent of the revenue realised. Some of them even revealed specific
figures of Rs. 1000 on revenue of Rs. 10000/-. In World Bank (2005) the transporters/
booking agents admit that the amount they have to pay to the truck operators on any
given day can vary from half of their revenue to more than 100 per cent of the revenue. In
the context of the peak season, it was revealed by some booking agents that the higher
realisation is not necessarily passed on to the operator. Once again it is to be noted that it
is lack of information flows which gives rise to this problem for the operator. Whereas it
is the information flow that gives the intermediaries some advantage in the market.
In the 4th model again the booking agent plays the same role vis-a- vis the user as in
the third model depending on the nature of the demand conditions. However, given that
the fleet operator is in far more better position to obtain information, it is observed that
the booking agent does not really benefit in terms of the margin. The onus is now on the
fleet operator since he is in advantageous position vis-a –vis the smaller operators. Our
surveys revealed that the smaller operators were victims in this regard though not on a
regular basis.
In Goa, some of the small operators who are involved in long distance movements
have a tie up with a fleet operator, say, Transport Corporation of India (TCI) a major
player on an all India basis. TCI provides the framework under which the small operator
act as franchises in a formal way for which they are charged a price in addition to the
margin available to the fleet operator in the case of an attached vehicle. The survey
revealed that there are few companies operating on all India bases. These companies need
to have warehousing facilities, branches all over the country, network of hubs and sub-
centers. So accordingly their costs also differ. It was revealed to us that the user prefers
82

specific route operators when there is full truckload, as they are faster and less costly. But
when small parcels have to be transported the users approach companies which have all-
India operations.
In the case of international trade, both these models appear to adequately represent
the relationships. Our survey of some exporters revealed that it is the smaller ones who
really bear the burden of somewhat higher prices and poorer quality of service since they
depend significantly on the intermediaries who also take care of other requirements in
terms of formalities at the ports, etc. The president of the All India Importers and
Exporters Association was critical of the role played by these. Though the trucking sector
is still a highly disorganized one, he pointed out that transport companies who really
arrange for the movements have been dominant in fixing rates in the past. Further, earlier
there were also issues related to entry of outside operators to pick up cargo at the ports.
However, giving the presence of a large number of such companies, this tendency is
confined to pockets and mostly for local movements as pointed out earlier. One other
issue in the context of trade movement that we examined related to the quality of services
by the industry. World Bank (2005) observed that while the industry delivered very low
freight rates service quality was poor with low reliability and transit times double that of
developed countries. Such poor levels in terms of quality is adequate for low value bulk
items (which should normally be moving by rail) would hardly be considered appropriate
for international trade movements. When questioned, exporters hold that for a long time
even routine handling, processing for movement by trucks were not satisfactory as a
result of which exporters would take extra care by way of packing which meant
additional costs. However, in recent years, the trucking industry has responded to these
requirements in significant way. But there are other issues that need to be addressed. One
set of issues relate to inland transport component and the other to the port component of
the transport chain of, say, exports. The barriers to movement across the States in terms
of the poor road conditions, the delays on account of different regulatory and taxation
authorities and the resulting facilitation payments contribute to increasing the inland
transport cost component. Lata (2005), in the context of an attempt to examine the effects
of infrastructural impediments on the competitiveness of India’s exports, has pointed out
83

that when we compare the inland transport cost with ocean freight, it is observed that
magnitude of inland transport cost is disproportionately large. In addition, poor
processing, handling at the ports also impose additional burden on the exporter. Porter
(2004) points out that the size of India’s transport cost disadvantage for, say, textiles
shipped to the United States was around 35 per cent, 20 per cent and 10 per cent when
compared with China, Thailand and Indonesia respectively.
The 3rd and the 4th models seem to represent a significant part of the movement in
terms of the tonnage handled, distance moved – in short, the output produced. Even
though there is segmentation of markets in terms of region wise movements, given the
large number of players in terms of various categories constituting the markets, structure
of the market thus seem to be market driven and appears to be serving it reasonably well.
5th Model
User Fleet operator Owner Operator
In the above model there are three players but no middlemen. The fleet operators
generally bid for contracts and have formal contracts. This is the case where there is
‘competition for the market’ which though not a substitute for ‘competition in the
market’ is a good surrogate. The basis for this is auction theory, which traditionally
promised to deliver many of the games that competition in the market would have
delivered. The implicit assumption was that the number of potential providers in the
sector would be large enough to allowed competition for the market to be effective. This
has not happened in many of the infrastructure related sectors.
This model is observed in case of market for highly specialized vehicles where
large fleet operators have access to the market for bidding but small operators do not
84
have entry because of various entry barriers.2It is the large fleet operators, which actually
bid for the contract with users. They utilize the services of the small operators. That is, in
case additional vehicles are required then they outsource them from the small truck
operators. So the fleet operator here is playing a multiple role- of that of a booking agent,
a broker as well as an operator.
The bidding process in the case of formal contracts (which are normally for two
years extendable by one year) concerned certain important issues. In a formal contract,
we were given to understand that the users prefer multiple transporters instead of relying
on a single transporter. The user’s demand varies as per the season with the demand for a
higher number of vehicles during the peak season with additional numbers quoted for the
purpose of backups. For example, if the peak demand for vehicles is 180, user will put up
a requirement for 200 vehicles. In addition, requirements are also influenced by factors
like provision for annual growth, vehicle breakdown, and emergency requirements. To
provide a benchmark tariff, which serves as a basis for comparison with rates quoted in
the bidding process, users undertake their own calculation of freight rates, which is based
on historical costs, change in the input prices and estimation of logistic costs.
From the operator’s point of view, there are certain eligibility conditions such as
that the transporter should have certain specific number of vehicles of his own and three
times that number can be in terms attached vehicles. If it is the distributor of the user, he
can have owned vehicles in addition to the attached vehicles. This has important
implications for the small and new operator, as the transporter cannot be a new player; he
has to be an established player. Another condition is the fleet will be a captive one and
cannot be used for sub-letting. Sub-contracting is also not permitted .In other words, the
contract is agreed to on a principal-to-principal basis. The transporters have to pay
Earnest Money Deposit, which is repaid back to all the bidders once the tender is open.
The successful bidders are then expected to pay security deposits of specified amount.
The number of transport players, which bid for the tender generally is very large, and it’s
a mix of small as well as big players. The transporters interest in bidding is based on the
2 Operators having certain number of trucks/tankers can only bid for the contract.
85

factors like the number vehicles required, the number of trips the vehicle can make, the
mileage, loading and unloading base, the use pattern of the user. The tender is a pegged
tender and is a combined tender with one company acts as a front company and
negotiating on behalf of the others. The issue is: whether this form of tendering means
collusion among the participants? We have been informed that this grouping is meant
essentially to pitch themselves against other groups to get the business rather than any
attempt to fix rates. Even within a group, one operator acts as a leader while the others
take turn in consequent biddings. This seems to be the typical case of many players
tending to hedge by being involved as members of consortium rather than as individual
producer.
We have examined two major public sector users namely, Bharat Petroleum
Corporation and Container Corporation of India in this category of models. Though
conditions for bidding are different in some ways, they follow the general guidelines
adopted by Public Sector Enterprises. In both cases it is revealed that the Users are able
to get the most competitive rates given a fairly large availability of specialised trucking
services. In a recent bid for movement of liquid petroleum gas cylinders, we understand
that Bharat Petroleum was able to pitch the rate per cylinder at Rs.7/- as against the
quoted rate Rs.7.63 based on a costing sheet given by the transporters themselves. A
private sector company namely United Phosphorus Ltd. - manufacturer of wide rage of
chemicals – which exports chemicals and huge quantities also reported getting very
highly competitive rates for their movements from the northern and western parts of the
country to the Mumbai ports. Given that these users require bulk movements over a
period of time, the movements are substantial. They are able to pin down the operators.
Spokespersons for the All India Bulk Liquid Importers and Exporters Associations and
the All India Exporters and Importers Association also spoke of obtaining the most
competitive prices for trucking services from and to the Mumbai ports. However, it is
understood that there are issues relating to movement within the ports especially Nava
Sheva which is normally given to one operator on a bid basis for a certain period of time.
The larger tanker operators who really bid for the tenders appear fairly satisfied with final
86

rates fixed though the smaller operators complain of high margins for the larger operators
and accordingly a lower return for them.
The case study of Satara (Annexure II) reveals that in the case of long term
contracts – relating to grain movement (Public Distribution System) – there is virtually
only one fleet operator who handles these contracts on a continuing basis. Though there
are procedures to be followed in terms of bidding etc., it appears that collusion between
the consignor (a State Government Department) and the operator preempts outsider entry.
A recent report (TOI, 2006) referred to allegations made by some of the Ministers and
officials of the Government of Maharashtra that the State Government had lost Rs.250
crores in the last few years in transporting food grains for the public distribution system.
Transport contractors who have not changed after 1996 were undertaking this movement.
According to the report, a group of contractors has managed to influence decisions of the
state food and civil supplies department in their favour and that rates quoted by them are
350 to 400 per cent higher than prevalent rates. According to the report, there is a petition
before the Bombay High Court challenging the process of tendering. This is possibly a
case of bid rigging. It would be useful to point of some of the observations in ADB
(2005) in the matter relating to bid rigging for the market especially those involving
government agencies. It is pointed out that in many developing countries, the size of
government purchases is now so large that only small reductions in the amount of bid
rigging on state contracts would more than cover the costs of cartel enforcement. This is
particularly noteworthy since as mush as a quarter of documented law-enforcement
actions in developing countries involve bid rigging against state purchasers.
In this context, it may be useful to refer to some of the court cases that have been
reported by the Bombay Good Transport Association (BGTA). In a number of these (in
different parts of the country), the courts (Case No.216 of 2001 – Orissa High Court,
Case No.1122 of 2001 of the Kerala High Court, CaseNo.85 of 2000 of the Gauhati High
Court) have held that public sector unit/ government department need not necessarily
have take the lowest price bid provided the unit/ department is able to provide valid
87

reasons for approving a higher price bid (see www.bgta.org). We have not been able to
look into the matter in greater detail.
Part III
The Competition Act, 2002 and the Findings of the Study
Competition law provides a regulatory framework to maintain and improve
efficiency in markets, promote competitive practices, and restrain price rises in markets
where competition is affected by business practices ( collusive price-fixing, input output
allocation, bid rigging); abuse of dominant position (exclusion, discrimination and
predation); and mergers and acquisitions. Competition laws in many developing countries
also cover a broad range of anticompetitive actions and policies, including discretionary
grants of monopoly power and undue restrictive government regulations.
In the Indian context, the provisions of the Competition Act of 2002 are broadly in
terms of the following:
• Prohibition of anti competitive agreements – this includes contracts, arrangements
and understandings between competitors (horizontal) – such as market sharing,
price fixing, collusive price fixing, input-output allocations and bid rigging, etc.
Also of concern are exclusive supply arrangements (vertical restraints such as tie-
in arrangements, resale price maintenance, etc). Two factors are often assessed to
determine whether competition is unduly lessened or prevented: the structure of
the market and the behavior of the parties to the arrangement to determine the
agreement’s likely effect.
• Prohibition of abuse of dominant position- where firms already have significant
market power, the authority would not seek to make such power illegal. Structural
dominance alone is not the focus of this provision. However, the provision would
necessarily seek to prevent abuse of such dominant power.
• Regulation of combinations- these provide the tools to discipline anticompetitive
behaviour before it takes place. Since, for example, a merger is forever, these
provisions allow for careful scrutiny for potential negative effects on the
economy. Specific criteria that is to be considered when to allow a merger or not
are availability of substitute products, barriers to entry, effective remaining
88

competition, removal of an effective competitor, etc. These factors are examined
to decide if there will be a substantial lessening of competition post merger
We now attempt to understand the issues relating to the study within the framework
of provisions of the Competition Act, 2002. Considering the traditional hypothesis that
certain players dominate the sector and abuse their power (abuse of dominant position),
we have noted that this was indeed the case in the past as pointed out by the various
studies wherein it was pointed out that the intermediaries (apparently few in number)
dominated in fixing tariffs and were beneficiaries of huge margins – at the expense of the
operators and the users. This does not seem to be the case now given the large number of
such intermediaries. The long distance movements (as represented by the 3rd and the 4th
models) seem to represent a significant part of the movement in terms of the tonnage
handled, distance moved – in short, the output produced. Even though there is
segmentation of markets in terms of region wise movements, given the large number of
players in terms of various categories constituting the markets, the structure of the
market thus seem to be market driven and appears to be serving it reasonably well.
The sector is a very highly fragmented one with the biggest operators owning just
about a few hundred vehicles. Market sources do not expect consolidation especially in
face of asset based operators (big ones) turning to non-asset based operations in a
significant way. These are mostly related to parcel traffic and small loads which need to
be consolidated at different points (hub and spoke operations). As a result, the emphasis
is on investments on warehousing with movements being outsourced. In the United
States, this has been the typical less-than- truck load (LTL) operations in which segment
there has been consolidation in terms of mergers but this model has been based on
extensive vehicle fleets as well as other facilities which require huge investments thereby
posing issues of entry into the industry. We have noted one such case involving a merger
between two organisations in the United States which was approved by the United States
Department of Justice based on the expectation that there would not result less
competition in this segment of movement.
In a consideration of anticompetitive agreements, the examination of the different
markets revealed that i) (in the 1st Model representing local movements) there is a
89

tendency in local markets for price fixing practices based on informal arrangements and
on the basis of local political support, ii) in the model representing specialised
movement, movement on a long term basis (5th Model) where tendering aimed at
substituting ‘competition in the market’ by ‘competition for the market’ prevailed, there
was a ( in some cases) tendency towards informal combinations which was aimed at
clinching the deal without really influencing rates ( which was not easy in the face of
large users of services). The question then arises: is there a possibility of use of
countervailing power (as an anti-competitive practice) in the case of large users? We
examined this aspect in the course of our surveys.
Consider, for example, the tanker market. We spoke to some of these
operators (especially in the oil tanker segment) and also with their local association.
Though representing a specialised segment, there has been a steady increase in supply in
terms of the numbers entering the market. Given the important role of bigger operators in
bidding for contracts, there is a possibility of the smaller ones (who once again dominate
in terms of providing the single tanker in large numbers individually) not being given the
appropriate rate. As is the case with general trucks, the profit margins are low with the
small operator bearing the brunt of the burden. The profit margins are low because the
users may be attempting to get better rates (than what are quoted at the time of bidding).
However, we examined this dimension of the issue with the help of some data provided
to us by Bharat Petroleum. Based on the lowest quote, the rate was put forward as
Rs.7.63 for movement of a cylinder of a 14.2 kg. LPG (Liquefied Petroleum Gas)
cylinder. The final rate that was agreed upon was Rs.7.00 which, given the operators cost
profile, just about provided a break-even situation. The operators seemed to be satisfied
with this situation. The role of the tankers’ association is to prevent exploitation of
smaller operators by bigger operators as well as minimize harassment by police, RTO,
etc. In the case of United Phosphorus, a major user of the trucking sector for movements
between States as well as to the ports for export, we were given to understand that all
such movements were based on contracts though not always on a bid basis. However,
what was most important for the user was the quality of service provided in terms of the
various dimensions such as reliability, safety, etc. Taking into considerations these
aspects, the practice has been to rely on a certain set of operators over a period of time
90
which ensures a certain loyalty to the user which meant that the user did not necessarily
impose their significant purchasing power to push up rates to clinch the deal. Even from
the perspective of certain operators, this did appear to be reasonable to conclude. For
example, Om Shree Ganesh Container Movers revealed to us an annual contract for
transport of containers that they had with a major forging company in Pune for their
movement requirements between Pune and the Mumbai ports. The contract, according to
the operator, was being continually renewed (resulting from the quality of services
provided as revealed in the contract) on rates that the operator found to be very
reasonable. But it must be admitted that a more detailed empirical analysis involving
many more large buyers would be required to be made to emphatically state that
countervailing power (on the part of the users especially large ones) is either of
significance or not in the context of the trucking sector.
However, very limited evidence points out to bid rigging practices by operators
especially in the local movement of food grains for the public distribution system.
Though these may be highly decentralised in terms of areas, it appears that the same
operator or the same set of operators have continued to be given contracts for movements
over a considerable period of time. This may be due to wrong tender design or collusion
with authorities. We have not been able to examine the tender documents of these
regional level authorities but have found those prepared in connection with oil
movements (Bharat Petroleum) and container movement (Container Corporation of
India) to be of the standard design with all the requisite details and specifications (at least
to our knowledge). These are standard documents used by the public sector (with
variations to suit the matter at hand) and have been time tested. There does not seem to be
any reason to doubt the design of the process and the related documents. It does appear
that the problem lies with faulty implementation and this seems to indicate active
collusion with the authorities.
To conclude, from the above different supply chain models one could say that
the market appears to be segmented on various basis, say as per area of operation,
as per routes, i.e. operators as well as booking and commission agents seem to have
91

certain preferred routes. The preference for the area of operation is in general
based on familiarity with the route, contacts on that route, infrastructure required,
which in turn reduces associated risks. Historically, this kind of market
segmentation seems to have led to more powers in the hands of intermediaries as the
information flow was normally accessible to the intermediaries only. Therefore, in
the past, these intermediaries have enjoyed higher margins and have been in such a
position so as to exploit the market situation in their favour. However, over a period
of time, the entry of a large number of players, both operators and intermediaries, is
ensuring that the structure is driven by market forces. Given the dominance of
small operators and the user requirements in terms of reliable haulage, loss
protection, the role of the intermediaries is substantial and proving to be useful to
both from demand and supply perspectives. Though, there could be situations
wherein these intermediaries seem to be colluding with each other in fixing freight
rate as well as the conditions and terms of freight movement, the existence of a large
number of these intermediaries especially in the significant sections of the overall
movement reveals an overwhelming tendency towards a market determined revenue
sharing arrangement. The Mumbai market reflects this scenario to a very large
extent. However, concerns that have been raised regarding cartelisation practices in
local movements and bid rigging practices in the context of attempts to aim at
competition for the market by way of tenders and open bid procedures, need to be
looked into and such practices removed/ curbed.
92
SECTION 5
Effects of Policy and Regulatory Regimes on Competitiveness of the Industry
Several Committees and Study reports have, in the past, pointed out the
implications of several policy and regulatory regimes on the efficiency and viability of
operations of the trucking sector and thereby its competitiveness in the Indian context.
We examine some of these aspects now. We begin with issues related to policies and then
take up the regulatory aspects.
Some Policy Effects
Taxation Regime Taxes of various kinds and in varying rates are often imposed without consideration
to their distorting aspects. States have often attempted to reduce taxes in a competitive
spirit to attract trade and industry to the State concerned]. Such competition in sales tax
leads to legitimate concerns and there has also been an attempt to unify and harmonize
sales tax rates, so as to move towards a value added tax (VAT). However, there is also
the point that in an attempt to absorb the resultant revenue loss from competitive
lowering of sales tax rates, States have sought to identify new sources for levying taxes.
There has thus been a growing tendency to transfer tax liability to the transportation
sector for quite some time.
The tax regime is both transport-specific and commodity-specific. Vehicles are
detained for checking payment of commodity-specific taxes such as sales tax, octroi and
other local taxes. These checks are generally done by the respective agencies at separate
points, resulting in more than one detention for this purpose. At the same time, there are
specific taxes levied on the transportation sector, for instance, road tax, national and state
permits, etc. Taxation of motor vehicles is a widely used instrument for raising
resources. Usually, the transport carrier is detained at five different locations for
collection of tax or checking the papers at the State and District level.
According to Debroy and Kaushik (2001) what differentiates the existing system in
India with that of taxation systems practiced outside India is the delay and harassment in
93

the tax recovery system. Domestic trade taxes in India are in need of reform. The tax
regime that is in place today is archaic, irrational and complex. It interferes with the free
play of market forces and competition, causes economic distortions and entails high costs
of compliance and administration. Under the Constitution, the basis of excise duties and
sales tax, the two principal components of the domestic trade taxes, are distinctly defined
– excise duty as tax on production of goods and sales tax on consumption (sale or
purchase). In practice, the two have come to overlap because of problems in
administering taxes at the retail level.
Vehicle and operation related
In the context of assessing tax burden on a unit of operation, say, a truck operating
to a certain utilisation and moving over a certain distance, GOI (1950) observed “these
taxes alone amounted in the case of lorries to 100 per cent more than the average earning
per ton-mile for carrying traffic by rail” (p.25). The general conclusion was that the
prevalent taxation policies of the Central and State governments do not conform with
their overall policy of developing road transport as a national enterprise. GOI (1967) was
more specific when it pointed out “that the burden of taxation on the road transport
industry has been increasing. The margin left with the transport operators after the
payment of taxes is not sufficient to enable them to plough earnings in an adequate
measure for replacement let alone expansion” (p.63). The general conclusion was that the
tax element in the cost of operation had become a definite disincentive to the healthy
development of transport. NCAER (1979), on the basis of a detailed exercise, found that
the situation had not improved and pointed out the need to rationalize the tax structure so
as to ensure that taxation would be growth oriented rather than a hindrance, as it has been
in the past. According to a World Bank study (World Bank, 1989), the position in regard
to the incidence on vehicles was most unsatisfactory in India. Since vehicle taxation in
India was road damage related but levied on the basis of gross vehicle weight rather than
on potential axle loads resulting in under taxation of 2 axle trucks compared to those with
more axles. Since the former is a major source of revenue to the States (accounting for
one-fifth of the revenue from road users), it has been felt that there is need for
rationalization/ restructuring to ensure that the tax burden is distributed fairly among
94
different types of vehicles according to PCUs (passenger car unit) as well as the road
damage caused by each type of vehicle according to the equivalent standard axle.
As for the taxation element in the operating cost, GOI (1967) had come up with a
figure of 35.2 per cent. NCAER’s (1979) figure was at higher at 42 per cent. The
corresponding figures for the US and the UK were 5 per cent and 17 per cent respectively
for the early seventies. More recent estimates (Sriraman, et.al., 1998) of the tax burden in
the price of the vehicle were 31 per cent and in the operating cost 57 per cent. A high tax
burden would naturally affect competitiveness of services especially viewed from the
perspective of growing liberalization and globalization of markets. While it was
reasonable to expect this burden to come down to levels obtaining in advanced countries,
rationalization should necessarily lead to a lowering of the tax burden to about 15 to 20
percent (of the operating cost) – which are close to figures emerging out of optimal tax
exercises conducted in the context of developing countries (Newbery and Stern, 1987,
Ray, 1993). A detailed enquiry is called for in this regard.
Commodity-related Taxes An important feature of the prevailing tax system is the existence of a large number
of barriers for passenger and goods. Documents received by check-posts help the
transport department to monitor flow of goods into the State and also make an assessment
of tax. These check-posts, however, interfere with the free flow of traffic within a State
and cause harassment to a large body of dealers, the majority of whom are not liable to
pay tax. Studies undertaken on the efficiency of check-posts in different States reveal that
the existence of check-posts does not contribute significantly to checking tax evasion. On
the contrary, the more the number of check-posts, the higher is the wastage resulting from
stoppage of traffic.
Regulatory Effects
The MV Act of 1988 (1939 as amended over a period of time) prescribes conditions
for regulation of all types of road transport, viz, passenger transport in public and private
sectors, tourist transport, contract carriages and goods transport. The regulatory aspects
(in terms of different dimensions) relate to quality of vehicles, safety, labour,
95

environment, loading, policing, etc. The Motor Vehicles Departments of the various
States are concerned with the enforcement of the provisions of the Act. Almost every
high –powered Committee that has gone into an examination of the issues of road
transport in the Indian context has observed that the focus of these departments has been
on collection of tax revenue from motor vehicles and not on effective enforcement of the
various provisions of the Act. As a result, other important functions such as mobility,
safety, fuel conservation, environmental protection, etc. have hardly been attended to. In
fact, AITD (1999) observed, “the regulatory mechanism has fallen far short of
expectations” (p.24). However, even this limited focus has, it appears, given rise to a
number of problems especially smooth flows of movements thereby affecting efficiency
of operations.
One important index for measuring the efficiency of a transport system is its
adequacy. Adequacy is not merely influenced by the size of the fleet in operation but
much more importantly by whether a given fleet moves frees without restraints so that its
effective capacity is utilized and hence productivity enhanced during a given period of
time. The smooth flow of road goods traffic is hampered by frequent detentions of
vehicles for one reason or the other at various check points and mid way. Vehicles are
detained for checking essential documents such as registration book, driving license,
permits, etc. (RTO checking). They are also detained for checking payment of
commercial taxes such as sales tax, octroi, other local levies, etc. In addition, detentions
take place for booking traffic rule violations (Police checking) and also at State borders
(Border Post checking).
According to Debroy and Kaushik (2001) besides having to conduct their
operations within the framework of the Motor Vehicle Act, the operators have to fit their
operations within the regulatory regime for goods too which can be schematically be
represented in the following figure {adapted from Debroy and Kaushik (2001)}
96

Commodity Specific Regulations
Enforcement Agencies are different and the truck may be detained under any
criteria
Figure 15 - Regulatory Regime: Goods
Restriction on Flow of Commodities -Essential -Hazardous -Adulterated -Licensed -Forest -Endangered Species -Others
Restriction on Flow in Locations -National Borders -State Borders -District Borders -Municipal Limits -Law & Order -Bridges -Others
Fiscal Related
Customs Excise
Sales Tax Octroi
Entry Tax Toll
Location Specific Commodity Specific
The consequences of detention of vehicles are loss of time leading to
underutilisation of truck capacity, avoidable consumption of fuel (due to deceleration and
acceleration, stopping and restart of engines) and lastly, corruption and graft. GOI (1950),
while pointing out to the delays due to octroi levies observed, “the delays that occur
while goods are being examined and weighed at octroi posts are as harmful or even more
harmful to the economy of the country than the levy made on the goods themselves
especially when these levies are relatively light” (p.23). GOI (1967) pointed out, “Octroi
and similar check posts which detain vehicles frequently are impediments to the growth
of the economy and the time they consume is a serious obstacle in the way of quick turn
round” (p.83). The Committee also observed that octroi was a fertile source of corrupt
practices and concluded that octroi is one of the greatest hindrances in the way of
97

commerce and economic development of the country. NCAER (1979) noted that
considering the total time wasted at the various detention points which were of the order
of 20 to 35 per cent of the running time, carrying capacity equivalent to nearly 80000
trucks or capital investment equal to Rs.650 crores is locked up due to check posts.
Further, there was a huge wastage of fuel as a result of idling. In terms of gratification
and other social costs, the study revealed that the incidence of gratification on different
routes was almost as much as the total fees levied on those routes. CIRT (1994) surveys
revealed that detentions on the different routes ranged between an average of 2 hours and
“more than 24 hours”. In the course of our surveys, most operators emphatically pointed
out that problems arising out of exploitation by an intermediary in the trade were of no
consequence to them when viewed in relation to those they faced on the road on a day-to-
day basis. “The broker is a much lesser evil than the police or the RTO official,” it was
observed every time we raised the issue of exploitation by the intermediary. The
implications are many. One of them, as pointed out earlier, relates to low utilisation that
results from less movement in a day. Our exercises relating to freight rates and operators
reveal that at a higher lever of operations in terms of more movements per day, say, 350
to 400 kilometers, operators’ returns turn out to be positive even with legal loads. With
less to be paid by way of wayside expenses, the returns could be higher. Debroy and
Kaushik (2001) conclude that on the basis of personal interviews with transporters, if all
the additional costs are eliminated, the delay can be reduced by approximately 3 days and
transportation costs halved. World Bank (2005) pointed out the low cost of movement by
trucks while at the same time it was inefficient. If inefficiencies could be reduced, the
cost to the user could go down further – the rates would be more competitive. Given that
there could be very little provision for overloading in future, the demand for truck
services can go up significantly thereby pushing up freight rates and restore some
respectability to the viability of the operators especially the smaller ones.
98

SECTION 6
Competition Advocacy Measures and Initiatives
A key function of competition authorities in many countries has been advocacy of
the application of competition principles in the design of governmental policies and
measures including the elimination of unnecessary regulation and the adoption of least
anti-competitive means of achieving various policy and regulatory objectives (UNCTAD,
1998). One outstanding example of competition advocacy has been the clarion call given
by the former Chairman of the United States Federal Trade Commission in the early
seventies, Lewis Engman, for deregulation of the transport sector, which has often been
cited as being among the first contemporary evidence of useful competition advocacy.
Accordingly, competition laws in several countries the right to intervene in legislation or
administrative processes, while other may intervene only if the competition authority is
requested to do so. In Canada and the United States, competition authorities participate in
proceedings before regulatory authorities relating to competition policy and also
undertake general advocacy efforts. In the United States, the Department of Justice
participates in executive branch deliberations and has played important role in
deregulation. In the Republic of Korea, the competition law requires other governmental
authorities to consult with the competition authority when they wish to introduce, amend
or enact any legislation that might restrain competition. In short, active competition
advocacy efforts are a necessary part of any competition authority’s work profile though
it is not quite sure as to how such efforts (thereby recommendations) have actually been
implemented. Competition advocacy is an essential part of the work of the Competition
Commission of India. Having examined issues relating to competition in the RGTI in
India, we now attempt to provide some guidelines, which can be part of advocacy
measures to be put forward to the Government in regard to RGTI in India. We provide
these in two parts – some structural- relating to measures to promote efficiency within the
industry and the others – policy and regulatory oriented- relating to measures aimed at
99

removing barriers to movement with a view to increasing the industry’s efficiencies and
thereby its competitiveness.
I. Structural and Behaviourial
1. We have pointed out the tendency for price fixation especially in the context of local
movements. This mainly relates to short distance movements of industrial/ commercial
items with the Mumbai region. Given that these attempts at price fixation occur at distinct
places namely small industrial estates or areas of small commercial activities, it would be
useful for the users – their associations- to get this sorted out with the local operators with
the help of the larger association of operators, say, for example, the Maharashtra Rajya
Truck and Tempo Vahatuk Sangh which represents both small truck and tempo operators
in the State and is based in Mumbai. The Regional Transport Authority (RTA) can be
requested to provide parking spaces where these operators could be located and also
notify (based on discussions with the operators and users) a price band within which
the operators could compete until such time that the market has effective
competition. Thus, the State Governments through the RTA could eliminate price
fixation practices in local movements. It may be useful to note that most of the MRTP
cases given in Section 2 (Part III) referred to restrictive trade practices and price fixation
therein in the context of local movements.
2. In the case of competitive tendering, there are often difficulties or limitations
associated with competitive tendering processes for long-term provision of natural
monopoly services such as difficulties of specifying all the contingencies in the contract.
There are advantages too. Competitive tendering substantially reduces the information
disadvantages of the regulator by revealing, through the bidding process, key information
about the true costs of providing the tendered services. Given the shorter-term contracts,
in the context of RGTI, the difficulties are not significant. But given the tendency that
many players tend to hedge by being involved as members of a consortium rather than as
an individual producer, there is always a danger of collusion in the bidding process as
pointed out earlier. This has been observed in the case of petroleum product movement
wherein the collusion aspect takes the form of groups aimed at winning the contract while
100

not really aiming at any price fixation. However, in the context of other public sector
contracts, especially in food grain movements (for the public distribution system), very
limited evidence points out to collusion between the operators and officials aimed at high
rates for movement – relative to market rates for similar movements. It is, therefore,
necessary that the Central and State Governments and other public sector bodies
enhance the efficiency and competitiveness of competitive tendering through more
careful attention to the tendering process. In particular, attention should be paid the
specifications of the services to be provided and the selection of firms eligible to bid. An
element of this would mean that the geographical region over which the services are
required should neither too large nor too small. (In fact, this is done precisely in the case
of petroleum product movements in India wherein region-wise requirements are required
to be catered too. Further, a regular feature on the part of the user has to been to split
movements between groups so as to ensure that possible disruptions associated with loss
of service from a single firm (group) are reduced). Given that there is provision for
action against bid rigging or collusive rigging in the Competition Act, 2002, the
Commission’s advocacy role would be to impress upon Governments for an active
oversight of the competitive tendering process to ensure sustainability of
competition failing which active competition enforcement would be resorted to by
the agency.
3. Informational asymmetries have been quite significant in the context of the working of
the market for trucking services. As a result, the implications have been many. Even in
the U.S. the problems were formidable within the regulated framework before 1980.
Those opposed to deregulation argued that entry by small trucking firms would fail
because without set prices and the information systems that large carriers maintained,
small entrepreneurs would be faced with “chaos” and be unable to function. However,
after 1980 the chaos got eliminated as a result of entry of a large number of operators and
other intermediaries that effectively disseminated the required information as a result of
the WEB- from which almost any one could access information to function effectively.
Effectively, this means sharing of data useful for shippers and suppliers. From the supply
side need for data sharing arises for low margins (Cruijssen, 2003). Internationally,
101

especially in Europe, the Intelligent Transport Systems (ITS) is taken as a system that
monitors the whole range of transportation including the road, rail, shipping, aviation and
others. Among these functions, one that monitors cargo transportation is very important.
Japan’s trucking industry realizing as early as 10 years ago the arrival of today’s
transportation affairs, has been studying the ITS on its own, and worked out the system
projection as illustrated here in Figure 16.
Figure 16 - ITS Network for Information on Trucking
Source: Home page of the Japanese Trucking Association
As part of the measures to assist small and medium truckers in promoting the joint
truck allocation, the Network KIT which collects and exchanges information on the
trucks awaiting cargoes and the cargoes awaiting trucks, is put into operation for greater
transport efficiency. The efforts are being made for substantial improvement of this
computer system, so as to increase the users of the system, and the cooperative unions
that actually operate the system. As a result, there were 135 cooperative unions, 460,000
trucks and 508 terminals as of March 1998. The KIT, a system developed by Japan
Trucking Association, provides trucking companies and shippers with information on
cargoes awaiting trucks, and trucks seeking for cargoes.
We understand that such systems have developed in some parts of the country
though in a very limited way (see Annexure IV). It is obvious that the private sector is
102

taking a lead in attempting to provide a basis for information exchanges in an attempt to
eliminate the middlemen so that the operators especially the smaller one get a better deal
in terms of returns/ margins. Given the structure of the industry, it will be a long time
before intermediaries are eliminated. In fact, this may not be desirable. What can be
expected to happen is the emergence of a single intermediary like the broker operators in
the U.S. who would in addition to their current ‘responsibilities’ also take care of cargo
insurance and third party liability insurance covering their truck operators. An effective
public sector role (Central and State) can be in facilitating applications and
adaptability of information technology and Intelligent Transport Systems (ITS).
This is required especially in coordinating the working of the system of exchanges that
can be expected to emerge at the regional levels.
4. Several times in the past, the role of transport operator cooperatives as a means of
enabling viability of operations for the small operator has been emphasized. CIRT (1994)
felt that these could be an interim measure only and that if mobility gaps have to be
bridged in keeping with the growth of the economy, it was necessary for the corporate
sector to come into the sector in a big way with large fleet so that standards of operations
and quality of employment could be raised for the benefit of the entire economy.
However, we are not inclined to view this as a solution. Even in advanced countries, we
came across a huge number of firms operating with a few vehicles but still turning out to
be profitable though it must be admitted that the larger firms were more profitable
(Savage, 1995). A cooperative solution would provide for far more flexibility in terms of
a scope for decentralized framework of operations than a corporate solution. Besides,
attempting to provide a viable basis of operations, one could handle the issue of
information asymmetries also. We understand that a cooperative solution has not really
emerged in countries like the U.S. where attempts have been made towards this end.
However, there are groups such as the Truckload Carriers Association, American
Independent Trucking Association, Inc. that have been formed for the same purpose and
have been fairly successful in attempts to derive economies of scale in marketing,
operating and sharing of information. In fact, on the shipper’s side too, a group called the
American Shippers’ Association has functioned for nearly a decade fairly successfully
103

taking care of shipper’s requirement in terms of the rates and quality of the services.
Though a cooperative effort could eventually evolve into a position of power as in the
case of cooperatives in sugar, etc. care can be taken to avoid these problems when they
are tackled at the right movement. The cooperative solution would also ensure that
information asymmetries are not present while at the same time result in elimination of
some elements of intermediaries in the supply chain process. Equally important is the
possibility of members of an operators’ cooperatives society getting registration with the
Indian Bank Associations (IBA), which enables operators to borrow against documentary
bills accompanied by the lorry receipts and to discount or purchase bills drawn by their
customers and accompanied by lorry receipts. Currently, as per the website of the IBA
(www.iba.temp.directi.com), only 652 transport operators are registered with the IBA
under their approved list. Today, one of the biggest problems that truckers face relates to
availability of working capital/ on route expenses for which they invariably depend on
middlemen who charge them heavily by way of discounts for the money advanced.
State legislation providing for cooperative efforts already exists. What are
required are some efforts on the part of the respective State Governments to
encourage operators based in the State to get down to formation of such cooperative
units of operators. The Commission can actively promote this idea with the State
Governments as an advocacy measure. A hypothesis that emerges: it would result not
only in a vibrant set of operators with lower costs and viable operations but also a better
deal for users by way of a more competitive price.
5. The movement of containers that moves by rail has been for a long time been handled
only by a subsidiary of the Indian Railways, namely, the Container Corporation of India
(CONCOR). The exclusion of other Multimodal operators from access to railways has
always been pointed out as being discriminatory. Only recently, a policy decision was
taken to allow private sector to run container trains was approved by the Central
Government. To begin with, the private sector (multimodal operators) is to be allowed to
use the railways (in addition to CONCOR) for movement of containers from the ports to
inland depots. Later, the private sector parties can be expected to have their own rakes
with the movements being taken care of by the railways. However, we understand that a
104
number of issues relating to price for the use of railway services, mainly levels and their
temporal variations, have arisen as a result of which there appears to be reluctance on the
part of the private sector to make use of rail services. The Commission, in its advocacy
initiative, must lay particular emphasis on the emergence of a mechanism for a
competitive price regime in this market and also point out the need for a fair
allocation of services in terms of access between the players (the multimodal
operators) in the market.
6. With increasing use of containers in the eighties, on issue faced by the trucking
industry then was that it was effectively precluded from carrying container cargo
especially, import cargo, over the road. This was because the Indian Customs service had
interpreted its rules and regulations in a manner that precluded trucks from competing
with the public sector CONCOR. In December 1994, the Indian Customs relaxed some of
these constraints. However, there have been problems. With a number of Internal
Container Depots being established, the trucker’s role increased. But bonding
requirements associated with customs clearance in the case of truck movement to inland
locations place the truckers at a disadvantage vis-à-vis the railways. As an advocacy
measure, the Commission needs to point out these anomalies which need to be
removed to provide a level playing field to the trucking sector.
II. Policy and regulation related
7. We have pointed out that the trucking rates are among the lowest in the world. From a
structural point of view, the sector is a highly competitive one – one could even say that
that there is too much of it resulting in a very low level ‘equilibrium’ income level. They
are all in what one would call – a low level equilibrium trap. As a result, service quality
is poor – which does not augur well for our domestic as well as our international
expansion efforts in terms of competitiveness of the economy. Advocacy should
cover the quality aspect of the trucking service (industry) also. The Motor Vehicles
Departments of the States are concerned with the enforcement of the Motor Vehicles Act
which provides for regulation of road transport. However, given the present institutional
focus on ‘revenue’, important provisions such as those related to aspects such as
mobility, axle load controls, safety, fuel conservation, environmental protection etc., have
105
hardly got the necessary attention. These provisions need to be effectively enforced.
Further, as suggested by the World Bank (2005), deficiencies related to motor insurance
such as lack of provisions regarding a statute of limitations, liability limits and thresholds
for claims adjudication need to be removed by amendments to the MV Act of 1988. And
all these have implications on the quality and cost of service provided and thereby on the
competitiveness of services.
8. There has been a demand on the part of operators that the State Government should fix
minimum rates for movements as provided under Section 67 (1) of the MV Act of 1998
which gives power to the State Governments to issue directives to the STAs regarding
fixing of freight and fair rates. This fixing of minimum rates, according to the operators,
would ensure that actual rates do not fall below these rates. In many countries such as
U.S., Australia, there have been persistent demands to fix minimum rates even after
deregulation so as to ensure reasonable profit margins for the operators. However, given
the difficult experience of rate fixation under regulatory regimes of the past,
Governments have rejected the demands for minimum rates. In the U.S., there are still
requirements to publish tariffs on the part of the operators. At present, the freight rates
are largely determined by forces of demand and supply. In an industry where there are
large number of operators and intermediaries operating all over the country, it would be
practically impossible to specify rates. Walters (1959) had made a case, which made it
clear that no rate regulation was necessary given the ample competition. He maintained
that ‘some firms will find it profitable to establish more or less standard scales of charges
from which they will diverge only occasionally. Others will find it profitable
continuously to vary the rate charged. These are responses to the preferences of shippers
and are quite proper and reasonable. There is evidence of rapidity of adjustment of the
industry, the elasticity, the will to innovate and various others aspects of an efficient
industry’ (p.66). In other words, competitive market forces should define the structure
and commercial arrangements within the industry. Rate regulation is an anachronism and
even provision for such regulation must be removed. Accordingly, we believe that the
relevant provisions relating to fixation of minimum and maximum rates contained
in Section 67 (1) and Section 79 (2) (iv) are redundant and should be dropped from
106

the Act. This is to ensure that there is no more clamor for minimum rates under the
existing regulatory framework.
9. The workhorse of the Indian trucking fleet has always been (and continues to be) a
rigid two-axle Mercedes (allowable pay load of 10.2 tonnes) design of 1960s vintage.
This has been so because the allowable 10.2 tonne pay load can easily be increased by 40
per cent with minimal changes in the truck body and suspension. While this has had a
catastrophic impact on the payment, it has been financially beneficial to the consigner
and operator. There has been a failure (fairly significant) to introduce more fuel-efficient,
less polluting, low tare weight trucks with heavy haul multiple axles (Sriraman, 2006).
According to World Bank (2005), the introduction of more tractors –trailer Multi-axle
Vehicles (MAVs) into the Indian truck fleets could reduce the overall cost of transport
including operating costs, quality of services, road provision costs and environmental and
other externalities. One area where MAVs are indispensable is in hauling the standard
ISO containers. With container traffic witnessing a spectacular growth in the past two
decades, the role of MAVs has become significant especially in the context of
international trade movements. However, traditionally tax and regulation regimes low-
grade highways have typically favored a single axle truck over the MAV. Even with
effective control of truck overloading and emergence of MAV friendly highways, it is
widely recognized that efficient trucking technology will be introduced and used in India
much more significantly only when the perverse system of financial incentives such as
high tax rates and tolls on such vehicles is corrected. As an advocacy measure,
Governments need to be advised on this issue so as to ensure that more efficient use
of trucking and road capacity is in place. This is especially important in the context
of our competitiveness in international markets.
10. When the reform process began in many countries, in the context of the transport
sector, it was felt that a lot could be achieved by simply focusing on improving the
efficiency and productivity of individual transport modes. However, given rapid increases
in international trade movements, it was felt that only an integrated strategy involving all
modes could be effective. In the absence of such an approach, there were major
107

impediments including lack of competitive neutrality across transport modes, low quality
and capacity of inter-modal connections etc. It has been further pointed out that current
institutional arrangements do not appear to have provided the level of coordination and
cooperation between modal jurisdictions needed to address certain issues. The traditional
compartmentalized approach has, it is held, left a legacy of distortions that have created
modal biases. The most commonly cited example is overuse of and excessive investment
in road transport at the expense of rail. This point hardly needs to be emphasised here
in a detailed way in the context of transport development in India especially in the
past decade or so. Thus, the design of public policies that influence investment in
multimodal transport systems has been a major area of concern given its impacts on
: i) India’s international competitiveness, and ii) inter-regional competitiveness.
What needs to be emphasised now is a required focus on development of a multi –modal
freight transport system which can lead to improved productivity through eliminations of
the bottlenecks. In other words, we must move away from development and investment
decision-making based on segmented modes and many tiers of management to an
integrated nationally consistent multi-modal approach. The Commission, as an
advocacy measure, should advise the Central Government to initiate a review into
the requirements for an efficient and sustainable nation freight transport system
(encompassing all freight transport modes). Taking into account reforms to date
and also the various detailed studies undertaken in this regard, the review should
map out what is required to:
• Achieve competitive neutrality across all transport modes;
• Address barriers to competition and efficiency in individual model;
and
• Enhance interfaces between modes.
This is an important advocacy measure which could ultimately in policies which
can help ensure that the mix of transport modes reflects the intrinsic efficiency of
the different modes compared to current Government policies and regulations that
favored one mode to other.
108
11. We have already pointed out that there are a number of barriers to free inter-State
movements of trucks in India. As a result of these barriers which result in huge delays,
transport and transactions costs have increased which further increase the cost of
production distorting competition in the domestic market as well as our competitiveness
in the international market. There are a number of legal barriers arising mainly from the
legal framework governing indirect taxes imposed by States. Legal definitions regarding
the incidence of taxes vary significantly from State to State. Legal procedures for
compliance with State tax law are cumbersome and vary widely from State to State.
Physical barriers such as check posts as well as legal rights to stop vehicle to check on
payment of indirect taxes, operate as major sources of delay in the flow of goods across
state barriers. All these features afford important rent-seeking opportunities for State
officials. With an economy dominated by roads and road transport, it is increasingly
important that truckers have much the same right as the railways to travel
interstate with a minimum of delays. Legal and administrative reforms in this area
are needed for India to function effectively as a single market. At the national level,
“Some States like Gujarat have taken up the matter seriously and have initiated measures
to have Computerised Inter-State Check posts. Through the use of computers and other
electronic devices at 10 remote inter-State border check posts in Gujarat, a team of savy
public officials have reduced corruption and significantly increased the State’s tax
revenue by automating the highway toll and fine collection system. The system was a
good investment. Within one year a system had paid for itself, illustrating how strategic
investments, properly planned can lead to long-term benefits” (ADB, 2003). This new
system could be used by the sales tax department of the State, which would monitor the
movement of goods in the State, as well as transshipments. Future plans include
integrating payment of sales tax on the goods carried on the vehicles. At the international
level, the European Union has introduced a range of policies that underpin the single
market and boost trade.
As a measure of competition advocacy, the Commission needs to emphasize the
importance of elimination of regulatory and physical barriers which can pave the way for
a seamless national (single) market to begin with. The State Governments should be
encouraged to carry out competition audit of existing regulations especially those
109

providing for the present system of checkpoints administered by the States and involve a
number of agencies (which involve restrictions on flow of commodities, the fiscal
regime, etc) to determine the need for their continuation.
BIBLIOGRAPHY
AAI (2003): ‘Representation to U.S. Department of Justice by F.M. Scherer’, American
Anti-trust Institute, Washington.
ADB (2003): Case Studies, Asian Development Bank, Manila.
ADB (2005): ‘Asian Development Outlook’, Asian Development Bank, Manila.
AITD (1999): 'Trucking Operations in India', Asian Institute of Transport Development,
Ministry of Surface Transport, Government of India.
Anderson, R.D. and Jenny, F., (2005): ‘Competition Policy, Economic Development and
the Role of a Possible Multilateral Framework in Competition Policy: Insights from the
WTO Group on Trade and Competition’ in E.Medalla (ed.) Competition Policy in East
Asia, London: Routeledge.
Arrunada, B. et.al. (2004): 'Determinants of Organisational form: Transaction Costs and
Institutions in the European Trucking Industry', Industrial and Corporate Change,
Volume 13, November 6.
Carbajao, J. (edited) (1993): ‘Regulatory reforms in Transport- Some Recent
Experiences’, A World Bank Symposium.
CIRT (1994): 'Road Goods Transport in India - A Study of its Structure and
Organisation', Central Institute of Road Transport, Pune, December.
110

Cruijssen, F., (2003): ‘A Survey of European Inter-organisation Data Sharing
Implementation in Ttransportation’, Mimeograph, Tilberg University, The Netherlands.
Daniel, D. and Estache, A. (2005): 'How Concentrated are Global Infrastructure
Markets?', Working Research Paper 3513, World Bank, Washington D.C.
Debroy,B. and Kaushik, P.D. (2001): Barriers to Inter- State Trade: the Case of Road
Transport, Paper submitted to the Ministry of Law, Justice and Company Affairs,
Government of India.
Deloitte (2003): 'Modernisation of the Trucking Industry', Report submitted to the
Advisory Group on Trucking Industry in India, All India Motor Transport Congress and
All India confederation of Goods Vehicles Owners’ Association.
Dugar, S. M., (1997): ‘Law of Monopolistic, Restrictive and Unfair Trade Practices’,3rd
edition, Wadhwa & Company, Nagpur.
Dutz, M. et.al. (2000): ‘Regulatory Reforms, Competition and Innovation’, Policy
Research Working Paper 2318, World Bank, Washington D.C.
Dutz, M. and Hayri, A., (2000): ‘Does More Intense Competition Lead to Higher
Growth? Policy Research Working Paper 2320, World Bank, Washington D.C.
Dutz, M. (2002): Competition Policy Issues in Developing and Transition Markets, Paper
presented at the OECD Global Forum on Competition, March.
Dutz, M., (2005): ‘Road Freight Logistics, Competition and Innovation: Downstream
Benefits and Policy Implications’, Policy Research Working Paper 3768, World Bank,
Washington, DC.
111
Everett, S. (2002): Deregulation, Competitive Pressures and the Emergence of Inter-
Modalism, Australian Journal of Public Adminstration, No.61, Vol.3, September.
Federal Register (2003): Volume 68, Number 214.
Fernandez, A. et.al. (2003): Quasi-Integration in the Truckload Trucking Industry, Paper
submitted to the 2nd Annual Conference of the International Society for New Institutional
Economics, Paris, September.
Friedlander, A.F. and Spady, R. H., (1981): Freight Transportation Regulation:Equity,
Efficiency, and Competition, MIT Press, Cambridge, MA.
FTC (2003): FTC Approves Filing of Antitrust Complaints against Associations in Three
States, Cases Concern Allegedly Illegal Filing of Collective Rates with States
GOA (2005): ‘Review of National Competition Policy Reforms’, Productivity
Commission Enquiry Report, No.33, Government of Australia, February.
GOI (1932): ‘Report of Mitchell- Kirkness Committee’, Government of India.
GOI (1932): ‘Report of Wadgewood Committee’, Government of India.
GOI (1950): 'Report of the Motor Vehicle Taxation Enquiry Committee', Ministry of
Transport, Government of India, Delhi.
GOI (1953): 'Report of the Taxation Enquiry Committee', Government of India, Delhi.
GOI (1958): ‘Report of the Road Transport Committee’, Government of India, Delhi.
GOI (1966): 'Report of the Committee on Transport Policy and Coordination', Planning
Commission, Government of India, New Delhi.
112

GOI (1967): 'Final Report of the Road Transport Taxation Enquiry Committee', Ministry
of Transport, Government of India, New Delhi.
GOI (1980): 'Report of the National Transport Policy Committee', Planning Commission,
Government of India, New Delhi.
GOI (1987): ‘Report of the Planning Group on Road Transport for the Twentieth
Century’, Planning Commission, Government of India, New Delhi.
Hoj et.al., (1995) : 'Deregulation and Privatisation in the Service Sector', OECD
Economic Studies, No.25, /995/11.
Hubbard,T.N., (1998): 'Governance Structure in the Deregulated Trucking Industry',
Mimeoograph, National Bureau of Economic Research.
ILO (1999): Background document, Symposium on the Social and Labour Consequences
of Technological Developments, Deregulation and Privatization of Transport, Geneva.
Kessides, C. (1993): Institutional Options for Provision of Infrastructure, Discussion
Paper No. 212, World Bank, Washington D.C..
Kessides, I.N. (2004): Reforming Infrastructure: Privatisation, Regulation and
Competition, A World Bank Policy Research Report, Oxford University Press and World
Bank, Washington D.C.
Kovacic, B. and Shapiro, C. (2000): ‘Antitrust Policy: A Century of Economic and Legal
Thinking’, Journal of Economic Perspectives, Volume 14.
113

Lakshmanan, T.R. and Anderson, W.P. (2000): Case Studies in Trade and Transport
Integration, Centre for Transport Studies, Boston University, Report prepared for the
World Bank Group on Infrastructure, March.
Lata,. M. (2005): ‘Infrastructural Impediments and Rising Costs of International Trade: A
case study of India’s Export Competitiveness in the Global Market’, Ph. D. Thesis
submitted to the University of Mumbai.
Lee, C. (2002): The Institutional and Policy Framework for Regulation and Competition
in Malaysia, Working Paper No.45, Centre on Regulation and Competition, University of
Manchester.
Moore, T.G., (1995): ‘Clearing the Track: The Remaining Trucking Regulation,
Regulation’, Vol. 18, No.2.
Muris, T., (2002): ‘Creating a Culture of Competition: The Essential Role of Competition
Advocacy’, Presentation at the International Competition Network Panel on Competition
Advocacy and Antitrust Authorities, Naples, Italy.
NCAER (1979): 'Road Transport Industry', National Council of Applied Economic
Research, New Delhi.
Newbery, D.M. and Stern, N., (1987): The Theory of Taxation for Developing Countries,
Oxford University Press.
Owen, B. (2003): Competition Policy in Latin America, Discussion Paper, Stanford
Institute for Economic Policy Research, Stanford University, November.
OECD (2001): ‘Competition Issues in Road Transport’.
Png, I.,(2001) : 'Managerial Economics', Blackwell Publication..
114

Porter, M.E. (2004):‘Indian Competitiveness: Where Does the Nation Stand?’,
PowerPoint presentation in Mumbai, January 20.
Rao, T.V.S.R. and Sriraman S., (1985) : 'Disequilibrium in Rail Freight Services', Ajanta
Publication, New Delhi.
Ray, R. (1990): 'Optimal Commodity Tax and Consumer Behavior in India: Theory and
Empirical Evidence in K. Basu and P.Nayak (ed.) Development and Economic Theory,
Oxford University Press, 1992.
Savage, I., (1995): 'Panzar and Rosse Style Tests of Market Structure in the U.S. Motor
Carrier Industry', Logistic and Transportation Review Volume 31, No.2.
Smith, H. L. (1995): ‘Deregulation and Privatization in the UK Freight, and Bus and
Coach Industries, Volume III, Regulatory Policy Research Centre, Oxford.
Smith, G., et.al. (1986): ‘Assessing the Effects of Trucking Regulation in Korea’,
Transportation Department, World Bank, Washington D.C.
Sriraman, S. (1998): 'Road Transport Development in India', Current Science, October.
Sriraman, S., (1997): 'Road and Road Transport Development in India', Asian Transport
Journal, Asian Institute of Transport Development, New Delhi.
Sriraman,et.al. (1998): Report of the Sub-Committee on Financing, Taxation, Fares and
Freight and Insurance submitted to the Steering Committee on “Trucking Operations in
India”, Asian Institute of Transport Development, New Delhi.
Sriraman, S., (2000): 'Indian Railway Finances- Critical Issues and Emerging Options',
Economic and Political Weekly, Vol.XXXV, No.12, March 18.
115

Sriraman, S., (2006): ‘The Transport Sector in India: Has it been technology driven or
demand induced?’, Directions, Vol.7, No.4, Indian Institute of Technology, Kanpur.
Taylor, J.C., (1995): Regulation of Trucking by the States, Regulation: CATO Review of
Business and Government, CATO Institute, Washington D.C.
Thompson, L.S., (2000) : 'Regulatory Developments in the U.S. :History and Philosophy',
World Bank, Washington D.C.
TOI (2006): Transporters milk PDS of crores by overcharging, June 13.
Thukral, K. L., (2002): ‘Enhancing the Quality of Trucking Services’, Report prepared by
Asian Institute of Transport Development, New Delhi for Asian Development Bank,
Manila.
UN Mission, (1993): 'Transport Sector Needs Assessment in India', Mission Report,
United Nations Development Programme, New York.
UNCTAD (1998) : Empirical Evidence of the Benefits from Applying Competition Law
and Policy Principles to Economic Development in order to Greater Efficiency in
International Trade and Development, Report of United Nations Conference on Trade
and Development, July.
Vickers, J. (2002): ‘Competition Economics and Policy Mimeograph’, Office of Fair
Trading, U.K.
Walters, A.A (1959): ‘Economics Development and Administration and Regulation of
Transport’,
116
Winston, C. et.al. (1990): ‘The Economic Effects of Surface Freight Deregulation’, The
Brookings Institution, Washington D.C.
Wise, M. (2001): ‘The Role of Competition Policy in Regulatory Reform’, OECD
Journal of Competition Law and Policy, Vol.1, No.1.
World Bank (1989): 'Vehicle Fleet Modernization Road User Cost Study', World Bank,
Washington D.C.
World Bank (1997): Brazil Multi-modal Freight Transport: Select Regulatory Issues;
Report No. 1631- BR, World Bank, Washington D.C.
World Bank (1997): ‘Economic Development in India: Achievements and Challenges, A
World Bank Country Study’, World Bank, Washington D.C.
World Bank (2002): 'India's Transport Sector: The Challenges Ahead', Volume 1, World
Bank, Washington, DC.
World Bank (2005): 'Road Transport Service Efficiency Study', Mimeograph, World
Bank, Washington D.C.
Yamauchi, H., (1995): ‘Regulatory Reform and Changes in the Japanese Trucking
Industry’, Volume III, Regulatory Policy Research Centre, Oxford.
Zingales, L., (1997): 'Survival of the Fittest or the Fattest? Exit and Financing in the
Trucking Industry', Working Paper No.6263, National Bureau of Economic Research.
List of Websites:
www.infreight.com
www.bgta.org
www.businessworldindia.com
www.census.gov/epcd/www/econ97.html
117

www.competitioncommission.org.uk.
www.infobanc.com/logtruck.htm
www.iba.temp.directi.com
www.internationalcompetitionnetwork.org
www.worldbank.com
ANNEXURE I
Format of the Model of Costs of Operations of a Truck- An Example Std.16 ton GVWTRUCK Kms. covered /year 60000 Payload 9 Chassis Price(Rs.) 800000Ch. Price 800000On road Price(Rs.) 942656s.tax 80000Loan Interest rate(%) 0.14Total 1 880000No. of years 3 No. of Installments 35Octroi 35200Body Bldg. Cost(Rs.) 150000Tot2 915200On road Price and Body Bldg. Costs 1092656 Down Payment (%) 20Reg. 27456Down Payment(Rs.) 188531.2Tot3 942656Ins.and serv. Charges(%) 3 Ins and ser.charges(Rs.) 32779.68 302965Total(after down and Ins.ch.) 721345.12 1024310Contract Amt. 1024310.07 29266Inst. Per month 29266 1053576Amt. Paid per year 351192 Fixed Costs Av. Amt. Paid/year 465206.9835 (Con.amt+Down pay+Ins+Body)/3 Admn. Overheads(Rs.1000/month) 12000 Road Tax and permit charges 50000 Driver and cleaner salary 132000 Loading & unloading 50000 Broker's commission 50000 Maintenance repairs 60000 Wayside Expenses 60000 Total fixed costs 879206.9835 Variable costs Fuel average (km per litre) 4 Diesel cost /litre(Rs.) 38 Litres of diesel consumed per year 15000
118

Fuel cost per year 570000 Tyre life(kms.) 45000 Avg.tyre cost per year 144000 Total variable cost 714000 Total cost per year 1593206.983 540000 Cost per tonne km (rs.) 2.950383303
ANNEXURE II
A Case Study of Trucking Operations in Satara
Surveys were conducted in Satara district of Maharashtra with a focus on the city
area of Satara. The objective of the exercise undertaken in Satara was to examine relevant
issues relating to the Trucking sector in a relatively small market like Satara. Satara
district is located in the western part of Maharashtra. It is bounded by Pune district to the
north, Solapur district to the east, Sangli district to the south and Ratnagiri district to the
west. Raigad district lies to its northwest. It has historical importance in the history of
Maharashtra. Traditionally it is an agrarian economy with sugar cane being the major
crop. The movements consist mainly of sugar cane, sugar and other grains in and out of
Satara.
There are 50-60 transport providers, which vary, in fleet size and nature of
operations. The fleet of the truck operators surveyed varied between 1 to 30 trucks. More
than 85% are single truck operators and we were given to understand that only two big
fleet owners really dominated the market. The small operators are dependent on brokers
and booking agents. Sometimes the small operators too acted as brokers and passed on
the information regarding the availability of freight to other operators. This market due to
its limited geographical spread and nature of business appeared to be very small. Most of
the operators operated with overage fleets. A single truck remains off the road on an
average for 8 to 10 days in a month. The capacity utilisation is quite low may be due to
lack of business throughout the year especially for the small operators.
119
The operators were reluctant to reveal the truckload carried by them3. Though the
normal capacity load was 9 tonnes, it was revealed that generally the actual truck load is
15-16 tonnes. The truck operators try to increase their revenue realisation by overloading
the vehicles in general. It was revealed by one big operator that overloading resorted
because otherwise there is no break- even. According to them if
Truck load is approximately 13-14 tonnes there is break- even,
Truck load 10 = Not viable
Truck Load is 15= Profit.
The role of brokers/ commission agent
As there is large number of small operators, the brokers and booking agents play
very important role in price fixation. The freight is mainly decided on the basis of
distance or kms to be covered. They also determine the allocation of quantum movement.
The commission of the broker is fixed per trip. Few small operators also act as a
commission agent.
As mentioned earlier there were two big fleet owners who really dominated the
market. These two, however, were not competing with each other, as their area of
specialisation was different. Thus, regarding the market structure, the market seemed to
be dominated by two players; one of the two transport companies enjoy monopoly in
transporting grains and fertilizers in Satara whereas the other transport company which
also owned specialised vehicles has monopoly position in transporting industrial goods in
MIDC area of Satara. The transport company, which has monopoly in, certain
movements regularly bid for government contracts for movement of grains and they
always manage to get these contracts. Due to their understanding with the government
officials they know the rates quoted by others and get the tender. But even this company
which regularly, give services to government face problems, like delay in payments,
corruption, administrative inefficiency and delay in payments and lack of basic facilities
at the Railway Yards.
3 We were shown a truck which arrived in the market area of Satara which had a truckload of 34 tonnes whereas the capacity load was only 17 tonnes
120
The costs of operations of transport operators are substantially high. There are
various components of it. But the loading and unloading charges, wayside expenses, and
the fuel charges are the major components. Transport companies have to bear the loading
charges, which increase their costs, and reduce their profitability. These are called as
‘Varai’ in Satara. This can be explained as the remuneration paid to the workers for the
movement of goods inside the truck and arranging and re-arranging the load inside the
truck. These charges vary a lot depending on the location. In Mumbai these charges are
highest. But small operators normally take a stand “Jyacha Maal Tyacha Hamal” which
means the person to whom the goods belong will bear these charges.
There was one interesting case where truckers owning a single truck formed a
group and within the group the business was divided. This enabled them to have
collective bargaining and at the same time it reduced their costs as they were sharing
certain facilities like office, telephone etc. Apart from this there is trucker’s association
called “Satara Zilha Truck Chalak Malak Sanghatana” but as reported by the operators
and brokers, it hardly plays any role as far as the freight rate or brokerages are concerned.
Other Observations: The bigger transport companies seem to employ drivers and
cleaners for long-term basis. Apart from the salaries these drivers and cleaners are also
provided daily allowance when the truck is on road. There no long-term formal contracts
made with the traders. But informal contract play important role. Big transport companies
also go for hiring of trucks if required. Most of the trucks were single-axle in Satara. An
empty movement is a common problem of the operators irrespective of the size. Most of
the vehicles are insured. One or two agents had other side business.
121

ANNEXURE III
A Case Study of Trucking Operations in Goa
Trucking operations in Goa can be categorized into two kinds of operations:
• Ore Movements
• General Movements
Ore Movements:
Goa is essentially a mining economy. 95% of the Indian iron ore exports take
place from Goa. The major mining companies in Goa are Salgaocar, Sesa Goa and
Dempo. These companies utilize the services of various local truck operators. The
trucking movements for iron ore take place in the following way; initially trucks carry the
ore from the mine pit to refinery and after the ore is processed, it is further carried by
trucks from the refineries to the jetties wherefrom they are transported to the Mormugoa
port trust for export by means of barges. The mining companies are likely to appoint
different operators for these respective movements.
The process of selection of truck operators in Goa is quite interesting. There is no
formal contract in most cases rather; there are agreements between local village
panchayats and the mining companies. This is mainly done to keep the village panchayats
in good humour so that they would not unnecessarily obstruct the trucking movements.
As per the agreements reached the mining companies offer truck quotas to the village
panchayats. Freight rates are determined mainly on basis of bulk density. For instance,
pig iron has a higher bulk density than coke. So the operator could load a given volume
122

of pig iron, and also carry additional part-load in the truck, which is not possible in the
case of coke. Hence, coke was charged a higher rate as compared to pig iron.
Another peculiar feature which emerged from the interviews with various users of
trucking services in Goa was that operators tended to charge higher rates if users levied a
relatively bigger penalty on theft of ore during transit. Users expressed concern over
increasing pilferage of ore during transit. Earlier this was non-existent but is now a
common feature owing to the large increase in price of ore in the world market. Pilferage
occurred by means of collusion between the truck operators and barge operators. Also, it
is very difficult to detect pilferage per se. for instance from a truck load of ore, if three
chunks of pig iron ore are removed by the operator, it is impossible to detect but could
fetch the operator around Rs. 20000. It was revealed that by such relatively “minor”
pilferages, a barge owner managed to export his own barge full of ore to china, where the
demand for ore is at its peak owing to the booming economy.
The informality in the transactions between operators and users is further
emphasized by the way in which price changes are negotiated. Negotiations took place
between the truck operators’ association and the mine owners’ association. An important
parameter, which acted as a signaling device for price changes, was changes in ore prices
in the world market. When price of ore rose in the world market due to greater demand,
then the operators expected a part of the increase to be passed on to them in the form of
higher freight rates. Conversely, when price of ore fell in the world market, then they
were willing to cut down freight rates.
Entry of new operators in the market for ore movements is highly restricted. As
mentioned earlier, the quotas were allotted to various village panchayats. Furthermore,
since the movements were of a highly localized nature, i.e. within the limits of Goa, it
was virtually impossible for new operators to enter the trucking market.
Non Ore Movements:
123

For the general trucking movements, there existed both large fleet operators of
India as well as smaller truck operators. Each of them had their own clientele. The larger
operators moved consignments for companies at various industrial estates at Goa whereas
the smaller operators moved for the smaller companies as well as catered to individual
movements. The larger operators usually entered into rate contracts with the users. The
customers who moved larger consignments were given certain rate discounts. Other
customers were quoted standard rates.
Operators like Transport Corporation of India used a relatively innovative way to
get new business in Goa. If a local operator is moving relatively large consignments for a
company, the TCI enter into an agreement with the operator. As per the agreement, the
operator becomes a franchisee of TCI. While TCI gets an entry into the company’s
movements, the smaller operator gets to use TCI’s brand name to generate new business.
The larger operators denied any kind of harassment at the check posts and also
claimed that they did not indulge in overloading. However, they did admit to problems at
check posts in those States, which levied octroi on goods movements.
The smaller operators typically owned between one to five trucks. They got their
business either by direct contact with customers or in some cases, used the services of a
broker for which they had to pay commission to the broker. The commission was either a
fixed rate of Rs 250-300 per consignment or was charged at the rate of 15 paise per kg.
Freight was charged at the rate ranging from Rs. 1.30 per Kg to Rs.2 per Kg depending
on market conditions. Some of the smaller operators did complain of some harassment at
the check posts but admitted overloading only to the extent of two tons over the legally
permissible limit.
124
ANNEXURE IV
Information Exchanges 1. Case related to Transport Exchange (Source: Business World, October 04, 2004)
Driving out the middlemen
For more than five decades, thousands of brokers have dominated the Rs 70,000-
crore road freight sector. Now, one company wants to replace them.
Nazeer is a strapping young man who is supremely confident of his abilities. His
profession requires him to be in a state of almost perpetual motion, plying up and down
the Chennai-Kolkata highway several times a month. He has been a truck driver for five
years now. You can tell that he handles the stress as well as he handles the steering
wheel. He holds a record for having conquered the eastern leg of India's golden
quadrilateral in three days flat. His peers admire him. He also commands the respect of
his boss - Narasimha Rao.
Narasimha Rao has been an entrepreneur-fleet operator for 23 years. He owns 42
trucks that ferry goods all over the country. He is sharp and street smart. He has the
schedules, movements, and loads of all his trucks plotted in his mind. He lives in Tenali,
a small town in Andhra Pradesh. Yet he manages his countrywide fleet, customers and
drivers with acumen. But there is one set of people that Rao does not relish dealing with -
brokers. They intermediate between those with trucks and those with freight. Munna of
Kolkata is one such broker.
Munna's office is a small room. Many drivers come there. Many languages are
spoken. Many deals are struck. And many crumpled currency notes change hands. And
more often than not, those who give do so reluctantly. Drivers are crowded around
125

Munna's table for the better part of the day... and night. Many like Nazeer, who have
come from Chennai, seek Munna out to find a return load for their truck.
Rao would be very disappointed if Nazeer came back to Chennai with an empty
truck. He would be equally unhappy if Nazeer is stranded in Kolkata even for a few days
without a return load. Every idle day means loss of revenue. On the contrary, the longer a
truck stays on the road, the more profits it earns for its owner. Both Rao and Nazeer
know that. Munna knows it too, and exploits it to his advantage.
Rao-Nazeer-Munna - truck owner, driver, broker: this trio forms the backbone of
the country's Rs 70,000-crore road freight industry. And more often than not, the broker
has the upper hand in this uneasy economic relationship. Even big transport and logistics
companies with large fleets outsource a substantial part of their truck requirements.And
Munna is much in demand.
Every farmer, every manufacturer, and every trader relies on this trio to lug fruits
and food grains, raw materials and finished products across the country. This basic
transportation model, as defined by the triumvirate, has survived the last half a century
with very little change. Monsoons have come and gone, the composition of India's
manufacturing sector has changed, new industrial clusters have sprung up, new highways
have been laid, large logistics companies have been born, information technology has
transformed the way the transport sector does business, and bigger and better multi-axle
trucks have hit the roads. But the broker has remained unchallenged.
Now, one man wants to change all that. He wants to displace the brokers from the
trucking chain. J.K. Rajagopal is the CEO of Transport Exchange, a new road freight
exchange. It has been working out of 40 offices on the country's highways for almost six
months now. He hopes that truck operators and companies will find in Transport
Exchange a respectable, efficient and transparent intermediary. Over 5,000 truckers and
500 companies have already signed up with it. Among them is Rao, one of the early
members of Transport Exchange.
126

Rao is a good example of how Transport Exchange can help truck owners. To
begin with, Nazeer has now stopped visiting Munna's Kolkata office. For that matter, he
doesn't need to visit any broker anymore. These days, when he makes a trip to Kolkata,
he stops at Kharagpur. He calls Transport Exchange in Kolkata and places a request for a
return load. By the time he reaches Kolkata, unloads the freight and gets some shut-eye,
Transport Exchange has a load ready for him. He no longer has to shell out Rs 2,000 or
more to Munna as brokerage. Transport Exchange is happy with less than half that
amount.
Moreover, as much as Rao trusts Nazeer, he does not have to worry about the
possibility of the latter cutting a deal with Munna or other brokers. He also need not be
anxious of finding a return load quickly enough. Rao is certain most of his trucks will
soon run at optimum capacity. "The utilisation of my trucks has been pretty much the
same since I joined Transport Exchange. But I expect it to improve a lot as Transport
Exchange expands," he says.
There are other benefits too. If Nazeer needs some cash in case of an emergency
on the highway, Rao only needs to call the nearest Transport Exchange office. (See
'Working Capital: A Trucker's Lifeline') Rajagopal isn't the first one to attempt the
disintermediation of the trucking business model. A couple of years ago, Transport
Corporation of India (TCI), one of the largest logistics companies, tried it with
apnatransport.com. It was a Web-based model, requiring fleet operators to log on to the
Net. It failed. Other online ventures have survived, but only just. For example, the Indian
Freight Exchange,a multi-modal exchange, has perhaps done better in the sea and air
sectors than on roads.
So far, all such attempts have relied on the Internet - one of the greatest tools for
disintermediation. In recent times, the Web has cut out brokers in several sectors
worldwide, including air tickets, automotive, commodities and real estate. But India's
truckers are very different from America's net-savvy car buyers or Europe's travellers.
Nazeer is happy with his place behind the wheel. His rough, greasy hands are unlikely to
127

touch computer keyboards in the near future. That is why Transport Exchange - it works
through a physical network of offices - has a better chance of success than the likes of
apnatransport.com. "Such physical exchanges will work. They have a better chance of
capturing brokerage revenues from the value chain," says a senior executive of a Web-
based logistics firm.
Of course, Rajagopal has wired up his 40 offices with the latest in
telecommunication infrastructure. Software tracks truck movements and the goods
transport requirement of companies, and matches the demand and supply of trucks on the
network. Algorithms work out how best to keep a truck on the road for as long as
possible and the most profitable routes for truckers. It even teaches them how to combine
part-loads for maximum gains. But it stays invisible to the actual users. The staff at
Transport Exchange's branches consult their computer terminals and give verbal
instructions to the truckers. Nazeer and Rao pick up the phone and interact with real
people. They don't have to decipher Web pages. They can walk into a real office, sign
real transport orders and collect real currency notes. They don't do business online.
Interestingly, the thought of Transport Exchange first originated during the dotcom craze
of the late 1990s. The idea was floated by Ashok Leyland Finance (since merged with
IndusInd Bank). It drew up a business plan for an Internet-based model. But the
management soon realised that a Web-based interface would not work. The idea was
quickly dumped.
Rajagopal revived it a couple of years later. He recast the model and took it to
Ashley Transport Services, a subsidiary of truck maker Ashok Leyland. He came up with
the idea of a physical network which could deliver the benefits of technology to the
trucker without him having to come anywhere near a computer.
Transport Exchange branches try to create an environment that truckers are
familiar with. The people manning the branches speak the lingo of the truckers. They
don't wear ties. The branches themselves are strategically located. Every city has a
transaction hub. This is where most deals are done. "We have tried to set up our branches
128

as close to these hubs as possible," says K.S. Kumar, director, Transport Exchange.
Moreover, all the branches also have enough parking space to accommodate half a dozen
trucks. In many ways, a Transport Exchange is much like any other broker's office - only
it has air-conditioning and a few other comforts.
Working capital: a trucker's lifeline As any trucker will tell you, gaadi chalaane ke liye paisa chahiye (you need money to run a truck). Fuel charges, incidental expenses are all incurred up front. But the trucker gets paid only 15-45 days after he has delivered his consignment. So he needs a bit of cash, or working capital, to keep the business running. While banks and finance companies are willing to lend to them to buy new trucks, they don't fund his working capital needs. As a result, truckers land up at the doors of financiers, who discount their receivables, a hefty cost. Rates vary from 6-8 per cent or, sometimes, if the trucker is desperate, even 10 per cent. Such discounting is a huge market running into several thousand crores, mostly dominated by the unorganised sector. This is where Transport Exchange steps in. It has tied up with a few banks to provide 'challan discounting' services to truckers. And unlike unorganised financiers, the company is offering this at m uch lower rates.
Rajagopal is working to a simple plan: enter broker territory, and provide all the
services a broker offers, but with greater transparency, lower costs and better efficiency.
Transport Exchange has a paid up capital of Rs 10 crore and targets a turnover of Rs 10
crore in a year. "Transport Exchange is trying to emerge as the super-broker of the
industry. Whether it can break into the business depends on how much value it can add to
both sides," says a senior executive of a Web-based logistics firm.
Less than a year from now, the number of Transport Exchange branches would
have gone up from 40 to almost 200. Almost every hub and spoke in the country's road
freight map would have been covered. The technology and business models too would
have been tested rigorously. That is when the real battle with the brokers will begin. But,
already, there are signs that the intermediaries aren't happy. "I've been talking to a few
brokers and they have all been bad-mouthing Transport Exchange," says Rao.
129
That animosity will only increase as brokers realise that they are losing their
customers. Nazeer, for instance, is much happier walking into a Transport Exchange
office than he is walking into Munna's den. But Rajagopal prefers to underplay any
confrontational angle to the story: "The business is so large that we will hardly threaten
existing players." Nevertheless, six months after he flagged off Transport Exchange, one
thing is evident. Rajagopal is Rao's best friend and Munna's worst enemy.
2. Case related to Bharat on Wheels (Source: Express Computer, April 19, 2004)
Keeping track of trucks
The Bharat On Wheels tracking system finds ways to hook the transport industry to
the information superhighway.
At any given point of time, around three million trucks are plying on India’s roads,
keeping the economy on the move, and reaching raw materials or finished goods to their
destinations. However, once a truck embarks on its journey, neither consignees nor
consignors can tell you where the truck is or what the status of the consignments is,
unless the drivers provide these details to them over the phone.
A few novel vehicle-tracking systems based on satellite Global Positioning Systems
(GPS), introduced in the recent past, proved nowhere near down-to-earth in affordability
or accessibility due to various technical reasons. As a result, the Indian transport industry
continues to remain largely under the radar of information technology.
This may change soon. The Bangalore-based BOW (Bharat on Wheels) Network,
an IT solution provider for the transport industry, has recently come up with an
innovative vehicle tracking solution that works on an interactive voice response system,
the telephone network and the Internet.
130

Says Bharat On Wheels’ managing director, P S Selvaraj, “What was missing all
along was a vehicle tracking system. Though truck drivers could make long distance
calls, there was no one way through which consignors, consignees, transport companies,
agents and vehicle owners could know the status of the vehicle or the consignment.
Further, there was no one to support drivers in case of vehicle breakdowns, ill health,
security needs and other unforeseen emergencies during the journey.”
According to him, the sophisticated GPS-based models did not take off in India since
they involved gadgets costing as much as Rs 30,000 per vehicle, an investment that truck
owners were not prepared to make. Also, truck operators needed computers and users
with a working knowledge of computer applications.
BOW’s answer
When BOW attempted to design an alternative system, it determined that the system
would respect certain crucial criteria—the new system had to be the most economical,
provide information even without a computer and Internet availability, and even an
illiterate person would be able to operate it.
BOW’s vehicle tracking system, perfected on the basis of an interactive voice response
system (IVRS) functions without the need to fix any additional gadget to the vehicle, as is
the case with GPS.
The BOW system involves establishing tracking points, usually STD booths having
BOW tie-ups, and located at convenient places like truck bays, dhabas, petrol pumps and
check posts on national and state highways. Drivers who are given BOW cards furnish
information about the vehicle’s current location, date, time and destination (plus any
other message) to tracking point operators, who pass those details on to the nearest area
franchisee office online, where data compiling and transmission takes place. This
information is made available to subscribers via both online and offline means.
BOW’s IVRS helps truck drivers provide information over the telephone from any
location in the country at just the cost of a local call.
Network
131
BOW is providing its services through an all-India franchisee network. The
company is setting up master franchisees in all state capitals and major cities, and area
franchisees in all districts and business headquarters across the country.
“We have 34 master franchisees and 121 area franchisees covering all important states,
except Madhya Pradesh and a few North-Eastern states. We will soon be increasing the
number of master franchisees by adding 18 others and the number of area franchisees by
25,” Selvaraj reveals. In the first phase BOW is targeting a minimum of 100 franchisees
and 600 tracking points, which roughly covers the country. Later, it plans to expand to
interior locations.
BOW has its own servers with high-speed data transmission, auto data back-up
and recovery, besides high levels of security, which assure high quality service without
interruption.
“Our franchisees will get immediate returns on registration of vehicles, and very
good monthly returns thereafter,” Selvaraj says. “Master franchisees and area franchisees
will get complete technical, operational, marketing, promotional and advertising support
from us to render high-quality services to customers. By using the BOW service,
transport owners can leverage and streamline their services in order to reach out to newer
customers and ensure high satisfaction for existing customers.”
Savings
The BOW service costs a one-time registration fee of Rs 500, and monthly service
charges of Rs 100 to Rs 300, depending on whether the vehicle for tracking has a state or
national transport permit.
In the present situation, a driver has to make long distance calls to communicate
with the owners during a journey, so the monthly telephone charges for a running vehicle
could be quite high. “On an average, a truck operator with a national permit can save a
minimum of Rs 1,000 to 2,000 by using our service,” claims Selvaraj.
132
“Since BOW’s vehicle tracking system is most economical and highly reliable,
we are expecting a minimum 60 percent of truck operators to utilise the services,” says
Selvaraj. The company is targeting a minimum of two lakh vehicles to begin with, and
“by the end of this financial year we hope we can reach six lakh vehicles,” adds a very
optimistic Selvaraj.
3. Case related to Infreight.com (Source: www.infreight.com)
Infreight.com facilitates The Indian Freight Exchange, which is a portal built
exclusively for the logistics and surface transportation industry in India. It is a vertical
portal that covers all the critical aspects of the Indian road transport industry. It facilitates
the critical and sacred transactions between the Shipper/Client and Transport Company
and the Transport Company and Broker in a formal real-time environment via a secure
exchange. The Indian Freight Exchange works to facilitate the day to day negotiation and
contracting of truck-routes through a system of Global and Open Orders. The exchange
also facilitates the regular and contracted transactions between the Client and the
Transport Companies. The entire process is conducted via secure transactions, which
means only authorised persons have access to the data. InFreight.com recognises that
these transactions are sacred to all parties.
The Indian road transport industry is very vast and distributed considering the size
of the country and has a market share of about 75%. Its nearest competitor is the Indian
railways. Whereas the railways are government controlled and basically amount to a
monopoly, the road transport industry comprises mainly of private players, most of who
have a regional presence and no single player has a significant individual market share.
The Indian road transport industry works through a very well set traditional system of
Brokers who supply truck-routes of Market Trucks (which are small owner-operator run
fleet of 1-7 trucks), to customers at freight rates which are negotiated on a minute to
minute basis. The Brokers supply these Market Trucks largely to Transport Companies,
who have infrastructure in place to add value to these truck-routes. The Transport
Companies in turn offer a total transportation solution to Shippers/Clients like industries,
133

traders, importers, exporters, government, etc. This value addition is in terms of offering
periodic contracted rates (thus buffering the Clients from the vagaries of the market), risk
coverage, billing and credit periods, payment of octroi and such statutory incidentals
enroute, etc. Many large Clients/Shippers with large volume despatches also directly
contract truck-routes from Brokers and the market by making open offers. This happens
in case of time critical or freight critical consignments.
134

ANNEXURE V
Data Issues
Data problems have been severe. Given that the Industry has never been in the
public domain and that it has always been almost exclusively in private finance, data
relating to the industry has always been a problem. Committees after Committees
have emphasised the need to develop a systematic database. Very often, Working
Groups/ Committees, appointed from time to time, have often commissioned studies
for the purpose of their work – which was invariably once every five years or so. But
then, each Committee has to look at specific issues which required specific data to be
generated. As a result, data generation has been undertaken in bits and pieces as a
result of which no systematic time-series data is available even now. The first attempt
that was made in 1987, as part of the work of a Planning Group of the Planning
Commission (GOI, 1987), built up a database on rail and road movement from the
50s up to the mid-80s. This database has been updated once in a while and is being
used to estimate the railroad share in the country.
Data that is available mainly relates to the registration of the vehicles in the
States in terms of the categories of the vehicle. However, this database does not give
the break up relating to the composition of the fleet which is important from the point
of view of understanding and examining RGTI. Registered numbers often include
vehicles, which have been deregistered. Permits are issued by the STA to operators
for intra-State and National movements. However, the database relating to these
permits has not been updated on a systematic basis as a result of which one is not able
to know the exact number of, say, National Permit holders.
We are aware that the Economic Census that has been conducted almost every
five years in the past two decades in India gives some figures relating to the transport
industry. The most recent Economic Census (Fifth) was conducted in 2005 with only
135

some provisional results available now. These results indicate the number of
enterprises in the country at a certain level of dis- aggregation including transport
enterprises. Further, employment in these enterprises is also attempted to be given.
We had a somewhat detailed glance of the report on the Fourth Economic Census of
Maharashtra State undertaken in 1998. There is hardly any data that has been found
useful for our study of RGTI.
136

ANNEXURE VI
List of People / Parties contacted I. List of Operators/Brokers /Booking Agents/Users 1. Mr.Irfan S. Bhivandiwala, Bhiwandiwala and Sons.
2. Mr.Mohinder Singh Ghura, President, Maharashtra Rajya Truck Tempo Tankers
Bus Vahatuk Mahasangh (Reg.)
3. Mr.Mahendra Arya, ex- President, Bombay Goods Transport Association, Sri
Srinivasa Roadlines
4. Mr.M.C.Khatua, Transport Corporation of India Ltd.
5. ABC Transport
6. Jai Hind Transport
7. Mailspeed Transport Services
8. New Thane Motor Transport, Local Operator
9. Chawala Highway Services
10. Jaydeep Transport Services
11. Roshan Transport
12. Mahanagar Transport
13. Maha Transport
14. Mr.Manzoor Khan, New Bharat Roadlines
15. Mr.Afzal Husain, Iqbal Husain Choudhari Transport
16. Arunah Transport
17. Dombivili Goods Carrier
18. Vishwas Transport Services
19. Mr.Sopan Kadam,Somnath Transport Agency
20. Jai Lakshmi Road Service
21. Mr.Kheradarkar, Jadhav Brothers
22. Mr.B.M.Tambe, B.M. Fortklift Service
137

23. Mr.Dinkar Mohite, Ambica Water Suppliers
24. Mr.Shahaji, Best Container Movers
25. Manau Containers
26. Mr.Iqbal Singh, Raj Carriers
27. Mr.Prem Kumar , Operator
28. Leelam Transport Co.
29. Mr.Sanjay N. Gogri, Deepak Transport Co.
30. Mr.Navinchandra H. Gori, Deepak Transport Co.
31. Mr.Patel, Patel & Co.
32. Mr.Kailash Pingle, Operator
33. Mr.Parashuram P. Katke
34. Mr.Abid Husain
35. Mr.G. Vipinchandran Nair, Shree Kailash Associates
36. Moosa Transport
37. Jay Mallhar Logisticss
38. Dombivli Goods Carrrier, local operator
39. Mr.R.P.Parkar, Sterling Roadways
40. Ajay Cargo Movers, Pvt.Ltd.
41. Mrs.Madhavi, Meghdoot Roadways
42. Mehata Roadlines
43. Vijay Laxmi Transport Corporation
44. Mr. Sudhir Kumar Vashisth, Malik Transport
45. Mr.Mohammad Shrif Liyakat Husain, Baba Transport
46. Mr.Anwar Yusuf Shekh, Baba Transport
47. Mr.Raghu, Sushanth Road Lines
48. Mr.M.S.Barkade, New Ambica Transport
49. Mr.P.Desai, New Ambica Transport
50. Kolhapur Transport
51. Mr.V.S.Agre, Navarang Road Lines
52. Mr.Laxmanbhai, Sreenath Roadlines
53. Mr.Iqbal Mehar, Mehar Transport Corporation
138

54. Someshwar Transport
55. Mr.Kishor, Om Shree Roadways
56. Mr.Chandrakant, Prabhat Transport Service
57. Mr.Anil, Shree Krishna Garage
58. Mr.K.Vishwanathan, General Manager, Benzy Transport Corporation
59. Mr.Rajgopal, Canara Goods Transport
60. Mr.Phatak, Kartar Carriers Pvt. Ltd.
61. Mr.V.K.Gopinathan, Jai Bharat Roadways
62. Jalaram Transport Co.
63. Mr.Sachin Abdar, Mahanagar Transport,Vashi
64. Mr.Kiran Namdev Hinukale, Canara Goods Transport,Vashi
65. Mr.Manoj Pokharkar, Siddhi Trans – Logistics
66. Mr.Vasant Barkade, Kataria Transport Agency
67. Hindustan Roadways
68. Mr.Mishra, Prominent Roadways
69. Shivshakti Roadlines
70. Hydrabad Poona Transport Agency
71. Mr.Jain, New Diamond Transport Company
72. Mr.K.Sukumaran, Director, Supergeon Transport Pvt. Ltd.
73. Rama Roadlines
74. Mr.Debesh C. Patra, Territory Manager- Mumbai LPG, Bharat Petroleum
Corporation Ltd.
75. Mr.D.B.Shetty, Director, Shrirang Sulpher Chem.Pvt.Ltd.
76. Kheraj Water Pumps
77. Mr.Sattarbhai Khan, New Vijay Transport, Satara
78. Mr.Riyaz Khan, New Vijay Transport, Satara
79. Roman Transport , Satara
80. Sawkar Transport ,Satara
81. Laxmi Transport , Satara
82. Vikam Transport, Satara
83. VRL Transport Satara
139

84. Transport Corporation of India, Goa
85. Rajesh Transport, Goa
86. Gadge Patil Transports,Goa
87. Deccan Queen Transports,Goa
88. S.V.Transport,Goa
89. Senior Translines,Goa
90. Sesa, Goa
91. Salgaonkar,Goa
II. List of others
1. Mr.B.Channa Reddy, President, All India Confederation of Goods Vehicle
Owner's Associations
2. Mr.Chittranjan Dass,Vice-President, All India Confederation of Goods Vehicle
Owner's Associations
3. Mr.K.S.Sharma, General Secretary, Maharashtra Tank Lorry Owner's Association
(Reg.)
4. Mr.P.P. Puntambekar, Director, Shriram Transport Finance Co.Ltd.
5. Mr.Hardeep Singh, Head- Hire Purchase, Shriram Transport Finance Co.Ltd.
6. Mr.Selvan C, Senior Manager, Shriram Transport Finance Co.Ltd.
7. Mr.Arun Patkar, Partner, Deloitte Haskins & Sells
8. Mr.K.T. Golani, Regional Transport Officer, Motor Vehicle Department, Govt. of
Maharashtra
9. Mr.Ravi S. Ganti, Manager Vehicle Sales, Ashok Leyland,Mumbai
10. Mr.Jagannath, Business Consultant, Thane.
11. Mr.R.S.Venkataraman,Business Consultant, Bhandup,Mumbai
12. Mr.R N.Yadav,Golden Transport Organisation
13. Mr.R.N.Rao,General Manager (West), Ashok Leyland,Mumbai
14. Mr.J.M.Saksena, Secretary General, All India Motor Transport Congress,Delhi
15. Mr.Virendra Parekh, Senior Economist, Indian Marchants' Chamber,Mumbai
16. Mr.B.Krishnamurthy, CMO, Aditya Logistics (I) Pvt.Ltd.,Mumbai
17. Mr.Cyrus J. Guzder, Chairman & Managing Director, AFL Private Ltd.,Mumbai
140

III. List of people met in May and June
1.Mr. Mohinder Singh Dua, President, Bombay Goods Transport Association,
Calcutta Express Roadlines P.Ltd.
2. Mr.L.D.Fernandes, Managing Director, All Freight International Pvt. Ltd.
3. Mr.Shashi R. Tanna, Managing Director, Links Cargo Agencies private Ltd.
4. Mr.Sachin Bhanushali, Sr.General Manager, Container Corporation of India
Ltd.
5. Mr.Yash Vardhan, Group General Manager, Container Corporation of India
Ltd.
6. Mr.Manish Kumar, General Manager (Customs) and Chief Manager (CFS,
Mulund), Container Corporation of India Ltd.
7. Mr.K.Subramanian, Senior Regional Manager, Hindustan Petrolium
Corporation Ltd.
8. Mr.Sudhir S. Rnagnekar, Director, The Shipping Corporation of India Ltd.
9. Capt.S.Narula, Deputy General Manager, Container Operations, Container
Corporation of India Ltd.
10. Capt.Devinder Durga, Deputy General Manager, Incharge Freight, Claims,
Port Operations and Break Bulk Operations, Shipping Corporation of India
Ltd
11. Mr.Mohan Nihalani, President, All India Importers’ and Exporters’
Association
12. Mr.Jayant Lapsia, President, All India Liquid Bulk Association
13. Mr.R. Rajasekhar, Vice- President –Commercial, United Phosphorus Ltd.
14. Mr.Siddhartha Bhattacharya, DGM- Logistics, United Phosphorus Ltd.
15. Mr.Nayan M. Savani, Managing Director, Savani Transports Private Ltd.
16. Mr. Naval. H. Mehta, Director, White and Co. Pvt. Ltd.
17. Mr.R.Radhakrishnan, Chairman, Clearship Group and President , The
Bombay Custom House Agents’ Association
18. Mr.S.H.Phalke, Shree Gurudatta Transport
141

19. Mr. H.T.Bhivandiwala, Bhiwandiwala and Sons.
20. Mr.Ashok Sonimindia, Om Shree Ganesh Container Movers
21. Mr.Amit, Om Shree Ganesh Container Movers
22. Mr.Samit, Om Shree Ganesh Container Movers
23. Mr.P. Shridharan, Vice- President, Shriram Transport Finance Co.Ltd.
24. Mr.R.Sridhar, Managing Director, Shriram Transport Finance Co.Ltd.
25. Mr.Umesh Revankar, Executive Director, Shriram Transport Finance Co.Ltd.
26. Mr.Norbert Noronha,Institute of Logistics Management
27. Mr.P.S.Reddy, Chief General Manager, Bombay Stock Exchange Ltd.
28. Mr. Ravindra P. Purohit, Economic Adviser, Hindustan Construction Co.Ltd.
29. Mr. Deepak Rane, Liasion Officer-Wadala Truck Terminal Project
30. Mr.Mark S. Fernandiz ,Chairmen, Indian Merchant Chamber, Logistics
Management and Infrastructure Committee
31. Mr. Juzar T. Potia, Managing Director, Potia Expotrs Pvt. Ltd.
32. Mr. A.D. Punjabi, Chief finance officer
33. Mr.S.V.Ponkshe,General Manager, J. M. Baxi & Co. Total Shipping Support
Services
34. Mr. Narayanan, J. M. Baxi & Co. Total Shipping Support Services
35. Mr.Ebrahim Latif, Institute of Logistics Management
IV. List of people who have not responded
1. Nisha Roadways Pvt. Ltd.
2. Mr.Ramann Khosala,Cargo Carriers
3. Dorba Roadways
4. Jaipur Golden Transport
5. Associate Road Corporation
6. Bharat Roadways
7. South Eastern Carrier Ltd.
8. Yadav Transport
9. Mount Gomerry Goods Carrier
10. Carwan Roadways Ltd.
11. Delhi Rajasthan Transport Ltd.
142
12. Jayshree Clearing Forward & Shipping Agency
13. Om Hari Om Roadways Pvt. Ltd
14. Mr. Bhuman
15. Mr. Rajiv Agarwal.
16. Mr. Girish Agarwal
17. Rahul Transport Pvt. Ltd.
18. Bombay Dewas Roadways
19. Mr.M.N.Chaini, President, Maharashtra Economic Development Council 20. Shri.Vijay Kalantari, President, All India Association of Industry.
143