trucking in the changing grain industry (phase i)
TRANSCRIPT

Truckingin the
ChangingGrain
Industry(phase 1)
/dlberraAGRICULTURE
Production and ResourceEconomics BranchAgdex No. 843-3

Copies of this publication may be obtained from:
Print Media BranchAlberta Agriculture
7000 - 113 Street
Edmonton, Alberta T6H 5T6ORAlberta Agriculture’s district offices

TRUCKING IN THE CHANGINGGRAIN INDUSTRY (PHASE I)
by
G. Nabi Chaudhary
Production and Resource Economics Branch
Alberta Agriculture

ACKNOWLEDGEMENTS
The author wishes to express his sincere thanks to Messrs Gordon Halls, Director, Systems Planning,
Alberta Transportation; and Glen Johnston, Director, Highway Freight Services, Economic Development
(member of the study management committee) for guidance, cooperation and invaluable assistance
during the course of this study (Phase I).
Comments by Oswald Fierara, Transportation Planner, on the preliminary draft of the study are
gratefully acknowledged.
i

TABLE OF CONTENTS
SECTION PAGE
Acknowledgements i
List of Tables iv
List of Figures v
List of Appendix Tables v
I INTRODUCTION 1
Obj ecti ves for Phase I 2
Objectives for Phase 1 1 2
Source of Data 2
II ELEVATOR SYSTEM AND RAIL7ROAD NETWORK IN ALBERTA 3
Historical Record of Elevators in Alberta 3
Capacity and Throughput of Elevators 4
Rail Network in Alberta 6
Road Network in Alberta 8
III GENERAL CHARACTERISTICS OF FARM TRUCKS 1
1
Number of Farm Trucks in Alberta 11
Distribution of Farm Trucks by Gross Vehicle Weight (GVW) 1
1
Age of Farm Trucks 12
Distribution of Farm Trucks by Fuel Type 13
Use of Farm Trucks 14
IV FARM TRUCKING ACTIVITY AND COSTS FOR HAULING GRAIN 1
6
Role of Farm Trucks in Collection and Delivery of Grain 16
Total Costs of Grain Transportation by FarmTruck 17
Unit Costs of Transporting Grain by FarmTruck 20
V CHARACTERISTICS OF COMMERCIAL TRUCKS IN ALBERTA 21
Regulations Governing the Commercial Grain Trucking in Alberta 21
Intra-Provincial Motor Carrier 22
Extra-Provincial Motor Carrier 22
Commercial Grain Trucking Fleet Size and Operating Characteristics 23
ii
TABLE OF CONTENTS (cont'd)
SECTION PAGE
Development of Commercial Trucking in the Grain Industry 24
Use of Commercial Trucks by the Canadian Wheat Board 27
Intra-Provincial Rates/Costs of Transporting Grain by Commercial Trucks 28
Efficiency of Commercial Trucking Versus Farm Trucking 30
Transportation of Feed Grains to British Columbia 31
Commercial Trucking Activity for Transportation of Feed Grains to British Columbia 32
Comparison of Rail and Truck Rates on Feed Grains to British Columbia 34
VI ROAD EXPENDITURES AND RELATED ISSUES 38
Government Expenditures on Road Construction and Maintenance 40
Impact of Changes in the Primary Grain Collection System 43
Impact of Trucking on Other Highway Traffic (Safety) 44
VII FUTURE ROLE OF TRUCKING 47
Branch Line Consolidation 47
The Prairie Branch Line Rehabilitation Program 48
Railway Efficiency Measures 50
Grain Handling Efficiency Measures 52
Alberta Terminals 54
Changes in the Statutory Rates and the Commercial Trucking Industry 58
VIII SUMMARY 60
Bibliograghy 65
Appendix 66
iii

LIST OF TABLES
TABLE PAGE
1 Historical Record of Licensed Primary Elevators in Alberta, 1965-66 to 1983-84 5
2 Number of Farm Trucks Registered in Alberta 12
3 Distribution of Farm Trucks by Gross Vehicle Weight 13
4 Model Year of Farm Trucks 14
5 Distribution of Farm Trucks by Fuel Type 15
6 Use of Farm Trucks: Per cent of Annual Mileage 16
7 Average Total Costs of Transporting Grain by Farm Truck in Alberta, (1983-84) 19
8 Unit Costs of Transporting Grain by Farm Truck in Alberta, 1983-84 20
9 Operating Authority Certificate Report on Commercial Truckers Licensed to Haul Grain
and Grain Products Extra-Provincially 24
10 Hopper-Bottom Fleet for Intra- and Extra-Provincial Hauling of Grain and Grain Products,
1984-85 25
1 1 Intra-Provincial Commercial Truck Transportation Rates on Grain and Grain Products 29
12 FFA Movement of Feed Grains to British Columbia by Type and Origin ("000" Tonnes) 33
13 Movement of Wheat, Oats and Barley to British Columbia by Origin (% of Total) 34
14 Percentage Movement of FFA Feed Grains to British Columbia From Prairies by Mode
of Transport 36
15 Rail Rates on Feed Grains to Selected Destinations From 1967 to 1985 ($ Per Tonne) 37
16 Commercial Truck Transportation Rates on Grain Products: In Bulk or Sacks ($ Per Tonne) 39
1 7 Provincial Government Estimate of Expenditures For Highway Construction and
Maintenance, 1984-85 42
18 Rate Differential Between Neighboring Points (Shipper's Share) 45
19 Status of Railway Branch Line Abandonments 49
20 Monthly Truck Deliveries to Alberta Terminals, 1981-84 56
21 Annual Throughput at Alberta Terminals Ltd. (Tonnes) 57
IV

LIST OF FIGURES
FIGURE
1 Country Elevator Map
2 Rail Network in Alberta
3 Highway Network in Alberta
4 Supply of Feed Grains to B.C. by Areas of Origin
5 County Expenditures on Local Roads
6 Rail and Truck Transportation Rates
PAGE
7
9
10
35
43
64
LIST OF APPENDIX TABLES
A Distribution of Farm Trucks by Gross Vehicle Weight and Age of Trucks, 1981-82
B Distribution of Farm Trucks by Gross Vehicle Weight and Age of Trucks, 1982-83
C Distribution of Farm Trucks by Gross Vehicle Weight and Age of Trucks, 1 983-84
D Distribution of Farm Trucks by Fuel Type and Age of Trucks, 1981-82
E Distribution of Farm Trucks by Fuel Type and Age of Trucks, 1982-83
F Distribution of Farm Trucks by Fuel Type and Age of Trucks, 1983-84
66
67
68
69
70
71
v

SECTION I
INTRODUCTION
The federal government promoted railway
expansion by granting monopoly rights to the
rai Iways with respect to movement of grai ns for
export from certain areas of the Prairies. The
railways constructed as many lines as possible to
help establish centres of trade. Country elevators
were constructed on this scattered network of rail
lines to receive grain for domestic and export
shipments.
The railway has been the most common mode
of grain transportation for domestic use and export
throughout the Prairies until the early seventies.
The rising costs of branch line operations over the
last several years forced the railways to consider
abandonment of many uneconomical light density
rail lines, resulting in consolidation of country
elevators. On August 1, 1974, the total number of
licensed primary elevators in Alberta was 1,357 with
a capacity of 3.409 million tonnes (121.7 million
bushels). Ten years later, this number had
decreased to 913. Similarly the number of elevator
points during the same period decreased from 449
to 343.
Over the last 20 years, the road network in
Alberta has increased to 151,470 kilometres (94,139
miles) while the railway network used for hauling
grain has decreased by five per cent to 8,689
kilometres (5,400 miles). As the number of
commercial carriers has increased with highway
and road improvement, the dominant position of
railways in providing transportation service on
short hauls has diminished considerably. During the
early seventies, the trucking industry in Alberta
showed tremendous growth. The number of grain
trailers increased to over 400 in September 1974
from approximately 100 about 3-4 years earlier.
Motor truck transportation, which was first
developed as a "feeder" to bring grain from
production areas to the rail sites, has played an
important role as an alternative mode of grain
transportation for the branch line abandoned
areas. Since the early seventies, there has been a
significant increase in trucking grain to distant
country elevators, inland terminals and feed mills,
etc. When there has been a shortage of rail cars,
trucks have been used to haul rapeseed to the west
coast for export purposes.
Rail line abandonments and closure/
consolidation of country elevators have increased
the demand for truck services. Because of the
development of more powerful and efficient motor
vehicles, the trucking firms have increased the
capacity and payloads of the units used. With the
increase in highway and road networks, the role of
trucking has become more prominent. However,
the use of commercial trucks for transporting grain
raises a number of questions: What would be the
cost of moving grain by trucks as compared to
projected costs of rail transport? How efficient
would a commercial trucking operation be as a
replacement? Would farmers use the opportunity
to do custom or commercial trucking as a sideline
to their present farming activities?
The passage of the Western Grain
Transportation Act (WGTA) to reform the statutory
(Crow's Nest) rates on grain could make
custom/commercial trucking more attractive in
1

hauling grain from the farm to main line rail
shipping points. Under the act, the crow benefit is
to be paid to the railways. This does not give
farmers the opportunity to evaluate alternatives
for transporting grain. However, in this study,
attempt has been made to assess the impact of
reforms in the statutory rates on the trucking of
grain.
In the late eighties, when the statutory rates
increase four or five fold plus the country elevation
and storage charges, trucking grain over longer
distances to more central locations could become a
reality. Therefore, the emphasis of this project was
to study in depth the role of trucking grain for
short and long hauls.
When preparing the terms of reference, it was
decided that this study would be undertaken in
two phases. The objectives were outlined for both
phases and it was anticipated that work on Phase II
would start after the completion of Phase I.
Objectives for Phase I
1. To describe the present trucking activity for the
transportation of grain and grain products in
Alberta;
2. To determine the future role of trucking in
Alberta in view of closure/consolidation of
country elevator facilities;
3. To describe the present commercial trucking
activity for the transportation of grain and
grain products from Alberta to British Columbia
for domestic use; and
4. To measure the effects of the reforms in the
statutory rates on the trucki ng of grai n to
Alberta Terminals Limited (ATL) and other
major inland terminals.
Objectives For Phase II
1. To determine the future role of trucking for
grain transportion under the scenarios:
a) pay the railway,
b) pay the producers.
2. To determine the future role and prospects for
commercial trucking to transport grain to the
export positions under the new statutory rates.
In Phase II, emphasis would be on opportunities
for the farmers on how to ship grain if method of
payment were changed in their favour or what
impact the method of payment would have on
their choice of transporting grain from the farm to
country elevators or other primary grain collection
facilities. In regards to objective number 2, it was
realized that trucking may not be feasible now to
replace rail for long hauls, but may serve as a
"feeder" to expedite rail traffic and efficient use of
railway equipment.
Work on Phase II of this study would be
undertaken sometime during fall 1985.
Source of Data
No formal survey was undertaken to obtain the
required information for this study. As a joint study
between the Departments of Agriculture,
Economic Development, and Transportation,
extensive consultations were undertaken to
develop as much information as possible in-house
from the primary and secondary sources. Some of
the information on grain distribution and country
2

elevator throughput were obtained from the
Livestock Feed Board of Canada, Canadian Grain
Commission Annual Reports and Canada Grains
Council Study on Prospects for the Prairie Grain
Industry to 1990.
Data on farm and commercial truck
characteristics were obtained from the Solicitor
General's Department - Motor Vehicle Branch, and
Alberta Motor Transport Board in Red Deer.
Commercial truck tariffs were obtained from the
tariffs published by the Western Tariff Association
in Calgary and farm truck costs were taken from an
earlier departmental study and were up-dated to
the 1983-84 crop year using western Canada farm
input indicies.
Preliminary discussions were also held with a
private consultant and senior officials of the
federal and provincial governments to obtain some
feedback on the terms of reference. Initial contacts
were also made with selected grain carriers to
assess the impact of reforms to the statutory rates
on commercial grain trucking from their
perspective.
SECTION II
ELEVATOR SYSTEM AND RAIL/ROAD NETWORK
IN ALBERTA
The primary elevator system is the key
component of the present grain handling and
storage system in western Canada. It serves as a
vital link in the marketing of grain both at home
and abroad. The primary function of this system is
to collect small quantities of grain from producers
and to assemble these into larger units of the
proper types and grades of grain to be transported
to inland terminals or export positions. Some of
the functions of a primary elevator are receiving,
grading, weighing, binning and shipping
operations.
The primary elevator system 1 on the Prairies
developed at a time when producers delivered
their grain by horse and wagon. As the railways
expanded their branch line network, the grain
companies built primary elevators along these
branch lines to attract grain business. While the
producers have long since abandoned the horse
and wagon as a means of moving grain from the
farm to primary elevator, the spatial relationship
among primary elevators has remained the same.
Although the grain companies started closing the
non-profitable country elevators during the forties
and fifties, there was still a large number of
primary elevators serving the grain producers.
Rationalization of primary elevators accelerated
during the sixties and seventies. The older facilities
required extensive repairs, and their overall
throughput was declining, which resulted in
increased operating costs. Branch line
abandonments also resulted in the closure of some
primary elevators as the railways could not provide
service for branch lines which were uneconomical
to operate.
Historical Record of Elevators in Alberta
Historically, the primary elevator system has
been comprised of many small units handling
relatively small volumes of grain. With the
1
In 1971, Canada Grains Act, country elevator
was changed to primary elevator.
3

development of the commercial grain industry,
competition among the grain companies and lack
of proper grain delivering facilities over longer
distances facilitated the development of the
network of primary elevators.
The first elevator in western Canada was built
i n 1 879 and for the next 50 years, pri mary elevator
construction continued to accelerate. There was
one elevator in 1879; 90 in 1890; 454 in 1900; 1049
in 1905 and 5,746 in 1934. This climaxed the
maximum number of such elevators in western
Canada. From 1934 the number of elevators
declined year by year and by 1973, it had decreased
to 4,383 made up of 540 in Manitoba, 2,431 in
Saskatchewan, 1 ,390 in Alberta and 22 in British
Columbia.
Total storage capacity, however, increased
constantly until 1971, from 857,000 tonnes (32
million bushels) in 1905 to 10.8 million tonnes (396
million bushels) in 1971. The following year it
began to decline for the first time and on August 1,
1973, it had declined to 368 million bushels (10
million tonnes).
Increased storage capacity was the result of the
construction of elevator annexes and replacement
of older elevators with larger elevators. The sharp
decline in 1972 came from the closure of numerous
elevators made redundant by the sale of Federal
Grain Limited's grain assets to the three prairie
wheat pools.2
Construction of primary elevators in Alberta
peaked in 1 933-34, when the number of licensed
elevators reached 1 ,781 with a capacity of 1 .8
million tonnes (67 million bushels) at 580 delivery
points. In 1945-46, although the number of
country elevators have decreased to 1 ,735, the
overhaul capacity increased to 2.7 million tonnes
(99 million bushels) and the number of delivery
points increased to the highest level at 620. Ten
years later, i.e. in 1955-56, the number of primary
elevators have decreased to 1 ,730 and the delivery
points to 591. Capacity to store grain at these
elevators increased to 3.2 million tonnes (1 18
million bushels). In the years ahead, the number of
delivery points and primary elevators continued to
decline, reaching 535 and 1,573, respectively in
1970-71 . The closure of primary elevators has
continued through the seventies and into the
eighties. The number of primary elevators, delivery
points, capacity and throughput of these elevators
from 1965-66 to 1983-84 are listed in Table 1
.
During the last 18 years, primary elevators have
been closed on an average of 2.5 per cent per crop
year and the number of stations or delivery points
has decreased by an average of about 2 per cent
per year. From 1965-66 to 1983-84 the overall
capacity of the primary elevators decreased by 23
percent.
Capacity and Throughput of Elevators
As discussed above, the capacity of primary
elevators in Alberta has been declining since 1970-71
when it was at its highest level at 3.7 million
tonnes. Although the number of elevators.
2 Canadian International Grains Institute, "Grains
and Oilseeds, Handling, Marketing and
Processing", Winnipeg, Manitoba, May 1975,
p. 67.
4

TABLE 1
HISTORICAL RECORD OF LICENSED PRIMARY ELEVATORS IN ALBERTA, 1965-66 TO 1983-84
Crop Year
No. Of
Elevators
No. Of
Delivery
Points
Capacity
(tonnes)
Throughput(tonnes)
1965-66 1,612 551 3,562,060 4,599,670
1966-67 1,602 546 3,587,640 5,708,451
1967-68 1,589 543 3,606,810 4,110,247
1968-69 1,582 540 3,638,910 4,059,250
1969-70 1,574 538 3,688,210 4,261,861
1970-71 1,573 535 3,726,370 5,888,846
1971-72 1,543 522 3,694,300 5,419,622
1972-73 1,435 468 3,526,640 6,246,593
1973-74 1,390 456 3,464,480 6,097,711
1974-75 1,357 449 3,409,410 5,762,404
1975-76 1,330 441 3,371,270 7,271,838
1976-77 1,290 426 3,293,830 7,946,676
1977-78 1,232 406 3,184,850 6,595,400
1978-79 1,210 401 3,167,270 6,309,100
1979-80 1,174 394 3,105,730 8,156,400
1980-81 1,097 374 2,981,270 9,293,100
1981-82 1,040 365 2,901,340 9,887,800
1982-83 979 356 2,778,610 10,079,100
1983-84 899 343 2,740,080 10,114,600
Source: Canadian Grain Commission, "Grain Elevators in Canada", Crop Years 1966-67 to 1983-84.
delivery points and capacity continued to decrease,
the throughput continued to increase because of
increased production and efficient handling of
grain. Table I shows the capacity and throughput
of the primary elevators in the province from 1965-
66 to 1983-84. On an average, the throughput ratio
has been between 2.5 to 3.5 per crop year. Figure 1
5

shows the estimated throughput and location of
elevators in Alberta.
Data in Table I show that the largest reduction
in elevator points occurred between the 1971-72 and
1972-73, and the 1982-83 and 1983-84 crop years.
With the closure of most of the branch lines, it
could be anticipated that consolidation of country
elevators would continue, but not at the same pace
as in the past. The elevators which require major
renovations and fail to receive the throughput
required for economical operation would be
closed, possibly to be replaced by high throughput
elevators. Throughput is very important for an
elevator to be efficient and economical. The
concept of high throughput elevators has been
discussed in Section VII under grain handling
efficiency measures.
Rail Network in Alberta
Alberta is well-served by the railroad system. It
was the major mode of transportation until the
early sixties. Before the branch line abandonments,
railroads provided a good link between small
communities, towns and cities. Owing to
increasing operating costs and the deterioration in
maintenance of the system, railroad service has
been diminishing in favour of trucks, especially on
short hauls.
Rail is still the most economical mode for long
distance hauls and large volumes. Because of the
longer distances to export position, grain traffic is
dependent on railways as are the other
commodities for shipments overseas and to other
provinces. Figure 2 shows the rail network in
Figure 1. Country Elevator Map
GRAIN AND OILSEED VOLUMEAT ALBERTA DELIVERY POINTS(5 year average 1978/79 and 1982/83)
CNR mainlines
CNR branch lines
CNR branch lines subject to CTC review
CP Rail mainlines
CP Rail branch lines
CP Rail branch lines subject to CTC review
Elevator points
Single company
less than 7 500 tonnes or 300 000 bushels
(total of delivery points - 100)*
7 500 to 14 999 tonnes or 300 000 to 599 999 bushels
(total of delivery points - 327)*
15 000 to 24 999 tonnes or 600 000 to 999 999 bushels
(total of delivery points - 331)*
25 500 to 50 000 tonnes or 1 000 000 to 2 000 000 bushels
(total of delivery points - 298)*
greater than 50 000 tonnes or 2 000 000 bushels
(total of delivery points - 91)*
numbers indicate volume in thousands of tonnes.
Kilometres 10^0 10 2° 30 40 50_J0 70^80 *^^0Statute Mites 10^5^0 .
,0 20 30 40 iMPi V
6

Figure 1. Country Elevator Map
7
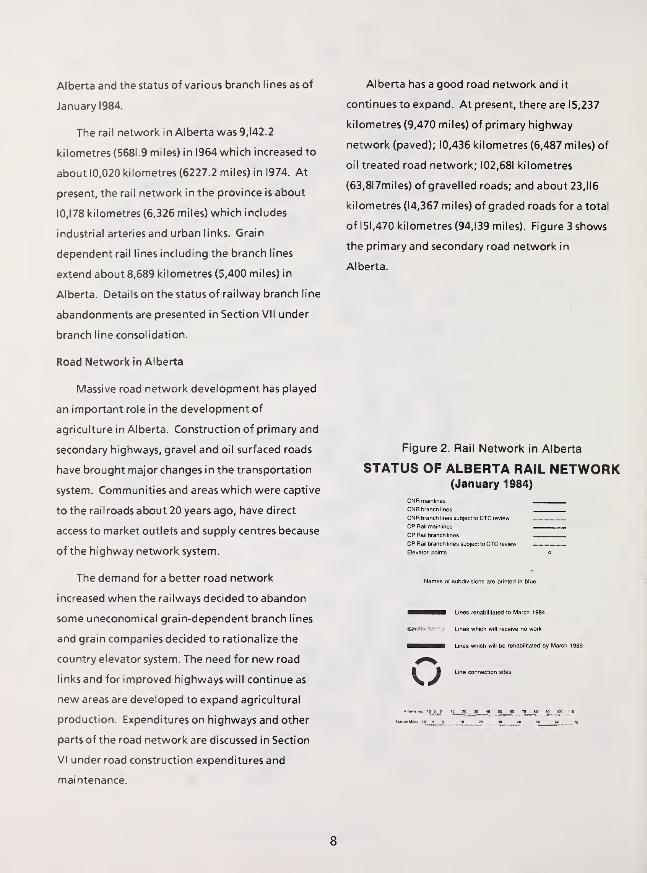
Alberta and the status of various branch lines as of
January 1984.
The rail network in Alberta was 9,142.2
kilometres (5681.9 miles) in 1964 which increased to
about 10,020 kilometres (6227.2 miles) in 1974. At
present, the rail network in the province is about
10,178 kilometres (6,326 miles) which includes
industrial arteries and urban links. Grain
dependent rail lines including the branch lines
extend about 8,689 kilometres (5,400 miles) in
Alberta. Details on the status of railway branch line
abandonments are presented in Section VII under
branch line consolidation.
Road Network in Alberta
Massive road network development has played
an important role in the development of
agriculture in Alberta. Construction of primary and
secondary highways, gravel and oil surfaced roads
have brought major changes in the transportation
system. Communities and areas which were captive
to the railroads about 20 years ago, have direct
access to market outlets and supply centres because
of the highway network system.
The demand for a better road network
increased when the railways decided to abandon
some uneconomical grain-dependent branch lines
and grain companies decided to rationalize the
country elevator system. The need for new road
links and for improved highways will continue as
new areas are developed to expand agricultural
production. Expenditures on highways and other
parts of the road network are discussed in Section
VI under road construction expenditures and
maintenance.
Alberta has a good road network and it
continues to expand. At present, there are 15,237
kilometres (9,470 miles) of primary highway
network (paved); 10,436 kilometres (6,487 miles) of
oil treated road network; 102,681 kilometres
(63,8l7miles) of gravelled roads; and about 23,116
kilometres (14,367 miles) of graded roads for a total
of 151,470 kilometres (94,139 miles). Figure 3 shows
the primary and secondary road network in
Alberta.
Figure 2. Rail Network in Alberta
STATUS OF ALBERTA RAIL NETWORK(January 1984)
CNR mainlines
CNR branch lines
CNR branch lines subject to CTC review
CP Rail mainlines ,
CP Rail branch lines
CP Rail branch lines subject to CTC review
Elevator points o
Names of subdivisions are printed in blue
Lines rehabilitated to March 1984
IBWffft sr.-Ts- Lines which will receive no work
— Lines which will be rehabilitated by March 1989
8

Figure 2. Rail Network in Alberta
9


SECTION III
GENERAL CHARACTERISTICS OF FARM TRUCKS
Number of Farm Trucks in Alberta
There has been a considerable change in the
size of the farm truck fleet in Alberta. In 1972-73,
the total number of farm trucks registered in
Alberta was 109,676 of which over 80 percent were
under the 6,000 kg. (13,225 lb.) gross vehicle
weight class, and about one per cent were in over
14,000
kg (30,860 lb.) group. Farm truck
registrations increased by eight per cent to 117,931 in
1973-74 and continued to increase by an average of
about four per cent per year up to 1982-83. In 1983-
84, the number of trucks on Alberta farms
registered with the Motor Vehicle Branch
decreased for the first time by over three percent
from the previous year.1
As shown in Table 2, there was a considerable
increase in farm truck registrations from 1975-76 to
1976-77, by about 19.5 per cent in one year. Most
of this increase could be attributed to new
purchases of farm trucks in 1976-77. Table 2
presents the registration of farm trucks with the
Motor Vehicle Branch from 1972-73 to 1983-84.
Data from 1977-78 to 1979-80 were not available
for publication.considerably from the numbers
reported in some earlier studies.
Distribution Of Farm Trucks By Gross Vehicle
Weight (GVW)
The number of farm trucks in Alberta has
continued to increase with the increased
production of farm products, and heavier trucks
were substituted when the earlier models became
obsolete. It was not possible to determine the
distribution of farm trucks by gross vehicle weight
for the years before 1 980-81, as most of the
information was compiled manual ly. However,
for a few selected registration years, i.e. 1972-73
and 1976-77, farm trucks were registered by the
gross vehicle weight classification.
In 1 976-77, the number of farm trucks under
6,000
kg (13,225 lb.) dropped below 77 per cent as
the number of heavier trucks increased. Table 3
shows the distribution of farm trucks by gross
vehicle weight from 1980-81 to 1983-84
(registration years).
During the 1980-81 registration year, the
number of farm trucks under 6,000 kg (13,225 lb.)
gross vehicle weight (GVW) class dropped to 69.4
per cent from about 77 per cent i n 1 976-77. The
number of heavier farm trucks i.e. over 14,000 kg
(30,860 lb.) GVW increased to 4.5 per cent of all
farm trucks registered in 1980-81. In 1976-77, the
number of these trucks was just about one per cent
of all farm trucks registered in that year.
In 1981-82, the number of small trucks (under
6,000
kg) slightly decreased to 69 per cent of all
farm trucks registered in Alberta. During the 1982-
83 and 1983-84 registration years, their number
decreased to 67.9 per cent and 66.4 per cent.
1 Prior to 1 983-84, vehicles other than farm
trucks were registered as farm vehicles, the
same category as trucks, e.g. cars, stations
wagons, utility vehicles and motor homes, etc.
The motor Vehicle Branch has tightened the
registration procedures since 1983-84, and only
those vehicles which are used for farming
operations are issued farm plates, i.e. trucks.
The number of farm trucks reported here has
11

been obtained by registration year (April 1 to
March 31) of vehicles and could vary respectively.
Purchases of larger trucks (over 1 4,000 kg) have
continued to increase during the last 4-5 years and
now stand at 5.4 per cent of all farm trucks in
Alberta registered during 1983-84. In the future,
such information may be difficult to obtain because
of the staggered registration procedure
implemented in the fall of 1983. However, data
presented in Table 3 clearly indicate a trend
towards heavier farm trucks as the demand for
increased transportation services on and off-farm
continues to grow. The increase in truck operating
costs and the increase in volume of farm
production can be met more economically with
larger trucks.
Age of Farm Trucks
Farm trucks in use in Alberta show a wide range
of ages. The age of a truck is an important
component of the cost function since newer trucks
are more fuel efficient and tend to develop more
power out of smaller size power units. Heavy farm
trucks usually last longer because they are used
relatively less than smaller trucks. At the time of
registration, owners are required to record the year
of the vehicle. Data on age of farm trucks were
obtained from the Motor Vehicle Branch. Table 4
TABLE 2
NUMBER OF FARM TRUCKS REGISTERED IN ALBERTA
Registration Year No. Of Farm Trucks
% Change From
Previous Year
1972-73 109,676 -
1973-74 117,931 7.6
1974-75 129,074 9.5
1975-76 132,067 2.4
1976-77 157,810 19.5
1977-80 (D (D
1980-81 161,900 2.6
1981-82 163,152 0.8
1982-83 167,508 2.7
1983-84 161,875 (3-4)
(1) Data not available
Source: Solicitor General's Department, Motor Vehicle Branch, Vehicle Registration Statistics.
12
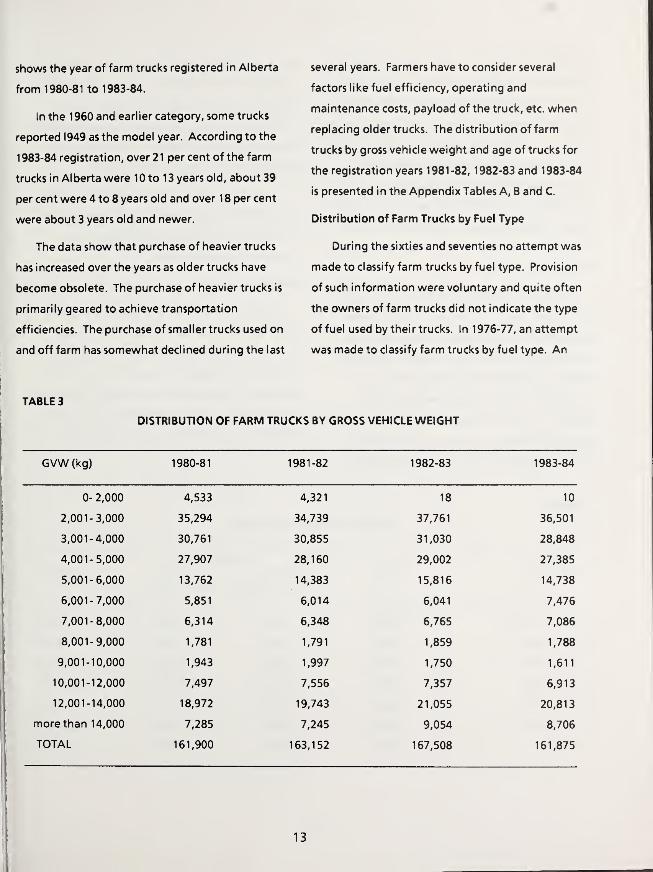
shows the year of farm trucks registered in Alberta
from 1980-81 to 1983-84.
In the 1 960 and earlier category, some trucks
reported 1949 as the model year. According to the
1 983-84 registration, over 21per cent of the farm
trucks in Alberta were 10 to 13 years old, about 39
per cent were 4 to 8 years old and over 1 8 per cent
were about 3 years old and newer.
The data show that purchase of heavier trucks
has increased over the years as older trucks have
become obsolete. The purchase of heavier trucks is
primarily geared to achieve transportation
efficiencies. The purchase of smaller trucks used on
and off farm has somewhat declined during the last
TABLE 3
DISTRIBUTION OF FARM TRU
several years. Farmers have to consider several
factors like fuel efficiency, operating and
maintenance costs, payload of the truck, etc. when
replacing older trucks. The distribution of farm
trucks by gross vehicle weight and age of trucks for
the registration years 1981-82, 1982-83 and 1983-84
is presented in the Appendix Tables A, B and C.
Distribution of Farm Trucks by Fuel Type
During the sixties and seventies no attempt was
made to classify farm trucks by fuel type. Provision
of such information were voluntary and quite often
the owners of farm trucks did not indicate the type
of fuel used by their trucks. In 1976-77, an attempt
was made to classify farm trucks by fuel type. An
BY GROSS VEHICLE WEIGHT
GVW (kg) 1980-81 1981-82 1982-83 1983-84
0- 2,000 4,533 4,321 18 10
2,001-3,000 35,294 34,739 37,761 36,501
3,001-4,000 30,761 30,855 31,030 28,848
4,001-5,000 27,907 28,160 29,002 27,385
5,001-6,000 13,762 14,383 15,816 14,738
6,001-7,000 5,851 6,014 6,041 7,476
7,001-8,000 6,314 6,348 6,765 7,086
8,001-9,000 1,781 1,791 1,859 1,788
9,001-10,000 1,943 1,997 1,750 1,611
10,001-12,000 7,497 7,556 7,357 6,913
12,001-14,000 18,972 19,743 21,055 20,813
more than 14,000 7,285 7,245 9,054 8,706
TOTAL 161,900 163,152 167,508 161,875
13
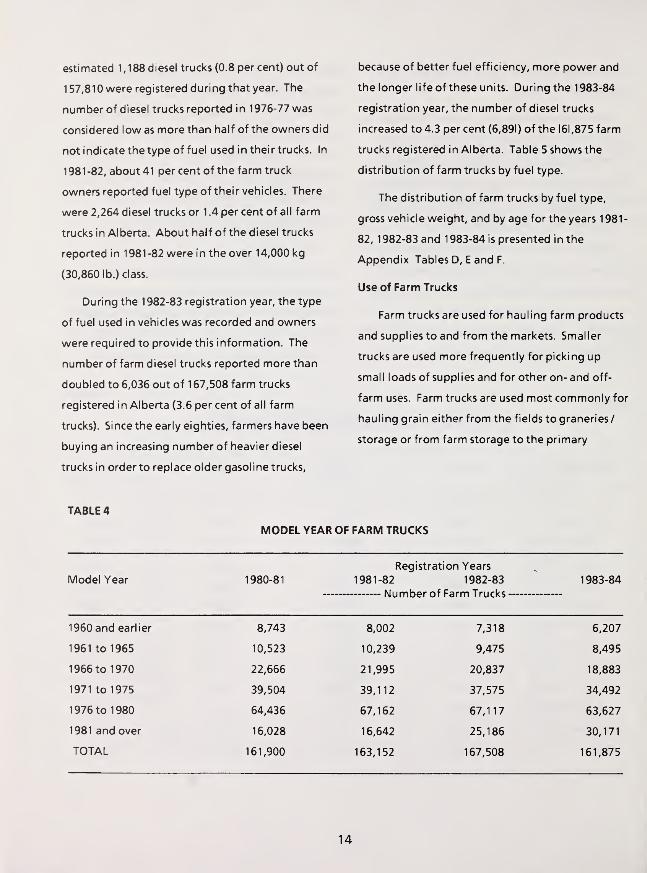
estimated 1,188 diesel trucks (0.8 per cent) out of
157,810 were registered during that year. The
number of diesel trucks reported in 1976-77 was
considered low as more than half of the owners did
not indicate the type of fuel used in their trucks. In
1981-82, about 41 per cent of the farm truck
owners reported fuel type of their vehicles. There
were 2,264 diesel trucks or 1 .4 per cent of all farm
trucks in Alberta. About half of the diesel trucks
reported in 1981-82 were in the over 14,000 kg
(30,860 lb.) class.
During the 1982-83 registration year, the type
of fuel used in vehicles was recorded and owners
were required to provide this information. The
number of farm diesel trucks reported more than
doubled to 6,036 out of 1 67,508 farm trucks
registered in Alberta (3.6 percent of all farm
trucks). Since the early eighties, farmers have been
buying an increasing number of heavier diesel
trucks in order to replace older gasoline trucks,
because of better fuel efficiency, more power and
the longer life of these units. During the 1983-84
registration year, the number of diesel trucks
increased to 4.3 per cent (6,891) of the 161,875 farm
trucks registered in Alberta. Table 5 shows the
distribution of farm trucks by fuel type.
The distribution of farm trucks by fuel type,
gross vehicle weight, and by age for the years 1981-
82, 1982-83 and 1983-84 is presented in the
Appendix Tables D, E and F.
Use of Farm Trucks
Farm trucks are used for hauling farm products
and supplies to and from the markets. Smaller
trucks are used more frequently for picking up
small loads of supplies and for other on- and off-
farm uses. Farm trucks are used most commonly for
hauling grain either from the fields to graneries/
storage or from farm storage to the primary
TABLE 4
MODEL YEAR OF FARM TRUCKS
Model Year 1980-81
Registration Years
1981-82 1982-83
Number of Farm Trucks
1983-84
1960 and earlier 8,743 8,002 7,318 6,207
1961 to 1965 10,523 10,239 9,475 8,495
1966 to 1970 22,666 21,995 20,837 18,883
1971 to 1975 39,504 39,112 37,575 34,492
1976 to 1980 64,436 67,162 67,117 63,627
1981 and over 16,028 16,642 25,186 30,171
TOTAL 161,900 163,152 167,508 161,875
14
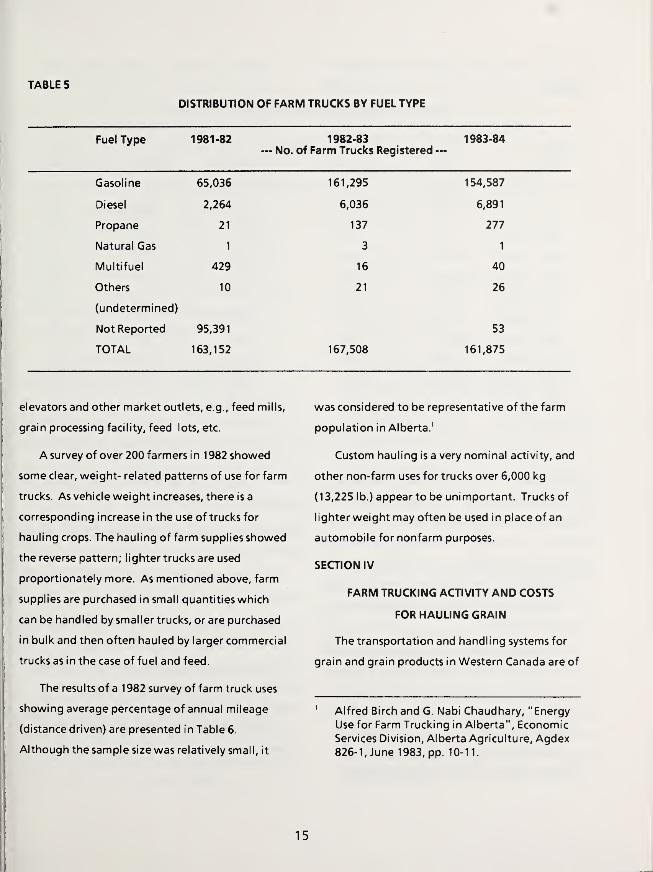
TABLE 5
DISTRIBUTION OF FARM TRUCKS BY FUEL TYPE
Fuel Type 1981-82 1982-83— No. of Farm Trucks Registered —
1983-84
Gasoline 65,036 161,295 154,587
Diesel 2,264 6,036 6,891
Propane 21 137 277
Natural Gas 1 3 1
Multifuel 429 16 40
Others 10 21 26
(undetermined)
Not Reported 95,391 53
TOTAL 163,152 167,508 161,875
elevators and other market outlets, e.g., feed mills, was considered to be representative of the farm
grain processing facility, feed lots, etc. population in Alberta.1
A survey of over 200 farmers in 1982 showed
some clear, weight- related patterns of use for farm
trucks. As vehicle weight increases, there is a
corresponding increase in the use of trucks for
hauling crops. The hauling of farm supplies showed
the reverse pattern; lighter trucks are used
proportionately more. As mentioned above, farm
supplies are purchased in small quantities which
can be handled by smaller trucks, or are purchased
in bulk and then often hauled by larger commercial
trucks as in the case of fuel and feed.
The results of a 1 982 survey of farm truck uses
showing average percentage of annual mileage
(distance driven) are presented in Table 6.
Although the sample size was relatively small, it
Custom hauling is a very nominal activity, and
other non-farm uses for trucks over 6,000 kg
(13,225 lb.) appear to be unimportant. Trucks of
lighter weight may often be used in place of an
automobile for nonfarm purposes.
SECTION IV
FARM TRUCKING ACTIVITY AND COSTS
FOR HAULING GRAIN
The transportation and handling systems for
grain and grain products in Western Canada are of
Alfred Birch and G. Nabi Chaudhary, "Energy
Use for Farm Trucking in Alberta", Economic
Services Division, Alberta Agriculture, Agdex826-1, June 1983, pp. 10-11.
15

TABLE 6
USE OF FARM TRUCKS: PERCENT OF ANNUAL MILEAGE
WeightClass (kg) Crops Livestock
Haulinq
Farm Supplies CustomOther
Non-Farm
0- 2,000 10.4 9.8 71.6 0 8.2
2,001-3,000 10.9 10.3 62.7 0.5 15.6
3,001-4,000 16.2 11.9 64.1 0.1 7.7
4,001-5,000 47.7 10.3 32.5 0.5 9.0
5,001-6,000 51.7 5.2 34.6 0 8.5
6,001-7,000 46.8 22.6 27.8 0 2.8
7,001-8,000 62.1 8.6 29.3 0 0
8,001-9,000 75.6 10.6 13.8 0 0
9,001-10,000 66.0 17.7 15.3 1.0 0
10,001-12,000 68.8 10.9 18.9 0.1 1.3
12,001-14,000 74.6 14.3 9.6 0.5 1.0
More than14,000 79.3 6.5 13.4 0 0.8
extreme importance not only to the prairie region
but to Canada as a whole. The production of
livestock across Canada relies heavily on the
availability of feed grains. Truck transportation has
played an important role in the development of the
livestock industry in feed deficient areas by hauling
grain and grain products from production areas to
consumption centres.
During the seventies and early eighties, the
trucking industry (commercial and farm) in Alberta
has shown a tremendous growth. The number of
farm trucks registered with the Motor Vehicle
Branch has increased by an average of six per cent
per year from 1972-73 to 1982-83. Similarly the
numbers of commercial trucks used for hauling
grains, feed grains and grain products almost
doubled from 1970 to 1979-80.
Role of Farm Trucks in Collection and Delivery of
Grain
Farm trucking of grain is an integral part of the
entire grain transportation system. The
responsibility for transporting grain from the farm
to shipping points (primary elevators) and other
market outlets has rested with the grain producers.
At harvest, farm trucks haul grain from fields to
storage on the farm, and in some instances grain is
hauled directly from the field to the primary
collection points.
16

Hauling grain from farm storage or field to
primary collection points is exclusively by truck,
which in most cases is undertaken by the producers
themselves. Before the early sixties, farm trucks
were considerably smaller and producers had to
make several trips to deliver grain to market
outlets. However, at that time producers travelled
relatively shorter distances to deliver grain
compared to now. With the abandonment of rail
branch lines and consolidation of country elevators,
the distance to grain market outlets has increased
significantly. In order to reduce the increasing costs
of hauling grain, producers gradually bought
larger trucks for a better payload.
Although the one way distance for hauling
grain from farms to primary elevators varies
greatly, the average was estimated to be about 8
kilometres (5 miles) in Alberta a few decades ago.
The average grain hauling distance on the prairies
from farms to primary elevators was 1 2 kilometres
(7.7 miles).
With the closure of primary elevators and
delivery stations, the average distance for hauling
grain in Alberta increased to 18 kilometres (1
1
miles) in 1974-75 from about 1 1 kilometres (7 miles)
in 1967-68. Trucks (commercial and farm) have
played an important role in bringing grain from
farms to the primary grain collection points.
Total Costs of Grain Transportation by Farm Truck
No formal survey has been undertaken since
1975 to document farm trucking costs for hauling
grain from the field/farm to primary elevators or
other market outlets. A survey in 1975-76 obtained
information on the cost of transporting grain in
Alberta directly from about 200 farmers for the
1974-75 crop year. The cost was divided into two
major categories -- fixed and variable costs.1
The fixed costs included:
depreciation
i nterest on i nvestment
license fees
insurance costs
The variable costs included
:
lubrication cost
repairs- parts, etc.
fuel - gasoline/d iesel
maintenance and repair labour
tires and batteries
driving labour
dead-haul labour
A brief description as to how depreciation,
driving labour and dead-haul labour costs were
computed, is given below:
Depreciation: The diminishing balance method
was used to arrive at depreciation costs for the
trucks surveyed for the 1 974-75 crop year. The
average life of a truck was assumed to be 1 5 years.
Some older trucks still in use at that time were
allocated 10 per cent of the original price to
calculate depreciation.
1
G. Nabi Chaudhary, "The Cost of Transporting
Grain By Farm Truck in Alberta", Alberta
Agriculture, Economic Services Division,
Production Economics Branch, Agdex 1 1 0/820,
August 1977, P. 9.
17

Driving Labour: Farmers were asked to
estimate the average time it took them to make a
trip from the farm to the delivery point and other
sales outlets and back to the farm. The total
driving time for transporting grain was calculated
by multiplying the number of trips during that crop
year by the travel time for each trip. Driving labour
costs were calculated by multiplying the total
driving time (hours) spent by the operator, hired
worker and family with respective hourly labour
charges.
Dead-Haul Labour: The dead-haul labour time
was calculated by adding the time taken for
loading-unloading grain and waiting time. The
total dead-haul labour time was arrived at by
multiplying the number of trips hauling grain
during the crop year by dead-haul time for each
trip. Dead-haul labour costs were obtained by
multiplying the respective dead-haul labour time
for operator, hired worker and family member by
respective hourly wage rate.
The various costs listed above were the
common costs for various grain trucks uses. These
costs (except driving and dead-haul labour costs)
were allocated to grain traffic by using the criterion
of "proportion of grain haul miles to annual truck
miles".
An important assumption for calculating grain
transportation costs for the 1 974-75 survey was
that each trip to the elevator or other sales outlet
was charged to hauling grain. It was further
assumed that the farmer did no other business
while hauling grain. Round trip distance was
included for cost calculation purposes and in
calculating grain miles, rather than using only the
loaded miles.
The total farm truck grain transportation costs
obtai ned for the 1 974-75 crop have been
periodically up-dated to the 1983-84 crop year by
using Western Canada Farm Input Indicies,
published quarterly by Statistics Canada. Although
this crude updating procedure does not reflect the
changes which have taken place in the grain
handling and transportation system, there was no
acceptable alternative for developing such costs.
The costs shown in Table 7, except driving and
dead-haul labour, are not the total costs for the
truck, rather, these are the portions of all costs
attributable to the transportation of grain from the
farm to the primary elevator and other market
outlets.
The average total grain transportation costs per
farm truck were $949.96 for the 1 983-84 crop year
which showed an increase of about 1 22 per cent
over the costs in the 1974-75 crop year. Total fixed
costs per truck amounted to $363.09 or 38 per cent
of total grain transportation costs.
The largest component of grain transportation
costs was depreciation at $2 1 7.79 or about 23 per
cent of total costs. This was followed by driving
labour (1 5.8 per cent), dead-haul labour (13.92 per
cent) and fuel at 1 3 per cent. Interest on
investment amounted to $81.50 (8.6%) of total
costs. Fuel and lubrication costs showed the
highest increase in 1983-84 over the costs in 1974-
75. Details on other variable and fixed costs are
presented in Table 7.
18

AVERAGE
TOTAL
COSTS
OF
TRANSPORTING
GRAIN
BY
FARM
TRUCK
IN
ALBERTA,
(1983-84)
.1
0)
3 42co wre 5>
Is-V oTJ -Q(0 JO
a; -J
Q
> 5a ®
<0 U.a d® ooc jgi
c -a<0 c5 10
VIa>_ •—
2 c <»
k <o C(0
acc
So S$in
5
cc.22 5 *
2 S-uo cI- (0
- T| vi
42 <u t;
p .5 oh U. U
- £0) o 002 c E in in
+"*
co S
a>>
5 00
u<0x_
CL<U
D
I^S
r<
in>JQ
T3<U-C
z3CLv»®X
ac4-»
3Q.C
E8=.
iou=
<0
~o(0c<0uc
(TJ
<u>,
Q.Oi_v->
in
'd-
<n
Eo
*aCDM<TJ
"PQ-3VI+->VIOU
OJ

Unit Costs of Transporting Grain by Farm Truck
Although significant changes have taken place
in grain handling and transportation in terms of
the increasing payload of farm trucks, longer
hauling distances to primary elevators, and an
increase in the volume of grain production since
1974-75, no data have been obtained for bushels of
grain delivered or bushel-miles of service and grain
miles, etc. Therefore, in order to estimate the 1983-
84 unit costs of hauling grain, the 1974-75 data on
bushels of grain transported, bushel-miles of
service provided and grain miles have been used to
arrive at unit costs. Three types of unit costs were
calculated, i.e. costs per bushel, costs per bushel-
mile and costs per grain mile. The unit costs are
shown in Table 8.
On a bushel basis, the average cost of
transporting a bushel of grain from the farm to the
primary elevator and other market outlet was
estimated to be 12.8 cents. Average variable costs
amounted to 7.9 cents per bushel where as fixed
costs were 4.9 cents per bushel . It was assumed
that an average farmer delivered or hauled 7434
bushels of grain in 1983-84, same as in 1974-75.
Average cost per bushel-mile was calculated to
be 1.05 cents in 1983-84, up from 0.47 cents in
1974-75. Average variable costs per bushel-mile
were 0.65 cents and fixed costs per bushel-mile
amounted to 0.4 cents.
On a grain mile basis, the average cost of
transporting an average load of grain one mile was
1 1 8.8 cents. The average variable costs per grain
mile amounted to 73.4 cents and average fixed
costs per grain mile were 45.4 cents. During the
1974-75 crop year, average number of grain miles
per farm truck was 800 miles (1,280 kilometres) and
the same number was used to arrive at 1 983-84
farm truck costs.
TABLE 8
UNIT COSTS OF TRANSPORTING GRAIN BY FARM TRUCK IN ALBERTA, 1983-84
Units
AverageVariable Cost
AverageFixed Cost
AverageTotal Cost
Cents Cents Cents
Bushel 7.9 4.9 12.8
Bushel-mile 0.65 0.4 1.05
Grain Mile 73.4 45.4 118.8
20

SECTION V
CHARACTERISTICS OF COMMERCIAL TRUCKS IN
ALBERTA
Commercial trucking of grain in the sixties was
quite minimal involving the movement of
rapeseed, grass seed and coarse grains from farms
to mills or feedlots. Commercial for-hire trucks
were not involved to any great extent in the
movement of grain from farms to the local elevator
in the past owing to the relatively short haul,
I i mited quotas and elevator space. At some of the
old elevators, large trucks encountered difficulties
such as unsatisfactory approaches and exits, height
and width restrictions, spillage, slow spouting
loading capacity, platform scales that were
inadequate for heavy loads and positioning of
trucks, etc.
Commercial trucks offer some cost savings over
farm trucks and have been used to some extent
where length of haul is quite long. The large
capacity equipment operated by commercial
truckers appears to some producers to be more
efficient than the small trucks they operate.
Commercial truckers are also used by producers
who either cannot afford to own large capacity
equipment or cannot commit the time to deliver
their own grain when required.
Commercial trucks have been part of various
exercises undertaken by the Canadian Wheat Board
and private grain companies to expedite grain
shipments to export positions. Trucks have been
used in connection with experimental programs to
determine the feasibility and desirability of using
inland terminals in combination with unit
trains/solid trains to ship grain to domestic or
export positions.
Regulations Governing the Commercial Grain
Trucking in Alberta
Regulation of motor carriers has traditionally
been the responsibility of provincial governments.
Under The British North America Act, the federal
government was empowered to regulate extra-
provincial transportation. However, the federal
government's powers of regulation were formally
delegated to the provinces under the Motor
Vehicle Transport Act of 1 954.
For regulatory purposes, the provinces have
divided the motor carrier industry into the
following two broad jurisdictional categories:
(a) Intra-provincial motor carrier operation -- a for-
hire motor carrier whose entire business
undertakings are confined within the
boundaries of one provincial jurisdiction, i.e.,
does not transport goods outside provincial
boundaries.
(b) Extra-provincial motor carrier operation -- a
for-hire motor carrier whose business
undertaking involves transporting goods
between two or more provincial jurisdictions,
i.e., transport goods across provincial
boundaries or into the United States.
The Public Service Vehicle Act of Alberta
empowers the Alberta Motor Transport Board to
regulate the trucking industry in Alberta. Under
the Motor Vehicle Transport Act, Section 37, "no
person may operate a public vehicle on a highway
for the purpose of transporting goods .... unless the
operation is carried out pursuant to the authority
21

of an operating authority certificate or an
exemption has been obtained
Under the act, a "public vehicle means a vehicle
operated on a highway by or on behalf of a person
forthetranportation of goods and goods
means anything that is or may be carried by means
of a vehicle and for the transportation of which
compensation is payable
Intra-Provincial Motor Carrier
In Western Canada, Alberta may be described
as "non-regulator" with respect to intra-provincial
trucking as it allows the intra-provincial trucking
industry in the province to operate in a free
enterprise environment with minimal regulation.
As a result the procedure involved in obtaining
intra-provincial operating authority and
commencing a for-hire trucking operation is
relatively simple. The Motor Transport Board
stipulates the following minimal requirements that
must be met in order to obtain intra-provincial
operating authority:
purchase of a Public Service Vehicle license
plate
show proof of insurance
posting of a fidelity bond
Prior to issuance of authority to operate as an
intra-provincial carrier, the application must be
ratified by the Motor Transport Board, however,
this procedure is strictly a formality and less than
one per cent of all applications are rejected.4
Any properly licensed resident of Alberta meeting
the above three basic requirements can commence
an intra-provincial for hire operation in Alberta
with no restriction respecting routes, rates,
commodity transported or equipment.
Extra-Provincial Motor Carrier
With respect to extra-provincial hauling, under
powers conferred on the Alberta Motor Transport
Board by the Federal Motor Vehicle Transport Act,
the regulatory environment in Alberta for
commercial trucking is somewhat similar to that of
other provinces. That is, there is entry control, but
with respect to grain hauling, there are no
economic regulations in terms of service, rates, etc.
An extra-provincial motor carrier (resident or
non-resident) must apply to the Motor Transport
Board for authority. Restrictions (routes,
commodities, areas, shippers, etc.) may be placed
on this authority and the board may issue a permit
to a non-resident owner of a vehicle who:
a) has complied with the law of his/her place
of residence as to the registration of motor
vehicles, and
b) desire to operate the public vehicles for a
single conveyance of goods .... and specify
conditions to which the permit is subject.5
The board may issue special permits (in place of
operating authority certificates) "in any instances
1 Alberta Motor Transport Act, Section 37.
2 MTA, Section I (v)
3 MTA, Section 1 (g)
4 Report of the Select Committee of the
Legislative Assembly, "Reviewing Intra-
Provincial Trucking Regulations", Alberta,
March, 1977, P.23.
22

where the operation of a public vehicle is otherwise
prohibited under the Act," and may specify:6
the duration of special permits, and
the conditions to which the special permit is
subject.
Alberta's regulations governing commercial
grain hauling are:
Intra-
Provincial
Entry
Controls
not
controlled
Rate
Controls
not
controlled
Service
Controls
not
controlled
Extra-
Provincail
controlled not
controlled
not
controlled
Commercial Grain Trucking Fleet Size AndOperating Characteristics
Data on intra-provincial commercial grain
trucking are not readily available. The operating
authority records are of little value in identifying
intra-provincial carriers because they are not
restricted to grain hauling or any other particular
commodity. Therefore, it is not possible to identify
which or how many carriers are in intra-provincial
grain hauling. However, the authority's records do
serve as an indicator of the number of extra-
provincial carriers, although there are some factors
limiting their usefulness.7
"non-complimentarity" (i.e., holding an extra-
provincial authority in one jurisdiction which is
not complemented in another).
"non-exercise" (i.e., holding appropriate
authority but not exercising it).
"authority cascading" (i.e., grain being
encompassed within another, broader,
authority term).
1 trip permitting (i.e., authorizing operations
by -trips or time-limited permits only, issuing no
formal (recorded) authority).
"mid-night permitting" (i.e. non, or loose
enforcement).
These are some of the shortcomings in the
authority records with the Al berta Motor Transport
Board. However, for the purposes of this study, the
board's records have been relied upon to
determine the size and various characteristics of
commercial trucks for extra-provincial grain
hauling. As indicated above, it is impossible to
isolate commercial trucks for intra-provincial grain
hauling.
The list of authorities obtained from the
Alberta Motor Transport Board showing extra-
provincial movements of grain or grain products
has shrunk considerably and contains the names of
only 31 carriers. Four carriers have two
authorizations each. The authorities showed that
26 carriers were Alberta domiciled, three were
from British Columbia and two from Saskatchewan.
The commodities listed on the authorities are
processed grains, grains unmilled and seed. Table 9
presents the operating authority certificate report
on commercial truckers licensed to haul grain and
grain products extra-provincially.
5 MTA Section 196 MTA Section 207 Clayton, A., Nix, F., and Sparks, G., "Aspects of
Commercial Trucking of Grain in the Prairie
Region: Fall 1982", Research Branch,
Canadian Transport Commission, May 1983, p.
40.
23

Alberta Commercial Grain Trucking Fleet Size:
Commercial grain truckers owning extra-
provincial authorities were contacted to obtain
information on the fleet size, areas served,
utilization of equipment, configuration of
equipment, other dry bulk freight hauled, rates,
and back-haul situation, etc. Discussion under this
sub-section concentrates on size of the fleet and
configuration of equipment.
It was difficult for some carriers to pinpoint the
exact number of grain trailers/A-trains/B-trains
used for hauling grain or grain products intra- and
extra-provincially. Because of the versatility of the
equipment, its uses included hauling other dry bulk
commodities and products.
Table 10 presents a summary of estimated fleet
of hopper-bottom units operated by carriers with
intra- and extra- provincial authorities.
In addition to the carriers and equipment
presented in Table 10, it is estimated that there is a
large number of one to two truck operators in
Alberta. Because of the deregulated nature of
intra- provincial grain hauling, it was difficult to
estimate the number of such carriers and
equipment operated by them.
Several carriers and other sources dealing with
commercial truckers estimate the number of grain
trailers (semis, A-trains and B-trains) in Alberta
could be between 200 and 250 which is about three
times lower than in the late seventies. Carriers
contacted indicated that there are other carriers
hauling grain and grain products under the
classification of bulk commodities. Most of these
TABLE 9
OPERATING AUTHORITY CERTIFICATE REPORT ON COMMERCIAL TRUCKERS LICENSED TO HAUL GRAINAND GRAIN PRODUCTS EXTRA-PROVINCIALLY*
Number of
Number of Authorities in
Hauled Authorities use in 1984 Orgin Destination
1 . Processed Grain 17 9 All points in Alta. All points in B.C.
Products 1 All points in B.C. All points in Alta.
2. Grains Unmilled 13 2 All points in B.C. All points in Alta.
9 All points in Alta. All points in B.C.
3. Seed Grain 1 1 All points in Alta. All points in B.C.
4. Grain Processed
For Feed
4 4 All points in Alta. All points in B.C.
TOTAL 35 26
‘Information obtained from Alberta Motor Transport Board,
Red Deer, Alberta.
24

TABLE 10
HOPPER-BOTTOM FLEET FOR INTRA- AND EXTRA-PROVINCIAL HAULING OF GRAIN AND GRAINPRODUCTS, 1984-85
No. of
Carriers Semis A-Trains B-Trains C-Trains Total
Carriers Contacted 24 107 23 40 170
Carriers Identified
by Others 7 12 3 8 23
TOTAL 31 119 26 48 193
carriers were not Alberta domiciled therefore no
contact was made with them.
The tractor semi-trailer five-axle units, which
dominate the fleet, range between 38 to 42 feet in
length. Some of these semis have special features,
like interchangeable 2, 3, and 4 feet sides, sliding
tandem axles, complete tarping protection, which
can be used for hauling general commodities,
palletized and bagged commodities. In terms of
payload for these units, estimates varied
considerably from 30,000 lb. to 45,000 lb.
Operating Characteristics: The carriers
contacted were also asked to provide general
information on the operating characteristics of
their fleet. Specific questions on operating
characteristics included grain hauling patterns
(areas served), types of commodities (dry bulk)
hauled other than grain, annual utilization of
equipment, back-haul rates, etc.
Grain Hauling Patterns: About half of the
carriers contacted hauled grain and products intra-
provincially both in Alberta and British Columbia.
Fourteen carriers moved processed feed grains or
unmilled grains to the States, most commonly to
Washington, Idaho, Montana, California and
others. Four carriers hauled feed grains to
Saskatchewan and Manitoba as a back-haul as well
as front-haul.
For some of the carriers, local hauling (intra-
provincial) was between farms, country elevators
and feed mills. Three carriers indicated contract
hauling for grain companies and rapeseed crushing
plants and feed mills in the province.
A few carriers reported a considerable drop in
the grain traffic because of competition among the
carriers and poor production in 1984. Most of the
Alberta feed grains shipped by truck to British
Columbia were for domestic consumption. Since
the introduction of contract rates by the railways
on feed grains, the truckers' share has been on the
decline.
Most of the carriers could not provide an
accurate account of the number of loads of grain
carried intra- and extra-provincially during 1984.
Therefore, no attempt was made to generalize this
information.
25

Types of Commodities Hauled: The carriers
were asked to provide information on the types of
commodities hauled with the equipment used for
hauling grain. Because of the versatility of the
equipment, other commodities hauled included
fertilizer, paper, lumber, and general merchandise,
and as one carrier put it "anything which is possible
to load and unload". A few carriers hauling
perishable produce from the States reported using
semis equipped with refrigeration units hauling
feed grains as back-haul to the States.
Most Alberta-based carriers hauled grain, grain
products and fertilizers to British Columbia and the
provinces to the east, and hauled non-farm
commodities as back-haul. Grain hauled by these
carriers was mostly non-board and most of the
movements were primary i.e., off the farm. Most of
the destinations were other than primary elevators
i.e., processing plants, terminals and feed mills.
Annual Utilization of Equipment and Back-
Haul: Annual utilization of grain related
equipment was determined in terms of annual
kilometres (miles) per unit. It was difficult to
obtain specific information, particularly when the
equipment was being used for non-grain traffic as
well. However, carriers were asked to provide an
estimate of annual mileage per unit. It was not
possible to get this information from all carriers.
Two Alberta-based carriers estimated that they
averaged about 96,000 to 120,000
kilometres/trailer/year in 1984. Another carrier
estimated 160,000 to 180,000 kilometres/trailer/year
for the grain related equipment of which about 40
per cent was for grain and grain products. Another
Alberta carrier hauling grain and grain products
intra- and extra-provincial ly to British Columbia
hauled about 360 loads of grain in A-trains and
about 200 loads in semis.
Carriers hauling grains intra-provincially
reported over 50 per cent running empty on back-
hauls. Extra-provincial carriers reported 5 to 20 per
cent being empty on back-hauls, depending upon
the area serviced and length of haul. Two carriers
hauling to and from the States reported very little
empty back-haul as they always found some
products to haul, although back-haul rates did not
always cover operating costs of the unit.
One Alberta carrier hauling perishables from
the States in refrigerated semis reported hauling 20
loads of feed grain as back-haul in 1984, with an
average load of 19,510 kg (43,000 lb). The back-haul
rate reported by this carrier to California was about
$54/tonne ($2.45 per cwt) which is less than 40 per
cent of the front-haul rate. This carrier commented
that the shippers pretty well dictate the back-haul
rate. Sometime the carrier is told "take it or leave
it" because there are several other carriers
competing for the same load. Average annual
mileage on this carrier's equipment was about
240,000 kilometres/trailer/ year.
Several carriers pointed out that there is
currently wide-scale underutilization of the
existing equipment available for commercial grain
trucking in Alberta and on the Prairies. A few of
the obvious reasons for underutilization of
equipment are wide fluctuations in production,
competition among carriers, competition with the
railways and the down-turn in the economy.
26

Development of Commercial Trucking in the Grain
Industry
Using commercial trucks to haul grain from the
farm and/or from the primary collection points to
central shipping areas (terminals) increased
significantly during the early seventies. It peaked
from 1976 through 1981. The increase in
commercial grain trucking activities could be
attributed to several factors: consolidation of
primary elevators; abandonment of rail branch
lines; relaxation of vehicle weight and dimension
regulations; and the development of a hopper
bottom fleet. The relaxation of maximum weights,
lengths and other highway legal limits inspired the
trucking industry to increase payloads significantly
and improve overall transportation efficiencies. All
these developments over the past two decades
have made commercial trucking an effective mode
of transportation. Trucks are competing
successfully with railways on medium and some
long hauls. Since the early seventies, commercial
trucks have taken over short haul or intra-
provincial traffic.
Use of Commercial Trucks by the Canadian Wheat
Board
The Canadian Wheat Board (CWB) undertook
some test hauls involving commercial trucks to
expedite the shipment of grain to export positions
in 1971-72. The test project involved the movement
of barley by commercial trucks from primary
elevators to the federal government terminals at
Moose Jaw and Saskatoon. During the ten week
test period, i.e., May 23 to July 31, 1971, a total of
122,397 tonnes (5,621,700 bushels) of barley was
trucked from country elevators to the two
terminals. The entire operation was completed
successfully.
Since the 1971-72 crop year, commercial trucks
have been serving as feeder to the railways in the
Prairie region. Rail line abandonments and closure
of country elevators increased the demand for
truck services.
Before the 1973-74 crop year, commercial truck
uses for hauling grain in Alberta were limited to
serving feed-mills, seed plants and feed-lots. After
examining grain shipment by truck from primary
elevators to interior terminals in Saskatchewan, the
CWB attempted test hauls in Alberta during the
1973-74 crop year.
The objective of the test hauls was to overcome
delays caused by strikes and shortages of boxcars,
and also to test the reliability of using commercial
trucks for unit train operation. Grain was moved
from branch line points to the interior terminals
using commercial trucks to speed up rail shipments.
Commercial trucks used in the test haul carried
1 8 to 24 tonnes (700 to 900 bushels of barley). All
of the units were the self-unloading type and were
licensed as commercial vehicles "Class C". Initially,
the carriers were authorized to haul grain within
320 kilometres (200 miles) radius from the terminal
points at Edmonton and Lethbridge. However, the
above limit was reduced to 160 kilometres (100
miles) because of the cost factor.
The trucking program relieved the rail cars
which were usually tied up on the tracks either at
the country elevators or at the terminals. Injection
of truck service expedited grain movement to the
ports in time. One estimate showed that during
27

the test haul period rail cars took seven days from
Lethbridge to Vancouver and back. Earlier the
same cars used to take 1 2 to 1 5 days for a return
trip.
During the 1973-74 crop year, the trucking
program in Alberta moved 49,262 tonnes
(1,810,094 bushels) of wheat, and 53,071 tonnes
(2,437,548 bushels) of barley from country
elevators to interior terminals in Edmonton. A
total of 1 78,206 tonnes (6,547,992 bushels) of
wheat were transported to the Lethbridge
terminal. Over 280,500 tonnes (10.7 million
bushels) of wheat and barley were hauled to the
two terminals by truck for the board in the 1973-74
crop year. The Calgary terminal was not used by
the board as it was occupied by oilseed and other
grain.
The cost of trucking grain to interior terminals
in 1973-74 was $3.92 per tonne (6. 1 cents per
bushel). Other costs like diversion charges, interior
terminal handling, weighing and inspection were
$1.98 per tonne (3.1 cents per bushel) for grain
shipped to inland terminals.
Commercial trucks expedited the grain
shipments, as grain was dried, cleaned and graded
at the inland terminalsand was shipped via unit
trains to seaports using modern hopper cars.
Where as rail boxcar which usually took about ten
days to move from country elevator to an inland
terminal was able to make the round trip in 8 to 10
hours to move the same amount of grain. Trucking
of grain to inland terminals lead to better
utilization of available railway equipment.
A strike by blue-collar workers at the seaports
resulted in the suspension of commercial trucking
of grain, and since then no such attempt has been
made to revive that program. Commercial trucks
have been hauling non-board grain to inland
terminals for further shipments and to the feed
mills, processing plants and ranches.
Intra-Provincial Rates/Costs of Transporting Grain
by Commercial Trucks
Commercial grain trucking rates presented in
Table 1 1 have been obtained from the Western
Tariff Bureau. For both intra- and extra- provincial
movements the carriers are free to set their own
rates. The published tariffs set out certain
conditions and charges which are usually
considered as guidelines. Only those carriers
following these guidelines are party to a particular
tariff. Some of the established carriers have their
own tariffs for quoting rates. However, these rates
can be further negotiated depending upon the
business volume, routing, loading and unloading
facilities, etc.
A few contract carriers hauling grain and grain
products for grain companies and other grain
processing organizations negotiate rates for a
certain duration and these are strictly followed. In
addition to the negotiated rates, other grain
hauling conditions are also stipulated in the
respective companies' tariffs.
The commercial grain trucking rates published
by the Western Tariff Bureau on behalf of the
participating carriers are presented in Table 1 1
.
These rates, which apply to the intra-provincial
28
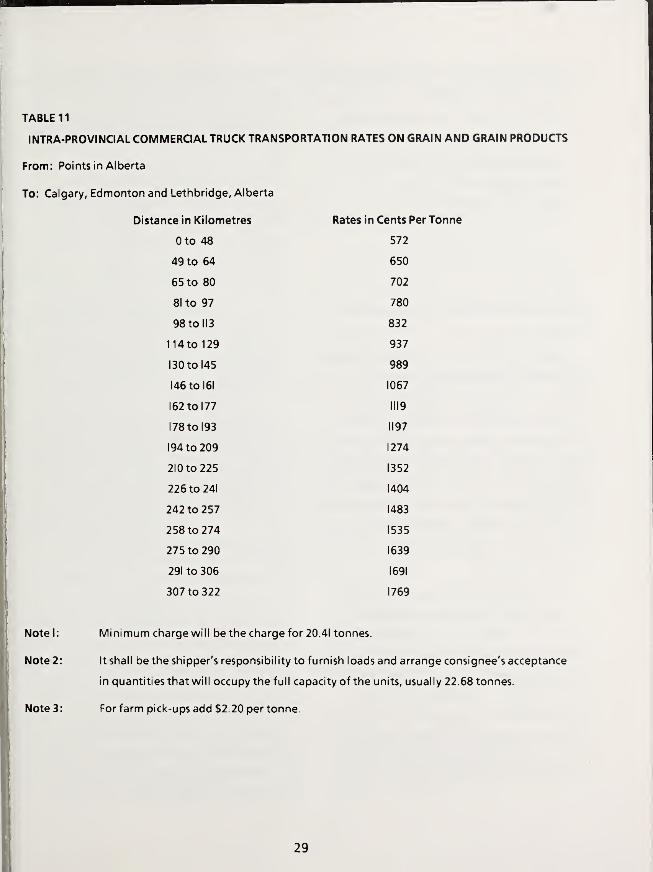
TABLE 11
INTRA-PROVINCIAL COMMERCIAL TRUCK TRANSPORTATION RATES ON GRAIN AND GRAIN PRODUCTS
From: Points in Alberta
To: Calgary, Edmonton and Lethbridge, Alberta
Distance in Kilometres Rates in Cents Per Tonne
Oto 48 572
49 to 64 650
65 to 80 702
81 to 97 780
98 to 113 832
1 14to 129 937
130 to 145 989
146 to 161 1067
162 to 177 1119
178 to 193 1197
194 to 209 1274
210 to 225 1352
226 to 241 1404
242 to 257 1483
258 to 274 1535
275 to 290 1639
291 to 306 1691
307 to 322 1769
Note I: Minimum charge will be the charge for 20.41 tonnes.
Note 2: It shall be the shipper's responsibility to furnish loads and arrange consignee's acceptance
in quantities that will occupy the full capacity of the units, usually 22.68 tonnes.
Note 3: For farm pick-ups add $2.20 per tonne.
29
movement of grain, have not been increased since
May 1982. The main reasons are:
too many carriers for the same load (severe
competition)
considerable drop in the volume of grain
available for trucking
farmers buying into larger trucks and increase
in custom hauling
1984 being the worst year for grain production;
etc.
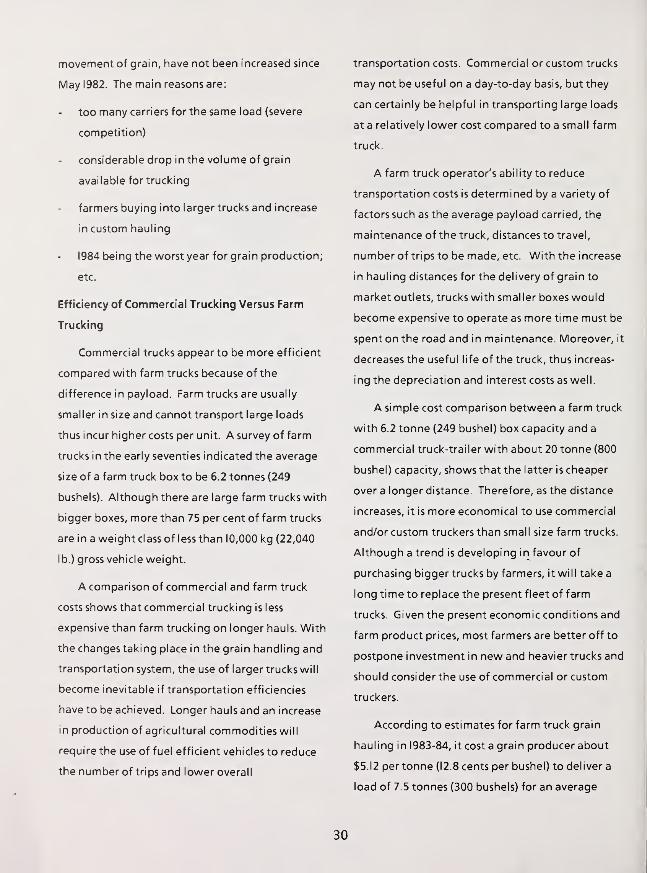
Efficiency of Commercial Trucking Versus Farm
Trucking
Commercial trucks appear to be more efficient
compared with farm trucks because of the
difference in payload. Farm trucks are usually
smaller in size and cannot transport large loads
thus incur higher costs per unit. A survey of farm
trucks in the early seventies indicated the average
size of a farm truck box to be 6.2 tonnes (249
bushels). Although there are large farm trucks with
bigger boxes, more than 75 per cent of farm trucks
are in a weight class of less than 10,000 kg (22,040
lb.) gross vehicle weight.
A comparison of commercial and farm truck
costs shows that commercial trucking is less
expensive than farm trucking on longer hauls. With
the changes taking place in the grain handling and
transportation system, the use of larger trucks will
become inevitable if transportation efficiencies
have to be achieved. Longer hauls and an increase
in production of agricultural commodities will
require the use of fuel efficient vehicles to reduce
the number of trips and lower overall
transportation costs. Commercial or custom trucks
may not be useful on a day-to-day basis, but they
can certainly be helpful in transporting large loads
at a relatively lower cost compared to a small farm
truck.
A farm truck operator's ability to reduce
transportation costs is determined by a variety of
factors such as the average payload carried, the
maintenance of the truck, distances to travel,
number of trips to be made, etc. With the increase
in hauling distances for the delivery of grain to
market outlets, trucks with smaller boxes would
become expensive to operate as more time must be
spent on the road and in maintenance. Moreover, it
decreases the useful life of the truck, thus increas-
ing the depreciation and interest costs as well.
A simple cost comparison between a farm truck
with 6.2 tonne (249 bushel) box capacity and a
commercial truck-trailer with about 20 tonne (800
bushel) capacity, shows that the latter is cheaper
over a longer distance. Therefore, as the distance
increases, it is more economical to use commercial
and/or custom truckers than small size farm trucks.
Although a trend is developing in favour of
purchasing bigger trucks by farmers, it will take a
long time to replace the present fleet of farm
trucks. Given the present economic conditions and
farm product prices, most farmers are better off to
postpone investment in new and heavier trucks and
should consider the use of commercial or custom
truckers.
According to estimates for farm truck grain
hauling in 1983-84, it cost a grain producer about
$5.12 per tonne (12.8 cents per bushel) to deliver a
load of 7.5 tonnes (300 bushels) for an average
30

distance of 18 kilometres (ll.l miles). These costs
increased to $6.72 per tonne (16.8 cents per bushel)
for a distance ranging from 19 to 24 kilometres (11.8
to 15 miles).
Costs for hauling grain by farm and commercial
truck are:
Farm Truck Commercial Truck
Box capacity 6.2 tonnes 20 tonnes
Average 18 km $5.l2/t $5.72/t*
distance: 23 km $6.72/t $5.72/t*
48 km $9.20/t $5.72/t‘
j
* Add $2.20 per tonne for farm pick-up.
A cost comparison between a farm truck and a
commercial truck shows that the former is cheaper
for short distance deliveries. However, to deliver
the same volume of grain as with a commercial
truck in one trip, the farm truck owner would have
to make about three trips. As the hauling distance
increases, the commercial truck offers cost saving
over an average farm truck. If the payload can be
increased on a commercial unit by using A or B-
trains, higher savings can be realized.
The grain hauling rates given above should be
used as a guide for estimating trucking costs.
Better rates can be negiotiated depending on
business volume, loading, unloading and road
conditions.
Transportation of Feed Grains to British Columbia
Livestock and poultry production in British
Columbia has been dependent on feed grain
supplies from outside the province. Production is
centred in the lower mainland, southern interior
Okanagan and Vancouver Island regions. Since
these regions are almost entirely grain deficient.
producers have to rely on supplies of feed grains
from distant areas. In order to assist these
producers, the federal government introduced a
Feed Freight Assistance (FFA) program in 1940
which subsidizes a portion of the transportation
costs of feed grains to be used by livestock feeders.
This FFA program is administered by the Livestock
Feed Board of Canada.
A recent study completed by the Grain
Transportation Task Force for the Livestock Feed
Board of Canada provides detailed information on
movement of feed grains to British Columbia by
mode, type and origin. Selected information from
this report has been used here to describe the
commercial trucking activity for hauling feed grains
and grain products to British Columbia. 8
The British Columbia Feed industry is heavily
dependent upon feed grain supplies from Alberta.
Most of the feed grains transported to the lower
mainland of British Columbia under the FFA
program comes from Alberta and the Peace River
region of British Columbia. Lesser amounts
originate from other Prairie areas and the west
coast terminal elevators.
The origin of feed grains and products
transported to British Columbia under the Feed
Freight Assistance (FFA) Program are shown in
Table 12. The terminal elevator amounts represent
purchases from the Canadian Wheat Board of
The Grain Transportation Task Force,
"Transportation of Feed Grains
To British Columbia", Livestock Feed Board of
Canada, January 1984.
31

wheat, oats and barley and screenings moved from
Vancouver terminals under FFA.
The figures in Table 12 show the dominance of
Alberta as a source of feed grains for British
Columbia. Prior to the crop year 1974-75, the
domestic sales of feed grains from the Prairies was
under the control of the Canadian Wheat Board
(CWB). Feed grains from the Peace River region of
B.C. for domestic use were not subject to CWB
jurisdiction and were used in large quantities
because of the competitive pricing structure used.
At the start of the 1974-75 crop year changes were
made to the Domestic Feed Grains Policy and British
Columbia producers were allowed direct access to
the Prairie feed grain market. Since that time there
has been a decline in the percentage of feed grains
obtained from the Peace River region.
The percentage of wheat, oats and barley
transported to B.C. from Alberta, the Peace River
region of B.C. and the West Coast terminals, under
the FFA program, are shown in Table 13.
Commercial Trucking Activity for Transportation of
Feed Grains to British Columbia
During the seventies the trucking industry
showed a tremendous growth and captured a
significant share of the extra-provincial movement
of feed grains and grain products, and has almost
replaced rail for the intra-provincial movement of
agricultural products. A shortage of railway
equipment, high operating costs, and higher
domestic freight rates provided truckers with
opportunities to haul feed grains and grain
products to British Columbia, eastern Canada and
the U.S.A. The commercial truckers took advantage
of the situation and increased their share of feed
grain shipments to British Columbia.
Since 1978, the railways have made determined
efforts to get back part of the traffic lost to truckers
by offering competitive rates in the form of
contract rates. These rates are discussed in the
following sub-section. Figures in Table 14 show that
rail has again become the dominant mode of
transport for the movement of feed grains to
British Columbia from the Prairies. The percentage
transported by truck has changed significantly
during the last 10 years. Movement by truck
increased through to the 1977-78 crop year and
then declined when the railways established "truck
competitive" rates from the main shipping points.
The supply of feed grains to British Columbia in
the 1982-83 crop year is illustrated in Figure 4,
which shows the areas of origin, the transportation
modes and the regulatory bodies involved. The
main regulatory bodies are the Canadian Wheat
Board (CWB), and the Grain Transportation Agency
(GTA). The GTA and CWB regulate shipments of
feed grains transported by the elevator system.
Alberta is the major supplier, providing 66 per
cent of the feed grains and over 90 per cent of the
wheat, oats and barley used in British Columbia.
Approximately 10 per cent of the wheat, oats and
barley is shipped direct from farms to nonlicensed
elevators. These shipments are by truck and are not
subject to the quota system of the CWB. The
balance of shipments are from the elevator system,
and move by truck or rail. Grain entering the
elevator system is subject to the CWB quota system
32

and rail shipments are regulated by the GTA and
CWB.
During the 1982-83 crop year approximately
0.37 million tonnes of wheat, oats and barley were
transported from Alberta to the lower mainland
domestic market with approximately 65 per cent or
about 0.25 million tonnes moved by rail.
Truck transport, direct from farm or from the
elevator system, does provide an alternative to rail
movement. However, there are limitations to the
amount of grain that can be transported by truck.
These limitations include:
the seasonal nature of grain availability direct
from the farm, owing to weather and supply
problems,
grain is "back hauled" by trucks and the
number of trucks available varies depending on
the demand for primary loads,
TABLE 12
FFA* MOVEMENT OF FEED GRAINS TO BRITISH COLUMBIA BY TYPE AND ORIGIN ("000" TONNES)
-Wheat/Oats/Barley-
Alberta Peace Terminal
Corn
Man.Screen
Term."
Mill
Feed
Alta. Total
Crop Year
82/83 370.0 19.1 2.2 50.8 3.0 44.2 489.3
81/82 397.3 23.3 3.2 81.4 2.6 45.5 553.3
80/81 361.9 37.8 8.6 15.7 3.5 39.3 466.8
79/80 368.4 31.0 4.9 29.5 4.9 32.6 471.3
78/79 330.0 27.9 3.7 20.3 2.9 41.5 426.3
77/78 219.6 25.9 4.6 6.2 7.7 43.9 307.9
76/77 167.7 33.8 7.8 0.0 6.7 39.7 255.7
75/76 149.7 53.6 8.6 0.0 5.1 49.4 266.4
74/75 196.4 31.5 6.8 0.0 6.0 40.4 281.1
73/74 139.4 113.8 32.6 0.0 5.8 29.5 321.1
*FFA (Feed Freight Assistance)
“Screenings Terminal - Screenings from Vancouver Terminal transported to Zone I
(Okanagan/Kootenays) and covered under the Feed Freight Assistance
program.
33
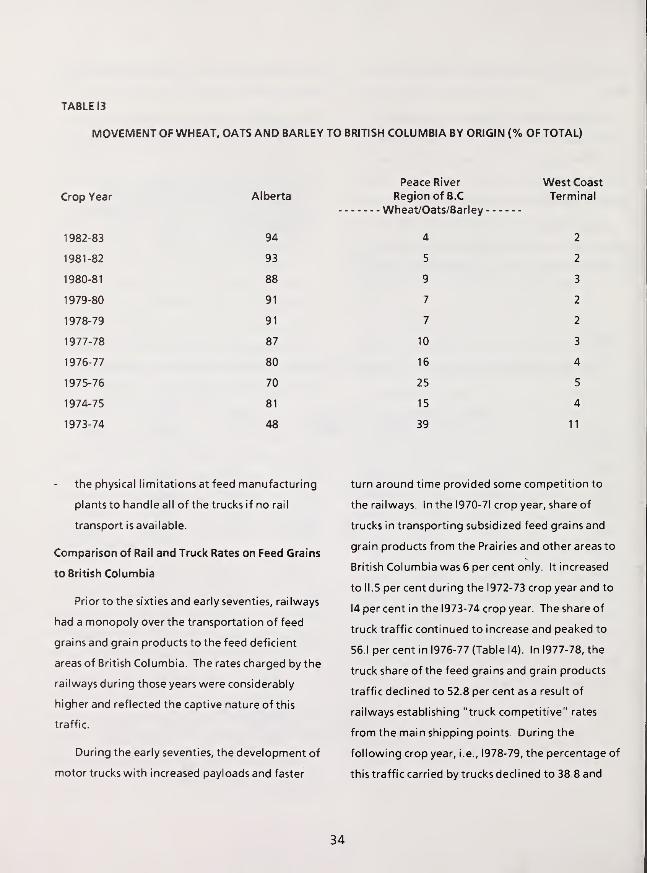
TABLE 13
MOVEMENT OF WHEAT, OATS AND BARLEY TO BRITISH COLUMBIA BY ORIGIN (% OF TOTAL)
Peace River West Coast
Crop Year Alberta Region of B.C Terminal
1982-83 94 4 2
1981-82 93 5 2
1980-81 88 9 3
1979-80 91 7 2
1978-79 91 7 2
1977-78 87 10 3
1976-77 80 16 4
1975-76 70 25 5
1974-75 81 15 4
1973-74 48 39 11
the physical limitations at feed manufacturing
plants to handle all of the trucks if no rail
transport is available.
Comparison of Rail and Truck Rates on Feed Grains
to British Columbia
Prior to the sixties and early seventies, railways
had a monopoly over the transportation of feed
grains and grain products to the feed deficient
areas of British Columbia. The rates charged by the
railways during those years were considerably
higher and reflected the captive nature of this
traffic.
During the early seventies, the development of
motor trucks with increased payloads and faster
turn around time provided some competition to
the railways. In the 1970-71 crop year, share of
trucks in transporting subsidized feed grains and
grain products from the Prairies and other areas to
British Columbia was 6 per cent only. It increased
to 11.5 per cent during the 1972-73 crop year and to
14 per cent in the 1973-74 crop year. The share of
truck traffic continued to increase and peaked to
56.1 per cent in 1976-77 (Table 14). In 1977-78, the
truck share of the feed grains and grain products
traffic declined to 52.8 per cent as a result of
railways establishing "truck competitive" rates
from the main shipping points. During the
following crop year, i.e., 1978-79, the percentage of
this traffic carried by trucks declined to 38.8 and
34
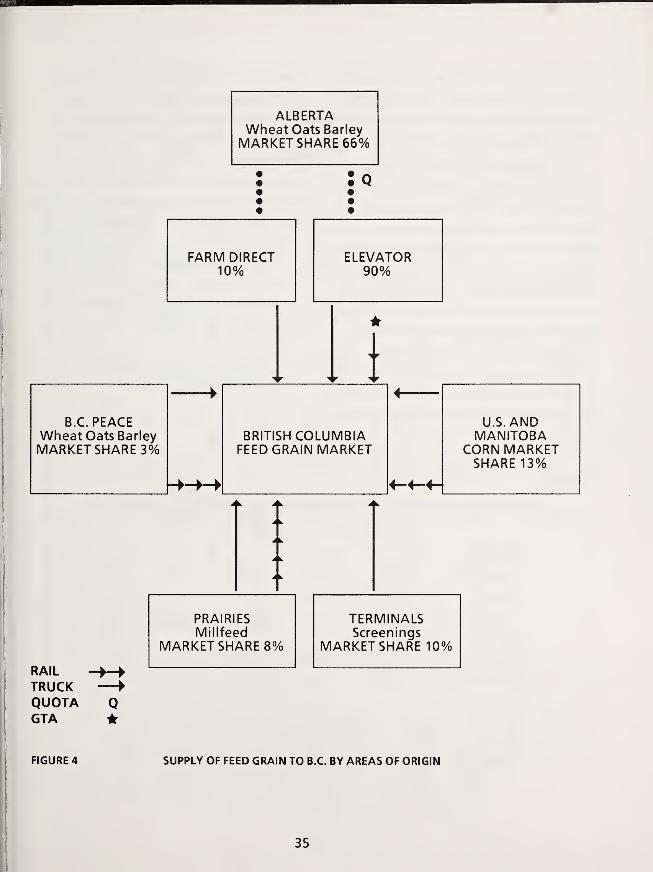
ALBERTAWheat Oats BarleyMARKET SHARE 66%
Q
rail
TRUCKQUOTA QGTA *
PRAIRIES TERMINALSMillfeed Screenings
MARKET SHARE 8% MARKET SHARE 10%
FIGURE 4 SUPPLY OF FEED GRAIN TO B.C. BY AREAS OF ORIGIN
35
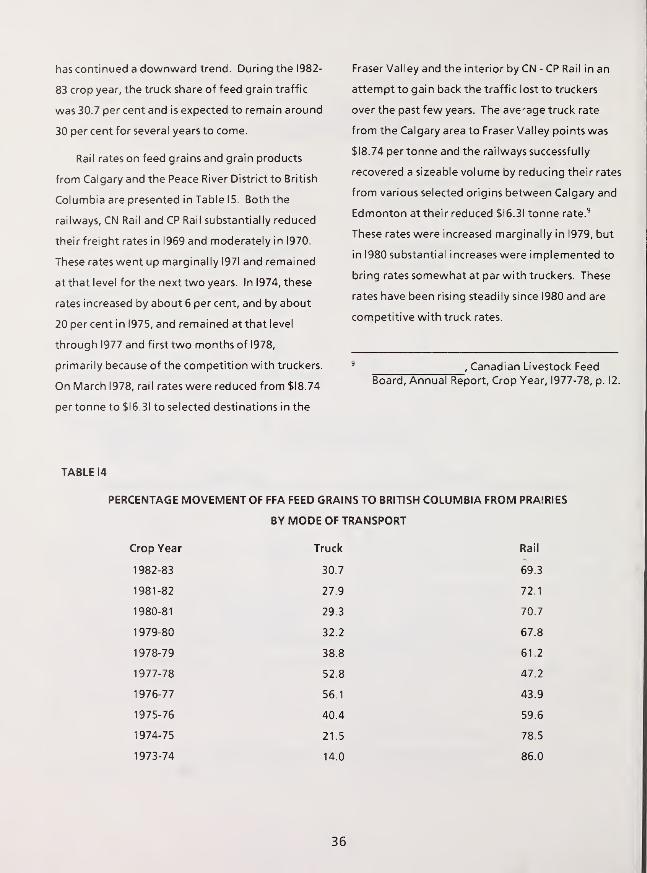
has continued a downward trend. During the 1982-
83 crop year, the truck share of feed grain traffic
was 30.7 per cent and is expected to remain around
30 per cent for several years to come.
Rail rates on feed grains and grain products
from Calgary and the Peace River District to British
Columbia are presented in Table 15. Both the
railways, CN Rail and CP Rail substantially reduced
their freight rates in 1969 and moderately in 1970.
These rates went up marginally 1971 and remained
at that level for the next two years. In 1974, these
rates increased by about 6 per cent, and by about
20 per cent in 1975, and remained at that level
through 1977 and first two months of 1978,
primarily because of the competition with truckers.
On March 1978, rail rates were reduced from $18.74
per tonne to $16.31 to selected destinations in the
Fraser Valley and the interior by CN - CP Rail in an
attempt to gain back the traffic lost to truckers
over the past few years. The average truck rate
from the Calgary area to Fraser Valley points was
$18.74 per tonne and the railways successfully
recovered a sizeable volume by reducing their rates
from various selected origins between Calgary and
Edmonton at their reduced $16.31 tonne rate.9
These rates were increased marginally in 1979, but
in 1980 substantial increases were implemented to
bring rates somewhat at par with truckers. These
rates have been rising steadily since 1980 and are
competitive with truck rates.
_____ ,Canadian Livestock Feed
Board, Annual Report, Crop Year, 1977-78, p. 12.
TABLE 14
PERCENTAGE MOVEMENT OF FFA FEED GRAINS TO BRITISH COLUMBIA FROM PRAIRIES
BY MODE OF TRANSPORT
Crop Year Truck Rail
1982-83 30.7 69.3
1981-82 27.9 72.1
1980-81 29.3 70.7
1979-80 32.2 67.8
1978-79 38.8 61.2
1977-78 52.8 47.2
1976-77 56.1 43.9
1975-76 40.4 59.6
1974-75 21.5 78.5
1973-74 14.0 86.0
36

RAIL
RATES
ON
FEED
GRAINS
TO
SELECTED
DESTINATIONS
FROM
1967
TO
1985
($
PER
TONNE)
3 s£ £
00 N ©© oo oo
6 iri N 8 6© ©© © (N
© © com in m
03 N NIfl CO 03
© © ©
© © O(NONS IN 6«— IN CO
03 5<u .2a. oo
to m oIN CO ©© <3- ©
o m mT~ ^ ©© © ©
03 ww <u<o 5ni
CO © 00© O CO*- IN COCO IN IN
0)
Jo %a> ~Q. 00
© © ©IN © *-
<y
Jo ^(Va. oc
© o o© ©CO O^ co
on
io 5oi .2a. ao
ai
S *<13 Oa. oo
© ©in © ©
<0- <x> CMCM © ©<- © oo
<V
© ©on C'.'
03 C> (O
ct .03
<vi 10
o u(0 -rj03 £
u C
u“ U
Q- >2 3o o
cc _o>
<K IO
S u10 -n03 2C £ 03 ©
io Q- >+- o u IO
(~> O O 3-
N-"E c -2
— O 10 IO
Q H- ^ > >
Same
rates
for
1973.
Same
rates
for
1976
to
1978.

Commercial Truck Rates to British Columbia:
As discussed in Section V, commercial feed
grain trucking rates are unregulated for both intra-
and extra-provincial movements. Thus, there is no
regulatory source of data on feed grain hauling
rates for shipments to British Columbia. The rates
presented below have been obtained from a carrier
tariff and from carriers who were contacted to
obtain information on grain trucking fleet size and
the characteristics of the fleet for shipping feed
grains and grain products to British Columbia.
Readers are cautioned that truck rates published in
a carrier tariff have no particular status as the
participating carriers are free to set their own rates
as they see appropriate. Rates published in a tariff
are used as guidelines and a participating carrier
would not charge more than the published rates.
However, if a carrier is guaranteed a certain
business volume over a time period, there is a good
possibility of negotiating a lower rate.
The truck rates presented in Table 16 indicate
that although these rates were slightly higher than
the rail rates (Table 15), they provided severe
competition to the railways during the mid-
seventies. The increased competition from the
truckers could be attributed to inadequacy of
railway equipment, turn around time required for
railway cars, efficient service provided by truckers,
and to some extent the consideration for freight
rates.
Truckers share of subsidized feed grains and
grain products movement increased to over 56 per
cent in the 1976-77 crop year. It dropped to about
53 per cent in 1977-78, and fearing the erosion of
rail service for domestic grain shipments, the
railways decided to reduce their rates on March I,
1978 for feed grains shipped under the FFA
program. In the following crop years the truckers'
share declined considerably and has been around
30 per cent since 1979-80.
As shown in Table 16, truck rates on feed grains
and grain products to British Columbia have not
been increased since 1982. The main reasons for
hauling feed grains at the 1982 rates are that there
are too many carriers for the same load, and
competition with the railways. Rail rates have
played a major role in recapturing grain traffic
from the truckers.
SECTION VI
ROAD EXPENDITURES AND RELATED ISSUES
Alberta is well served by a system of primary
highway, secondary and local roads. The primary
highway and secondary road network is shown in
Figure 3 in Section II. The secondary road system
covers most of the province and provides direct
access to the paved all-weather roads. The
objective of this chapter is to examine expenditures
by various levels of governments on road
construction and maintenance, and the adequacy
of the road network to serve grain producers in the
province. It is also, to evaluate the impact of
increased trucking activity on the provincial road
network and to determine any additional
expenditures for proper maintenance.
38


Government Expenditures on Road Construction
and Maintenance
Before discussing the road construction and
maintenance expenditures, it would be useful to
discuss the jurisdictional responsibilities of
different types of roads.
Local Roads: The main purpose of local roads is to
provide access to abutting properties. In rural
areas, local roads are paid for on an "at large"
basis, they are not assessed di rectly to the frontage
of the parcels they serve, but are paid for out of the
municipal portion of the mill rate available to the
total rural jurisdiction.
Collector Roads: These collect traffic from the local
roads and feed it into the arterial system. They
typically provide both a land access and collector
function, and thus are wider than local roads.
In rural areas it is useful to subdivide collectors
into two categories:
Full municipal responsibility rural collector
raods are developed and financed by the
rural jurisdiction on the at-large basis. That
is, they are financed out of the municipal
mill rate.
Rural collectors which have received the
administrative classification of secondary,
form part of a system developed jointly by
the rural municipalities and the province.
The rural municipality provides the right-of-
way, the province pays for the construction,
and the municipality is responsible for
subsequent maintenance. (Some
secondaries are built fully by the
municipality).
Arterials: The major function of arterials is
through movement. Depending on the demand
for through movement, some land access function
can also be accommodated. Low volume arterials
may provide as much land access service as some
collectors. Extremely high traffic demands require
freeway standards and permit no direct access.
In rural areas the basic arterial system is the
primary highway network, which has full provincial
jurisdiction and financial responsibility. Some
secondaries also provide an arterial function. For
the most part these have been identified as the
"900 series", where the province pays for any
additional right-of-way required, construction and
subsequent maintenance.
The impact of grain trucking on local roads is
not severe. Grain producers are quite dispersed
therefore individual local roads are not subjected
to concentration of trucks. Truck trips begin to
concentrate on the collector system which are in
most cases either secondary roads or primary
highways.
Road Expenditures and Maintenance: The task of
calculating the effect of increased trucking activity
or the use of bigger trucks on roads is very complex.
The service life of pavements, both ashphalt and
concrete, are influenced by axle weights and
number of axle load repetitions. Pavements are
initially designed to withstand an expected number
and magnitude of load repetitions for the
anticipated service life.
40

When a pavement is properly designed, it
presumably will require only routine surface
maintenance throughout its life, provided the
expected number of axle load repetitions is not
exceeded. In other words, it will not be damaged
by the traffic it is designed to support.
Unexpected increases in loadings are likely to
shorten the service life of the pavement. The result
is an earlier application of the expected
rehabilitation, usually a thicker overlay.
Primary highway pavements are usually
designed for high volumes and heavy loads, so the
incremental impact of changes in grain haul
patterns is not large. Some secondary road
pavements have been designed to take advantage
of the lower expected traffic volume. It is in these
cases where changed grain haul patterns can have
a larger incremental effect.
The main impact of changes in grain haul
patterns on road costs is on collectors which have
an oiled surface. These surfaces do not have any
structural strength, but are designed to provide a
higher quality dust-free surface and to protect the
subgrade from moisture. Oiled surfaces can only be
successful in situations where there is not a
substantial amount of trucking. Should there be an
unexpected change in truck loading, there are two
possibilities: If the total volume of cars and trucks
is low enough, the road revert to gravel, which is
much more economical to maintain. If the traffic
volume is such that a gravel surface is unsafe
because of dust, the road must be upgraded at a
much higher cost.
Here is a moot question. If a relatively modest
increase in grain trucking takes away the oiling
option, and the road must be paved, all the traffic
will benefit. So is it fair to assign the cost of paving
to the increased grain or other trucking?
The provincial expenditures for construction of
primary highways, approach roads, secondary
roads, maintenance of primary and secondary
highways and grants to counties and municipal
districts were estimated at $605.7 million in 1984-
85. A detailed breakdown of different types of
expenditures related to highway and road
maintenance is given in Table 17. Grants provided
by the provincial government to counties and
municipal districts and special areas amounted to
over $27 million in 1984-85.
Road maintenance expenditures vary
considerably from one type of road to another. For
a two-lane primary paved highway it costs about
$4,547 per kilometre per year in maintenance
including snow ploughing and ditch maintenance.
For two-lane secondary highways the costs are
about $3,600 per kilometre per year. Gravelled
road maintenance costs are estimated to be about
$1,250/km/year. For oiled roads annual
maintenance
expenditures are around $6,000 per kilometre and
about $22,000 per kilometre every three years for
re-oiling and grading.
It is anticipated that with an increase in
trucking activity (only if producers have choice of
mode) maintenance costs for the above roads
41

TABLE 17
PROVINCIAL GOVERNMENT ESTIMATE OF EXPENDITURES FOR HIGHWAY CONSTRUCTION AND
MAINTENANCE, 1984-85
ELEMENT TITLE 1984-85 APPROPRIATION
Regional Administration $12,102,683
Construction Programming Branch Administration 1,809,628
Construction of Primary Highways 193,937,000
Construction of Campsites and Rest Areas 1,477,800
Construction of Approach Roads 1,999,000
Construction of Roads to Provincial Parks 2,075,000
Construction of Vehicle Inspection Stations 578,000
Highway 40 Project 34,000,000
Construction of Secondary Roads 86,172,000
Construction of Forestry Roads 4,000,000
Special Projects 2,476,635
Improvement District Road Construction 30,000,000
Engineering Support 723,000
Grants - Counties & Municipal Districts 25,487,600
Grants - Special Areas 1,528,000
Grants -Street Assistance in Towns & Villages 7,500,000
Maintenance of Primary Highways 66,231,888
Maintenance of Improvement District Roads 14,803,337
Maintenance and Operation of Ferries 1,143,164
Resource Roads 38,129,596
Pavement Rehabilitation 45,000,000
Construction of Provincial Airport Facilities 3,667,206
Construction of Community Airport Facilities 5,818,199
Maintenance and Operation of Provincial Air Facilities 2,374,759
Improvement District Trust Account 22,687,700
TOTAL $604,904,000
42

would not increase significantly. Grain producers
would be either using larger trucks or engaging
commercial/custom truckers which would reduce
the number of axle repetitions on these roads.
Several studies have shown that maintenance of
roads for increased grain truck traffic would cost
significantly less than rehabilitation or upgrading
of branch lines.
Estimates of county expenditures from 1978 to
1982 for improvement and maintenance of local
roads are shown in Figure 5. Calculations show that
60 to 65 per cent of total municipal expenditures
went for roads. In 1982, an average of $4.7 million
per county was spent on municipal roads.
The municipal districts and county
representatives have expressed concerns regarding
increased truck hauling of grain in view of the rail
lines abandoned. They have asked the provincial
government to enter into a cost-sharing agreement
with the federal government to increase regular
road grants to all municipal districts and counties
affected by rail line closures.
Impact of Changes in the Primary Grain Collection
System
Significant changes have taken place in the
primary grain collection system owing to
rationalization of the primary grain elevator system
and abandonment of rail branch lines. Grain
producers who used to haul grain on an average of
FIGURE 5
COUNTY EXPENDITURESON LOCAL ROADS
43

II kilometres (7 miles) are now hauling about 18
kilometres (II. I miles) or more.
Long-term plans of the grain companies are
difficultto predict but one thing is certain: these
companies will continue to consolidate grain
receiving facilities in order to lower overall
operational costs. A number of primary elevators
in the province require massive renovations or
upgrading for efficient handling of grain.
Another change which could occur in the
present grain collection system would be delivering
grain to those elevators offering lower rail rates
under the present rate zones. It would involve
some extra hauling of grain, but a few points listed
in Table 18 have been identified where the rail rate
differential could result in changes of delivery
points. A shift in grain delivery point would
depend on factors like availability of space at the
elevator offering a lower rate (capacity and
throughput); other services offered at that point;
road connections and conditions, the additional
cost of trucking grain measured against any
savings. Some of the selected points where there is
potential for shifting deliveries are listed in Table
18.
The most common rate differential (farmer's
share) is about $0.13 per tonne between
neighboring elevators. Average distance between
various points is about 10 to 13 kilometres (6 to 8
miles). In addition to the above points, there are
other areas which offer savings from $0.26 to $1.14
per tonne but the distance range is quite large, i.e.,
II to 64 kilometres (7 to 40 miles).
The shift in grain deliveries is difficultto
quantify exactly but there is some potential for it.
Such a shift would require monitoring to determine
the impact on roads. A grain producer's first
preference is usually to deliver to the closest
elevator, but if there is lack of space and the next
elevator offers some incentive in terms of a lower
rate, grain may be delivered there. Moreover, if
producers employ custom or commercial truckers to
haul their grain, there would be no additional
charge for an extra 10 to 15 kilometres (6 to 9 miles)
if they can benefit from a lower rail rate.
If throughput should decrease at some facilities
for no apparent reason, grain companies would not
hesitate to close those facilities. As mentioned
above, distances travelled by grain producers to
deliver grain have increased considerably and will
continue to increase if efficiencies in the grain
handling system are to be achieved.
Over the last several years, the concept of high
throughput elevators has developed which
provides a potential solution to some of the
inefficiencies inherent in the present elevator
system such as high fixed costs, slow grain car turn
around, long storage time, slow loading and
unloading, etc. The development of such a system
could lead to a considerable reduction in cost to
grain producers.
Impact of Trucking on Other Highway Traffic
(Safety)
Safety is an important public concern on the
nation's highways and local roads. As a result of
increasing truck size and weight, there are general
44

TABLE 18
RATE DIFFERENTIAL BETWEEN NEIGHBOURING POINTS (SHIPPER'S SHARE)
Elevator
Point
Rate
$/tonne
Elevator
Point
Rate
$/tonne
Differential
$/tonne
Distance
(km)
Lanfine 8.33 Oyen 8.20 0.13 10-13
Ellerslie 7.95 Nisku 7.83 0.13 10
Spirit River 7.44 Rycroft 7.32 0.12 10
Falher 7.82 Girouxville 7.70 0.12 13
Erskine 7.70 Stettler 7.44 0.26 12
St. Michael 7.32 Star 7.06 0.26 16
Hardisty 8.20 Lougheed 7.44 0.76 58
Fairview 8.33 Rycroft 7.32 1.01 53
Hines Creek 8.46 Rycroft 7.32 1.14 64
safety concerns and concerns over effects on other
transportation modes. These are controversial
concerns and very little definitive data are
available. However, an attempt has been made to
extract information from a few of the studies
undertaken on the safety of larger trucks.
Concerns about large trucks often focus on
safety characteristics including stopping ability,
jackknifing tendencies, sway or other lack of
stability, and spray in inclement weather.
A study completed by the Ontario Commission
on Truck Safety addressed two major safety areas,
(a) accident frequency, and (b) accident severity.
Information contained in this study is based on a
review of the related literature and discussions
with experts. Many researchers have attempted to
answer the questions as to whether or not doubles
have a worse safety record than singles. A lot of
conflicting data have been produced and
consequently, the question has not effectively been
answered to the satisfaction of many people. Some
of the findings from this study are presented
below 1
.
It has been frequently postulated that smaller
cars and bigger trucks cause more accidents. This is
Ontario Commission on Truck Safety "Car-
Truck Size Disparity", a study of the Nature and
Safety Implications of Trends in Automobile
and Truck Weights and Dimensions, by Delean,
June 1982
45

a complex question because accidents may
sometimes involve a "phantom vehicle" not
actually involved in the collision. "Phantom
vehicle" involvement, whether it be a car or a truck,
is virtually impossible to determine.
1. Where it is to their economic advantage carriers
will tend to utilize trucks as large as the
regulations permit. With an increasing use of
larger vehicles, presuming that their capacity is
utilized, fewer vehicles would be required to
meet any given demand.
2. The aerodynamic effects of large vehicles on
small vehicles are often considered a safety
concern. One expert consulted on this topic
noted that the actual mass of the automobile is
not what is important, but rather, the concept
of density is more relevant.
The perception of a small car and large
truck interacting aerodynamically, to present a
potentially dangerous situation is commonly
encountered, however, no evidence has been
found that this will be a significant safety
problem with the anticipated car and truck
sizes.
3. Splash and spray generated by large vehicles
are often considered to be a safety hazard to
operators of smaller vehicles. No literature was
found that identified the magnitude of this
problem. Although splash and spray can be
indeed be a safety hazard, research by the
Western Highway Institute shows that it is
speed, and not vehicle length, that increases
splash and spray. Apparently, doubles and
triples with single axles create less spray than
tractor- semis with tandem axles at comparable
speeds. Splash and spray may be a significant
safety concern under especially degraded
environmental conditions and when coupled
with other safety reducing processes.
4. Traffic operations, especially on two lane roads,
can be adversely affected by heavy trucks. Slow
vehicles may, under certain conditions,
"induce" accidents. When traffic flow is
impeded, driver frustration increases and an
unsafe passing manoeuvre may be attempted.
Whether or not any ensuing accident can be
attributed to the slow moving vehicle is
debatable. The fact remains, however, that this
is a potentially hazardous situation and should
be avoided where possible.
The consensus of opinion expressed by the
experts is that car-truck accident rates will not
be significantly influenced by vehicle size
changes.
5. There are factors (other than vehicle mass or
size) that have an influence upon accident
severity. It is suggested that accident location
(by road type) is one such factor. A paper by
Hedlund found that: "accident location has a
far greater effect on accident
severity than does size or weight of the truck.
An accident is more likely to be severe ...
if it occurs on a rural two lane road."2
2J. Hedlund,
"The Severity of Large Truck Accidents,"
National Highway Traffic Safety
Administration, 1977.
46

Owing to the strict controls exercised on
the use of long combination vehicles, it is
difficult to accurately assess their relative safety
however, there is no evidence of decreased
safety with use of the longer combinations or
bigger trucks. Tractor-semis or any other
configuration of trucks (A-trains or B-trains)
would be less hazardous on the roads and also
less demanding on pavements compared to
single axles and tandems. Therefore, there
should not be any major concerns about the
safety aspect of such trucks.
SECTION VII
FUTURE ROLE OF TRUCKING
Since the early sixties, intra-provincial
movement of grain from farms and country
elevators to processors, feedmills, feed lots and
local grain and seed companies has been
dominated by commercial, custom and farm trucks,
especially hauls originating from farms. As
mentioned earlier, the role of trucks would
continue to increase for hauling products over
shorter as well as longer distances. Convenience of
service from production areas to consumption sites
or the consumer's door is a key factor in the growth
of the commercial trucking industry. Development
of fuel efficient equipment and new configurations
of B- and C-trains have increased the trucking
payload significantly, thus reducing the per unit
cost of hauling products.
The extent to which trucks are used for intra-
provincial hauling can be illustrated by the fact that
most canola and other grain processing facilities in
the province receive about 85 to 90 per cent of
their deliveries by trucks. The significance of truck
use is further enhanced when one considers that
more than half of the deliveries to processing
plants come from grain gathering stations located
on a rail line.
Rail is used for a small percentage of the
deliveries from primary elevators to processors
where the length of haul and size of equipment are
sufficient to make rail transport competitive with
other modes. Otherwise commercial truckers are
used exclusively.
Trucking is expected to play an important role
in the movement of grain and grain products on
the short hauls and to some extent on long hauls.
However, development of trucking in the
agriculture industry, specifically the grain sector,
will depend to a greater extent on consolidation of
branch lines, railway efficiencies, grain companies'
efficiencies, the role of Alberta terminals, and the
method of payment for the " Crow Benefit" . Some
of these factors are discussed in the following
subsections.
Branch Line Consolidation
The original prairie branch line was the only
real means of opening up the Prairies for full scale
agricultural development. Construction of branch
lines began in the late 1800's and the network
expanded rapidly until the 1930s.
In the 1950s, when the operation of branch lines
in the transportation of grain became unprofitable,
the railways took steps to counter losses. The one
obvious way of reducing losses on hauling grain
was to abandon a significant portion of the branch
line network. In the 1960s railways applied to the
47

Canadian Transportation Commission (CTC) for
permission to abandon some of the nonprofitable
branch lines. After several commissions and studies
on railways, the federal government allowed the
railways to request abandonment of uneconomical
branch lines and began compensating the railways
for losses on grain dependent lines. A significant
portion of the branch line network has been
protected from abandonment until the year 2000.
The retained branch lines have become eligible for
branch line subsidies under Section 258 of the
Railways Act.
The government decision has prevented
extensive abandonments, and the rehabilitation
program has ensured that quality of the branch line
network will be maintained or upgraded in order
to improve the grain transportation system. For
some branch lines, however, the volume of grain
traffic did not warrant maintaining service, and
these therefore, have been abandoned following
the rail company's request and government
hearings on the status of such lines.
The current status of railway branch line
abandonments in Alberta is given in Table 19.
Twenty per cent of the branch lines were
abandoned prior to 1977, 53 per cent were
abandoned between 1977 and 1981 upon
recommendations of the Hall Commission, and 27
per cent were recommended for retention.
These abandonments have removed
approximately 383 kilometres (238 miles) of
Alberta branch lines from service. Further
abandonments are not expected because most of
the remaining branch lines in Alberta are protected
to the year 2000 as part of the basic network. Two
branch lines (Acadia Valley and Furness) are in
question, and no decision will be made on these
lines until the federal study on branch lines is
completed.
To improve the overall grain transportation
system, the federal government has undertaken
several initiatives such as purchase of grain hopper
cars, double tracking, and the branch line
rehabilitation program, etc. The latter is discussed
in some detail in the following subsection outlining
the objectives and accomplishments so far.
In areas of the province where branch lines
have been taken out and primary elevators closed,
trucks have provided complementry service to the
railways in collecting grain.
The Prairie Branch Line Rehabilitation Program
The basic objective of the rehabilitation
program is to upgrade the grain-dependent branch
lines in the basic network to be capable of carrying
grain cars weighing a minimum of 99,000 kg
(220,000 lb.) gross weight. Some lines will be
upgraded to a maximum capacity of 118,350 kg
(263,0001b.).
Another objective of this program is to provide
new connections whereever possible. These links
will connect existing branch lines and allow the
abandonment of uneconomical lines.
In June 1977, the federal government, as an
interim measure, approved a two year, $100 million
program to restore the badly deteriorated prairie
branch line network. In March 1978, this
rehabilitation program was extended to the
remainder of the grain-dependent lines in the basic
network at an additional cost of $600 million over
48

TABLE 19
STATUS OF RAILWAY BRANCH LINE ABANDONMENTS
Subdivision Location Category* Mileage Acres
Acquired to Date by Provincial Crown:
CN Spondin Scapa-Spondin C 17.7 230.65
CN Haight Inland-Haight Jet. C 13.0 171.928
CN Kingman Kingman-Barlee Jet. C 10.3 141.31
TOTAL 41.0 543.888
Abandoned, to be Acquired from Federal Government:CN Kingman Tofield-Kingman B 13.0 186.95
CN Haight Inland-Vegreville B 8.8 102.81
CP Woolford Raley-Whiskey Gap B 21.0 375.05
CP Crossfield Cremona-Collicutt B 27.1 477.573
CPVegreville Willingdon-Vegreville B 24.6 351.40
CN Dodsland Loverna-Sedalia B 30.7 491.20
CN Dodsland Sedalia-Hemaruka B 19.8 300.16
CP Cassils Cassils-Scandia B 23.2 360.00
CPSuffield Hays-Suffield B 35.3 696.15
CP Rosemary East Couiee-Finnegan B 23.1 479.59
CN Sheerness Cessford -Wa rd 1ow B 7.4 153.37
CN Endiang Byemoor-Nevis B 40.9 590.93
CP Alberta Central Forth-Otway B 58.0 1046.21
CP Strathmore Namaka-Gleichen B 12.9 224.24
TOTAL 345.8 5835.633
Abandoned, to be Acquired Directly from the Railways:
CP Rosemary Gem Jct.-Finnegan C 29.8 481.78
CP Irricana Irricana-Standard C 35.3 636.29
CP Hoadley Truman-Breton c 34.0 503.99
CP Cardston Omokta-Glenwood B 12.7 204.516
CP Rosemary Rosemary-Gem Nil 11.8 273.626
CP Langdon Kneehill-Kirkpatrick Nil 3.9 67.79
CP Langdon Kirkpatrick-Carbon Nil 16.8 292.03
CP Strathmore Strathmore-Namaka B 7.8 135.59
CN Coronado Lindbergh-Heinsburg Nil 10.6 184.26
CN Coronado Elk Point-Lindbergh Nil 9.8 170.35
CN Endiang Byemoor-Hanna Nil 34.6 601.45
CP Furness Paradise Valley-Epping Nil 19.5 335.49
CP Strathmore Langdon-Strathmore Nil 19.1 245.10
CN Bodo Cactus Lake-Bodo Nil 12.0 208.60
TOTAL 257.7 4340.862
Appealed:
CN Stettler Morrin-Edberg - Aug. 31/84 Nil 88.1 1815.2
CN Acadia Valley Acadia Valley-Eyre-Nov. 30/83 Nil 23.7 411.98
CP Langdon East Coulee-Rosedale - Federal Court has ruled to be operated in perpetuity.
* 'C lines - abandoned prior to 1977.
'B' lines - Hall Commission recommended abandoned between 1977 and 1981.
'Nil' lines - not recommended for abandonment or retention by Hall Commission.
49

eight years. Thus, a total of $700 million, based on
1977 dollar cost estimates, was approved for this
program for the ten year period commencing in
1977-78.
In 1983, as part of its Western Transportation
Initiative, the government increased the total
funding for the program to $1,069.5 million.
Qualification for grain-dependent status and
eligibility for rehabilitation under this program are
based on line traffic averaged over five years. A
line qualifies for rehabilitation if 60 per cent or
more of the total tonnage origi nati ng or
terminating on the line, or final segment of it, is
comprised of grain.
Basic prairie network protected by order-in-
counci! from abandonment until the year 2000 and
status of the rehabilitation program areas follows:
Railway Efficiency Measures
Railways should be encouraged to introduce
efficiency measures and some new technology in
their operations which could lead to cost savings to
shippers. Railway cars which run around the
country to collect grain should be able to pickup
full loads at central places of the same grade of
grain for export positions. Collecting grain for
central loading stations can be complemented by
commercial, custom or farm trucks.
Some of the technological innovations and
efficiency measures which can result in
considerable cost savings are as follows:
I. Technological Innovations: Current third
generation locomotives have increased fuel
economy 7 per cent over previous models. This
amounts to roughly 2,100 gallons of fuel per
year per locomotive. With further engine
refinements, higher traction locomotives,
improved operating procedures, and better
maintenance, increases in fuel economy of 2
per cent per year are possible.
Railways should attempt to use six axle cars
to increase the payload. Tare weight
reductions of four or five tonnes and the high
utilization of freight cars can increase tonne-
kilometre productivity some 10 per cent in the
near future.
Traffic control systems are the key to
further improvements. These have the ability to
increase system capacity without resorting to
major capital investments. As the headway
between trains is shortened, the capacity of the
line is increased. Computers also take over
many of the clerical duties allowing dispatchers
to devote more time to higher order functions
of traffic control, thereby increasing safety and
efficiency.
Marshalling yards continue to be
increasingly automated through computer
applications which reduces freight terminal
time, increase yard capacity and reduce labour
intensive activities.
In the area of trackage innovations,
continuous welded rail and concrete ties are
claimed to last 50 years compared to 30 years
for wooden ones. As well, the concrete tie
reduces maintenance costs by 30 per cent.
Large track machines capable of lifting old
rail ties, performing all maintenance functions
50

BASIC PRAIRIE NETWORK AND STATUS OF THE REHABILITATION PROGRAM*
Basic
Network
CANADA 25,912 km(16,065 miles)
ALBERTA 8,545 km(5,298 miles)
* All figures are approximate.
Total
eligible for
Rehabilitation
9,515 km(5,900 miles)
1,920 km(1,190 miles)
Rehabilitation
Completed
3,932 km(2,438 miles)
947 km(587 miles)
Rehabilitation
Scheduled for
work 1984-89
5,583 km(3,462 miles)
972 km(603 miles)
and relaying new rail and concrete ties in one
operation are proving effective. Estimates of
rail replacement savings run as high as $3
million per year.
2. Long Term Outlook: The external factors which
influence technological development in the rail
industry include energy, capital, labour,
demand, government policy regulation and
safety. Energy is the most significant factor. It
will most likely determine the policy on
electrification, the future of alternate fuel
development and encourage research in fuel-
efficient technologies. Capital is the second
most important factor. In the capital intensive
rail industry, new technologies have been
proven effective will not be implemented if the
capital is not available.
In general, the rail companies have a lot of
new technology available to them which would
increase efficiency and productivity and
decrease costs. However, because of capital
and regulatory barriers, the implementation of
new technology will be a slow process.
Despite this limitation, the transportation of
freight, including grain, over long distances
(over 500 kilometres) by rail should continue to
be significantly cheaper than other modes in
the foreseeable future.
3. Co-operation With Grain Companies: Many rail
efficiency measures require associated changes
by grain companies. For example, to decrease
grain car turnaround time, things like high
throughput elevators and consistent flow of
grain are required. This change will require the
close cooperation between the parties involved
in the grain handling and transportation
industry.
One of the most beneficial changes to rail
operations would be the implementation of
unit trains. This would require changes in both
grain collection methods and elevator facilities
and in policy.
51

Expanded use of unit trains would also
require adjustments at the port terminals.
When the market demand begins to exceed the
port terminals' capacity, producers and grain
companies will apply pressure for unit trains
hauling blocks of cars carrying the same grade
of grain directly to ships.
Unit trains offer significant efficiency gains
and allow producers and grain companies to
respond to market demand.
a) Cabooseless Trains: "End of Train Units" ETU's-
these eliminate one man, and possibly two, of a
typical four man unit (leaving the engineer and
conductor) which results in a decrease in labour
costs.
b) Increasing Car Payload: Higher car loading may
still be possible because of improved cars (lower
tare weights) and the increased capacity of rail,
etc. Higher tonnage trains may be possible as a
result of railway grade reductions, high
technology traction devices and mid train
remote locomotives.
c) Speed of Train: Branch line rehabilitation is
continuing and will allow speeds up to 50 km/h
on branch lines that previously limited speeds
to 15 km/h. This will result in decreased
turnaround time.
d) Elimination of Waiting Time: Double tracking
projects are underway which will eliminate
waiting time especially through mountain
passes. This will result in decreased turnaround
times.
e) Compatible Working Hours: Making working
hours of the railways and grain companies
compatible will improve the grain handling and
transportation system.
Grain Handling Efficiency Measures
If grain companies can introduce some
efficiency measures in handling grain, considerable
savings can be realized in costs. Some of the grain
handling efficiency measures are:
I. High Throughput Elevators: A typical primary
elevator in Alberta has a capacity of about
3,000 tonnes and usually operates at 2.5 to 3.5
turns per year, giving it an annual throughput
of 7,500 to 12,000 tonnes.
The concept of high throughput elevators
was developed as a potential solution to some
of the inefficiencies inherent in the present
elevator system such as: high fixed costs, slow
grain car turn around, long storage time, slow
loading and unloading, etc. It involves the
consolidation of primary elevators in an area
and the development of a single high
throughput elevator for the area by modifying
existing facilities. Throughput can also be
increased simply by introducing operational
changes, such as longer hours of operation.
Other changes which may also be necessary
to convert an existing facility into a high
throughput elevator are:
extend the length of sidings to carry longer
strings of rail cars for loading
heavier track and/or upgrade roadbed for
sidings. At many of the present facilities,
cars cannot be loaded to 100 per cent
52
capacity; 70 per cent loading of cars is quite
common
improvements to unloading facilities to
allow handling any size of truck.
Upgrading terminal access roads to ensure
adequate flow and capacity for the increase
in truck volume
provisions for on-site grain cleaning can
offer further savings to producers and
therefore may be a consideration in the
development of high throughput elevators,
and
installation of modern computer
management systems may be considered in
order to achieve maximum cost efficiency.
Although some of the above changes may be
required and/or desirable in the development of a
particular high throughput elevator, in most cases,
the capital investment required would be relatively
small.
These changes should allow loading of 10-12
grain cars per day from one high throughput
elevator compared to the 2 to 3 cars per day seen in
a typical primary elevator's operation.
2. Projected Development: There are many
factors which will affect the rate of
consolidation of primary elevators and the
subsequent development of high throughput
elevators, thus it is difficult to make definite
growth estimates. However, if we assume that
the present market, and political and economic
factors remain constant, some guesses can be
made:
development will continue to be slow over
the short time (the next five years) in the
order of 3 to 4 high throughput elevators
developed per year per prairie province.
development will likely speed up in the
1990s, and there may be 80 to 100 high
throughput points across the prairies by the
year 2000.
3. Off-Track Loading: Two basic types of off-track
loading of grain have been proposed, each
having several possible operational variations.
The concept of each of the system is outlined
below.
a) Container System: This system makes use of the
C/TOFC (container/ trailer-on-flat car) designed
in a modified form. Containers are dropped off
at the farm where farmers fill them as they
harvest. The containers are then picked up with
a crane by tractor-flatbed units and hauled to a
nearby nonelevator rail point. After the weight
and grade are recorded, the containers would
be emptied and immediately redistributed to
farmers.
Loaded grain cars are sent to a central
terminal/switching facility where they are
routed to their proper destination. It is unlikely
that the terminal would contain cleaning
facilities as the elevation and cleaning of the
grain at this point would compromise the time
and handling efficiencies which the system
offers. The entire process involves just one
elevation of the grain at the port terminal.
b) Off-Track System : This is a true off-track system
in that the initial destination of the grain is a
53

facility which is not associated with a rail
branch line.
Grain is hauled by farm trucks to a relatively
small facility, like a buffalo elevator, with
minimal storage capacity. The grain is
unloaded from the small trucks into the
elevator which may or may not have cleaning
facilities. From the elevator the grain is loaded
into large trucks in A, B or C trailer
configurations and these trucks would haul to a
central terminal where the grain is loaded into
hopper cars.
Alberta Terminals
Three inland terminals at Edmonton, Calgary
and Lethbridge were purchased by Alberta
Terminals Limited in the fall of 1979. Alberta
Terminals Limited is owned by the Alberta
government. The main purposes of purchasing
these three inland terminals were:
to ensure that farmers and grain companies
have ready access to the terminals and thereby
play a vital role in the enhancement of
producers' income; and
to increase the volume of grain going through
the terminals to assist in meeting the urgent
requirement of increasing Canada's grain
exports.
The government has upgraded the three
facilities to meet environmental concerns and
efforts are being made to utilize these facilities to
their maximum potential. At present, grain is
being brought in by commercial, custom and farm
trucks, and by rail, for cleaning and grading for
further shipment to export positions. It is
anticipated that with the introduction of variable
rates, throughput would increase by 3 to 4 turns
per year at these terminals.
Capacity and utilization of the three terminals
are as follows 1
:
Edmonton:
The Edmonton terminal has a capacity of about
67,000 tonnes (2.5 million bushels). During the last
year 90 per cent of grain received at the terminal
was canola which was cleaned for export shipment.
Balance of the receipts were feed wheat, barley
and wheat for export. About 90 per cent of the
deliveries to the terminal were by commercial,
custom and farm trucks, but mostly by commercial
trucks (9:1 in favour of commercial trucks. Hauling
out of the terminal was about 10 per cent by truck
and 90 per cent by rail. Approximate average load
per commercial truck (semi) was 24 tonnes (960
bushels) and about 9 tonnes (360 bushels) per farm
truck.
Calgary:
The Calgary terminal has a capacity of 61,000
tonnes (2.25 million bushel). Receipts of grain at
this terminal included canola and coarse grains, of
which 50 per cent was rapeseed for cleaning and
export shipment. In 1983-84, considerable space at
this terminal was being used for storing barley for
Canada Malting Co. Limited. Most of the deliveries
were by commercial trucks followed by rail.
’Effective August 1, 1984, the three terminals have
been licensed as primary elevators by the Canadian
Grain Commission.
54

Lethbridge:
Lethbridge terminal has a capacity of about
34,000 tonnes (1.25 million bushels). Grain receipts
here included more coarse grains and less canola.
Wheat, oats, barley and mustard were cleaned for
export. It received both board and non-board
grains. Part of the facility is used for storing grain
for other companies. This terminal is expected to
show the highest throughput compared to the
other two when variable rates are implemented.
About 70-85 per cent of the deliveries to this
terminal are by farm trucks and the balance are by
commercial trucks.
There is no allocation of cars to these terminal
elevators other than the ones allocated to grain
companies/purchasers or users of grain. The
elevators are being used as facilitators for the
efficient movement of grain to export positions
and to domestic users.
Because of the poor crop year (1984-85), there
has been a considerable drop in throughput at all
three terminals. Table 20 shows the monthly truck
deliveries to these terminals from March 1981 to
December 1983.
Long Term Plans: The long term plans for Alberta
Terminals Limited are to continue to operate as
handlers of grain and not purchasers of grain. The
main thrust in the future would be to join with
grain companies and ship grain in unit trains. The
facilities would continue cleaning and grading
grain for shippers who would be encouraged to use
multiple cars and unit trains.
Once the variable rates are implemented, the
operation of the terminals could be on 24 hour
basis to allow the shippers to take advantage of
lower rates. The variable rates would make grain
transportation more efficient.
Terminal elevators would also continue making
space available to grain companies, export grain
companies, domestic feed users, specialty crop and
other grain producers. With these facilities at
central locations, more and more trucks would be
used to haul grain from the farm and primary
elevators for cleaning and grading purposes. Table
21 presents the annual throughput at Alberta
Terminals Ltd. from 1974-75 to 1984-85.
Inland terminals can be used to clean, dry,
grade and sample grain before shipping ittothe
coast for export. Retained screenings can be sold to
ranchers/livestock producers in the province. In
some situations, grain can be hauled directly to
these terminals from farm storages. At high
throughput elevators, efficiencies can be achieved
through increasing output which can result in
significant cost savings. Savings made at these
elevators can be passed on to the grain producers
to pay for additional trucking to reduce his/her
trucking costs.
As the box and hopper car fleet is depleted, and
the federal government has indicated that no more
funds will be allocated for buying new cars, the
available stock would require more optimal use
and faster turn around time to haul grain. It can
only be accomplished by using more centralized
grain handling facilities across the province and
trucks would play an important role in bringing
grain to these facilities.
55

Month
Edmonton
Calgary
Lethbridge
Edmonton
Calgary
Lethbridge
Edmonton
Calgary
Lethbridge
Number
of
Trucks
< <
no VO VO ov o vo VO VO cn 't no o 00VO VO VO cn no 't *t VO
i".
vo*t
rsi
nolt>
CMnonocm
ns m84
no o o no 't no (T» 00<NI cry v— no vo oo no 't vo cm VO*— *— *
—
T 't in no T— rsi
rsi
o CM no m 't o rv cm rsi no nsi ,
(N no uo «— no in i-". 't 00 no 00 <jyno rsi cm vo
(Tv no vo (Tv CTi VO <Tv «— r— r*. T— T— rsivo »— *t O rsi VO in VO t— rsi no vo
no rsi no ,— no no no no rsi <T>
(N *-VO (Tv
CM fM
>s-Q
00 oLO LT»
CM
lo^ 't 00CM (N
o rsi <—VO !*•> in U0CM »— »— VO
o 00 uo ,
—
in oo rsi no 00(N vo o o VO VO o no inno 't vo VO in cm 't
't
03c
Ev-
<U
M03
«/>+->
Q.
0/yj0#
<u-C
no o no r^ no «— vO o oo 00vo *
—
00 no no (TV rsi vo '(f rsinsi ' in r". * rsi no o (N (N
't
>»
3 -c
jQa;
03 Q.<
k.
(U-O v.
s_Ofn
k-
(UXI
0)c
tsocrv
E(U+•»
n
(U-Oo+-<
Eo»>
Ea>v-»
_i
—
»
D< <v
vn
v->
Oo2
a;
Q Oi-
ca>U<ua.o<r>
a> >_Q <y03 +-— 03
5 .i
2 S
g ac Q.II
™I
5Z 3
-
10
per
cent
of
the
trucks
are
hauling
out;
-
of
the
90
per
cent
deliveries
-
10
per
cent
are
farm
trucks
and
90
per
cent
are
tractor-trailer
unit
with
an
exception
at
Lethbridge
where
farm
truck
deliveries
are
about
70
per
cent.

ANNUAL
THROUGHPUT
AT
ALBERTA
TERMINALS
LTD.*
(TONNES)
<2 3
3O
VO 00 in in 00 o in <3- 00 r— ono o 00 '3' CO " r> I
s*. CM oIN cn o> in in co 'tf in o
o' r— rs" in' no' in' o'o in ON <3- in o in rsi co in<n no rsi <N *— »— T—
<2 $o
<- 00 00
<0CT>o
00 co r- 00 cn 00 o no IN o oin rsi in cn no o in o oo *— in fN no fN no 00 IN oo' rs' no' o' o' r*.' rs' no' oo' o'
<3- no *3- rsi co in no fN <3° o o
2 S
(N o o o o fN <J» no T— IN ocn T— cn fN in fN <Ti IN <3- IN oGO fN IN in 00 fN in fN fN ©o' IN no' no' oo' in' nsT o' rsT o' o'<n no 00 o *3- fN fN o <3- in o
fO
_o»
<0u
o fN 00 ro no o o 00 o <3- OfN fN O o fN O <3- no no o ofN no r— cn 00 no <n fN IN rs c>no' oo' o' in' rsT no' IN oo' o'o <T> o in no 00 <n o no *3- in
ca;
Eaxun
fN in o IN 00 cn o r— fN no inLU fN IN IN IN IN 00 op op op op op—1 in O IN 00 <T> o rL fN no *3"
00 IN IN IN IN IN rs 00 00 00 00 00< cn <n <T> cn cn cn cn cn cn <n <n1- *— s— *— *- *— <
—
*— «—
3Q.Xa\3O
inLO

It is widely claimed that greater utilization of
trucks to complement rail results in much greater
efficiency in the entire grain collection and
transportation system in such areas as:2
faster turn around time of rail equipment,
savings in expenditures in upgrading branch
lines,
flexibility of trucks in moving the kind of grain
required from country elevators to mainline
elevators or terminals to meet peak service
demands at export terminals
a more efficient grain collection system moves
more grain, thereby lowering the farm
inventory and improving the producer's cash-
flow position
greater use of trucks would create more jobs in
farming communities
truckers provide the essential flexibility in the
collection system to move the right kind of
grains to railhead in order to meet particular
service requirements for export customers.
Terminal facilities can be used to develop unit
train operations as was done during the 1973-74
crop year. The unit train concept allows railways to
reduce costs by alleviating extra car handling and
by encouraging long-haul traffic. The unit trains
offer cost reductions through reduced switching
expenses, faster turn around time and lower
administrative expenses. Moreover, railroad
efficiency is increased on long haul and nonstop
traffic. Also, unit trains or multiple car shipments
allow for better planning and increased car use.
Commercial/custom trucks can serve as feeder to
railways.
Grain companies using unit trains can afford to
offer higher prices to farmers, which would force
surrounding or nearby companies to become more
efficient to remain price competitive.
Large volume shipments would prevent
temporary blockage of elevator facilities so that
farmers would not need to hold their grain or take
it to less favorable markets which could reduce
their returns. Moreover, railways will be able to
predict more accurately the traffic volume, more
efficiently allocate equipment and improve train
turnaround time.
More in-depth study would be required to
develop the unit train concept and how it can be
coordinated with the hauling of grain by truck. At
present there is more truck-haul capacity available
than demand and it will be around for many more
years. The Canadian Wheat Board model and
several exercises undertaken in the United States
could serve as benchmarker for evaluating, refining
and implementing unit train operations.
Changes in the Statutory Rates and the
Commercial Trucking Industry
According to trucking industry representatives,
the Western Grain Transportation Act enacted on
January 1, 1984 did not have a positive impact on
2 Submission on Behalf of the For-Hire Trucking
Industry Concerning Bill C-155, to the
Parliamentary Standing Committee on
Transport, May 1983.
58

their industry. Two specific decisions, affecting the
trucking industry are:
1. the addition of specialty crops, such as lentils,
peas, sunflowers, canary seed, and alfalfa
products, etc. to the I ist of crops that move by
rail at the statutory rates, and
2. the decision to pay the Crow Benefit to the
railways.
The addition of specialty crops to the statutory
rates list has had very little effect on Alberta
truckers because of the low volume of production
of such crops. Truckers believe that if the Crow
Benefit were paid to producers, it would have
given them a choice of mode which would have led
to an efficient grain transportation system. They
pointed out the grain companies' concerns that if
the Crow Benefit were paid to producers, certain
elevator points would be by-passed, which would
not improve the grain handling and transportation
system. Rationalization of the elevator system and
rail branch lines istaking place and will continue
but maybe at a slower pace than before.
Truckers strongly feel that payment to
producers would lead to increased economic
activity in rural communities because increased
trucking would tend to create some new
employment (administration, operation and
maintenance) in these communities. At present the
existing trucking capacity is under-utilized thus
having negative economic impact on the rural
communities.
During the last few years commercial trucking
of grain within the province (intra-provincial) has
declined somewhat compared to the seventies.
Last year (1984) was one of the worst years for
commercial truckers because of a drop in crop
production because of drought. The decrease in
grain traffic for commercial truckers can be
associated with grain producers buying larger
trucks and custom truckers coming on the scene.
Another reason for the drop, may be that because
of the lower rates offered by the railways,
commercial trucking was not used for longer hauls
of feed grains.
The trucking industry did not escape the effects
of the downturn in the economy. The industry has
not grown during the last few years, a lot of
equipment has been sold off and the remaining
trucks and trailers now need replacement.
Commercial truckers hauling grain and grain
products are still charging 1982-83 rates because of
the fear of losing business if rates are increased.
Profit margins for truckers have shrunk.
Most of the truckers in the grain hauling
business feel that their role would increase if the
grain handling and transportation system were
allowed to be rationalized. Despite the fact that
the pace of rationalization has slowed down
because of the guaranteed rail network and branch
line rehabilitation programs, etc., some elevators
and branch lines will still go out of service and
truckers see an increased participation in the grain
handling system. As rail freight rates and hauling
distances increase, producers will have to evaluate
alternative to lower grain hauling costs. One
posible alternative to partly offset these costs is the
use of commercial custom truckers, partly be
achieved by using commercial/custom truckers.
59

Since 1978, rail rates for hauling feed grains to
British Columbia have been relatively lower than
truck rates. As a result of these lower rates,
considerable portion of grain hauling business has
shifted to the railways (see Section V for details).
Therefore, grain hauling for truckers which was
considered front-haul (primary-haul) in the
seventies is now regarded as back-haul (secondary-
haul). The railways offer two types of rates for
hauling feed grains to British Columbia which make
it impossible for truckers to compete. One is a
commodity rate which truckers can match and the
other is a contract rate which is lower than the
commodity rate and guarantees the railways 80 per
cent of grain/feed grain merchant's business.
A few truckers have reported that during the
last 6-7 years they have seen their grain business
drop from 70-80 per cent to 25 per cent. The lower
rates offered by the railways for B.C. traffic have
forced them to switch to other products and haul
grain as back-haul at a considerably reduced rate.
One trucker who has been in the grain buying and
trucking business for the last 20 years indicated
that if the Feed Freight Assistance program were
not there, he would not be in a position to haul
grain grain to B.C. feed grain deficient areas.
Another trucker pointed out that it does not
matter what the rates are, it is the service provided
by truckers which determines the business.
Performance, flexibility and door-to-door service
are the important factors which have guaranteed
truckers a certain portion of the extra-provincial
grain traffic.
Truckers point out that it costs much more to
rehabilitate a branch line than to maintain
secondary roads in spite of increased grain trucking
activity. Larger trucks with proper differentials and
weight distribution are likely to cause less damage
than single axle and semi units owned by grain
producers. A general consensus in the trucking
industry is that there is currently a wide scale
underutilization of the existing equipment
available for commercial grain trucking, not only in
Alberta but in the other prairie provinces as well.
SECTION VIII
SUMMARY
Trucking is an integral part of the grain
handling and transportation system. The
responsibility of transporting grain from the farm
to shipping points i.e. primary elevators and other
market outlets has rested with the grain producers.
Since the beginning of the rationalization of the
country elevator system and the abandonment of
rail branch lines, trucks have played an important
role in hauling grain from farm storage to primary
delivery points and other market outlets (feed
mills, feedlots, seed plants, etc.)
This study was undertaken to document
present trucking activity (commercial and farm) for
the transportation of grain and grain products in
Alberta and to British Columbia - one of the major
domestic markets for Alberta feed grains. Other
objectives of the study were to determine the
future role of trucking for hauling grain and grain
products and to measure the effects of the reforms
in the statutory rates on the trucking of grain.
During the last two decades trucking grain has
increased considerably in Alberta. Changes to
regulations on the length of vehicles and increases
60

in payload have helped the trucking industry to
become more efficient and competitive.
Average truck hauls from farm to primary
elevators and other market outlets have increased
from II kilometres (7 miles) in 1967-68 to 18
kilometres (II. I miles) in 1974-75. Lately it has been
estimated that producers' grain hauling distances
in some parts of the province range from 24 to 48
kilometres (15 to 30 miles).
Increases in grain hauling (truck) distances are
due to the closure of country elevators and the
abandonment of uneconomical rail branch lines.
Since 1965-66, elevators and delivery points
have decreased by 44 and 37 per cent, respectively.
Although overall capacity of the remaining
elevators has declined by about 23 per cent during
the last two decades, throughput at the existing
facilities has more than doubled. Higher
throughput would makes these facilities more
economical and cost effective.
During the 1983-84 crop year, over 10 million
tonnes of grain were delivered to primary elevators
in Alberta by farm and commercial trucks. It is not
possible to determine the volume of grain
delivered by farm versus commercial trucks.
Farm Trucking Industry
Since 1976-77, a trend towards buying large
farm trucks has emerged. In 1980-81, the number of
heavier farm trucks, i.e., over 14,000 kg (30,860 lb.)
GVW was 4.5 per cent which increased to 5.4 per
cent during 1983-84. This change indicates that
larger trucks are being used for hauling grain to
market outlets. The most common farm trucks
used for hauling grain are two and three axle
trucks, the latter are also known as tandems. A few
grain producers have purchased semis for their own
use and for custom hauling.
The number of farm trucks in Alberta had been
steadily increasing, but for the first time in 1983-84,
it showed a decline of 3.4 per cent. According to
1983-84 farm vehicle registrations, there were
161,875 farm trucks in Alberta or an average of 2.8
trucks per farm.
Regulations Governing Commercial Grain Trucking
and Size of the Industry
In western Canada, Alberta could be described
as a "non-regulator" with respect to intra-
provincial trucking. The province has no
regulations with respect to service, conditions of
carriage, rates, etc. for intra-provincial hauling of
grain by commercial carriers.
For extra-provincial hauling, the regulatory
environment in Alberta for commercial trucking is
somewhat similar to that of other provinces, i.e.
there is entry control. An extra-provincial motor
carrier must apply to the Motor Transport Board for
authorization. Restrictions (routes, commodities,
areas, shippers, etc.) may be placed on this
authorization and a nonresident operator may be
issued a permit.
The present regulations are no impediment to
the growth of the trucking industry, although
complaints have been heard about entry and other
related procedures. Anticipated changes in
regulations in the trucking industry also known as
"deregulation" of the industry would eliminate
some of the concerns and, it is hoped, the industry
would face uniform regulations across Canada
61

A commercial grain trucking fleet for intra and
extra-provincial movement of grain peaked in the
seventies with about 600-700 grain trailers in
Alberta. In the mid-seventies trucks hauled more
grain to feed deficient areas of British Columbia
than rail. However, the trend reversed when the
railways decided to implement truck competitive
tariffs. The downturn in the economy and the drop
in grain traffic forced many carriers to change their
operations or to sell the equipment. At present, it
is estimated that there are about 200-250 grain
trailers operating in Alberta for the delivery of
grain and grain products intra- and extra-
provincially.
Farm and Commercial Truck Costs/Rates
Average farm truck costs estimated for the
1983-84 crop year were $5.12 per tonne (12.8 cents
per bushel). These costs were for transporti ng
grain from farm to primary elevators for a distance
of 18 kilometres (II. I miles). With the increase in
distance, farm truck costs increased considerably in
comparison to commercial truck grain hauling
rates. For a distance of 48 kilometres (30 miles) or
less, farm truck costs amount to $9.20 per tonne (23
cents per bushel) whereas commercial truck rates
are $7.92 per tonne (19.8 cents per bushel) for farm
pick up. These costs indicate that as distance
increases commercial trucks become more
economical for transporting grain from the farm.
Moreover, commerial trucks can deliver three times
more grain per trip than an average farm truck.
Trucking Activity for Transporting Grain to British
Columbia
Commercial trucking activity for transporting
grain and grain products from Alberta to B.C. was
not a factor until the early seventies. The
development of heavier, fuel efficient trucks, and
changes in maximum weight limitations prompted
the trucking industry to offer a rail competitive
service. During the first four years (1973-74 to 1976-
77), the share of truck traffic for feed grain
shipments to British Columbia quadrupled.
Railways realizing the erosion of service introduced
truck competitive rates on March 1, 1978. These
rates reversed the feed grain traffic trend in 1978-79
in favour of the railways. Since then the share of
truck traffic has remained around 30 per cent of
the feed grains shipped under the Feed Freight
Assistance Program.
Commercial carriers pointed out that truck
competitive rail rates and contract rates have
forced them to haul grain as back-haul. For a few
carriers, feed grains used to be front-haul traffic,
but not any more, because of rate competition, it
has become secondary traffic to these carriers.
Rail and Truck Rates for Feed Grains to British
Columbia
Railways had a monopoly over the
transportation of feed grains and grain products to
the feed deficient areas of British Columbia. In the
early seventies, commercial truckers offered their
services to feed grain receivers in B.C., and within
62

few years were able to capture a significant share
of the market away from the railways, i.e., from 6
per cent in 1971-72 to 56.1 per cent in 1976-77.
On March 1, 1978, the railways reduced their
rates from $18.74 to $16.31 per tonne. In the next
few years the railways recovered part of the traffic
lost to truckers. The competitive truck rate in 1978
was $18.74 per tonne. Figure 6 shows fluctuations
in rail rates and the trend of commercial truck
rates. Truckers could not afford to match rail rates,
therefore lost part of the feed grains traffic to the
railways. Presently trucks are moving about 30 per
cent of the feed grains shipped under the Feed
Freight Assistance Program to British Columbia.
Some commercial carriers pointed out that
grain traffic to B.C., which was front haul a few
years ago, is now considered secondary and moves
at the back-haul rate. Carriers have indicated that
most of the time the back-haul rate does not even
cover operating costs of the unit. Railways have
also established contract rates which have further
hurt the trucking industry. Under these rates, the
railways are guaranteed 80 per cent of the
grain/feed grain merchant's business. One carrier
pointed out that if the Feed Freight Assistance
Program were not in place, commercial carriers
could not move feed grains to British Columbia.
Grain Trucking Industry and the Statutory Rates
Reforms in the statutory rates under the
Western Grain Transportation Act did not have a
positive impact on the grain trucking industry for
two main reasons: I) adding speciality crops to the
statutory rates lists and 2) paying the Crow benefit
to the railways.
Commercial carriers were hoping that changes
in the statutory rates would offer producers the
choice of mode for transporting grain. They feel
that the existing legislation has failed to do so. If
the Crow benefit were paid to producers it would
generate some economic activity in rural and urban
communities. Representatives of the carriers'
association have pointed out that the railways have
been given what they had asked for while their
industry has been over looked.
If no changes are made in the WGTA as to
payment of the Crow benefit, the grain trucking
fleet will be further reduced, leaving grain
producers captive to the railways. Most carriers
strongly feel that with their participation grain
handling and transportation could become
efficient. Moreover, as rates increase in the future
and grain handling facilities are consolidated,
truckers can offer some savings to grain producers
for hauling grain longer distances.
Differential rate zones, i.e. the rail rate on
grain, if significant will attract farmers from a long
distance away. Premium offers can be made at
high throughput elevators which would provide an
incentive to farmers to deliver grain to that facility.
Commercial/custom truckers can offer savings for
additional haul of up to 16 kilometres (10 miles) at
no extra charge.
63

FIGURE 6
RAIL AND TRUCK TRANSPORTATION RATES
FEED GRAIN RAIL TRANSPORTATION RATES - 1967 TO 1985
PEACE RIVER TO KAMLOOPS TO KAMLOOPSPEACE RIVER TO VANCOUVER CALGARY TO VANCOUVER
COMMERCIAL TRUCK TRANSPORTATION RATESGRAINS IN BULK OR SACKS - 1971 TO 1982
CALGARY TO KAMLOOPS TO KAMLOOPSTO VANCOUVER EDMONTON TO VANCOUVER
64

BIBLIOGRAPHY
1. Alberta Motor Transport Act.
2. Birch, Alfred and Chaudhary, G. Nabi, Energy Use For Farm Trucking in Alberta
,
Economic Services
Division, Alberta Agriculture, Agdex 826-1, June 1983.
3. Canadian Grain Commission Grain Elevators in Canada,Winnipeg, Manitoba, crop year 1966-67 to
1983-84.
4. Canadian International Grains Institute, Grains and Oilseeds, Handling, Marketing and Processing
,
Winnipeg, Manitoba, May 1975.
5. Chaudhary, G. Nabi, The Cost of Transporting Grain by Farm Truck in Alberta, Economic Services
Division, Agdex 110/820, August 1977.
6. Clayton, A., Nix, F., and Sparks, G., Aspects of Commercial Trucking of Grain in the Prairie Region: Fall
1982 ,Research Branch, Canadian Transport Commission, May 1983.
7. Hedlund,J. The Severity of Large Truck Accidents , National Highway Traffic Safety Administration,
1977.
8.,Canadian Livestock Feed Board, Annual Report, crop year, 1977-78.
9. Report of the Select Committee of the Legislative Assembly, Reviewing Intra-Provincial Trucking
Regulations,Alberta Government, March 1977.
10. ,Ontario Commission on Truck Safety, Car-Truck Size Disparity
,
a study of the
Nature and Safety Implications of Trends in Automobile and Truck Weights and Dimensions, by
DELCAN, June 1982.
11. The Grain Transportation Task Force, Transportation of Feed Grains to British Columbia, Livestock Feed
Board of Canada, January 1984.
65

APPENDIX
TABLE A
DISTRIBUTION OF FARM TRUCKS BY GROSS VEHICLE WEIGHT AND AGE OF TRUCKS, 1981-82
Age of Trucks
Gross Vehicle
Weight (kg)
up to
1960 1961-65 1966-70 1971-75 1976-80
Number of Trucks
1981 &over Total
up to 2,000 148 153 419 1185 1653 763 4321
2,001-3,000 704 1758 6126 10851 13008 2292 34739
3,001-4,000 677 771 2754 6656 15400 4597 30855
4,001-5,000 554 538 1835 6738 15788 2707 28160
5,001-6,000 304 229 405 1304 8838 3303 14383
6,001-7,000 505 1047 1328 664 1611 859 6014
7,001-8,000 646 529 851 1591 2197 534 6348
8,001-9,000 483 285 342 344 298 39 1791
9,001-10,000 708 454 509 259 58 9 1997
10,001-12,000 1709 1637 1996 1451 672 91 7556
12,001-14,000 1358 2354 4159 5707 5383 782 19743
over 14,000 206 484 1271 2362 2256 666 7245
TOTAL 8002 10239 21995 39112 67162 16642 163152
% of Total 4.9 6.3 13.5 24.0 41.2 10.2 100.0
Source: Solicitor General Department, Motor Vehicle Branch, Vehicle Registration Statistics.
66

TABLE B
DISTRIBUTION OF FARM TRUCKS BY GROSS VEHICLE WEIGHT AND AGE OF TRUCKS, 1982-83
Age of Trucks
Gross Vehicle
Weight (kg)
up to
1960 1961-65 1966-70 1971-75 1976-80
Number of Trucks
1981 &over Total
up to 2,000 - -1 1 4 12 18
2,001-3,000 688 1572 5642 10607 14352 4900 37761
3,001-4,000 570 642 2479 6013 14635 6691 31030
4,001-5,000 493 496 1719 6501 15846 3947 29002
5,001-6,000 295 215 440 1278 8454 5134 15816
6,001-7,000 452 960 1241 620 1495 1273 6041
7,001-8,000 574 516 875 1661 2383 756 6765
8,001-9,000 471 290 348 379 313 58 1859
9,001-10,000 584 397 451 237 64 17 1750
10,001-12,000 1604 1519 1884 1460 752 138 7357
12,001-14,000 1372 2378 4352 6013 5840 1100 21055
over 14,000 215 490 1405 2805 2979 1160 9054
TOTAL 7318 9475 20837 37575 67117 25186 167508
% of Total 4.4 5.7 12.4 22.4 40.1 15.0 100.0
Source: Solicitor General Department, Motor Vehicle Branch, Vehicle Registration Statistics.
67

TABLE C
DISTRIBUTION OF FARM TRUCKS BY GROSS VEHICLE WEIGHT AND AGE OF TRUCKS, 1983-84
Age of Trucks
Gross Vehicle
Weight (kg)
up to
1960 1961-65 1966-70 1971-75 1976-80
Number of Trucks
1981 &over Total
up to 2,000 - - 2 3 4 1 10
2,001-3,000 549 1319 4882 9524 14023 6204 36501
3,001-4,000 435 513 1989 5014 13160 7737 28848
4,001-5,000 389 437 1457 5744 14740 4617 27385
5,001-6,000 225 176 368 1094 7391 5484 14738
6,001-7,000 384 858 1186 671 1877 2500 7476
7,001-8,000 508 493 891 1664 2473 1057 7086
8,001-9,000 414 259 336 375 321 83 1788
9,001-10,000 502 363 427 223 76 20 1611
10,001-12,000 1388 1396 1786 1421 752 170 6913
12,001-14,000 1246 2225 4249 5986 5892 1215 20813
over 14,000 167 456 1310 2773 2918 1082 8706
TOTAL 6207 8495 18883 34492 63627 30171 161875
% of Total 3.8 5.2 11.7 21.3 39.3 18.6 100.0
Source: Solicitor General Department, Motor Vehicle Branch, Vehicle Registration Statistics.
68

TABLE D
DISTRIBUTION OF FARM TRUCKS BY FUEL TYPE AND AGE OF TRUCKS, 1981-82
FUEL TYPE
Natural Not
Age Gasoline Diesel Propane Multifuel Gas Reported Total
Number of Farm Trucks
up to 1960 3300 21 - - - 4681 8002
1961-65 3810 52 - - - 6377 10239
1966-70 8600 141 2 - - 13252 21995
1971-75 15364 347 6 - - 23395 39112
1976-80 26833 786 10 -1 39532 67162
1981 & over 7129 917 3 - - 8593 16642
TOTAL 65036 2264 21 -1 95830 163152
% of Total 39.9 1.4 0.0 _ 0.0 58.5 100.0
Source: Motor Vehicle Branch, Solicitor General Department.
69

TABLE E
DISTRIBUTION OF FARM TRUCKS BY FUEL TYPE AND AGE OF TRUCKS, 1982-83
FUEL TYPE
Age Gasoline Diesel
Natural
Propane Multifuel Gas
Not
Reported Total
up to 1960 7296 18 2 - - 2 7318
1961-65 9440 34 1 - - - 9475
1966-70 20434 394 4 1- 4 20837
1971-75 36712 835 21 2 2 3 37575
1976-80 65239 1790 71 10 - 7 67117
1981 & over 22174 2965 38 3 1 5 25186
TOTAL 161295 6036 137 16 3 21 167508
% of Total 96.3 3.6 0.1 0.0 0.0 0.0 100.0
Source: Motor Vehicle Branch, Solicitor General Department.

TABLE F
DISTRIBUTION OF FARM TRUCKS BY FUEL TYPE AND AGE OF TRUCKS, 1983-84
FUEL TYPE
Age Gasoline Diesel
Natural
Propane Multifuel Gas
Not
Reported
up to 1960 6172 31 2 - - 2 6207
1961-65 8412 71 1- - 11 8495
1966-70 18496 359 9 1- 18 18883
1971-75 33528 915 33 2 - 14 34492
1976-80 61622 1806 155 13 - 31 63627
1981 & over 26357 3709 77 8 1 19 30171
TOTAL 154587 6891 277 24 1 95 161875
% of Total 95.5 4.3 0.2 0.0 0.0 0.0 100.0
Source: Motor Vehicle Branch, Solicitor General Department.
71


