report on the baltimore county public schools 2020
TRANSCRIPT

For accessibility issues with this document, please contact Dr. Christine Koth, Director of
Research at [email protected] or (443) 809-3845
Report on the
Baltimore County Public Schools
2020 Stakeholder Survey
Division of Research, Accountability, and Assessment
June 1, 2020

Office of Research 2 June 1, 2020
Table of Contents
Executive Summary ........................................................................................................................ 3
Report on the Baltimore County Public Schools 2020 Stakeholder Survey ................................... 5
Survey Administration ............................................................................................................ 5
Participation ............................................................................................................................ 5
Survey Responses in Translated Languages ................................................................... 6
Survey Participation by Demographic Group ................................................................. 6
Parent Participation ......................................................................................................... 7
Domains of Student Perception .............................................................................................. 8
Student Domain Index Scores ......................................................................................... 8
Selected Survey Items across Stakeholders ............................................................................ 9
College and Career Readiness/Discussions .................................................................. 10
Access to Technology ................................................................................................... 11
Safety at School and Work ........................................................................................... 12
Bullying ........................................................................................................................ 12
Welcoming School Environment .................................................................................. 14
Parent/Caregiver Engagement ...................................................................................... 15
System, School, and Department Effectiveness ........................................................... 15
Appendix A – Results by Stakeholder Group ....................................................................... 17
Appendix B – Student Participation Rate and Parent Participation by School ..................... 39

2020 BCPS Stakeholder Survey
Executive Summary
Office of Research 3 June 1, 2020
Executive Summary
The Baltimore County Public Schools (BCPS) Stakeholder Survey polls all facets of Team BCPS
and focuses on four areas: academics, safety and security, communication, and organizational
effectiveness. The survey contributes vital information to the evaluation and improvement of key
activities that drive student and organizational performance including school progress planning
and allocations from Title I-IV federal grants.
Summary of Results
Participation
• Overall, the survey received a total of 83,014 responses across all stakeholder groups.
• Student participation in the survey was relatively high, particularly in elementary schools
where over 90% of students responded to the survey.
• There were 2,030 survey responses in translated languages from students, parents, and
community members. Of these translated responses, 75% were in Spanish.
• Parent participation was assessed using a metric that provides the number of parent
responses per 100 enrolled students. Overall, parent participation was low; only 8 parents
submitted a survey response for every 100 students enrolled in the system.
Domains of Student Perception
• Analyses of student responses were used to identify three broad domains of student
perception: Academic Aspirations, Belonging, and Student Support.
• On the Academic Aspirations domain, student respondents across all levels had, on
average, high levels of agreement that they felt engaged, were academically prepared,
understood the importance of academics, and had high expectations for academic
performance.
• On the Belonging domain, elementary student respondents agreed, on average, that peer
relationships and interactions were characterized by mutual respect and that their school
environment was safe and welcoming; however, secondary students had levels of
agreement that were lower for this domain.
• On the Student Support domain, student respondents across all levels agreed, on average,
that interactions between students and teachers were characterized by trust, care, and
respect. This also points to positive two-way communication between teachers and
students.

2020 BCPS Stakeholder Survey
Executive Summary
Office of Research 4 June 1, 2020
Selected Survey Items Across Stakeholders
Academics
• Student, parent, school-based staff, and central office staff respondents had high levels of
agreement with a number of survey items that related to:
o BCPS students being prepared for college and career opportunities
o Access to technology increasing personalized learning opportunities for students
• Student, parent, and school-based staff respondents also agreed at high levels that teachers
were able to use technology to meet students’ academic needs.
Safety and Security
• Elementary school respondents felt safer at school by a meaningful margin compared to
middle and high school students.
• More than half of all student respondents reported having witnessed other students that
were bullied; however, only a quarter reported having been bullied themselves. Reported
personal experiences of bullying were highest among elementary students and having
witnessed bullying was highest among middle school students.
• Parent and all BCPS staff respondents had positive perceptions of school/workplace safety.
• A higher percentage of parent and school-based staff respondents perceived bullying to be
a problem than school administrators.
Communication
• Among student respondents, elementary students expressed the most agreement that they
felt welcome at schools while middle and high school students had lower levels of
agreement.
• Overall, parent, school-based staff, and school administrator respondents agreed that BCPS
schools encouraged parent engagement.
Organizational Effectiveness
• Ratings of the overall effectiveness for BCPS were highest among parent, school-
administrator, and central office staff respondents.
• Ratings of effectiveness for their school or department were high across all stakeholder
respondents, with elementary students, parents, school-based staff, and central office staff
reporting the highest ratings.
Results by stakeholder group for every survey item are provided in Appendix A and student and
parent/caregiver participation by school is provided in Appendix B.
Office of Research 5 June 1, 2020
Report on the Baltimore County Public Schools
2020 Stakeholder Survey
The Baltimore County Public Schools (BCPS) Stakeholder Survey polled all facets of Team
BCPS. The survey focused on four areas: academics; safety and security; communication; and
organizational effectiveness.
Survey Administration
The online survey was available from January 27 through March 11, 2020, across various device
platforms (e.g., desktop computer, mobile/phone, and tablet). Stakeholders who serve more than
one role, such as a BCPS parent who works for the school system or a parent with children at
multiple schools, were encouraged to complete the survey once in each of their respective roles.
Respondents identified as one of eight stakeholder groups: students (Grades 3–12);
parents/caregivers; community members; school staff; school administrators; or central office
staff. A four-point scale was used for most items (strongly agree, agree, disagree, and strongly
disagree). Other items included yes/no responses and a grading scale of the system and individual
schools. Respondents could skip any items; therefore, the choice of “not applicable” was not
offered.
Participation
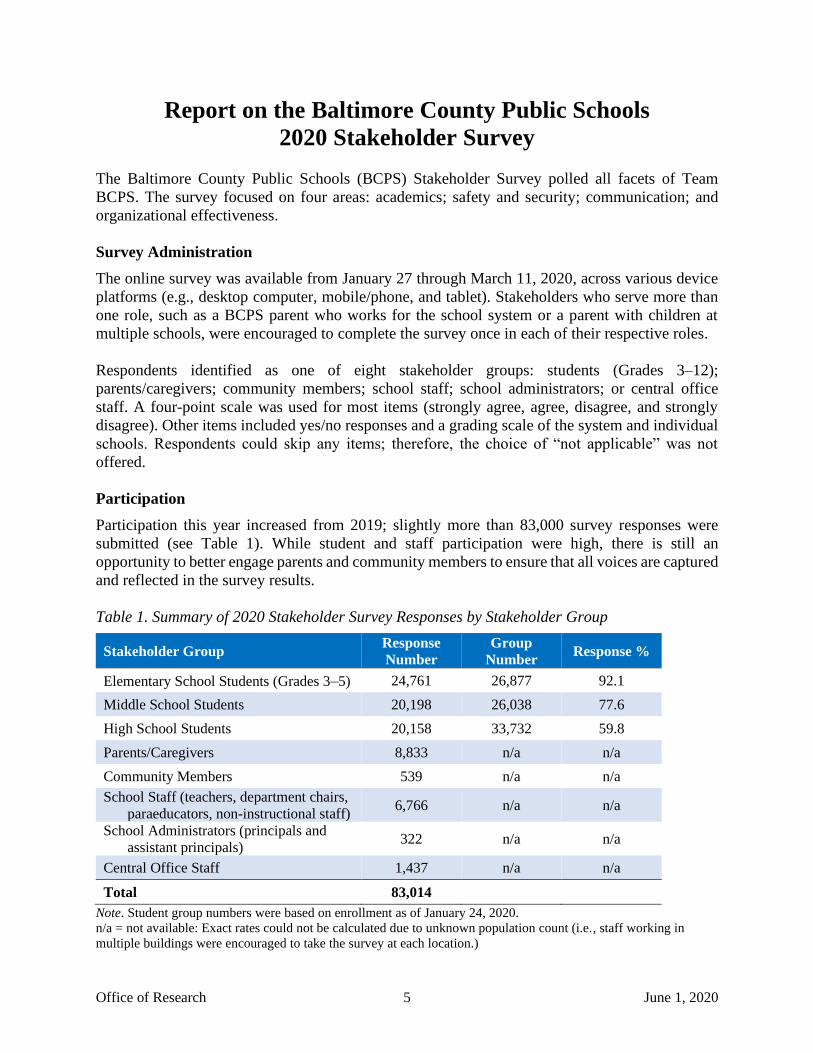
Participation this year increased from 2019; slightly more than 83,000 survey responses were
submitted (see Table 1). While student and staff participation were high, there is still an
opportunity to better engage parents and community members to ensure that all voices are captured
and reflected in the survey results.
Table 1. Summary of 2020 Stakeholder Survey Responses by Stakeholder Group
Stakeholder Group Response
Number
Group
Number Response %
Elementary School Students (Grades 3–5) 24,761 26,877 92.1
Middle School Students 20,198 26,038 77.6
High School Students 20,158 33,732 59.8
Parents/Caregivers 8,833 n/a n/a
Community Members 539 n/a n/a
School Staff (teachers, department chairs,
paraeducators, non-instructional staff) 6,766 n/a n/a
School Administrators (principals and
assistant principals) 322 n/a n/a
Central Office Staff 1,437 n/a n/a
Total 83,014
Note. Student group numbers were based on enrollment as of January 24, 2020.
n/a = not available: Exact rates could not be calculated due to unknown population count (i.e., staff working in
multiple buildings were encouraged to take the survey at each location.)

2020 BCPS Stakeholder Survey
Office of Research 6 June 1, 2020
Survey Responses in Translated Languages
The survey was translated into 15 languages for students, parents/caregivers, and community
members. Overall, 2,030 responses were received across all translated languages (see Table 2).
The most common language was Spanish, which accounted for more than 75% of translated
responses. The next most common languages, Chinese and Arabic, together accounted for
approximately 9% of translated responses.
Table 2. Responses to Stakeholder Survey in a Translated Language by Groups of Stakeholders
Language Student
Responses
Parent/Caregiver and
Community
Responses
Translated
Responses
Percentage of
Translated
Responses (%)
Spanish 1,250 288 1,538 75.8
Chinese 59 52 111 5.5
Arabic 45 23 68 3.4
French 52 11 63 3.1
Russian 31 13 44 2.2
Korean 18 10 28 1.4
Nepalese 19 10 29 1.4
Vietnamese 24 3 27 1.3
Tagalog 18 7 25 1.2
Amharic 6 16 22 1.1
Burmese 7 13 20 1.0
Urdu 4 16 20 1.0
Uzbek 12 3 15 0.7
Gujarati 6 7 13 0.6
Yoruba 4 3 7 0.3
Total 1,555 475 2,030 100
Survey Participation by Demographic Group
Among students, the number of responses from Black/African American students and White
students comprised slightly over a third of all responses. Overall, the percentage of students who
selected the third gender option was relatively small, with a larger number of secondary students
identifying as such than elementary students (see Table 3).
To gauge how representative survey responses were of the larger BCPS community, the
demographic breakdown of responses was examined. It is important to note that, on the

2020 BCPS Stakeholder Survey
Office of Research 7 June 1, 2020
Stakeholder Survey, race/ethnicity and gender were self-reported. Furthermore, respondents had
the option to not select a race/ethnicity or gender.
Since Black/African American and Hispanic/Latino students comprise approximately 40% and
12% of the overall BCPS student population, their shares of student responses were
underrepresented. This underrepresentation was more notable among parents, with responses from
Black/African American and Hispanic/Latino parents combined comprising less than 30% of all
parent responses (see Table 4).
Table 3. Percentage of Student Responses by Demographic Group
Student Demographic Group Elementary Middle High Overall
Race/Ethnicity
Asian 6.1% 7.0% 8.7% 7.2%
Black/African American 34.2% 34.4% 34.5% 34.4%
Hispanic/Latino 8.6% 9.5% 9.5% 9.2%
White 36.0% 33.6% 35.8% 35.2%
Other Race/Ethnicity 15.1% 15.5% 11.5% 14.0%
Gender
Female (she/her) 49.4% 49.2% 50.7% 49.7%
Male (he/him) 49.8% 49.0% 47.6% 48.8%
Another gender identity (they/them) 0.8% 1.8% 1.7% 1.5%
Table 4. Percentage of Parent/Caregiver Responses by Race/Ethnicity
Parent/Caregiver Race/Ethnicity Elementary Middle High Overall
Asian 7.0% 4.7% 4.1% 6.0%
Black/African American 21.5% 23.5% 25.3% 23.5%
Hispanic/Latino 6.3% 4.5% 4.6% 5.7%
White 59.7% 61.9% 61.6% 59.6%
Other Race/Ethnicity 5.5% 5.4% 4.4% 5.2%
Parent Participation
To comparatively assess parent participation across schools and areas, a parent participation metric
was developed that provided the number of parent responses per 100 enrolled students. Viewed
through this metric, parent participation on the survey was low. In 2020, only eight parents
submitted a survey response for every 100 students enrolled (see Table 5). Across geographic
areas, the metric was highest in the central region with 13 parent responses per 100 students.
Across school levels, the metric was highest in elementary schools.

2020 BCPS Stakeholder Survey
Office of Research 8 June 1, 2020
Table 5. Parent Responses per 100 Enrolled Students by School Level and Geographic Area
School Level Central Northeast Northwest Southeast Southwest Total
Elementary 15 10 7 6 8 9
Middle 10 6 5 4 5 6
High 9 6 4 3 6 6
Total 13 8 7 6 7 8
Domains of Student Perception
In an effort to develop a more thorough understanding of the underlying content collected in the
survey, analyses were conducted over the past three years with a focus on student responses. These
analyses helped identify three broad domains of student perception:
• Academic Aspirations measured students’ perceptions of teacher expectations, their
interest and engagement in class, and belief that their BCPS education will allow them to
succeed in the future.
• Belonging measured the extent to which students feel physically and emotionally safe at
school. Items in this domain addressed the overall school environment and peer-to-peer
relationships.
• Student Support measured the communication and social support that students received
in school and included the relationships students have with their teachers and other adults
in the school.
In this report, survey questions for students are reported under the domains listed above. While
some of the survey questions did not group within the areas above, they were still important and
were reported as additional questions. These included questions regarding bullying, challenging
schoolwork, school pride, and school effectiveness.
Student Domain Index Scores
Domain index scores are a summary of multiple survey items within each domain. Each score is
on a scale of 0 to 100, with higher values indicating more positive perceptions. For example, an
index score of 0 meant that all participants strongly disagreed with all survey items within the
domain; whereas a score of 100 indicated all participants strongly agreed with all items. One
interpretation of a domain score of 50 was that, on average, respondents agreed with half of the
items and disagreed on the remaining items. Table 6 contains descriptions for each domain.

2020 BCPS Stakeholder Survey
Office of Research 9 June 1, 2020
Table 6. Descriptions of Low and High Index Scores
Domain index scores by school level are provided in Figure 1. Overall, elementary students had
more positive perceptions than secondary students on all three domains. Of the domains, Academic
Aspirations had the highest scores with perceptions tapering downward from elementary to high
school. In comparison, ratings for Belonging were the lowest across all levels. Elementary school
students scored notably higher than secondary students for Belonging; middle school students had
the lowest ratings on this domain. Ratings on Student Support were moderately high with
elementary students having more positive perceptions than secondary students.
Figure 1. Student Domain Index Scores by Level
Selected Survey Items across Stakeholders
Throughout the survey, there were several items that addressed similar concepts across stakeholder
groups. These items allowed for comparisons of perceptions across stakeholders. Selected items
and performance measures are provided below.
Domain At low end of Index Score At high end of Index Score
Academic
Aspirations
Students are disengaged and feel ill-
prepared for the future. They may
underestimate the importance of
performing well academically and not
see the utility of topics covered in class.
Students are engaged and feel academically
prepared for the future. Students understand
the importance of academic achievement and
have high expectations for academic
performance.
Belonging
Students experience and witness peer
relationships and interactions that are
characterized by unresolved conflict.
They may find their school to be unsafe
and not welcoming.
Students experience and witness peer
relationships and interactions that are
characterized by mutual respect. They also
perceive their school environment as safe
and welcoming.
Student
Support
Students do not feel respect or care from
adults in their school. Students perceive
challenges in communication between
them and adults. These students may feel
as though their opinions and perspectives
are not valued by adults.
Students experience relationships with adults
that are characterized by trust, care, and
respect. Positive, two-way communication
occurs between teachers and students, with
students feeling that teachers listen to their
opinions and provide useful feedback.
81.570.7 66.865.5
47.3 52.9
75.864.3 63.6
0
25
50
75
100
Elementary School Middle School High SchoolDom
ain I
nd
ex S
core
Academic Aspirations Belonging Student Support

2020 BCPS Stakeholder Survey
Office of Research 10 June 1, 2020
Academics
Every student will experience high academic achievement and continuous growth by
participating in a rigorous instructional program designed to raise the academic bar and close
achievement gaps so that every student will become a globally competitive citizen in a culturally
diverse world.
College and Career Readiness/Discussions
Overall, more than 80% of BCPS staff recognized how their work contributed to students’
readiness for college and/or career. Three-quarters of high school students agreed with the
assertion that they will be prepared for college and/or career by graduation.
Figure 2. Preparedness for College and Career
Stakeholder Group Survey Item
HS Students By the time I graduate, I will be prepared for college and/or a career.
Parents/Caregivers The school’s academic program prepares students for college and career.
Community Members BCPS’ academic program prepares students for college and career.
School-Based Staff and
School Administrators My work contributes to students’ college and career readiness.
Central Office Staff The work of my division/department/office contributes to students’ college and
career readiness.
In line with the above item, students were asked about educators having had conversations with
them about college and career options. Students’ agreement with this statement increased from
elementary to secondary grades, with high school students having demonstrated the highest
agreement.
75
82
55
88
89
81
0 25 50 75 100
HS Students
Parents/Caregivers
Community Members
School-Based Staff
School Administrators
Central Office Staff
Percent Agreement
2020 BCPS Stakeholder Survey
Office of Research 11 June 1, 2020
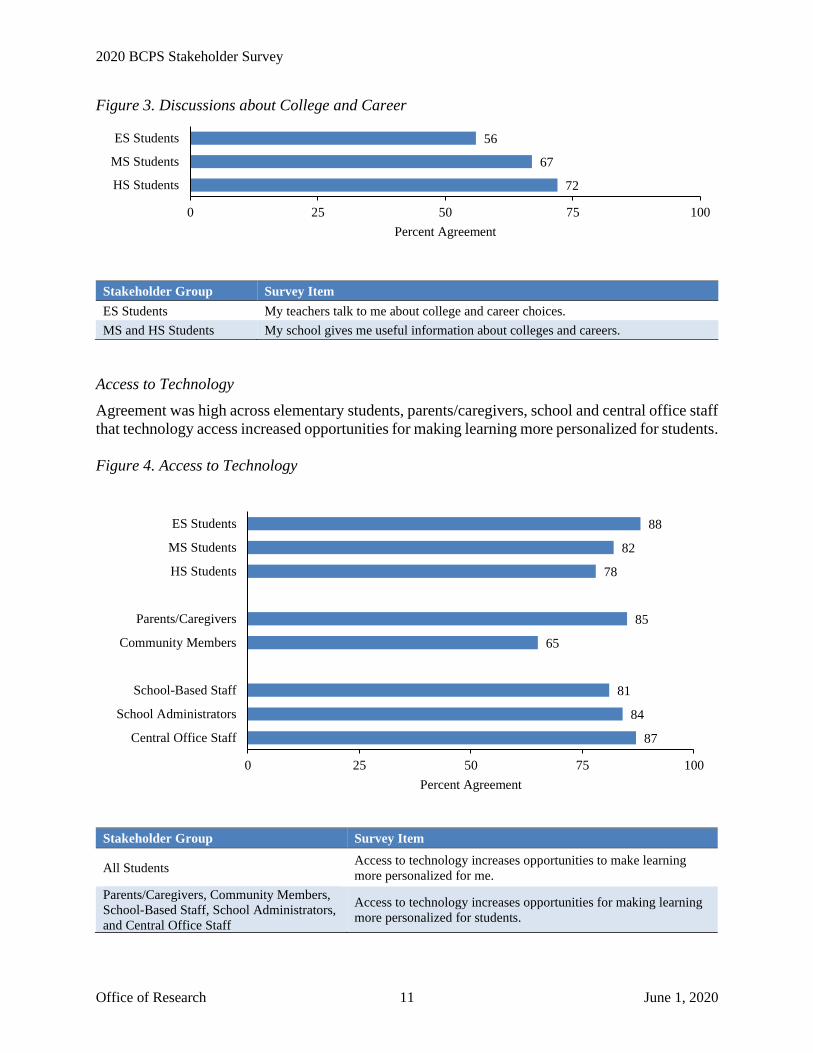
Figure 3. Discussions about College and Career
Stakeholder Group Survey Item
ES Students My teachers talk to me about college and career choices.
MS and HS Students My school gives me useful information about colleges and careers.
Access to Technology
Agreement was high across elementary students, parents/caregivers, school and central office staff
that technology access increased opportunities for making learning more personalized for students.
Figure 4. Access to Technology
Stakeholder Group Survey Item
All Students Access to technology increases opportunities to make learning
more personalized for me.
Parents/Caregivers, Community Members,
School-Based Staff, School Administrators,
and Central Office Staff
Access to technology increases opportunities for making learning
more personalized for students.
56
67
72
0 25 50 75 100
ES Students
MS Students
HS Students
Percent Agreement
88
82
78
85
65
81
84
87
0 25 50 75 100
ES Students
MS Students
HS Students
Parents/Caregivers
Community Members
School-Based Staff
School Administrators
Central Office Staff
Percent Agreement

2020 BCPS Stakeholder Survey
Office of Research 12 June 1, 2020
Safety and Security
Every school and office will be safe and secure, promote individual well-being, and provide
positive, respectful, and caring environments for teaching, learning, and working.
Safety at School and Work
There was a gap in the percentage of elementary and secondary students who felt safe at school.
Staff members’ perceptions varied slightly with central office staff perceptions having been the
lowest. Parents/Caregivers’ perceptions were similar to elementary students; community
members’ perceptions were the lowest of all stakeholder groups.
Figure 5. Safety at School and Work
Stakeholder Group Survey Item
All Students I feel safe at my school.
Parents/Caregivers This school is safe and secure.
Community Members BCPS schools are safe.
All Staff I feel safe and secure at work.
Bullying
Parents and school-based staff perceived that bullying was a problem at higher rates than school
administrators.
79
89
80
47
84
72
66
86
0 25 50 75 100
Central Office Staff
School Administrators
School-Based Staff
Community Members
Parents/Caregivers
HS Students
MS Students
ES Students
Percent Agreement

2020 BCPS Stakeholder Survey
Office of Research 13 June 1, 2020
Figure 6. Bullying Is a Problem
Several student items related to bullying were included on the survey. The first asked if students
had been bullied at their school and the second asked if students witnessed others bullied at their
school. Students who answered ‘yes’ to either of these items, were asked questions about the
location and frequency of the bullying.
A third of elementary students reported being bullied and this number decreased from elementary
to secondary grades, with high school students having reported the lowest rates of experiencing
bullying (see Figure 7). Approximately half of all students reported having witnessed other
students being bullied at their schools (see Figure 8). Middle school students reported the highest
rates of having witnessed bullying. Students’ reports of being bullied were notably lower than their
reports of having witnessed other students bullied across all levels.
Figure 7. I was bullied at this school.
Figure 8. I have witnessed students bullied
at this school.
To explore both frequency and location of bullying, students were asked to identify how often they
experienced bullying in various locations. For each location, students could select never, once or
twice, once a month, or every day. Students across all levels reported being bullied most frequently
within the schoolhouse, with similar percentages reported inside the classroom and in areas outside
the classroom such as in the cafeteria, gym, hallway, or stairs (see Figure 9). The frequency of
bullying on the school bus was consistent across levels. In contrast, the frequency of bullying that
was experienced online or by text was higher for older students. Similar patterns were reported for
the frequency and location of students witnessing bullying (see Appendix A) with the exception
32
38
15
0 25 50 75 100
Parents/Caregivers
School-Based Staff
School Administrators
Percent Agreement
12
22
33
0 25 50 75 100
HS Students
MS Students
ES Students
Percent Answered Yes
46
60
50
0 25 50 75 100
HS Students
MS Students
ES Students
Percent Answered Yes

2020 BCPS Stakeholder Survey
Office of Research 14 June 1, 2020
of middle school students witnessing notably more bullying on the school bus than elementary and
high school students. Responses to these questions by school level are in Appendix A.
Figure 9. Students Experiencing Bullying by Location
Communication
Every stakeholder will experience clear, timely, honest, transparent, and widely available
communication about system initiatives and activities that engages them in building a culture
of trust through action and establishes BCPS as a world-class school system.
Welcoming School Environment
Parents and elementary school students expressed the most agreement that they felt welcome in
the school building. Middle and high school students had the lower level of agreement.
Figure 10. Welcoming School Environment
Stakeholder Group Survey Item
ES, MS, and HS Students I feel welcome at my school.
Parents/Caregivers I feel welcome at my child’s school.
30
33
31
30
34
32
17
19
19
13
19
30
0 25 50 75 100
ES Students
MS Students
HS Students
Percent Answered
"Once a month" or "Every day"
in the classroom
outside the classroom
on the school bus
online or by text
85
71
76
89
0 25 50 75 100
ES Students
MS Students
HS Students
Parents/Caregivers
Percent Agreement

2020 BCPS Stakeholder Survey
Office of Research 15 June 1, 2020
Parent/Caregiver Engagement
Overall, parents, school administrators, and school-based staff reported similar levels of agreement
that BCPS schools encouraged parent/caregiver engagement.
Figure 11. Encouraging Parent Engagement
Stakeholder Group Survey Item
Parents/Caregivers My child’s school encourages parent/caregiver engagement.
School-Based Staff My school encourages parent/caregiver engagement.
School Administrators BCPS encourages parent/caregiver engagement.
Organizational Effectiveness
Baltimore County Public Schools will maximize organizational efficiency and effectiveness by
engaging in strategic efforts that employ rigorous, relevant, and reasonable performance
standards that provide for all employees’ professional growth and shared accountability for
student, school, and organizational performance.
System, School, and Department Effectiveness
Stakeholders were asked to grade the effectiveness of BCPS, their school, and/or their department.
Grades of A, B, and C were considered effective. Parents and staff gave BCPS the highest grades
while community members expressed the least satisfaction. School administrators’ grades were
higher than school-based staff grades (Figure 12). School and department grades were high across
stakeholders (Figure 13).
89
90
84
0 25 50 75 100
School Administrators
School-Based Staff
Parents/Caregivers
Percent Agreement

2020 BCPS Stakeholder Survey
Office of Research 16 June 1, 2020
Figure 12. Graded BCPS as Effective (A, B, or C)
Figure 13. Graded School/Department as Effective (A, B, or C)
82
88
76
63
85
0 25 50 75 100
Central Office Staff
School Administrators
School-Based Staff
Community Members
Parents/Caregivers
Percent Effective
86
86
91
84
80
92
0 25 50 75 100
Central Office Staff
School-Based Staff
Parents/Caregivers
HS Students
MS Students
ES Students
Percent Effective

2020 BCPS Stakeholder Survey
Appendix A – Results by Stakeholder Group
Office of Research 17 June 1, 2020
Appendix A – Results by Stakeholder Group
Elementary School Students (Total Responses = 24,761; student response rate = 92.1%)
Academic Aspirations
Survey Item Responses Strongly
Disagree (%) Disagree (%) Agree (%)
Strongly
Agree (%)
Getting good grades is important to me. 24,600 1.3 1.6 22.6 74.5
In school, I participate in class activities. 24,199 1.8 5.6 43.2 49.4
My teachers have high expectations for me to do well in school. 24,359 2.0 3.7 30.0 64.3
I am interested in my classes. 24,269 4.0 10.8 47.4 37.9
By the end of the year, I will be prepared to do well next year. 24,213 2.1 4.3 32.6 61.0
I pay attention in class. 24,215 2.2 7.7 50.8 39.3
Belonging
Survey Item Responses Strongly
Disagree (%) Disagree (%) Agree (%)
Strongly
Agree (%)
Most students do their best, even when their school work is difficult. 24,325 4.9 16.2 49.5 29.5
I feel safe at my school. 24,579 5.1 9.3 36.7 48.9
I feel like I can be myself when I am at school. 24,425 7.7 16.0 38.4 37.9
Students at my school treat me with respect. 24,257 8.5 20.3 49.2 22.0
Most students in my school are accepting of other students. 24,249 7.7 16.6 47.8 28.0
Most students in my school try to work out their disagreements with other
students by talking to them. 24,434 13.3 24.9 43.1 18.6
I feel welcome at my school. 24,386 5.3 9.6 37.2 47.9
Most students in my school stop and think before doing anything when they
get angry. 24,327 21.4 32.6 33.8 12.2
At my school, students cooperate with one another to complete school work. 24,124 5.8 14.2 53.5 26.5
At my school, students help each other. 24,074 5.0 11.4 52.1 31.5
At my school, students do things that are good for the school community. 24,200 7.7 17.1 46.0 29.3

2020 BCPS Stakeholder Survey
Appendix A – Results by Stakeholder Group
Office of Research 18 June 1, 2020
Elementary School Students (Total Responses = 24,761; student response rate = 92.1%)
Student Support
Survey Item Responses Strongly
Disagree (%) Disagree (%) Agree (%)
Strongly
Agree (%)
Most adults at my school treat me with respect. 24,310 2.9 5.9 34.5 56.7
There is at least one adult at my school I can go to if I have a problem. 24,349 4.4 5.0 22.9 67.6
Most adults at my school care about me as a person. 24,274 2.7 5.3 36.1 55.9
My teachers listen to my ideas. 24,517 3.6 7.0 46.6 42.8
My teachers tell me how I do on my classwork, tests, and homework
assignments. 24,285 3.5 8.5 39.9 48.1
My teachers talk to me about college and career choices. 24,219 17.7 26.6 34.8 20.9
Additional Questions
Survey Item Responses No (%) Yes (%)
Do you know how to respond during an emergency at school? 24,555 5.3 94.7
Do you have Internet access where you live? 24,230 6.6 93.4
Survey Item Responses No (%) Yes (%)
I was bullied at this school. 24,583 67.2 32.8
I have witnessed students bullied at this school. 24,566 50.5 49.5
Survey Item Responses Strongly
Disagree (%) Disagree (%) Agree (%)
Strongly
Agree (%)
My school work is challenging. 24,404 4.7 23.0 56.9 15.4
Access to technology increases opportunities to make learning more
personalized for me. 24,285 3.2 9.2 44.4 43.2
My teachers are able to use technology to meet my academic needs. 24,339 2.6 6.0 40.1 51.3
I am proud to be a student at this school. 24,199 5.5 8.0 33.5 53.0

2020 BCPS Stakeholder Survey
Appendix A – Results by Stakeholder Group
Office of Research 19 June 1, 2020
Elementary School Students (Total Responses = 24,761; student response rate = 92.1%)
Survey Item Responses Never (%) Once or
Twice (%)
Once a
Month (%)
Everyday
(%)
I was bullied in a classroom. 7,963 29.7 40.5 11.0 18.8
I was bullied outside of the classroom (cafeteria, gym, hallway, or stairs) 7,909 28.3 41.3 13.2 17.2
I was bullied on the school bus. 7,833 66.6 16.7 6.3 10.4
I was bullied online or by text. 7,852 71.1 16.2 5.5 7.2
Students were bullied in a classroom. 11,985 25.4 41.9 11.9 20.8
Students were bullied outside of the classroom (cafeteria, gym, hallway, or
stairs) 11,949 19.3 42.4 17.4 20.9
Students were bullied on the school bus. 11,770 45.7 25.0 11.0 18.3
Students were bullied online or by text 11,817 59.3 20.3 8.7 11.7
Survey Item Responses F (%) D (%) C (%) B (%) A (%)
What grade would you give your school for its
performance/effectiveness? 24,512 3.5 4.4 14.5 33.5 44.2

2020 BCPS Stakeholder Survey
Appendix A – Results by Stakeholder Group
Office of Research 20 June 1, 2020
Middle School Students (Total Responses = 20,198; student response rate = 77.6%)
Academic Aspirations
Survey Item Responses Strongly
Disagree (%) Disagree (%) Agree (%)
Strongly
Agree (%)
I understand that getting a good education is important. 20,140 2.4 1.3 24.9 71.4
In school, I participate in class activities. 19,824 3.1 9.4 58.0 29.5
My teachers set high standards for learning in their classes. 19,973 3.7 11.7 54.3 30.3
I am interested in my classes. 20,025 8.2 23.1 52.2 16.5
By the end of the year, I will be prepared to do well next year. 19,995 3.9 9.0 50.6 36.4
I pay attention in class. 20,040 2.6 8.4 60.3 28.6
My academic skills are improving. 19,922 3.0 9.4 55.3 32.3
My school work requires me to think about how academic topics relate to
real-life situations. 20,006 9.0 24.3 47.4 19.3
By the time I complete middle school, I will be prepared for high school. 20,044 4.6 11.0 51.9 32.6
Belonging
Survey Item Responses Strongly
Disagree (%) Disagree (%) Agree (%)
Strongly
Agree (%)
Most students do their best, even when their school work is difficult. 20,015 15.5 38.0 37.2 9.3
I feel safe at my school. 20,110 12.6 21.3 48.7 17.5
I feel like I can be myself when I am at school. 20,038 13.0 23.0 43.4 20.6
Students respect each other at my school. 20,001 30.3 38.5 26.2 5.0
Most students in my school are accepting of other students. 19,916 21.0 29.8 39.6 9.6
Most students in my school try to work out their disagreements with other
students by talking to them. 20,026 30.2 35.3 28.0 6.5
I feel welcome at my school. 20,006 10.6 18.2 53.4 17.7
Most students in my school stop and think before doing anything when they
get angry. 20,006 39.7 38.0 17.6 4.6
At my school, students cooperate with one another to complete school work. 19,927 11.9 22.7 54.1 11.2
2020 BCPS Stakeholder Survey
Appendix A – Results by Stakeholder Group
Office of Research 21 June 1, 2020
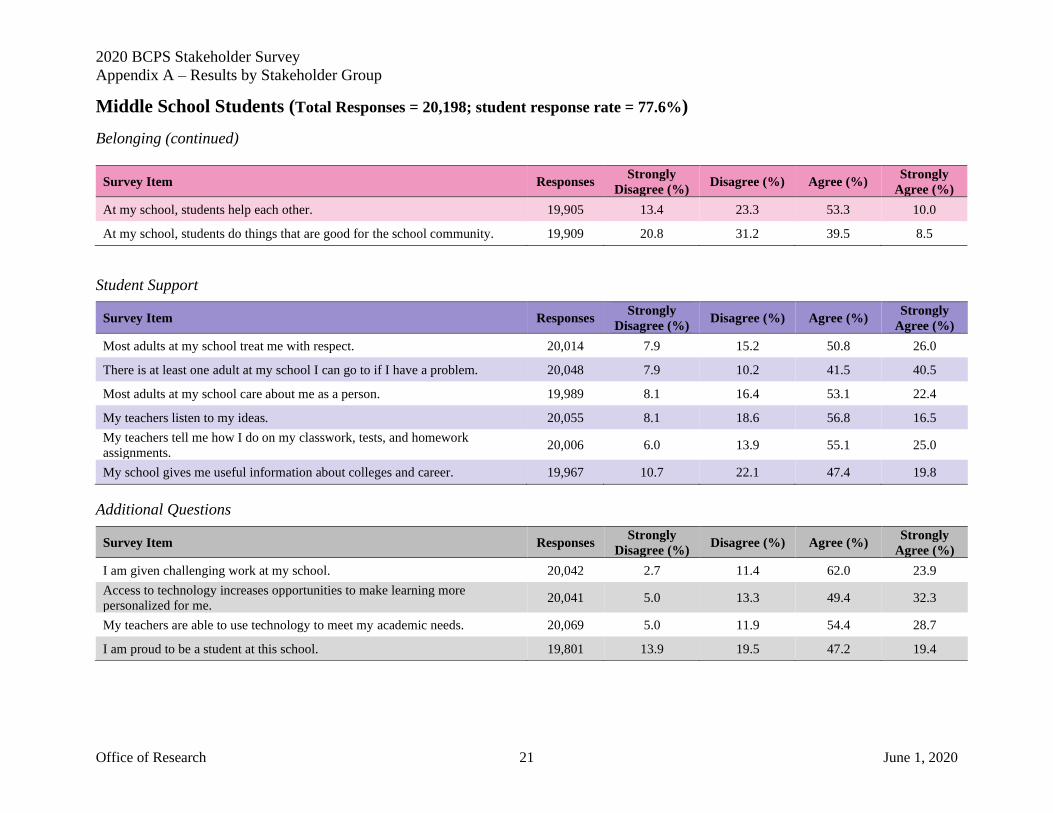
Middle School Students (Total Responses = 20,198; student response rate = 77.6%)
Belonging (continued)
Survey Item Responses Strongly
Disagree (%) Disagree (%) Agree (%)
Strongly
Agree (%)
At my school, students help each other. 19,905 13.4 23.3 53.3 10.0
At my school, students do things that are good for the school community. 19,909 20.8 31.2 39.5 8.5
Student Support
Survey Item Responses Strongly
Disagree (%) Disagree (%) Agree (%)
Strongly
Agree (%)
Most adults at my school treat me with respect. 20,014 7.9 15.2 50.8 26.0
There is at least one adult at my school I can go to if I have a problem. 20,048 7.9 10.2 41.5 40.5
Most adults at my school care about me as a person. 19,989 8.1 16.4 53.1 22.4
My teachers listen to my ideas. 20,055 8.1 18.6 56.8 16.5
My teachers tell me how I do on my classwork, tests, and homework
assignments. 20,006 6.0 13.9 55.1 25.0
My school gives me useful information about colleges and career. 19,967 10.7 22.1 47.4 19.8
Additional Questions
Survey Item Responses Strongly
Disagree (%) Disagree (%) Agree (%)
Strongly
Agree (%)
I am given challenging work at my school. 20,042 2.7 11.4 62.0 23.9
Access to technology increases opportunities to make learning more
personalized for me. 20,041 5.0 13.3 49.4 32.3
My teachers are able to use technology to meet my academic needs. 20,069 5.0 11.9 54.4 28.7
I am proud to be a student at this school. 19,801 13.9 19.5 47.2 19.4

2020 BCPS Stakeholder Survey
Appendix A – Results by Stakeholder Group
Office of Research 22 June 1, 2020
Middle School Students (Total Responses = 20,198; student response rate = 77.6%)
Additional Question (continued)
Survey Item Responses No (%) Yes (%)
Do you know how to respond during an emergency at school? 20,100 6.0 94.0
Do you have Internet access where you live? 19,951 5.4 94.6
Survey Item Responses No (%) Yes (%)
I was bullied at this school. 20,088 78.5 21.5
I have witnessed students bullied at this school. 20,090 39.6 60.4
Survey Item Responses Never (%) Once or
Twice (%)
Once a
Month (%)
Everyday
(%)
I was bullied in a classroom. 4,286 20.3 46.8 12.9 20.1
I was bullied outside of the classroom (cafeteria, gym, hallway, or stairs) 4,273 22.9 43.3 14.1 19.7
I was bullied on the school bus. 4,239 61.6 19.5 7.3 11.6
I was bullied online or by text. 4,250 59.1 21.5 8.5 10.9
Students were bullied in a classroom. 12,073 14.2 43.3 16.0 26.5
Students were bullied outside of the classroom (cafeteria, gym, hallway, or
stairs) 12,045 7.1 34.8 21.5 36.5
Students were bullied on the school bus. 11,920 29.5 30.0 15.6 24.9
Students were bullied online or by text 11,973 27.6 25.6 16.8 30.0
Survey Item Responses F (%) D (%) C (%) B (%) A (%)
What grade would you give your school for its
performance/effectiveness? 20,085 7.6 12.7 32.9 34.9 11.9

2020 BCPS Stakeholder Survey
Appendix A – Results by Stakeholder Group
Office of Research 23 June 1, 2020
High School Students (Total Responses = 20,158; student response rate = 59.8%)
Academic Aspirations
Survey Item Responses Strongly
Disagree (%) Disagree (%) Agree (%)
Strongly
Agree (%)
I understand that getting a good education is important. 20,037 3.1 1.5 28.9 66.5
In school, I participate in class activities. 19,918 3.9 10.3 60.4 25.5
My teachers set high standards for learning in their classes. 19,979 4.3 12.6 58.6 24.5
I am interested in my classes. 19,977 8.0 22.7 54.4 14.9
I pay attention in class. 19,941 3.1 8.6 65.3 22.9
My academic skills are improving. 19,922 4.5 13.6 56.9 25.0
My school work requires me to think about how academic topics relate to
real-life situations. 19,980 14.9 29.0 42.0 14.0
By the time I graduate, I will be prepared for college and/or a career. 19,980 7.8 17.0 50.6 24.6
Belonging
Survey Item Responses Strongly
Disagree (%) Disagree (%) Agree (%)
Strongly
Agree (%)
Most students do their best, even when their school work is difficult. 19,994 13.4 35.8 41.4 9.4
I feel safe at my school. 20,006 10.0 18.4 54.8 16.8
I feel like I can be myself when I am at school. 19,971 10.0 18.3 51.2 20.4
Students respect each other at my school. 19,964 20.6 32.9 38.7 7.8
Most students in my school are accepting of other students. 19,909 14.7 24.4 48.5 12.3
Most students in my school try to work out their disagreements with other
students by talking to them. 19,952 21.7 33.5 37.3 7.5
I feel welcome at my school. 19,948 8.0 16.1 60.2 15.7
Most students in my school stop and think before doing anything when they
get angry. 19,921 28.1 36.9 28.8 6.3
At my school, students cooperate with one another to complete school work. 19,935 8.0 17.0 59.4 15.6
At my school, students help each other. 19,901 8.6 18.1 58.8 14.6

2020 BCPS Stakeholder Survey
Appendix A – Results by Stakeholder Group
Office of Research 24 June 1, 2020
High School Students (Total Responses = 20,158; student response rate = 59.8%)
Belonging (continued)
Survey Item Responses Strongly
Disagree (%) Disagree (%) Agree (%)
Strongly
Agree (%)
At my school, students do things that are good for the school community. 19,895 12.9 27.3 48.9 10.9
Student Support
Survey Item Responses Strongly
Disagree (%) Disagree (%) Agree (%)
Strongly
Agree (%)
Most adults at my school treat me with respect. 19,970 6.8 12.6 57.7 23.0
There is at least one adult at my school I can go to if I have a problem. 19,959 7.8 11.6 48.6 32.0
Most adults at my school care about me as a person. 19,941 7.9 18.1 56.5 17.5
My teachers listen to my ideas. 19,955 6.6 17.6 62.1 13.7
My teachers tell me how I do on my classwork, tests, and homework
assignments. 19,961 6.1 15.3 57.8 20.9
My school gives me useful information about colleges and career. 19,937 8.9 19.5 51.2 20.4
Additional Questions
Survey Item Responses Strongly
Disagree (%) Disagree (%) Agree (%)
Strongly
Agree (%)
I am given challenging work at my school. 19,980 2.8 9.9 59.5 27.8
Access to technology increases opportunities to make learning more
personalized for me. 19,981 6.9 15.1 51.7 26.3
My teachers are able to use technology to meet my academic needs. 19,990 6.1 13.7 58.3 21.9
I am proud to be a student at this school. 19,769 11.7 18.2 50.9 19.2

2020 BCPS Stakeholder Survey
Appendix A – Results by Stakeholder Group
Office of Research 25 June 1, 2020
High School Students (Total Responses = 20,158; student response rate = 59.8%)
Additional Questions (continued)
Survey Item Responses No (%) Yes (%)
Do you know how to respond during an emergency at school? 20,095 8.2 91.8
Do you have Internet access where you live? 19,975 5.0 95.0
Survey Item Responses No (%) Yes (%)
I was bullied at this school. 20,081 88.1 11.9
I have witnessed students bullied at this school. 20,075 54.2 45.8
Survey Item Responses Never (%) Once or
Twice (%)
Once a
Month (%)
Everyday
(%)
I was bullied in a classroom. 2,363 28.0 41.3 12.8 17.9
I was bullied outside of the classroom (cafeteria, gym, hallway, or stairs) 2,369 27.0 40.6 14.1 18.3
I was bullied on the school bus. 2,347 65.5 15.9 6.7 12.0
I was bullied online or by text. 2,351 41.9 28.4 12.0 17.8
Students were bullied in a classroom. 9,407 19.4 44.6 16.7 19.2
Students were bullied outside of the classroom (cafeteria, gym, hallway, or
stairs) 9,390 11.1 41.8 20.8 26.3
Students were bullied on the school bus. 9,311 44.5 27.5 12.4 15.7
Students were bullied online or by text 9,351 21.0 27.4 18.5 33.1
Survey Item Responses F (%) D (%) C (%) B (%) A (%)
What grade would you give your school for its
performance/effectiveness? 20,093 5.3 10.5 32.6 37.8 13.7

2020 BCPS Stakeholder Survey
Appendix A – Results by Stakeholder Group
Office of Research 26 June 1, 2020
Parents/Caregivers (Total Responses = 8,833)
Academics
Survey Item Responses Strongly
Disagree (%) Disagree (%) Agree (%)
Strongly
Agree (%)
The school sets high academic standards. 8,797 3.6 9.0 52.8 34.7
My child does work that prepares him/her for the next academic year. 8,797 2.7 7.4 53.6 36.3
The school's academic program prepares students for college and career. 8,648 4.0 13.7 54.3 27.9
The school challenges students to maximize their potential. 8,770 4.9 15.2 48.9 31.0
The school provides its students with a high-quality education. 8,771 3.9 12.0 49.6 34.4
I am satisfied with the instruction my child receives at this school. 8,781 5.1 13.3 47.8 33.8
Making learning more personalized for students helps teachers to meet the
academic needs of all students. 8,770 3.3 7.0 44.1 45.6
Access to technology increases opportunities for making learning more
personalized for students. 8,775 4.3 10.7 47.6 37.4
Teachers are able to use technology to meet the academic needs of all
students. 8,755 4.7 15.0 52.1 28.3
Safety and Security
Survey Item Responses Strongly
Disagree (%) Disagree (%) Agree (%)
Strongly
Agree (%)
This school is safe and secure. 8,796 5.6 10.3 48.8 35.4
Students respect each other at this school. 8,779 8.5 17.3 51.9 22.2
My child is treated with respect at this school. 8,786 4.7 9.2 54.3 31.9
Bullying is a problem at this school. 8,649 16.7 51.8 21.9 9.6
Survey Item Responses No (%) Yes (%)
In case of an emergency, do you know the procedures at this school? 8,796 25.3 74.7

2020 BCPS Stakeholder Survey
Appendix A – Results by Stakeholder Group
Office of Research 27 June 1, 2020
Parents/Caregivers (Total Responses = 8,833)
Communications
Survey Item Responses Strongly
Disagree (%) Disagree (%) Agree (%)
Strongly
Agree (%)
Communication to and from the school system is open, clear, and timely. 8,806 5.7 12.1 47.6 34.6
Information and results data are available and easily accessible. 8,737 4.1 14.9 53.6 27.5
I feel welcome at my child's school. 8,790 3.5 7.5 45.8 43.2
The school provides opportunities for two-way communication. 8,767 3.8 9.1 51.0 36.1
I know how to get school information when I need it. 8,777 2.6 9.9 52.0 35.5
School staff return phone calls or e-mails in a timely manner. 8,734 4.8 9.8 46.8 38.5
I am satisfied with the quality of information about my child's academic and
social progress. 8,788 4.9 14.1 48.3 32.8
Communication to and from my child's school is easy to understand. 8,771 2.8 7.7 52.2 37.3
My child's school encourages parent/caregiver engagement. 8,746 4.6 11.6 45.3 38.5
Survey Item Responses No (%) Yes (%)
Do you have broadband Internet access where you live? 8,769 5.2 94.8
Organizational Effectiveness
Survey Item Responses Strongly
Disagree (%) Disagree (%) Agree (%)
Strongly
Agree (%)
I am satisfied with the ability of the teachers to meet the needs of my child. 8,773 4.6 12.3 49.5 33.6
I am satisfied with the principal's leadership at my child's school. 8,722 6.9 9.7 44.7 38.8
I am satisfied with school improvement planning at my child's school. 8,544 6.6 16.4 50.6 26.4
I am satisfied with the superintendent's leadership and vision. 8,403 7.0 17.2 58.6 17.2
Community members, parents/caregivers, teachers, and school leaders work
together to solve school-based challenges. 8,597 6.1 17.0 53.6 23.4

2020 BCPS Stakeholder Survey
Appendix A – Results by Stakeholder Group
Office of Research 28 June 1, 2020
Parents/Caregivers (Total Responses = 8,833)
Organizational Effectiveness (continued)
Survey Item Responses Definitely
Not (%)
Probably
Not (%)
Probably
Yes (%)
Definitely
Yes (%)
Would you recommend this school to other parents/caregivers? 8,776 6.2 10.8 33.4 49.6
Survey Item Responses F (%) D (%) C (%) B (%) A (%)
What grade would you give your child's school for its
performance/effectiveness? 8,795 3.0 6.1 15.5 35.8 39.5
What grade would you give BCPS for its
performance/effectiveness? 8,763 4.8 10.2 26.6 40.1 18.4

2020 BCPS Stakeholder Survey
Appendix A – Results by Stakeholder Group
Office of Research 29 June 1, 2020
Community Members (Total Responses = 539)
Academics
Survey Item Responses Strongly
Disagree (%) Disagree (%) Agree (%)
Strongly
Agree (%)
BCPS sets high academic standards. 528 14.4 23.1 51.7 10.8
BCPS' academic program prepares students for college and career. 520 16.9 28.5 44.8 9.8
BCPS challenges students to maximize their potential. 516 16.3 31.6 43.6 8.5
BCPS provides its students with a high-quality education. 513 15.2 28.7 46.8 9.4
Making learning more personalized for students helps teachers to meet the
academic needs of all students. 510 11.6 20.2 44.7 23.5
Access to technology increases opportunities for making learning more
personalized for students. 517 12.0 23.2 46.4 18.4
Teachers are able to use technology to meet the academic needs of all
students. 512 12.7 30.5 43.9 12.9
Safety and Security
Survey Item Responses Strongly
Disagree (%) Disagree (%) Agree (%)
Strongly
Agree (%)
BCPS schools are safe. 538 23.6 29.2 37.7 9.5
Communications
Survey Item Responses Strongly
Disagree (%) Disagree (%) Agree (%)
Strongly
Agree (%)
Communication to and from the school system is open, clear, and timely. 525 17.1 30.5 40.0 12.4
Information and results data are available and easily accessible. 520 14.4 31.9 44.2 9.4
The school system provides opportunities for two-way communication. 514 15.2 28.0 47.7 9.1
I know how to get school information when I need it. 518 10.2 26.6 49.8 13.3

2020 BCPS Stakeholder Survey
Appendix A – Results by Stakeholder Group
Office of Research 30 June 1, 2020
Community Members (Total Responses = 539)
Organizational Effectiveness
Survey Item Responses Strongly
Disagree (%) Disagree (%) Agree (%)
Strongly
Agree (%)
I am satisfied with the superintendent's leadership and vision. 512 16.4 27.5 48.6 7.4
Community members, parents/caregivers, teachers, and school leaders work
together to solve school-based challenges. 512 20.5 38.3 31.8 9.4
Survey Item Responses Definitely
Not (%)
Probably
Not (%)
Probably
Yes (%)
Definitely
Yes (%)
Would you recommend BCPS to others? 523 19.1 28.9 38.8 13.2
Survey Item Responses F (%) D (%) C (%) B (%) A (%)
What grade would you give BCPS for its
performance/effectiveness? 521 12.9 24.0 30.7 25.7 6.7
2020 BCPS Stakeholder Survey
Appendix A – Results by Stakeholder Group
Office of Research 31 June 1, 2020
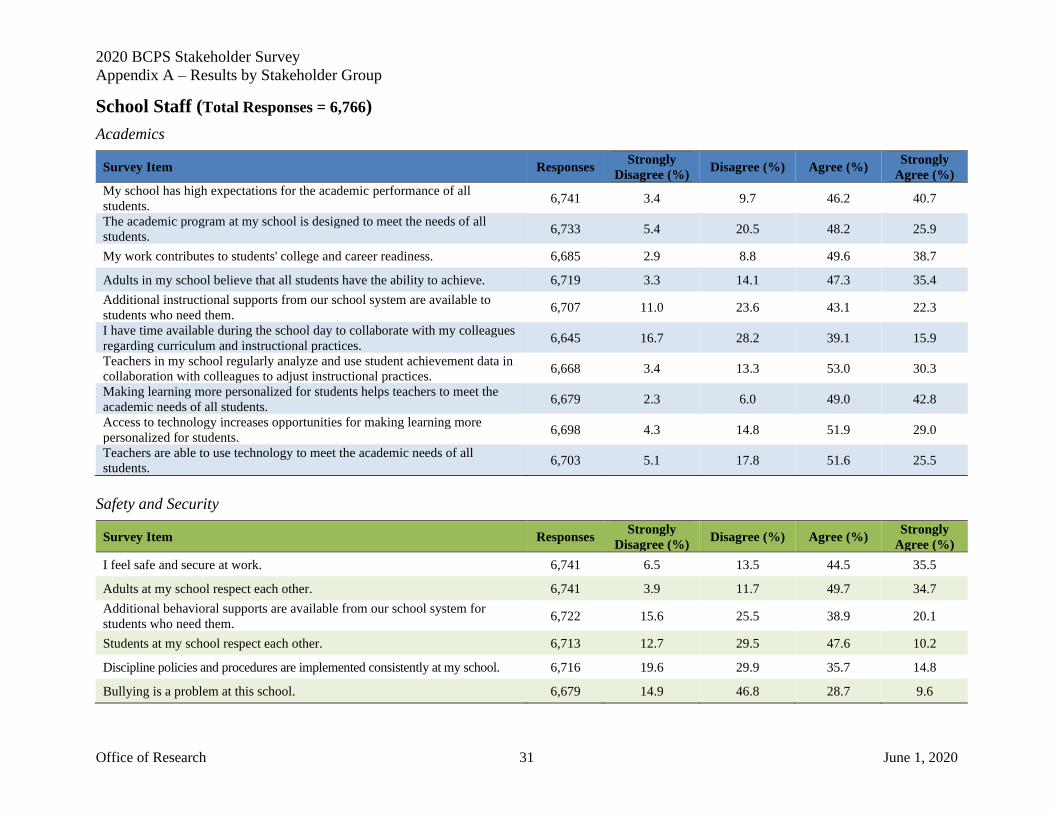
School Staff (Total Responses = 6,766)
Academics
Survey Item Responses Strongly
Disagree (%) Disagree (%) Agree (%)
Strongly
Agree (%)
My school has high expectations for the academic performance of all
students. 6,741 3.4 9.7 46.2 40.7
The academic program at my school is designed to meet the needs of all
students. 6,733 5.4 20.5 48.2 25.9
My work contributes to students' college and career readiness. 6,685 2.9 8.8 49.6 38.7
Adults in my school believe that all students have the ability to achieve. 6,719 3.3 14.1 47.3 35.4
Additional instructional supports from our school system are available to
students who need them. 6,707 11.0 23.6 43.1 22.3
I have time available during the school day to collaborate with my colleagues
regarding curriculum and instructional practices. 6,645 16.7 28.2 39.1 15.9
Teachers in my school regularly analyze and use student achievement data in
collaboration with colleagues to adjust instructional practices. 6,668 3.4 13.3 53.0 30.3
Making learning more personalized for students helps teachers to meet the
academic needs of all students. 6,679 2.3 6.0 49.0 42.8
Access to technology increases opportunities for making learning more
personalized for students. 6,698 4.3 14.8 51.9 29.0
Teachers are able to use technology to meet the academic needs of all
students. 6,703 5.1 17.8 51.6 25.5
Safety and Security
Survey Item Responses Strongly
Disagree (%) Disagree (%) Agree (%)
Strongly
Agree (%)
I feel safe and secure at work. 6,741 6.5 13.5 44.5 35.5
Adults at my school respect each other. 6,741 3.9 11.7 49.7 34.7
Additional behavioral supports are available from our school system for
students who need them. 6,722 15.6 25.5 38.9 20.1
Students at my school respect each other. 6,713 12.7 29.5 47.6 10.2
Discipline policies and procedures are implemented consistently at my school. 6,716 19.6 29.9 35.7 14.8
Bullying is a problem at this school. 6,679 14.9 46.8 28.7 9.6

2020 BCPS Stakeholder Survey
Appendix A – Results by Stakeholder Group
Office of Research 32 June 1, 2020
School Staff (Total Responses = 6,766)
Safety and Security (continued)
Survey Item Responses No (%) Yes (%)
Do you know how to respond during an emergency at work? 6,720 2.7 97.3
Communications
Survey Item Responses Strongly
Disagree (%) Disagree (%) Agree (%)
Strongly
Agree (%)
Communication at my school is open, clear, and timely. 6,730 8.7 22.4 46.8 22.1
Information and results data are available and easily accessible. 6,675 3.5 14.3 56.1 26.1
I am able to share my ideas and opinions with my school leadership. 6,710 6.4 12.6 48.7 32.3
I am provided performance feedback that is useful to me. 6,701 4.9 13.1 52.5 29.5
My school encourages parent/caregiver engagement. 6,692 2.6 7.6 53.8 36.0
Teachers at my school communicate frequently to parents/caregivers about
student progress. 6,684 1.8 6.6 56.1 35.5
Teachers and staff at my school have the opportunity for dialogue and
planning across grades and/or subjects. 6,671 9.4 23.2 46.4 21.0
Survey Item Responses No (%) Yes (%)
Do you have broadband Internet access where you live? 6,706 5.1 94.9
Organizational Effectiveness
Survey Item Responses Strongly
Disagree (%) Disagree (%) Agree (%)
Strongly
Agree (%)
I work in a collaborative, professional work environment. 6,720 3.7 10.4 54.1 31.8
I receive the information I need to perform my job effectively. 6,724 3.8 14.2 54.4 27.6

2020 BCPS Stakeholder Survey
Appendix A – Results by Stakeholder Group
Office of Research 33 June 1, 2020
School Staff (Total Responses = 6,766)
Organizational Effectiveness (continued)
Survey Item Responses Strongly
Disagree (%) Disagree (%) Agree (%)
Strongly
Agree (%)
Professional development offerings are relevant to my work. 6,697 7.0 19.8 50.7 22.5
I have opportunities for professional growth. 6,698 4.2 11.2 56.7 27.9
Overall, school leadership is supportive of my professional growth. 6,717 6.7 14.9 52.4 26.0
Roles and responsibilities within my school are understood. 6,681 3.1 10.7 57.6 28.6
I have the tools, resources and technology to do my job. 6,704 19.2 25.6 41.1 14.2
Students at my school have access to instructional technology needed to
succeed. 6,690 5.0 9.6 48.4 37.0
The workload expected of me is manageable. 6,706 5.8 17.1 49.9 27.2
Survey Item Responses Definitely
Not (%)
Probably
Not (%)
Probably
Yes (%)
Definitely
Yes (%)
Would you send your child to this school or recommend this school to
another parent/caregiver? 6,706 16.8 23.0 34.7 25.6
Would you recommend this school to a friend seeking employment? 6,706 10.1 18.1 38.4 33.3
Survey Item Responses F (%) D (%) C (%) B (%) A (%)
What grade would you give your school for its
performance/effectiveness? 6,730 3.4 10.4 25.3 35.2 25.7
What grade would you give BCPS for its
performance/effectiveness? 6,734 6.6 17.8 37.5 30.3 7.7

2020 BCPS Stakeholder Survey
Appendix A – Results by Stakeholder Group
Office of Research 34 June 1, 2020
School Administrators (Total Responses = 322)
Academics
Survey Item Responses Strongly
Disagree (%) Disagree (%) Agree (%)
Strongly
Agree (%)
BCPS has high expectations for the academic performance of all students. 319 7.2 3.8 48.6 40.4
The academic program in our school system is designed to meet the needs of
all students. 319 10.7 18.2 49.5 21.6
My work contributes to students' college and career readiness. 318 7.5 3.1 41.8 47.5
Adults in our school system believe that all students have the ability to
achieve. 313 7.7 14.4 58.8 19.2
Additional instructional supports from our school system are available to
students who need them. 316 11.1 23.4 47.5 18.0
I have time available during the school day to collaborate with my colleagues
regarding curriculum and instructional practices. 316 9.8 27.2 42.1 20.9
Teachers in my school regularly analyze and use student achievement data in
collaboration with colleagues to adjust instructional practices. 317 6.6 10.1 51.1 32.2
Making learning more personalized for students helps teachers to meet the
academic needs of all students. 318 7.2 4.1 33.0 55.7
Access to technology increases opportunities for making learning more
personalized for students. 318 6.6 9.4 53.5 30.5
Teachers are able to use technology to meet the academic needs of all
students. 318 7.9 19.5 49.4 23.3
Safety and Security
Survey Item Responses Strongly
Disagree (%) Disagree (%) Agree (%)
Strongly
Agree (%)
I feel safe and secure at work. 315 7.6 3.5 36.2 52.7
Adults at my school respect each other. 317 8.2 3.8 50.5 37.5
Additional behavioral supports are available from our school system for
students who need them. 318 19.5 27.7 35.5 17.3
Students at my school respect each other. 318 8.8 7.9 63.2 20.1
Discipline policies and procedures are implemented consistently at my school. 318 7.5 6.0 51.9 34.6
Bullying is a problem at this school. 314 34.7 50.6 11.1 3.5

2020 BCPS Stakeholder Survey
Appendix A – Results by Stakeholder Group
Office of Research 35 June 1, 2020
School Administrators (Total Responses = 322)
Safety and Security (continued)
Survey Item Responses No (%) Yes (%)
Do you know how to respond during an emergency at work? 312 7.1 92.9
Communications
Survey Item Responses Strongly
Disagree (%) Disagree (%) Agree (%)
Strongly
Agree (%)
Communication in our system is open, clear, and timely. 318 8.5 20.4 51.9 19.2
Information and results data are available and easily accessible. 317 8.2 8.8 53.9 29.0
I am able to share my ideas and opinions with school system leadership. 317 10.1 13.2 47.3 29.3
I am provided performance feedback that is useful to me. 319 7.8 92.2
BCPS encourages parent/caregiver engagement. 317 7.6 3.2 50.5 38.8
Teachers at my school communicate frequently to parents/caregivers about
student progress. 317 6.9 6.3 52.1 34.7
Teachers and staff at my school have the opportunity for dialogue and
planning across grades and/or subjects. 319 7.5 10.7 48.0 33.9
Survey Item Responses No (%) Yes (%)
Do you have broadband Internet access where you live? 319 7.8 92.2
Organizational Effectiveness
Survey Item Responses Strongly
Disagree (%) Disagree (%) Agree (%)
Strongly
Agree (%)
I work in a collaborative, professional work environment. 317 8.2 3.2 40.1 48.6
I receive the information I need to perform my job effectively. 314 6.7 7.3 51.9 34.1

2020 BCPS Stakeholder Survey
Appendix A – Results by Stakeholder Group
Office of Research 36 June 1, 2020
School Administrators (Total Responses = 322)
Organizational Effectiveness (continued)
Survey Item Responses Strongly
Disagree (%) Disagree (%) Agree (%)
Strongly
Agree (%)
Professional development offerings are relevant to my work. 314 7.6 13.7 50.3 28.3
I have opportunities for professional growth. 313 7.3 6.1 53.0 33.5
Overall, system leadership is supportive of my professional growth. 309 7.8 9.7 46.0 36.6
Roles and responsibilities within my school are understood. 310 7.1 7.4 46.8 38.7
I have the tools, resources and technology to do my job. 309 16.8 24.6 45.0 13.6
My school has access to instructional technology needed for students to
succeed. 313 7.3 9.3 44.7 38.7
The workload expected of me is manageable. 311 7.7 3.5 44.4 44.4
Survey Item Responses Definitely
Not (%)
Probably
Not (%)
Probably
Yes (%)
Definitely
Yes (%)
Would you send your child to a school in our system or recommend schools
in this system to another parent/caregiver? 312 8.7 9.6 37.2 44.6
Would you recommend our school system to a friend seeking employment? 309 7.1 8.4 36.9 47.6
Survey Item Responses F (%) D (%) C (%) B (%) A (%)
What grade would you give BCPS for its
performance/effectiveness? 315 6.7 5.7 23.2 49.8 14.6

2020 BCPS Stakeholder Survey
Appendix A – Results by Stakeholder Group
Office of Research 37 June 1, 2020
Central Office Staff (Total Responses = 1,437)
Academics
Survey Item Responses Strongly
Disagree (%) Disagree (%) Agree (%)
Strongly
Agree (%)
BCPS has high expectations for the academic performance of all students. 1,421 5.7 11.8 53.5 29.1
The work of my division/department/office contributes to students' college
and career readiness. 1,417 5.2 14.3 45.0 35.6
Access to technology increases opportunities for making learning more
personalized for students. 1,415 4.8 7.9 52.0 35.3
Safety and Security
Survey Item Responses Strongly
Disagree (%) Disagree (%) Agree (%)
Strongly
Agree (%)
I feel safe and secure at work. 1,427 8.3 12.4 48.1 31.2
Individuals at my work location respect each other. 1,422 9.4 15.3 47.7 27.7
Safety procedures are followed at my work location. 1,424 7.0 8.1 49.9 35.1
Survey Item Responses No (%) Yes (%)
Do you know how to respond during an emergency at work? 1,394 8.8 91.2
Communications
Survey Item Responses Strongly
Disagree (%) Disagree (%) Agree (%)
Strongly
Agree (%)
Communication in my division/department/office is open, clear, and timely. 1,426 12.0 18.2 46.3 23.5
I am able to share my ideas and opinions with division/department/office
leadership. 1,426 9.1 11.5 45.9 33.5
I am provided quality feedback that is useful. 1,419 9.7 14.5 48.2 27.6
Survey Item Responses No (%) Yes (%)
Do you have broadband Internet access where you live? 1,359 10.6 89.4

2020 BCPS Stakeholder Survey
Appendix A – Results by Stakeholder Group
Office of Research 38 June 1, 2020
Central Office Staff (Total Responses = 1,437)
Organizational Effectiveness
Survey Item Responses Strongly
Disagree (%) Disagree (%) Agree (%)
Strongly
Agree (%)
I work in a collaborative, professional work environment. 1,423 8.4 12.0 50.5 29.1
My job is important to this organization. 1,425 2.9 4.8 39.8 52.5
My professional performance is assessed objectively in my
division/department/office. 1,414 5.9 11.0 49.9 33.2
Professional development offerings are relevant to my work. 1,421 6.5 15.3 50.7 27.4
I have opportunities for professional growth. 1,417 7.8 16.5 47.7 28.0
Overall, system leadership is supportive of my professional growth. 1,411 8.7 14.2 48.3 28.8
Roles and responsibilities within my division/department/office are
understood. 1,426 8.4 17.5 47.8 26.2
My division/department/office leadership has done a good job of translating
the organization’s objectives into meaningful assignments for their
employees.
1,417 9.5 16.4 46.7 27.5
I have the tools, resources and technology to do my job. 1,417 6.9 12.5 50.0 30.6
The workload expected of me is manageable. 1,416 9.3 16.5 53.2 21.0
I am provided the opportunity to apply my skills and abilities in my current
job. 1,415 5.7 8.3 52.0 34.1
Survey Item Responses Definitely
Not (%)
Probably
Not (%)
Probably
Yes (%)
Definitely
Yes (%)
Would you send your child to a school in our system or recommend schools
in this system to another parent/caregiver? 1,415 9.4 15.6 44.9 30.1
Would you recommend your division/department/office to someone seeking
employment? 1,421 9.9 13.7 39.4 37.0
Survey Item Responses F (%) D (%) C (%) B (%) A (%)
What grade would you give your division/department/office for
its performance/effectiveness? 1,426 6.9 6.8 18.0 35.6 32.7
What grade would you give BCPS for its
performance/effectiveness? 1,421 7.0 11.3 29.4 38.2 14.0
2020 BCPS Stakeholder Survey
Appendix B – Student Participation Rate and Parent Participation by School
Office of Research 39 June 1, 2020
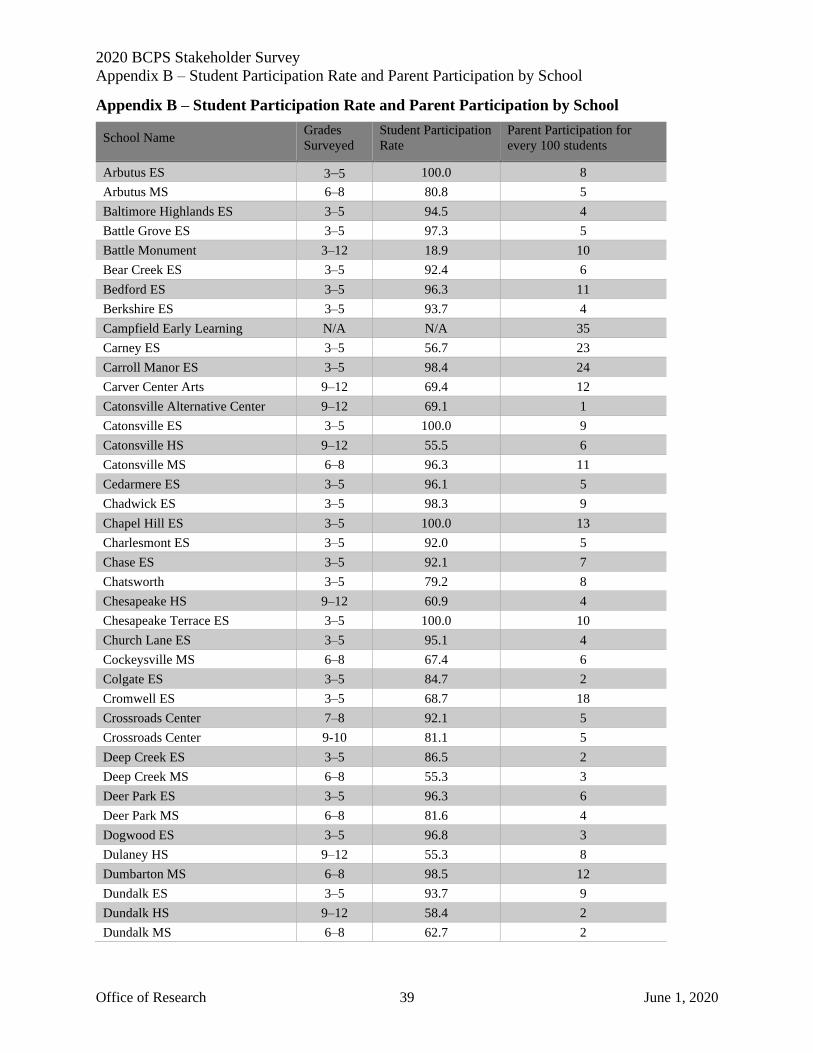
Appendix B – Student Participation Rate and Parent Participation by School
School Name Grades
Surveyed
Student Participation
Rate
Parent Participation for
every 100 students
Arbutus ES 3–5 100.0 8
Arbutus MS 6–8 80.8 5
Baltimore Highlands ES 3–5 94.5 4
Battle Grove ES 3–5 97.3 5
Battle Monument 3–12 18.9 10
Bear Creek ES 3–5 92.4 6
Bedford ES 3–5 96.3 11
Berkshire ES 3–5 93.7 4
Campfield Early Learning N/A N/A 35
Carney ES 3–5 56.7 23
Carroll Manor ES 3–5 98.4 24
Carver Center Arts 9–12 69.4 12
Catonsville Alternative Center 9–12 69.1 1
Catonsville ES 3–5 100.0 9
Catonsville HS 9–12 55.5 6
Catonsville MS 6–8 96.3 11
Cedarmere ES 3–5 96.1 5
Chadwick ES 3–5 98.3 9
Chapel Hill ES 3–5 100.0 13
Charlesmont ES 3–5 92.0 5
Chase ES 3–5 92.1 7
Chatsworth 3–5 79.2 8
Chesapeake HS 9–12 60.9 4
Chesapeake Terrace ES 3–5 100.0 10
Church Lane ES 3–5 95.1 4
Cockeysville MS 6–8 67.4 6
Colgate ES 3–5 84.7 2
Cromwell ES 3–5 68.7 18
Crossroads Center 7–8 92.1 5
Crossroads Center 9-10 81.1 5
Deep Creek ES 3–5 86.5 2
Deep Creek MS 6–8 55.3 3
Deer Park ES 3–5 96.3 6
Deer Park MS 6–8 81.6 4
Dogwood ES 3–5 96.8 3
Dulaney HS 9–12 55.3 8
Dumbarton MS 6–8 98.5 12
Dundalk ES 3–5 93.7 9
Dundalk HS 9–12 58.4 2
Dundalk MS 6–8 62.7 2

2020 BCPS Stakeholder Survey
Appendix B – Student Participation Rate and Parent Participation by School
Office of Research 40 June 1, 2020
School Name Grades
Surveyed
Student Participation
Rate
Parent Participation for
every 100 students
Eastern Tech HS 9–12 89.9 12
Edgemere ES 3–5 100.0 27
Edmondson Heights ES 3–5 87.4 7
Elmwood ES 3–5 100.0 2
Essex ES 3–5 93.5 5
Featherbed Lane ES 3–5 82.6 4
Fifth District ES 3–5 91.9 12
Fort Garrison ES 3–5 91.2 11
Franklin ES 3–5 88.5 10
Franklin HS 9–12 88.4 4
Franklin MS 6–8 69.2 5
Fullerton ES 3–5 79.1 9
General John Stricker MS 6–8 68.3 5
Glenmar ES 3–5 92.5 5
Glyndon ES 3–5 100.0 6
Golden Ring MS 6–8 68.3 5
Grange ES 3–5 74.1 5
Gunpowder ES 3–5 96.8 13
Halethorpe ES 3–5 100.0 8
Halstead Academy 3–5 81.6 7
Hampton ES 3–5 95.8 17
Harford Hills ES 3–5 97.2 9
Hawthorne ES 3–5 72.8 4
Hebbville ES 3–5 93.7 5
Hereford HS 9–12 69.6 8
Hereford MS 6–8 93.1 11
Hernwood ES 3–5 84.9 4
Hillcrest ES 3–5 100.0 13
Holabird MS 4–5 23.0 3
Holabird MS 6–8 32.9 3
Honeygo ES 3–5 100.0 14
Jacksonville ES 3–5 100.0 13
Johnnycake ES 3–5 90.9 4
Joppa View ES 3–5 97.6 9
Kenwood HS 9–12 33.3 4
Kingsville ES 3–5 100.0 21
Lansdowne ES 3–5 90.5 4
Lansdowne HS 9–12 75.7 5
Lansdowne MS 6–8 100.0 3
Loch Raven Academy 6–8 81.0 6
Loch Raven HS 9–12 59.0 10
Logan ES 3–5 94.0 2

2020 BCPS Stakeholder Survey
Appendix B – Student Participation Rate and Parent Participation by School
Office of Research 41 June 1, 2020
School Name Grades
Surveyed
Student Participation
Rate
Parent Participation for
every 100 students
Lutherville Lab 3–5 94.7 26
Lyons Mill ES 3–5 77.4 6
Maiden Choice 3-12 3.8 4
Mars Estates ES 3–5 81.0 2
Martin Blvd ES 3–5 98.7 7
Mays Chapel ES 3–5 96.7 12
McCormick ES 3–5 84.2 4
Meadowood Center 6–8 53.1 0
Middle River MS 6–8 79.5 2
Middleborough ES 3–5 99.4 8
Middlesex ES 3–5 93.3 10
Milbrook ES 3–5 100.0 3
Milford Mill Academy 9–12 70.1 3
New Town ES 3–5 87.0 8
New Town HS 9–12 40.5 5
NW Academy of Health Sciences 6–8 75.6 4
Norwood ES 3 100.0 9
Oakleigh ES 3–5 69.6 5
Oliver Beach ES 3–5 96.6 8
Orems ES 3–5 90.4 5
Overlea HS 9–12 57.6 3
Owings Mills ES 3–5 89.3 7
Owings Mills HS 9–12 65.9 3
Padonia International ES 3–5 89.5 24
Parkville HS 9–12 34.9 3
Parkville MS 6–8 73.1 6
Patapsco HS 9–12 30.3 4
Perry Hall ES 3–5 100.0 11
Perry Hall HS 9–12 66.1 6
Perry Hall MS 6–8 79.8 10
Pikesville HS 9–12 78.7 6
Pikesville MS 6–8 64.5 5
Pine Grove ES 3–5 98.9 11
Pine Grove MS 6–8 87.3 10
Pinewood ES 3–5 93.4 20
Pleasant Plains ES 3–5 84.3 9
Pot Spring ES 3–5 97.2 10
Powhatan ES 3–5 93.9 9
Prettyboy ES 3–5 91.9 15
Randallstown ES 3–5 83.5 5
Randallstown HS 9–12 68.2 4
Red House Run ES 3–5 96.5 7

2020 BCPS Stakeholder Survey
Appendix B – Student Participation Rate and Parent Participation by School
Office of Research 42 June 1, 2020
School Name Grades
Surveyed
Student Participation
Rate
Parent Participation for
every 100 students
Reisterstown ES 3–5 86.7 5
Relay ES 3–5 98.4 8
Riderwood ES 3–5 67.4 14
Ridge Ruxton 3-12 22.2 6
Ridgely MS 6–8 92.7 14
Riverview ES 3–5 87.0 3
Rodgers Forge ES 3–5 100.0 33
Rosedale Center 6–8 42.9 2
Rosedale Center 9–12 32.1 2
Sandalwood ES 3–5 95.8 2
Sandy Plains ES 3–5 82.6 2
Scotts Branch ES 3–5 100.0 5
Seneca ES 3–5 100.0 9
Seven Oaks ES 3–5 77.9 17
Seventh District ES 3–5 100.0 13
Shady Spring ES 3–5 89.2 5
Sollers Point HS 9–12 54.9 1
Southwest Academy 6–8 80.0 3
Sparks ES 3–5 98.2 13
Sparrows Point HS 9–12 59.0 6
Sparrows Point MS 6–8 56.7 7
Stemmers Run MS 6–8 85.3 3
Stoneleigh ES 3–5 97.8 15
Sudbrook MS 6–8 83.9 8
Summit Park ES 3–5 97.8 15
Sussex ES 3–5 88.0 3
Timber Grove ES 3–5 89.5 4
Timonium ES 3–5 97.0 18
Towson HS 9–12 64.8 9
Victory Villa ES 3–5 77.8 4
Villa Cresta ES 3–5 95.8 11
Vincent Farm ES 3–5 90.9 12
Warren ES 3–5 95.7 10
Watershed Public Charter 3–5 90.3 29
Wellwood International 3–5 88.7 12
West Towson ES 3–5 100.0 16
Westchester ES 3–5 91.7 13
Western HS 9–12 93.3 9
Westowne ES 3–5 83.0 9
White Oak 3–5 76.7 4
Winand ES 3–5 98.2 8
Windsor Mill MS 6–8 56.0 5

2020 BCPS Stakeholder Survey
Appendix B – Student Participation Rate and Parent Participation by School
Office of Research 43 June 1, 2020
School Name Grades
Surveyed
Student Participation
Rate
Parent Participation for
every 100 students
Winfield ES 3–5 89.3 4
Woodbridge ES 3–5 100.0 15
Woodholme ES 3–5 81.2 4
Woodlawn HS 9–12 47.6 3
Woodlawn MS 6–8 88.9 5
Woodmoor ES 3–5 84.4 4