report on portuguese environmental economic instruments 2010 e... · until the end of the former...
TRANSCRIPT

Report on Portuguese EnvironmentalEconomic Instruments
2010
Tiago Souza d’Alte

Report on Portuguese Environmental
Economic Instruments
2010
Tiago Souza d’AlteLisbon, April 2011

Title
Edition
Author
Design
Printing
Legal Deposit
ISBN
Print run
Edtion date
Report on Portuguese EnvironmentalEconomic Instruments 2010
APA (Portuguese Environment Agency)
Tiago Souza d’Alte
rpvpdesigners.com
Rolo & Filhos II
329961/11
978-972-8577-56-8
1000
May 2011

0.
1.
2.
3.
0.
1.
2.
3.
4.
0.
1.
2.
Table of Contents
Foreword 5
AcronymsandAbbreviations 7
Summary 9
Economics of Water 11
Synthesis 13
WaterTaxation 15
Water Resources Tax 15
Water Quality Tax 24
Water and Wastewater Services’ Regulation Charge 26
PublicInvestmentFunds 29
Water Protection Fund 29
WaterandWastewaterServices’TariffsRegulation 33
Carbon and Energy Finance 39
Synthesis 41
CarbonTrade 43
Portuguese Carbon Fund 43
VehicleTaxation 45
Motor Vehicle Tax 45
Single Road Tax 48
EnergyTaxation 51
Petroleum and Energy Products Tax 51
Low Efficiency Light Bulbs Tax 53
PublicInvestmentFunds 55
Permanent Forest Fund 55
Economics of Waste and By-Product 57
Synthesis 59
WasteTrade 61
Organized Waste Market 61
WasteTaxation 63
Waste Management Tax 63
Waste Services’ Regulation Charge 65
Sirapa Charge 67
Waste Border Movements Charge 68
Waste Permits Charges 69

3.
4.
0.
1.
2.
3.
Eco-value 71
UrbanWasteServices’TariffsRegulation 85
Economics of Nature Conservation and Biodiversity 89
Synthesis 91
PrivateInvestment 93
Public-private investment partnerships in Biodiversity 93
Environmental Compensation 94
PublicInvestmentFunds 97
Nature Conservation and Biodiversity Fund 97
Environmental Intervention Fund 98
Agro-environmentalIncentives 101
Foreword
Environmental Fiscal Reform in Portugal is an important issue in this difficult time.
This is an opportunity to reflect on the strong relationship between our economic goals and the delicate environmental balance we pursue.
An important part of the environmental financial policy of the last years took the form of subsidies or tax exemptions on goods that contribute to environmental improvement (eg solar panels).
To persist in using only these environmental financial instruments is extremely difficult: they tend to increase both consumption and the fiscal and external deficits, albeit added environmental and economic gains are marginally smaller and smaller. We must therefore adopt solutions that both promote more ambitious environmental goals and claim a positive contribution to the improvement of the external and fiscal balances – the double dividend.
This huge challenge has already been taken since 2006. Since then several environmental taxes were created, that are altogether an important part of the Portuguese total tax collection revenues. These are taxes due and calculated on an environmental basis; in particular, it is the case of Motor Vehicle Tax, Single Road Tax, Low Efficiency Light Bulbs Tax, Water Resources Tax, Waste Management Tax and Water Quality Tax. The results are quite striking: in Portugal, the revenues from environmentally related taxes in 2008 accounted for 2.6% of GDP and 8% of total tax receipts – well above OECD’s average.
It is now important to extend this movement to other ecological and environmental services, in particular in what regards biodiversity. We must also expand the environmental dimension in indirect and consumption taxation.
Therefore, it comes as no surprise that Portugal’s Stability and Growth Plan 2010-13 foresees several environmental measures:
• introducing a fiscal incentive for purchases of electric vehicles by businesses, while discouraging purchases of conventional fuel-powered vehicles and the provision of such vehicles as benefit-in-kind to employees;
• extending tax credits for the purchase of energy efficient equipment;• revising the vehicle registration tax by annually reducing the CO2 emission categories by 5g/km, so as to
maintain the revenue-raising ability of the tax and better link it to development of the car market; • elimination of tax expenditure related to excise duties on energy products, linking fiscal benefits and
exemptions to more rigorous environmental criteria;• rationalisation of tax expenditure related to vehicle taxes, linking fiscal benefits and exemptions to more
rigorous environmental criteria. On the other hand, some important advances are to be registered as well in the field of environmental public expenditure. Full compliance with polluter pays and user pays principles led to the creation of several environmental funds.
Environmental funds were established to enable a harmonious environmental and financial management. Initially functioning as a vehicle for the polluter pays and user pays principles, they ensure that revenues from environmental taxes are converted into environmental expenditure.

6
Foreword
Moreover, the environmental funds enable resetting public environmental financial decision from short term goals to projects that envisage a longer period of time, consistent with sustainable development concerns.
Also, environmental funds reflects more strongly the results of the deep reflection on the dimension and forms of action of the State, creating solutions of greater economical, administrative and environmental rationality meaning the State is able to cooperate with private sector and to adopt private law solutions. This is what happens with the creation of public funds for the purpose of direct intervention in market or management of environmental compensation regimes.
The first fund created in Portugal was the Permanent Forest Fund. It was later followed by the Portuguese Carbon Fund. More recently, the establishment of the Environmental Intervention Fund, the Water Protection Fund and the Nature and Biodiversity Conservation Fund ensures a full applicability of polluter pays and user pays principles.
Another challenge for the coming years will be, of course, to implement the double dividend on the expenditure side. That implies, on the long-term, abandoning earmarked revenues and shift the basis of the State finance from income taxes to environmental taxes.
There will always be more than budget and financial objectives at stake: safeguarding a country’s natural resources legacy is decisive for our future wellbeing and for the future of our planet.
The book that is now in our hands, in its first edition, intends to report in a factual and systematic performance the new mechanisms of environmental policy financial indispensable tool to understand these instruments and to conduct an assessment of their own sustainable development.
In matters of competence of Portuguese Environmental Agency (APA), much has been done, particularly in the waste areas, but also in the Environmental Impact Assessment (EIA), Risk Analysis, Accident Policy (PAG) and Environmental Safety of the Population, Environmental Permit (EP), European Trade Emissions Trading Scheme (EU ETS), among others. It is now important to assess, consolidate and improve existing financial and environmental mechanisms.
The Integrated System of Registration of the Portuguese Environmental Agency (SIRAPA), the National System of Environmental Information (SNIAmb) and CIRCA (for processes EIA, EP and concourse of the consignment of TGR – Rate Waste Management), have been the main focus of the APA in the dematerialization of registration procedures (which began with the waste) and the availability of current and spatial information, allowing communication between APA and its customers and partner organizations (national and international), optimizing and rationalizing the collection procedures, evaluation and communication of information on reliable environment, which allows one to support decision-making processes and the development and implementation of policies and strategies relating to the environment and their integration into sectorial and financial policies. Here too, considering that the tools are in wide deployment, it is crucial to adapt the growing environmental and financial instruments to reality.
Mário Grácio,Director-General – APA (Portuguese Environment Agency)

Acronyms and Abbreviations
National Forest Authority (Autoridade Florestal Nacional)
Portuguese Environment Agency (Agência Portuguesa do Ambiente)
River Basin District Administration for North (Administração de Região Hidrográfica do Norte)
River Basin District Administration for Centre (Administração de Região Hidrográfica do Centro)
River Basin District Administration for Tejo (Administração de Região Hidrográfica do Tejo)
River Basin District Administration for Alentejo (Administração de Região Hidrográfica do Alentejo)
River Basin District Administration for Algarve (Administração de Região Hidrográfica do Algarve)
Regional Co-ordination and Development Committee for North (Comissão de Coordenação
e Desenvolvimento Regional do Norte)
Regional Co-ordination and Development Committee for Centre (Comissão de Coordenação
e Desenvolvimento Regional do Centro)
Regional Co-ordination and Development Committee for Lisbon and Tejo Basin (Comissão de
Coordenação e Desenvolvimento Regional de Lisboa e Vale do Tejo)
Regional Co-ordination and Development Committee for Alentejo (Comissão de Coordenação
e Desenvolvimento Regional do Alentejo)
Regional Co-ordination and Development Committee for Algarve (Comissão de Coordenação
e Desenvolvimento Regional do Algarve)
Climate Change Commission’s Executive Committee (Comité Executivo da Comissão para as
Alterações Climáticas)
Integrated centers for recovery, recycling and disposal of hazardous waste (Centros integrados de
recuperação, valorização e eliminação de resíduos perigosos)
City Council (Câmara Municipal)
Carbon Dioxide
Directorate-General for Customs and Special Consumption Taxes (Direcção-Geral das Alfandegas
e dos Impostos Especiais do Consumo)
Directorate-General for Taxes (Direcção-Geral dos Impostos)
Directorate-General for Energy and Geology (Direcção-Geral de Energia e Geologia)
Directorate-General for Treasury and Finance (Direcção-Geral do Tesouro e Finanças)
Regulatory Authority for Water and Waste Services (Entidade Reguladora dos Serviços de Águas
e Resíduos)
Nature and Biodiversity Conservation Fund (Fundo de Conservação da Natureza e Biodiversidade)
Permanent Forest Fund (Fundo Florestal Permanente)
Environmental Intervention Fund (Fundo de Intervenção Ambiental)
Portuguese Carbon Fund (Fundo Português de Carbono)
Water Protection Fund (Fundo de Protecção de Recursos Hídricos)
Nature and Biodiversity Conservation Institute (Instituto da Conservação da Natureza
e Biodiversidade, IP)
AFN
APA
ARHNorte
ARHCentro
ARHTejo
ARHAlentejo
ARHAlgarve
CCDRNorte
CCDRCentro
CCDRLVT
CCDRAlentejo
CCDRAlgarve
CECAC
CIRVER
CM
CO2
DGAIEC
DGCI
DGEG
DGTF
ERSAR
FCNB
FFP
FIA
FPC
FPRH
ICNB

8
Agriculture and Fisheries Finance Institute (Instituto de Financiamento da Agricultura e Pescas, IP)
Environment and Land Use Inspection General (Inspecção-Geral do Ambiente e do Ordenamento
do Território)
Water Institute (Instituto da Água, IP)
Water and Waste Services Regulatory Institute (Instituto Regulador dos Serviços de Águas e
Resíduos, IP)
Petroleum and Energy Products Tax (Imposto Sobre Produtos Petrolíferos e Energéticos)
Motor Vehicle Tax (Imposto Sobre Veículos)
Single Road Tax (Imposto Único de Circulação)
Waste Organized Market (Mercado Organizado de Resíduos)
Construction and demolition waste (Resíduos de construção e demolição)
Electric and electronic equipment waste (Resíduos de equipamentos eléctricos e electrónicos)
Urban waste (Resíduos urbanos)
Local Tax Administration (Serviço local de finanças)
Waste Management Tax (Taxa de Gestão de Resíduos)
Low efficiency light bulbs tax (Taxa sobre Lâmpadas de Baixa Eficiência Energética)
Water Quality Tax (Taxa de Qualidade da Água)
Water Resources Tax (Taxa de Recursos Hídricos)
IFAP
IGAOT
INAG
IRAR
ISP
ISV
IUC
MOR
RCD
REEE
RU
SLF
TGR
TLBEE
TQA
TRH
Acronyms and abbreviations

Summary
The use of economic instruments in environmental policies is a phenomenon with already some tradition in many countries that share the same experience with Portugal. Among us it is still a rather new solution, but nonetheless there is no doubt that it is an essential tool for the achievement of environmental goals.
Until the end of the former century the pursuit of environmental policies in Portugal neglected the contribution of economic instruments, which were limited to some minor tax regimes. None of the Portuguese taxes could be considered as strict environmental taxes, even though some undeniably produced some behaviour modifications towards more environmental friendly options – such were the case of Automobile Tax, Petroleum and Energy Products Tax, or some tax benefits concerning Income Taxes. And albeit the Environment Base Law (Law 11/87) established that charges should be levied on the use of natural resources, only in 1994 such legislation was approved for water resources – and it was never duly applied.
However, in the past decade Portugal has redesigned its environmental policy giving economic instruments a far more important role than before.
First of all, a most significant transformation has been in course in the Portuguese tax system. There are now several environmental taxes – taxes due and calculated on an environmental basis – that are altogether an important part of the Portuguese total tax collection revenues. In particular, it is the case of Motor Vehicle Tax, Single Road Tax, Low Efficiency Light Bulbs Tax, Water Resources Tax, Waste Management Tax and Water Quality Tax. Also, some other specific tax regimes with environmental purposes were created, namely the car scrappage program and the bio fuels framework.
On the other hand, some important advances are to be registered as well in the field of environmental public expenditure. Full compliance with polluter pays and user pays principles led to the creation of several environmental funds. These funds have been given the tasks of administrating some environmental taxes collection revenues and financing environmental recuperation projects. And later environmental funds were created with the purpose of resettling public expenditure decision from a short-term logic to sustainable development concerns, being given important financial means.
One of the indisputable merits of these mechanisms is that their behaviour can be evaluated quantitatively and the analysis of its performance is objective. Despite we still find ourselves at the start of its operation, there is already a sufficient history of activity that justifies the collection of quantitative evidence that may reveal what is their degree of effective implementation and tangible its results are – in other words, if they have produced the desired environmental effects.

10
This publication provides a factual and systematic report on the performance of these mechanisms. In addition, it contains a succinct explanation of its operation, financial reporting and operational environment of their institutionalization. The general public, academia, public services and the majority of policy makers thus have at their disposal a means to better understand these instruments and to consider with solid foundation its own evolution.
Tiago Souza d’alTe
April 2011
Summary

Economics of Water
0. Synthesis 13
1. Water Taxation 15
Water Resources Tax 15
Water Quality Tax 24
Water and Wastewater Services’ Regulation Charge 26
2. Public Investment Funds 29
Water Protection Fund 29
3. Water and Wastewater Services’ Tariffs Regulation 33


Report on Portuguese Environmental Economic Instruments 2010
13
0. Synthesis
Presently, the existing economic instruments in the water sector are essentially of public nature. Indeed, there are no relevant voluntary markets for the use of water resources, so behaviors related to water are usually driven by stimuli that emanate from the State.
There are several taxes that seek to implement the polluter pays and user pays principles; Particularly important in this context is the Water Resources Tax (Taxa de Recursos Hídricos – TRH).
As the effective collection of TRH started only recently, is still too early to assess what its actual impact on the preservation and improvement of water resources. Only a longer period will allow an accurate measure of the trends in use of water resources and of the impact produced by the TRH on the choices of the users. However, some provisional observations can already be made.
Perhaps the most important one is that the numbers of the revenue collection evidence TRH as a tribute with asymmetric contours. This asymmetry should be carefully analyzed, discerning those cases in which it is an intrinsic and neutral feature of the tax from the others in which it is a symptom of maladjustment of its structure to realities and is therefore a source of environmental distortions.
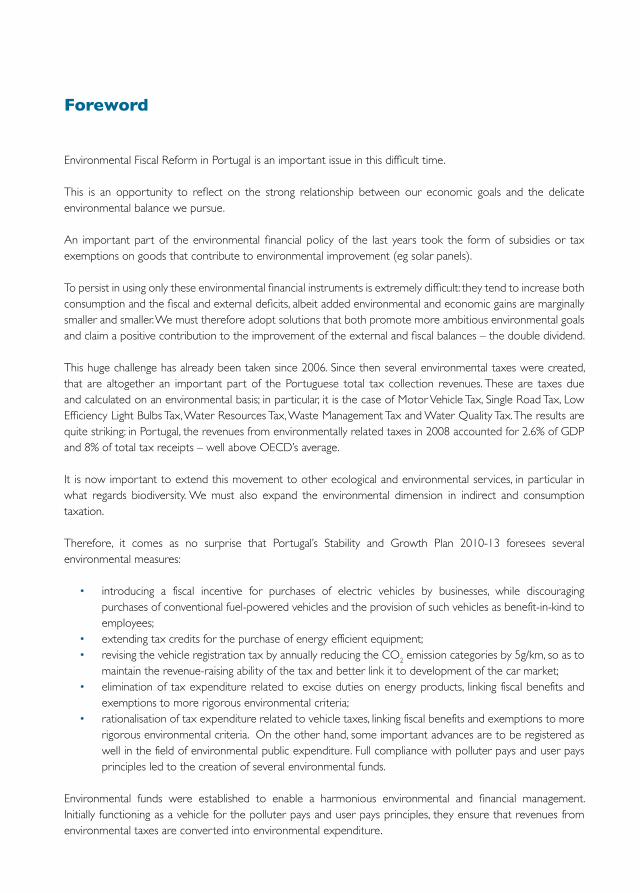
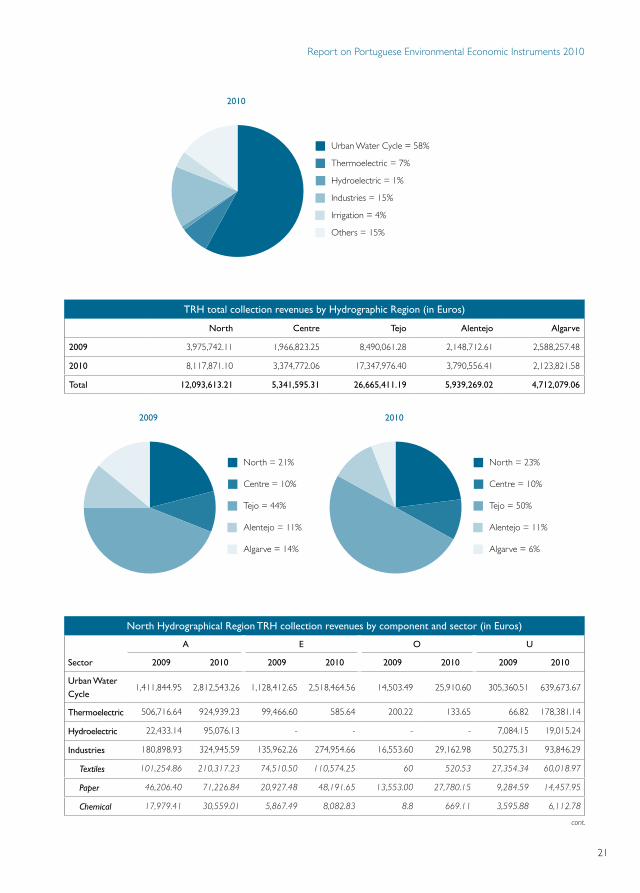
The clear asymmetry detected in the geographical distribution of income (the Hydrographic Regions of the Tejo and North are jointly responsible for nearly three quarters of total revenues, albeit contributing parts of the Centre, Alentejo and Algarve mount up only to one quarter) was to be expected, given the different abundance of the resource in each region. But some thought must be put in the asymmetry detected in the amount collected by each of the various components of TRH (abstraction and effluents components together account for four fifths of revenue; but aggregates, occupation and general management mount up to less than one fifth). And the division of the tax burden of TRH among the various economic sectors definitely needs some rethinking, should the trend be confirmed in the coming years, as the Urban Water Cycle bears almost 60% of total TRH revenues, while Irrigation contributes with less than 5% – hardly justifiable, considering that human consumption is the noblest and more economically relevant use given to water and irrigation is the sector that consumes more water in Portugal.
The still early enforcement of the TRH determined that only in 2010 has commenced the activity of FPRH. Only this year started its operation, with the approval of its Regulation of Management, but the significant volume of financial resources being allocated to the Fund predicts that this instrument will configure itself as one of the most dynamic and fruitful of the Economics of Water.
Finally, mention should be made to the tariffs in the sector of water supply services.

14
The industry itself is highly fragmented and it is known that the tariffs in general are not a guarantee of financial sustainability of services. Another conclusion cannot be drawn when in over 60 municipalities sanitation services are provided free of charge and while most municipalities’ practical values are below or far below the average national rates.
Moreover, it is suspected that in most services the tariffs do not allow full cost recovery; so, water consumption is probably provided with hidden subsidies, which tends to aggravate the problems of overexploitation of the resource. This hypothesis will be confirmed or denied in the coming years, with the expansion of ERSAR’s regulatory powers.
Rates are therefore marked by a large gap, coexisting cases of inexistence of tariffs with others of very high tariffs. This is a situation to be reviewed, to ensure the financial sustainability of these activities and to end the discrepancy with the existing legal framework, as the Water Law (Law No. 58/2005 of 29 December) and the Economic and Financial Regime for Water Resources (Decree-Law No. 97/2008 of June 11), determine that the system of tariffs for water services must ensure the recovery of the initial investment and new investment expansion, modernization and replacement of infrastructure, ensure the maintenance, repair and renovation of all goods and equipment allocated to services as well as payment of all compulsory charges that may be involved, and ensure the effectiveness of services.
Economics of Water

Report on Portuguese Environmental Economic Instruments 2010
15
1. Water Taxation
Water Resources Tax
DescriptionThe Economic and Financial Water Resources Management Regime (approved by Decree-Law 97/2008) created the Water Resources Tax (Taxa de Recursos Hídricos – TRH), which is a key instrument of national policy for water, in accordance with Water Law (Law 58/2005, which implemented the Directive 2000/60/CE of the European Parliament and the Council of 23 October).
TRH=A+E+I+O+U
A=Vbase.m3.SC
The abstraction of public water for private uses, and it is calculated by multiplying the base value of the respective use by the volume of water drawn, diverted or used expressed in cubic meters, and by the applicable shortage coefficient
E=Vbase.kgThe direct or indirect discharge of effluents on water resources which may cause significant impact, and it is calculated by multiplying the base value of the effluent to the quantity of toxicity or pollution loads contained in the discharge, expressed in kilograms
I=Vbase.m3
The aggregate extraction of public water resources, calculated by multiplying the base value to the volume of aggregate extracted, expressed in cubic meters
O=Vbase.m2
The land occupation of the public water resources and/or the occupation and creation of water plans, and it is calculated by multiplying the base value of the respective use by the occupied area, expressed in squared meters
U=Vbase.m3
The private use of water, whatever its nature or statutory regime, subject to planning and public management, which may cause significant impact; it is calculated by multiplying the base value of the respective use to the volume of water drawn, diverted or used, expressed in cubic meters
TRH implements the basic idea that the private user of water resources must compensate the cost generated to the community and/or restore the benefit’s extent that the community grants (polluter pays and user pays principles). Apart from collecting funds for public environmental purposes, TRH has a clear intention of guiding private users´ (1) towards a more efficient water usage and (2) to prefer water usage in activities of more economic worth. Accordingly, it sets off: (1) the advantage resulting from the public water private use, (2) the environmental costs related to the activities likely to cause a significant impact on water resources, and (3) the administrative costs regarding planning, management, supervision and water quality and quantity surety.
TaxstructureThe TRH is due on a yearly basis, and the debtor entity is the private user of water resources.

16
Economics of Water
The components have various differences, corresponding to: (1) the different contribution that each economic sector should be required to provide for water resources sustainable management, (2) the varied shortage of water resources in different parts of the territory; (3) concerns with user groups on a more social and economic distress.
BaseValues2009-2010(inEuros)
AeUAgriculture, fish farming, aquaculture, marine and biogenetic cultures 0.003Hydric energy production 0.00002Thermal energy production 0.0027Public water supply systems 0.013Other cases 0.015Minho. Lima. Cávado. Ave. Leça e Douro 1Vouga. Mondego. Lis. ribeiras do oeste e Tejo 1.1Sado. Mira. Guadiana e Ribeiras do Algarve 1.2
EOxidizable Matter (kg): (COD + 2.CBO5)/3 (COD = chemical oxygen demand BOD5 = biochemical oxygen demand) 0.3Total nitrogen (kg) 0.13Total phosphorus (kg) 0.16
I
250/m3
OElectric power production and fish farming equipment located in the sea and water plans creation 0.002Agriculture, fish farming, aquaculture, marine biogenetic crops, infrastructure and support equipment to traditional fisheries, sanitation, public water supply and electricity generation 0.05Farms, fisheries, aquaculture, marine and biogenetic cultures occupying an higher area than 1 acre in the portion of thecorresponding excess 0.025Industry 1.5 ≥ 2Residential/dwellings 3.75 ≥ 5Temporary beach constructions and casual occupations of commercial, tourist or recreational nature for profit purposes 5 ≥ 7,5Permanent beach constructions and lasting occupations of commercial, tourist or recreational nature for profit purposes 7.5 ≥ 10Other cases 1
The taxable rate of TRH is determined on the basis of self-regulating and constant measuring of the values estimated by users (effective use) or, failing that, by the maximum values constant of the use titles issued by the ARH, as all water resources uses must be titled. In case of impossibility of direct liability of the taxable base resulting from the lack of evidence of use or breach of its terms, the water resources rate settlement is officiously done by indirect methods, in order to proceed to the estimate of the components that make up its taxable base using the elements of fact and law that ARH has at its disposal, including users indicators in activity sector and employing similar production methods.
The result of the tax collection regarding TRH is exclusively a source of revenue of the competent public entities in matters of water resources: it reverts by 50% to the FPRH, 40% for the ARH

Report on Portuguese Environmental Economic Instruments 2010
17
incumbent on the respective settlement and 10% for the INAG. Moreover, the annual revenue is consigned to activities and projects regarding water resources recuperation and preservation.
ValuesBase values have remained unchanged since the TRH began being levied.
This value is based on a minimum price of reference when the concession of the marine aggregate extraction is done through tender procedure or where aggregates extraction is encouraged by the initiative of the ARH and held on its behalf. In order to determine the volume of aggregate extracted, it is considered as factor of conversion volume/mass of dry sand the value of 1.6 ton/m3. Component I shows a downward trend for collection which can be explained due to the fact that the aggregate extraction on water resources – in particular in rivers – a practice being prohibited to the commercial activity as from 2007 (with the entry into force of the Water Resources Utilization Regime – Decree-Law 226-A/2007), is only possible under the public authorities initiative and for environment adjustments purposes.
Reductions2009-2010
Generic
Good use of irrigation projects or developments of multi-purpose of predominantly hydro agriculture nature Coefficient of efficiency of 0,60
Industrial users whose water drawing exceeds the annual volume of 2 000 000 m3, and in what accounts the portion of the excess, whenever they are under activity in July 2008 and prove that they have achieved a significant reduction in water use over the five years prior to that date or have investment plan to ensure that within five years (under special permission of the Minister of Environment)
50% of components A
and U
Industrial users whose water drawing exceeds the annual volume of 2 000 000 m3, whenever they are under activity in July 2008 to prove that they have achieved a significant reduction in the rejection of effluent over the five years prior to that date or hold an investment plan that is supposed to ensure it within five years (under special permission of the Minister of Environment)
50% of component E
Bycomponents
AandU
Water for hydroelectric power production in hydro area with a maximum drop of only up to 10 m 50%
Pumping water to hydro electric energy production that use reversible groups advantages of hydroelectric energy groups 80%
Sea water use in cooling circuits for thermal energy production and other forms of thermal regulation, such as industrial cooling and regasification of liquefied natural gas
90%
Thermal regulation of agricultural crops 90%
Very small uses, namely when the power of extraction equipment does not exceed 5 hp Exempt
Uses resulting from security reasons of supply or other national strategic reasons Exempt
E
Effluents discharges into the aquatic environment when the quality of water abstracted is justified (under special permission of the Minister of Environment)
Up to 20%
Industrial installations covered by the IPPC regime, which demonstrate best practices and techniques available 35%
cont.

18
Reductions2009-2010
Effluents discharges into the sea via outfall, if properly treated 35%
Effluents discharges carried out by sanitations structures of urban wastewater 50%
Discharges derived from isolated dwellings with their own solutions to wastewater treatment Exempt
Discharges from urban areas with size up to 200 inhabitants, as long as the respective wastewaters do not contain untreated industrial effluents
Exempt
O
Exemptions:The land or water plans occupation where are established infrastructure or support equipment to existing traditional fishing activities in 2008;The land occupation of by self and permanent households taxpayers whose household taxable income derives gross income for income taxable purposes not exceeding twice the annual amount of the monthly minimum wage, when that occupation already exists since 2008;The land occupation or water plans for infrastructure and equipment used in pilot projects designed to research and testing of technologies related with power energy production from sea waves, under the permission of members of the Government responsible for environment and energy;The land occupation or water plans for infrastructure and equipment designed for signalling and Marine rescue, public safety as well as to prevent and fight marine pollution; The land occupation by roads, railways and other means of public communication;The land occupation made by the water levels of hydro plants, hydro agriculture or supply for human or industrial consumption whenever the water use contained in their reservoirs is intended for public use or public interest purposes.
Collection of the TRH began only in 2008. The available register is insufficient to allow conclusive judgments regarding the achieving of its environmental purposes, namely the behavioural responsiveness from the water private users.
The implementation of the TRH is experiencing the difficulties inherent in starting a taxation that is entirely new to the Portuguese taxpayer, on a subject until recently considered of full gratuity – suffices to say that industry and irrigation are finally subject to the payment of a fee on behalf of the natural resources consumed, both in “A” as in “E” components.
Furthermore, the institutional and administrative framework that collects TRH is extremely recent: the TRH is charged by the ARH, which are in operation only since the start of 2008; and the collection of the TRH is based on a national register of the use of water resources, in many cases in an early stage.
However, the number of taxpayers that do not meet the payment of TRH is low. Also, the volume of revenue increased exponentially from the first to the second year, a phenomenon explained by the broadening of taxpayers’ field, which became possible due to an effort of the authorities to detect and legalize a higher number of uses, making the registration system a more complete procedure.
A disaggregation of the total revenue by the five hydrographical regions identifies which uses are more relevant in each one; this identification is influenced by the regions’ characteristics: in the North there is a more industrialized use while in the South irrigation becomes more prominent.
Economics of Water
cont.

Report on Portuguese Environmental Economic Instruments 2010
19
Revenue from North and Tejo hydrographical regions clearly represent the greater amount surely because Tejo region is the largest region of the country, occupying almost one third of the territory, and because the North is a region of higher water abundance.
It is possible to identify four major economic uses subject to the charge of the TRH, each one due to a specific reason.
• Firstly the Urban Water Cycle, which aggregates the complete set of uses regarding public water supply and sanitation; which is explainable by the fact that the register index is almost entirely complete and updated, as those services are public utilities and were almost fully implemented in the entire territory in the last decades.
• The thermoelectric production, which is explained by the fact that it is still a major source of electricity generation in Portugal and needs a large volume of water.
• Paper industries, which are one of the most important industrial sectors in Portugal and one of the main export industries, responsible for remarkable water consumption.
• Finally, irrigation because, excluding in the North hydrographic region, Portuguese agriculture has a traditionally intensive use of water.
Totaltaxcollectionrevenues(inEuros)
Abstraction
(A)Effluent
(E)Aggregates
(I)Occupation
(O)Management
(U)Total
2009 8,274,505.63 8,234,510.78 679,659.10 1,178,705.62 1,992,809.44 20,360,190.57
2010 14,276,238.17 15,209,017.98 147,714.41 2,168,120.47 3,926,973.15 35,728,064.18
Total 56,088,254.75
2009
A = 41%
E = 40%
I = 3%
O = 6%
U = 10%
2010
A = 40%
E = 43%
I = 0%
O = 6%
U = 11%

20
2009TRHcollectionrevenuesbyeconomicsectors(inEuros)
A E O U Total
UrbanWaterCycle 4,865,965.46 5,600,134.87 32,013.96 1,193,872.31 11,691,986.60
Thermoelectric 1,330,230.07 3,118.66 2,675.42 145,483.13 1,481,507.28
Hydroelectric 80,397.62 0.00 54.18 17,538.35 97,990.15
Industries 1,008,815.76 1,344,166.31 36,453.46 301,478.74 2,690,914.27
Paper 461,958.63 666,788.30 17,596.95 101,621.68 1,247,965.56
Chemical 200,728.19 143,092.73 8.80 52,739.18 396,568.90
Food processing 134,352.14 284,893.46 5,669.99 60,086.77 485,002.36
Irrigation 503,279.36 0.00 18,893.93 121,783.15 643,956.44
Others - - - - 3,753,835.83
2009
Urban Water Cycle = 57%
Hydroelectric = 1%
Industries = 13%
Irrigation = 3%
Others = 19%
Thermoelectric = 7%
2010TRHcollectionrevenuesbyeconomicsectors(inEuros)
A E O U Total
UrbanWaterCycle 8,078,457.60 10,318,786.36 37,513.52 2,124,667.58 20,559,425.06
Thermoelectric 2,146,583.92 5,845.89 5,084.08 396,934.30 2,554,448.19
Hydroelectric 232,579.34 0.00 148.62 43,603.45 276,331.41
Industries 1,888,955.32 2,980,713.40 78,421.06 580,862.35 5,528,952.13
Paper 800,275.86 1,662,279.68 29,853.41 181,689.75 2,674,098.70
Chemical 397,919.92 287,654.08 1,366.11 101,206.51 788,146.62
Food processing 228,786.82 414,691.69 4,441.64 107,280.47 755,200.62
Irrigation 1,002,113.43 0.00 49,114.74 324,408.24 1,375,636.41
Others - - - - 5,433,270.98
Economics of Water
Report on Portuguese Environmental Economic Instruments 2010
21
2010
Urban Water Cycle = 58%
Hydroelectric = 1%
Industries = 15%
Irrigation = 4%
Others = 15%
Thermoelectric = 7%
TRHtotalcollectionrevenuesbyHydrographicRegion(inEuros)
North Centre Tejo Alentejo Algarve
2009 3,975,742.11 1,966,823.25 8,490,061.28 2,148,712.61 2,588,257.48
2010 8,117,871.10 3,374,772.06 17,347,976.40 3,790,556.41 2,123,821.58
Total 12,093,613.21 5,341,595.31 26,665,411.19 5,939,269.02 4,712,079.06
2009
Algarve = 14%
Alentejo = 11%
Tejo = 44%
Centre = 10%
North = 21%
2010
Algarve = 6%
Alentejo = 11%
Tejo = 50%
Centre = 10%
North = 23%
NorthHydrographicalRegionTRHcollectionrevenuesbycomponentandsector(inEuros)
A E O U
Sector 2009 2010 2009 2010 2009 2010 2009 2010
UrbanWaterCycle
1,411,844.95 2,812,543.26 1,128,412.65 2,518,464.56 14,503.49 25,910.60 305,360.51 639,673.67
Thermoelectric 506,716.64 924,939.23 99,466.60 585.64 200.22 133.65 66.82 178,381.14
Hydroelectric 22,433.14 95,076.13 - - - - 7,084.15 19,015.24
Industries 180,898.93 324,945.59 135,962.26 274,954.66 16,553.60 29,162.98 50,275.31 93,846.29
Textiles 101,254.86 210,317.23 74,510.50 110,574.25 60 520.53 27,354.34 60,018.97
Paper 46,206.40 71,226.84 20,927.48 48,191.65 13,553.00 27,780.15 9,284.59 14,457.95
Chemical 17,979.41 30,559.01 5,867.49 8,082.83 8.8 669.11 3,595.88 6,112.78
cont.

22
NorthHydrographicalRegionTRHcollectionrevenuesbycomponentandsector(inEuros)
A E O U
Sector 2009 2010 2009 2010 2009 2010 2009 2010
Food
processing270 4,272.42 1,331.60 87,767.06 ‑ 193.19 389.52 7,174.46
Others 15,188.26 8,570.09 33,325.19 20,338.87 2,931.80 ‑ 9,650.98 6,082.13
Beachsupports/etc.
- - - - 95,962.84 174,941.65 - -
Others - 605.23 - 188.36 - - - 369.70
Total 2,121,893.66 4,141,802.09 1,363,841.51 2,756,056.77 127,220.15 225,273.74 362,786.79 915,891.70
Source: ARH Norte (2011)
CentreHydrographicalRegionTRHcollectionrevenuesbycomponentandsector(inEuros)
A E O U
Sector 2009 2010 2009 2010 2009 2010 2009 2010
UrbanWaterCycle
326,383.99 663,922.22 236,473.41 409,767.70 1,578.92 3,568.73 66,088.80 137,486.36
Hydroelectric 19,495.19 53,366.59 0.00 68.70 0.00 40.25 3,540.38 9,678.51
Industries 347,973.68 561,811.77 408,490.52 933,708.22 11,977.18 26,978.24 81,664.17 139,282.12
Chemical 29,918.25 50,679.07 34.05 274.59 0.00 0.00 5,554.96 9,603.08
Paper 282,873.47 476,665.91 343,976.21 820,110.03 3,458.95 874.01 51,431.54 86,791.99
Food
processing26,414.27 12,526.68 31,203.56 58,945.33 4,267.92 1,282.50 9,133.90 13,508.42
Others 8,767.69 21,940.11 33,276.70 54,378.27 4,250.31 24,821.73 15,543.77 29,378.63
Aquaculture 7,944.46 0.00 9,911.97 47,033.37 33,752.82 66,452.73 1,472.62 3,627.73
Beachsupports/etc
0.00 0.00 0.00 0.00 242,463.42 350,125.98 0.00 0.00
Municipalities 140,123.25 244,505.13 435,292.63 419,412.84 5,220.05 4,104.83 88,493.33 151,223.58
Others 7,968.40 44,282.62 0.00 314.34 0.00 0.00 1,448.80 8,208.54
Total 849,888.97 1,567,888.33 1,090,168.53 1,810,305.16 294,992.39 451,270.76 242,708.10 449,506.83
Source: ARH Centro (2011)
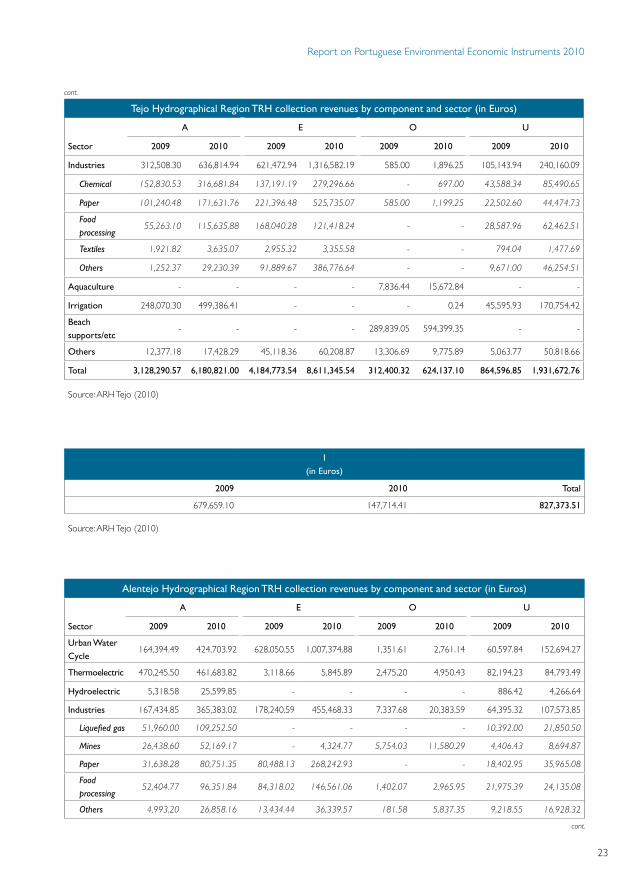
TejoHydrographicalRegionTRHcollectionrevenuesbycomponentandsector(inEuros)
A E O U
Sector 2009 2010 2009 2010 2009 2010 2009 2010
UrbanWaterCycle
1,856,407.85 3,571,878.78 2,896,709.30 5,917,972.29 193.96 387.91 534,399.79 1,085,376.77
Thermoelectric 353,267.93 759,960.87 - - - 63,222.08 133,759.67
Hydroelectric 33,150.71 58,536.77 - - 54.18 108.37 6,027.40 10,643.06
Economics of Water
cont.
cont.
Report on Portuguese Environmental Economic Instruments 2010
23
TejoHydrographicalRegionTRHcollectionrevenuesbycomponentandsector(inEuros)
A E O U
Sector 2009 2010 2009 2010 2009 2010 2009 2010
Industries 312,508.30 636,814.94 621,472.94 1,316,582.19 585.00 1,896.25 105,143.94 240,160.09
Chemical 152,830.53 316,681.84 137,191.19 279,296.66 ‑ 697.00 43,588.34 85,490.65
Paper 101,240.48 171,631.76 221,396.48 525,735.07 585.00 1,199.25 22,502.60 44,474.73
Food
processing55,263.10 115,635.88 168,040.28 121,418.24 ‑ ‑ 28,587.96 62,462.51
Textiles 1,921.82 3,635.07 2,955.32 3,355.58 ‑ ‑ 794.04 1,477.69
Others 1,252.37 29,230.39 91,889.67 386,776.64 ‑ ‑ 9,671.00 46,254.51
Aquaculture - - - - 7,836.44 15,672.84 - -
Irrigation 248,070.30 499,386.41 - - - 0.24 45,595.93 170,754.42
Beachsupports/etc
- - - - 289,839.05 594,399.35 - -
Others 12,377.18 17,428.29 45,118.36 60,208.87 13,306.69 9,775.89 5,063.77 50,818.66
Total 3,128,290.57 6,180,821.00 4,184,773.54 8,611,345.54 312,400.32 624,137.10 864,596.85 1,931,672.76
Source: ARH Tejo (2010)
I(inEuros)
2009 2010 Total
679,659.10 147,714.41 827,373.51
Source: ARH Tejo (2010)
AlentejoHydrographicalRegionTRHcollectionrevenuesbycomponentandsector(inEuros)
A E O U
Sector 2009 2010 2009 2010 2009 2010 2009 2010
UrbanWaterCycle
164,394.49 424,703.92 628,050.55 1,007,374.88 1,351.61 2,761.14 60,597.84 152,694.27
Thermoelectric 470,245.50 461,683.82 3,118.66 5,845.89 2,475.20 4,950.43 82,194.23 84,793.49
Hydroelectric 5,318.58 25,599.85 - - - - 886.42 4,266.64
Industries 167,434.85 365,383.02 178,240.59 455,468.33 7,337.68 20,383.59 64,395.32 107,573.85
Liquefied gas 51,960.00 109,252.50 ‑ ‑ ‑ ‑ 10,392.00 21,850.50
Mines 26,438.60 52,169.17 ‑ 4,324.77 5,754.03 11,580.29 4,406.43 8,694.87
Paper 31,638.28 80,751.35 80,488.13 268,242.93 ‑ ‑ 18,402.95 35,965.08
Food
processing52,404.77 96,351.84 84,318.02 146,561.06 1,402.07 2,965.95 21,975.39 24,135.08
Others 4,993.20 26,858.16 13,434.44 36,339.57 181.58 5,837.35 9,218.55 16,928.32
cont.
cont.

24
AlentejoHydrographicalRegionTRHcollectionrevenuesbycomponentandsector(inEuros)
A E O U
Sector 2009 2010 2009 2010 2009 2010 2009 2010
Aquaculture 4,733.16 - 4,560.49 9,563.32 7,295.12 14,590.25 790.16 1,563.38
Tourism 162.61 210.65 2,296.16 4,586.37 36,089.00 69,240.07 5,170.81 2,965.09
Irrigation 181,831.45 420,675.63 - - 18,872.93 49,114.50 42,748.83 83,774.55
Others - 9.05 7,296.20 9,653.27 107.13 171.75 717.04 955.41
Total 994,120.64 1,698,265.94 823,562.65 1,492,492.06 73,528.67 161,211.73 257,500.65 438,586.68
Source: ARH Alentejo (2011)
AlgarveHydrographicalRegionTRHcollectionrevenuesbycomponentandsector(inEuros)
A E O U
Sector 2009 2010 2009 2010 2009 2010 2009 2010
UrbanWaterCycle
1,106,934.18 605,409.42 710,488.96 465,206.93 14,385.98 4,885.14 227,425.37 109,436.51
Aquaculture - - 21,675.59 28,834.43 5,727.11 7,618.60 3,597.30 4,785.40
Irrigation 73,377.61 82,051.39 - - 21.00 - 33,438.39 69,879.27
Beachsupports/etc
- - - - 350,430.00 693,723.40 - -
Others - - 40,000.00 44,777.09 - - 755.99 7,214.00
Total 1,180,311.79 687,460.81 772,164.55 538,818.45 370,564.09 706,227.14 265,217.05 191,315.18
Source: ARH Algarve (2011)
Water Quality Tax
DescriptionAs a result of the approval and entering into force of the legal framework governing the quality of water used for human consumption (Decree-Law 306/2007), a charge has been levied thereon pertaining to inspection activities and the control of the quality standards of water used for human consumption carried out by the ERSAR – the Water Quality Tax (Taxa de Qualidade da Água – TQA).
TQA=Bvaluexm3
The charge is calculated in accordance with the base value and the volume of distributed water stated on the billing.
Economics of Water
cont.

Report on Portuguese Environmental Economic Instruments 2010
25
At the heart of the matter lays the water quality control plans laid down by managing entities responsible for the distribution of potable water, the undertaking of inspection activities concerning water quality standards regarding any part of the public water supply system, alerting the health authorities and the managing entities of the occurrence of any irregularities, carrying out the supervision of laboratories that guarantee the analytical quality control in water, providing annual technical reports with reference to the quality of water used for human consumption designed for public broadcast and also providing triennial reports concerning the quality of water used for human consumption intended for the European Commission.
The charge is levied on any service rendered which is carried out by a managing entity responsible for the distribution of potable water, namely, the State, the municipalities, the associations of municipalities, municipal services, parish councils, concessionary companies and recipients of delegated state-owned systems and also EPAL – Empresa Portuguesa de Águas Livres, S.A. (a 100% public corporation responsible for a water supply system which stretches more than 2100 kilometres). Globally, the charge encompasses over 300 entities.
Basevalue(inEuros)
2007 2008 2009 2010
€/1.000m3 1.5000 1.5360 1.5775 1.5633
ValuesThe base value of the TQA has increased marginally since 2007, while the universe of taxpayers is stable. The growing movement of TQA revenues is probably explained, therefore, by the increase of services provided to taxpayers, and in particular in terms of volume of water supplied.
Totaltaxpayers Totalrevenues(inEuros)
2007 303 2007 1,528,699.90
2008 304 2008 1,598,286.18
2009 308 2009 1,677,647.13
2010 304 2010 1,726,246.25
Source: ERSAR (2011) Total 6,530,879.46
Source: ERSAR (2011)

26
Water and Wastewater Services’ Regulation Tax
DescriptionEntities responsible for providing services of potable water, wastewater and solid waste are levied with a charge regarding the regulatory activity of the ERSAR. This activity has been broadening in the last years and its scope includes the entire activity of the abovementioned managing entities.
Tax=Vfixed+Vvariable
The fixation of the amount of the charge is based on the economic activity of the managing entity. That activity is evaluated according both the number of served inhabitants and the quantification of the services rendered, measured by the volume of cubic metres of distributed water or wastewater or the weight of solid waste collected.
Basevalues
FixedComponent(€/1000 inhabitant)
VariableComponent(€/1000 m3)
2000 37.4098 1.2470
2001 39.2654 1.3069
2002 39.2700 1.3100
2003 39.2700 1.3100
2004 53.0000 1.7700
2005 55.1200 1.8400
2006 58.7000 1.9600
2007 59.9300 2.0000
2008 61.3100 2.0460
2009 61.3100 2.0460
2010 62.1100 2.0726
ValuesThe tax collection revenues have been consistently growing, now being nearly the triple of the amount collected 10 years ago. The reason appears not to be the increase of the respective base values charged in the last ten years as much as the constant expansion of the array of entities subject to IRAR’s (nowadays ERSAR) regulatory activity.
With the approval of ERSAR’s new statutes, which again expands its regulatory scope, as well as the legal frameworks of water and wastewater and waste services, collection revenues may register even further increase beyond 2010.
Economics of Water

Report on Portuguese Environmental Economic Instruments 2010
27
Totalrevenues(inEuros)
Year Total Fixed Water Wastewater
2000 1,359,794 ‑ ‑ ‑
2001 1,438,625 ‑ ‑ ‑
2002 1,628,505 ‑ ‑ ‑
2003 1,791,111 ‑ ‑ ‑
2004 2,763,025 ‑ ‑ ‑
2005 3,081,115 ‑ ‑ ‑
2006 4,153,623 ‑ ‑ ‑
2007 3,494,472.15 927,877.41 1,341,856.12 1,224,738.62
2008 3,465,938.35 1,432,169.11 1,246,421.60 787,347.64
2009 3,605,929.39 1,423,458.10 1,343,937.08 838,534.21
2010 3,742,786.85 1,460,958.75 1,164,652.69 1,117,175.41
Source: ERSAR (2011)Note: values up to 2006 include the sector of urban waste. The fixed component includes also the three sectors.

Report on Portuguese Environmental Economic Instruments 2010
29
2. Public Investment Funds
Water Protection Fund (FPRH)
DescriptionEnvironmental funds nowadays are mainly investment or rotation funds, resetting public environmental financial decision from short-term goals to projects that envisage a longer period of time, consistent with sustainable development concerns.
The Water Protection Fund (Fundo de Protecção de Recursos Hídricos – FPRH) was created by Decree-Law 172/2009 on the result of Water Resources Economical and Financial Legislation (approved by Decree-Law 97/2008), as established by Water Act (Law 58/2005 which transposed the Directive 2000/60/EC of the European Parliament and of the Council of 23 October). It is a public investment fund, designed to promote water rational use and protection by financing projects and investments. It entirely relies on TRH, working as a mechanism to return to economical operators the tax revenue generated by them, through the allocation of financial resources to public and private projects and investments. To that effect, 50% of TRH revenues are earmarked to FPRH, which constitutes its most important financial resource.
FPRH Management Regulation was published 13th July 2010 by Portaria n.º 486/2010, establishing the procedures for presentation and selection of intervention projects, the payment and financing rules, as well as the terms of reimbursement. At 13th August 2010 the FPRH procedure manual was finally approved, setting the terms and process to be followed by beneficiaries from the presentation to the conclusion of the funding eligible project.
FPRH financial resources’ are applied in financing activities whose target is the efficiency of water use and water resources quality, financing measures to improve water status and associated ecosystems and covering costs of water resources management, object of use and protection. The FPRH may also redistribute resources among the ARH, whenever necessary to accomplish interventions and major projects demanding greater financial support.
More specifically, FPRH’s financial resources are invested in:
a) Projects to improve efficiency in water collection, use and distribution;
b) Projects to reduce water resources pollutant load rejection;
c) Projects to reduce environmental impact of the occupation of State’s public water domain;

30
d) Projects to improve water ecosystems;
e) Projects to control floods and other interventions to systematize rivers;
f) Other projects to protect and recover water resources under INAG and ARH’s.
The FPRH can act as a sinking fund, in the sense that financing can be carried out without return or payment; however, it acts preferentially as a revolving fund, since funding should be repaid and may be recovered through participation in income from projects implementation and may be remunerated by charging interests.
ValuesOutset in 2010, only since then the FPRH receives it’s TRH 50% share. In 2009, the amount affected to FPRH was redistributed by all ARH and INAG. From the total amount allocated to ARH Tejo remained the sum of €85.886,20, which in 2010 was reimbursed to FPRH.
As the Management Regulation only entered into force in 14th July 2010, only afterwards it was possible to begin the submission of projects for FPRH approval, more precisely in the period elapsed between 14th July and 31st October 2010. During that period 85 projects were presented to FPRH. As they were still under evaluation in the end of 2010, during that year there was no financial execution associated to funding projects.
FPRHtotalresources(inEuros)
TRH Others Total
2009 7,754,283.00 - 7,754,283.00
2010 15,498,668.69 85,886.20 15,584,554.89
Source: FPRH Activities Report 2010 (2011)
FPRHrevenuesredistribution(inEuros) WRTcontributors(inEuros)
2009 2010 2010
Amount % Amount % Amount %
ARHNorte 1,400,000.00 18,05 2,067,107.00 22,95 ARHNorte 3,801,472.16 24,53
ARHCentro 900,000.00 11,61 1,247,269.00 13,85 ARHCentro 1,435,735.47 9,26
ARHTejo 1,800,000.00 23,21 2,462,841.00 27,35 ARHTejo 7,131,861.82 46,02
ARHAlentejo 1,000,000.00 12,90 1,388,372.00 15,42 ARHAlentejo 1,630,586.25 10,52
Economics of Water
cont.

Report on Portuguese Environmental Economic Instruments 2010
31
FPRHrevenuesredistribution(inEuros) WRTcontributors(inEuros)
2009 2010 2010
Amount % Amount % Amount %
ARHAlgarve 2,000,000.00 25,79 1,840,228.00 20,43 ARHAlgarve 1,499,012.99 9,67
INAG 654,283.00 8,44 0.00 0,00
Total 7,754,283.00 100,00 9,005,817.00 100,00 Total 15,498,668.69 100,00
Source: FPRH Activities Report 2010 (2011) Source: FPRH Activities Report 2010 (2011)
cont.


Report on Portuguese Environmental Economic Instruments 2010
33
3. Water and Wastewater Services’ Tariffs Regulation
DescriptionThe industry structure for water services is fragmented in 23 wholesale and 275 retail water service providers, nearly all of which are owned and controlled by municipalities. Very small-scale suppliers, with few economies of scale, too often operate these services.
The average degree of cost recovery in water supply is of 80%, yet little over 30% in wastewater services, with roughly 50 municipalities (out of 300) not charging explicitly for this service.
Wastewater collection and treatment charges are well below full-cost recovery (FCR) level in many localities, with local and/or national taxation making up the difference. The ERSAR estimates that the financial sustainability of wholesale water services is, under present circumstances, either doubtful (one-third) or of concern (another one-third) for two-thirds of operators.
There are significant affordability problems potentially impacting between 5% and 10% of Portuguese households, even without FCR. FCR realisation and predicted future increases in real water charges will worsen these problems, unless social tariffs involving a measure of cross-subsidisation are introduced.
This is a situation clearly at odds with the existing legal framework. In fact, the Water Law (Law 58/2005 of 29 December) and the Economic and Financial Regime for Water Resources (Decree-Law 97/2008 of June 11), determine that the system of tariffs for water services must ensure the recovery of the initial investment and new investment for expansion, modernization and replacement of infrastructure, ensure the maintenance, repair and renovation of all goods and equipment used, as well as the payment of all compulsory charges that may be involved, and ensure the effectiveness of services within a framework of efficiency of resource use. Similarly, the Local Finance Law (Law 2/2007 of January 15) expressly establishes that the tariffs set by the municipalities on the services of water and wastewater services must ensure cost recovery directly and indirectly supported with his performance.
As a result, ERSAR has produced a recommendation concerning the structure and criteria that should be observed in setting urban water and wastewater tariffs (Recomendação IRAR 01/2009).
The recommendation establishes a framework for the tariff structure, which is to be followed by all service-providers, with the following orientation:
• Standard household tariff to be a fixed charge plus a 4-block IBT.

34
• Standard non-residential tariff to be a fixed charge plus a uniform volumetric rate (which must be equal in value to the 3rd household block), thus implying a built-in measure of unavoidable cross-subsidisation of the household by the non-household sectors.
• Block widths for the standard household tariff structure are set in the legislation and prices for each block to be approved by each municipality.
• ERSAR can issue further recommendations on topics such as absolute or relative prices for each block to be applied by utilities, monitor progress on FCR and compliance with legislation and issue recommendations directed at specific service providers.
• It is mandatory for wastewater charges to follow precisely the same tariff structure as the structure used for the water supply of any given household. This is achieved by setting the variable portion of the wastewater bill equivalent to a certain percentage of the variable portion of the water supply bill.
• Lump-sum charges for new service-connections can at present be very high (between €500 and €1.000). This significant barrier to universal access will have to be gradually phased-out over a 5-year period.
• It should be implemented a social tariff structure for low-income households, as well a larger family plan tariff structure.
The implementation of the recommendation began in 2010, after a period of public discussion in which new tariffs the municipalities and the services’ providers elaborated plans.
ValuesRegarding the burden for the end user, it is possible to show the three levels of household consumption more relevant during 2009 in all Portuguese municipalities (60 m3, 120 m3, 180 m3), whereas the 120 m3 consumption is considered by ERSAR as the average level.
One may verify that:
• The water supply is paid in almost all municipalities,
• However, in more than 60 municipalities, wastewater services are provided free of charge;
• Most municipalities practice values below or well below the average;
Economics of Water

Report on Portuguese Environmental Economic Instruments 2010
35
• The average values grow due to the higher rates applied in the higher tariffs, as it is demonstrated by the fact that the average values are always higher than the median ones.
An analysis on full cost recovery will only be available by ERSAR from August 2011, as only then begins its effective economic regulation of entities in models of direct and delegated management.
Watertariffs2009(inEuros)
60m3 120m3 180m3
Minimum 0.00 0.00 0.00
Maximum 126.24 222.84 378.84
Average 47.64 86.52 138.20
Median 46.68 83.88 132.70
Source: ERSAR (2011)
5
52
140
101
28
6 1 00
20
40
60
80
100
120
0
� 2
5
� 5
0
� 7
5
� 1
00
� 1
25
� 1
50
> 1
50
115
Num
ber
ofM
unic
ipal
ities
ValueinEuros
52
Water:60m3
140.00
0.00
20.00
40.00
60.00
80.00
100.00
120.00
NumberofMunicipalities
Water:60m3
1 21 41 61 81 101
121
141
161
181
201
221
241
261
281
301
Source: ERSAR (2011)
5
33
10082
0
20
60
80
0
� 2
5
> 1
50
82
Num
ber
ofM
unic
ipal
ities
ValueinEuros
5
Water:120m3
40
� 5
0
� 7
5
� 1
00
� 1
25
� 1
50
� 1
75
� 2
00
� 2
25
55
33
100 3 0
250.00
0.00
50.00
150.00
200.00
1 22 295
NumberofMunicipalities
Water:120m3
100.00
43 85 106
127
148
190
211
253
274
232
16964
Source: ERSAR (2011)
MedianAverage

36
5
Num
ber
ofM
unic
ipal
ities
ValueinEuros
� 5
0
5
Water:180m3
0
� 1
50
� 2
00
� 2
50
� 3
00
� 3
50
� 4
00
� 1
00
4
19
41
5756
4442
14 134 2 1 0 0 1 0
0
50
60
30
20
10
40
0.00
1 21 301
NumberofMunicipalities
100.00
400.00
300.00
200.00
Water:180m3
41 81 101
121
141
181
201
241
261
221
16161 281
Source: ERSAR (2011)
Wastewatertariffs2009(inEuros)
60m3 120m3 180m3
Minimum 0.00 0.00 0.00
Maximum 147.24 360.00 231.96
Average 22.18 36.98 51.00
Median 15.86 27.63 41.40
Source: ERSAR (2011)
020
80
140
0
Num
ber
ofM
unic
ipal
ities
ValueinEuros
160
� 2
5
139
Wastewater:60m3
60
� 5
0
� 7
5
� 1
00
� 1
25
� 1
50
> 1
50
120
100
40
3718
79
1 0
61
0.0020.00
160.00
NumberofMunicipalities
60.00
39
Wastewater:60m3
80.00
140.00
40.00
100.00
120.00
1 58 96 134
153
191
286
305
267
248
229
210
172
1157720
Source: ERSAR (2011)
MedianAverage
MedianAverage
Economics of Water

Report on Portuguese Environmental Economic Instruments 2010
37
010
0
Num
ber
ofM
unic
ipal
ities
ValueinEuros
90�
50
Wastewater:120m3
30
� 1
00
� 1
50
� 2
00
� 2
50
� 3
00
� 3
50
40
807060
20
1
61
> 3
50
50
80 77
54
188 6 3 0 0 0 0 0 0 0 0
0.0050.00
400.00
NumberofMunicipalities
150.00
39
Wastewater:120m3
200.00
350.00
100.00
250.00
300.00
1 58 96 134
153
191
286
305
267
248
229
210
172
1157720
Source: ERSAR (2011)
010
0
Num
ber
ofM
unic
ipal
ities
ValueinEuros
� 2
5
Wastewater:180m3
30
� 7
5
� 1
00
� 1
25
� 1
75
� 2
00
� 2
50
40
807060
20
62
> 2
50
5049
70
45
� 5
0
� 1
50
� 2
25
2 012811
2533
0.00
250.00
NumberofMunicipalities
100.00
39
Wastewater:180m3
50.00
150.00
200.00
1 58 96 134
153
191
286
305
267
248
229
210
172
1157720
Source: ERSAR (2011)
MedianAverage


0. Synthesis 41
1. Carbon Trade 43
Portuguese Carbon Fund 43
2. Vehicle Taxation 45
Motor Vehicle Tax 45
Single Road Tax 48
3. Energy Taxation 51
Petroleum and Energy Products Tax 51
Low Efficiency Light Bulbs Tax 53
4. Public Investment Funds 55
Permanent Forest Fund 55
Carbon & Energy Finance


Report on Portuguese Environmental Economic Instruments 2010
41
0. Synthesis
Under the Carbon and Energy Finance, attention focuses on the functioning of the Carbon trade and all the taxes that make up vehicle and energy taxation.
On the side of the Carbon trade, highlights are drawn to the contribution given by the Portuguese Carbon Fund (Fundo Português de Carbono – FPC) to the efforts made to meet the national targets under the Kyoto Protocol. The purchase of credits through permits, clean development mechanisms and joint implementation and investments in various funds have been part of the strategy for placing Portugal’s emissions below the greenhouse gases ceilings that have been set for 2012. The coming years will confirm this trend or not.
With respect to taxation with environmental impact, is now understood that the reform of vehicle taxation in 2007, by basing the tax on vehicles on CO2 emissions, contributed decisively to the national policy on climate change in the crucial sector of road transportation. The applicable rates of ISV and IUC increase according to CO2 emissions and all available information reveals that the consumers’ decisions are shifting to the purchase of vehicles with less environmental impact.
Despite being a budget-neutral reform – the total tax revenue collected by the State remained broadly unchanged – the importance of the environment in taxation is increasingly prevalent. It is particularly visible that the average CO2 emissions from new vehicles imported for consumption has repeatedly and consistently fallen since 2007 – regardless of increase or decrease of tax collected and therefore the number of vehicles sold – reaching in 2010 a level of leadership among OECD countries.
As for the ISP, there is a declining trend in revenue since 2007, although between 2008 and 2010 nominal rates have been kept unchanged. This decline reflects, therefore, the rising price of raw materials. The positive environmental performance of the ISP is hampered by the many exemptions and tax benefits in place, which, according to the recommendations of the OECD, should be removed shortly. The end of the biofuels tax benefits regime by the end of 2010 is a good example.
Finally, the energy taxation in Portugal stands out positively on the account of TLBEE, designed to offset the costs originated to the environment by the use of such lamps, and stimulate the achievement of national targets on CO2 emissions. Since its inception, has been responsible for raising revenue for projects to stimulate energy efficiency and the operation of the FPC.
The final step to be taken in the coming years lies in the implementation of the Tax on Electricity, transposing into national law the European directive on energy taxation – in fact, it is an obligation for which the Portuguese State is already in default.


Report on Portuguese Environmental Economic Instruments 2010
43
1. Carbon Trade
Portuguese Carbon Fund (FPC)
DescriptionDecree-Law 71/2006 created the Portuguese Carbon Fund (Fundo Português do Carbono – FPC), a financial instrument to support measures to fulfil the Portuguese commitments under the Kyoto Protocol, and to obtain emission credits from the Kyoto Protocol’s market based mechanisms.
The FPC develops its activity in several areas, namely, such as the purchase of credits through direct investment in Kyoto mechanisms (CDM, JI and IET) or the investment in other Funds or other instruments of the carbon market, supporting the development of projects in Portugal that aim at the reduction of GHG emissions; and supporting the participation of public and private entities in the carbon market.
The FPC is managed by the CECAC and by the DGTF; the first one is responsible for technical management and the second for financial management. The government endowed the FPC with a nominal value of 348 million Euros over the Kyoto period (2008-2012).
ValuesThe FPC has received 152 million Euros between 2006 and 2010, of which 78 million was granted by the State Budgets and 74 million generated by its own revenues.
By the end of 2010, the account of the FPC on the National Register of Allowances (RPLE) amounts to 5,321,629 tonCO2e.
Revenues(inEuros)
2006-2009 2010 Total
Statebudget 55,000,000 23,000,000 78,000,000
Ownrevenues 47,552,714 26,770,447 74,323,161
ISP on heating diesel 44,305,378 20,533,133 64,838,512
Light bulbs tax (TLBEE) 2,878,417 5,911,994 8,848,095
Fines 0 286,441 286,441
Investments returns 317,493 38,878 350,113
Total 102,501,288 49,770,447 152,323,161
Source: CECAC | FPC – Activities Report 2010 (2011)

44
The FPC has invested about 136 million Euros by 2009. In 2010, investments amounted to the value of the FPC total assets of 141.8 million Euros. By the end of 2010, the FPC has committed about 140.9 million Euros and the payments amount to approximately 98.8 million Euros.
This investment represents about 23.1 MtonCO2e, of which 9.1 Mton regards to pre-2012 credits, with an average price of €10.90 / Ton.
The total committed investment of the FPC in participations in carbon funds was 75.8 million Euros, at an average price of €11.22 / Ton.
The FPC has concluded an AAUP (Assigned Amount Unit Purchase Agreement) with Latvia in 2009 to purchase 4 million AAU, which was paid in 2010. 200 000 AAU were also purchased as part of an AAU transaction through a World Bank operation.
Values2010(inEuros)
Investments Accumulatedsubscription
Yearrealizations Accumulatedrealizations
Accumulateddefaultrealizations
Netvalue31.12.2010
Funds 72,985,095.74 382,889.00 45,315,470.74 27,669,625.66 45,315,470.74
Luso Carbon Fund 28,263,121.74 0.00 28,263,121.74 0.00 28,263,121.74
Carbon Fund
Europe11,700,000.00 0.00 5,600,000.00 6,100,000.00 5,600,000.00
Natsource Carbon
Asset Pool22,800,000.00 382,889.00 1,230,375.00 21,569,625.00 1,230,375.00
Asia Pacific Carbon
Fund10,221,974.00 0.00 10,221,974.00 0.66 10,221,974.00
AssignedAmountUnits(AAU)
40,090,990.00 21,090,000.00 40,090,000.00 990.00 40,090,000.00
SecondarymarketCER/ERU
10,585,581.00 6,939,642.00 10,585,579.00 0.00 10,585,579.00
Total 123,561,666.74 28,412,531.00 95,991,049.08 27,670,617.66 95,991,049.08
Source: DGTF (2011)
The FPC has also participated in national projects to reduce emissions, supporting the program Mobi.E (electrical mobility) and concluding agreements with the IGP and the AFN for the accounting of emission / capture of CO2e component in agricultural and forest-forest management.
Carbon & Energy Finance

Report on Portuguese Environmental Economic Instruments 2010
45
2. Vehicle Taxation
Motor Vehicle Tax
DescriptionMotor Vehicle Tax (Imposto sobre Veículos –ISV) in Portugal is since 2007 based on CO2 emissions and on cylinder capacity, making of it an important tool in the context of environmental and climate change policy. Passenger cars (including all road vehicles – 4x4) and multipurpose vehicles are taxed based on CO2 emissions and on cylinder capacity. The corresponding rates increase according to the level of CO2 emissions and are designed to encourage the acquisition of vehicles that are environmentally less detrimental.
This means that this tax has not simply an environmental implication, as its predecessor (Imposto Automóvel – IA) had; Law 22-A/2007, created the ISV as an environmental tax itself, as one of the novelties lays in the introduction of the abovementioned environmental factor, which started by representing 30% of the total tax basis and then, as of 1st January 2008, encompassed 60% of the taxation base. Therefore, as a result of this ongoing environmental policy, the weight of cylinder capacity has decreased significantly, promoting a sustained change of heart by consumers who have started to opt for less polluting forms of transport, i.e., those that have less CO2 emissions and have less cubic capacity.
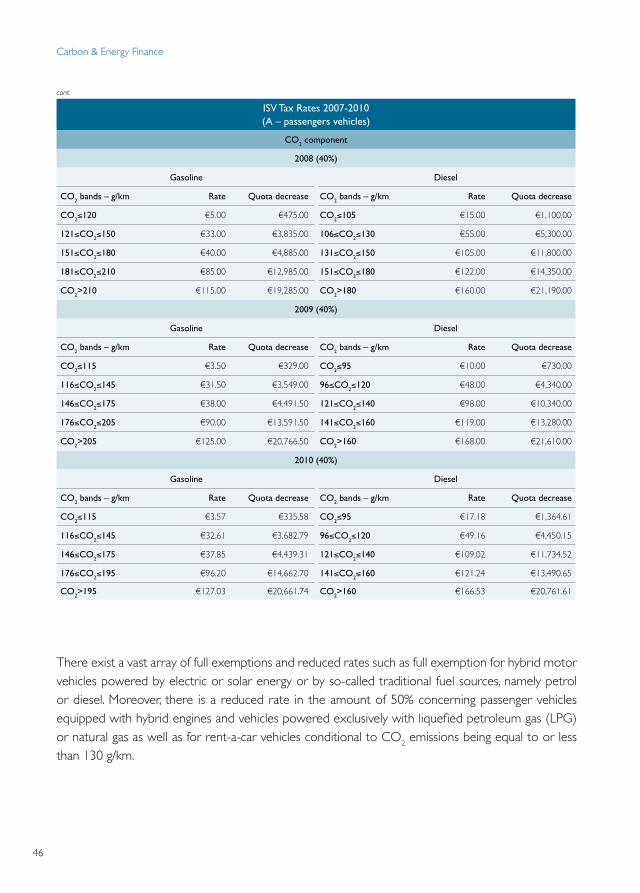
ISVTaxRates2007-2010(A–passengersvehicles)
Cylinderenginecomponent
2007(70%) 2008-2010(60%)
Cubiccentimetres Rate Quotadecrease Rate Quotadecrease
≤1250cc €1.96 €1,350.00 €0.90 €670.00
>1250cc €7.16 €7,850.00 €4.25 €4,875.00
CO2component
2007(30%)
Gasoline Diesel
CO2bands–g/km Rate Quotadecrease CO2bands–g/km Rate Quotadecrease
CO2≤120 €0.95 €0.00 CO2≤100 €2.60 €0.00
121≤CO2≤180 €18.50 €2,106.00 101≤CO2≤150 €27.00 €2,440.00
181≤CO2≤210 €53.00 €8,316.00 151≤CO2≤180 €85.00 €11,140.00
CO2>210 €60.00 €9,786.00 CO2>180 €105.00 €14,740.00
cont.
46
ISVTaxRates2007-2010(A–passengersvehicles)
CO2component
2008(40%)
Gasoline Diesel
CO2bands–g/km Rate Quotadecrease CO2bands–g/km Rate Quotadecrease
CO2≤120 €5.00 €475.00 CO2≤105 €15.00 €1,100.00
121≤CO2≤150 €33.00 €3,835.00 106≤CO2≤130 €55.00 €5,300.00
151≤CO2≤180 €40.00 €4,885.00 131≤CO2≤150 €105.00 €11,800.00
181≤CO2≤210 €85.00 €12,985.00 151≤CO2≤180 €122.00 €14,350.00
CO2>210 €115.00 €19,285.00 CO2>180 €160.00 €21,190.00
2009(40%)
Gasoline Diesel
CO2bands–g/km Rate Quotadecrease CO2bands–g/km Rate Quotadecrease
CO2≤115 €3.50 €329.00 CO2≤95 €10.00 €730.00
116≤CO2≤145 €31.50 €3,549.00 96≤CO2≤120 €48.00 €4,340.00
146≤CO2≤175 €38.00 €4,491.50 121≤CO2≤140 €98.00 €10,340.00
176≤CO2≤205 €90.00 €13,591.50 141≤CO2≤160 €119.00 €13,280.00
CO2>205 €125.00 €20,766.50 CO2>160 €168.00 €21,610.00
2010(40%)
Gasoline Diesel
CO2bands–g/km Rate Quotadecrease CO2bands–g/km Rate Quotadecrease
CO2≤115 €3.57 €335.58 CO2≤95 €17.18 €1,364.61
116≤CO2≤145 €32.61 €3,682.79 96≤CO2≤120 €49.16 €4,450.15
146≤CO2≤175 €37.85 €4,439.31 121≤CO2≤140 €109.02 €11,734.52
176≤CO2≤195 €96.20 €14,662.70 141≤CO2≤160 €121.24 €13,490.65
CO2>195 €127.03 €20,661.74 CO2>160 €166.53 €20,761.61
There exist a vast array of full exemptions and reduced rates such as full exemption for hybrid motor vehicles powered by electric or solar energy or by so-called traditional fuel sources, namely petrol or diesel. Moreover, there is a reduced rate in the amount of 50% concerning passenger vehicles equipped with hybrid engines and vehicles powered exclusively with liquefied petroleum gas (LPG) or natural gas as well as for rent-a-car vehicles conditional to CO2 emissions being equal to or less than 130 g/km.
Carbon & Energy Finance
cont.

Report on Portuguese Environmental Economic Instruments 2010
47
AverageCO2emissionsNewvehiclessales
2006-2010
Petrol Diesel
2006 145 150
2007 144 146
2008 140 138
2009 136 137
2010 132 126
Variation - 13gr - 24gr
Source: DGAIEC (2011)
ValuesWith the refurbishment in 2007, the centre of vehicle taxation shifted from acquisition of the vehicle to its property, meaning that in the long run tax revenues will fall in ISV and increase in IUC.
The overall price tags of motor vehicles have remained the same, although the emphasis on aggravated taxation must lie on cars that pollute more than cars that have less CO2 emissions. Currently, CO2 tax component already plays a decisive role in reducing car emissions as seen in the diagram below.
Collectionrevenuesbytypeofvehicle(inmillionEuros)
Totalcollectionrevenues(inmillionEuros)
All-roadandlightcargo
Lightcargo Mixed Passengerormixed
Motorcyclesandothers
Impo
sto
Aut
omóv
el
2000 1,204.9
Impo
sto
Aut
omóv
el
2001 92.7 32.5 0.0 1,102.8 0.0 2001 1,192.9
2002 61.8 12.4 18.5 1,089.6 0.0 2002 1,150.4
2003 45.6 5.7 23.2 938.3 0.0 2003 985.1
2004 43.8 3.7 26.8 1,076.1 0.0 2004 1,121.3
2005 37.8 3.4 30.0 1,135.7 0.0 2005 1,173.2
2006 39.4 2.8 46.0 1,109.5 0.0 2006 1,166.0
2007 29.9 19.5 61.2 1,075.1 0.4 2007 1,186.6
ISV
2008 0.0 47.5 0.0 857.9 0.9
ISV
2008 917.6
2009 0.0 34.0 0.0 665.8 0.8 2009 693.3
2010 0.0 40.0 0.0 772.6 0.7 2010 809.1
Source: DGAIEC (2011) Source: DGAIEC (2011)

48
Carscrappingscheme
The car-scrapping scheme set out by Decree-Law 292-A/2000 will be extended until 31st December 2010, although differing from the transitional framework in force until 31 December 2009. This transitional tax structure set in place for 2009 granted a €1250 tax reduction if a person acquired a new vehicle to replace one with a 8 year old and under 13 year old register plate, bearing in mind it was bound to be disassembled. Likewise, a vehicle with a 13 year old or over register plate benefited from a €1500 tax reduction.
Henceforth as set out in the State Budget for 2010, the possibility to reduce the motor vehicle tax payable preceding the purchase of a new passenger car will be reduced by € 750 (for cars at the end of its cycle with a register plate over 10 years and up to 15 years old) or € 1000 (for cars at the end of its cycle with a register plate in excess of 15 years) bearing in mind the introduction of an environmental factor based on carbon dioxide (CO2) emissions, i.e., the purchased vehicles CO2 emissions cannot exceed 130g/km.
The estimated tax expenditure as referred to in the State Budget for 2010 amounts to € 24 Million Euros. In 2009, tax expenditure was approximately 50.7 million Euros.
Years Amount(inEuros)
2001 9,595,949.00
2002 5,018,889.00
2003 3,206,925.00
2004 3,920,464.00
2005 4,397,277.00
2006 7,381,144.00
2007 18,767,676.00
2008 44,774,053.00
2009 51,349,125.00
2010 35,379,792.24
Source: DGAIEC (2011)
Single Road Tax
DescriptionAs abovementioned Law 22-A/2007 enacted a global amendment of motor vehicles and as a result a Single Road Tax (Imposto Único de Circulação – IUC) entered in force that resulted in the simultaneous repeal of the Municipal Vehicles Tax, the former Road Tax and the Road Haulage Tax.
The IUC is an annual tax levied based on an ownership principle as well as grounded on the principle of tax equivalence intended to burden taxpayers according to the environmental damage they cause as well as to the proportionate wear and tear of road network as a direct cause of vehicle circulation.
Carbon & Energy Finance

Report on Portuguese Environmental Economic Instruments 2010
49
IUCStructure
Category B: Other passenger vehicles and mixed use vehicles originated from passenger vehicles with a gross weight not over 2500 kg registered after the date of entry into force of Road Tax Code
Cylindercapacity(incubiccentimetres)
Rates(inEuros)
CO2Levels(GramsperKilometre)
Rates(inEuros)
Up to 1 250 26.10 Up to 120 52.40
More than 1 250 up to 1 750 52.40 More than 120 up to 180 78.50
More than 1 750 up to 2 500 104.70 More than 180 up to 250 157
More than 2 500 314 More than 250 261.70
Yearofacquisition(categoryB)
Coefficient
2007 1
2008 1.05
2009 1.10
Henceforth, in the case of passenger vehicles and mixed use vehicles originated from passenger vehicles with a gross weight not over 2500 kg, the tax to be paid depends on the vehicle’s CO2 emissions level and the respective cylinder capacity. The environmental component is likewise included in the calculation of the IUC at the same percentages used for ISV. To the remaining vehicles, taxation is calculated according the vehicles’ weight.
There are also full exemptions for vehicles powered by non-combustion renewable energy sources.
ValuesThe tax collection revenue of Category B (with environmental criteria) has a growing trend, both in the total amount of collected tax as in its proportion in the total IUC collection revenue.
Likewise, the environmental component of the circulation tax, based on the CO2 emissions, is gaining an increasing importance.
Taxcollectionrevenues(thousandEuros)
Category 2008 2009 2010
A 125,889.49 125,095.76 123,668.84
B 43,596.15 75,141.20 106,660.95
CO2
23,262.27 39,493.34 56,624.53
Cylinder 20,333.87 35,647.86 50,036.42
cont.

50
Taxcollectionrevenues(thousandEuros)
Category 2008 2009 2010
C 62,063.79 65,732.92 65,724.77
D 16,782.28 16,455.28 15,583.74
E 6,038.75 7,257.92 7,793.85
F 4,020.00 4,169.48 4,229.81
G 123.74 127.00 130.66
Total 258,514.20 293,979.55 323,792.62
Source: DGCI (2011)
IUCstructure(%)
Category 2008 2009 2010
A 48.70 42.55 38.19
B 16.86 25.56 32.94
CO2 9.00 13.43 17.49
Cylinder 8.87 12.13 15.46
C 24.01 22.36 20.30
D 6.49 5.60 4.81
E 2.34 2.47 2.41
F 1.56 1.42 1.31
G 0.05 0.04 0.04
Source: DGCI (2011)
Evolution2008-2010
Category 2009/2008 2010/2009
A -0.63% -1.14%
B 72.26% 41.95%
CO2
69.77% 43.38%
Cylinder 75.31% 40.36%
C 5.91% -0.01%
D -1.95% -5.30%
E 20.19% 7.38%
F 3.72% 1.45%
G 2.63% 2.88%
Source: DGCI (2011)
Carbon & Energy Finance
cont.

Report on Portuguese Environmental Economic Instruments 2010
51
3. Energy Taxation
Petroleum and Energy Products Tax
DescriptionTaxation on petroleum and energy products encloses clear environmental goals, apart from the economic rationale from a tax collection standpoint, such as energy efficiency, energy saving and the reduction of CO2 emissions.
The Petroleum and Energy Products Tax (Imposto Sobre Produtos Petrolíferos e Energéticos – ISP) structure basically reproduces the EU harmonised excise duties framework. Taxable products are petroleum and other energy products, any other products to be used, sold or consumed as motor fuel, vegetable oils (when used as motor fuel or as furl), mineral oils including lubricating oils which are non-harmonized – products identified by their NC codes of Ch. 27, 29, 34 and 38, coal and natural gas (used as motor fuel), bio fuels (when used as motor fuel or as fuel).
ISPRates2007-2010(inEuros)
Product
01.0
1.20
07a
07.
01.2
007
08.0
1.20
07a
22.
02.2
007
23.0
2.20
07a
31.
12.2
007
01.0
1.20
08a
09.
01.2
008
10.0
1.20
08a
31.
12.2
008
01.0
1.20
09a
28.
02.2
009
01.0
3.20
09a
31.
12.2
009
01.0
1.20
10a
28.
04.2
010
29.0
4.20
10a
31.
08.2
010
01.0
9.20
10a
31.
12.2
010
Leadedgasoline
For
1000
litr
es
650 650 650 650 650 650 650 650 650 650
Unleadedgasoline 557.95 582.95 582.95 518.95 518.95 518.95 518.95 518.95 518.95 518.95
Diesel 339.41 364.41 364.41 278.41 278.41 278.41 278.41 278.41 278.41 278.41
Agriculturaldiesel 77.51 77.51 77.51 77.51 77.51 77.51 77.51 77.51 77.51 77.51
Heatingdiesel 91.44 91.44 137.2 137.2 176.18 176.18 176.18 176.18 176.18 176.18
Petroleum 308.04 308.04 308.04 308.04 308.04 308.04 308.04 308.04 308.04 308.04
Industrialpetroleum 110.64 110.64 110.64 110.64 110.64 110.64 110.64 110.64 110.64 213.83
cont.

52
ISPRates2007-2010(inEuros)
Product
01.0
1.20
07a
07.
01.2
007
08.0
1.20
07a
22.
02.2
007
23.0
2.20
07a
31.
12.2
007
01.0
1.20
08a
09.
01.2
008
10.0
1.20
08a
31.
12.2
008
01.0
1.20
09a
28.
02.2
009
01.0
3.20
09a
31.
12.2
009
01.0
1.20
10a
28.
04.2
010
29.0
4.20
10a
31.
08.2
010
01.0
9.20
10a
31.
12.2
010
Fueloilw/sulphur<=1%
For
1000
kg
15.3 15.3 15.3 29.25 29.25 29.25
Fueloilw/sulphur>1% 29.25 29.25 29.25 29.25 29.25 29.25
Propellantgas 106.54 106.54 106.54 108.78 108.78 108.78 108.78 108.78 109.65 109.65
Heatinggas 7.81 7.81 7.81 7.81 7.81 7.81
Industriallubricant 4.78 4.78 4.78 4.78 4.78 4.78 4.78 4.78 4.78 4.78
Otherlubricant 21.28 21.28 21.28 21.28 21.28 21.28 21.28 21.28 21.28 21.28
Coal 4.16 4.16 4.16 4.16 4.16 4.16
NaturalGas
Gig
a-jo
ule
2.72 2.72 2.72 2.78 2.78 2.78 2.78 2.78 2.78 2.78
There are full exemptions concerning petroleum and other energy products that are proved to be used for purposes other than as motor fuel or as heating fuel, used in air navigation (except for private pleasure flying) used in coastal and internal navigation, including fishing but excluding pleasure navigation (gas oil and fuel oil), used for producing electricity or electricity and heat (coal and fuel oil), used in public transportation (LPG and natural gas), used as industrial fuels in approved installations (coal, coke, fuel oil and petroleum gas), under emissions license scheme or energy efficiency agreements, used in dredging operations in ports and waterways (gas oil and fuel oil), used in railways (gas oil) and bio fuels (small producers).
On the other hand, partial exemptions are conferred to agricultural and forestry equipment, power-producing engines (fixed generators foe electricity production and compressors) and bio fuels (large producers).
ValuesThe following tax rates and overall tax collection revenue of ISP (in Million Euros) are as follows (situation as of January 1st 2010):
Carbon & Energy Finance
cont.

Report on Portuguese Environmental Economic Instruments 2010
53
ISPcollectionrevenuesbyfuel(millionEuros)
TotalISPcollectionrevenues
(millionEuros)
Gasoline Diesel Fueloil LPG Kerosene Gas Others
2000 2,114.5
2001 772.6 1,345.4 17.4 9.0 0.7 0.0 2.1 2001 2,147.4
2002 1,223.3 1,495.3 14.4 9.2 0.9 0.0 2.4 2002 2,745.4
2003 1,278.0 1,649.3 7.9 8.6 0.7 0.0 2.0 2003 2,946.4
2004 1,252.2 1,691.6 8.0 8.5 0.7 0.0 2.2 2004 2,963.4
2005 1,202.1 1,771.9 7.7 4.0 0.7 4.2 2.1 2005 2,992.7
2006 1,178.0 1,849.3 6.8 3.6 0.6 4.5 2.3 2006 3,045.1
2007 1,164.9 1,968.3 6.1 5.7 0.4 2.6 21.4 2007 3,169.4
2008 967.1 1,522.7 0.4 3.4 0.9 0.3 35.1 2008 2,530.0
2009 941.5 1,471.9 2.3 4.9 0.9 1.7 11.0 2009 2,434.2
2010 902.9 1,456.9 2.5 5.5 0.8 2.3 35.2 2010 2,406.1
Source: DGAIEC (2011) Source: DGAIEC (2011)
Low Efficiency Light Bulbs Tax
DescriptionThe enactment of a tax on low efficiency light bulbs is intended to compensate the costs that the utilization of these bulbs have on the environment due to the effects of inefficient energy consumption. Furthermore, it proposes to stimulate the fulfilment of the domestic objectives concerning CO2 emissions. This was the objective of the publication of Decree-Law 168/2008, which created the aforementioned tax.
Tax=(Wbulb
-Wreference).Hoursbulb.EmissionFactor.CO2
Wbulb
Light bulb wattage subject to taxation
Wreference
Wattage of the alternative of high efficiency for the same level of measurement in lumens of light
HoursbulbEstimated average rated life cycle of the type of bulb subject to taxation
EmissionFactorAverage factor of CO2 emissions of the National Electric System expressed in TCO2 per Wh
CO2
Reference price per tonnage of CO2

54
The tax on low efficiency light bulbs is due by manufacturers and importers and all other economic agents that introduce these products into the Portuguese market and is levied on the following type of bulbs:
• Incandescent light bulbs for generic usage, without halogen glare, of any format or type of finish (clear, textured glass, opaline), with spiral screw E14, E27 and B22, of wattage between 15 W and 200 W and a rated voltage between 220 V and 240 volts, even if included in lamps;
• High-pressure mercury vapour lamp without diodes, generally used in urban and industrial lighting, with wattage between 50 W and 1000 W.
ValuesAmounts of tax as well as the value parameters comprised in the formula for tax calculation are specified in Portaria 63/2008:
• Incandescent light bulbs: € 0,41/unit
• High pressure mercury vapour lamps: € 6,77/unit
The reporting period began in January 2008 and to date taxes were levied until the end of the first half of 2009. As we can see from the table below, between January 2008 and June 2009 about 6 million Euros were raised related to this charge, which represents an annual average of 4 million. Of these, about 3.2 million (annual average) returned to the FPC for the purchase of carbon credits and about 0.8 million (annual average) paid into the Fund for Energy Efficiency intended to support measures for Energy Efficiency in Portugal.
The overall tax revenue collection is as follows:
Taxcollectionrevenues(inEuros)
First semester 2008 924,715
Second semester 2008 2,673,306
First semester 2009 2,416,847
Total 6,014,868
Source: DGEG (2010)
Carbon & Energy Finance

Report on Portuguese Environmental Economic Instruments 2010
55
4. Public Investment Funds
Permanent Forest Fund (FFP)
DescriptionEnvironmental funds were originally conceived as vehicles for the polluter pays and user pays principles, as they ensure that revenues from environmental taxes are converted into environmental expenditure. Its only natural, then, that the first fund created in Portugal was the Permanent Forest Fund.
Decree-Law 64/2004 established the Permanent Forest Fund (FFP) as a result of the political options undertaken via the Resolution of the Council of Ministers 178/2003 concerning the primary guidelines of the future of the Portuguese forestry sector. It was a continuous environmental process ante ceded by the enactment of the 1996 FrameworkLaw on ForestPolicy that introduced the concept of ‘sustainable forest management’ for the first time.
The FFP, an autonomous body, was created complementarily with the Institute for Financing and Supporting the Agriculture and Fisheries Development (IFADAP). It sets the objectives of the Fund, as, for instance: promoting the investment, management and prevention of forest fires; supporting the preventive measures of forest fires; creating financial mechanisms for enabling sustainable forestry models. The Ministry for Agriculture, Rural Development and Fisheries shall approve the programme of financial aid to be granted by the FFP. Finally, the Decree indicates the various possible aids foreseen (subsidies, credit lines, insurance premiums and guarantees) and the areas covered by the Funds.
FFP’s target activities comprise forest fire prevention such as bolstering the number of existing forest fire fighters and forest offices on a municipal level, improvements in forest management by means of “Forest intervention zones” (ZIFs), forest research, provision of forest public goods (ecological, social and cultural services) and monitoring of forest health conditions and biotic risks. The Fund’s main beneficiaries are forest owner’s ´associations, municipalities and Public Forest Services.
Since 2010 FFP is allowed to grant support to the certification of forest management in the axis of intervention “Sustainability of the Forest”, both in the constitution of Systems Certification of Forest Management and in the adherence to already existing Systems Certification of Forest Management. The beneficiaries of these grants are forest owners and producers, producer organizations and the forest management bodies of commons not subject to the Forestry Legal Framework, as well as fund managers in areas of forest intervention (ZIF), particularly those with high standards of competitiveness and technology. The financial support is provided in the form of non-repayable subsidies, and the level of support to be provided is equivalent to 80% of eligible expenses in the case of the ZIF areas and 50% for non-adherent areas.

56
ValuesAs far as funding is concerned, the FFP is financed primarily by a percentage of 0,5% of tax revenue collected on ISP, which is specifically earmarked to that effect.
The tax expenditure was approximately 25 million Euros in 2009 and over 51 million in 2010.
Approvedfunding(inEuros)
Interventionaxis 2009 2010
Awareness and information 1,822,000.00 2,359,720.00
Prevention and protection of forest 18,854,688.60 20,802,750.00
Planning, forest management and intervention 4,517,429.42 898,854.65
Forest sustainability 0.00 25,915,839.87
Research, experimentation and studies 183,135.00 1,865,989.00
Total 25,377,253.02 51,843,153.52
Source: IFAP (2011)
Carbon & Energy Finance

0. Synthesis 59
1. Waste Trade 61
Organized Waste Market 61
2. Waste Taxation 63
Waste Management Tax 63
Waste Regulation Charge 65
Sirapa Charge 67
Waste Border Movements Charge 68
Waste Permits Charges 69
3. Eco-value 71
4. Urban Waste Services’ Tariffs Regulation 85
Economics of Waste & By-product


Report on Portuguese Environmental Economic Instruments 2010
59
0. Synthesis
The Economics of Waste and By-product presents itself as the field in which economic instruments are more comprehensive, diversified and, as a whole, present a more advanced stage of maturation. From the Organized Waste Market to various taxes, through the eco-value of the system of extended producer responsibility, varied economic instruments are in force.
The Organized Waste Market is still a reality in its infancy, but with its onset of activity in 2010 it will soon be possible to assess its real capacity to return waste back into the economic circuit. An essential step has to be given by the transposition of Directive 2008/98, adapting the concept of by-product to the national legal system.
Among the many tributes that somehow implement the polluter pays and user pays principles, it is worth highlighting the performance of the Waste Management Tax (Taxa de Gestão de Resíduos – TGR). TGR’s revenue has been growing since 2007 and this growth is the result of the enlargement of subjects to a greater number of operators and economic activities, as the environmental authorities have been able to integrate them into the system. In fact, the nominal values of TGR have remained untouched and perhaps it is high time to reflect what is the real effect of this tax instrument in inducing behavior. Looking at the volume of waste recorded for the purposes of TGR is not yet clear that the levy of this tax has led to a substantial change from the previous options of economic agents. Therefore, it should be evaluated whether the values of the rates of TGR should be increased so as to intensify the burden put on the shoulders of economic agents whose choice always lies on undesirable alternatives – thus guiding their decision more strongly.
The eco-value is a typical example of a well conceived economic instrument: the majority of economic agents have already embraced the idea that production and consumption of goods generates a cost to society by virtue of the creation of waste; that that cost is materialized and economically visible in all decisions through the eco-value; which is only fair that the social cost is thereby supported by the beneficiaries of the private good; and that the eco-value revenues are not channeled to the State – as an intermediary in the context of the polluter pays principle, as is the case with environmental taxes – but to the system’s managing entity, in order to restore the environmental and economic balance. The volumes of waste and financial resources handled by the various systems affirm eco-value as a solid and streamlined economic instrument.
Finally, we stress the tariffs applied in the service sector of urban waste. This is a highly fragmented sector and, also here, tariffs’ rates in general are not a guarantee of financial sustainability of the services – contrary to the Local Finance Law, which expressly provides that the tariffs set by the municipalities on services of municipal solid waste management should ensure the coverage of direct and indirect costs incurred for their benefit. Another conclusion cannot be drawn when waste

60
collection and treatment services are provided free of charge in about 50 municipalities and while most municipalities practice values below or far below the average national rates. Moreover, it is suspected that in most services the tariffs do not allow full cost recovery. This hypothesis will be confirmed or denied in the coming years, as the ERSAR will be expanding its regulatory powers.
Economics of Waste & By-product

Report on Portuguese Environmental Economic Instruments 2010
61
1. Waste Trade
Organized Waste Market
DescriptionEconomical and financial legal framework of waste contemplated in Waste Management Legal Framework (Decree-Law 178/2006) created the Organized Waste Market (Mercado Organizado de Resíduos – MOR), as a means to foster an adequate and effective recovery and reintroduction of waste in the economical circuit, facilitating its exchange and encouraging its demand to be used as a resource.
More precise legal framework of the Organized Waste Market was approved by Decree-Law 210/2009, which sets out the principle of free waste marketing, although conditioning this freedom to the rules that safeguard environment protection and public health, as it is essential, and fixes the terms of its constitution, management and operation, as well as the rules applied to transactions made and their operators.
The Organized Waste Market unites various electronic negotiation platforms where the waste transactions are processed as meeting the conditions of sustainability and security. Waste producers and operators have access to these negotiation platforms in order to launch orders for the purchase or sale of waste. On the other hand, the functioning of this negotiation platforms within the framework of waste market is subject to authorization of the APA, which verifies if they have an adequate electronic support, if the necessary operation and information security mechanisms exist and also if actually contribute to satisfy the goals fixed by waste management plans.
The APA’s authorization allows the managing entity to use a logo as well as the designation “Integrated Platform on the Organized Waste Market” in all media communications regarding its own activities.
In the Organized Waste Market waste of all categories can be traded when directed only to recovery, except waste defined as potentially dangerous by the Waste Management Legal Framework.
The negotiation platforms are e-platforms that support the negotiation of waste, made through queries to the market, indications of interest and transactions, and are of universal and equal access by all potential users. Managed by private entities, provided they ensure transparency, universality, timeliness and accuracy of the information that circulates within them and are subject to confidentiality regarding transactions operated in their trading platforms. To accomplish this, negotiation platforms should:
• Have mandatory management systems of information security, certified by ISO 27001 on Management Systems of Information Security or by other certification equivalent certification by independent auditing entity and accepted by APA;

62
• Adopt measures to prevent access to the system by those without appropriate authorization and qualification, through the authentication of each user in the system using an identification code and password;
• Be housed on secure servers with high levels of redundancy in their operation systems and data security.
Negotiation platforms must be financially self-sustaining; management entities may charge transaction fees, annual dues for membership or earn additional revenues, particularly those from complementary services.
ActivityAfter the entering into force of the legal framework in late 2009, two licensing procedures for two negotiation platforms were presented in the beginning of 2010 by business associations and other economic agents.
The first licensed Portuguese negotiation platform is called MOROnline; it has received authorization to operate in the market as from July 21, 2010, and the electronic platform was released on November 25, 2010.
Economics of Waste & By-product

Report on Portuguese Environmental Economic Instruments 2010
63
2. Waste Taxation
Waste Management Tax
DescriptionThe Waste Management Legal Framework (Regime Geral da Gestão de Resíduos) approved by Decree-Law 178/2006 lays down the economic and financial structure concerning waste management. Its main objective is the fulfilment of the environmental objectives that Portugal is bound to as a result of its obligations and commitments to the European Union and also those Portugal has undertaken on its own initiative.
TGR=Basevalue.ton
The new fiscal instruments created in this respect are intended to guide operators´ behaviour and final consumers in the direction of a reduction in the production of waste in general as well as to a more efficient waste management approach.
That is precisely the intention of the Waste Management Tax (Taxa de Gestão de Resíduos – TGR) created by Decree-Law 178/2006. It is designed to serve as a gradual compensation mechanism for (1) the social and environmental costs generated by waste producers in detriment of the community as a whole and (2) the benefits that the same community provides as a result of waste activities, in accordance with the general principle of equivalence, as well as stimulating the carrying out of the domestic objectives in regard to waste management.
TaxstructureThe TGR is due on a yearly basis and arises from, although varying in amount, the quantity of waste (1) deposited in landfills (2) managed by specific waste flow systems (3), overseen by CIRVER or (4) eliminated in incineration or co-incineration facilities.
In any case, the minimum amount due is € 5.000 per entity. The TGR is threefold in nature, consisting simultaneously of a landfill tax, an incineration tax and lastly an inefficiency waste tax.
The debtor entity is the waste managing entity, even though it has the obligation to reflect this cost on the economic agents by means of tariffs and financial services that they are responsible for charging.
The result of the tax collection regarding TGR is exclusively a source of revenue of the competent public entities in matters of waste management (on a national level, the APA; and regionally the CCDR). Moreover, the annual revenue is consigned to:

64
a. Accompaniment expenses pertaining to the taxpayers activities;
b. Expenses pertaining to the financing of the APA or the CCDR activities, when applicable, that contribute to the fulfilment of the domestic objectives concerning waste management;
c. Expenses related to the financing of activities of taxpayers that are instrumental to the implementation of the domestic objectives concerning waste management.
ValuesThe TGR revenue intake reveals an upward trend, explicable by its recent inception: created in 2007, the tax collection has progressively encompassed a growing number of operators and economic activities.
However, it is noteworthy to underline that the measure of effectiveness of this fiscal instrument in regard to the level of behavioural responsiveness is not totally perceptible due to the fact that merely three years have elapsed since the effective computation of the TGR. A situation that may deserve special mention is the shift of landfill waste derived from construction and demolition and other inert waste – but also a consequence of specific legislation enacted that has lead the way to the reutilization in construction and other similar activities.
Basevalues2007-2010(inEuros)
Operation Waste Years 50%aggravation for waste
characterized as recyclable
2007 2008 2009 2010
Landfill
Inert waste and industrial non-hazardous waste 5 5.5 - - -
Urban waste and similar 2 2.5 3 3.5 Yes
Inert waste derived from construction and demolition - 2.5 3 3.5 Yes
Wasted deposited in CIRVER landfills - - 5 5.5 Yes
Other types of waste deposited in landfills - - 5 5.5 Yes
CIRVER Waste managed in CIRVER facilities 1 1.03 - - -
Incineration Waste managed in incineration and co-incineration facilities 1 1.03 1.06 1.05 Yes
Inefficiency
Waste indexed to the rate of retrieval stipulated in the licenses of the managing entities of specific waste flow systems, either individual persons or enterprises, and granted that these systems are not steered towards reutilization, recycling or valorisation purposes, in accordance with the terms and conditions of the respective licenses
2 2.05 2.1 2.08 No
Economics of Waste & By-product

Report on Portuguese Environmental Economic Instruments 2010
65
QuantityofwasterelevantforcalculationofTGR(ton)
2007 2008 2009 2010(estimate)
Urban waste landfill 3,599,388.34 3,657,064.40 3,334,281.76 3,321,879.23
Urban waste 3,491,507.62 3,510,714.69 3,204,129.37 3,191,726.83
Construction waste107,880.72
17,202.32 7,822.52 7822.52
Other waste 129,147.38 122,329.87 122329.87
Other landfills 341,623.07 254,215.96 318,193.34 322,207.19
Urban waste 13,214.00 23,211.68 107,529.80 107,149.06
Construction waste328,409.07
3,053.52 6,557.70 6,684.24
Other waste 227,950.76 204,105.84 208,373.89
CIRVER - 50,987.95 143,007.55 99,601.72
Incineration 793,201.23 913,269.27 1,001,325.41 992,405.61
Urban waste 784,913.60 904,854.82 984,506.67 974,317.65
Other waste 8,287.63 8,414.45 16,818.74 18,087.96
Co-incineration 85,579.24 133,407.51 143,082.15 143,082.15
Managingentities - - 13,207.00 13,207.00
Total 4,819,791.89 5,008,945.09 4,939,890.23 4,892,382.89
Source: APA (2011)
Totalcollectionrevenues(inEuros)
2007 2008 2009 2010
10,119,673.00 12,060,101.00 13,957,467.88 N/A
Source: APA (2011)
Waste Services’ Regulation Tax
DescriptionEntities responsible for providing services of potable water, wastewater and solid waste are levied with a charge regarding the regulatory activity of the ERSAR. This activity has been broadening in the last years and its scope includes the entire activity of the abovementioned managing entities.
Tax=Vfixed+Vvariable
The fixation of the amount of the charge is based on the economic activity of the managing entity. That activity is evaluated according both the number of served inhabitants and the quantification of

66
the services rendered, measured by the volume of cubic metres of distributed water or wastewater or the weight of solid waste collected.
BaseValues(inEuros)
Fixedcomponent(€/1000inhabitant)
Variablecomponent(€/ton)
2000 37.4098 0.1247
2001 39.2654 0.1297
2002 39.2700 0.1300
2003 39.2700 0.1300
2004 53.0000 0.2000
2005 55.1200 0.2100
2006 58.7000 0.2200
2007 59.9300 0.2300
2008 61.3100 0.2353
2009 61.3100 0.2353
2010 62.1100 0.2384
ValuesTax collection revenues have been consistently growing, now being nearly the triple of the amount collected 10 years ago. The reason appears not to be the increase of the respective base values charged in the last ten years as much as the constant expansion of the array of entities subject to IRAR’s (now ERSAR) regulatory activity.
With the approval of ERSAR’s new statutes, which again expands its regulatory scope, as well as the legal frameworks of water and wastewater and waste services, collection revenues may register even further increase beyond 2010.
Totalrevenues(inEuros)
Year Total Fixed Variable
2000 1,359,794 - -
2001 1,438,625 - -
2002 1,628,505 - -
2003 1,791,111 - -
2004 2,763,025 - -
Economics of Waste & By-product
cont.

Report on Portuguese Environmental Economic Instruments 2010
67
Totalrevenues(inEuros)
Year Total Fixed Variable
2005 3,081,115 - -
2006 4,153,623 - -
2007 1,592,516.69 927,877.41 664,639.28
2008 2,339,753.06 1,432,169.11 907,583.95
2009 2,316,871.09 1,423,458.10 893,412.99
2010 2,410,291.57 1,460,958.75 949,332.82
Source: ERSAR (2011)Note: values up to 2006 include the sectors of water and wastewater. The fixed component includes also the two sectors.
SIRAPA Charge
DescriptionAPA houses since 2007 a system of information and communication between the Administration and the economic agents designated SIRAPA.
The SIRAPA is available through a web portal accessible to users of representatives of organizations or heads of establishments / installations with legal environmental obligations. Adherence to SIRAPA is mandatory for all entities (public or private), including those by way of ownership or operation of establishments or facilities fit into that situation.
By SIRAPA the APA provides a platform for communication with clients and partner agencies in the various environmental frameworks. The system aims to integrate information in a standardized manner, providing a range of services to its users, which will grow as the system evolves and consolidates. By SIRAPA registered entities may come to submit environmental information that are required by law, requests for information or licensing and review the status of its resolution or response and access your payment information.
The registration and renewal on SIRAPA involves the payment of an annual charge, a basic condition for access to the system and all the services available there.
ValuesThe present waste charges framework, namely its permits, values and respective revenues are as follows:
cont.

68
Operation Value(inEuros) Totalcollectionrevenues(inEuros)
2007 2008 2009 2010
Registration of waste producers and operators on SIRAPA
25.00 222,375.00 1,199,650.04 753,330.23 934,850.10
Source: APA (2011)
Notification of Waste Border Movements Charge
DescriptionRegulation (EC) n.º 1013/2006 of the European Parliament and the Council of 14 June 2006, which repealed Regulation (EEC) n.º 259/93 of 1 February, establishes procedures and control regimes for the transfer of waste, according to the source, destination and route of the shipment, the type of waste shipped and the type of treatment to be applied to the waste at its destination.
Decree Law 45/2008 of 11 March ensures the implementation and ensures compliance in domestic law of the obligations for the Portuguese State emerging of the abovementioned Regulation. Under this Decree, the APA is the competent national authority for the purposes of Regulation (EC) n.º 1013/2006 of the European Parliament and Council of 14 June 2006.
Portaria 242/2008 of 18 March establishes the payment of charges by the notifier, from examining the procedures for notification of shipments of waste intended for import, export or transit.
ValuesThe notification charges, namely its values and respective revenues, are as follows:
Operation Value(inEuros) Totalcollectionrevenues(inEuros)
2007 2008 2009 2010
Movement notification 500.00
34,962.45 335,485.93 321,600.00 176,600.00
Notification of import or export of waste
T = F + (M x N) T = tax supported by the notifier ;
F = fixed amount of € 500;
M = fixed amount of € 50 per movement;
N = total number of movements predicted in the notification
Source: APA (2011)
Economics of Waste & By-product

Report on Portuguese Environmental Economic Instruments 2010
69
Waste Permits Charges
DescriptionThe waste management legal framework approved by Decree-Law 178/2006 simplified, condensed and rationalized the vast array of charges that were in force regarding waste. A residual category of general licensing charges was created. Concurrently, charges concerning the licensing of operations or operators subject to a specific legal framework were fully and autonomously regulated, as occurs with landfills, managing systems of specific waste flow systems, integrated systems for the CIRVER and incineration and co-incineration facilities as well as border movements of waste.
The aforementioned rationalization of charges was necessarily accompanied by the update of the cost of the licenses concerning the activities linked to the management of waste. This update comprises a twofold objective: on one hand, to guarantee that the amounts due cover in reality the economic cost that corresponding procedures generate on behalf of the State; on the other hand, to contribute by means of serving as an indicator to economic agents and society in general of the overbearing cost that this activity represents in the global context of the economy.
ValuesThe present waste charges framework, namely its permits, values and respective revenues are as follows:
Permit Operation Value(inEuros)
Totalcollectionrevenues(inEuros)
2007 2008 2009 2010
Lice
nsin
gof
op
erat
ions
and
w
aste
man
agem
ent
oper
ator
s
Issuing of licenses and authorizations 2,000
4,330.20 112,810.79 275,759.28 192,261.73
Issuing of licenses (simplified procedure) 1,500.00
Inspection procedure 1,000.00
Register resulting from the change of conditions of the license or authorization
500.00
Lice
nsin
gof
la
ndfil
ls
Exploration license 20,000.00
Inspection procedure 1,000.00
Register resulting from the change of conditions of the license
1,000.00
cont.

70
Permit Operation Value(inEuros)
Totalcollectionrevenues(inEuros)
2007 2008 2009 2010
Lice
nsin
g of
spe
cific
was
te fl
ow s
yste
ms,
indi
vidu
al p
erso
ns
ore
nter
pris
es
Licensing of managing entities 25,000.00
4,330.20 112,810.79 275,759.28 192,261.73
Licensing of managing entities in charge of registering
20,000.00
Licensing, authorization or approval of individual systems
10,000.00
Operating authorization of reception centres for the scrapping of passenger cars at the end of their life cycle
5,000.00
Prior authorization or specific to operations dealing with the handling of passenger cars at the end of their life cycle or used oils
1,000.00
Register of transport operators 1,000.00
Inspection procedure 1,000.00
Register resulting from the change of conditions of the license or authorization
1,000.00
Lice
nsin
gof
CIR
VER
Pre-qualification phase 3,750
Examination phase and project selection phase 5,000.00
Installation licensing, exploration licensing or temporary/provisional operating authorization
25,000.00
Inspection procedure 2,500.00
Register resulting from the change of conditions of the license
1,000.00
Lice
nsin
gof
in
cine
ratio
nan
dco
-in
cine
ratio
n Exploration license 20,000.00
Inspection procedure 1,000.00
Register resulting from the change of conditions of the license
1,000.00
Source: APA (2011)
Economics of Waste & By-product
cont.

Report on Portuguese Environmental Economic Instruments 2010
71
3. Eco-value
DescriptionAt the heart of EU policies is the extended producers responsibility for the management of the waste generated by the production of goods. This extended responsibility provides positive stimulus to tailor product design, forcing the use of smaller quantities of raw material or the use of recycled or recyclable materials. Thus under Waste Management Legal Framework as well, economic operators that place the products in the market are held responsible for the respective waste management (i.e., to recover, re-use, recycle and eliminate the waste generated by those products).
They may, however, transfer this responsibility delegating it to another entity duly licensed by the Ministry of Environment. This delegation of responsibility occurs in several cases in Portugal: first with waste originated by packaging, and later with other waste flows, namely batteries and accumulators, tires, electric and electronic equipment, lubricating oils and vehicles. For these purposes, the various economic operators responsible for waste management constituted vehicle-entities for whom they transferred their extended responsibility of recovering and eliminating the waste.
As compensation, the producers must pay those vehicle-entities a price over the products they place in the market, in order to finance their activities and guarantee a proper waste management. That price is Eco-value (Eco-valor).
Eco-value is charged over the quantity of goods produced and marketed; it has a unit value or a value per unit of volume or weight, and is fixed in the license issued by the Ministry of Environment.
That means that the producer as a production cost supports the Eco-value. Hence, the Eco-value is economically incorporated in the price to the consumer under the form of a surcharge. That surcharge may be hidden in the price, as it is not mandatory to inform the consumer of Eco-value associated to the product being bought (visible fee). However, producers frequently choose to explicit Eco-value in the price, especially in the waste flows of mineral oils, tires, vehicles and electric and electronic equipment.
Values by waste flowsBatteries and accumulatorsThe legal regime that regulates the placement of batteries and accumulators in the waste market and the regime of collection, valorisation, recycling and elimination of batteries and accumulators residues contained in Decree-Law 6/2009 and Decree-Law 266/2009, both transposing Directive 2006/66/EC, of the European Parliament and of the Council of 6 September, concerning batteries

72
and accumulators and its residues, modified by Directive 2008/103/EC, of the European Parliament and of the Council of 19 November.
There are five entities responsible for integrated systems of management of used batteries and accumulators (Ecopilhas, Valorcar, Amb3E, ERP Portugal e GVB) and one responsible for an individual system (Autosil). The eco-values practiced for batteries and accumulators are as follows:
Valorcar
CategoriesofbatteriesandaccumulatorsUnitValue(inEuros)
Non-electric vehicles 0.50
HDV, vessels and non-electric machinery 1.00
Pure electric cars, HDV, motorcycles and vessels 1.00
Non-electric motorcycles 0.15
Loading machines and others purely electrical 11.50
Hybrid cars 2.50
Source: APA (2011)
AMB3E
Typesofbatteriesandaccumulators2009/2010(Euro/kg)
Portablebatteriesandaccumulators
ZnC + Alkaline 0.60
Lithium and others 0.97
Button 1.29
NiCd 0.40
NiMH 0.40
Lithium ion 0.57
Lead-acid 0.40
Industrialbatteriesandaccumulators
Lead-acid and others 0.55
Source: APA (2011)
Economics of Waste & By-product
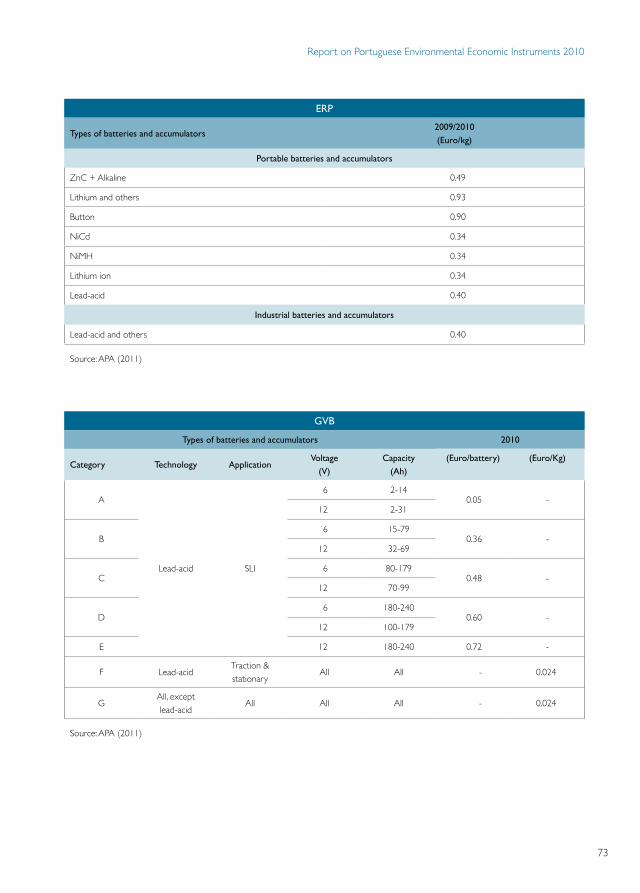
Report on Portuguese Environmental Economic Instruments 2010
73
ERP
Typesofbatteriesandaccumulators2009/2010(Euro/kg)
Portablebatteriesandaccumulators
ZnC + Alkaline 0.49
Lithium and others 0.93
Button 0.90
NiCd 0.34
NiMH 0.34
Lithium ion 0.34
Lead-acid 0.40
Industrialbatteriesandaccumulators
Lead-acid and others 0.40
Source: APA (2011)
GVB
Typesofbatteriesandaccumulators 2010
Category Technology ApplicationVoltage
(V)Capacity
(Ah)(Euro/battery) (Euro/Kg)
A
Lead-acid SLI
6 2-140.05 -
12 2-31
B6 15-79
0.36 -12 32-69
C6 80-179
0.48 -12 70-99
D6 180-240
0.60 -12 100-179
E 12 180-240 0.72 -
F Lead-acidTraction & stationary
All All - 0.024
GAll, except lead-acid
All All All - 0.024
Source: APA (2011)

74
Ecopilhas
Typesofbatteriesandaccumulators
2003(Euro/kg)
2004/2005(Euro/kg)
2006/2007(Euro/kg)
2009/2010(Euro/kg)
ZnC + Alkaline 1.412 1.119 0.908 0.47
Lithium 1.653 1.402 1.141 0.70
Button 2.671 2.563 2.17 0.70
NiCd 1.115 0.79 0.598 0.49
NiMH 1.115 0.79 0.598 0.49
Lithium ion 1.039 0.704 0.522 0.40
Lead-acid - - - 0.007
Source: APA (2011)
Electrical and electronic equipment wasteThe legal framework for electric and electronic equipment waste management resides on Decree-Law 230/2004 and Decree-Law 174/2005, transposing Directive 2002/95/CE, of the European Parliament and of the Council, 27th January 2003, and Directive 2002/96/CE, of the European Parliament and of the Council, 27th January 2003, altered by Directive 2003/108/CE, of the European Parliament and of the Council, 8th December 2003.
Currently, the activity of management of an integrated system of REEE waste management is licensed to AMB3E – Associação Portuguesa de Gestão de Resíduos and to ERP – Associação Gestora de Resíduos. These two entities practice different eco-values.
The Eco-values practiced for electric and electronic equipment waste are as follows:
AMB3E(Euros/unit)
REEEcategories 2005/2006 2007/2008 2008/2009 2010
Category1–LargeAppliances
Large cooling appliances ≤ 20 kg - 1.75 1.75 1.92
Large cooling appliances >20 e ≤150 kg 7.04 5.58 5.58 6.13
Large cooling appliances > 150 kg 34.39 21.1 21.1 23.21
Large Appliances ≤ 150 kg 4.62 3.39 3.39 3.72
Large Appliances > 150 kg 34.39 10.4 10.4 20.03
Appliances for cooking or processing food > 15 kg 1.75 1.5 1.5 1.65
Air conditioners and dehumidifiers ≤ 40 kg 1.75 1.75 1.75 1.92
Air conditioners > 40 kg e ≤100 kg 5.36 5.36 5.36 5.89
Economics of Waste & By-product
cont.

Report on Portuguese Environmental Economic Instruments 2010
75
AMB3E(Euros/unit)
REEEcategories 2005/2006 2007/2008 2008/2009 2010
Air conditioners > 100 e ≤ 500 kg 8.05 7.17 7.17 12.08
Air conditioners > 500 kg 16.59 33.54 33.54 72.60
Heating, ventilation, exhaust ventilation and conditioning appliances ≤ 10 kg 0.40 0.3 0.3 0.33
Heating, ventilation, exhaust ventilation and conditioning appliances > 10 e ≤ 150 kg 1.65 1.04 1.04 1.14
Heating, ventilation, exhaust ventilation and conditioning appliances > 150kg 17.00 25.52 25.52 28.07
Category2–Smallappliances
Small equipment: watches and equipment for domestic use, cooking, personal care, hygiene and health ≤ 0,2 kg
0.40 0.05 0.05 0.11
Small equipment: watches and equipment for domestic use, cooking, personal care, hygiene and health > 0,2 kg
0.40 0.2 0.2 0.30
Cleaners ≤ 5 kg 1.43 0.54 0.54 0.59
Cleaners > 5 kg 1.43 1.43 1.43 1.57
Category3–Computerequipmentandtelecommunications
Desktop, servers and main frame ≤ 25 kg (without monitor) 2.08 1.1 1.1 1.39
Desktop, servers and main frame > 25 kg (without monitor) 10.32 4.29 4.29 5.11
Laptops 0.29 0.36 0.36 0.45
CRT/LCD/TFT/Plasma Monitors ≤ 15” 3.87 1.69 1.3 1.43
CRT/LCD/TFT/Plasma Monitors >15 e ≤ 21” 3.87 3.24 2 2.20
CRT/LCD/TFT/Plasma Monitors > 21e ≤ 29” 3.87 7.02 3.5 3.85
CRT/LCD/TFT/Plasma Monitors > 29” 3.87 10.98 8 8.80
Printers and multifunction inkjet/gel jet/other technologies 0.6 0.6 0.6 0.97
Copiers/printers/ multifunction laser ≤ 20 kg 1.75 1.04 1.04 1.53
Copiers/printers/ multifunction laser >20 e ≤ 60 kg 3.93 3.93 3.93 5.17
Copiers/printers/ multifunction laser > 60 kg 6.99 10.22 10.22 16.06
Large format copiers/plotters ≤ 100 kg 10.32 5.32 5.32 9.64
Copiers/printers/ multifunction laser >100 kg 25.79 25.79 25.79 36.11
Laser thermal faxes and other technologies 1.03 0.64 0.64 0.83
Scanners 0.99 0.34 0.34 0.52
Pocket calculators/portable agendas/PDA 0.10 0.01 0.01 0.01
Calculators with printer/printer brass 0.48 0.2 0.2 0.27
Cash registers/POS 1.51 1.66 1.66 1.82
Desk phones 0.12 0.09 0.09 0.11
Wireless phones 0.10 0.07 0.07 0.08
Mobile phones 0.10 0.03 0.03 0.05
PABX (€/kg) - 0.11€/kg 0.11€/kg 0.62€/kg
Other equipment ≤ 0,1 k 0.24 0.03 0.03 0.03
Other equipment > 0,1 e ≤1kg 0.24 0.06 0.06 0.08
cont.
cont.

76
AMB3E(Euros/unit)
REEEcategories 2005/2006 2007/2008 2008/2009 2010
Other equipment > 1 kg e ≤ 5 kg 0.96 0.19 0.19 0.33
Other equipment >5 kg e ≤ 15 kg 4.78 2.5 2.5 2.98
Other equipment > 15 kg e ≤ 50 kg 8.30 5.5 5.5 6.05
Other equipment > 50 kg 10.32 10.32 10.32 28.12
Category4–Consumerequipment
TVs/CRT/LCD/TFT/Plasmas and surveillance monitors ≤15” - 1.69 1.3 1.60
TVs/CRT/LCD/TFT/Plasmas and surveillance monitors > 15 e ≤ 21” - 3.24 2 2.20
TVs /CRT/LCD/TFT/Plasmas surveillance monitors > 21 e ≤ 29” - 7.02 3.5 3.70
TVs /CRT/LCD/TFT/Plasmas surveillance monitors >29” - 10.98 8 8.00
Apparatus for receiving, recording and playing audio and video/video surveillance/photographic material
- 0.31 0.31 0.48
Apparatus for receiving, recording and playing audio ≤ 1 kg 0.24 0.08 0.08 0.13
Apparatus for receiving, recording and playing audio > 1 kg 2.42 1.14 1.14 1.48
Video projectors ≤ 5 kg 1.19 0.42 0.42 0.46
Video projectors /overhead projectors > 5 kg 2.39 1 1 1.49
Small equipment: personal audio, portable audio, reception apparatus, video recording and playback, remotes and photographic material ≤ 0,1 kg
0.10 0.01 0.01 0.11
Small equipment: personal audio, portable audio, reception apparatus, video recording and playback, remotes and photographic material > 0,1 e ≤ 0,5kg
0.13 0.04 0.04 0.13
Musical instruments ≤ 5 kg 1.19 0.45 0.45 0.58
Musical instruments ≤ 5 kg 4.78 1.8 1.8 4.36
Other equipments ≤ 0,1Kg - - 0.03 0.03
Other equipments > 0,1 e ≤ 1kg - - 0.06 0.08
Other equipments > 1kg e ≤ 5kg - - 0.19 0.33
Other equipments > 5kg e ≤ 15kg - - 2.5 2.98
Other equipments > 15kg e ≤ 50kg - - 5.5 6.05
Other equipments > 50kg - - 10.32 34.98
Category5–Lightingequipment
Fluorescent and discharge lamps 0.23 0.23 0.23 0.16
Fixtures ≤ 1 kg 0.10 0.10 0.10 0.18
Fixtures > 1 kg e ≤ 6 kg 0.39 0.39 0.39 0.54
Fixtures > 6 kg 1.73 1.50 1.50 1.62
Category6–Electricalandelectronictools
Electrical and electronic tools ≤ 1 kg 0.10 0.05 0.05 0.07
Electrical and electronic tools > 1 kg e ≤ 5 kg 0.41 0.24 0.24 0.38
Electrical and electronic tools > 5 kg e ≤ 10 kg 1.16 0.73 0.73 0.99
Economics of Waste & By-product
cont.
cont.

Report on Portuguese Environmental Economic Instruments 2010
77
AMB3E(Euros/unit)
REEEcategories 2005/2006 2007/2008 2008/2009 2010
Electrical and electronic tools > 10 kg e ≤ 15 kg 2.53 1.27 1.27 1.70
Electrical and electronic tools > 15 kg e ≤ 20 kg 3.99 1.86 1.86 2.20
Electrical and electronic tools > 20 kg 5.01 4.8 4.8 5.00
Category7–Toysandleisureandsportsequipments
Toys and leisure and sports equipments ≤ 0,5 kg 0.12 0.05 0.05 0.05
Toys and leisure and sports equipments > 0,5 kg e ≤ 5 kg 0.96 0.11 0.11 0.19
Toys and leisure and sports equipments > 5 kg e ≤ 20 kg 4.78 1.06 1.06 1.16
Toys and leisure and sports equipments > 20 kg 8.30 5 5 7.15
Category8–Medicaldevices
Medical devices ≤ 5 kg 2.90 0.5 0.5 0.55
Medical devices > 5 e ≤ 20kg 2.90 0.9 0.9 1.81
Medical devices > 20 kg e ≤ 100 kg 5.34 5.34 5.34 6.14
Medical devices > 100 kg 5.34 26.8 39.5 60.36
Category9–Monitoringandcontrolequipment
Monitoring and control equipment 0.13 0.13 0.130.250.50
Category10–Vendingmachines
Vending machines without cooling or refrigeration ≤ 20 kg 4.78 1.08 1.08 1.80
Vending machines without cooling or refrigeration > 20 kg e ≤ 60 kg 9.56 4.32 4.32 4.98
Vending machines without cooling or refrigeration > 60 kg 17.20 7.52 7.52 17.20
Vending machines without cooling or refrigeration ≤ 60kg 9.56 5.58 5.58 6.13
Vending machines without cooling or refrigeration > 60 kg 17.20 21.1 21.1 28.90
Source: APA (2011)
ERP(Euros/ton)
WasteCategories 2005-2006 2007-2008 2009-2010
Large appliances 128 48 48
Cooling equipments 345 76 76
TV/monitors 180 156 156
Lamps 458 680 680
Others 108 91 82
Source: APA (2011)
cont.

78
End-of-life vehiclesThe legal system applicable to the management of vehicles and end-of-life vehicles, its components and materials is ruled on by Decree-Law 196/2003, modified by Decree-Law 64/2008, transposing Directive 2000/53/EC of the European Parliament and of the Council of 18 September into Portuguese law.
A license to manage an integrated system of the end-of-life vehicles was granted to Valorcar – Sociedade de Gestão de Veículos em Fim de Vida, Lda, which brings together all vehicle manufacturers and importers and a recycling association.
The Eco-values practiced for end-of-life vehicles are as follows:
VALORCAR
Fixedcomponent(Euros/month)
Variablecomponent(Euros/vehicle)
2004-2005 123 0.413
2006 123 0.423
2007-2009 123 0.455
Source: APA (2011)
2010
NumberofvehiclesFixedcomponent
(inEuros)Variablecomponent
(Euros/vehicle)
< 500 250
1From 500 to 9999 500
From 10000 to 20000 1000
> 20000 1500
Source: APA (20110)
Packaging and waste originated by packagingThe Decree-Law 366-A/97, the Decree-Law 162/2000 and the Decree-Law 92/2006 establishes the principles and norms applicable to the management of packaging and waste originated by packaging and includes the legal framework that rules the integrated management systems, transposing Directive 94/62/EC of the European Parliament and of the Council of 20 December into Portuguese law, amended by Directive 2004/12/EC of the European Parliament and of the Council of 11 February, regarding packaging and waste originated by packaging.
Economics of Waste & By-product

Report on Portuguese Environmental Economic Instruments 2010
79
Different packaging management entities are licensed. Despite this, they are not in a situation of real competition since one is a generalist while the others are aimed at very specific economic sectors. Thus, the Sociedade Ponto Verde – SPV is the managing entity of the integrated management of urban and non-urban packages and packaging waste; Valormed – Sociedade Gestora de Resíduos de Embalagens e Medicamentos, Lda, is the managing entity of the integrated system for medicines packages waste; and Sigeru – Sistema Integrado de Gestão de Embalagens e Resíduos em Agricultura, Lda, holds the integrated management system of phytopharmaceuticals packages.
The Eco-values practiced for packaging and waste originated by packaging are as follows:
SPV(Euros/ton)
Material
From01.2005to
04.2005
From04.2005
From04.2006 From01.2007 From01.2008(WithWMTincluded)
CategoriesAeB
CategoriesAeB
CategoryA
CategoryB
CategoryA
CategoryB
CategoryA
CategoryB
CategoryC
Glass 6.3 8.7 9.5 9.5 14.7 14.7 - -
Paper/paper board
15.8 42.5 76.5 31 64.4 26.6 64.4 26.6 7.5
Ecal - - 76.5 64.4 - 64.4 - -
Plastic 121.1 92.7 112.5 84 170.2 69.6 170.2 69.6 25
Steel 30.9 36.5 58.5 23 71.7 31.5 71.7 31.5 25
Aluminium 52.7 62 70 25 122.4 115 122.4 115 50
Wood 3.9 3.9 7.5 4 12.3 16.2 12.3 16.2 10
Others 126.4 126.4 150 150 180 - 180 - -
Source: APA (2011)

80
SPV(Euros/ton)
MaterialPrimaryVPV SecondaryVPV TertiaryVPV
2009 2010 2009 2010 2009 2010
Packagingforconsumerproducts
Glass 13.5 18.3 - - - -
Plastic 169 228.2 68.4 92.3 23.8 23.8
ECAL 63.9 86.3 - 35.2 - 7
Paper /paperboard
63.9 129.4 26.1 - 7 -
Steel 71.1 96 30.9 41.7 24.4 24.4
Aluminium 121.8 164.4 114.4 154.4 49.4 49.4
Wood 11.4 15.4 10.3 14.2 9.1 9.1
Other materials
178 260 178 260 178 260
Packagingforindustrialproductsandforrawmaterials
Glass 13.5 13.5 - - - -
Plastic 23.8 23.8 23.8 23.8 23.8 23.8
Paper /paperboard
7 7 7 7 7 7
Steel 24.4 24.4 24.4 24.4 24.4 24.4
Aluminium 49.4 49.4 49.4 49.4 49.4 49.4
Wood 9.1 9.1 9.1 9.1 9.1 9.1
Other materials
178 55 178 55 178 55
Packagingforindustrialproductsandforrawhazardousmaterials
Glass - 13.5 - - - -
Plastic - 23.8 - 23.8 - 23.8
Paper /paperboard
- 7 - 7 - 7
Steel - 24.4 - 24.4 - 24.4
Aluminium - 49.4 - - - -
Wood - - - - - 9.1
Source: APA (2011)
SPV(Euros/ton)
Packaging Material 2010
Service bags Plastic 228.2
Service bags Paper / paperboard 86.3
Economics of Waste & By-product

Report on Portuguese Environmental Economic Instruments 2010
81
Valormed(Euros/package) Sigeru(Euros/ton)
2006 2007 2008 2009 2010 2006 2007 2008 2009 2010
0.00504 0.00504 0.00504 0.00504 0.00504 336 336 336 336 336
Source: APA (2011) Source: APA (2011)
Used tiresThe Decree-Law 111/2001 and the Decree-Law 43/2004 rule the used tires management regime. Only one license was granted to ensure an integrated management system of used tires, the Valorpneu – Sociedade de Gestão de Pneus, Lda.
The Eco-values practiced for used tires are as follows:
Valorpneu(Euros/tire)
Categoriesoftires 2003 2004 2005 2006 2007 2008 2009 2010
Passengers / Tourism 0.8 0.8 0.8 0.8 0.8 1.00 1.00 1.00
4x4 on/off road 1.79 1.79 1.79 1.79 1.79 1.99 1.99 1.99
Commercial 1.44 1.44 1.44 1.44 1.44 1.57 1.57 1.57
HGV 7.18 7.18 7.18 7.18 7.18 7.81 7.81 7.81
Agricultural (various) 1.71 1.71 1.71 1.71 1.71 2.55 2.55 2.55
Agricultural (Wheels) 8.82 8.82 8.82 8.82 8.82 9.47 9.47 9.47
Industrial (8” to 15”) 3.1 3.1 3.1 3.1 3.1 2.74 2.74 2.74
Solid 3.72 3.72 3.72 3.72 3.72 4.10 4.10 4.10
Civil Engineering (<12,00-24”)
7.14 7.14 7.14 7.14 7.14 8.91 8.91 8.91
Civil Engineering (>=12,00-24”)
40.13 40.13 40.13 40.13 40.13 36.54 36.54 36.54
Bikes (>50cc) 0.56 0.56 0.56 0.56 0.56 0.67 0.67 0.67
Bikes (up to 50cc) 0.11 0.11 0.11 0.11 0.11 0.23 0.23 0.23
Aircraft 0.8 0.8 0.8 0.8 0.8 1.00 1.00 1.00
Bicycles 0 0 0 0 0 0.07 0.07 0.07
Source: APA (2011)
Used mineral oilsThe legal regime on the oil management (old and new) is ruled on by Decree-Law 153/2003, transposing Directive 75/439/EC of the Council of 16 June into Portuguese law, amended by Directive 87/101/EC of the Council of 22 December 1986.

82
The management entity responsible for the management of new oils and used oils to who a license was granted is Sogilub – Sistema Integrado de Gestão de Óleos Usados.
The Eco-values practiced for used mineral oils are as follows:
Sogilub(Euros/litre)
2005 2006 2007 2008 2009 2010
0.063 0.063 0.063 0.063 0.063 0.063
Source: APA (2011)
ValuesAn analysis of the total amount of financial benefits transferred from the producers to the vehicle-entities as a result of collection of Eco-values allows, at least, two brief conclusions.
First, the total amount of eco-value charged in each waste flow tends to be stable over the years, despite changes in their unit values and, eventually, volume of goods in market.
Second, that Eco-value produced its higher economic impact in the packaging sector; on the contrary, the sector in which eco-value produced its lower impact was the one associated to the vehicles waste flow.
Total transferences by waste influx (in Euros)
2003 2004 2005 2006 2007 2008 2009 2010 Total
Batteries and accumulators
N/A 2,266,859 3,236,975 2,513,015 2,384,077 1,566,019 1,344,443 1,897,539 13,644,474.02
Electrical and electronic equipment waste
N/A N/A N/A 10,934,844 4,822,857 22,050,522 20,707,333 21,990,563 80,506,119.00
End-of-life vehicles
N/A 152,486 155,454 171,222 178,365 186,282 184,537 225,609 1,253,955.00
Packaging N/A N/A 46,994,353 43,819,678 55,466,994 56,209,189 58,103,842 - 260,594,056.00
Used tires 7,263,667 8,251,224 8,115,843 8,673,407 9,123,255 10,621,345 9,965,251 10,369,402 65,119,727.00
Used mineral oils N/A N/A N/A 5,587,964 5,678,553 5,632,445 4,995,806 5,156,182 27,050,950.00
Source: APA (2011)N/A: The managing entities were not constituted up to this date / no info available
Economics of Waste & By-product

Report on Portuguese Environmental Economic Instruments 2010
83
Tota
ltra
nsfe
renc
esb
ym
anag
emen
tent
ity(i
nEu
ros)
2003
2004
2005
2006
2007
2008
2009
2010
Tota
l
Ecopilhas
Batt
erie
san
dac
cum
ulat
ors-
por
tabl
e&
indu
stria
lN
/A2,
266,
859
3,23
6,97
52,
513,
015
2,38
4,07
71,
566,
019
1,34
4,44
31,
007,
440
14,3
18,8
28.0
0
AMB3E
Elec
tric
ala
nde
lect
roni
ceq
uipm
ent
was
teN
/AN
/AN
/A10
,232
,884
N/A
16,3
75,0
5416
,897
,466
18,1
43,5
4261
,648
,946
.00
Batt
erie
san
dac
cum
ulat
ors
port
able
an
din
corp
orat
eee
ewN
/AN
/AN
/AN
/AN
/AN
/AN
/AN
/AN
/A
GVB
Batt
erie
san
dac
cum
ulat
ors
vehi
cles
N/A
N/A
N/A
N/A
N/A
N/A
N/A
192,
428
192.
428
ERP
Elec
tric
ala
nde
lect
roni
ceq
uipm
ent
was
teN
/AN
/AN
/A70
1,96
04,
822,
857
5,67
5,46
83,
809,
867
3,84
7,02
118
,155
,914
.96
Batt
erie
san
dac
cum
ulat
ors
port
able
an
din
corp
orat
eee
ewN
/AN
/AN
/AN
/AN
/AN
/AN
/A13
9,95
713
9,95
7
Valorcar
End-
of-li
fev
ehic
les
N/A
152,
486
155,
454
171,
222
178,
365
186,
282
184,
537
225,
609
1,25
3,95
5.00
Batt
erie
san
dac
cum
ulat
ors
vehi
cles
N/A
N/A
N/A
N/A
N/A
N/A
N/A
557,
714
557,
714
Valormed
Pack
agin
gN
/AN
/AN
/A1,
512,
998
1,45
1,88
71,
564,
745
1,58
2,44
91,
721,
496
7,83
3,57
5.00
Sigeru
Pack
agin
gN
/AN
/AN
/A31
1,68
040
5,10
737
0,44
427
0,39
331
4,28
11,
360,
225.
00
SPV
Pack
agin
gN
/AN
/A46
,994
,353
41,9
95,0
0053
,610
,000
54,2
74,0
0056
,251
,000
71,5
00,0
00*
277,
630,
000.
00
Valorpneu
Use
dtir
es7,
263,
667
8,25
1,22
48,
115,
843
8,67
3,40
79,
123,
255
10,6
21,3
459,
965,
251
10,3
69,4
0248
,752
,660
.00
Sogilub
Use
dm
iner
alo
ilsN
/AN
/AN
/A5,
587,
964
5,67
8,55
35,
632,
445
4,99
5,80
65,
156,
182
27,0
50,9
50.0
0
Sour
ce: A
PA (2
011)
N/A
: The
man
agin
g en
titie
s w
ere
not c
onst
itute
d up
to th
is da
te /
no in
fo a
vaila
ble


Report on Portuguese Environmental Economic Instruments 2010
85
4. Urban Waste Services’ Tariffs Regulation
DescriptionThe service sector of urban solid waste management is also fragmented and often assumed by the municipalities themselves or by small vendors, with few economies of scale. In this sector one also encounters the symptoms of economic and financial distortion found in the services sector of water and wastewater.
The General Waste Management Act (Decree-Law 178/2006, 5 September), establishes in its Financial and Economic Framework that tariffs must seek to compensate the social and environmental costs that the producer of the waste generates to the community or the benefits that the community provides. Similarly, the Local Finance Law (Law 2/2007, 15 January) expressly establishes that the tariffs charged by municipalities for the services of urban solid waste management must ensure the recovery of costs incurred directly or indirectly its provision.
These legal commands are also behind of IRAR Recommendation 1/2009, which also applies to entities of urban solid waste services, discerning the structure and criteria to be followed in setting tariffs. The recommendation establishes a framework for the tariff structure that is to be followed by all service-providers, with the following orientation:
• Standard household tariff to be a fixed charge plus a 4-block progressive charge;
• Standard non-residential tariff to be a fixed charge plus a uniform volumetric rate (which must be equal in value to the 3rd household block), thus implying a built-in measure of unavoidable cross-subsidisation of the household by the non-household sectors;
• Block widths for the standard household tariff structure are set in the legislation and prices for each block to be approved by each municipality.
• It should be implemented a social tariff structure for low-income households, as well a larger family plan tariff structure.
The implementation of the recommendation began in 2010, after a period of public discussion in which new tariffs the municipalities and the services’ providers elaborated plans.

86
ValuesRegarding the burden for the end user, it is possible to show the three levels of household consumption more relevant during 2009 in all Portuguese municipalities (60 m3, 120 m3, 180 m3), whereas the 120 m3 consumption is considered by ERSAR as the average level.
One may verify that:
• At fifty municipalities, services are provided without any financial counterpart;
• Most municipalities practice values below or well below the average;
• The average values grow due to the higher rates applied in the higher tariffs, as it is demonstrated by the fact that the average values are always higher than the median ones.
An analysis on full cost recovery will only be available from ERSAR from August 2011, as only then begins its effective economic regulation of entities in models of direct and delegated management.
Tariffs2009(inEuros)
60m3 120m3 180m3
Minimum 0.00 0.00 0.00
Maximum 129.12 258.00 438.00
Average 22.01 31.45 41.98
Median 18.00 24.60 30.60
Source: ERSAR (2011)
0
0
ValueinEuros
200
60m3
� 1
00
� 1
50
� 2
00
� 2
50
� 3
00
150
100
5051
> 3
50
� 3
50
144
90
1506 1 1
Num
ber
ofM
unic
ipal
ities
0.00
20.00
140.00
NumberofMunicipalities
60.00
43
60m3
40.00
100.00
120.00
80.00
1 64 106
148
169
211
295
274
253
232
190
1278522
Source: ERSAR (2011)
MedianAverage
Economics of Waste & By-product

Report on Portuguese Environmental Economic Instruments 2010
87
0
Num
ber
ofM
unic
ipal
ities
ValueinEuros
120�
25
120m30
� 7
5
� 1
00
� 1
50
� 1
75
� 2
25
20
100
80
60 49
40
� 2
75
8
43
94106
01102022
> 2
75
� 5
0
� 1
25
� 2
00
� 2
50
0.00
300.00
NumberofMunicipalities
50.00
43
120m3
150.00
200.00
250.00
100.00
1 64 106
148
169
211
274
253
232
190
1278522 295
Source: ERSAR (2011)
ValueinEuros
180m3
50
0
Num
ber
ofM
unic
ipal
ities
120
0
� 1
50
� 2
00
� 3
00
� 3
50
20
100
80
60
40
� 5
0
� 1
00
� 2
50
� 4
00
102
44
72
22
82 0 3 1 1 0 0 0 0 1 0 1 1 0
� 4
50
0.00
500.00
NumberofMunicipalities
100.00
43
180m3
300.00
400.00
200.00
1 64 106
148
169
211
274
253
232
190
1278522 295
Source: ERSAR (2011)
MedianAverage


0. Synthesis 91
1. Private Investment 93
Public-private investment partnerships in Biodiversity 93
Environmental Compensation 94
2. Public Investment Funds 97
Nature Conservation and Biodiversity Fund 97
Environmental Intervention Fund 98
3. Agro-environmental Incentives 101
Economics of Nature Conservation & Biodiversity


Report on Portuguese Environmental Economic Instruments 2010
91
0. Synthesis
Nature and biodiversity conservation is recognized as the most difficult area of implementation of economic instruments, not only on national experience but also a bit everywhere.
Several obstacles contribute to make it so, but it has been particularly difficult to give ecological services and biodiversity an expression of a monetary nature, even though they arguably comprise the capital stock of any company or country. In other words, the obstacle lies in conducting economic evaluation of ecological services and biodiversity. The effort in this area has gone through to create the conditions for closer cooperation between business and nature conservation and biodiversity. Particularly through the adoption of instruments by which contributions made by any private operator for the conservation and improvement of ecological services and biodiversity turn in tangible assets for its business.
This goal has been explored in the context of public-private environment, anchored in the ICNB activity, especially in the context of existing regimes of environmental compensation in Portugal. In this particular case, the Legal Framework for Conservation of Nature and Biodiversity enables economic agents to offset the environmental impacts caused by them through the financing of conservation of nature and biodiversity in areas included in the Fundamental Network of Nature Conservation. Investments made under this scheme are already significant, especially when they pass by the scope of FCNB.
As for the FIA, the data suggests that it is not really an instrument at the service of conservation and environmental improvement. And that it will only be so when financial difficulties are remedied. In fact, the inflow of revenue for the fund is characterized by slowness and uncertainty: less than three million euros in three years of activity is clearly short of the needs that any environmental guarantee fund features. This situation should be solved by strengthening the control of environmental offenses fines collection, and especially by the introduction of the surcharge on the collateral constituted by the operators to the effects of environmental liability coverage, as it is expressly provided for since 2008 on the Legal Framework of Environmental Damage Liability.
Finally, it is worth mentioning the application of economic instruments in the form of subsidies by public authorities in the agricultural sector, with the aim of reconciling the economic activity with nature conservation and biodiversity. The agri-environmental incentives transform the environmental benefit in a benefit of economic nature; that is the case for the implementation of organic production methods, the conservation of the variability of plant and animal genetics, the utilization of local varieties or the conservation of natural or scenic values. These incentives normally take place in areas classified by value and/or natural landscape, particularly in Natura 2000 zones and the Douro area.


Report on Portuguese Environmental Economic Instruments 2010
93
1. Private Investment
Public-private Investment Partnerships in Biodiversity
DescriptionServices of general economic concern, including environmental protection, are public because the regulation of such services is based on public rules defined by public entities directly or indirectly legitimized. But there is an open path of collaborative relationships between State and economic agents, united around common goals, in which agents offer their expertise and financial resources, allowing the State to function with greater efficiency and effectiveness: in other words, public-private partnerships or similar in environmental domain.
In biodiversity domain, the environmental entities chronic budget shortage was dealt with by adapting the public-private partnerships. This adaptation follows the general guidelines of State’s financial activity, i.e., without place to the approval of a special regime of environmental public-private partnerships.
With the legal form of Public-Private Partnership two Bird Rehabilitation Centres were created, one at Serra da Estrela and another at River Formosa, with funds from ANA – Portuguese Airports, SA, and management of ALDEIA Organization with delegated powers from ICNB, after a public tender. These initiatives involve the amount of € 400.000,00.
In addition to the partnerships referred, there are nature conservation investment actions performed by a considerable number of companies under the Business & Biodiversity Initiative. As known, the main target of this initiative is to enhance the relationship between companies and biodiversity, allowing a significant contribution to biodiversity protection and to achieve 2010 target of stopping biodiversity loss at local, national, regional and global levels. This initiative is promoting, through long-term voluntary agreements, a common ground for collaboration between two distinct systems: business and biodiversity, promoting the introduction of biodiversity in companies’ strategies and policies.
ValuesUnder this initiative, private companies and the ICNB join forces to carry out tasks of common interest whose purpose is the preservation of biodiversity. Since it is a voluntary and diversified initiative, investment values are not included in the Memorandums of Understanding but only the investment purposes. So it is not possible to identify accurately the right amounts.
This initiative has already 49 private members, including banks, cement plants, civil construction, electricity producers, paper producers, oil companies and the air, rail and road transportation.

94
Environmental compensation
DescriptionThe difficulty of attributing an economic value to biodiversity hampers the creation of biodiversity markets with an economic extent and acceptance equal to the other environmental markets fully implemented, as carbon markets or waste markets.
However it has been created an early biodiversity market in Portugal, by enforcing economic agents to offset damages created to the environment, in particular biodiversity, by means of (1) paying the recuperation or compensation of affected ecosystems or (2) by paying the same measures in other ecosystems of equal value. The essential goal of internalization of social costs is assured, and in some sense an economic evaluation of biodiversity similar to an evaluation that would be made by a market is thus achieved.
Investment made through environmental compensation takes place within the Nature Conservation and Biodiversity Legal Framework (Decree-Law 142/2008), which predicts that funding the activities of conservation and biodiversity in areas which are part of Key Network of Nature Conservation should be promoted in articulation with private entities.
Specifically, article 36 of the Legal Framework of Nature Conservation and Biodiversity sets that economic agents can implement environmental compensation instruments in order to ensure satisfaction of the conditions and/or mandatory requirements depending on the implementation of projects and actions under the Legal Framework of Environmental Impact Assessment or the Legal Framework of Natura Network 2000.
Environmental compensation must be executed by developing projects or actions in areas integrated of Key Network of Nature Conservation, such as National Parks or other Protected Areas. These projects or actions can be drawn or implemented by the economic agent, under the approval of ICNB or FCNB; or, alternatively, an economic agent can choose to fund the FCNB’s projects. Anyway, it is essential that initiatives may produce environmental benefits equivalent to environmental costs caused, assessment that is subject to a certification procedure made by environmental authorities.
ValuesIn these projects and only in the main ones are involved a dozen companies with investments in conservation around 3.8 million Euros. At this moment, investments made by companies in partnership with the ICNB pursuing the procedures for environmental assessment or partnerships negotiated with the ICNB are in progress, as follows:
Economics of Nature Conservation & Biodiversity

Report on Portuguese Environmental Economic Instruments 2010
95
PrivateinvestmentsinpartnershipwithICNB
Economicagent Project Investment
ANA – Aeroportos de Portugal
Support to bird rehabilitation centres at Ria Formosa Natural Park and at Serra da Estrela Natural Park
€ 40 000/year, during 3 years
ANA – Aeroportos de Portugal
Compensation for extension of airport runway: investment in start up of weed species, monitoring of avifauna and observatories of avifauna at Ria Formosa Natural Park and at Castro Marim Nature Reserve
€ 1.6 Million
BRISA – Auto--estradas de Portugal
Preparation of plans to manage colonies for bird nesting € 10 000
REN – Redes Energéticas Nacionais
Avifauna monitoring project € 29 768
Somincor e EDIA Investment in a ictological centre to manage endemic species of Guadiana River with emphasis on the Saramugo species, at risk
€ 13 000
e-Value Investment in forestation with native species at Peneda Gerês National Park (counterpart in carbon credits)
€ 8/Ton/year (1000 ton for
30 years)
Portucel Compensations for each paper mill: annual investments in Estuário do Sado Nature Reserve conservation
€ 27 000/year, during 10 years
SONAE Turismo Compensation for the new crossing of Sado river by ferry: investment in the conservation of Sado Estuary Nature Reserve, especially managing dolphins
€ 180 000/year
Soltroia Compensation for the construction of hotel: investment in the Sado Estuary Nature Reserve Under evaluation
Carlinca Compensation for plant deployment: investment in the conservation of Sado Estuary Nature Reserve
€ 50/ton/year
REN – Redes Energéticas Nacionais
Compensation for pipeline crossing at Sancha and Santo André Lagoons: investments in conservation projects in the Natural Reserve of Sancha and Santo André Lagoons
€ 200 000
ENERSIS Compensation for wind farms deployment: investment in the Environmental Interpretation Centre Parque at Serra de Aire and Candeeiros Natural Park
€ 50 000
Irmãos Cavaco, SA
Rehabilitation of habitats at Sintra Cascais Natural Park € 575 000
Source: ICNB (2010)


Report on Portuguese Environmental Economic Instruments 2010
97
2. Public Investment Funds
Nature Conservation and Biodiversity Fund (FCNB)
DescriptionEnvironmental funds also reflect the results of the deep reflection on the dimension and forms of action of the State, creating solutions of greater economical, administrative and environmental rationality meaning the State is able to cooperate with private sector and to adopt private law solutions. This is what happens with the creation of public funds for the purpose of direct intervention in market or management of environmental compensation regimes.
The establishment of the Nature and Biodiversity Conservation Fund (Fundo de Conservação da Natureza e Biodiversidade – FCNB) has been ongoing since 2009 under the Legal Framework of Nature Conservation and Biodiversity (Decree-Law 142/2008). The FCNB has been formally established on August 3, 2009 through Decree-Law 171/2009. In September 2009, a Draft Ordinance was drawn up to regulate this fund, settling 2010 as the actual starting date. The circumstances surrounding the electoral process and the subsequent arrival of the new government delayed the proposal’s approval, presently in its final stage.
The FCNB was established to support the management of the Key Network of Nature Conservation through the allocation of resources to the necessary and appropriate projects and investments. With the adoption of operational regulations and the constitution of a management team in the second half of 2010, it could be said that Portugal has implemented, yet in an embryonic form, an innovative measure to encourage financing the Natura 2000 management. It is achieved through an autonomous management specialized Fund as well as an objective investment boost.
Its key objectives are to promote public and private investment in nature conservation projects and initiatives, to develop knowledge, to increase awareness of nature conservation issues through education and to create incentives and tools to encourage entrepreneurship in Protected Areas.
Even though being an autonomous entity, the FCNB is managed by the ICNB, not aiming at overlapping the ICNB budget. Quite to the contrary, the ICBN won’t be direct recipient of FCNB. The resources allocated to the Fund will be used primarily to encourage social investment in conservation and biodiversity enabling a sustained increase of social awareness to the risks of biodiversity loss.
The main financing source of the Fund is the financial product of the system of environmental compensation. In addition to measures to minimize environmental impacts in situ based on Environmental Impact Assessment, the FCNB may manage the implementation of other environmental compensation.

98
The FCNB is also financed by government budget, by other funds, through donations, by tax incomes or other similar mechanisms that may be assigned.
The FCNB may participate in or integrate other funds not only to increase its critical management ability but also to evolve to other financial solutions in the conservation field, such as countervailing duties future markets.
According to 2010 State Budget, FCNB represents an investment around € 1 000 000.
Environmental Intervention Fund (FIA)
DescriptionEnvironmental Basic Framework for Administrative Offences (Law 50/2006), which provides the legal scheme for administrative offences in environmental matters, created the Environmental Intervention Fund (Fundo de Intervenção Ambiental – FIA), finally regulated by the Decree-Law 150/2008.
The FIA is an environmental guarantee and recovery fund. It is drawn as a public tool to prevent and remedy environmental damage that may occur as result of detrimental activities. It funds actions and protective measures as well as the recovery of environmental liabilities. It also has to bear the cost of public intervention in preventing and restoring environmental damages set out in Legal Framework of Environmental Liability, approved by Decree-Law 147/2008 (that transposed Directive 2004/35/CE, of the European Parliament and of the Council, 21st April 2004, on environmental liability with regard to the prevention and remedying of environmental damage).
The FIA Management Regulation was published 13th July 2010 by Portaria n.º 486/2010, establishing the procedures for presentation and selection of intervention projects, the payment and financing rules, as well as the terms of reimbursement. At 13th August 2010 the FIA procedure manual was finally approved, setting the terms and process to be followed by beneficiaries from the presentation to the conclusion of the funding eligible project.
The FIA finances public entities initiatives, such as prevention of serious and imminent threats to natural or human environmental components, prevention and remediation of any damage to natural or human environmental components caused by natural disasters or accidents, elimination of environmental liabilities, recovery of environmental damage whose prevention and repair is not covered by environmental liability regime and, finally, all sort of action in situations of delay, difficulty or impossibility of charging or compensating for damage to natural or human environmental components.
Economics of Nature Conservation & Biodiversity

Report on Portuguese Environmental Economic Instruments 2010
99
The activity of FIA and the selection of which projects to finance in particular, is ruled according to the following descending order of priorities:
a) Prevention, removal and minimization of extreme situations for people and goods;
b) Recovery of operation of basic environmental infrastructure;
c) Rehabilitation and recovery of natural and human environmental components;
d) Promotion of balanced, rational and sustainable environmental and economical usage of natural resources.
The FIA can act as a sinking fund, in the sense that financing can be carried out without return or payment; however, it acts preferentially as a revolving fund or even as an investment fund, since funding should be repaid and may be recovered through participation in income from projects implementation and may be remunerated by charging interests. Its (dual) genesis is based upon the polluter-pays principle. Therefore, its incomes are as much a product of fines collected on behalf of environmental administrative offences as well as a surcharge applied to financial guarantees constituted by economical agents under the legal framework of Environmental Damages Liability.
ValuesThe FIA´s financial resources have grown moderately since its creation, which is explained by two reasons: (1) revenues from environmental administrative offences fines implies sometimes full processing of its cases, including those in court, which extends the time of income collection; (2) regarding surcharge applied to financial guarantee under the environmental liability regime, collection has not started yet.
FIAoverallresources(inEuros)
Fines Others Total
2008 131,885.52 - 131,885.52
2009 1,227,490.13 131,885.52 1,359,375.65
2010 1,579,006.77 1,301,058.91 2,880,065.68
Source: FIA Activity Report 2008-2009 (2010) and FIA Activity Report 2010 (2011)
During 2008 and 2009 it would be impossible to grant any funding to projects submitted to FIA, as FIA must first be capable to support the expenses that may be generated to the Portuguese State

100
regarding the enforcement of the Environmental Liability Act (article 23 of Decree-Law 147/2008). As such, it was necessary to accumulate in FIA a minimum amount that would enable the competent authorities to act promptly in case of need. For that reason, the revenues of 2008 were capitalised to 2009; and again all revenues of 2009 were capitalised to 2010.
As the Management Regulation only entered into force in 14th July 2010, only afterwards it was possible to begin the submission of projects for FIA approval, more precisely. Nonetheless, during that period no project was applied for funding by FIA. As such, during 2010 there was no financial execution associated to funding projects.
FIArevenuessources(inEuros)
2008 2009 2010
IGAOT 0.00 943,223.06 1,407,102.65
Courts 150.00 8,850.00 21,719.06
CACMEP 0.00 535.71 3,869.17
ARHNorte 0.00 9,576.00 0.00
ARHCentro 0.00 0.00 100.00
ARHTejo 0.00 0.00 15,516.33
ARHAlentejo 0.00 0.00 818.15
CCDRNorte 131,111.42 215,860.76 34,452.26
CCDRCentro 0.00 11,846.15 30,263.88
CCDRLVT 374.10 200.00 125.00
CCDRAlentejo 0.00 26,485.95 58,564.72
CCDRAlgarve 0.00 0.00 725.00
CMMontemor-o-Novo 250.00 1,375.00 1,413.18
CMLagos 0.00 8,000.00 1,500.00
CMdeValongo 0.00 1,462.50 1,252.37
CMdeGuimarães 0.00 75.00 310.00
CMSãoBrásAlportel 0.00 0.00 125.00
SLFLoulé 0.00 0.00 250.00
SLFOdemira 0.00 0.00 900.00
Total 131,885.52 1,227,490.13 1,579,006.77
Source: FIA Activity Report 2008-2009 (2010) an FIA Activity Report 2010 (2011)
Economics of Nature Conservation & Biodiversity

Report on Portuguese Environmental Economic Instruments 2010
101
3. Agro-environmental Incentives
DescriptionPart of government action in biodiversity conservation lies in the field of compatibility between economic activities and the ecological services available. The agricultural sector is, for obvious reasons, a sector capable of producing effects with particular focus on biodiversity; therefore, there is a strong public investment in measures that permit the coexistence of economic activity with these values.
As a rule, the investment takes the form of incentives (subsidies) that shape the environmental benefit as an economic one. Some actions support farmers to implement organic production methods; others aid the maintenance and conversion of production methods. Others are intended to conserve the plant and animal genetic diversity, promoting economic development for the use of local varieties and value traditional knowledge associated with plant genetic resources.
The integrated territorial interventions aimed at the conservation of natural values or scenery and, therefore, take place in areas classified by value and / or natural landscape, particularly in Natura 2000 and the Douro area. Each Integrated Territorial Intervention is specific to the territory that was created in accordance with their particular conditions. For each ITI are identified agricultural systems and are relevant to the conservation of natural values identified. The proposed measures aim, in this case, support the maintenance and recovery of systems at risk of abandonment or conversion, paying for the service of conservation or landscape maintenance provided.
ValuesOver the past years various incentives were granted in the form of agri-environment and forestry incentives, as well as encourage to non-productive investments.
Paidincentives(inEuros)
2007 2008 2009 2010
Meansofproductionvalorization 33,119,741 52,517,696
Changes of agricultural production methods
23,511,521 41,296,901
Domestic biodiversity protection 3,050,824 4,873,994
Genetic resources conservation and development
6,557,395 5,872,269
Soil conservation 474,532
IntegratedTerritorialInterventions 5,497,891 7,820,681
ITI management support 72,399 102,986
ITI Douro Vinhateiro 2,244,488 3,192,756
cont.

102
Paidincentives(inEuros)
2007 2008 2009 2010
ITI Peneda Gerês 1,732,958 2,465,112
ITI Montesinho - Nogueira 158,122 224,927
ITI Douro Internacional 444,000 631,584
ITI Serra da Estrela 61,233 87,103
ITI Tejo Internacional 52,812 75,124
ITI Serra de Aire e Candeeiros 7,067 10,053
ITI Castro Verde 722,633 1,027,936
ITI Costa Sudoeste 2,179 3,100
Total 0 36,180,148 38,617,632 60,338,377
Economics of Nature Conservation & Biodiversity
cont.

