report of working committee 7 “ industrial utilisation & power...
TRANSCRIPT

22nd World Gas Conference June 1-5, 2003 Tokyo, Japan
Report of Working Committee 7
“ Industrial Utilisation & Power Generation ”
Rapport du Comité de travail 7
“ Utilisations des gaz industrielle et production d'electricite”
Chairman/Président
Dr Robert Harris
United Kingdom
1

ABSTRACT
This report provides a formal record of the work undertaken by IGU Working Committee 7 focussing on key issues relating to industrial gas utilisation and power generation during the triennium 2000-2003. Details are also provided on membership of the committee during this period and separate reports are included on the results and conclusions generated from the work specifically carried out by three study groups focussing on:-
Opportunities for gas in distributed power generation.
•
•
•
•
•
•
New developments to improve the competitiveness of industrial gas applications. Future business opportunities for the Gas Industry in a Hydrogen economy.
RESUME
Ce rapport constitue la synthèse du travail effectué par le comité 7 de l’UIIG. Il présente les
problématiques essentielles des utilisations industrielles du gaz naturel dont, en particulier, la production d’électricité, pour la période 2000-2003. Il fournit aussi des informations sur la participation des membres au comité durant cette période. Les résultats et conclusions des travaux sur les sujets spécifiques menés par les trois groupes d’études font l’objet de rapports séparés :
Opportunités pour le gaz naturel en production d’électricité répartie n Nouveaux développements pour l’amélioration de la compétitivité des utilisations industrielles du gaz.
Opportunités futures pour l’industrie du gaz dans une économie de l’hydrogène
2

TABLE OF CONTENTS 1. Introduction 2. General conclusions and recommendations 3. Acknowledgements 4. Report of Study Group 7.1 – Opportunities for gas in distributed Power Generation 5. Report of Study Group 7.2 – New development to improve the competitiveness of industrial
gas applications 6. Report of Study Group 7.4 – Future business opportunities for the Gas Industry in a Hydrogen
Economy
Appendix 1. Membership of Working Committee 7 Appendix 2. Committee Meetings
3

1. INTRODUCTION This report provides the formal record of the significant studies undertaken by WOC 7 during the triennium 2000 – 2003 specifically related to Industrial Gas Utilisation and Power Generation. In many countries of the world industry is the largest gas-using sector and offers important potential for future growth in gas consumption. However, whilst gas offers many advantages over other forms of energy and is a key fuel for almost every aspect of industrial production, the industrial gas market faces many challenges. Deregulation of both gas and electricity markets throughout the world is promoting increased competition and industry restructuring supported by the accelerating developments in information technology is changing the way customers purchase, use and monitor energy. In addition, increasing focus on environmental issues is promoting requirements to improve energy efficiency and reduce emissions. Demand for electricity continues to grow significantly throughout the world and as a result of increasing availability of gas supplies and combined cycle gas turbine technology developments, natural gas has been taking an increasing share of the centralised power generation market. Decentralised, or distributed power generation, however, offers advantages in higher energy efficiency, reduced emissions and integrated energy services. Adding technology to provide a cooling option, to co-generation can also be attractive. However, despite the advantages offered by co-generation, market barriers exist which need to be carefully evaluated and addressed if the full potential for gas in this market can be realised. Opportunities also exist to promote the use of gas as a feedstock for conversion into other products including hydrogen, necessary for example in many types of fuel cells. Looking to the future, consideration is needed of the issues and opportunities for the gas industry in the possible development of a hydrogen based economy. In preparing its report for the 22nd World Gas Conference, Committee 7 has directed, reviewed and co-ordinated the work of three Study Groups. Study Group 7.1 has reviewed the continuing opportunities for gas in distributed power generation identifying and providing access to key information on both the current barriers and incentives relating for example to fuel price, regulations such as interconnection issues and technology developments. Study Group 7.2 has concentrated on assessing new and emerging technology developments in combustion and process control techniques for the use of gas in industry, in order to share knowledge and information which in turn can help improve the competitive position of gas in different countries. The results should also allow individual gas companies and suppliers of gas equipment to target further R&D or marketing activities towards industries and applications which offer potential for growth. Study Group 7.4 has surveyed the current gas industry’s role in hydrogen, considered the future of hydrogen in the energy business and identified short, medium and longer term opportunities for the Gas Industry in a future hydrogen economy. The report, which builds on earlier studies within IGU provides the industry with an informed basis for business decisions. The committee also began its work with an intention to complete a further study (SG 7.3) relating to the impact of information technology in creating new opportunities in the sale, purchase and use of gas in industrial applications. This work was subsequently combined with an equivalent project in WOC6 (Domestic Gas Utilisation). However owing to organisational difficulties compounded to some extent by the tragic events of September 11th responsibility for the topic was subsequently transferred to IGU TFA. The latter planned and organised a very successful conference on Information and Communication Technology in the gas industry in Prague, Spring 2002. During the course of the current triennium two special reports have also been prepared within the remit of WOC7 on behalf of IGU and published and presented at major international conferences
4

by the WOC7 Chairman Dr Bob Harris (references 1 and 2 below), helping to promote the status and influence of IGU in the developing energy market. Finally, the committee was also responsible for the development of the WOC7 programme at WGC 2003. This programme includes presentations on all three study group reports included in this document supported by Round Table discussion sessions focussing on distributed power generation and the role of gas in the future hydrogen economy. WOC7 was also very encouraged to receive many offers of papers to be selected for inclusion in technology forum sessions to be held at WGC 2003 and subsequently selected some 34 papers to be presented in interactive poster sessions.
The Potential for Natural Gas to contribute to a Hydrogen Energy Future, Harris R.J., Saint-Just. J., Asaoka Y., Thatcher D.R.P., World Energy Conference, Buenos Aires, November 2001
•
• Safety Aspects of Natural Gas Utilisation in Power Generation and Industry, Harris R.J., and Sheperd K.D., China Gas 2001, Chonqing, November 2001
5

2. GENERAL CONCLUSIONS AND RECOMMENDATIONS
The results and conclusions from each study group in WOC 7 are presented in separate succeeding sections of this report. However, key points arising out of the Study Group (SG) work, together with some general recommendations for IGU to consider in future, are drawn together here. First it is clear that whilst substantial interest in gas fired distributed power generation (DPG) remains and significant technology improvements continue, the market opportunity is very sensitive to the price of both gas and electricity. During the period of this study, gas prices – usually linked to the price of oil – have risen, whilst electricity prices – influenced in many countries by market liberalisation and deregulation – have fallen, rendering the economics of gas fired DPG much less attractive. Without other incentives, for example promoting reduced CO2, the fully potential for gas fired DPG will not be realised. Since the last World Gas Conference in 2000, no major breakthroughs have been reported in industrial gas applications. However, a number if improved technology developments have been made, as described by SG7.2 in their report and they have also shown that even in a mature market, there are still possibilities to find new applications for gas. SG7.2 have also drawn attention to a reduced concern/demand for new developments as one consequence of market liberalisation. This means that trading companies and transport companies become less willing to spend on technology developments, particularly where as a result of competition it may be more difficult to receive a sufficient return on the investment concerned. Co-operation between equipment suppliers and gas companies is still important but new mechanisms to encourage wider support for research, development and demonstration will have to be found. Finally, it is important to note that the comprehensive report prepared by SG 7.4 is not intended as a plea for hydrogen economy has begun and even if somewhat controversial and not of immediate market relevance, it cannot and should not be ignored. The report aims to help a well informed gas industry make the right decisions about the level of its future involvement and identifies potential business opportunities in the short, medium and longer term. It is worth noting that following the tragic events of September 11, ensuring security of supply has become an important argument for the proponents of a hydrogen future, which now include the US and European Union governments. It is recommended that IGU perpetuate the existence of a dedicated group on hydrogen. Along with electricity, hydrogen will be a major carrier of energy in the future. It will be a threat if the gas industry ignores it but could provide a wealth of opportunities if the gas industry is involved in its development. The group should ideally be given the status of a Programme Committee of Task Force, cutting across the different technical committee areas and should maintain an objective to keep the gas industry informed of the threats and opportunities created by hydrogen, whilst establishing closer links with those companies and organisations, including government organisations, supporting and investing in hydrogen related studies. More generally, the value of IGU membership linked to opportunities for international networking and information exchange need to be promoted. WOC 7 has found particular value in ensuring at each meeting time for members to report on developments and related issues in their countries and would recommend the new IGU co-ordinating committee to consider ways of ensuring that this valuable information can be accessed and share more widely as a benefit of IGU membership. WOC 7 would also support the intended concept of using WOC contacts for benchmarking relevant business processes on a confidential non-attributable basis.
6

3. ACKNOWLEDGEMENTS The undertaking of the studies described and the preparation of this report would not have been possible without the dedication and support of many people. I would wish therefore to record my sincere thanks to all members of WOC 7 and the Study Groups but in particular to the Study Group Chairman, Dr Sam Bernstein (SG 7.1 – USA) Dr Klaas Beukema (SG 7.2 – Netherlands) and Dr Jacques Saint-Just (SG 7.4 – France) without whose unstinting efforts and expertise, none of the work would have been possible. I would also wish to record my sincere appreciation to the WOC 7 Vice- Chairman Jean-Pierre Roncato (France) for his support and wise-counsel and to the secretary of WOC 7 Colin Heap (UK) for organising our meetings and helping ensure they were always conducted in a supportive, informal but business focussed way. Last but not least my grateful thanks on behalf of IGU to all those WOC 7 members, their companies and/or national member organisations, who respectively arranged and provided financial support for the meetings held by WOC 7 and its Study Groups. Their warm hospitality, support and commitment to IGU has been greatly appreciated. Dr. R. J. Harris 31 January 2003
7

4. REPORT OF STUDY GROUP 7.1
“Opportunities for Gas in Distributed Power Generation”
Rapport du Groupe d’étude 7.1
“ Opportunités pour le gas natural en production d’ electricité”
Chairman/Président
Sam Bernstein
United States of America
8

TABLE OF CONTENTS
1. Introduction 2. Definition and General Information
3. Liberalisation of Gas and Electricity Markets
3.1 Asia
3.2 Europe
3.3 North America
4. Member Country Perspectives
4.1 Belgium 4.2 Chech Republic
4.3 Denmark
4.4 Finland
4.5 France
4.6 Germany
4.7 Italy
4.8 Japan
4.9 The Netherlands
4.10 Norway
4.11 Spain
4.12 Sweden
4.13 United Kingdam
4.14 United States
5. Barriers 6. Incentives 7. Reference Material 8. Acknowledgements
9

1. INTRODUCTION
The focus of this paper is to assess the worldwide perspective of distributed generation (DG) and combined heat and power (CHP). Some of the following questions will be addressed:
• What is the status of deregulation and liberalization?
• What impact has deregulation and liberalization of the gas and electric markets had on DG and CHP?
• What are the barriers to implementing DG and CHP?
• What incentives are promoting DG and CHP?
2. DEFINITION AND GENERAL INFORMATION
Distributed generation (DG) systems are parallel and stand-alone electric generation units located within the electric distribution system at or near the end user. DG systems range in size and capacity from a few kilowatts up to 10 MW. They comprise a portfolio of technologies, both supply-side and demand-side, that can be located at or near the location where the energy is used. Many of these technologies are commercially available or under development. Distributed power generation systems include microturbines, combustion turbines, internal combustion (IC) engines, Stirling engines, fuel cells, photovoltaic (PV) systems, and wind turbines.
DG technologies are playing an increasingly important role in the world-wide energy portfolio. They can be used to meet baseload power, peaking power, backup power, remote power, power quality, as well as cooling and heating needs.
Combined heat and power (CHP) systems produce electricity at or near a thermal load, utilizing waste heat produced by the DG equipment. In applications where thermal energy (i.e., heat) is required, the total efficiency of separate heat and power systems may total only 45 percent. However, there is a tremendous efficiency opportunity to combine electricity generation with thermal loads in buildings and factories, converting as much as 85 percent of the fuel into usable energy (Figure 1). CHP systems can provide electricity, hot water, heat for industrial processes, space heating and cooling, refrigeration, and humidity control to improve indoor air quality and comfort.
10

Figure 1. Combined Heat and Power versus Conventional Power Generation
DG technologies are typically installed for one or more of the following purposes:
• Overall load reduction — using energy efficiency and other energy-saving measures to reduce total consumption of electricity, sometimes with supplemental power generation (see below).
• Energy independence — using on-site power generation to meet all energy needs, usually to ensure power reliability and/or power quality, in one of two configurations:
• Grid-connected — using grid power as a backup electricity source during failure or maintenance of the on-site generator.
• Off-grid — stand-alone power generation for the purpose of self-sufficiency, usually including energy-saving approaches and an energy storage device for backup power. This includes most village power applications in developing countries.
• Supplemental power — augmenting grid electricity with distributed generation for one of two reasons:
• Standby power — using a generator as a backup electricity source to ensure power availability during grid outages.
• Peak shaving — reducing demands for grid electricity during peak periods, usually to avoid the higher rates ("peak demand charges") imposed on big electricity users at these times.
• Net energy sales — homeowners and entrepreneurs generating more electricity than they need and selling the surplus to the grid.
• Combined heat and power — capturing waste heat from a power generator and using it in manufacturing processes, for space heating, or for water heating, thereby significantly improving the efficiency of fuel utilization.
• Grid support — installed by power companies for a wide variety of reasons, including meeting higher peak loads without having to invest in infrastructure (line and substation) upgrades.
11

High capital costs are presently the norm for many DG technologies and serve as a deterrent to their widespread implementation. However, as production levels and sales increase, it is expected that economies of scale will result in decreased equipment costs. Table 1 illustrates the variation in initial equipment costs and those costs associated with the operation and maintenance (O&M) of the DG system.
Table 1. Capital Cost of Selected DG Equipment
DG Technology Capital Cost ($/kW) O&M Costs (¢/kWh)
Microturbine 700-1,100 0.5 - 1.6 (estimated)
Combustion Turbine 300-1,000 0.4 – 0.5
IC Engine 300-800 0.7 – 1.5 (natural gas) 0.5 – 1.0 (diesel)
Stirling Engine 2,000-50,000 ---
Fuel Cell 3,500-10,000 0.5 – 1.0 (estimated)
Photovoltaic 4,500-6,000 1% of initial investment per year
Wind Turbine 800-3,500 1.5% – 2% of initial investment per year
A 1999 U.S. Department of Energy report, Distributed Utility Perspectives, examined 275 distributed energy resource (DER) projects in the United States, managed by 121 different companies, to find out why the distributed resource was being used (see Figure 2). The report found the top three applications of DG, in order of importance, are:
• Electricity supply
• Deferral of transmission and/or distribution system upgrades
• Power quality and reliability
12

Figure 2. Applications of Distributed Generation Installations (total of 407 occurrences for 275 projects) Source: Distributed Utility Associates
Many stakeholders are expected to benefit from DG and CHP system implementation. These stakeholders include the following:
• Developers and manufacturers of DG and CHP systems and components
• Support service providers (e.g., fuel and equipment maintenance providers)
• Homeowners
• Business owners (including commercial facility managers)
• Industrial facilities
• Construction community (e.g., A&E firms, homebuilders, urban developers, etc.)
• Utilities
• Regulators (e.g., state public utility commissions)
• Policy makers (e.g., senators, state reps, federal agencies)
• Bodies that develop codes and standards
• Fire and building code officials
• Permitting agencies (e.g., environmental, land, etc.)
13

• Investment community (e.g., venture capitalists, investment banks, stockbrokers, etc.)
Two of the largest stakeholder groups include power consumers and power providers. Each of these groups can realize significant benefits from the use of DG and CHP. Primary benefits of DG and CHP to the electric consumer may include:
• Better power reliability and quality
• Lower energy costs
• More choice in energy supply options
• Greater predictability of energy costs (lower financial risk) with renewable energy systems
• Energy and load management
• Combined heat and power capabilities
• Environmental benefits — including cleaner, quieter operation, and reduced emissions
• Faster response to new power demands — as capacity additions can be made more quickly
Benefits of DG and CHP to power providers include:
• Reduced energy losses in transmission lines
• Reduced upstream congestion on transmission lines
• Reduced or deferred infrastructure (line and substation) upgrades
• Optimal utilization of existing grid assets — including potential to free up transmission assets for increased wheeling capacity
• Less capital tied up in unproductive assets — as the modular nature of distributed generators means capacity additions and reductions can be made in small increments, closely matched with demand, instead of constructing central power plants sized to meet estimated future (rather than current) demand
• Improved grid reliability
• Higher energy conversion efficiencies than central generation
• Faster permitting than transmission line upgrades
• Ancillary benefits — including voltage support and stability, contingency reserves, and black start capability
14

3. LIBERALIZATION OF GAS AND ELECTRICITY MARKETS
3.1 Asia
Many Asian countries have permitted private foreign participation in areas such coal mining, production and exploration of oil and natural gas fields, and production of electric power. At a domestic level, Korea has deregulated its oil refining industry and conceived a comprehensive energy reform strategy, with a progressive and committed electricity deregulation program. China too has begun to take steps towards opening up the power generation sector. Since March 2000, electric power supply to customers who have a contract over 2,000 kW has been liberalized in Japan, with the liberalization of the power generation market to be expanded in the future. Nonetheless, more work remains to further deregulation as well as regional and multilateral integration of energy markets. Distribution and transmission remains largely state controlled in these economies, and there is no commitment as yet from these economies on opening up this service sector to multilateral trade liberalization.
The political and economic systems of the ten Association of Southeast Asian Nations (ASEAN) member countries are varied (Figure 3). But, all are heading towards adopting the consumer-market-based economic model for power. As a consequence of this shift from mainly centrally planned government dominated power systems national power utilities are being unbundled, privatized, and deregulated.
The Heads of ASEAN Power Utilities/Authorities have adopted a roadmap towards regional power interconnection and promotion of electricity trade. The master plan study to establish the ASEAN Power Grid is expected to be completed in March 2003.
?
Vertically Integrated Unbundled Wholesale
CompetitionFull Customer
Choice
Brunei
Cambodia
Lao PDR
MyanmarVietnam
2007
2004
2002
2003
2010
?
Philippines
Indonesia
Thailand
Malaysia
Singapore
??
Vertically Integrated Unbundled Wholesale
CompetitionFull Customer
Choice
Brunei
Cambodia
Lao PDR
MyanmarVietnam
2007
2004
2002
2003
2010
?
Philippines
Indonesia
Thailand
Malaysia
Singapore
Source: “Overview of the Privatization and Deregulation Initiatives in the ASEAN Power Sector” presented by Guillermo R. Balce, DSc. at Metering Asia-Pacific 2002 – Singapore, 9-11 April 2002.
Figure 3. ASEAN Member Deregulation Plans
15

3.2 Europe
According to the EU’s second benchmarking report detailing the implementation of the internal electricity and gas markets, liberalization is progressing. In electricity, there has been a general increase in the level of market opening. There also has been progress in the degree of unbundling, and greater clarity and transparency in regulation. Progress in the gas market is limited and more uneven. Key problems remain in both segments1.
Electricity Market Problems
• Differential rates of market opening continue to reduce the benefits of competition to customers and promote distortion of competition between energy companies.
• Disparities in access tariff due to the lack of transparency caused by insufficient unbundling and inefficient regulation.
• Impeding new entrants due to the high level of market power among existing generating companies associated with lack of liquidity in wholesale and balancing markets.
• Insufficient interconnection infrastructure between member states and, where congestion exists, unsatisfactory methods for allocating scarce resources.
Gas Market Problems
• Unequal levels of market opening.
• Inappropriate tariff structures and large and unexplained disparities in network access tariff between countries and regions for transportation and distribution transactions, which form a barrier to competition and provide revenue for cross-subsidies.
• Lack of transparency regarding the availability of infrastructure capacity, both internally and cross-border, as well as capacity-reservation procedures which do not allow third parties the flexibility to change their gas sources or customer base without incurring increased costs.
• Concentration of gas production and importation in a few countries and slow development of trading hubs, which often means that new entrants find it very difficult to buy wholesale gas on reasonable terms.
• Balancing regimes that are unnecessarily stringent, being non-market based and not reflective of the costs incurred.
1 Energy Markets, Benchmarking Study Shows Progress in Liberalization, December 2002.
16

Figure 4. Status of Liberalization in Europe (Source: European Commission and The Energy Efficiency Center, Prague)
With the liberalization of the electricity market (Figure 4), more market-based methods are being demanded over direct support systems. After a certification system that is growing in interest for renewable energy system (RES) plants, it is now the turn for CHP plants to establish possible CHP-certificates or at least certification of the CHP electricity coming from such plants. Even with existing support schemes there may be a value in linking support to certification of the electricity production.
Some certification systems for CHP plants have already been introduced, like the CHP-QA (Quality Assurance) system in the UK from April 1, 2001. So far, real trading with the certificates has not yet taken place, but the British and Dutch systems provide some tax breaks. In Italy exemption from the obligation on fossil producers of electricity to meet a quota of renewable electricity, and priority dispatching after renewable energy are given. Combinations with more traditional support schemes and certificates might develop in some countries.
The main method for supporting CHP, used in the majority of cases, is linked to the production of electricity: dispatch priority and/or fixed price or a price premium on produced kWh. Under such national schemes, the grid company is obliged to offer the fixed price for CHP electricity (in France, the difference between the fixed price and the avoided cost will be returned to EdF from a special fund, paid by all generators). The price premium on generated kWh is paid from central sources.
Today many European countries provide support for CHP, either for installation of CHP plants and/or for the operation of the plants. The support given varies from country to country. Some supports are given for a certain portion of the investment cost and are common as well as different forms of tax breaks. Even in some countries there is a feed-in system that guarantees the purchase of the produced electricity at a price higher than the market value. Table 2 summarizes various forms of CHP support incentives for selected countries.
17

Table 2. Support Schemes for CHP Plants in Selected European Countries
Type of support Country Investment Fuel Production Other Belgium Special fiscal status Lower price for
certified CHP
Denmark Subsidies for small and industrial CHP; natural gas, RES, biogas, straw, wood, waste
Price premium per kWh, depending on type and fuel. Dispatch priority for selected small CHP plants.
France Fixed price for certified CHP
Netherlands Exemption from energy tax for quality CHP
Price premium per kWh for CHP; exemption from energy tax for heat
Low tax scheme
Italy Dispatch priority (after RES) for quality CHP; eligible gas customer
Spain Dispatch priority for quality CHP; price premium per kWh
Sweden Investment support of max 25% of the investment cost for biomass-fired CHP plants
Price premium per kWh for plants < 1,5 MW
UK Enhanced Capital Allowance
Exemption from Climate Change Levy for quality CHP.
Tax breaks
Source: Eurelectric
A draft Directive on CHP was published in July 2002. The EU Commission confirmed a goal to double CHP electricity production from 9% to 18% of the total EU electricity production by 2010. The Directive is roughly modeled after the Renewable Directive; allowing member states to choose their implementation strategy and support mechanisms.
The draft Directive will oblige member states to:
a) Guarantee that electricity from cogeneration will be transmitted and distributed on the basis of objective, transparent and non-discriminatory criteria
b) Publish the following:
• Analysis of the national potential for high efficiency cogeneration
• Analysis of the barriers to high efficiency cogeneration
• Report on progress towards increasing the share of high efficiency cogeneration, including the measures taken to promote it
c) Facilitate access to the grid for electricity produced from cogeneration units using renewable energy sources and from units with a capacity less than 1 MW(e)
d) Introduce basic cogeneration definitions. Member states will have to amend national legislation to comply with the basic definitions within the Directive for:
18

• “electricity from cogeneration”: Member states will eliminate the current ambiguity resulting from the different definitions of cogeneration
• “high-efficiency cogeneration”: Member states will determinate high efficiency cogeneration in terms of energy savings in comparison with separate production. Only cogeneration production providing energy savings of at least 10% will qualify as high-efficiency cogeneration
e) Introduce guarantee of origins. Member states will have to ensure that guarantee of origin of electricity from cogeneration can be issued on request by one or more competent body.
The vision of the draft is also that a market-based system with trading of CHP certificates could be established in a similar way as certificate trading systems for renewables energy sources has been introduced in some countries of the EU.
3.3 North America
The status of electric deregulation in the United States is illustrated in Figure 5. Twenty-four states and the District of Columbia have either enacted enabling legislation or issued a regulatory order to implement retail access. The local distribution company continues to provide transmission and distribution (delivery of energy) services. Retail access allows customers to choose their own supplier of generation energy services, but each state's retail access schedule varies according to the legislative mandates or regulatory orders.
In Canada, Alberta and Ontario are fully deregulated while British Columbia and New Brunswick have both introduced bills to the legislature. The remaining areas of Canada have seen minimal activity toward deregulation.
Figure 5. Status of Deregulation in the United States as of February 2003 (Source: U.S. Department of Energy)
19

In the United States, deregulation has caused instability in the power market. Deregulation problems experienced in California has significantly slowed deregulation nationwide. The distributed generation market in the U.S. decreased significantly in 2002 in comparison with the previous year. Reasons for the decreased market potential for DG in the U.S. include:
• Poor economy and decreased capital spending
• California blackouts did not expand nationwide, decreasing the urgency to invest in distributed generation
• Electricity prices stabilized
The primary market segments continuing to utilize DG are industrial sites with heat-recovery potential.
4. MEMBER COUNTRY PERSPECTIVES
Member countries are at varying stages of market deregulation. This process has had significant effects on distributed generation in many of the countries, ranging from countries creating incentive programs promoting DG to countries lacking a gas infrastructure, eliminating the potential of gas-fired DG adoption.
4.1 Belgium
Belgium has opted for a gradual opening of its natural gas market (Law of April 1999): 66 percent in 2006 and 100 percent in 2010. It is currently transposing the European Directive into Belgian law at the federal level. The situation is complicated by a second (different) set of laws for each of the 3 regions of Belgium. Belgium has not yet appointed regulators to coordinate this effort. The transmission and distribution system chosen, in principle, is that of regulated TPA. Access may only be refused on the grounds of lack of capacity or breach of technical regulations.
There are currently reduced tax rates for wind generators, renewables quotas and penalties if the targets are not reached, and price guarantees. But tough application and approval procedures to connect to the network act as a barrier and many operators are currently waiting for approval of their wind power installations. But the main barrier is and will remain the lack of harmonization between the three Belgian regions' legislative bodies, deterring investors.
4.2 Czech Republic
The Czech Republic is currently a candidate to become a member of the European Union. The Czech Republic legislation is currently in the early stages of being conformed to the EU legislation.
4.3 Denmark
20

Denmark played a waiting game in power sector liberalization, watching the evolution of Nordpool and contemplating how to make a smooth transition from a planned to a liberalized market without compromising the future of its district heating/cogeneration and renewables market. The resulting 1999 Electricity Supply Act comes into force gradually with full implementation in 2003.
Involvement with Nordpool offers intermittent generators in Denmark (and the other member regions) several sizeable advantages over those operating within national boundaries: expanded electricity demand, a load profile with many different peaks and troughs and relative price stability.
DG capacity was largely established during the 1990-1998 period and is today estimated at 28 percent of total production capacity. However, there is not much economic potential left for building new plants. The expansion of local CHP is expected to continue at a decreasing rate although increase in onshore and offshore wind turbines is expected to continue at an unchanged rate until the year 2005. CHP is primarily located at residential and industrial facilities.
The national target is for renewables to account for 12-14 percent of energy consumption by 2005. The government has given the highest priority to maintaining present levels of cogeneration plus further development. Eighty percent of the country's energy research program is devoted to energy saving and renewable energy sources.
4.4 Finland
Finland, like Norway and Sweden, has deregulated its electricity market ahead of the EU schedule. The country is advancing rapidly toward full liberalization, the most important development in this respect being the Electricity Market Act of 1995 that extended competition to all customers in January of 1997.
DG capacity is estimated to be around 10 percent of the total installed capacity, mainly in the form of hydropower. The government supports DG by granting a tax refund for producers of wind power (0.69 eurocents/kWh) and biomass and micro-hydro of up to 1 MW (0.42 eurocents/kWh). Investments subsidies of up to 40 percent of the cost are also available.
Some areas of Finland do not have a gas distribution network and this is a major barrier for gas-fired DG technologies.
4.5 France
The EU directive was implemented in France in February 2000 through the "Loi Electricité". One of the main components is the purchasing obligation for electricity produced by cogeneration installations of up to 12 MW.
France's current DG installed base is estimated to be around 5 percent of the total installed generating capacity. This includes CHP, wind power, and small hydropower. At the moment, there is no real political incentive to support DG. Designing effective DG regulations will be difficult given the current dependence on nuclear power generation and the concurrent weakness in competing fuels. The French government is focused on increasing the share of renewable energy sources.
There is not a specific regulation for small cogeneration systems, however, the law recently expanded the definition of cogeneration; there is no longer a lower limit therefore any installation
21

between 0 and 12 MW (provided it meets certain efficiency targets) is defined as cogeneration. Feed-in tariffs are currently under discussion.
Concerning the access to the grid, indications are that France will adopt a solution halfway between regulated and negotiated TPA with a regulated base, which does not exclude negotiations. There are no real interconnection standards, currently.
Although some testing has been performed with fuel cells and micro-gas turbines, one of the main problems with DG is the French gas network norm; it is not really compatible with the gas-fired DG technology requirements (The French norm is 20 millibar). France is more likely, therefore, to focus on renewable energy sources in the near future.
4.6 Germany
Germany is the front-runner in terms of implementing the European electricity and gas directives. As of April 1998, it opened 100 percent of its electricity and gas markets to competition. The utility market is highly fragmented in Germany, with about 70 regional utilities and 900 municipal utilities, which together account for about 20 percent of power generation and about two-thirds of distribution.
Non-discriminatory access to the transmission and distribution system is required. In general network access has to be negotiated. There is an optional alternative implemented, applying the single buyer model in municipalities supplied solely by a utility across their whole area.
Despite the overall success of liberalization, third party access to transmission networks remains a contentious issue. The Verbändevereinbarung that determines access to the grid system was first agreed to in May 1998 and left transmission control mostly in the hands of the six major utilities. After much criticism, a new Verbändevereinbarung was revised in December 1999. This agreement has encountered even more criticism than its predecessor, and EU competition authorities have expressed concern. The most criticized aspects of the agreement include a lack of price transparency and the division of the German market into two distinct trading zones.
DG capacity is estimated to be around 10 percent of total installed capacity and annual growth rate is expected to be 10 percent for the next five years. The most important DG technologies are currently CHP and wind power. The government strongly supports renewables and CHP. Replacing the Electricity Feed Act, the Renewable Energy Sources Act (EEG, February 2000) regulates the prioritization of grid-supplied electricity from renewable sources. It specifies mechanisms for implementing the option of granting priority to renewable power generation envisaged in the EU Directive on the internal market in electricity.
Energy utilities will also now benefit from the compensation for supplying the grid with electricity from renewable sources. By guaranteeing compensatory payments, the act turns energy production with renewables into a very lucrative business. Moreover, there are generous grants and low-interest loans for solar energy, and CHP has recently received additional government.
4.7 Italy
22

In April 1998, the Italian Parliament issued the guidelines to be following by the government to transpose the EU directive into Italian law. In February 1999, the government issued the decree opening the electricity market to competition. The main regulations are as follows:
• Freedom to construct new generation facilities
• Progressive creation of a competitive electricity market
• Free and non-discriminatory access to the transmission grid at tariffs to be set by the regulator (although Enel will maintain ownership of the grid)
• Creation of an electricity pool (borsa dell'energia) in the near future.
The shape of the regulatory framework is not yet clear, though it will contain some policies favoring energy efficiency, renewables and energy security. For example, by 2002 electricity from renewable and indigenous sources and from CHP plants was to be given dispatch priority and generators are obliged to produce 2 percent of their electricity from renewable energy plants commissioned after 1997. A tradable green certificate scheme was launched linearly in 2002 to fulfill the obligation.
Regulations for purchasing excess electricity are under discussion. There is only a regulation providing that grid operator has to provide access for energy produced by renewable sources and some cogeneration plants. Micro-CHP is not considered as renewable unless fuelled by biogas. There is an open debate on the new Electrical Authority regulations. The new parameters and indexes to define a plant as a cogeneration plant were issued by Authority in 2002.
Small-scale gas fired systems could offer significant market potential if technologies such as fuel cells and microturbines become mainstream. There is no micro-CHP currently in use in Italy but gas supply companies are likely to investigate the market for gas-fired DG and accept some electricity market risk to secure sales volumes.
Currently the individual consumer pays a single tariff but in few years, there could be free access to the pool and thus different shades of prices, which would make micro-CHP very attractive to individual consumers.
The future for DG is uncertain in Italy but no dramatic change is expected over the next 4 to 5 years.
4.8 Japan
In Japan, ten privately owned electric power companies operate as independent suppliers, and they are responsible for providing local operations from power generation to distribution and supplying their respective service areas. Electricity was only supplied by electric utilities until a turning point in the 1970’s when the gas industry initiated a project to import natural gas, and promoted environmentally benign gas-fired power generation along with a strong requirement of reducing energy costs by industrial and commercial customers.
Customers were pursuing various measures designed to level the electricity load by reducing the growing seasonal and hourly demand gap. One such measure was CHP or on site generation with heat recovery system to take advantage of their large heat demand to economize the energy usage. The first CHP in Japan began operation in 1981, and the installation rate steadily increased. After a
23

guideline for grid-connection was established in 1986, the installation rate rapidly increased, especially from 1989 to 1991.
However, for the last decade, annual installed capacity of CHPs was almost saturated, at roughly 300MW to 400MW per year due to both the sluggish economy and the recent deregulation of electric industry, by which electric rate had been reduced to impact midsize DG systems.
As of March 2002, gas-fired CHP capacity in Japan has reached about 2,400MW with the total CHP capacity including diesel engines at about 6,500MW. This numerical value represents around two percent of total generation in Japan. To achieve the goals, some incentives were established such as one third of facility investment paid by subsidy. The target installation of gas-fired CHP systems and all CHP systems were amended to 4,550MW and 10,020MW, respectively.
Although in March 2000, power supply was partially liberalized to allow Power Producer Suppliers to sell to extra high-voltage users over 2MW of capacity. As a result, 30% of total demand had been opened to free market, however, less that 1% has been actually provided by new entrants.
With regard to the future market of DG, the shape of the regulatory framework is still not clear. However, since the DG market is economically driven, not only the regulatory framework but also electric rate will have significant impact on its market acceptance.
4.9 The Netherlands
The Dutch Electricity Act entered into force in August 1998. The Netherlands was among the pioneers of European electricity market deregulation. In the last years the amount of small-decentralized plants grew very fast as a consequence of state subsidies for CHP. In the Netherlands, environmental concerns and issues have been built into policy making for many years and, as a result, highly efficient cogeneration facilities are considered as the mainstay rather than an alternative to conventional power generation.
At the moment, DG capacity meets about 25 percent of the national demand for electricity. This share could grow further in the future. DG capacity is mainly CHP (about three quarters) followed by waste and renewables. There are special subsidies for CHP, as the government wants to increase its installed base by 50 percent over the next 10 years. Renewables benefit from energy tax exemption and other tax relief, designed to help achieve the country's target for renewables to account for 10 percent of Dutch energy demand by 2020.
4.10 Norway
Norway is well ahead of EU liberalization with full deregulation already underway. The control of the central grid is a natural monopoly. The publicly owned Statnett is now the power grid company responsible for the construction and operation of the central grid and for coordinating operations. Norway's transmission and distribution infrastructure consists of the central grid, the regional grids, and the distribution grids. The utility operating the regional grid to which a distribution grid with local production (DG) is connected, will stipulate a fixed output for the DG in question when forecasting the short- term electricity trade. Should the DG production deviate from the stipulated value, this difference must be balanced out in the regulatory market.
24

The total DG capacity in Norway is estimated to amount to 2 percent of the production capacity. This is mainly small hydropower and to a minor extent wind turbines. The stations can be utility or privately owned. In the short- and mid-term, DG is not expected to go beyond 2 percent of total production capacity. Hydropower will remain the main DG technology due to the lack of gas infrastructure to support gas-fired DG technologies.
4.11 Spain
The Electricity Directive was implemented into Spanish law through the Electricity Act of 1997, which came into effect on January 1, 1998. The act represents a fundamental reorganization of the Spanish electricity market, aiming for full liberalization ahead of the EU schedule; it accelerates the pace of liberalization by reducing the eligibility threshold.
Customers are free to set commercial agreements with any "agent" or to buy energy from the pool. The system for access to the transmission and distribution network is based on regulated TPA. Concerning gas markets, the hydrocarbon law approved in October 1998 initiated the process of liberalization in the Spanish gas market. The new law came into effect in April 1999 and full liberalization is planned for January 2008.
As of the end of 2001, there were 2,060 installed DG plants producing 10,900 MW of power. This is approximately 20 percent of Spain’s total installed capacity, mainly from the 800 CHP plants (5,600 MW), 200 wind stations (3,300 MW), and mini-hydropower plants (1,500 MW). DG provides 30 TWh/year to the electric grid, totaling 15 percent of the energy transported and distributed by the grid.
Legislation is favorable to wind power and there is a regulation for buying prices concerning energy produced by DG. Utilities are planning to get more involved with DG in Spain, in particular in the renewables field. Wind power and solar PV are currently favored among utility planners. Forecasts for 2010 predict 8,000 MW CHP and 13,000 MW of wind power will be installed.
4.12 Sweden
Sweden's reform of its electricity market came into effect in January 1996. The main characteristic of its free market is that the distribution networks are accessible to all and power transmission is managed separately from electricity generation and trade. By paying a grid fee, a customer can gain access to the national grid and is therefore able to choose its electricity supplier. Electricity generation is fully deregulated: anyone wishing to generate or trade electricity is free to do so (subject to standard legal and regulatory requirements).
DG capacity is estimated to be around 5 percent of total installed capacity.
4.13 United Kingdom
The main regulations influencing the DG market are:
• The Climate Change Levy (C.C.L) – This is a downstream tax on energy that started to apply in April 2001, charged to all final consumers, with the exception of the domestic
25

sector. Electricity and heat supplied from renewable energy sources are exempted from the CCL. The government has a manifest commitment to develop renewable sources of energy, which has translated into targets of 5 percent of UK electricity requirements met from renewables by the end of 2003 and 10 percent by 2010. The UK environmental policy is also driven by European legislation and by national greenhouse gas emission reduction commitments of 12 percent agreed as part of the EU's Kyoto commitment
• New Electricity Trading Arrangements (NETA) – The basic principle of NETA is that those wishing to buy and sell electricity should be able to enter into any freely negotiated contracts to do so. Markets participants will contract bilaterally over a range of periods from a few days to a year or more ahead of real-time delivery. NETA aims to treat all forms of generation equitably. But a power exchange approach in general rewards plants with a flexible and predictable output, as intermittent generators are likely to miss their contractual output more frequently and hence suffer financial penalties (imbalance charges). This brings additional risks for many types of decentralized generation especially wind and those reliant on continually varying weather patterns.
• Distribution Systems – On average, it takes 10-15 percent of total investment costs to connect to the distribution system, due in part to outdated technical standards not designed with the needs and benefits of smaller, decentralized plants in mind. The technical state of many UK distribution systems is inadequate to support significant growth in DG, especially due to difficulties to cope with power flows in both directions. Infrastructure investment is needed. Utilities are forecasting an annual growth rate of 1 percent for DG in the next 6 years. They think DG will be mainly composed of renewable energy sources in the next 5 years. Some new regulations are to be issued: there is a pending CHP strategy paper, a DTI/OFGEM paper to be produced on ways to develop DG, and proposals from the embedded Generation Working Group are expected. The proposals are likely to study the type of connection in the UK: while connection to the grid is qualified as "deep" in the UK (the generator who wants to connect to the grid pay charges for all the way through to customer end-point), it may change to "shallow" connection, where the generator pays only the cost to connect to the nearest connection point. There is an estimated 7.3 GWe of decentralized generating capacity in the UK, or 12 percent of the total capacity. This is comprised predominantly of gas-fired plants and renewable energy sources. The UK target for cogeneration was to achieve 5 GWe by the end of 2000 with a further target of 10 GWe by 2010 as part of the climate change program.
4.14 United States
The distributed generation market in the U.S. decreased significantly in 2002 in comparison with the previous year. Reasons for the decreased market potential for DG in the U.S. include:
• Poor economy and decreased capital spending
• California blackouts did not expand nationwide, decreasing the urgency to invest in distributed generation
• Electricity prices stabilized
Niche markets, however, remain promising. Among those market segments still interested in DG are industrial sites with heat-recovery potential. These companies have the strongest interest in the use of onsite generators to meet their base load power requirements while utilizing any waste heat from the DG system in order to save money. Other potential niche applications for DG include companies that rely on computers and electronics, such as data processing centers and
26

telecommunications companies; commercial and industrial facilities with a potential to benefit from heat recovery; continuous manufacturing processes that will incur significant losses in a power outage; and sectors that produce methane gas as a by-product.
According to a study conducted by Primen2, an estimated 1,700 large establishments in the U.S. and Canada, representing 1.6 gigawatts of load, are strong near-term prospects for DG systems. The study found these companies to be more sophisticated energy buyers in general that understand their distributed energy options more than most companies.
In a February 2003 Electric Light & Power article3, the market for small gas turbines (1 – 10 MW), fuel cells (PEM, SOFC, MCFC, PAFC, and AFC), reciprocating engines, and microturbines (30 – 200+ kW) is summarized, identifying the key factors expected to influence the future of these systems. Figure 6 illustrates the growth of the estimated market size of small gas turbines, fuel cells, and microturbines through 2007. The reciprocating engine market is considered a mature, slow growing market with an estimated size in North America ranging from $1.5 billion to $2.5 billion.
0.0
50.0
100.0
150.0
200.0
2002 2003 2004 2005 2006 2007
Year
Mar
ket S
ize
($M
)
Small Gas TurbinesFuel CellsMicroturbines
Figure 6. Distributed Generation Market Potential 2002 – 2007
The fuel cell market is expected to grow from $40 or $45 million in 2002 to approximately $110 million in 2007, with the most significant growth occurring in 2005 through 2007, as many vendors predict commercialization during that time. The article identified thirty-five factors that will influence the future of fuel cells. The eight most influential include:
• The end user’s need for backup power
• Reduction in initial costs
• Development of interconnection standards
• Successful commercialization schedules
• Development and enforcement of emissions regulations
2 Energy User News, Distributed Energy Market Has Softened, Smaller Niche Market Remains Promising. 3 Electric Light & Power, Dissecting the North American Market for Distributed Generation, February 2003.
27

• Developments in reforming technologies
• Utilization of resource recovery potential
• Utilization of CHP potential
Solid oxide fuel cell commercialization is not expected to begin in North America until 2005, following significant delays in the commercialization process. Phosphoric acid fuel cells have over ten years of commercial availability, accounting for over 85% of the fuel cell dollar amount in 2002. PAFC growth is expected to slow as other technologies reach commercialization. Most proton exchange membrane fuel cells are being developed for residential applications (1 – 10 kW). With a large number of developers working on PEM systems, several products should be commercially available by 2005. The only major player in molten carbonate fuel cells in North America is FuelCell Energy. MCFC’s are targeting the industrial and CHP markets with systems in the 300 kW to 3 MW size range. Alkaline fuel cells are not expected to play a large role in the fuel cell market. AFC’s have been used almost exclusively by the government (NASA) since the 1960’s.
The microturbine market is expected to grow from $46 million in 2002 to over $173 million by 2007. Twenty-nine factors impacting the future of the microturbine market were identified, with the following five being the most influential:
• Utilization of CHP potential
• Reduction in initial costs
• Development of interconnection standards
• The end user’s need for backup power
• Potential of the 200+ kW market segment
Commercial microturbines have been available in the 30 to 100 kW range for several years; however, higher output microturbines (greater than 200 kW) are now beginning to enter the market. The real potential for the market segment requiring 200+ kW systems has yet to be proven.
Small gas turbines range in size from 1 to 10 MW for this discussion. The market size is estimated at $125 million in 2002 and is expected to approach $150 million by 2007. Gas turbines are a proven technology in a mature market experiencing slow, steady growth at roughly 2-3 percent per year.
In total, DG represents roughly 4 to 8 percent of the total installed electric power generation capacity in the United States.
5. BARRIERS
The most significant barrier to the adoption of distributed generation technologies is the high initial cost. Many factors impact the overall costs of owning and operating a DG system, including:
• Core technology problems or hurdles
• System integration, fabrication, and manufacturing
• Markets and applications
28

• Installation requirements
• Operation and maintenance (O&M) requirements (e.g., fuel prices, replacement parts, personnel, etc.)
• Rules, regulations, and policies:
Financial incentives
- Net metering incentives
- Tax incentives (e.g., personal, corporate, sales, property, etc.)
- Buy-downs or rebates
- Loan programs
- Grants
- Emissions credits
Codes and standards
- Building codes
- Design and performance standards applicable to PEMFC component or systems
- Interconnection standards
Permitting requirements
- Land
- Building
- Environmental
Value-adding benefits (e.g., better for the environment, increases security, etc.)
While the potential benefits of distributed generation systems are substantial, technical, market, and regulatory barriers currently hinder consumer access to these benefits. Additional barriers to distributed generation beyond the high initial costs include the following:
• Codes and standards - The lack of uniform, consensus-driven interconnection codes and standards is causing delays in the deployment of distributed power systems. Such standards are currently in development by IEEE's P1547 interconnection working group. In addition, without legislative or regulatory intervention, utilities have little incentive to streamline the technical requirements for grid interconnection. Many developers of distributed power argue that existing requirements are overly burdensome.
• Legislation - Legislative barriers to distributed power exist at the federal and/or state level. Barriers can arise from local codes, standards, and environmental regulations that are not structured to recognize the attributes of distributed power.
29

• Market - The structure of the electricity market itself presents some barriers to the adoption of distributed power. Any market rules or business practices that nullify the advantages of distributed power will slow market adoption. For example, owners of grid-connected distributed power generators can pay excessive and prohibitive charges for their connection to the grid as a backup power source, even if they never use any grid power.
6. INCENTIVES
Member countries have adopted varying incentive programs promoting the use of DG, CHP and renewable energy systems. Types of incentives include:
• Net metering incentives
• Tax incentives
• Buy-downs or rebates
• Loan programs
• Grants
• Emissions credits
Table 3 and Table 4 summarize incentive programs offered in selected member countries.
30

Table 3. CHP Incentives
BELGIUM CZECH REP DENMARK SWEDEN JAPAN USA
Role of CHP Energy savings; sustainable development
To cover heating demand
Not specified; Only few demonstration plants
Energy savings; Environment protection; Cost reduction O&M
Energy savings & to cover the heating demand
Quality CHP Yes No No No No No
Supporting Mechanism
Quotas/ penalties for CHP connected below 150kV
None None None
Subsidization at installation; Tax credit; Favorable financing
CHP program for R&D; Subsidization at installation
National Target
Only regional targets None None None 4,640 MW in
2010 9,600 MW in 2010
Special Scheme
Flanders: green energy; Wallonia: green certificates for capacity < 20 MW
No No No
Small CHP systems are included in general CHP incentives
CHP Certification
Only in Wallonia No No
Only if CHP fired by renewable fuel
No No
Penalty Yes No No No No No Obligation Set On
Distribution operator No No No
regulations No No
Barriers High investment costs
Laws are not appropriate for the development of new CHP
Gas Prices No tax reduction
High investment costs Unfavorable tax rules
Grid connection;
Raising CHP awareness through education and outreach
31

Table 4. Incentives for Renewable Energy Sources
B DK F D S NL UK J USA
Supporting Mechanism of RES
Quota-based system + green certificates
Tax exemption
Fixed price system (buy-back obligation)
Fixed price system (buy-back obligation)
Tax exemption + green certificates
Tax exemption + green certificates
Quota-based system + green certificates
Subsidizing
Subsidizing & tax credit
National Target
EU ref. value : 12 % in 2010
13-17 %
EU ref. value : 21,0 % in 2010
EU ref. value : 12,5 % in 2010
10 TWh in 2010
EU ref. value : 9,0 % in 2010
EU ref. value : 10,0 % in 2010
3% of primary energy in 2010
No global target for RES ; initiatives for individual technologies
Part of Biogas
3% of total RES
150 GWh/y (0.1%)
Green certification Yes No No Yes Yes Yes Yes No No
Penalty 75-125 €/MWh
Max 360 €/MWh
None None
Yes Economic sanction Not specified yet
None Not specified yet
None None
Obligation Set On
Distribution grid operator
On end-user
Distribution grid operator
Distribution grid operator
On end-user
None Every licensed supplier
None None
7. REFERENCE MATERIAL
Online educational and informational materials to be put in reference database:
• U.S. Department of Energy – Office of Distributed Energy Resources http://www.eere.energy.gov/der/ – includes general discussion of DER basics, technologies, and regulatory and policy issues. DOE reports on DER can be downloaded.
• U.S. Combined Heat and Power Association http://www.nemw.org/uschpa/ – has a link to “CHP Resources,” which includes, papers, presentations, fact sheets, roadmaps, case studies, etc.
• Fuel Cells 2000 http://www.fuelcells.org/ – the most comprehensive source of information available
32

about fuel cell technology and the developers. Also includes a massive library of publications.
• U.S. Department of Defense – U.S. Army Corps of Engineers, Engineer Research and Development Center, Construction Engineering Research Laboratory http://www.dodfuelcell.com/ – includes a discussion of fuel cell technology and provides an updated status report (site specs, costs, performance, etc.) on the dozens PAFC and PEMFC demonstrations that the DOD is conducting.
• Resource Dynamics Distributed Generation Website http://www.distributed-generation.com/ – includes info on technologies, applications, markets, regulations, and stakeholders. Also includes a library of DG reference materials and publications that can be downloaded.
• Distributed Power Coalition of America http://www.distributed-generation.com/dpca/ – includes a summary of DG technologies specs and utility benefits. Looks the site is hosted by Resource Dynamics.
• EPRI – Distributed Resources Web http://www.disgen.com/ – member-only site with extensive information on DG technologies, developers, and markets.
• California Energy Commission http://www.energy.ca.gov/distgen/ – California-specific DG information source.
• Cooling, Heating, and Power, for Buildings http://www.bchp.org/index.html – has a library with fact sheets, a database to search for CHP installations by state, and another database with industry contact names.
• National Fuel Cell Research Center http://www.nfcrc.uci.edu – has a resource section that includes an explanation of the fundamentals of fuel cells, market opportunities, benefits, challenges, fuels, government initiatives, incentives, codes and standards, industry publications, and industry links.
33

8. ACKNOWLEDGEMENTS
This paper was prepared as a result of the proceeding and contribution of the members of International Gas Union WOC 7, Study Group 7.1. The support of Research Engineer Kelly Tarp from Energy International, Inc., USA in preparing the manuscript is gratefully acknowledged. Comments on the paper may be addressed to Dr. Samuel Bernstein at [email protected]
International Gas Union Study Group 7.1 Members
U.S.A. - Chairman Dr. Samuel Bernstein Energy International, Inc. Gastec Group
Belgium Francis Wolters Electrobel Brussels
Jean-Marie De Hoe Electrobel Brussels
Denmark Jacob Fentz Naturgas Midt Nord
Czech Republic Jan Ruml Plynoprojekt Praha,a.s.
Finland Pasi Svinhufvud UPM-KYMMENE Ltd
France Catherine Lancelot Gaz de France
Manuel Bonnier Gaz de France
Italy Gabriele Fraschini SNAM S.p.A.
Japan Takao Fujiwaka Osaka Gas Co., Ltd
Tak Tanaka Tokyo Gas Co., Ltd.
Slovak Marian Kosnac Istroenergo Group a.s.
Spain Antoni Julia Gas Natural SDG,S.A.
Sweden Staffan Ivar sson Sydgas AB
34

5. REPORT OF STUDY GROUP 7.2
“New developments to improve the competitiveness of industrial
gas applications”
Rapport du Groupe d’étude 7.2
“ Nouvelles developements pour augmenter la concurrence des applications du gaz industrielles”
Chairman/Président
Klaas Beukema
The Netherlands
35

TABLE OF CONTENTS
9. Summary and conclusions
10. Introduction
11. Description of the different topics
3.1 Natural gas and glass melting furnaces; how to reduce NOx and CO2 emissions
3.2 Efficiency improvement of CHP by inlet air cooling
3.3 Micro-Turbines
3.4 Radiant heating in industrial processes
3.5 Using natural gas instead of electricity in the plastic processing industry
3.6 Precise combustion control
3.7 Wobbe index and calorific value control in gas fired industrial processes
Appendix 1: Members of SG 7.2
36

1. SUMMARY AND CONCLUSIONS
We have described 8 different new developments to improve the competitiveness of industrial gas applications. It is shown that improved burners, the use of oxygen in stead of air and reburning of natural gas are able to increase the thermal efficiency and to reduce the NOx emission in glass melting furnaces. Also Flameless oxidation is able to obtain this. Cooling the inlet air of gas turbines, especially in periods with high ambient air temperatures leads to efficiency improvement. Micro-turbines can be used in combined heat and power generation with 95 % overall efficiency. The heat can be used for hot water production or fed directly in the industrial process. Gas fired radiant heaters are available on the market and should be used especially for larger capacities. Improvement of the burners is still under study. In the plastic processing industry gas fired equipment is developed which has a better performance than electric heated equipment. Burner control can be simplified by using the new developed Easy Burner Control system. Also the control of the Wobbe index or the calorific value can be improved by a new developed control system.
37

2. INTRODUCTION
Since the last IGU World Gas Conference in Nice in 2000 no major break-throughs have occurred in the area of the industrial gas applications. Nevertheless enough topics have shown further development or new developments are now commercial available on the market. The IGU Study Group 7.2: “New developments to improve the competitiveness of industrial gas applications” has selected some of the most interesting topics for publication in this report. Each member of the Study Group (see appendix 1) contributed to the description of the topics. Those members who gave the major contributions on the topic are mentioned in the heading of the topic description. The e-mail address of the corresponding author is also given.
The attention for efficiency improvement by energy saving has increased. Especially because
of the ratification of the Kyoto Protocol by many countries the industrial users of gas are willing to reduce the emission of CO2 by energy saving. Of course the economic advantages of using less energy are another stimulating factor for the attention for this topic. Energy saving can be obtained by all of the described topics.
The attention for environmental aspects related to the use of natural gas has continued. Some
topics leading to lower NOx emissions are described (glass melting with low NOx, flameless oxidation, radiant heating and microturbines).
One topic shows that even in a mature market there are still possibilities to find new
applications for gas in industrial applications (gas versus electricity in the plastics industry). The last two topics pay attention to improvements in the control of different types of burners
(wobbe control and combustion control). During this triennium we have seen a reduction in attention for new developments in gas
applications. In the past many gas companies felt the responsibility to help smaller equipment manufacturers in the development op new equipment. Because of the liberalisation of the market many traders and transport companies are not willing to spend the same amount of money on new developments as they did in the past. Different of the described topics show that cooperation between equipment manufacturers and gas companies is still in favour of both companies. To aid development of the use of natural gas in industry support from gas companies is still important and should continue to be encouraged.
38

3. DESCRIPTION OF THE DIFFERENT TOPICS 3.1 Natural gas and Glass melting Furnaces; How to reduce NOx and CO2 emissions
Philippe Buchet, Gaz de France
[email protected] TATSUDA TAKASHI , OSAKA GAS
[email protected] GUY VERKEST, DISTRIGAZ [email protected]
3.1.1 Introduction In many countries, the thermal installations functioning at high temperature such as the industrial furnaces, specifically the glass melting furnaces, must meet more stringent regulations on the increase in thermal effectiveness (reduction of emitted CO2) and the reduction of the emissions of pollutants like nitrogen oxides (NOx). These constraints, with those relating to CO2 set by the international regulations (protocol of KYOTO) national or Community (Directives UE) regulations and those relating to Nox by the "environmental" concerns expressed by the surrounding population of the industrial plants, are increasing year by year.
In this context, the objective of the industrialist is thus intelligently to deal with the emissions of pollutants generated by production facilities, taking into account not only the best financial cost but also best ecological cost for the environment. Combustion technologies using natural gas, represent important opportunities of progress for the industrialists of glass manufacturing sector . They bring answers new and complementary to the already existing technical solutions, denitrification (de NOx) by post-processing of the wasted gas resulting from the industrial thermal processes. In this document, we present an outline of various natural gas technologies, their potential and some industrial examples carried out. 3.1.2 Available natural gas low-Nox technologies 3.1.2.1 Recall on the techniques of reduction of NOx The principal techniques of reduction of nitrogen oxides (“de NOx techniques”) consist either of avoiding the formation at source (preventive techniques called "primary"), or to reducing emissions using a post-processing of the wasted gas ("secondary techniques"). A slightly different distinction can be made by considering the primary techniques, those which apply in the furnace, sepearate from the secondary techniques which apply downstream from the furnace (cf. table 1).
39

PRIMARY TECHNIQUES � Staging of combustion � flue gas Re circulation � Reduction of excesses of air
Efficiency: 20 to 50 %
SECONDARY TECHNIQUES � SNCR (Selective non-Catalytic Reduction) � SCR (Selective Catalytic Reduction)
Efficiency: 40 to 85 %
INTERMEDIATE TECHNIQUES � Reburning gas � Advanced Reburning gas
Efficiency: 50 to 80 %
Oxy-combustion � Burners 1st generation � Burners 2nd generation
Efficiency: 90 to 95 %
Table 1: Overview of different Nox reduction techniques
The primary techniques are perfectly reliable but will not be enough to meet the regulatory
requirements concerning the emissions of NOx for many installations.
The principal secondary reduction techniques are based on the use of reducing chemical agents (ammonia or urea), assisted or not by catalysts which cause to transform NOx into molecular nitrogen (N2).
They are primarily two: � The Non Catalytic Selective Reduction (SNCR), � The Catalytic Selective Reduction (SCR).
It is thus to try to bring new solutions to the equation (effectiveness, costs, pollutants
secondary) that technologies of combustion to pure oxygen and process Reburning gas have been explored for a few years. 3.1.3 Primary Natural Gas Low-Nox Technologies Large-size regenerative type melting furnaces generally called glass tank furnaces are operated in condition of very high temperature (about 1500 degree C), and almost all NOx generated is thermal NOx, and NOx emission level of natural gas, with classical fuel injectors, is not always lower than that of fuel-oil. In USA and European countries, due to the environmental constraints and reduction of difference cost between natural gas and heavy oil, a large number of natural gas-fired glass tank furnaces are in operation, but few combustion techniques can be applied to furnaces with high constraints in terms of NOx performance like in Japan.
Fig 3.1: Structure of glass tank furnace
40

Recently, several manufacturers or natural gas companies developed new generation of low-Nox natural gas injectors. It is the objective of the two injectors technologies of which will be reported the details here under. 3.1.3.1 Osaka Gas burner construction Recently, Osaka Gas has developed an original low-NOx burner, applied to the glass furnace. A conventional gas burner (Fig.3.2), which is commonly used abroad, consists of a single hole. On the other hand, the burner (Fig.3.3) which Osaka gas have developed comprises a plurality of gas nozzles arranged at both the center and the circumference, and it achieves complete combustion, even under low air ratio conditions. The gas issuing from gas nozzles at the circumference plays a key role in the improvement of flame luminance, and the achievement of low NOx production, due to slow combustion, by interrupting the mixing of main gas supplied from the center with air.
Gas (Liner) Gas (Liner or swirling)
Gas (Liner or swirling)
Gas (Liner)
Fig 3.2: Structure of a conventional type burner Fig 3.3: Structure of the newly developed burner
The burner performance was indicated by
measuring the NOx level in the exhaust gas in a test furnace. Fig.3.4 shows that the NOx level of the developed burner is 20~30% lower than that of the heavy-oil burner or conventional gas burner. The burner operates without generating CO or soot, even when the air ratio is low.
���������������������������������������������������������������������������
0
20
40
60
80
100
NO
x le
vel
(%
)
H e a vy- o il- fire d(a ir - a to m iza tio n)
G a s - fire d (c o nve ntio na l
ga s b urne r)
S ta nd a rd o fN O x le ve l
R e fe re nc e
G a s - fire d (ne w ly d e ve lo p e d
ga s b urne r) Fig 3.4: Comparison of NOx level 3.1.3.2 Gaz de France "DGI" burner From 1993 to 1998, Gaz de France developed optimized and tested on industrial furnaces or in laboratory (see Fig. 3.5, 3.6 and 3.7 "DGI "flame numerical simulation) a innovative concept of burner (Double Gas Injection) for large glass melting furnaces. The possibility to switch or combined high pressure to low pressure of fuel gas flow in the same injector gives high level of flexibility to reach low–NOx emissions. With this kind of burners we can reach, on float glass furnaces, emissions of NOx under 800 mg at 8 % of O2 on dry waste gas.
Fig 3.5: High and low pressure fuel flow system
41

Fig 3.6: nozzle of "DGI" burner Fig 3.7: CFD simulation of "DGI" injector; velocity field in the burner block
3.1.4 Oxy-combustion technologies with natural gas The use of oxidant is an effective technique to increase the thermal transfer. For several years, oxy-combustion has been used in the world and in Europe for special glasses, but the use in hollow glass or flat glass remained marginal. Only few existing references are available in the United States, the Netherlands and in Germany. Figure 4.1 shows the evolution of the tonnage of glass been based per day in oxy-combustion since the Nineties.
0
5000
10000
15000
20000
25000
Jan-90 Jan-91 Jan-92 Jan-93 Jan-94 Jan-95 Jan-96 Jan-97 Jan-98 Jan-99
50 % Increase of oxy-gas use
Reduction of Economic growth
Fig 4.1: Ton of glass per day produced with oxy-combustion versus years The results obtained by this technology, still confidential to the middle of the Nineties, led glass and gas companies (industrial and fuel gas) to cooperate together, through international R&D projects, in order to do assessment of oxy-gas burners, feasibility studies for implementation on furnaces and pilot demonstrations
42

As an example, we will present hereafter results of a the four years collaboration between Verrerie of Languedoc and Gaz of France which allowed the first pilot demonstration of a 360 TpD of glass for packing with a complete natural gas –oxygen combustion system. 3.1.4.1 Available oxy-gas burners for glass melding furnaces: Two families of burners already exist: • Burners without staging of oxygen (first generation), • Burners with staging of oxygen (second generation). These burners are proposed with various shapes of flames • Traditional «flames » • «Flat » flames. The different designs are used to improve the length of the flame (traditional one) or the heat transfer and covering of the glass bath (flat flame type). • The thermal transfer to the load, • Sensitivity to nature of natural gas or oxygen used, • Sensitivity to the parasitic air (NOx). The laboratory tests, made on a 2 MW high temperature facility in R&D center of Gaz de France, show clearly the variable sensitivity of the burners to the nitrogen content in natural gas on NOx emissions (see figure 4.2) according to their technology. NOx versus nitrogen content of natural gas
0
0,2
0,4
0,6
0,8
1
1,2
0,5 2,5 4,5 6,5 8,5 10,5 12,5 14,5 16,5 Nitrogen in NG (%)
NOx (g/kW)
1st generation of burners "Pipe to pipe type
2nd generation of burners Combustion staging
Fig 2: NOx and nitrogen (N2) natural gas - staging of combustion effect 3.1.4.2 Conversion of the furnace:
Before the Revamping, the furnace was equipped with 28 low burners NOx fed in hot air and preheated natural gas. Melting surface is 170 m ² for drawn from 360 to 400 t/j with electric boosting system.
43

Fig 4.3: The furnace
The main characteristics of the furnace in air-combustion (reference) were the following ones: • Drawn: 360 t/j, • Cullet: 60 %, • Hot air: 700 °C, • Preheated natural gas: 500 °C, • Specific consumption: 1550 kWh (PI)/Ton of glass, • NOx: 0,8 kg/ton of glass. After oxy-combustion revamping the characteristics of the were the following ones: • 10 burners Flat flame type • Drawn: 360 t/j without electric boosting • Surface bath: 150 m ² (- 20 m) ² • Specific Drawn: 2,4 t/m ² (+ 20 %) • Cullet: 60 % • Oxygenate: VSA purity of 93 % with safeguard of cryogenic oxygen tank • Control command taking into account of the purity of the oxygen and the calorific value of natural gas • Burner control by oxygen mass and natural gas volume throughput. Through numerical simulation and before rebuilding of the furnace, optimization was done on the height of crone, the position of the burners above the bath, profile of heating of the burners and size of the bath in order to avoid hot or cold spots on crone and increase heat transfers.
44

Fig 4.4 Temperature fields in various plans of the furnace
These numerical optimizations show a potential energy economy of about 22 % on fuel and the possibility of removing the electric boosting system. These optimization works supervised by Verrerie du Languedoc and Gaz de France in cooperation with TNO Laboratory ( CFD simulation) , Stein Heurtey (Manufacturer of Furnace) and AIR LIQUIDE (Burners and Oxygen production). 3.1.4.3 Industrial results:
Fig 4.5: Burner view Fig 4.6: Oxy-flame in furnace
45

Under the same conditions of drawn (360 t/j) and with the same percentage of cullet (60 %) the results obtained are the following: • Specific natural gas consumption: 1050 kWh (PI)/TONNE of glass (- 32 % ie: reduction of CO2 emissions) and no electric boosting, • NOx Emissions: 0,2 kg/ton of glass (- 75 %) with cryogenic oxygen, • NOx Emissions: 0,4 kg/ton of glass (- 50 %) with VSA oxygen. The furnace moreover is equipped with a waste heat boiler, which imposed a dilution of the exhaust gases to lower their temperature of 1350 °C (left furnace) at 700 °C (entered boiler). The waste gas coming out of the furnace is sufficiently cold so that this dilution does not generate nitrogen oxides. This industrial demonstration shows clearly the interest of Oxy-gas Combustion technologies for glass melting furnaces in terms of energy efficiency and emission of pollutants. From an economic point of view an operation of this type, is available if the operational cost related to oxygen price could be compensated by a profit of investment on the furnace and associated equipments and reduction of energy consumption 3.1.5 Reburning natural gas 3.1.5.1 Principle and concept of the reburning Gas reburning is a NOx control technology that consists of using fuel as a reactant with NO molecules. As shown in Figure 5.1, it could be represented by dividing the system into three zones. The first zone is the primary zone where fuel and air are burned under normal conditions and lead to NO formation. In the second zone, called reburning zone, fuel is injected downstream of the primary combustion in order to create a slightly fuel rich zone (stoichiometric ratio about 0,9). For our case, the fuel used is natural gas ; one will thus speak about gas reburning. Overfire air is then added in the burnout zone to eliminate carbon monoxide formed in the reburning zone and any remaining reduced nitrogen species.
fuel
Primarycombustion air
Primary zone Burnout zoneReburn zone
Natural Gas Over Fire Air
λ > 1 λ < 1 λ > 1
NO
NO
NO
NO
NO XN
COCO
NO + CH N2XN
Flue gases
λ : stoichiometric ratio
CO2CO
Figure 5.1 General diagram of the gas reburning process
The NOx reduction efficiency depends on temperature, residence time, stoichiometric ratio in the reburn zone and also depends on the mixing between flue gases and natural gas or excess air. Depending upon the application and the operating conditions, the NOx reduction efficiency of the gas reburning process generally varies between 40% and 70%. If this process is chemically complex, it is technically rather simple to implement and thus compatible with a wide range of existing thermal installations. The design of such a process relies on the combustion technology, which is provided by furnaces and combustion systems manufacturers. It includes installing specific injectors in the walls, modifying refractory walls of the furnace, designing natural gas and air skids with associated control systems and eventually designing a flue gas recirculation system.
46

3.1.5.2 Advantages and limits of technology The main advantages of the gas reburning compared to other types of fuel reburning or other NOx technologies are: easy to handle and transport natural gas, using natural gas as a chemical reactant, good mixing between it and flue gases. In addition, gas reburning can be coupled with traditional NOx control techniques and it does not produce secondary pollutants like some SCR or SNCR. It is not easy to assess the costs of this technology because it depends on the site, the operating conditions and the required NOx efficiency. In this way, it is necessary to study individually each installation. On the technical level, difficulties can appear when implementing gas reburning on an installation presenting high primary excess air (for example municipal solid waste incinerator), unsteady primary combustion or wide section furnace. The latter sometimes involves problems of mixing between flue gases and natural gas or overfire air. It can be solved by using flue gas recirculation acting like a carrier gas for natural gas and increasing the mixing. 3.1.5.3 Pilot demonstration on a flat glass furnace port If this technique is now well controlled for utility boilers, its application to glass furnaces is under development and in particular on cross-fired regenerative flat glass furnaces. 3.1.5.3.1 Principle Application of gas reburning to glass furnaces was particularly studied and developed by PILKINGTON Glass manufacturer ( 3R system) and also Energy and Environment Research Corporation (GE-EER) with the Gas Research Institute (GRI). The principle of gas reburning applied to a cross-fired regenerative flat glass furnace is shown in Figure 5.2. It consists in injecting the natural gas at the exit of the furnace laboratory and injecting over fire air upstream or downstream of the checkerwork of the heat regenerator.
Natural gas injections
Overfire Air
Checkerwork
Stack
Preheatedcombustion air
Reburning zone
Burnout zone
Melting bath
Flue gases
Primary zone
Burners
λ < 1λ > 1
λ > 1
Checkerwork
Regenerator
Fig 5.2: EER/GRI Reburning gas system applied to a cross-fired regenerative glass furnace
For the present pilot demonstration only one port of a flat glass furnace was implemented to study gas reburning. The first test run was carried out in 2000 and the results are presented in the following paragraph. Measurements of concentrations of NOx, CO, O2, CO2, CH4 and temperatures were carried out upstream and downstream of the treated port checkerwork. Measurements downstream of the regenerator of the opposite side were also done. 3.1.5.3.2.1 Results of the reburning test on the treated furnace port
47

Figure 5.3 gives the evolution of NOx emissions at exit of the treated port (in %) versus the quantity of natural gas injected, expressed as a percentage of the primary heat input. As expected, the NOx control efficiency increases with the quantity of natural gas injected. Reductions from 50% to 70% are obtained using 12% to 14% of natural gas compared to the NOx baseline level. The variation of the NOx reduction efficiency is in particular due to the variation of the primary stoichiometric ratio. Moreover, recent tests have shown that if one can control primary combustion, good NOx reduction can still be obtained using less than 10% of natural gas.
0%
10%
20%
30%
40%
50%
60%
70%
80%
90%
100%
0% 2% 4% 6% 8% 10% 12% 14% 16%
NOx - Reburning
NOx - Baseline
NO
x le
vel a
t the
por
t exi
t, %
Natural gas quantity, % of primary heat input
Fig. 5.3: NOx emissions level versus natural gas quantity
In Figure 5.4, the NOx emissions are plotted versus the reburn zone stoichiometric ratio. We observe that the NOx reduction increases with decreasing the reburn stoichiometric ratio. However, it seems that one reaches a limit NOx reduction value (~ 60 to 70%) at a ratio of 0,9.
0%
10%
20%
30%
40%
50%
60%
70%
80%
90%
100%
0,84 0,86 0,88 0,90 0,92 0,94 0,96 0,98 1,00 1,02 1,04 1,06 1,08
NOx - Reburning
NOx - Baseline
NO
x le
vel a
t the
por
t exi
t
Reburn stoichiometric ratio (calculated)
Fig 5.4: NOx versus stoichiometric ratio
48

It has been observed in Figure 5.5 that during reburning mode, the CO emissions were most of the time not increased, except for some points corresponding to special tests (low reburn zone stoichiometric ratio).
0%
20%
40%
60%
80%
100%
120%
140%
0,84 0,88 0,92 0,96 1,00 1,04 1,08
CO - Baseline
CO - Reburning
CO
leve
l at t
he p
ort e
xit
Reburn stoichiometric ratio (calculated)
Fig 5.5: CO versus stoichiometric ratio 3.1.5.3.3 Conclusion of this test on one furnace port
This test made it possible to show the efficiency of the gas reburning process on a part of the furnace (one port) regarding NOx emissions reduction, without increasing the CO emissions. Other aspects of the gas reburning are currently studied and in particular the over consumption due to natural gas injection. These various points must be validated before operating gas reburning on the whole furnace. 3.1.6 Conclusions
Thermal high temperature processes like industrial glass melting furnaces, have to continuously increase their thermal efficiency (reduction of emitted CO2) and reduce the emissions of pollutants like nitrogen oxides (Nox) and sulfur oxides. In this context, the objective of the glass manufacturers is thus ito deal intelligently with the emissions of pollutants generated by their production facilities, i.e. best financial cost but also best ecological cost for the environment (see Fig 6.1)
49

30%
€ / T Glass
65 % 100 %
4
8
12
LNB
SNCR
Gas Reb.
LNB +Gas Reb.
Oxy-fuel
SCR
Operating costs for NOx reduction in Glass melting furnaces
NOx reduction
Fig 6.1: Operating costs for NOx reduction in Glass melting furnaces Natural gas technologies of combustion, as we have seen, represent a large panel of opportunities to bring innovative answers for, de-NOx, reduction of sulfur oxides (SOx) and dust emissions. These environmental regulatory constraints represent good opportunities for the natural gas companies to increase natural gas sales, which is an energy with important qualities, to bring adapted answers, and to provide technical support in the implementation of new technologies to customers of the glass-making sector. If the techniques of NG-combustion or de-polluting, presented here, are now at a stage of rather advanced deployment, new technologies like "Flameless" combustion, presently under development in the Iron and steel industry, seem a new axis of important progress as well in the field of the energy effectiveness as for reduction of NOx emissions. Many R&D works are presently in progress in Japan and in Europe and should lead soon on the realization of industrial Pilot demonstrations.
50

3.2 Efficiency improvement of CHP by inlet air cooling
Sari Siitonen, Electrowatt-Ekoco Oy [email protected]
Jordi Roca, Gas Natural [email protected]
3.2.1 Introduction
Efficiency improvements of natural gas fired systems will increase the competitiveness of natural gas in industry. Due to the increased energy production efficiency the fuel consumption will be lower. Therefore, also the fuel costs and carbon dioxide emissions per produced energy unit can be reduced.
In combined cycle power plants both gas and steam turbines are supplying power to the network. Therefore, improving the efficiency of both gas turbine cycle and steam turbine cycle can increase the efficiency of gas turbine combined cycles. Efficiency can be improved for example by:
• Cooling of the compressor inlet air below the ambient temperature
• Cooling of the exhaust gases of gas turbine to lower temperature by using cold process stream after heat recovery steam generator (HRSG)
• Applying supplementary firing in the HRSG
• Multistage compression with intercoolers
In this connection, the cooling of the compressor inlet air below the ambient temperature is dealt with.
3.2.2 Use of absorption chillers for cooling of gas turbine inlet air
The gas turbine output drops as compressor inlet air temperature increases, which is a problem especially in the areas of high ambient temperatures. However, by reducing the inlet air temperature the compressor power demand can also be reduced. Although refrigeration system consumes power the energy conservation in compressor power is higher. Basically, gas turbine output power can be raised by 3-4 %, when inlet air temperature is reduced by 5 °C.
Inlet air can be cooled by using evaporate coolers or, especially in areas with high air humidity, compressor chillers or absorption chillers. Absorption chillers and compression chillers belong to cold-steam refrigeration machines.
Absorption chillers are state-of-the-art technology in the cooling industry. They are mainly used for thermally driven cold generation. In absorbing chilling system for gas turbine inlet air-cooling a lithium-bromide or ammonia water solutions can be used. Ammonia water solutions are especially suitable for cooling purposes with temperature demand below 5 °C.
Refrigeration is a closed cycle in which heat is transferred from lower temperature to higher temperature. The principle of refrigeration is presented in Figure 1.
51

Fig 1: The principle of refrigeration
The main components of refrigeration machine are vaporiser, compressor, condenser and throttle valve. Refrigerant, for example ammonia circulates in refrigeration machine. The compressor increases the pressure of the cold vaporised refrigerant from the vaporisation pressure to the condensation pressure. In condenser, the refrigerant condenses and transfers heat to the surrounding. After the condenser, the refrigerant transfers to the throttle valve, in which the pressure drops to the vaporisation pressure. Due to the pressure drop, the liquid (refrigerant) is partially vaporising and same time its temperature is decreasing. In the vaporiser, the liquid-vapour mixture is vaporising. The liquid takes the heat needed to the vaporisation from the surrounding when the
environment is cooling down.
Fig 2: The absorption system
A basic absorption chiller comprises four heat exchangers: evaporator, absorber, condenser and generator. The vaporised refrigerant is led to the absorber, where a mixture of refrigerant and solvent absorbs it. Consequently, the refrigerant condenses and its concentration in solvent increases. The condensation and solution heat of the absorption process is removed from the absorber by using cooling water. The solution is circulated in the chiller based on the internal circulation pumps and pressure differences between the heat exchangers. In the generator, the refrigerant is regenerated out of the solution by mean of thermal energy from the inlet air of the compressor. So, the concentration of refrigerant in the solution decreases. From the generator the solution is led to the absorber through the valve.
The most important task of the absorption chiller is cooling. Therefore, its efficiency is described by using the coefficient of performance (COP) defined as follows:
52

H
c
QQCOP =
where
CQ Cooling output
HQ heat required for driving the absorption unit
The COP for absorption chillers is in the range of 0.75 at maximum for single effect cycle and about 1,1 – 1.2 for double effect cycle.
The biggest advantage is achieved if there are heat sources in temperatures high enough that cannot be used in any other part of power plant process. One possible heat source is hot water, which is heated in the heat recovery steam generator (HRSG) hot water coil with the gas turbine hot exhaust gases.
3.2.3 Market position
The technology does not increase the natural gas consumption directly. However, the more efficient natural gas fired processes can be developed the better competitiveness of natural gas can be reached (compared to the other fuels). Therefore, natural gas consumption will increase indirectly, when it is decided to build new natural gas fired power plants.
3.2.4 Examples, references
The Enso Espanola’s paper mill in Spain has the first combined-cycle power plant (1996) in Europe to have an absorbing chilling system for gas turbine inlet air-cooling. Heat transfer fluid in the chiller is lithium bromide (Li-Br) mixture, water and steam. The function of the chiller system is to maintain gas turbine suction air temperature at about 8 ºC in order to increase power generation and efficiency of the gas turbine. The absorption chiller is designed to give up to 3000 kW of combustion air chilling capacity at design point conditions. With this system gas turbine can operate with maximum electric output almost throughout the year.
During hot ambient air temperature period’s gas turbine suction (combustion) air is cooled and chiller system is used in chiller operation. During cold periods suction air is warmed and chiller system is in anti-icing operation. Additional function of the anti-icing operation is to prevent ice formation in the gas turbine compressor inlet.
Another example is the case of a Hospital in Barcelona (Spain), with a 4.2 MW gas turbine producing steam, used in winter time for heating and in summer time for cooling through an 5800 kW absorption chiller. Part of the cooling water is used during summer time to maintain the level of electricity production by cooling inlet air.
Ammonia based absorption chillers have also been introduced in Spain.
53

3.3 MICRO-TURBINES
Wim Mallon, Gasunie Research [email protected]
Klaas Beukema, Gastransport Services [email protected]
3.3.1 Introduction We define micro-turbines as gas turbines with a power production less than 200 kWe. They may be regarded as a relative young market development, however they have a long history as automotive power units, originating from the 1950’s. First units developed by Rover for this automotive application had relative poor response and low efficiency. In automotive application gas turbines eventually lost out to reciprocating engines, but they still enjoyed continued use in the aircraft transport sector. Until about 1990 very few gas turbines below 3 MWe were available for the industrial market, whereas between 3 MWe and 100 MWe gas turbines were available in each class demanded by industrial customers. Gas turbines in the small power ranges were used mainly for aircraft propulsion (e.g. small turboprops for helicopters, computer aircraft, leisure and trainer aircraft) and for military applications (missiles, ground equipment). Only few small gas turbines were used for industrial applications, e.g. Kongsberg KG2 and the Solar Saturn, both used for generator and mechanical drive in the offshore and some cogeneration plants. The industrial demand for (mechanical and electrical) power in the range up to 3 MWe was addressed by the use of reciprocating (piston) engines: gas or diesel fuelled. These engines were available in all power classes, having in general high reliability, reasonable efficiency and a low price. In the late 80’s and early 90’s this situation changed drastically. Increased attention for environmental issues led to more strict regulations with respect to emissions, especially NOx and CO2-emission. Various groups in the US and in Japan started research on hybrid propulsion for cars, trucks and buses. These projects addressed the problem by making use of gas turbines, because of their inherent better emission characteristics, compared to piston engines. This is based on the continuous combustion process with high excess air in gas turbines, instead of intermittent combustion in piston engines. Until then gas turbines had not really been considered because of high prices based on low production volumes. However, the technology developed for turbo chargers (essentially a gas turbine without internal combustor) for application in diesel trucks and passenger cars and the resulting decrease in price due to the higher production volume formed a sound basis for the small gas turbine development. 3.3.2 State of the Art The turbo charger technology was adopted in the first small gas turbines developed by Elliot and Capstone. In addition to this, a major breakthrough in the development of small gas turbines was the use of a high-speed generator, with a permanent magnet rotor directly coupled to the turbine wheel, resulting in a very compact, lightweight system. Of course the high-speed generator with its high frequency output (around 1000 Hz or higher instead of the 50 or 60 Hz required) had to be combined with an electronic transformer, but recent developments in the electronic sector made it possible to build a reliable AC-DC-AC transformer for an acceptable price. A final contributing factor leading to the current interest in small gas turbines is the use of recuperators. While the normal thermal efficiency (simple cycle) for a small gas turbine in the range below 100 kWe is about 15-20%, the use of a recuperator will boost the efficiency to about 30%,
54

which is competitive to reciprocating engines. Although recuperators are still fairly expensive their reliability level has improved such that operation for long periods of time has been proven. Small gas turbines for electricity production and cogeneration have to compete with the current gas and (diesel) engines available on the market. The main drawback for gas turbines has always been the investment costs. The above development and the strategy of the current small gas turbine OEM’s seriously alter the situation. Some of the biggest OEM’s (Elliot, Capstone) are considering production volumes of 20.000 units per year, which makes a competitive investment price attainable. In addition it should be brought in mind that the maintenance costs of small gas turbines are much lower than piston engines. It is therefore expected that the lower maintenance costs and the superior emission characteristics of gas turbines, apart from the gas turbine specific advantage of high power/weight and power/volume ratio, will counteract any negative difference in investment price with respect to piston engines. Gas turbines are now becoming commercially available in packaged mini-CHP and/or distributed power generation units in the 20 – 200 kWe range. Gas turbines derive their power from the expansion of a jet of hot combustion gasses and air passing through a rotor. On large machines, the rotor comprises a series of rings or moving blades fixed to a common shaft, but in modern micro-turbines a single nickel-alloy shaft replaces this. Kinetic energy of the jet is absorbed as it passes between the turbine blades. Of course an air compressor stage is also required (to compress the air) usually mounted on an extension of the rotor shaft and this compressor absorbs a portion (near 30%) of the power generated by the rotor.
Gas turbines can be designed for gaseous, liquid, and solid fuels, the most common being natural gas, biogas, fuel oil, and pulverised coal. Modern gas turbines have just one moving part, the rotor/compressor assembly, with two bearings (air bearings or oil bearing are most commonly used by most manufacturers) offering advantages of compactness, reliability, low weight, low emissions, and low maintenance. The high exhaust temperatures in gas turbines can be used via a recuperator to improve efficiency and be utilised to raise process steam or feed an absorption chiller for refrigeration and air-conditioning duties, effectively providing Combined Heat and Power (CHP) and Chilling CHPC. Normal operating pressures of micro turbines are typically 2-5 bars. The air is drawn into the turbine by the compressor and raised to combustion pressure (2-5 bar), before entering the combustion chamber. Here fuel is injected and burnt with excess air to limit operating temperatures to the capability of the burner and rotor materials. Fuels supplied at low pressure as is customary with natural gas for small consumers, must also be compressed to the combustion chamber pressure by a second compressor, which absorbs further rotor power (1 - 5%). High pressure combustion gas/air mixtures now enters the turbine and expands to atmospheric pressure as the turbine blades absorb the energy from the fuel to produce torque to turn the shaft and drive the alternator. 3.3.3 How to use it All micro turbines are delivered as complete packages, ready to connect to fuel supply, electricity grid and exhaust stack. This implies that the ‘flange-to-flange’ engine (consisting of the turbo machinery and generator, combustor and recuperator) is built in a container of 2 to 3 m³, together with the power electronics and switch gear, oil sump and pump (if present), inlet filter/silencer, controls and fuel pump or gas compressor (if required). Standard packages can be put on location with minimum of installation costs. For cogeneration applications, local suppliers can make standard heaters taking the heat out of the exhaust available. Some manufactures, like Turbec, are supplying systems with the exhaust heat exchanger included in the packages. Other manufacturers, like Bowman are supplying systems, where the recuperator can be by-passed by the exhaust gasses, to take care of the temporary extra
55

heat demand. Packages also contain the power electronics for the conversion of the high frequency output of the high-speed generator into any standard AC frequency, or DC power. All systems have sound attenuation, down to 65 dB at 10 metres distance. Usually there are two air inlets, one for the gas turbine itself and one for the cooling of the generator and the electronics. The smallest gas turbine available now is from Capstone (USA), with 30 kWe power output and electrical efficiency of 27% (excluding gas compression). Micro-turbines under test are: - Turbec 100 kWe; - Honeywell/Allied Signal 75 kWe; - Bowman 45, 80, 200 kWe; - Capstone 30, 60 kWe; - Elliot Energy Systems 45, 80, 200 kWe; - NREC/Ingersoll Rand 70 kWe; Specific advantages of micro-gas turbines are: Low Maintenance Micro-turbines require significant less maintenance than traditional IC engines of a similar size. In fact their service costs are expected to be only marginally higher than those of a traditional boiler. Low Emissions Long Life As there is generally only one moving part within the unit a long life can be expected due to the reliability of the part. The main rotor should last at least 40.000 hours before replacement is required and sometimes even longer. Low unit costs The units are generally cost competitive with IC engines on capital costs alone. This produces a competitive advantage when maintenance costs are included. Variable output and recuperation The output can be modulated to some extend without a large loss in efficiency. Recuperation can also be modulated to help match the heat load. Disadvantages of micro gas turbines might be that they can be quite noisy (70 – 80 dBa) and that they generally are designed to run once through the day; Repeated stop/starts are not usually accommodated. 3.3.4 Market position The market for small gas turbines can roughly be divided in the following sectors:
• Pure electrical power demand o Base load power:
Small industries, offices, hotels, restaurants, grocery stores, convenience stores, laundries, leisure centres, apartment buildings, UPS, etc.
Telecom services Rural areas (distributed power systems);
• Stand-by power (hospitals, offices, small industries, UPS-systems) • Peak shaving • Mobile power • Cogeneration units:
56

o Traditional CHP-units; o Absorption Cooling o Mechanical drive of refrigeration systems; o Direct use of exhaust gasses, e.g. as combustion air;
• Specific applications, based on fuel capabilities
o On-offshore applications, e.g. burning of flare gas at chemical sites o Burning other fuels; o Coal bed methane burning (applicable for coal seams) o Land fill gas, sewage gas and other bio-gas applications
• Hybrid propulsion systems (buses, trucks, cars) Small gas turbines for electricity production and cogeneration have to compete with the current gas and (diesel) engines available on the market. The advantages of micro turbines mentioned before, specifically low emissions, small size, low maintenance costs can be regarded as the main advantages above IC engines. Typical Gas consumption ranges from about 10 m³/h for a 30 kWe Capstone unit up to about 65 m³/h for a 200 kWe micro-gas turbine.
Manufacturers of small gas turbines have used various approaches to determine total overall market potential. Although various starting points can be used, most approaches start from the estimated total growth in the electricity market. Assuming a share of 8 % of growth to be provided by micro gas turbines, a total potential for micro gas turbines of about 80.000 MWe can be projected worldwide for the next 10 years. It is expected that 50% of the sales of micro gas turbines will be in the USA, while the rest will be in Asia, Europe (about 7%), Central and South America and in Africa. Assuming a ball park figure of 50 kWe as the current average size of micro gas turbines and a projected growth of this average value to 100 kWe in 2010, a total worldwide sales of 75.000 units/year and around 3400 units/year in the EU can be expected. 3.3.5 Examples and references In the Netherlands demonstration projects were carried out using micro turbines.All installations were in a combined heat and power system where the micro turbine is used to generate both electricity and heat. The electricity is fed into the local grid and the heat is put to use in the heating system or process.
Roofing factory In a roofing factory, a 100 kW Turbec turbine is installed in combined heat and power generation. The electric power is fed into the grid of the factory and the heat is used in two ways. During wintertime, the heat is used for space heating. In summertime the heat is fed into the production process. Overall efficiency is in the order of 95%. In this installation, one of the technical hurdles was the automatic transfer in the heating system from space heating to process heating. Space heating is at a varying temperature, depending on weather conditions. The process heat demands at least 85 C. Great care had to be taken to have a proper control unit.
57

Because of the need of high-pressure gas, a separate gas booster had to be installed. This booster is being controlled by the gas turbine.
Fig 1: Turbec micro turbine, the compressor can be seen on the left
Brick manufacturer A demo project is carried out in a brick manufacturing plant. In this installation a 35 kWe turbine is placed on top of the kiln, feeding the exhaust gasses directly in the process. An overall efficiency of 95% is realised. High pressure gas is available, making a simple installation possible. Electricity is fed directly into the plant grid. The installation is running on a continuous basis, as long as possible. High running hours and an economic operation can be achieved.
Fig 2: Capstone micro turbine installation on top
of the kiln.
3.3.6 Future developments Most manufacturers indicate that the future developments will be directed towards lower emissions and the ability to burn more kinds of fuel. Increase of efficiency will be a real long-term thrust, pending field experience to be gained in the coming years. There will be certainly an increase in turbine entry temperature, which will ask for increase in pressure ratio. Ceramics might be introduced to accomplish this temperature increase. If turbine entry temperature can be increased to 100 ºC and the pressure ratio to 6, a recuperated engine can have an efficiency of almost 40%, which is often mentioned as a future target. Further on ceramics may be used in small gas turbines first, as small parts are easier to manufacture flawless. This can boost turbine entry temperatures further up, leading to simple cycle efficiencies above 40%. This line of
58

development can be derived from the history of large gas turbines. Furthermore all manufacturers of micro-gas turbines (currently up to 100 kWe) indicate that the power levels up to 500 kWe to 1 MWe can be attained based on the micro-turbine concepts. The ability of high speed generators, for this power range seems yet to be the limiting factor. Also at the lower end of the range new gas turbine will become available, based upon the fast developing passenger car turbo-charger technology.
59

3.4 Radiant heating in industrial processes
Marianne Wagner, Dong [email protected]
Philippe Buchet, Gaz de France [email protected]
Willy Kesteleyn, Distrigaz [email protected] Anders Molin, Sydgas
3.4.1 INTRODUCTION
Radiant heating has been used in the industry since the 1930s, where it was introduced to bake finishes on cars. It took time for the new technology to gain acceptance but today the technology is used in most industrialised countries especially for drying and curing of paints and drying of textile, pulp and paper. Infrared energy is unique because it can heat materials or objects without heating the air around them. That allows infrared heat to be concentrated exactly where it is wanted without much loss of energy. The technology is still being developed to gain higher energy efficiency and better heat transfer mechanisms and new designs are developed that can help to improve the competitiveness of gas in industry.
3.4.2 STATE OF THE ART
FUNDAMENTALS OF THERMAL RADIATION
Thermal radiation involves transfer of heat by electromagnetic waves. The major part of the thermal radiation is emitted at wavelengths just longer than those of visible light and is called infrared (IR). The infrared range is between 0,76 and 1000 �m. The infrared wave range can be divided into the following three groups:
Type Wave length Temperature Short wave range 0,8-2,0 �m 1100 – 3200 oC Medium wave range 2,0-4,0 �m 500 – 1100 oC Long wave range 4,0 �m – 1 mm 30 – 500 oC
Table 1: Wave range groups.
GAS FIRED IR HEATERS
Gas fired IR heaters vary considerably in design and in operating principles. In general an emitting surface is heated by burning gas. Some are directly fired burners, where the combustion gases can get in contact with the object being heated, and some are indirectly fired burners where the flame is enclosed, for example in a tube. Gas fired IR heaters works mainly in medium wave length, but some new products seem to be able to work in short wavelength.
The following table show some of the different types of gas fired IR heaters that exists on the market today.
60

Type Description Characteristics Radiant tube burner
The flame heats the inside of a tube, which then radiates heat.
Medium to long wavelength
Impingement burner
A premixed jet flame impinges on a refractory surface.
High temperature Low efficiency
Porous radiant burner
Premixed air and gas pass through the radiating material and ignite close to the surface. The porous medium may be a ceramic plate/foam, ceramic or metal fibres or a knitted mat.
Medium to high temperature (RADIMAX up to 1400oC) High efficiency
Catalytic IR heater A porous burner where the porous medium is impregnated by a catalyst.
Low temperature 400-500 oC Suited for thermoforming, paintings (with solvents)
Ported tile /multi-flame burner
Premixed air/gas flow through small holes in a non-porous ceramic block. A small flame from each hole heats the ceramic block.
Medium wavelength Temperature 900-1200 oC Low efficiency
Table 2: Types of gas fired IR heaters.
Some burners are supplied with recuperation, where the combustion air is preheated by heat exchange with the flue gas. Infrared burner technology is still subject to research activities for example to find better materials and new construction principles.
3.4.3 HOW TO USE IT
APPLICATIONS Radiant heating is due to a better understanding of the advantages in the industry today used in a wide range of industrial processes over the world. Table 3 presents an overview of typical fields of utilisation.
Preheating
Metals, glass, polymer
Drying Textile, paper, gypsum boards, paint, adhesives, coatings, ink, wood veneer, latex, carpets, food
Curing Enamels, vinyl, plastics, glass, glass fibre, polymer, powder coatings, adhesives
General Heating
Metal finishing, process heaters, food processing, cooking, frying, grilling, annealing, defrosting
Table 3: Radiant heating applications.
ADVANTAGES Gas fired IR heaters has the following advantages depending on the application concerned: • Increased production speed and capacity • Reduced energy consumption
61

• Improved product quality • Reduced operation costs • Reduced required space/compact design • A good complementary technology for Convective heating zones or convective processes • Low emissions (NOx, CO) • Reduced space required (Paper drying) LIMITATIONS Radiant gas heating systems has the following limitations/weaknesses: • Short wave length capacity (for example Radimax) • Limited process temperature (up to 600-700 oC on the load) • Not suitable for complex objects • Not suitable for shining/bright objects • Ventilation required
3.4.4 MARKET POSITION
MARKET USA
A GRI market study ref /5/ has reported that gas fired IR in 1995 represented approximately 25 % of all IR installations in the four most important markets in USA (paper, paints & coatings, textiles, thermoforming). The potential is approximately 83 bcf per year. Europe
In Western Europe Gas radiant heating systems are well known but electrical processes for heat/surface treatment still keeps a great part of the energy market. In France IR gas equipments represent roughly 470 installations and 150 MW. Half of these installations are operating in the paper and board industry and 30 % are placed in the mechanics industry (analysis made by Gaz de France in 1999). IR applications are considered as a market of niches by the industry sector. The following industry sectors may represent the largest part of the potential market for IR gas burners in France: • Paper and board • Mechanics industry • Textile • Plastics • Automotive • Wood • Food • Electronics, building materials and printing are representing small niches.
COMPETITION
Gas fired radiant heaters compete today with electric radiant heaters and convective heat transfer burners. It is often reported that electric heaters offer more precise control and flexibility, but the gas-fired heaters can, due to their broad wave range, replace electric heaters in more and more applications. After all, if the thickness of a water film (on the surface) changes during the drying process, another wavelength will be required. The following table gives a comparison between gas-fired and electric burners.
62

Property Electric radiant burner Gas fired radiant burner Wavelength Low (All) Medium to long Temperature High Low to medium (high) Power density High Medium Controllability High (possibility of multiple
control zone with a relatively simple regulation system)
High (more complex control systems)
Price Cheapest for small capacities
Cheapest for large capacities
Operating costs Medium Low Maintenance costs High Low Energy costs Medium Low Flexibility High Medium
Table 4: Gas fired burners compared with electric burners
It is important to note that comparison of gas IR and electric IR is difficult because the advantages/disadvantages varies with the application. 3.4.5 Examples and references 3.4.5.1 Ongoing projects
CONRAD CONRAD is a joint European project, supported by the Fifth RTD Framework Programme 1998-2002 of the European Commission. The objective of the project is to develop and demonstrate an innovative, efficient, low-pollutant, airtight and recuperative gas-fired IR-system (infrared radiation) for industrial processes. The partners of the project is Danish Gas Technology Centre A/S (Project Co-ordinator), N.V.Acotech S.A., Gaz de France, SUNKISS, N.V. Nederlandse, Gasunie, University of Lund, Rademaker Den Boer BV Ref. /1/. CATHERM® from SUNKISS Sunkiss a French supplier of infrared equipment has together with Gaz de France designed and tested a new catalytic gas heater. Ref. /8/.
CATADRY European project CATADRY (with Acotech, RIPERT, universities): development of catalytic infrared burners and demonstrations in industrial ovens. 3.4.5.2 How to introduce radiant heating to the market It is important that gas companies help thermal equipment suppliers to suggest the use of natural gas infrared heaters. For that purpose Gaz de France is developing a computing tool to help design thermal equipment with an infrared area. Gaz de France is also developing communication tools for its own commercial task forces. Gaz de France has further contributed to the development of an independent technical centre that promotes infrared heating (both gas and electric) for industrial processes (ERICA, near Lyon). Gaz de France is also member of the Administrative Council of the French association RADIANT (leader: ADEME – French Agency for environmental and energy improvement) that promotes radiant energies. Another approach is to work with technical centres working in specific industrial fields (plastics industry, metal industry, agro food) in order for them to acquire a better knowledge of the gas infrared technology for their specific processes.
63

3.4.6 FUTURE TRENDS
3.4.6.1 TECHNICAL
The following areas are considered as future technical trends: • Confined infrared burners
• High temperature infrared burners (RADIMAX)
• New generation of catalytic infrared heaters
• Improvement of control systems (accuracy and costs).
3.4.6.2 Commercial Plastic industry In North America catalytic infrared gas heaters have been used to heat plastic sheets on thermoforming equipment. In Europe only electrically based techniques are used for that purpose. But some gas companies are running R&D projects with infrared gas heaters for thermoforming plastics. An example is the new Catherm 1000 E gas heater that raises hopes for use in thermoforming of plastics in Europe. In the plastic industries there are also other possible new applications, for example composite, blow moulding, bonding and printing. 3.4.7 Literature
/1/ www.conradburner.com /2/ Infrared burner technology improves process efficiency and capacity, Asger Myken, DGC /3/ General Infrared Process Heating Application Tool, GRI-99/0063 /4/ Gas IR Application in Paper Drying Process, GRI-99/0135 /5/ Infrared Burner Market Study, GRI-95/0300 /6/ IR Heating for Powder Coatings Application and Curing Process, GRI-99/0104 /7/ Heat transfer modelling in radiant gas burners, IGRC 2001 /8/ A new catalytic infrared gas heater, IGRC 2001 /9/ Drying using infrared radiators. A literature review. Magnus Petterson, LTH, Sweden.
64

3.5 Using Natural Gas Instead of Electricity in the Plastic Processing Industry
Jochen Arthkamp, Ruhrgas [email protected]
Hans Wackertapp, Ruhgas [email protected]
Massimo Cassibba, ENI [email protected]
3.5.1 Summary Most of the machines currently used in the plastic processing industry are electrically heated. Apart from high-energy costs, this also means a high consumption of primary energy and hence high levels of CO2 emissions to atmosphere. Thanks to new natural gas-heated machines, plastic processing companies can now draw on tried and tested technologies which, while offering identical product quality, make use of the typical application benefits of natural gas, i.e. low energy costs, a high control accuracy, fast heating and cooling etc. This article introduces some of the equipment available. 3.5.2 Introduction Plastic products are increasingly replacing metal, glass and ceramic products. Typical examples include packaging, vehicle components, consumer goods, medical consumables etc. These new products are manufactured using new machinery most of which was, until now, electrically heated, driven and controlled. This development has caused natural gas to lose some of its sales potential. To date, the plastic processing industry uses natural gas mainly for firing boilers, an area in which it faces stiff competition from oil, coal and other fuels. For the gas industry, it is therefore important to be able to use direct heating systems in plastic processing equipment and machinery, which until now was always powered electrically. 3.5.3 Natural gas-heated dryer for plastic granules
Prior to processing in extruders and Injection moulding machines, plastic Granules have to be dried to prevent Steam bubble inclusions, which may have an adverse effect on product strength and appearance. As an alternative to electrically heated appliances, Motan GmbH and Ruhrgas AG jointly developed a natural gas-heated granule dryer (Fig. 1).
Fig 1: Natural gas heated plastic granules dryer
65

Like electric dryers, this granule dryer comprises two process circuits:
In the first process, dry air is preheated by a combination of natural gas burners and a heat exchanger to temperatures of 80 to 180°C and then flows through the plastic bulk material, absorbing and thereby removing the humidity. At a downstream cartridge filled with a drying agent, the humidity is separated from the air flow so that the air dried to dew points of -20°C to -40°C can be reheated and again piped through the plastic bulk material. In the second process circuit, the cartridge containing the drying agent is regenerated using the hot waste gases of another burner. Since there are two such cartridges, one can be used for drying while the other is being regenerated. Operation of the machinery is largely the same, so there is little need for any special operator training. The product quality of the dried granules is identical to that of the electric process. For the users of this gas technology there are significant benefits: because of the lower energy costs, the investment starts to pay off after approx. 1 year. After that, the operator will save several thousand euros per year. The natural gas-heated unit has already been sold to customers worldwide. So far there have been no complaints.
3.5.4 Natural gas heating systems for extruding and injection moulding equipment
Following the pre-processing of the plastic raw material (e.g. by drying, cf. description above), further processing these days is usually in extruding and injection moulding machines. Again, there is a significant need for process heat, which is currently provided mainly by way of electric heating systems and partly thermal oil systems. One gas-heating element for large extruding machines is presently available on the market: It is the “Blue Tech” system developed and produced by Italtecnogas S.r.l.. It consists of heating collars (Fig. 2) that can be applied to extruders (Fig. 3) and injection presses, both new and old, as many as the heating zones to control, replacing traditional electrical resistances. The collars are composed of two hollow concentric cylinders with the combustion system in the lower part.
66

Fig 2 Heating collar Fig 3 Extruder with four heating collars The flames lick the inner cylinder (in contact with the surface of the plasticization cylinder) and together with exhausts run along the hollow space between the two cylinders. Exhausts go out from the outer cylinder in the upper part. The main advantages are: simple plant engineering; short time for obtaining set temperature; maintaining of set temperature with very good precision (±2°C); very good uniformity of temperature on the surface of the plasticization cylinder; for the same power, temperatures higher than an electrical system (even higher than 300°C, starting with the first heating zone); productivity increase (until 30% with reference to an electrical system); wide regulation (5÷100%) of output power; high safety; high economic saving (60-70% with reference to an electrical system); high saving of maintenance and spare parts; possibility to recover heat from exhausts to dry plastic granules in inlet.
Fig 4 Natural gas heating system for extruding and injection moulding machines
In addition, there was a need to develop another gas heating system (Fig. 4) for injection moulding machines and smaller extruder applications. This system was developed as part of a cooperation project between WEMA GmbH and Ruhrgas AG. Requirements to be met by this technology included a wide control range, the possibility to achieve high heating and cooling rates and, above all, a very even temperature distribution with a +/- 1°C accuracy in the axial and radial direction. The newly developed gas technology meets these requirements and is also very cost efficient, allowing operators of the typical, average-size plastic processing units to cut energy cost by as much as € 5,000 annually. Again, the additional investment for the technology pays off very quickly.
3.5.5 Natural gas burners for surface treatment Before plastic surfaces are painted, any grease, residues of release agents and other deposits have to be removed. This can either be done using chemicals, electric plasma processes or special natural gas burners. Again, the more efficient method with a comparable quality is a natural gas-based application. The technology uses long, blue flames to form radicals, which react with and remove the unwanted substances. The product (car body components, beer crates etc.) can then be directly painted or have something printed on its surfaces. 3.5.6 Natural gas-heated fluidised BES system to clean equipment
67

Apart from the production process itself, natural gas can also be used in fluidised bed applications to remove deposits on tools and equipment. Fig. 5 shows a technology which thermally removes, decomposes and then burns organic deposits e.g. on extruder ducts. This application can help to replace more extensive mechanical (i.e. electrically driven) technologies. Fig 5 Natural gas-heated fluidised bed for cleaning tools and equipment 3.5.7 Outlook
The high utilisation rate of up to 8,000 operating hours per year, which is typical of plastic processing machines, means that even small and medium-sized heating elements require a lot of energy. Using natural gas instead of conventional electric technologies allows operators of plastic processing machines to reduce their energy costs quite substantially. This translates into a measurable competitive edge in what is a highly competitive market.
For natural gas suppliers, this technology opens up a lucrative sales area with an excellent utilisation rate spread across the whole year. The development of natural gas-heated equipment continues. At present, there are a number of units under development, which will gradually be launched on the market. The modular system known as "Natural Gas Technologies in Plastic Processing" will thus increasingly help operators of plastic processing systems to cut costs. Moreover, the use of natural gas instead of electricity will result in significant primary energy savings and hence CO2 emission reductions.
68

3.6 PRECISE COMBUSTION CONTROL
TAKASHI TATSUDA, OSAKA GAS [email protected]
3.6.1 INTRODUCTION Precise combustion control, in other words precise air ratio control, is very important for saving energy and improving the quality of the products. There are a lot of methods to regulate the air ratio . At present the best way to control the air ratio is measuring the oxygen content or other components in the flue gas of the furnace. However we cannot use this method for some furnaces or equipments. In that case, it is necessary to control the amount of natural gas and combustion air. Recently, a new device that controls the amount of natural (fuel) gas and combustion air by using only 2 valves and 4 pressure sensors, is developed and commercialised. The device has low installed costs, high accuracy and long durability (see ref 1 and 2). 3.6.2 STATE OF THE ART 3.6.2.1 Oxygen concentration method This is one of the most popular and reliable ways for combustion control. But, the oxygen sensor and the numerical value converting unit are not cheap. Besides this system cannot be applied in to the following cases. For furnaces that have infiltration air which is unexpected combustion air, for example, surplus
air through the gap of the furnace walls. For furnaces with very high temperatures (more than 1200 degree centigrade). The life of the
oxygen sensor is too short. For furnaces whose flue gas has much contaminants. The life of the sensor may not be long
enough. For burners without furnaces
3.6.2.2 Measuring the amount of natural (fuel) gas and combustion air by flow meter. There are many kinds of flow meters. Most of them are expensive, large scale, and have a low reliability when the amount of gas or air is small. Moreover in order to measure the amount accurately and to control air ratio precisely, we must attach a pressure and temperature compensation device to the meter because of changing gas and air supply conditions. 3.6.2.3 An equalizing valve method. An equalizing valve that equalizes the pressures of the natural (fuel) gas and combustion air is a common way of air ratio control. This system keeps the ratio uniform by regulating gas pressure. The cost will be very low. However, the ratio is likely to deviate from the set point when the combustion rate is very high or very low.
69

E v
Pa Pg
r
Fuel
Fig 1 Equalising Valve System 3.6.2.4 FIC system
From the pressure difference of each orifice meter (gas and air) the flow rate is calculated . Then each control valve is operated so that the air ratio will approach to the target value. The disadvantages of this system are (1) the turn-down ratio cannot be set large, (2) the response speed is low because of the feedback time.
Qa=k ΔPa
Fuel
Air
FIC Qg=k ΔPg
aFIC
Fig 2: FIC sys 3.6.2.5 New Device: EBC system EBC system stands for Easy Burner Control syspressure sensors. Therefore, the system costs are notmeasurement of the pressure differences on both sides (which is the same as the pressure on one side (downstr
N2 ×
Q= N2 + V
Fuel
Air
Control valve
EBC controller
Pressure sensor
Control
valve
Fig 3: Installation of EBC System
70
Calcul
Ai
qualizingalvetem
tem. It consists only of 2 control valves and 2 high. The flow rate is calculated from the of each valve and the burner supply pressure eam) of the valve).
Q: Flow rate N: Burner flow coefficient V: Valve flow coefficient P0: Burner fore pressure
V2
P0 2
P1 P0 Valve unit
P0: Valve fore pressure P1: Burner fore pressure
P1 P0
Fig 4: EBC System

3.6.3 How to use it The EBC system can be used for several kinds of industrial furnaces. The most interesting market is the glass industry. The second seems to be the heat treatment industry. Glass Industry For the glass quality, such as colour or inside small bubbles, and for saving energy it is very important to control the air ratio precisely of the fore-hearth. This type of furnace has a high amount of surplus air passing and entering inside through its gap. Further more, its flue gas includes a lot of components of vaporized glass and the temperature is high. Consequently, it is impossible to use an oxygen sensor method to regulate the ratio. The EBC system is able to solve these problems. A glass fore-hearth is usually attached to a number of pre-mixed small burners, which mix gas and air by means of a venturi tube mixer. If the EBC system is used in place of the mixer, the air ratio control will be easier and much more correct.
natural gas
burner
blower
vent
flue gas infiltration air
R
Fig 5: Conve
Heat treatment In the process of hone of the most importancombustion control is imponecessary to use an oxygetakes a long time to stabiltime and the furnace volumadjust the air ratio smoothly There are a lot of kimportant. Therefore, EBC 3.6.4 Market Position
In general the EBCreliability, response time, aof common industrial furnais a little cheaper and the market seems to be restrictreatment furnace.
melting glass
uri mixer
ntional system
eat treatment, t factors in ordrtant. EBC cannn or another so
ize the oxygen e Then we can and quickly.
inds of ceramicis suitable to the
system is supnd durability. Tces, for exampleprecision is betted to some furn
B U R N E
ai
(left) and EBC (right) of Glass Fore-Hearth
the control of the furnace atmosphere gas components is er to produce high quality metals. Accordingly, accurate ot satisfy the requirement because of its precision, so it is rt of gas sensor. But, start up or change of the air ratio, it or another gas components owing to the sensor response use the EBC system to control gas and air flow in order to
materials. For certain materials, operating air ratio is very control of combustion air ratio of such a ceramic furnace.
erior to other air ratio control methods in cost, precision, he competitive device is an oxygen sensor system. In case , drying, heating or dissolving furnaces, the oxygen system
ter in comparison with the EBC system. Therefore the EBC aces or equipments such as a glass fore-hearth and a heat
71

3.6.5 Examples Osaka Gas Co., Ltd. and Chugai Ro Co., Ltd have developed this system. Both companies sell the device together or separately. At present, over 350 units of the EBC system are installed in many factories. 3.6.6 Future Trends The cost of the EBC system will be lowered in the near future, because of the lower cost of the calculating machine (computer system) . and the increased sales (economy of scale). 3.6.7 Literature Development of Intelligent Burner Control. T.SAEKI ; Osaka Gas, K NAKAGAKI ; Chugai Ro, 1995 IGRC The latest Gas Burner Control System K. IZUMI ; Chugai Ro, T SAEKI ; Osaka Gas, 1998 AFRC&JFRC
72

3.7 Wobbe index and calorific value control in gas fired industrial processes
Massimo Cassibba, ENI [email protected]
3.7.1 Introduction Natural gas used in industrial processes may come from different sources and therefore there are variations in its composition. Certain combustion processes are very sensitive to changing gas composition. Therefore an automatic control and regulation system suitable to compensate in real time for variations in natural gas composition was developed and is now available on the market. 3.7.2 State of the art Control of the gas quality in natural gas supplied to industrial furnaces and/or combustion processes is normally performed by means of continuous monitoring of the Wobbe Index or of the gross calorific value. The developed control and regulation system includes the following settings: • Constant thermal input to the burner by regulation of the flow rate of natural gas according to changes in the Wobbe Index; • Variable thermal input to the burner and regulation of the natural gas-air flow rates according to changes in the Wobbe Index, with furnace temperature and stack oxygen level both constant; • Constant Wobbe Index by mixing natural gas with air; • Constant thermal input to the burner and constant Wobbe Index by mixing the natural gas with air and regulating the flow rate of the gas mixture; • Control of gross calorific value by mixing the natural gas with air or with LPG.
The main components of the system are: • An analyser for measuring the Wobbe Index or the gross calorific value of the natural gas; • A control and regulation device which is able to calculate the correct gas flow rate and to compensate for variations in the gas quality; • A circuit for mixing the natural gas with air or LPG, as required. 3.7.3 How to use it Industries with sensitive thermal processes, particularly glass industry and thermal metal treatments, are interested in this system. In many applications variations in gas composition are not important or they are at least compensated by regulation of the gas/air ratio.
73

However in the industrial sectors mentioned before, these variations can cause serious problems in process management and consequently affect the quality of the final product. The choice of setting obviously depends on the user’s needs and on the process. In general: • The setting “at pre-set thermal input” is more suitable for single use with constant heat input; • The setting “at set furnace temperature and stack oxygen level with variable thermal input” is suitable for single use with processes where heat input is variable; • The setting “at constant Wobbe Index value” is suitable for those cases where a number of uses require constant gas quality; • The setting “at constant thermal input and prefixed Wobbe Index value” is suitable for a number of uses where constant gas quality and constant heat input are required; • The setting “at prefixed gross calorific value” is a particular case suitable for use where the
most important factor is to keep the calorific value of the natural gas within a certain range, since its fluctuations, which fall outside the optimum value of the process, may cause system management and capacity problems, as well as problems with the quality of the finished product.
3.7.4 Market position This system does not increase directly natural gas consumption, but it favours a rational use of energy, avoiding problems in process management, maintaining a good quality of the final product and consequently increasing the satisfaction rate of the user. 3.7.5 Examples, references The control and regulation system is installed in two Italian glass factories. The first installation is installed in a melting furnace for producing glass for the pharmaceutical industry. In this case mixing the natural gas with air controls the Wobbe Index. This is the setting “at constant Wobbe Index value”. The system manages to keep the pre-set Wobbe Index constant within a ±0.3 MJ/Sm³ band, with a regulation time of less than 10 minutes. Variations in the operating temperature of the furnace are limited to around 3-4 °C, without the system these variations are over 10 °C. Furthermore, the quality of the finished product is unchanged. The second installation is carried out on a float furnace for production of flat glass. The setting “at prefixed gross calorific value” In this case the gross calorific value of the fuel gas is controlled by mixing it with air or with LPG, using a gas chromatograph to measure the calorific value. The system is capable of compensating for variations in the gross calorific value ranging from 38 to 41 MJ/Sm³, bringing them within a range of variability determined by pre-setting a lower set point and an upper set point, with a dead band of ±0.2 MJ/Sm³ variation. Average regulation times are around 30-45 minutes. 3.7.6 Future trends
In the above described installations the system works satisfactory . The control and regulation device always performs very well. The component we had to pay the most attention to was the analyser, the core of the control system.
74

In the first case, where a Wobbe Index analyser was installed, there were reliability problems, linked to the wear of some parts. With frequent and correct maintenance, is the analyser works very well and the advantages for the process are considerable. In the second installation the gross calorific value is measured by a gas chromatograph. The response time of this analyser is around 15 minutes and sometimes the frequency of variations in gas composition is smaller than that time. The system works well, but the compensation is not always correct. It is obvious that the performance of the control and regulation system can be improved by the installation of a new generation gas chromatograph, which has fast response times (2-5 minutes).
75

Appendix 1 Members of IGU SG 7.2 Klaas Beukema (chairman) Gastransport Services The Netherlands Philippe Buchet Gaz de France France Massimo Cassibba Eni S.p.A. Gas and Power Italy Willy Kesteleyn Distrigas Belgium Anders Molin Sydgas Sweden Smail Moussi Sonelgaz Algeria Jordi Roca Gas Natural Spain Sari Siitonen Electrowatt- Ekono OY Finland Takashi Tatsuda Osaka gas Japan Hans Wackertapp Ruhrgas Germany Marianne Wagner DONG Denmark
76

6. REPORT OF STUDY GROUP 7.4
Future Business Opportunities for the Gas Industry
in a Hydrogen Economy
Rapport du Groupe d’étude 7.4
Future opportunités pour l’industrie du gaz dans une économie de l’hydrogène
Chairman/Président
Jacques Saint-Just France
77

TABLE OF CONTENTS
ABSTRACT
EXECUTIVE SUMMARY
FOREWORD
1 The current role of the gas industry in the hydrogen industry
1.1 The Hydrogen Industry Today
1.2 Current role of the gas industry in the hydrogen industry
2 The future of hydrogen in the energy business
2.1 The Global scene
2.2 The regional scenes
2.3 Barriers for the appearance of the Hydrogen economy
2.4 Present and potential Players in the Hydrogen Energy Field
2.5 Early actions in Hydrogen Energy; Motivations. Project update
3 future business opportunities for the gas industry in a hydrogen economy
3.1 Overview
3.2 Future Business opportunities
3.3 Summary and Conclusions; Opportunities in a LiberaliZed Market Structure
4 Proposed actions for IGU
Appendix 1 - Knowledge on Pure Hydrogen Networks Appendix 2 - Hydrogen Appliances Appendix 3 - Members of IGU SG 7.4 References
78

ABSTRACT
Since year 2001, the context, in all parts of the world, has evolved towards the recognition that hydrogen will be a major energy carrier for the future. The United States and Europe, in particular, have specifically identified hydrogen as a long-term solution for a clean and secure energy supply and Japan is a leader in new enabling hydrogen technologies.
However, the timing and the path that the evolving industries will take and the make-up of the hydrogen energy industry are not set and will depend on future government policies and regulations, technology development and industry visions. The full-fledged “Hydrogen Economy” is decades in the future and the identification of timely opportunities for gas companies is a challenge, as companies are focused on short term duties, with often deregulation as a major concern.
The present report lists a number of opportunities for the gas industry, per order of likely appearance. Natural gas should provide the largest fraction of the huge amounts of hydrogen that will become necessary if hydrogen is to become a vehicle fuel, in particular. However, it will take many years before hydrogen becomes a significant energy carrier with an impact on gas sales. Consequently, the report recommends the gas industry to consider the opportunities that are created already right now, outside of gas sales. Not taking advantage of these opportunities may restrict the future role of the natural gas industry to that of a mere supplier of raw material, which is unlikely to be the most rewarding position in the value chain.
It is the objective of this report to contribute to provide the gas industry with an informed basis for sound decisions concerning its involvement in the hydrogen energy business.
RESUME
Depuis 2001, le contexte mondial a évolué vers une reconnaissance que l’hydrogène sera un vecteur d’énergie majeur du futur. Les Etats-Unis et l’Europe, en particulier, ont spécifiquement identifié l’hydrogène comme une solution, à terme, pour un approvisionnement énergétique propre et durable et le Japon est un leader pour la mise au point des nécessaires technologies hydrogène.
Néanmoins, les échéances et la marche à suivre qui seront adoptées par les industries parties prenantes restent à déterminer et seront fonction des futures politiques gouvernementales, des contraintes environnementales, des développements technologiques et des visions long terme des industriels.
Le présent rapport présente des opportunités pour l’industrie gazière, dans l’ordre chronologique de leur mise en œuvre potentielle. Le gaz naturel devrait fournir la plus grosse fraction des quantités d’hydrogène qui seront nécessaires si l’hydrogène devient un carburant, en particulier. Cependant, de nombreuses années seront nécessaires avant que l’hydrogène ne devienne un vecteur d’énergie important avec un impact significatif sur les ventes de gaz. En conséquence, le rapport recommande que l’industrie du gaz s’intéresse aux opportunités qui sont créées dès à présent, en dehors des ventes de gaz. Négliger ces opportunités pourrait restreindre le futur rôle de l’industrie gazière à celui d’un simple pourvoyeur de matière première.
C’est l’objectif de ce rapport que de contribuer à fournir à l’industrie gazière des informations pertinentes pour aider les prises de décision dans le domaine de l’hydrogène énergie.
79

EXECUTIVE SUMMARY
In its 2001-2003 work plan, the IGU recognized that business opportunities would be generated by the early “Hydrogen Economy” actions, even if it was acknowledged that it would take decades before a full fledged “hydrogen economy” could be in place, in parallel with electricity as the other main energy carrier. Consequently, the IGU instructed its Hydrogen Study Group “to explore and review future business opportunities for natural gas in a Hydrogen Economy”.
An early decision of the Study Group was to investigate the opportunities for natural gas companies rather than for natural gas, considering that the companies could, on the occasion, advantageously expand the scope of their business beyond natural gas.
Later, the Study Group had to take into account the launch of specific Hydrogen Energy programs by the US and then Europe (2.1 billion € in R&D in the E.U’s. 6th Framework Program) and modify its initial conclusions. Energy supply security is a main motivation of these programs, partly as a consequence of the September 11 events. On the occasion of the related announcements, the hydrogen economy was widely described to the general public for the first time. Meanwhile, Japan was pursuing its ambitious plans on hydrogen and fuel cells with the delivery of the first generation hydrogen power fuel cell vehicles by Toyota and Honda, in December 2002 in both Japan and California.
A limited number of opportunities for the gas industry are listed in this report, per order of likely appearance. Natural gas should provide the largest fraction of the huge amounts of hydrogen that will become necessary if hydrogen is to become a vehicle fuel, in particular. However, it will take many years before hydrogen becomes a significant energy carrier with an impact on gas sales and the report recommends the gas industry to consider the opportunities that are created already now, outside of gas sales. The prospects created by the forthcoming hydrogen economy, are so numerous that many potential players are getting prepared now through alliances and new ventures. With a few exceptions, particularly in Japan, the natural gas industry is not yet part of that endeavor. There is a risk involved, even if some may consider that maintaining only a technology and strategy watch is sufficient for the time being.
The present report is not a plea for hydrogen. It aims at showing that a serious evolution, even a revolution, has started and that the burgeoning move towards a hydrogen economy cannot be ignored, even if the topic is still controversial. The report will meet its objective if it contributes to permit a well-informed gas industry to make the right decisions concerning the level of its involvement.
The opportunities that have been identified by the Study group appear in the figure 1, next page. They concern the entire hydrogen energy chain and relate to different terms of inception. Some of the opportunities are linked, e.g. on-site reformers and fuel cell buses on CNG refueling stations. A few gas and energy companies have already seized some of the short terms opportunities. Long term opportunities - ~40 years from now- are mentioned to make sure that the path shaped by the various opportunities is in line with long term energy scenarios which recommend that, at some point, the decarbonization of fossil fuels, including natural gas, should take place.
Finally, recommendations are made to IGU to recognize the topic’s fast growth, cross-cutting aspects concerning the entire gas chain and potential impact on the gas industry in terms of both threats and opportunities. A number of actions for a stronger involvement of IGU are suggested.
80

2003 2010 2020 2030 2040 2050
H2Production ST2: from NG, on site
ST1: from renewables
H2Transmission ST3: injection of H2
into NG
MT1: H2 distribution networks
H2Storage
H2Utilization ST5: HCNG
(Hythane®)
MT2: H2 CHP (fuel cells, …)
Short term (ST) Medium term (MT)
MT3: H2 buses
LT1: large reformers withCO2 sequestration
LT2: neat H2 transmission
LT4: H2 appliances
LT5: H2 power generation
Long term (LT)
LT3: large scale (underground storage)
Opportunities resulting into increased natural gas sales
Opportunities in renewable energies with various amounts of natural gas
Opportunities in hardware and gas technologies
Figure 1: twelve business opportunities for the gas industry created by the burgeoning “Hydrogen Economy”
Short-term opportunities
1. Hydrogen from natural gas, small scale, on site
The market prospects for fuel cell CHP and hydrogen vehicles have encouraged many industrial players to develop innovative small scale on site reformers, able to provide soon hydrogen on site at prices similar to those attached to the large-scale production of hydrogen. Through agreements with the small-scale reformer manufacturers, gas companies could have access to the market of hydrogen as an industrial gas and turn the CNG refueling stations into dual CNG/hydrogen refueling stations.
2. Refueling stations for HCNG buses (Hythane®)
Besides perpetuating the environmental advantage of CNG over diesel, the utilization of a natural gas/hydrogen blend -HCNG- in traditional thermal engines buses would constitute a smooth transition towards the hydrogen economy. It could be implemented immediately, in contrast to fuel cell vehicles, which may not be ready commercially before 15 or 20 years.
81

3. Addition of a few percents hydrogen in natural gas
Spiking natural gas with hydrogen of renewable origin or obtained from natural gas with CO2 sequestration would permit the CO2 emissions per energy units of combusted gas to be lowered. It remains to determine the level of hydrogen that could be added without causing difficulty at any point of the gas chain.
4. Hydrogen from renewables
The share of renewable energies is set to increase in all countries. Hydrogen will be a carrier of these energies. A new industry is being created with numerous opportunities.
Medium term opportunities
1. Hydrogen distribution networks
At this stage of early development of fuel cells, the technical and economic optimum system configuration is not yet established: it is conceivable that, e.g., a small network of a few tenths of fuel cells fed with hydrogen from a single reformer may represent an optimum system configuration in a given context. Hydrogen distribution networks would then be necessary. Their construction and maintenance would represent a business opportunity.
2. CHP with hydrogen as a fuel
A hydrogen distribution infrastructure would permit the development of CHP with hydrogen as a fuel in fuel cells and possibly microturbines.
3. Refueling stations for Hydrogen fuel cell vehicles
Buses will likely be the first hydrogen fuel cells vehicles in commercial service as hydrogen storage and vehicle range is not an issue for buses. With competitive on site reformers becoming available, Gas Companies will have the opportunity to turn the CNG refueling stations into dual CNG/hydrogen refueling stations and become significant players in the huge market of vehicle fuels.
Long-term opportunities
1. Neat H2 transmission
Hydrogen from distant renewable sources and from large natural gas reformers with CO2 sequestration will have to be transported over long distances to be distributed.
2. Large SMR with CO2 sequestration
Ultimately, fossil fuels, including natural gas, will have to be decarbonized and this operation will be more economically done in large SMR plants.
3. Large scale hydrogen storage (underground storage)
Underground storage of hydrogen has been demonstrated to be feasible and will permit to adapt the hydrogen production characteristics to the demand.
82

4. Hydrogen appliances
The wide availability of hydrogen will generate the appearance of hydrogen appliances, particularly catalytic combustion devices.
5. Power generation with hydrogen
Hydrogen is a good fuel for combustion turbines
83

FOREWORD
In the previous triennium 1998-2000, the International Gas Union completed a study to investigate the potential of hydrogen as a future energy carrier and the impact on the gas industry in this context. The study reviewed the benefits of hydrogen use on the reduction of greenhouse gas emissions and the recent technological advances on production, transportation, storage, and utilization of hydrogen and their economic and environmental impacts.
The study concluded that hydrogen could be an excellent or even ideal energy carrier to counter the greenhouse effect and global warming. It could be produced with low CO2 emissions from renewables or from fossil fuels with CO2 sequestration. The study projected that its utilization could become widespread before the second half of the 21st century. This is anticipated to occur for environmental reasons even before the fossil fuels reserves would start dwindling.
Mandates or incentives would ease the transition to the hydrogen economy, as governments recognize the large and rising societal costs of fossil fuels because of their detrimental effects on the environment and public health effects. With tougher environmental standards and higher energy taxes, hydrogen as an energy carrier will become competitive at some point in the future.
Natural gas will play a key role in supplying the enormous quantities of hydrogen that will be necessary. Recommendations were therefore made to the IGU for a deeper involvement of the gas industry in the hydrogen energy area, in view of both the potential future opportunities and the extensive experience of the gas companies in the town gas chain, which had hydrogen as its main constituent.
At the end of year 2000, the IGU decided to maintain a dedicated Study Group, the SG 7.4 on the hydrogen energy topic, within WOC 7 “Industrial Gas Utilizations”, with the following responsibility:
In consultation with WOC 5 (distribution) and 6 (Utilisation of gases for domestic, commercial, and transportation sectors), the Study Group will: 1- survey the current gas industry's role in the hydrogen industry 2- assess the future of hydrogen in the energy business 3- explore and review future business opportunities for the gas industry in a Hydrogen Economy A report will be prepared detailing the results of the study, which will allow sharing and exchange of information on the hydrogen industry and will provide the gas industry with an informed basis for business decisions.
Since year 2000, the context, in all parts of the world, has dramatically evolved towards the recognition that hydrogen will be a major energy carrier for the future. The United States and Europe, in particular, have specifically identified hydrogen as a long-term solution for a clean and secure energy supply1.
However, even though the idea of hydrogen as an energy carrier has been be included in future energy scenarios by energy policy advisers, the timing and the path that the evolving industries will take and the makeup of the hydrogen energy industry are not set and will depend on future government policies and regulations, technology development and industry visions. The full-fledged “Hydrogen Economy” is decades in the future and the identification of timely opportunities for gas companies is a challenge, as companies are focused on short term duties and often concerned with deregulation as a major challenge. The Study Group 7.4 focused its activity on item # 3, as items # 1 and 2 have either been dealt with in the previous triennium or been addressed in excellent recent reviews2.
An option that has been taken in this report was to dissociate fuel cells and hydrogen energy. It is recognized that fuel cells are indeed the best device to turn hydrogen into useful forms of energy such as electricity and heat, but, if it is hardly conceivable that a “Hydrogen Economy” could exist without fuel cells, in contrast, fuel cells could develop in the present fossil fuel economy. We have attempted, in particular, to avoid including in our projections for hydrogen demand, the quantities of hydrogen utilized by fuel cells operating on natural gas, LPGs or methanol. We have considered that the hydrogen demand could exist only if a hydrogen distribution infrastructure were in place. In short, a fuel cell with a reformer fed with natural gas creates a natural gas demand, not a hydrogen demand.
84

Another option that has been adopted in this report was to describe in some details only a few of the many current hydrogen energy demonstration projects. We selected a few of the lesser-known ones and those which could be considered as examples of opportunities for the natural gas industry.
The opportunities will appear along the entire chain, from hydrogen production to utilizations. A number of the IGU’s Working Committees are concerned with the hydrogen energy topic. The Study Group 7.4 is pleased to acknowledge the contribution of:
WOC 2: Underground storage; Klaus Ziegler
WOC 5: Distribution; Mannes Wolters
WOC 6: Utilisation of gases for domestic, commercial, and transportation sectors; Jeff Seisler
The Study Group 7.4 was also fortunate to obtain the cooperation of major organizations directly involved in developing hydrogen energy:
The U.S. Department of Energy
The WE-NET Center in Japan
Energy + from the Netherlands
The report was also prepared by Jacques Saint-Just, coordinator and Marc Berger, secretary (France), Takayuki Azuma (Japan), Gianfranco Visigalli (Italy), Lars Sjunnesson (Sweden), Fidel Valle (Spain) and Bjarn Spiegelhauer (Denmark), with a special contribution of Bob Harris, Chairman of WOC 7.
The Study Group met five times over the two-year writing period of the report. December 2000 (Paris), May 2001 (Venice), January 2002 (Palm Springs), June 2002 (Copenhagen), October 2002 (Barcelona).
______________________
85

1. THE CURRENT ROLE OF THE GAS INDUSTRY IN THE HYDROGEN INDUSTRY
1.1 The Hydrogen Industry Today Hydrogen is a commodity that is produced and used in large quantities by various industries such as the petroleum refining and petrochemical industries. It is produced both intentionally in dedicated units (“on-purpose hydrogen”) and recovered as a by-product of various processes. It is therefore difficult to talk about a “Hydrogen Industry” as a well-defined entity. Tracing the quantities produced and utilized is not straightforward either, as some industries, such as the petroleum refining industry, produce and consume large quantities of hydrogen on site, making accurate production numbers difficult to determine.
Only a small fraction (<4%) of the total hydrogen produced is traded as an industrial gas by the merchant/industrial gas companies for a variety of small users (table 1.1.a).
United States
Western Europe Japan Rest of the world
Captive users 88% 92% 97% ~99%
Merchant users 12% 8% 3% <1%
Table 1.1.a: the ratios between captive and merchant users differ in various regions of the world (SG7.4 estimate).
However, following the trend seen in the US, the merchant use of hydrogen is growing due to an increasing demand for hydrogen and the desire of customers to outsource their hydrogen supply.
Hydrogen mixed with nitrogen or carbon monoxide is of interest in metal treating. Many suppliers have traditionally provided ammonia and methanol crackers that produce hydrogen at purities of 75% and 40-45%, respectively. The technology has been extended to crack natural gas in so-called exo and endogas processes. Due to economic and environmental reasons, these processes are on the decline and are likely to disappear.
1.1.1 The current Hydrogen Markets Today, hydrogen is essentially a chemical commodity whose the main markets are the ammonia production (45%), oil refining (25%) and methanol production (15%). The rest of the demand for hydrogen comes from oxo syntheses (7%), industrial gas markets (4%) and the rocket industry (Figure1.1.1.a). Currently, the rocket industry provides the only example of pure hydrogen used as a fuel.
0%10%20%30%40%50%
Ammonia
Refinin
g
Methan
ol
Oxo sy
nthes
es
Rocke
t fuel
Indus
trial g
as
Figure 1.1.1.a: current uses of hydrogen
86

Natural gas and hydrogen are closely linked, as the largest fraction (80%) of intentionally produced hydrogen is produced from natural gas and, in turn, hydrogen represents the largest output for natural gas as a raw material (figure 1.1.1.b).
C HC H 44
LP G s
C 4
C 4+
C HC H 44
LP G s
C 4
C 4+
12% energy loss M ethanolC H 3 O H16 M t/y
14%12% energy loss M ethanol
C H 3 O H16 M t/y
14% M ethanolC H 3 O H16 M t/y
M ethanolC H 3 O H16 M t/y
14%
P etroleumC hem icalsP etroleumC hem icals
NATURAL
GAS
NATURAL
GAS
C oal
N aphtha
C 2
20%
C oal
N aphtha
C 2
C oal
N aphtha
C 2
20%
15% energy loss
SyngasCO + H2
SyngasCO + H2 M TB E
6M t/y
18%
A dditive for vehicle fuels
Form aldehyde8 M t/y
46%
G luesP lastics
Form aldehyde8 M t/y
46%
G luesP lastics
M ethylhalides3%
P ropellentsS olvents
M ethylhalides3%
P ropellentsS olvents
M ethylam ines4% S olvents
P esticidesM ethylam ines4% S olvents
P esticides
M ethionine A nim al feedM ethionine A nim al feed
H ydrogen cyanide0.5 M t/y
+ N H 3P lastics
H ydrogen cyanide0.5 M t/y
+ N H 3P lastics
C arbon disulfide1.1 M t/y+ S
FibersC arbon disulfide1.1 M t/y+ S
Fibers
E lectric arc, O 2A cetylene1 M t/y P lasticsE lectric arc, O 2A cetylene1 M t/y P lastics
+ H C l
C hlorom ethanes0.5 M t/y
P ropellentssolvents+ H C l
C hlorom ethanes0.5 M t/y
P ropellentssolvents
M aleic anhydride0.4 M t/y+ O 2 P lasticsM aleic anhydride0.4 M t/y+ O 2 P lastics
M arket trend:U p S table D ow n
M arket trend:U p S table D ow n
Alkanes
Fischer-Tropsch
FuelsD iesel additives
W axesAlkanes
Fischer-Tropsch
FuelsD iesel additives
W axes
FertilizersP lastics
78%
A m m onia110 M t/y
H 235 M t/y
FertilizersP lastics
78%
A m m onia110 M t/y
H 235 M t/y
Esters (D .M .T.)
7%
FibersE sters (D .M .T.)
7%
Fibers
P lasticsA ntifreeze
P lastics
Carbonylations
4%
+ steam
AldehydesAnhydrides
AlcoholsAcids
Ethylene12.5 Mt/y
Propylene6.5 Mt/Y
P lasticsA ntifreeze
P lastics
Carbonylations
4%
+ steam
AldehydesAnhydrides
AlcoholsAcids
Ethylene12.5 Mt/y
Propylene6.5 Mt/Y
P lasticsA ntifreeze
P lastics
Carbonylations
4%
+ steam
AldehydesAnhydrides
AlcoholsAcids
Ethylene12.5 Mt/y
Propylene6.5 Mt/Y
P lasticsP aints
Acetic acid 3 Mt/y
13%
P lasticsP aints
Acetic acid 3 Mt/y
13%
Natural gas as a feedstock for chemicalschemicals and fuels
© La Recherche, 1990, J. Saint-Just et al.
Natural gas as a feedstock for chemicalschemicals and fuels
© La Recherche, 1990, J. Saint-Just et al.
Figure 1.1.1.b: chemicals and fuels from natural gas (1990 data)
1.1.2. Players of the current hydrogen industry 1.1.2.1. Industrial gas companies
The industrial/merchant gas companies have become the major players in the current hydrogen industry because of their involvement in both the merchant gas business and the bulk supply of large customers through dedicated giant units. This activity is spurred by the growing demand for hydrogen for petroleum refining and the desire of many refiners to outsource their hydrogen production to concentrate on their core business. Durable partnerships with engineering companies have been established for that purpose (Air Products + KTI/Technip, Air Liquide + Howe Baker (US) + Haldor Topsoe (Europe), BOC + Foster Wheeler, Messer Griesheim + Lurgi,)
The engineering divisions of the industrial gas companies are also usually involved in hydrogen separation and purification technologies
1.1.2.2 Engineering companies
Hydrogen production
In addition to the engineering companies mentioned above who are technology owners, large engineering construction companies are involved. At some point, Kvaerner claimed to be the largest builder of reformers. There are approximately twenty large engineering companies that can build large hydrogen generation plants (up to 130,000 Nm3/h), based on either steam reforming or partial oxidation/gasification.
87

A few companies specialize in small reformers (100 to 1000 Nm3/h) of natural gas, or preferably, methanol, that can compete with electrolyzers. These plants do not deliver hydrogen at the most competitive price but they may have advantages for customers for whom price is not the first requirement.
Hydrogen separation
In the hydrogen production chain, separation is an essential step. UOP, the leading process licensing company for the oil refining industry, is the major PSA (Pressure Swing Adsorption) supplier. Air Liquide and Air Products are other suppliers, among about 15 suppliers worldwide.
1.1.2.3 Oil companies
Oil companies are the largest producers/users of hydrogen. Hydrogen is often said to be the most precious ingredient in a refinery. ChevronTexaco and Shell are the owners of the most commonly used oil residue and coal gasification processes. As discussed later, both companies are very active in the burgeoning hydrogen energy area. Exxon has built several integrated fluid coking/hydrogen production plants based on its own technology.
1.1.2.4 Petrochemical companies
The ammonia industry is the current single main user of hydrogen. From its historical involvement in ammonia, Norsk Hydro has retained its interest in hydrogen and remains the foremost manufacturer of electrolyzers in the world and is one of the most active players in hydrogen energy.
1.1.2.5. Coal Companies
Coal is used to produce 20,000 MW of syngas (H2 + CO) mostly for chemicals (ammonia and methanol) and power generation3. Presently, coal companies have a role, which is essentially limited to supplying the coal. Their potential interest for hydrogen is nevertheless apparent through the US DOE co-funded projects, the World Coal Institute and Zero Emission Coal Alliance studies. Poland and China are also potential players in this area.
1.1.2.6 Catalyst companies
Nine companies are listed in the Worldwide Catalyst Product, Process Licensing & Service Directory under the Steam Reforming Headline4. Three catalysts companies (Süd Chemie, Synetix, Haldor Topsoe) supply the majority of the steam reforming and shift catalysts.
1.1.2.7 Manufacturers of electrolyzers
Around twenty companies in the world have capabilities to produce electrolyzers of significant capacities, from 20 Nm3/h up to 5000 Nm3/h. As electrolysis is bound to play a key role in the future hydrogen economy and benefit from the technological advances made for fuel cells, newcomers are appearing in the field, with the prospect of attracting the new businesses of hydrogen filling stations and hydrogen production from renewable energies. At least five companies are targeting these new markets: Norsk Hydro (Norway), Stuart Energy Systems (Canada/Belgium), Proton (USA), Teledyne (USA) and Shinko Pantec (Japan). The trend is to use pressurized electrolyzers. GHW (Gesellschaft für Hochleistungs-Elektrolyseure zur Wasserstofferzeugung, - an associated company of MTU, Norsk Hydro Electrolysers and HEW, with MTU having lead management) installed a pressurized electrolyzer at the world’s first hydrogen filling station for buses at Munich airport.
1.2 CURRENT ROLE OF THE GAS INDUSTRY IN THE HYDROGEN INDUSTRY Gas companies, through town gas, were at some point the largest producers of hydrogen in the world, since town gas contained up to 60% hydrogen. Now that town gas has essentially been displaced by natural gas, the gas industry is no longer involved with hydrogen, except as a supplier of natural gas to be reformed. Deregulation also contributed to this evolution with the disappearance of British Gas, one of the main licensors of syngas technologies and catalysts at one time. One exception is in Japan, where the gas companies have maintained activities and interest in the production of syngas and H2. It is largely due to the fact that, in Japan, gas companies are also involved in the production of chemicals from natural gas, which requires the production of syngas as a preliminary step.
88

It can be concluded that, presently, the natural gas industry has essentially no role in the hydrogen industry, except in Japan.
2 THE FUTURE OF HYDROGEN IN THE ENERGY BUSINESS In the long term, hydrogen can play a unique role in comprehensive energy policies of developed and developing nations by increasing system efficiency and clean energy options, reducing energy supply disruptions, increasing domestic energy choices, creating new market opportunities and enhancing economic competitiveness of domestic industry.
Like electricity, hydrogen can be produced from all primary energy sources, especially fossil fuels, renewable resources and nuclear energy. Hydrogen could be an effective energy storage medium, particularly for distributed generation. With improved energy conversion technologies such as fuel cells and CO2 sequestration, hydrogen could permit fossil resources to continue to be used efficiently and with no noxious emissions.
Now, the hydrogen energy topic begins to receive new significant capital investments for transportation and power generation applications. As an energy carrier and storage medium, it is relevant to all energy sectors - transportation, buildings, utilities, and industry-. Hydrogen is a storage option for intermittent renewable technologies such as solar and wind. It can transform base-load technologies such as nuclear, geothermal, biomass, and hydro into load-following systems.
Clean vehicle requirements in California, especially in the Los Angeles basin, are propelling the development of zero-emission vehicles, which provide incentives for the growth of fuel cell buses, trucks and cars. Several bus companies are currently incorporating hydrogen and fuel cell technologies into their fleets. Major car manufacturers are developing fuel cell vehicles in response to market demands stimulated by growing concerns about greenhouse gas and other noxious emissions.
As with transportation, the demand for distributed generation that provides reliable, high-quality power with high efficiency is spurring the development of fuel cells that will provide electricity both to the grid and to on-site consumers. These distributed power systems can achieve even higher efficiencies when the waste heat is used for space heating or hot water production (CHP).
In a world that is now more attuned to climate change and national security issues, it is expected that hydrogen will fulfill substantial increased demand for energy in both the transportation and stationary applications.
Hydrogen is now part of the national energy strategy for an increasing number of countries (see §2.5, Early Actions in Hydrogen Energy).
2.1.1 THE GLOBAL SCENE 2.1.2 Key energy problems and drivers for change The world faces major energy and environmental challenges. Reference case forecasts published in the U.S. Department of Energy, Energy Information Agency (DOE/EIA), International Energy Outlook 2002, indicate that world energy consumption in 2020 will exceed 1970 levels by a factor of three. The demand for energy at these elevated levels indicates global society’s desire for increased economic well-being and he Kyoto Climate Change Protocol Agreement illustrates that there is also a world demand for improved environmental well-being. While it is difficult to estimate the price thresholds at which energy and environmental demands can be appropriately met, the challenge is quite clear: the world community needs reliable and affordable supplies of energy that minimize the risk of global climate change and energy supply threats.
On a global scale, petroleum supplies will be in increasing demand as highly populated developing countries expand their economies and become more energy intensive. For example, if just one half of Chinese households owned automobiles, this would be equivalent to about four times the number of car-owning households in the United States today. Hydrogen-powered fuel cell vehicles would not be dependent on foreign oil, as hydrogen could be produced from various domestic sources.
In the medium term, energy end-use patterns will include electricity and higher-quality fuels, such as natural gas and hydrogen from fossil fuels, along with energy supply structures specific of
89

renewable energy sources. Capital requirements will be large, and the energy sector will have to raise an increasing portion of capital from the private sector, thereby facing stricter return-on-investment criteria. Regional differences will persist in global energy systems due to differences in resource availability, trade, and development strategies. Local environmental impacts, particularly the natural capacity of the environment to absorb higher levels of pollution in densely populated urban areas, will continue to take precedence over global change, at least in the nearer term.
Capital turnover rates in end-use applications are short compared to those for energy supply infrastructures, and “betting on the wrong horse” in energy supply will have severe consequences. Although rates of change in the energy sector are slow, technological investments during the next few decades will shape technology options available after 2020.
These trends must be viewed in light of uncertainties that will affect how, where, when, and to what extent they may influence the energy sector. Key uncertainties that surround future energy projections include:
economic output and population growth, especially in developing countries and in countries with economies in transition from state controlled economies to market economies;
technical change and capital stock turnover, which depends on the nature and pace of technical change and the rate and extent of adoption of new technologies;
human attitudes and behavior, particularly as incomes rise;
fossil fuel supplies and extraction costs, including the magnitude of economically recoverable petroleum and natural gas reserves and rapidly improving technologies for exploration, production, and processing fossil fuels;
energy market developments, especially restructuring of electricity and gas markets in many countries;
energy subsidies, particularly in developing countries
the rate and extent of privatization of state-owned energy industries
changing environmental objectives and policies concerning emissions and hazardous wastes and, especially, greenhouse gases and the Kyoto agreement.
2.1.2 Energy Scenarios Energy scenarios are necessary tools that permit international bodies and governments, among others, to shape their policies to reach certain development objectives such as sustainable development or energy self-sufficiency. The “World Energy Assessment: Energy and the Challenge of Sustainability”5 recently published jointly by UNDP/UNDESA/WEC (United Nations Development Programme, United Nations Department of Economic and Social Affairs, World Energy Council) offers a review of various energy scenarios, including those built by IPCC (Intergovernmental Panel on Climate change) and by the International Energy Agency in its World Energy Outlook. It also presents its own six scenarios corresponding to three cases of global development based on a joint study by IIASA (The International Institute for Applied Systems Analysis) and WEC, entitled “Global Energy Perspectives”. That study integrates near term strategies through 2020, with long term opportunities till 2100 for 11 world regions.
These scenarios hardly mention the potential occurrence and impact of the “Hydrogen Economy”. This does not come from sheer ignorance of the benefits of the hydrogen economy but comes from the fair assumption that the hydrogen economy is unlikely to sweep the world before 2050, i.e. when a hydrogen infrastructure is in place. It does not imply, however, that business opportunities will not appear before. They will appear all along the decades that will be necessary to build the hydrogen infrastructure.
2.1.3 Solutions brought by Hydrogen Today about 90% of the world’s primary energy use originate from fossil fuels with the remainder from nuclear power and renewable energies, mainly hydroelectric. Burning fossil fuels means emitting undesirable gases in the local environment (NOx, CO, UHC -unburned hydrocarbons- particles) and in the global environment (CO2).
2.1.3.1 Reduction of “local” pollutants
90

Use of hydrogen as a fuel will sharply reduce local atmospheric pollution (NOx, CO, UHC, particles). Only nitrogen oxides (NOx) have to be controlled during combustion, which is easy to achieve with adapted burners. Fuel cells running on pure hydrogen emit no pollutants.
2.1.3.2 Reduction of CO2 emissions
The potential of hydrogen to reduce the impact of energy use on global climate change has been extensively described and will not be discussed further here. One may refer, for example, to the recent comprehensive life cycle analyses performed by a consortium of companies led by General Motors6. Only hydrogen cycles with no net CO2 emission from cradle to grave, will ultimately help reduce the greenhouse gas emissions, but the development of less perfect hydrogen based systems will help establish and demonstrate technologies.
Vehicles are an obvious opportunity, with zero emission fuel cycle fuels as the goal. Other opportunities include remote and portable power, and fuel cells for residential and stationary power generation. In the near term, cost and size reductions are required in many hydrogen technologies such as fuel cells and this will continue for many years. The changeover from the internal combustion engine to the fuel cell/electrical engine will be gradual and will take several decades. A suitable hydrogen infrastructure is needed to enable fuel cell vehicles to be a viable commercial option. To this end, work is underway to evaluate and demonstrate various hydrogen fueling routes.
The use of hydrogen as an energy carrier will enable the large scale introduction of renewable sustainable energy sources – hydro, solar, wind, geothermal – both for stationary energy production and for transport systems.
In the long transition period before renewables become widely available, hydrogen will be obtained from other sources, such as fossil fuels. Hydrogen production from fossil fuels, particularly from natural gas with CO2 sequestration, may prove attractive as it should permit fossil fuels to continue to be used while limiting their environmental impact. In turn, the wide availability of fossil fuels and of hydrogen production technologies based on fossil fuels, should permit hydrogen to be produced at acceptable prices during the transition period that will precede the renewable era.
2.1.3.3. Energy self-sufficiency and security
The critical contributions that hydrogen can make in achieving energy security goals are:
Reducing energy supply disruptions by increasing the options for energy resources on a regional and national basis
Increasing domestic energy choices by using local resources to meet local energy needs
Increasing system efficiency and clean energy options to meet regional power supply and air quality requirements
Creating new market opportunities and enhancing economic competitiveness of domestic industry in growing global energy technology markets.
Support of near and long-term RD&D for hydrogen energy technologies is important to achieving true energy security. Worldwide, public and private investments in hydrogen technologies have grown substantially in recent years but it is in 2002 that the most significant commitment was announced by the US and especially Europe, with funding increased. from 120 million € to 2.1 billion for the next three year framework R&D program (see below).
2.1.3.4. Other advantages
Unlike petroleum fuels, accidental spills or leaks of hydrogen will not pollute water or damage ecosystems because hydrogen disperses rapidly in the atmosphere and is not toxic. 2.2 THE REGIONAL SCENES 2.2.1. Europe 2.2.1.1 The European Energy Outlook
Europe must be considered both as a coherent ensemble and as a collection of individual countries with their own degree of freedom in energy policies. In addition, a few countries have a federal status that grants a significant degree of autonomy to regional authorities. This is particularly
91

true for Germany where the particular involvement of Bavaria, for example, in hydrogen technologies is well known. Drawing a comprehensive picture of the hydrogen drivers and activities in Europe is therefore a difficult task. However, the harmonisation of European activities is under way, induced by various regulations applicable to all member countries and EU supported R&D programs. In addition, the liberalized market allows, and often forces, corporations to operate in a wider framework. The largest ones already have worldwide activities (figure 2.2.1.1.a)
Figure 2.2.1.1: the major European energy companies, turnover in billion € (Les Echos,
25/11/2002)
In some areas of the market this is less relevant: in the renewable energy sector the resources are specific to a geographical location and so the market is partially constrained.
In 2002, the European Union has ratified the Kyoto Protocol, which legally binds its 15 member countries to greenhouse gas reduction commitments, averaging an 8% cut across the Union. Over the 1999-1990 period, the Union’s emissions of carbon dioxide decreased by 0.9%7. The recession in a few European countries and the replacement of coal by natural gas in the UK account for that result. Over the same period, the US emissions rose by 15%.
2.2.1.2 The Potential Role of Hydrogen in Europe
In the fall 2002, Romano Prodi, the President of the European Commission, announced a massive increase in hydrogen research and development. Prodi said that the scientific program will be as important for Europe as the space program was for the U.S. in the 1960s and that hydrogen power would relieve Europe from a potentially dangerous and growing reliance on imported oil and gas, and address the concerns of the green lobbies. Government financial support and legislation could push the technology toward practical use, thrusting Europe into the global lead in hydrogen and triggering a wave of scientific achievements.
92

The EU intends to promote hydrogen power through:
Massive increase in research and development spending, to over 2 billion € in 2003-2006 on renewable energy development, mostly technologies related to hydrogen from roughly 125 million € in the past three years
•
•
•
•
Advice from private corporations on shaping a hydrogen power-related policy
A Possible new body to oversee renewable energies
Tax breaks and regulations to promote investments
R. Prodi compared the importance of his hydrogen initiative with the introduction of the euro and EU enlargement.
Prior to this announcement, natural gas and hydrogen associated with renewables were mentioned by the European Commission as routes towards a sustainable development8 but no mandates concerning hydrogen as a fuel or energy carrier were considered, as hydrogen was viewed as a mean to achieve objectives and not an objective itself. Market forces would drive what uptake there is. Interaction between energy, environment and transport legislation would ensure that some penetration would be achieved.
Each member country had the same approach, except possibly Germany, where the Transport Energy Strategy may force the development of a hydrogen transport fuel policy. At this point, one may mention Iceland, a member of the European Economic Area, closely linked to the European Union, which has a specific hydrogen energy policy, driven largely by its will to achieve energy self sufficiency and cease its oil imports by 2030.
That new will of the European Union to get into the hydrogen energy era is one of the reasons why the European gas industry could consider getting involved more strongly with hydrogen.
Another reason for a stronger involvement is that many companies which are potential competitors of the gas industry in Europe, have started working with hydrogen in various projects. They are doing this without seeing any commercial benefit in the short term but with the belief that the business opportunities will exist in the long term. If the gas industry gets involved too late, the most profitable share of the future business may already belong to others who will be competitors to the existing natural gas industry. However, it is not too late to get involved, as experience has shown that major modifications in the energy business have occured more slowly than envisioned at first.
In Europe, industry relies for advice on many not-for-profit organizations and consulting firms working in the hydrogen energy area, most of them supported by energy companies and car manufacturers. They are expected to have a long-term view of energy problems. Among those, the European Natural Gas Vehicles Association (ENGVA) is of particular importance to the gas industry. On the occasion of its 2001 annual meeting, the Association decided to add hydrogen as a vehicle fuel to its traditional scope of interest and activities. This decision is a recognition that hydrogen is likely to play a major role in road transportation in Europe and could be a great opportunity for gas companies with experience with natural gas vehicles. Mixing hydrogen with natural gas in traditional thermal engines could be a bridge to the fuel cell era during a long transition period (§ 3.2.2.1).
2.2.1.3 Estimate of the Hydrogen Demand and Supply in Europe till 2020
Hydrogen energy use in Europe is expected to be almost exclusive to two sectors9. The first is the transport sector, where drivers for zero emissions vehicles are strong and CO2 reductions may not be possible if conventional fuels are used, even with more efficient engines. Since carbon sequestration from vehicles is unlikely, fuel switching to a lower – or zero – carbon fuel is necessary. The second possible sector is the renewable energy sector, where some hydrogen storage is expected to be beneficial to the utilization of intermittent renewable electricity production such as that from wind, and may provide an additional revenue stream for biomass-based fuels. Hydrogen for power generation, produced from fossil fuels in large reformers with CO2 sequestration capabilities, will become a significant route, only if mandates for extremely low CO2 emissions appear, which will be in the very long term.
93

The European Sixth Action Plan for Environment, issued January 2001, discusses the environmental impact of transportation. The document emphasizes the need for a transition from power generation through carbon and hydrocarbons to other sources with lower emissions of CO and the need for the decarbonization of fossil fuels. It also proposes that nuclear power plants, at the end of their life, be replaced by other technologies with low or null emissions of CO2.
2
All these intentions imply an effort to develop technologies for energy production with renewable sources and hydrogen production from fossil fuels with carbon sequestration.
In October 2001, the European Commission issued a proposal10 for the introduction of a share of 20% of alternative fuels for road transportation by 2020. The aim for this proposal is to provide environmental benefits by using cleaner fuels and to diversify the energy supply to Europe. The document makes a brief analysis of several alternatives and concludes that only biofuels, natural gas and hydrogen are potential realistic solutions.
According to this document, the share of hydrogen would be 2% by 2015 and 5% by 2020 (If all this hydrogen were provided by on site natural gas reformers of 1000 Nm3/h, that share would translate into 3500 hydrogen generators in 2015 and 10,000 in 2020 -calculation basis: consumption and forecast figures from the above reference with 1 toe = 3876 Nm3 d’H2-).
This projection may be compared to the number of on site steam reformers estimated for European countries on the basis of their own oil consumption only, which is a crude approximation, in a study performed for the Japanese hydrogen program WE-NET in 1999 (table 2.1.2.2).
No of units 2010 2020 2030 2010 2020 2030 2010 2020 2030
Steam reformers
0.3tpd units 817 53,588 66,776 1,082 67,196 80,264 1,585 100,927 125,445
3tpd units 92 5,839 7,193 70 4,520 5,743 52 3,551 4,762
Electrolysers
0.3tpd units 23 1,489 1,855 31 1,867 2,230 45 2,804 3,485
3tpd units 3 163 200 2 126 160 2 99 133
UK Italy Germany
No of units 2010 2020 2030 2010 2020 2030 2010 2020 2030
Steam reformers
0.3tpd units 1,003 65,081 82,200 25 1,682 2,233 0 0 0
3tpd units 127 7,824 9,633 7 390 478 0 0 0
Electrolysers
0.3tpd units 28 1,808 2,284 3 187 249 2 86 106
3tpd units 4 218 268 1 44 54 1 9 11
France Norway Iceland
No of units 2010 2020 2030 2010 2020 2030 2010 2020 2030
Steam reformers
0.3tpd units 608 39,321 49,606 40 2,691 3,573 124 7,970 10,0093tpd units 79 4,794 5,878 11 624 765 9 553 719
Electrolysers0.3tpd units 17 1,093 1,378 2 75 100 4 222 2793tpd units 3 134 164 1 18 22 1 16 20
Spain Greece Switzerland
Table 2.1.2.2: estimate of the number of on-site hydrogen production facilities in a few European countries (0,3 tpd = ~140 Nm3/h) i.e. for the EU + Norway: 5160 0.3 tpd units + 438 3 tpd units = ~11 GNm3 in 2010
Nevertheless, the WE-NET estimate of 11 GNm3 of hydrogen consumed in 2010 appears to be in line with the EU’s projection of 93 GNm3 in 2015, as the amount should pick up after 2010 and as not all the hydrogen will be produced by on site steam reforming of natural gas.
94

In conclusion, although that, on a percentage basis, there will be only a limited uptake of hydrogen in the next 20 years as a replacement of conventional energy sources in Europe, the absolute numbers are not negligible and business opportunities will appear (§3).
2.2.2 Japan 2.2.2.1 The Japanese Energy Outlook
In Japan, the number one driver for a Hydrogen Economy is the reduction of the emissions of greenhouse gases (GHG). However, though Japan has a well-known hydrogen development program - WE-NET, World Energy Network- supported by the government, this program is independent of the specific objectives of the Japanese government in terms of energy policies. For example, the government has set objectives to reduce Japan’s greenhouse gas emissions but hydrogen is not mentioned among the possible solutions to achieve the objectives. Hydrogen is obviously one of the possible solutions but the estimate of the hydrogen demand created is left to other bodies, such as the Fuel Cell Advisory Panel and WE-NET.
WE-NET operates under the wider mantle of the New Sunshine Project. The funds allocated to the New Sunshine Program over its 28-year span amount to about $11 billion dollars, some $2 billion of which are intended for use in the WE-NET Project, administered by the New Energy and Industrial Technology Development Organisation (NEDO). WE-NET will advance through three stages. The first stage, which ended in 1999, was devoted to research, mainly analyzing the possibilities for production, storage and usage of hydrogen. The second stage, -1999-2005-, will address the construction of facilities in Japan to demonstrate technologies, which produce, store or use hydrogen. Stage 3 will run from 2006-2020, when the technologies should actually be put to use.
Reducing local pollution and securing the energy supply were not the primary drivers for the Hydrogen Economy in Japan as it is considered that these objectives can be met by other means. These two issues are not considered to create a hydrogen demand significant compared to the one created by the GHG reduction plan and will be only briefly discussed here
Local pollution issues: hybrid cars could do the job in a transition period, till the problem of storing hydrogen on passenger cars is solved.
•
• Securing the energy supply: hydrogen can contribute to securing the energy supply if it is produced from locally available primary energies. Renewables (biomass, wind power,) could be a good candidate when a lot of land is available for a rather small population. This is not the case for Japan. On the other hand, Japan could be in a good position to resurrect the idea of using nuclear energy to produce hydrogen (§2.4.6).
2.2.2.2 The GHG reduction strategy of the Japanese government
The Japanese Government has a strategy to reduce the country’s GHG emissions to achieve a 6% reduction in 2010 compared to the 1990 level (table 2.2.2.1).
CO2 emissions of the energy producers and utilization sectors 0.0%
Emissions of CH4, N2O etc. - 0.5%
Development of innovative technologies, energy conservation in households etc
- 2.0%
Absorption by forest (with plantation of trees) - 3.9%
Emissions of freons, despite use of alternative gases + 2.0%
Dual fuel systems, Emission trade etc. - 1.6
TOTAL REDUCTION OF GHG EMISSIONS
- 6.0%
Table.2.2.2.1: % CO2 emissions change in 2010 vs 1990 emission levels
95

As can be seen in the above table, CO2 emissions in 2010 in the industrial sector are targeted to remain at their 1990 level, in a context of economic growth and in contrast to the business-as-usual (BAU) case shown in Figure 2.2.2.1. The projection in 2010 and 2020 in two different energy scenarios are also shown.
287.2
307.0
292.2
250
275
300
325
1990 2000 2010 2020 2030Year
CO
2 E
mis
sion (
Mill
iont-
C/ye
ar)
Emission in 1990:287.2 Million t-C
Reduction Target Case A
Report by The Advisory Committee for The Agencyof Natural Resources and Energy (June in 2001) ・Target Case A : Energy Saving, New Energy Fuel Diversion ・Target Case B : Current Power Source Coomposition 5 Million t-C over the 1990 Level
BAU Case
Reduction Target Case B
Figure 2.2.2.1: CO2 Emission in the Energy Industry Sector in 1990 – 2020
The Japanese government plans to meet its 20 million ton carbon reduction target by taking the following measures:
Energy conservation •
•
•
Introduction of new energies such as photovoltaics, wind, geothermal, power generation from wastes
Diversification of power generation fuels (5 million ton carbon reduction expected).
Hydrogen is slated to play a role in achieving the targeted reduction of carbon reduction, as discussed below.
2.2.2.3 The potential role of hydrogen in Japan
In Japan, the yearly consumption of hydrogen amounts to ca. 162 MNm3. The hydrogen is mainly produced from natural gas by Steam Methane Reforming (SMR).
The development of small scale hydrogen production facilities accelerated after 1980, because many hydrogen users, in their quest to outsource their hydrogen supply, preferred on-site hydrogen production systems for a more secure supply and, sometimes, lower costs. On-site hydrogen production systems first converted methanol, then natural gas, which benefited from the development of SMR for fuel cells since 1976. The hydrogen filling station in Osaka, for the WE-NET project, features such a plant.
96

Now gas companies, among others in Japan, are developing PEFCs for residential use, with scaled down SMR technology. The gas companies think that natural gas will become one of the primary raw materials for hydrogen production and that the demand will increase for both on-site, small scale, stand alone hydrogen generators and integrated compact fuel processors for stationary fuel cells.
This section gives an estimate of the impact of the introduction of hydrogen on CO2 emissions.
Figures expressed in 104
Scenario A: considering that vehicles with on boardreforming (OBR) exist
C-t/year
Scenario B: only pure H2 vehicles; no OBR
2006 2010 2015 2020 2030 2020 2030
Small trucks 0.0 0.1 0.9 24.1 48.2 24.2 48.4
Standard trucks 0.0 0.0 0.0 19.2 38.4 19.2 38.4
Garbage trucks 0.0 0.2 1.2 3.2 6.4 3.2 6.4
Buses 0.4 2.4 6.8 13.5 27.0 13.5 27.0
Pure hydrogenvehicles
0.2 1.7 15.0 112.3 224.6 200.5 401.0
OBR vehicles 0.0 0.0 5.1 82.9 165.8 0.0 0.0
Total 0.6 4.5 29.0 255.1 510.4 260.7 521.2
Table 2.2.2.2.b: Amount of CO2 reduction by type of vehicle, expressed in 104 C-t/year
Stationary Fuel cells create also a hydrogen demand and a CO2 emission reduction (table below).
2010 2020 2030
Market Size 106 kW 1.2 5.7 5.7
Hydrogen demand
108 million Nm3/year 35.4 143.8 124.1 Residential
Amount of CO2reduction
104 t-C/year 26.1 136.8 147.4
Market Size 106 kW 0.9 4.4 4.4
Hydrogen demand 108 Nm3/year 26.5 111.0 95.8 Commercial
Amount of CO2reduction
104 t-C/year 19.5 105.6 113.8
Hydrogen demand 108 Nm3/year 61.9 254.8 219.9
Total Amount of CO2reduction
104 t-C/year 45.6 242.4 261.2
Electricity generated kWh/year 4179 4115 4018
CO2 reduction t-C/year 0.2171 0.24 0.2586
Table 2.2.2.2.c: Stationary FC hydrogen demand and amount of CO2 reduction*
97

The impact on CO2 reduction of cogeneration with hydrogen-fueled engines, power generation with hydrogen combustion turbines and portable power source using hydrogen as a power supply was evaluated on the assumption that the hydrogen was derived from renewable energies.
Figure 2.2.2.2 summarizes the impact of switching to hydrogen energy technologies on CO2 reduction. The total amount of CO2 reduction in 2010 will be 6.7×10⁵ tons-carbon, which corresponds to 13% of the 5 million tons-carbon needed to reach the Government’s target (case A in Figure 2.2.2.2).
While the switch to hydrogen technologies does not have a great impact on CO2 reduction initially (until 2010), it will drastically affect it in 2020 and 2030 by multiplying its initial impact by approximately 10 and 15 times, respectively.
0
250
500
750
1000
Am
ount
of
CO
2 r
edu
cti
on
(10 t
housa
nd
t-c/y)
FCV 4.4 255.2 510.4
Stationary FC 61.9 254.8 219.9
Hydrogen Diesel 0.0 6.1 67.2
Hydrogen Combustion Turbine 0.0 0.0 61.1
Portable Power Source 0.7 1.8 3.0
2010 2020 2030
67.0
517.9
861.6
Figure 2.2.2.2: amount of CO2 reduction induced by the introduction of fuel cells and hydrogen
as an energy carrier in Japan
Scenarios for the introduction of fuel cell vehicles
Fuel cell vehicles (FCVs) should be one of the most effective methods of introducing hydrogen as a fuel. The scenarios currently planned in the WE-NET project are described in this section. The roadmap for FCVs and fuel supply infrastructure until 2020 is conceived with two types of FCVs: hydrogen fueled vehicles and vehicles with on board reforming (OBR).
The two scenarios were evaluated by taking into account the following factors:
The number of FCVs •
•
•
•
•
•
•
The number of hydrogen filling stations
The effect of CO2 reduction
The cost of FCV’s introduction
The cost of hydrogen filling stations
The benefit for FCVs owners
The benefits for companies involved with hydrogen filling stations.
98

Several assumptions were made to construct the scenarios:
According to the Japanese Advisory Panel on FCV commercialization, there should be 50,000 FCVs in 2010 and 5 million in 2020.
•
•
•
•
•
•
•
•
There will be, at least initially, only a small number of passenger cars with OBR as OBR in passenger cars is a very difficult technical and economic challenge
The hydrogen off-site supply stations have capacities of 100, 300 and 500 Nm3/h. The capacity of on site filling stations is 500 Nm3/h.
The number of hydrogen filling stations will be proportional to the number of FCVs.
The FCVs and filling stations investment costs benefit from construction in large numbers.
Two scenarios are considered. In Scenario A, pure hydrogen vehicles and OBR co-exist and the absence of a hydrogen fuel infrastructure is a limiting step. In scenario B, only pure hydrogen vehicles exist, with an adequate hydrogen distribution infrastructure. Additional assumptions for scenario A are:
At the early stage of introduction of FCVs with on board hydrogen, the hydrogen supply will satisfy the demand because the number of FCVs will be small while vehicles with OBR are not yet commercial.
At a latter stage, the FCV market introduction rate might be much higher than the hydrogen filling station installation rate. In such case, vehicles with on board reforming will be introduced to the market but in limited areas.
Finally, the cost of hydrogen filling stations will decrease, which will favor the FCVs with on board stored hydrogen rather than with OBR. OBR vehicles will tend to disappear.
Therefore, in 2020 in Japan, there should be 2,300 hydrogen filling stations according to scenario A and 3,300 according to scenario B, respectively.
Table 2.2.2.2.d shows the estimated cumulative number of off site hydrogen supply stations and on-site hydrogen filling stations. Because off-site hydrogen supply stations have a lower cost, they will be installed at the early stage of hydrogen introduction. On-site hydrogen filling stations will be installed later and their number will gradually increase.
Capacity Type 2006 2010
2015 2020
100 Nm3/h Off-site 56 56 56 56
300 Nm3/h Off-site 0 100 290 463
500 Nm3/h Off-site 0 13 119 1,201
500 Nm3/h On-site 0* 0 68 624
Total 56 169 533 2,344
Table 2.2.2.2.d: cumulated number of hydrogen filling station
* by-product H2 is available in sufficient quantity
The total investment on FCVs and hydrogen filling stations until 2020 will be of 950 billion Yen (US $8.0 billion) and 1000 billion Yen ($8.5 billion) in scenario A and B respectively. The hydrogen demand in 2020 will be ca 4.3 GNm3/year in scenario A and ca 6.3 GNm3/year in scenario B. The amount of CO2 reduction is nearly same for both scenarios but scenario B would allow for further reduction through CO2 sequestration.
The price of the hydrogen vehicle fuel must be such that there is an economic benefit for the
99

consumer. The pump price should be lower than 66 yen/Nm3 (55 c€/Nm3). If the FCV production is encouraged and low price FCVs become available, the hydrogen price can be 98 yen/Nm3 ($2.4/liter of gasoline). In any case, it is mandatory that governmental subsidies be available for the companies, which will install hydrogen filling stations.
In order for either scenario to take place, a number of tasks remain to be accomplished to ensure a smooth FCV introduction:
Development of on-board hydrogen storage technology •
•
•
•
•
•
•
Development of on-board reforming technology
Improvement of FCV efficiency
Improvement of legal and technical standards for hydrogen production equipments and hydrogen filling stations
Higher investments on FCV production by car companies
Precise and lower costs of hydrogen filling stations.
Better specifications for FCV vehicle types.
The role of the government
Besides granting incentives for hydrogen fuel and vehicles, the role of the government is crucial, as it must modify the regulations in order first to allow and then encourage the introduction of hydrogen as a vehicle fuel. Current hydrogen regulations exclude hydrogen fueling stations from non-industrial areas and ban fuel cell vehicles from driving through some tunnels. Other regulations are derived from i) High Pressure Safety Laws that edict the minimum distance between the hydrogen filling station and the surroundings and ii) Building Standard Laws that specify the maximum storage of high pressure hydrogen. In practice, it is therefore forbidden to construct hydrogen storage tanks next to fueling stations.
The role of industry
The companies involved with hydrogen are very diverse. They include gas and electric utilities, industrial gas companies, electric components suppliers, car manufacturers, housing industries, oil companies, etc.
The hydrogen economy will be created and rendered viable only by the cumulated efforts of all the industries mentioned above.
In these conditions, with the mandatory participation of both the government and private sector, it is expected that a completely new type of industry will evolve. At this point and in the midst of deregulation, it is difficult to predict its future structure.
2.2.2.5 Estimate of the hydrogen demand and supply till 2030 in Japan
Demand
The hydrogen energy demand was estimated on the basis of the Advisory Panel’s fuel cell introduction targets and of WE-NET’s prospect of introduction of hydrogen-fueled vehicles, engine cogeneration, hydrogen-fueled turbine power generation and portable power source for personal computers (table 2.2.2.3.a and Figure 2.2.2.3.a)
100

2010 2020 2030 Type of Demand
TWh/yr TWh/yr TWh/yr
Hydrogen FCVs 0,48 2,4% 12,73 14,1% 22,46 20,5%
Stationary hydrogen FCs 18,54 97,0% 76,31 84,4% 65,86 60%
Hydrogen engines 0 0% 1,05 1,2% 11,38 10,4%
Hydrogen fueled combustion turbines 0 0% 0% 0% 9,58 8,7%
Portable Power Sources 0,12 0,6% 0,33 0,4% 0,51 0,5%
Total hydrogen demand 19,14 100% 90,42 100% 109,79 100%
% hydrogen in theJapanese energy pool
0,4% 2,1% 2,6%
Table 2.2.2.3.a: Estimate of hydrogen demand in 2010-2030
The assumptions and sources utilized to obtain the values in table 2.2.2.3.a are:
The amounts of H2 for FCVs and stationary FCs in 2010-2020 were calculated from the Advisory Panel’s targets.
•
•
•
•
•
The number of stationary FCs is supposed to reach a saturation level by 2020.
Cogeneration with hydrogen engines was assumed to appear in 2020 to produce 0.1 TWh per year till 2030.
H2-fueled turbine power generation was assumed to begin to produce 1MWh in 2030.
The number of personal computers powered by hydrogen FCs in 2030 was evaluated at half the present number (40 million in 2000).
19,14
90,42
109,79
0.00
20.00
40.00
60.00
80.00
100.00
120.00
2010 2020 2030Year
TWh/year
Stationary HydrogenFCPortable PowerSourceHydrogenCombustion TurbineHydrogen EngineGenerationHydrogen FCV
Fig 2.2.2.3.a: Estimated Hydrogen Demand in 2010-2030
101

The consumption of petroleum in Japan was 286 Mt in 1990 and 330 Mt in 1999 for a global energy consumption of 515 Mtoe. The Government anticipates that in case B, fig 2.2.2.1, in 2010, the oil consumption will reach 328 Mt and will remain at this level for the subsequent 10 years. In these conditions of stabilized oil consumption, hydrogen will account for about 1% of the total energy consumption of Japan in 2010, 3% in 2020 and 4% in 2030.
A fuel cell project team was created in 2002 whose members are the vice ministers of the ministries of i) Economy, Trade and Industry, ii) Land, Infrastructure and Transport, iii) Environment. The team will help the Japanese government to work in close collaboration with industry, in order to make sure that the commitment of Japan to reduce its CO2 emissions under COP7 -Seventh Conference of the Parties to the UN Framework Convention on Climate Change- Marrakesh, Morocco, 29 October to 9 November 2001- is respected.
Supply
By-product hydrogen is available in Japan and is easy to produce from natural gas. As long as natural gas can be imported to Japan, the hydrogen supply potential will remain sufficient. However, CO2 is emitted by the reforming process, unless it is accompanied by sequestration, which is very expensive. It is therefore worthwhile to estimate the supply potential of by-product hydrogen and of hydrogen obtained from renewable energies.
By product hydrogen
Hydrogen is a by-product of several processes such as coke making (COG), chlor-alkali electrolysis and oil refining. Table 2.2.2.3.b indicates that the supply potential of by-product hydrogen is 9.3 GNm3/year.
H2 Production
(GNm3/y)
Fraction available
(GNm3/y)
Remarks
Coke Oven Gas 8.87 5.32 Fraction available: 60%*1
Soda Electrolysis
1.36 1.24 Calculation based on caustic soda production*2
Oil Refineries 13.60 2.71 H2 production based on facility surplus
Total 23.83 9.27
Table 2.2.2.3.b: production and availability of by-product hydrogen in Japan
*1: 10 to 20 % of the hydrogen potential can be easily used without influencing the energy balance in a factory.
*2: not all this hydrogen may be available. Some of it is sold to merchant gas companies.
It is expected that by 2010, available by-product hydrogen will amount to 7.3 GNm3/year. That amount should be sufficient to fuel the first FCVs on the market. In fact, only 0.16 GNm3/year will be needed to supply the 50,000 FCVs projected for 2010. Therefore, there should be enough by-product hydrogen to fill the needs and no reason to construct new hydrogen production facilities.
In 2020, the amount of hydrogen needed for the expected 5 million FCVs should be between 4.3 to 6.3 GNm3/y. The supply potential of by-product hydrogen is still sufficient to meet this demand.
A COG and/or soda electrolysis by-product hydrogen system can be regarded as one of the most plausible near-term scenario in Japan as well as on-site natural gas reforming and on-board gasoline reforming systems. WE-NET has just completed the design of a COG-based model system with a production capacity of 1 ton of hydrogen/day. A demonstration of this fuel chain is currently taking place.
102

Hydrogen from renewable energies
Table 2.2.2.3.c indicates that the maximum hydrogen supply potential based on renewable energies in Japan is 210 billion Nm3/y. However, almost all of renewable energies will be used in the form of electricity and only a small part may be utilized via hydrogen.
Source Yearly H2Potential, GNm3
Energy Potential
Process andprojected efficiency
Remarks
Hydraulic 11.68 46 TWh Electrolysis 90% undeveloped
Wind 8.66 34 TWh Electrolysis 90% undeveloped
Photovoltaics 60.36 237,39 GWh Electrolysis 90% undeveloped
Geothermal 121.26 478 TWh Electrolysis 90% undeveloped
Biomass 8.92 Gasification of forestwastes*
*excluding black liquor
Japan
Total 210.87
Hydropower 487.6 2, 6 PWh Electrolysis 90% newly developed
Photovoltaics 33111.1 145 PWh Electrolysis 90% undeveloped
Wind 4562.7 20,0 PWh Electrolysis 90% undeveloped
Pacific
Total 38161.4
Table 2.2.2.3.c: Supply Potential of hydrogen from renewable energies in Japan and the Pan-Pacific region
In order to have access to renewable hydrogen, Japan will have to import most of it. The Pan-Pacific countries, including China, will be the most probable partners for constructing an international renewable hydrogen system.
Hydrogen for stationary FCs was assumed to come from fossil fuels in the time frame considered in this study (2010-2030).
Comparison of hydrogen sources
The scale of hydrogen production, the availability of primary energies, the investment and operating costs, the environmental burden and the potential technical hurdles are to be taken into consideration for the introduction of hydrogen as an energy carrier. Different sources of hydrogen have been evaluated to determine the best candidates for the near and the mid term (table 2.2.2.3.d).
103

Factors to consider Hydrogen
sources/technologies Potential capacity
Local availability Cost Environmental
burden Technical
status Conclusion
On site Natural Gas Reforming High Yes Low C02 emission To be
improved +++
Water electrolysis with off-peak power medium Yes High Weak Mature ++
Methanol reforming Low Yes Low C02 emission Mature +
By-product hydrogen High No, in most cases Very low None Mature +++
Domestic biomass Low No
(in rural area only)
High Weak To be greatly
improved +
Table 2.2.2.3.d: Hydrogen sources in the near and mid term
It can be concluded that, for Japan, hydrogen from natural gas and by-product hydrogen are the most attractive possibilities.
2.2.3 North America 2.2.3.1. The North American Energy Outlook
Over the next 20 years, energy consumption in North America is projected to rise by 30 percent while domestic energy production is expected to grow by only 25 percent. Imports of petroleum already supply more than 60 percent of US domestic needs and are projected to rise to over 70 percent by 2020. This growing energy consumption and growing dependence on foreign sources of supply threatens national security. Reliance on volatile foreign oil imports may also jeopardize the economy and standard of living.
The need to expand the supply of domestically produced energy is great. The American transportation sector relies almost exclusively on refined petroleum products. As shown in figure 2.2.3.1, close to one-half of the petroleum consumed for transportation in the United States is imported, and that percentage is expected to rise steadily for the foreseeable future, unless the energy consumption habits are modified.
104

Figure 2.2.3.1: US fuel transportation needs
2.2.3.2 The potential role of hydrogen in North America
In the next 20 years, concerns about global climate change and energy security will create the platform for the penetration of hydrogen into initial commercial markets. In February 2002, President Bush announced that the US was committed to cut its greenhouse gas intensity – amount of greenhouse gas per unit of economic activity -- by 18 percent over the next 10 years, that is the equivalent of taking 70 million cars off the road. This will set America on a path to slow the growth of its greenhouse gas emissions and to stop and then reverse it. Hydrogen as a fuel for fuel cells will be one of the means thought of.
Ultimately, hydrogen and electricity should come from sustainable renewable energy resources, but fossil fuels will be a significant transitional resource. The growth of fuel cell technology will provide a base for introducing the hydrogen option into both transportation and electricity supply markets.
In order to meet the growing electrical demand in the US, it is estimated that electricity generation will have to increase by 2% per year. At this rate, 1.5 PWh of additional electricity generation capacity will be needed by 2020. Along with aging infrastructure, requirements for reliable premium power, and market deregulation, this increasing demand opens the door for hydrogen power systems. These hydrogen power systems can also lead to significant reductions in greenhouse gas emissions and improved urban air quality. The use of hydrogen as a major energy carrier would provide North America with a more efficient, diversified, and resilient energy infrastructure.
2.2.3.3 Estimate of the hydrogen demand and supply in North America
United States
The development of hydrogen energy technologies offers the opportunity to minimize energy security risks, reduce greenhouse gas emissions and create many new business opportunities in North America and abroad, but there remain significant technical and infrastructure challenges. The deployment of hydrogen energy options will require extensive research, development, and validation efforts, but these developments alone are not sufficient to assure that hydrogen technologies can compete in the marketplace. Estimates indicate that it could take a few hundred billion dollars to build the infrastructure needed to deliver, store and effectively utilize hydrogen in utility, buildings and transportation applications. The technical and infrastructure requirements for enabling hydrogen energy systems, the long-term high-risk nature of this endeavor, and the potential benefits warrant US
105

Federal leadership and support.
The Bush administration earlier this year launched a fuel-cell research program, dubbed FreedomCAR, for which it is asking Congress for $150 million in funding next year. The effort replaces a Clinton-era program that focused on developing experimental hybrid diesel-and-electric cars in cooperation with the Big Three U.S. automakers.
In addition, the U.S. Senate is considering a proposal that would require utilities to supply as much as 10% of their power from renewable energy sources. The EU has already committed itself to seeing 22% of gross electricity consumption coming from renewable energy by 2010 and 12% of all energy coming from renewable sources by the same date.
But the renewable energy push is controversial in the U.S. At the recent United Nations environmental summit in Johannesburg, South Africa, the Bush administration led a successful push to kill an EU call for a global renewable-energy target, saying the issue should be left up to individual nations. In Washington, the administration opposes the pending 10% U.S. proposal, saying the issue should be left up to individual states.
Canada
A whole industry is committed to providing cleaner transportation and stationary power systems in Canada. Canada ratified the Kyoto protocol in 2002. With greenhouse gas reduction obligations, energy efficiency and urban air quality are societal key drivers for fuel cell and hydrogen technologies.
2.2.4 China 2.2.4.1 The Chinese Energy Outlook
According to the IEA’s World Energy Outlook 2002, China will account for a fifth of the growth in world energy demand between now and 2030. While coal will continue to dominate its energy mix, the shares of oil, natural gas and nuclear energy in China's primary fuel mix will grow. China will become a major importer of oil and gas. By 2030, Chinese oil imports will equal the imports of the United States today, while imports will meet 30% of the country's gas demand.
The share of natural gas in China energy consumption is currently very low, estimated at 3 percent in 1999, compared with 10 percent in the rest of developing Asia and 23 percent in the rest of the world11. China has been adding significant amounts of natural gas reserves over the past decade, and current reserves are estimated at 38.8 trillion scf (986 Mtoe). China considers natural gas attractive as an indigenous clean-burning fuel, in substitution for domestic coal and imported oil. China’s natural gas demand is expected to reach 2.8 trillion scf by 2010 and 6.4 trillion by 2020. A full-fledged fuel-switching policy could boost demand to 3.4 trillion scf as early as 2010, with 53% going into power generation, 21% consumed in the chemical sector, and 25% used as city heating fuel.
Supplying natural gas to the industrial urban centers of eastern China, notably Shanghai, is a priority for China. On March 25, 2000, plans were announced to build a massive cross-country pipeline that would transport natural gas from the Tarim basin in the west to Shanghai in the east. The pipeline would pass through seven provinces -Gansu, Ningxia, Shaanxi, Shanxi, Henan, Anhui, and Jiangsu- before reaching Shanghai. Construction of the 4160 km pipeline was originally slated to begin in 2001.
The protection of the environment has been a significant concern for the implementation of the West-to-East project. Major cities in China have been among the most polluted cities in the world. Decades of expansionary coal use have resulted in environmental degradation, which needs urgent remediation. Estimates by some independent observers and by Chinese officials put the direct economic losses caused by pollution at approximately $100 billion per year, and some analysts claim that China must now spend $20 billion per year just to prevent pollution from rising above current levels.
Another issue of concern to the West-to-East pipeline developers is that China currently does not have an adequate distribution network. In fact, because of the lack of distribution networks, many of the pipelines already completed are running at rates that are lower than their design capacity.
2.2.4.2 The potential role of hydrogen in China
In January 2002, China announced that it would join the international race in effectively using
106

Hydrogen energy12. The total investment into the technological endeavor in the next three years would reach 100 million yuan (12 million US dollars). In particular, China has plans to become a player in the PEMFC technology with already 41 patents awarded.
China’s abundant coal and coal bed methane (CBM) resources are an option for making hydrogen, and the byproduct carbon dioxide could be used to stimulate CBM recovery. China is already making hydrogen from coal and does not have to acquire new foreign technology to create a H2 industry for fuel cells.
2.2.5 Other countries The energy demand in developing countries is expected to grow at a faster pace than in industrialized countries (Figure 2.2.5.a) with its obvious consequences on the accumulation of CO2 in the atmosphere.
Figure 2.2.5.a: World energy consumption per region
Hydrogen is likely to be considered as an option too expensive for developing countries but in a few of them, there are locally or internationally encouraged hydrogen actions that will be carried out on the ground of sustainable growth (see § 2.5.4: early hydrogen actions, International programs).
2.3 BARRIERS FOR THE APPEARANCE OF THE HYDROGEN ECONOMY Serious barriers obviously exist that could delay or even prevent the inception of the hydrogen economy. Opinions differ, however, on the time frames required to overcome the difficulties.
2.3.1 Technical barriers There are numerous technical barriers for the inception of the Hydrogen Economy. We concentrate here on three major area: production of hydrogen, fuel cells reliability and on board storage of hydrogen.
2.3.1.1 Production of Hydrogen energy
Currently, the production of hydrogen is not at all in line with what will be required by the hydrogen economy (figure 2.3 1.1.a). The Hydrogen Economy will need widely available hydrogen at prices comparable to those of traditional fuels. Since hydrogen is not a primary energy and is derived
107

from other sources, the “on-purpose” hydrogen is always more expensive than the primary energy it originates from, unless external costs, such as environmental costs, are attached to that primary energy.
Petroleum
On-purpose
HYDROGEN
MERCHANT HYDROGEN
Coal
(Tar, Aromatics, CO-H2)
Hydropower
Renewables
Nuclear
Natural Gas
Heating Fuel35%
Transportation Fuel40%
Chemical Feedstock (Olefins,
Aromatics)7%
Miscellaneous8%
Power Generation
10%
Chemical Feedstock
2%
Iron & Steel20%
Power Generation
60%
Miscellaneous18%
Heating Fuel73%
Power Generation
20%
Chemical Feedstock
7%
Electrolysis0,5%
Miscellaneous99,5%
W orld Consumption 2001
3504 Mt
2236 Mtoe
593 Mtoe
64 Mtoe
593 Mtoe
2135 Mtoe
73 Mtoe = 0.8 % of W orld Energy Consumption
(2001)
By productHYDROGEN
57 Mtoe
REFORMING
GASIFICATION
REFORMING
ELECTROLYSISGasification
Natural Gas85%
Petroleum7%
Electrolysis4%
Coal4%
Figure 2.3 1.1.a: Fossil fuels are the main source of hydrogen. The world hydrogen production (500 M Nm3 in 199813.) represents less than 1% of the world energy production of 9,130 Mtoe.
The governments may help overcome these economic limitations with their toolbox of taxes and subsidies but that will not be sufficient as the current prices for hydrogen delivered by merchant gas companies are about 3 to 10 times too high.
What is needed is hydrogen produced on site (100 - 1000 Nm3/h) at prices similar to those attached to the production at the large scale (100,000 Nm3/h). The challenge is actually the target sought for natural gas reformers for stationary fuel cells. The cost reduction will arise from more efficient small-scale reformers, with designs permitting the chain fabrication in large numbers. Although extremely ambitious, the challenge is not unrealistic and a few companies have taken steps in that direction with the hope that mass production will help reach the targeted costs.
In parallel with the efforts on natural gas and LPG reforming, it is essential that the cost of hydrogen from renewables be reduced or the gap between hydrogen from natural gas and from renewables will increase as well as the amounts of CO2 in the atmosphere. Technical innovations are
108

particularly necessary in photovoltaics to bring down the costs of “solar” hydrogen, the ultimate fuel that is perfectly clean and potentially widely available.
2.3.1.2 Fuel cells
Fuel cells do not need the advent of a hydrogen economy to develop. Fed with fossil fuels such as natural gas, or even diesel, they have the potential to displace the thermal engines, which have a lot of drawbacks. However, it is difficult to imagine a hydrogen economy without fuel cells. The ability of fuel cells to become commercial is therefore a serious concern for the inception of the hydrogen economy. Fuel cells have been around for a long time and the fact that they are not yet commercial is a serious concern. Several technologies (Figure 2.3.1.2) continue to be investigated, which is a recognition that they all have their own specific merits and limitations. However, even though problems remain, tremendous progress has been accomplished, and the momentum now exists to suggest that the technical barriers will gradually disappear. It is a slow and iterative process though, as the economic constraints will keep creating technical problems till the fuel cells become competitive with the devices they have to compete with, namely the thermal engine and the micro-turbine. We mention below a few of the most significant problems in the three types of fuel cells that have attracted most the attention of the gas industry.
Figure 2.3.1.2: Hydrogen Fuel cell types (from S. Chalk, US DOE; overview of DOE
Transportation Fuel Cell R&D, February 2002).
PEMFCs: A low cost membrane able to operate at a temperature higher than 80°C is needed. It would be more tolerant to CO, would require less platinum and would provide a better quality heat.
MCFCs: The problem of the poor durability of certain components in the aggressive carbonate medium could be circumvented by the introduction of low costs replaceable components.
SOFCs: The durability of certain materials at the high operating temperature of SOFCs (850°C) remains a problem.
2.3.1.3 On board hydrogen storage for vehicles
The switch to the hydrogen economy may never occur unless the problem of hydrogen storage on passenger cars is solved. Liquid hydrogen is a solution but making liquid hydrogen is very energy intensive. High-pressure storage (700 bar, 10,000 psi) is also pursued with success but this cannot be considered as an elegant solution. Adsorption of molecular hydrogen is not too promising as the hydrogen molecule retains essentially its large size when adsorbed. Kelvin liquefaction has not been achieved in view of the unfavorable physical properties of hydrogen. Hydrides, which permit the dissociation of the hydrogen molecule, remain a good prospect but they have been investigated for a
109

long time with limited success. For the problem of on-board storage of hydrogen, the difficulty of the challenge is commensurate with the potential reward and is often regarded as the main technical barrier towards the hydrogen economy.
2.3.2 Safety Barriers The technologies and equipments to produce, store, handle and distribute hydrogen safely have been in existence for many years in industry. Adapted legislations in all countries provide further guarantees. However, it is a different matter to let the general public have access to a new fuel, considered more dangerous by many even if this is not justified. Safety regulations in all countries favor conventional fuels, and despite an impressive industrial safety record, the Hindenburg episode remains a counter-demonstration for the widespread utilization of hydrogen.
The town gas experience
It is ironic that a single unfortunate episode like the Hindenburg, may have more impact on the public opinion than years of worldwide day-to-day fairly safe operation of the town gas chain. Town gas contained various amounts of CO, CH4 and CO2 and up to 60% hydrogen. It is still produced from coal and distributed in a few parts of the world, particularly in China.
GASTEC has gathered data on the safety record of town gas in the Netherlands. The number of deadly accidents for gas distribution in the Netherlands dropped from 25 to below 5 per million gas connections after the conversion from town gas to natural gas. However, the majority of accidents in the town gas era was due to poisoning by CO. Deadly accidents caused by explosions or fire are on average less than 1 per million gas connections and these numbers have been unaffected by the conversion from town gas to natural gas.
This data shows that for town gas as well as for natural gas distribution, the number of deadly accidents caused by fire or explosions are both at a very low level and substantiate the idea that a pure hydrogen chain would feasible safety wise.
2.3.3 Regulatory Barriers In many countries, regulatory barriers are hampering the early efforts to use hydrogen as a fuel. Therefore, many actions have been engaged internationally to rationalize matters, create and harmonize codes and standards regarding the hydrogen energy entire chain. Currently, most of the actions concern hydrogen as a vehicle fuel, the first likely and most visible engagement in the hydrogen economy. Another reason for the flurry of activities in this area is the importance of the vehicle market for a large number of traditional players and newcomers and the contrast between what is at stake and the impeding lack of legislation for hydrogen as a vehicle fuel.
2.3.3.1 Vehicles
Now that the CNG community and its national and international professional organizations (IANGV -International Association for NGVs-, U.S., European and Australasian NGV associations) have endorsed hydrogen as a vehicle fuel, these associations act to facilitate the implementation of adequate legislation, codes, standards and safety rules that will permit the development of the hydrogen fueled vehicle chain, in parallel with CNG vehicles. They work with other organizations, such as the US National Hydrogen Association (NHA), the European Integrated Hydrogen Project team (EIHP) and international standards organizations (ISO, IEC, SAE)14 with the objective of establishing worldwide standards for a global harmonisation of legal requirements for vehicles. The automakers also play a major role in that effort.
The ENGVA (European Natural Gas Vehicle Association) has gathered already a lot of information on the current hydrogen regulations and the activities engaged to facilitate its utilization as a vehicle fuel (http://www.engva.org/). The existence of codes and standards is critical to establish a market-receptive environment for commercializing hydrogen-based products and systems.
The strategies that are pursued for removing the regulatory barriers are global and international, but these barriers remain country specific for the time being. For the Gas industry, the NGV national associations are good sources of information to penetrate the arcana of codes and standards and get information on the current actions.
Europe
110

Of particular interest are the actions carried out by EIHP -European Integrated Hydrogen Project- which has entered its second triennium of existence with an expanded partnership of 20, including major North American companies and 5 vehicle manufacturers. EIHP, which is funded by the European Commission, provides a mechanism for direct industry input to the development of standards and legal requirements. It cooperates with ISO, IEC, SAE, etc. After having tackled the on board hydrogen storage issue, the project now extends to refueling infrastructure and to the vehicle interface. For the storage issue, it was decided to develop proposals for legal requirements based on the framework of the United Nations Economic Commission for Europe Working Party 29 (ECE WP29) as it is recognized as the world forum for the harmonization of vehicle regulations. The EIHP proposals were developed as the basis of future ECE regulations with contracting parties, which include most European countries, Canada, China, Japan, Korea, South Africa and the USA. Further details on EIHP and its activities can be found at http://www.eihp.org/ and on the NHA website in its monthly Hydrogen safety report at http://www.hydrogenus.com/.
Japan
Japan has one of the most severe and restrictive set of codes and standards regarding hydrogen, particularly in the area of storage. Nevertheless, through a successful collaboration between industry, government and local authorities, they have been adapted to permit several hydrogen filling stations to be erected (§ 3.2.2.2). Also, by 2005, the Japanese government plans to ease or lift restrictions impeding the development of fuel cells for automotive and residential power applications.
USA
The DOE has sponsored work in codes and standards as a key part of its hydrogen efforts since 1995. It supports the National Hydrogen Association (NHA) to conduct national codes and standards workshops at least annually to bring together experts to address key issues and needs.
These efforts have encouraged organizations such as the International Code Council (ICC), the National Fire Protection Association (NFPA), the Society of Automotive Engineers (SAE), the Underwriters Laboratory (UL), and the Compressed Gas Association (CGA) to conduct national activities in hydrogen codes and standards. Federal agencies such as the Department of Transportation (DOT), the National Aeronautics and Space Administration (NASA), and the National Institute of Standards and Technology (NIST) also have regulatory or mission-related interests in hydrogen regulations, codes, and standards. It was also from the NHA workshops that proposals emerged to form working groups to develop hydrogen standards under the International Organization for Standards (ISO) Technical Committee (TC) 197. These proposed standards are in various stages of completion under the ISO process.
In an effort to prepare uniform national model building codes, the three major code councils in the U.S., the Building Officials Code Administration (BOCA), the International Conference of Building Officials (ICBO), and the Southern Building Code Congress International (SBCCI), established the ICC (International Code Council) as a joint venture. The existing ICC model codes do not include hydrogen as an energy source or fuel cells as either a power-generating device or as an appliance. To address this limitation, the DOE sponsored a request to the ICC that it establish an Ad Hoc Committee (AHC) on hydrogen technologies, a process the other code bodies have used in the past to address new technologies and which can reduce the time needed to have the model codes amended to include hydrogen technologies. The ICC approved this request, and the Hydrogen Program has sponsored the participation of experts to the AHC. The AHC consists of a balanced membership of hydrogen user, producer, and regulator interests. It is working with a diverse group of technical and advisory parties to review current codes and standards applicable to hydrogen, to determine the adequacy of its coverage in the ICC International Codes, and to propose changes as necessary to those codes through the ICC Code Development Process.
In addition to sponsoring activities related to ISO TC197 and other international standards development organizations, the DOE is also sponsoring efforts to coordinate codes and standards activities among key countries outside of the European Union. Internationally accepted hydrogen standards can facilitate trade among nations and lower regulatory trade barriers. If hydrogen is to become a major energy carrier, the hydrogen interests of key countries must be coordinated and countries new to hydrogen must be introduced to its benefits and safe use.
As one step in this process of strengthening international interests in hydrogen energy, the
111

DOE is co-sponsoring the creation of a “regional” hydrogen association to improve knowledge about hydrogen while strengthening hydrogen organizations in interested countries. The Program is helping to organize the Partnership for Advancing the Transition to Hydrogen (PATH) to link and unify hydrogen interests of, to date, Canada, Japan, Argentina, and the U.S.
The goals of the PATH are to identify and build on a community of interest among members by addressing common issues and to increase knowledge and activities concerning hydrogen, particularly safety and codes and standards. The PATH will also help interested hydrogen parties in non-member countries to organize hydrogen activities and contribute to the strengthening of the international hydrogen community.
2.3.3.2 Stationary fuel cells
In this report we consider only hydrogen fuel cells. Their commercialisation will not occur before hydrogen distribution networks are in place, in a rather distant future. By then, it may be assumed that regulatory barriers for natural gas fuel cells will have disappeared and this will certainly clear the way for hydrogen fed fuel cells. In Europe, Vaillant and Sulzer Hexis obtained in 2002 the first EC stamp approval for their cogeneration units in the gas appliance category.
On the international level, the International Electrotechnical Commission (IEC) has an activity on codes and standards for stationary fuel cells under the responsibility of its Technical Committee 105. There is a chance that a project similar to the EIHP, but devoted to stationary fuel cells, be launched in 2003, in the 6th European Community Framework Programme.
2.3.4 Economic barriers The whole hydrogen energy chain is characterized by costs that are higher than those of traditional fuels, with their hidden costs: hydrogen appears to cost more to produce, to transport and to utilize. On an energy unit basis, hydrogen costs up to 10 times more to transport than oil. It costs 3 times more than the natural gas from which it is traditionally produced.
Currently, the most cost-effective way to produce hydrogen is steam reforming of natural gas. The US Gulf Coast cost is around US$ 7.00/GJ (7.5 c€/Nm3 or 21 cents/100 scf) in large plant, with natural gas at US $2.30/GJ (0,82 c€/kWh or $2,4/MMBTU). Hydrogen by electrolysis using hydroelectricity at off peak rates costs between US$ 10.00 to US$ 20.00/GJ (Figure 2.3.4).
0 0,5 1 1,5 2 2,5 3
electrolysis with peak electricity
electrolysis with off peak electricity
on site reforming
truck deliveries
NG reforming in large plants
€/Nm3
Figure 2.3.4: estimates of hydrogen prices (from various literature sources and suppliers
quotes)
Hydrogen from renewables would cost 3 to 10 times more than hydrogen from natural gas. Hydrogen would also cost more to utilize, particularly in the transportation sector because in the current thinking, it is associated with fuel cells whose price may remain high.
112

Are these costs a deterrent to any action? The worldwide activity on hydrogen energy proves that they are not because the costs for hydrogen should go down with technological improvement and dissemination while the real cost of oil and other fossil fuels will go up when their external costs (oil spills, health damages due to local pollutants, …) will be taken into account.
The economics will even become favorable for hydrogen if the costs of climate change induced damages such as storms, floods, etc, estimated to total more than $300 billion/year after 2050, are included in the cost of traditional fuels15. However, only governments have the power to include these costs in the price of traditional fuels through CO2 taxation and favor clean fuels with ,mandates and incentives for clean fuels. Industry does not have and cannot finance long-term societal goals such as clean air, reduced dependence on imported oil and greenhouse gas control. These issues are the responsibility of the governments, which are expected to provide the favorable economic context for industry to come up with solutions that will be economically attractive. New legislation and incentives will shape that new context. Alleviating the fuel taxes on clean fuels is another possibility.
Lower cost hydrogen will be obtained through product development and mass production of reformers. In order to ease its introduction as a vehicle fuel, the price of hydrogen, without taxes, should become less than that of gasoline with the taxes included. If hydrogen could be obtained on site at the price targeted for hydrogen from fuel processors for natural gas fuel cells and if the governments lift the fuel taxes for hydrogen, this should become possible in Europe and Japan where the taxes on vehicle fuels are high. It will be more difficult in the U.S..
2.3.5 Public acceptance Another important barrier for hydrogen as a fuel may be the acceptance by the public. Hydrogen must be viewed as safe, friendly to the environment and considered as a “high tech” fuel when used in cars and homes. The experience drawn from the demonstration of buses in Chicago, Vancouver and at the Münich airport (figure 2.3.5) has been rather positive and has shown that the “Hindenburg syndrome” could be overcome.
Hydrogen bomb
12%
Danger5%
Hindenburg1%
Positive perception
41%
Chemical knowledge
directly related to H2
23%
Hydrogen technologies
6%
Others3%
chemical knowledge
indirectly related to H29%
Figure 2.3.5: perception of hydrogen by the population in Münich where hydrogen fueled prototype buses and passenger cars are circulating (source: LBST)
It remains that any accident involving hydrogen will cause a much more serious damage to the image of hydrogen as a fuel than a similar accident would do to gasoline. Safety measures for hydrogen will be drastic, even though many consider that in many respects, hydrogen is a less dangerous fuel.
In the US, outreach involving public education and information dissemination on hydrogen safety and codes and standards is another key component of the DOE’s hydrogen effort. As a continuing part of its coordination effort, the DOE is providing support to the NHA to publish a monthly
113

electronic newsletter for hydrogen codes and standards. The newsletter also provides a central point where all interested parties can post information for better coordination of codes and standards activities and to improve information transfer on hydrogen safety issues.
In June 2000, Hydrogen 2000 premiered its video, Hydrogen: The Matter of Safety, sponsored in part by the DOE, at the Canadian Hydrogen Association meeting in Quebec. This video has been used by corporations and organizations around the world to educate community groups, elected officials, local permitting officials, and insurers about the unique properties of hydrogen and to address common misconceptions about its safety. Last year, the DOE sponsored, with others, a follow-on video which was produced by Hydrogen 2000. The video, Hydrogen Energy: The Safe and Clean Alternative, targets the general public. It was premiered at the 2002 WHEC in Montreal.
In Europe, Shell launched a TV and newspaper campaign. Also, Hydrogen as a vehicle fuel got a wide exposure in all the media in relation with the Paris auto show in October 2002 where GM unveiled its hydrogen/fuel cell car. 2.4 NON PROFIT ORGANISATIONS, PROFESSIONAL AND TRADE
ASSOCIATIONS Historically, a few individuals and non-profit organizations played a decisive role in bringing forward the idea of a hydrogen economy16. They continue to play their part among the numerous current players.
2.4.1 Non profit Organizations, Professional and Trade Associations 2.4.1.1 The International Association for Hydrogen Energy (IAHE)
The early believers in Hydrogen energy created the IAHE in 1974. The journal of the association is the International Journal of Hydrogen Energy. Under the continuous leadership of Pr. Nejat T. Veziroglu, it has since organized the World Hydrogen Energy Conferences -WHECs- every two years.
The last one organized in Montreal in June 2002 was attended by more than one thousand people. The next ones will take place in Yokohama, Japan, in 2004 and Lyon, France, in 2006.
2.4.1.2 Other organizations
Europe also had its own hydrogen visionaries:
Gustav Grob, President of the World Sustainable Energy Coalition (WSEC) is working closely with the world’s official bodies to promote the goal of sustainability, in particular, through hydrogen. He has obtained the intensive involvement of the relevant commissions, committees and working groups of the United Nations, such as the ISO which created the TC 197 dedicated to hydrogen technologies. At the CLEAN ENERGY 2000 conference in Geneva, stakeholders, governments, academia and NGOs gathered to work out action plans for a cleaner energy economy.
Ludwig Bölkow17, an aerospace pioneer and achiever created in 1982 Ludwig Bölkow Systemtechnik GmbH, a strategy and technology consulting firm for sustainable energy and transport systems. LBST has specialized early in hydrogen systems and has been a project coordinator in many of the hydrogen projects supported by the European Union, such as the Euro-Quebec-Hydro-Hydrogen Pilot Project. They currently manage the European Integrated Hydrogen Project II and are involved in the organization of the future hydrogen projects of the EU for the 6th RD&D Framework Programme.
Now the number of associations devoted to the promotion of hydrogen has increased tremendously, probably over one hundred. A fairly exhaustive list could be built from the partial lists that are featured on the web sites of the NHA, NREL, DWV, H2NET and AFH2.
2.4.1.3 The Natural Gas Vehicle Associations
In October 2002, the board of the IANGV -International Association for NGVs- following the lead of the U.S., European and Australasian NGV associations, has voted to add hydrogen to its missions
2.4.2 International official Bodies
114

2.4.2.1 United Nations
The United Nations and its various branches (UNDP, UNDESA, UNEP, IPCC, UNIDO), are beginning to include the hydrogen economy in their energy scenarios. Some of them, like the GEF/UNDP, are even launching concrete actions such as the demonstration of fuel cell buses in a few large heavily polluted cities in less developed countries (§ 2.5.5). The IGU maintains a contact with the UN Framework Convention on Climate Change through its co-ordinator, Marc Darras.
Numerous commissions, committees and working groups of the United Nations are involved with hydrogen energy issues: the ISO & IEC Technical Committees (Environment, Water, Safety, Technical Energy Systems, Solar and Geothermal Energy, Wind, Hydropower, Bio-Energy, Hydrogen etc.), the trade associations of the various renewable energy options and environmental protection, ,the UN Commission on Sustainable Development (CSD), the UN Regional Committees on Energy, UN ECOSOC, UN Agencies on Environment (UNEP), Meteorology and Climate (WMO, UNFCCC), Health (WHO), Labor (ILO), Education (UNESCO), Industrial Development (UNIDO), United Nations University (UNU), HABITAT.
2.4.2.2 International Organizations for Standards
As mentioned in section 2.3.3 discussing regulatory barriers, the international organizations for standards are involved with hydrogen and fuel cells. They act in coordination with professional organizations such as the IANGV -International Association for NGVs-. Very few gas companies are directly involved in the hydrogen energy activities of the international organizations for standards. More are involved in the fuel cell activities.
2.4.2.3 International Energy Agency
The International Energy Agency -IEA- was established in 1974, following the first oil crisis and is managed within the framework of the Organization for Economic Cooperation and Development (OECD). The mission of the IEA is to facilitate collaborations for the economic development, energy security, environmental protection and well-being of its members and of the world as a whole. The IEA is currently comprised of twenty-five member countries, ten of which are participants in the program focused on the Utilization and Production of Hydrogen.
The Hydrogen Program18, -Implementing Agreement-, has been in existence for more than twenty years for the purpose of advancing hydrogen technologies and accelerating the acceptance and widespread utilization. Past collaborations have been in the areas of thermochemical production, high temperature reactors, electrolysis, storage, safety, and markets.
The following countries/organizations participate in the Hydrogen Implementing Agreement: Canada, European Commission, Japan, Lithuania, the Netherlands, Norway, Spain, Sweden, Switzerland and the United States.
The following are the guiding principles on which the scope of the Agreement is based:
Hydrogen--now mainly used as a chemical for up-grading fossil-based energy carriers—will in the future increasingly become an energy carrier itself. It is necessary to carry out the analysis, studies, research, development and dissemination that will facilitate a significant role for hydrogen in the future.
•
•
•
•
•
Significant use of hydrogen will contribute to the reduction of energy-linked environmental impacts, including global warming due to anthropogenic carbon emissions, mobile source emissions such as CO, NOx, SOx, and NMHC (non-methane hydrocarbons), and particulates.
Hydrogen can be used as a fuel for a wide variety of end-use applications including important uses in the transportation and utility sectors.
Hydrogen is currently used to upgrade lower quality, solid and liquid fossil fuels, such as coal and heavy oils. The use of hydrogen in such applications reduces harmful emissions through more efficient end-use conversion processes and extends the range of applicability. Ultimately, with the addition of hydrogen, carbon dioxide emissions can be used to produce useful chemicals and fuels.
Hydrogen has the potential for short, medium and long-term applications and the steps to
115

realize the potential for applications in appropriate time frames must be understood and implemented.
All sustainable energy sources require conversion from their original form. Conversion to electricity and/or hydrogen will constitute two prominent, complementary options in the future.
•
•
•
•
•
•
Hydrogen can assist in the development of renewable and sustainable energy sources by providing an effective means of storage, distribution and conversion; moreover, hydrogen can broaden the role of renewables in the supply of clean fuels for transportation and heating.
Hydrogen can be produced as a storable, clean fuel from the world's sustainable non-fossil primary energy sources - solar, wind, hydro, biomass, geothermal, nuclear, or tidal. Hydrogen also has the unique feature that it can upgrade biomass to common liquid and gaseous hydrocarbons, thus providing a flexible, sustainable fuel.
All countries possess some form of sustainable primary energy sources; hence, hydrogen energy technologies offer an important potential alternative to fossil fuel energy supply (in many instances to imported fuels). Utilization of hydrogen technologies can contribute to energy security, diversity and flexibility.
Barriers, both technical and non-technical, to the introduction of hydrogen are being reduced through advances in renewable energy technologies and hydrogen systems including progress in addressing hydrogen storage and safety concerns.
Hydrogen energy systems have potential value for locations where a conventional energy supply infrastructure does not exist. The development of hydrogen technologies in niche applications will result in improvements and cost reductions that will lead to broader application in the future.
The members of the IEA Hydrogen Agreement recognize that a long-term research and development effort is required to realize the significant technological potential of hydrogen energy. This effort can help create competitive hydrogen energy production and end-use technologies, and supports development of the infrastructure required for its use. Attention is to be given to the entire system, in particular all of the key elements should be covered either with new research or based on common knowledge.
If the technological potential of hydrogen is realized, it will contribute to the sustainable growth of the world economy by facilitating a stable supply of energy and by helping to reduce future emissions of carbon dioxide. Cooperative efforts among nations can help speed effective progress towards these goals. Inasmuch as hydrogen is in a pre-commercial phase, it is particularly suited to collaboration as there are fewer proprietary issues than in many energy technologies.
Two other IEA programs have activities closely linked to the hydrogen energy topic. The IEA Greenhouse Gas Programme19 considers hydrogen as one of the solution to the greenhouse gas problem. The fuel cell program is concerned with hydrogen production technologies.
2.4.3 National Governments and authorities The role of governments in the transition to a hydrogen economy is to provide support for the development of infrastructure related to hydrogen energy systems. This includes such important items as technical and policy support for the development and institutionalization of codes and standards for the safe use of hydrogen, and for financial support of the installation of appropriate hydrogen distribution and dispensing networks.
In much the same way that governments, throughout the world, have supported electrification and the introduction of automobiles by building and maintaining transmission lines and highway systems, governments will be called upon to support the development of the infrastructure required to support hydrogen distribution and delivery. The overarching societal benefits that the use of hydrogen will bring require the support of governments, since these benefits will not directly impact a company’s bottom line, but will instead benefit society through improved air quality, increased energy security, and improved standards of living.
116

The local public authorities have an essential role to play towards the commercialisation of hydrogen as an energy carrier. They have the power to create the necessary mandates, incentives or taxes on tail pipe emissions or on fossil fuels. The authorities might accept new standards and regulations for hydrogen plants and equipment. They may also cause delays by unreasonably strict regulations, which would increase the costs as well.
2.4.4 Academia, Research Institutes As mentioned earlier, there are still serious technological and societal barriers for the inception of the hydrogen economy with its fuel cell component. The contribution from academia and research institutes, working with industry, is necessary to solve the fundamental problems involved. It is anticipated that they will get a sizeable share of the large funds that have been allocated by the governments in Europe, Japan and in the US and will built a hydrogen expertise.
2.4.5 Financial Institutions and start up companies As the money started to dry up in industry for long-term R&D projects in the late eighties, in particular for fuel cells development and hydrogen related projects, individual entrepreneurs turned to venture capital money to develop their ideas. Their activities and achievement have had, and continue to have, a large impact on the burgeoning fuel cell and hydrogen industry of today. Today, even if the venture capital money is not easily available any longer, financial institutions keep considering the hydrogen topic as promising and will keep playing a role to nurture R&D as well as commercial development projects.
2.4.6 Suppliers of hydrogen energy 2.4.6.1 Industrial gas companies
The industrial gas companies are currently suppliers of hydrogen energy for the space programs and for demonstration programs of hydrogen vehicles. They are attracted by the market opportunities in the hydrogen economy as this new business would be a very significant expansion of their current business and capabilities in merchant hydrogen. They have expertise on the entire hydrogen chain from production (50 large production plants in the US and Europe), to pipeline transportation (2500 km), distribution to industrial customers and safety issues.
2.4.6.2 Oil companies
Oil companies have for long acted as overall energy supply companies. Most of them -Shell, BP, ChevronTexaco and TotalFinaElf- are engaged in alternative energies such as renewables and indeed hydrogen. They also support the view that hydrogen will continue to be obtained from hydrocarbons, eventually with carbon sequestration, before renewables can take over.
2.4.6.3 Utilities
Utilities are blessed with the distribution of two products (electricity and natural gas) whose growth is predicted at a fast pace for the next decades in order to satisfy the world’s growing energy demand. The incentives for them to venture into activities that are not in the main stream of their traditional business are limited. However, exceptions exist when local conditions are favorable. Gas companies in Japan are strongly involved in hydrogen. In Canada, BC Hydro is pushing the hydrogen/gas natural vehicle fuel mixture, presumably to get into new markets. In the Netherlands, the gas transmission operator is encouraged by the government to look into the possibility of adding hydrogen in the natural gas networks to help the country meet its CO2 reduction commitment.
2.4.6.4 The nuclear industry
Many analysts consider that among the primary energies, the nuclear energy has the best potential to provide, without greenhouse gas emissions, the huge quantities of hydrogen that would be ,necessary for the hydrogen economy. Nearly 500 nuclear power plants are in operation or under construction worldwide. The development of next-generation reactor designs for simultaneously generating electricity and heat makes nuclear-powered hydrogen-generating plants a viable long-term solution. The European, American and Japanese nuclear industries are now involved in hydrogen projects. In Japan, the Nuclear Hydrogen Society, which has been created in January 2001, has 27 member companies including electric and gas utilities, petroleum, steel and chemical industries.
2.4.6.5 The steel industry
117

The steel industry is a large producer of by-product hydrogen and the prospect of a hydrogen economy may induce that industry to increase this production. This is particularly true in Japan where the steel industry has announced its interest for the hydrogen energy markets with new schemes to optimize its hydrogen production (potential: 4GNm3/year) with even new, dedicated hydrogen production processes, reminiscent of the steam iron process. A word of caution, however, concerning the ability of the steel industry to become a major supplier of hydrogen: the steel industry is one of the largest single emitters of CO2 in the world, responsible for about 6% of the emissions. The industry has the will to curb these emissions and is considering a switch to hydrogen as heating fuel for that purpose20. The industry could then become a consumer of hydrogen rather than a supplier.
2.4.7 Transporters of hydrogen energy The industrial gas companies operates the 2500 km of high purity petrochemical quality hydrogen pipelines in the US and Europe. Relying on this experience, they intend to become major players of the hydrogen economy but the natural gas companies whose networks may play a key role at all stages of the hydrogen economy may decide, at some point, to take advantage of the opportunities i) initially to transport natural gas to on site reformers, ii) later to transport mixtures of natural gas and hydrogen from renewables, iii) ultimately to transport pure hydrogen obtained from renewables and from natural gas in large reformers with CO2 sequestration.
Eventually all parties interested in hydrogen energy will have the opportunity to be involved in transportation of hydrogen through Third Party Access.
2.4.8 Distributors of hydrogen energy The distribution of hydrogen as a vehicle fuel produced on site from currently available primary energies with existing transmission infrastructures (natural gas, LPGs), could start relatively rapidly and oil companies will be involved. This market is also sought by industrial gas companies, as most of them are already involved in hydrogen filling stations demonstration projects. In Japan, the major natural gas companies are also involved. At a latter stage when the business will have been proven economically sound, it is expected that many natural gas companies having a CNG/GNV activity will extend that activity to hydrogen vehicles. In the long run, however, with deregulation and unbundling coming into play, it is unclear whether the current transporters/distributors of energy will continue to be in the energy distribution business. At that latter stage, it is also likely that a hydrogen infrastructure will start to appear, with CO2 sequestration facilities and a more significant contribution of renewables (solar, wind, biomass) available locally. New players will appear with consequences on the traditional energy distribution structures.
2.4.9 Customers of hydrogen energy (end users) After the rocket industry, the urban buses are likely to be the next customers of hydrogen energy. A few thousand refueling stations are envisioned for 2010 (section 3). The timetable for the introduction of passenger cars is more uncertain with plans from vehicle manufacturers ranging from 2010 to 2025. Less conspicuous applications of hydrogen energy may take place earlier such as the utilization of hydrogen as a heating fuel in industries that must reduce their CO2 emissions.
2.4.10 Pressure groups Pressure groups include environmentalists, mass medias, CO2 skeptics21, hydrogen skeptics, politicians, industry lobbyists,…who can influence the public and the governments in favor or against the hydrogen economy. It is clear that the topic of hydrogen energy is getting more exposure than ever and is viewed now more favorably. In recent years, the sustainable development promoters such as Green Cross, Greenpeace, the International Energy Foundation (IEF), WWF, scientific and legal associations, IUCS, IUCN and other Non-Governmental Organizations (NGOs), such as solar, wind, geo-thermal, bio-energy, hydropower, and energy efficiency associations and consortia have been exposed to the hydrogen energy topic.
2.5 EARLY ACTIONS IN HYDROGEN ENERGY; MOTIVATIONS. PROJECT
UPDATE The most immediate motivation to use hydrogen as a fuel is in the transport sector to reduce
118

the “local” pollutants (NOx, CO, UHC, particles) and this is where the first commercial breakthroughs are expected. Demonstrations of the utilization of hydrogen as a vehicle fuel have been carried out or are in progress in several countries today, in Europe, Japan and North America. They concern vehicles with thermal engines or, more often, electric engines with electricity supplied by a fuel cell.
In addition to these focused actions, there is one comprehensive hydrogen program, which is being carried out in Iceland. Iceland has the ambition to replace by 2030 all its imported oil with hydrogen made with its own locally available energies (geothermal and hydroelectric power). Iceland would then become the world’s first “hydrogen economy”. Daimler-Chrysler, Norsk Hydro and Shell were the initial partners of the consortium that has been created with the Icelandic authorities and various local concerns.
A comprehensive source of information on hydrogen energy projects and demonstrations is the IEA (International Energy Agency) Hydrogen Implementing Agreement22. The descriptions can be found at http://www.eren.doe.gov/hydrogen/iea/pdfs/. The contribution of LBST, Münich and of the French Hydrogen Association and its President Thierry Alleau23, are also acknowledged.
2.5.1 Europe 2.5.1.1 The European Union
The European Union (EU) must be considered both as an ensemble and as a collection of individual countries with their own degree of freedom in energy policies. In addition, a few countries have a federal status that grants a significant degree of autonomy to “provinces”. This is particularly true for Germany where the particular involvement of Bavaria, for example, in Hydrogen technologies is well known. Giving a comprehensive picture of the hydrogen drivers and activities in Europe is therefore a difficult task. It appears better to proceed country per country, despite the harmonisation of many European activities induced by various regulations applicable to all member countries.”
Furthermore, despite the existence of partially or totally European federative structures such as the HyNet network or the European Hydrogen Association (EHA), the databases such as the HyWeb Pro, designed by LBST in Münich, bringing together information on European activities on hydrogen energy are not yet operational.
What does not simplify matters either is the difficulty of distinguishing those fuel cell activities which are part of a hydrogen economy from those which are not: every odd year, the Daimler Chrysler NECAR, when it carries on board stored H2, is a hydrogen economy project. On even years, the NECAR with on board methanol reforming is not a hydrogen economy project.
Europe has been a pioneer in hydrogen energy with the EQHHPP project24, engaged in 1989. The project aimed at demonstrating the feasibility of a whole hydrogen chain starting with electrolytic hydrogen production in Quebec, liquefaction, transportation over the Atlantic Ocean by tankers to Europe and efficient and clean utilization there, particularly with fuel cells. The project was terminated in 1999, with around 30% of the project completed at a cost of 80 million US $. The EU and the government of Quebec supported the project. Eighty participants, including thirty industrial concerns, were involved.
Since 1985, the European Union has launched large RD&D Framework programs. 30 to 50% of the overall costs of the projects can be provided, depending on the nature of the work (research or demonstration) and the status of the participants.
The 5th Framework Programme (FP5) (1998-2002)
Renewable energies and fuel cells were identified as “Thematic Priorities” with a funding of about 120 million €. There was no explicit mention of hydrogen as hydrogen technologies were not a target but a way to reach the Thematic Priorities’ goals.
Figure 2.5.1.1a displays the allocation of E.U. funding for RD&D projects in the field of hydrogen and fuel cells during the period 1999-2001.
119

Figure 2.5.1.1a: E.U. funding for RD&D projects in the field of hydrogen (handling and storage)
and fuel cells during the period 1998-2002 The biggest share of funding was for low temperature fuel cells. Projects on hydrogen got 34% of the total funding, with emphasis on the research of better reforming technologies and on field tests. PEMFCs and hydrogen accounted together for 60% of the total funding. The clean transportation objective was favored with twice as much money as the stationary applications.
Figure 2.5.1.1.b: number of projects on fuel cell technologies funded by the E.U and budgets technologies and hydrogen projects, in the period 1995-2001 with the funding for these
projects.
It is estimated that equal amounts of funding were provided by the individual governments of the member countries of the European Union.
The 6th Framework Programme (FP6) (2003-2006)
The overall program has an overall budget of 16.3 G€ (16.3 billion €). Fuel cell and hydrogen technologies are much more emphasized than previously. The Commission has announced plans to spend 2.12 billion € for research on fuel cells, hydrogen and renewable energy, compared to 120 million € in the past program. This time, hydrogen is specifically mentioned as one of the thematic priorities with the declared ambition of a world leadership for Europe in the area (§2.2.1.2). The funding has been split between the EU’DG Research (medium and long term) and the DG TREN (Directorate-General for Energy and Transport, short and medium term, ).
120

Unfortunately the choice of the specific projects that the Commission will decide to fund in 2003 was not made at the time the present report was written. That information should be available before the World Gas Conference 2003 in Tokyo and will be presented there at the hydrogen roundtable.
Hydrogen projects in Europe
Hydrogen projects were initiated early in Europe and particularly in Germany and France (1975). The driving force was energy security and self-sufficiency, with the anticipated future shortage of fossil fuels, including natural gas. France had a large national program aimed at replacing natural gas with hydrogen produced from water electrolysis with power from nuclear energy. That motivation was also present in one of the early and most ambitious projects on hydrogen energy: the Euro-Quebec-Hydro-Hydrogen Pilot Project. Subsequently, the environmental concern became the main motivation for hydrogen till the September 11 events focused again the attention to the energy supply security benefits Now, that motivation accompanies the concerns for local pollution from vehicles in urban areas and for climate change (greenhouse effect).
Another driver is the wish to prepare the European industry for the production of the components for hydrogen energy systems. The European car industry has shown great interest in hydrogen technologies and has pioneered several development and demonstration projects, particularly in Germany.
Short-term as well as long-term projects, from academic research to demonstrations projects, have been launched. LBST on its HyNet web site was listing more than 533 projects on January 13, 2003. We mention here a few significant projects.
HYNET : European information network on hydrogen, coordinated by Norsk Hydro/LBST. •
• CUTE: operation of 27 Citaro type DaimlerChrysler fuel cell buses with on board pressurized hydrogen, in 9 European cities (8 countries) from 2003 on. Daimler-Chrysler will deliver 27 hydrogen fuel cell buses to European bus operators, which will be the first commercially sold fuel cell buses. They will be operated in Amsterdam, Madrid, Barcelona, Hamburg, London, Luxemburg, Porto, Stockholm, Stuttgart and Reykjavik. EvoBus, a Daimler-Chrysler subsidiary, will provide the cities with technical consulting and on-the-spot maintenance. During this period the partners will jointly accumulate and evaluate their experiences and technical findings related to bus operation and the hydrogen infrastructure. This first collation of data based on a whole fleet of buses will be utilized for the further development of fuel cell technology and infrastructure, in the light of potential future series production. The buses will have eight compressed hydrogen gas tanks and a fuel cell system located on the roof. The low-floor buses will be 12 meters long, designed to transport up to 70 passengers. They will have an operating range of about 250 kilometers and a maximum operating speed of 80 km per hour. The fuel cell units will be supplied by Ballard. The price will be about US$ 1.2 million per bus, which includes an extensive two-year service package. The participating bus operators have to provide the hydrogen refueling sites. They will receive financial support from the European Union (18.5 M€ for a total project cost of 52 M€).
FC bus (MAN) in Berlin, Lisbon and Copenhagen. The project is performed at a pan-European level, by several European manufacturers and public transport operators, with co-financing from the program for non-nuclear energy - JOULE/THERMIE/ENERGIE- of the European Commission’s DG TREN. It aims at demonstrating the first European implementation of a fuel cell bus using liquid hydrogen for urban transportation.
•
•
•
•
•
ECTOS: Daimler Chrysler fuel cell busses in Reykjavík, Iceland
EIHP I & II: development of standards and safety guidelines for hydrogen vehicles and infrastructure. In 1998 EU funding was secured for the 10-partner project EIHP I. The EIHP II project (to be completed early in 2004), has an expanded partnership of 20, including North American based companies and 5 vehicle manufacturers. The project now extends to refuelling infrastructure and the vehicle interface.
FUSCHIA, HYMOSSES, HYSTORY: hydrogen storage in metal hydrides and carbon nano-structures
SAPHYS: Stand-Alone Small Size Photovoltaic Hydrogen Energy System
121

USHER25: Urban Solar Hydrogen Economy Realisation Project. PV-hydrogen demonstrations in Cambridge, UK and Gotland, Sweden.
•
• CITYCELL: operation of 4 buses designed and manufactured by Irisbus/Iveco (Italy), The Buses should run in Turin, Madrid, Berlin and Paris for one year. The electric powertrain will be supplied by a hybrid system with hydrogen fuel cell and batteries. The fuel cells for the first vehicles will be provided by UTC. Different models of buses will be demonstrated: Irisbus Cityclass in Turin and Madrid; Renault Cristalis in Paris and Renault Civis in Berlin.
The level of government funded research on hydrogen and fuel cells in Europe varies greatly from country to country, both because of the involvement of their own industrial players and because of other factors such as the situation with regard to the Kyoto commitments and the specific energy situation and energy policies. The amount of R&D money invested by the various European governments was estimated to be around 200 M€ in 2001. Germany is the biggest player (100 M€), followed by France (37 M€). The 2.1 billion € promised for the 6th FP (2003-2006) should provide a real boost to the hydrogen R&D in Europe.
122

The level of Industrial spending was two or three times that of government funded research, before the announcement concerning the 6th Framework Programme.
Hydrogen associations
The European Hydrogen Association (EHA), founded in 2000, federates national associations - France (AFH2), Germany (DWV), Norway (Norsk Hydrogen Forum), Sweden (H2 forum) Netherlands, Spain, Greece - EHA’s missions are i) collect information and identify opportunities to be circulated between its members, ii) represent the interests of the hydrogen energy industry in the public bodies of Europe, especially in the field of laws, standards and regulations, iii) provide expertise and iiii) promote education, dissemination and training.
There also two fuel cell European associations: the European Fuel Cell Users Group and the European Fuel Cell Group, which are concerned with hydrogen technologies.
2.5.1.2 Austria
Austria was one of the pioneers of the development of fuel cells in Europe. In the 1970s, K. Kordesch, at the University of Graz, constructed a vehicle equipped with an alkaline fuel cell, operating with hydrogen stored at 150 bar. Presently, hydrogen and fuel cell activities seem to have slowed down.
Public players: Technische Universität Wien, TU Graz-Inst. für Chemische, Int. Institute for Applied Systems Analysis.
2.5.1.3 Denmark
The Danish Energy Agency established a specific hydrogen energy program in 1998. Hydrogen is viewed, in particular as a storage medium that would permit to deal with the fluctuations in wind power production and demand. Denmark gets 12% of its electricity from wind power and plans to get 50% by 2030.
Research in Hydrogen-related technologies such as fuel cells has been ongoing for 20 years, also managed by the Danish Energy Agency. The utilization of hydrogen as a vehicle fuel is particularly targeted. Besides the already mentioned FC bus (MAN) project in Berlin, Lisbon and Copenhagen (§2.5.1.1), there is one project concerning the demonstration of a FIAT passenger car with a De Nora PEM fuel cell.
2.5.1.4 Finland
The energy policy of Finland – one of the biggest European per capita consumers of electricity – is based on the availability of low cost electricity. Consequently, Finland recently decided to reactivate its nuclear program and limit its financial commitments regarding alternative energy sources, which are more expensive..
Since 1989 solar hydrogen systems have been studied at the Helsinki University of Technology: construction of a 1-2kW pilot plant and development of a numerical simulation program H2PHOTO for system sizing and optimization.
Fortum Oy, a major international energy company evaluated an H Power residential cogeneration fuel cell unit in a test house located in Äetsä. The unit was fueled by hydrogen and was intended to supply all the electricity and heat needed by a typical household. In addition to Fortum, several other Finnish companies are participating in the project.
2.5.1.5 France
Since the mid-nineties, France has launched a program on renewable energies and new energy technologies, including hydrogen and fuel cells. There is a public financial commitment (37 M€/year) for several years26, via a dedicated network (PACo27 network) on hydrogen and fuel cells. New industrial ventures such as Aréva/Hélion (PEMFCs) and Air Liquide/Axane have taken advantage of that support.
Public players: Commissariat à l’Energie Atomique (CEA), Centre National de la Recherche Scientifique (CNRS), INERIS (safety, security), AFNOR (standardization) and IFP (Institut Français du Pétrole)
123

Industrial players: Air Liquide, Alstom Transport, EDF, Gaz de France, Peugeot-Citroën, Renault, TotalFinaElf, Snecma, Areva, Helion (manufacturer of fuel cells), CNIM. The investment was around 35 M€ in 2001.
France will organize the first "European Hydrogen Energy Conference" in September 2003 in Grenoble and the 16th World Hydrogen Energy Conference in June 2006 in Lyon.
Germany
Germany is the most active European country in the hydrogen and fuel cell area with the strong involvements of both public authorities and industry. What also distinguishes Germany from other European countries is the autonomy of the Lander, which enables them to conduct their own energy policy to a limited extent.
Industrial players:
DaimlerChrysler has been active in hydrogen fuel technologies for the past 20years and has decided to invest 1600 M€ in the 2001-2004 period. It conducts demonstrations all over the world.
•
•
•
BMW had plans to build 2000 dual fuel (liquid hydrogen/gasoline) cars by 2004.
Other players : Opel and Ford, Siemens-Westinghouse (SOFCs), HEW/HGW (PAFCs), MTU (MCFCs), Vaillant/Plug Power (PEMFCs), Proton Motor (PEMFC buses), Linde, Messer, RWE, Ballard Power Systems AG, etc.
Projects
Hamburg Hydrogen Fleet W.E.I.T (IEA PDF 312 KB) •
Hydrogen-Fueled Buses: The Bavarian Fuel Cell Bus Project (IEA PDF 277 KB) •
LH2-Fueled Cogeneration Unit with Fuel Cells (PDF 151 KB) •
Phoebus Jülich Demonstration Plant (PDF 306 KB) •
Bavarian Fuel cell bus project: http://www.eren.doe.gov/hydrogen/iea/pdfs/bavarian_proj.pdf
•
Solar-Wasserstoff-Bayern Hydrogen Demonstration Project at Neunburg Vorm Wald, (PDF 927 KB)
•
Hysolar I and II: The 10 kW PV-electrolysis test facility was erected by DLR (German Aerospace Research Establishment) on the university campus in Stuttgart during Phase I of the HYSOLAR project. It was the first complete plant for solar hydrogen production in a technical scale in Germany. Hysolar II: 350 kW Demonstration Plant (KACST/DLR). The objectives of this task were the design, installation and safe experimental operation of a directly coupled 350 kW concentrated photovoltaic, advanced electrolysis system with compressed hydrogen storage. The plant was installed in the Kingdom of Saudi Arabia at the Solar Village of the King Abdulaziz City for Science and Technology (KACST) research site, about 50 km north of Riyadh. The project is now completed.
•
•
•
•
Self-Sufficient Solar House (Fraunhofer ISE, Freiburg). Completed
TES (Transport Energy Strategy). The Transport Energy Strategy (TES) is an initiative launched by the vehicle manufacturers BMW, DaimlerChrysler, General Motors Europe (Opel), MAN and Volkswagen and the energy suppliers ARAL, BP, RWE, Shell and Total FinaElf, supported by the Federal Government, with the Federal Ministry of Transport, Building and Housing acting as central coordinator. The objective is to decide before 2005 on the fuel of the future for transport: three fuels are still in the running (hydrogen, methanol and natural gas), but hydrogen seems to be increasingly favored.
The Clean Energy Partnership Berlin (CEP), created in June 2002, could be considered as the European equivalent of the California Fuel Cell Partnership. It is supported by the German Federal Government and involves nine companies among which BMW, DaimlerChrysler, Ford, Opel, MAN, Linde. Up to 30 buses could be tested in several
124

hydrogen filling stations. The Berlin's urban transit agency BVG dedicated its first hydrogen fueling station with its French partner TotalFinaElf in 2001.
Fairs: the “Hydrogen and Fuel Cells Group Exhibit” part of the Hanover Industrial Fair is now a worldwide event with hydrogen and fuel cell exhibitors from several continents. The 8th exhibit was an unprecedented success with nearly 100 exhibitors. Hamburg, Stuttgart and Cologne also hold exhibits on hydrogen and fuel cells.
Association : German Hydrogen Association (DWV)
2.5.1.7 Greece
Greece does not have any specific "hydrogen and fuel cells" structure or program. There is however a desire to perform R&D in universities within the framework of European programs. Athens with its large CNG bus fleet may be a ground for hydrogen bus demonstrations. Also, there are also many islands in Greece and a will to install hydrogen based self sufficient energy systems with locally available renewable energies such as wind energy.
Association: the "Hellenic Hydrogen Association"
2.5.1.8 Iceland
Iceland is the first country in the world with plans to abandon petroleum and switch to an economy based on hydrogen, both on land and on sea (12 000 boats), with the objective to cut all petroleum imports by 2030. Iceland is said to have geothermal energy equivalent to 100 nuclear power stations and enough hydroelectric power to provide the equivalent of 15 nuclear power stations. These resources will provide the power to produce hydrogen through water electrolysis.
With this objective, the "Icelandic Hydrogen and Fuel Cell Company" was created in 1999 with foreign partners (DaimlerChrysler, Norsk Hydro, Shell). Other partners are now associated with the project: Exxon, BP, TotalFinaElf, Ford, Renault, PSA, Toyota, BMW, Honda, Nissan, GM and the European Union (4 M€ in the 5th Framework Program) The plan is to replace the public buses with fuel-cell buses, persuade the population to buy fuel-cell cars, and develop fuel-cell technology to power fishing trawlers. The first phase of the plan is a $50 million project to replace the Reykjavík Municipal Bus Service's 100 buses with hydrogen fuel-cell buses.
Figure 2.5.1.8: forthcoming hydrogen filling station in Iceland (Norsk Hydro document)
2.5.1.9 Italy
Italy is one of the most active European countries in the hydrogen and fuel cell field. Besides industrial players, it has national fuel cell and hydrogen programs coordinated by ENEA -Italian National Agency for New Technologies, Energy and the Environment-.
From 1990-1994, the Italian government invested ~$22 million in fuel cell R&D, largely on phosphoric acid fuel cell (PAFC) technology to build the Milan 1.3 MW fuel cell power plant. It is the largest in Europe. The plant runs on natural gas. The PAFC program has declined since then.
Since 1994, the Italian fuel cell program has concentrated primarily on developing two types of fuel cells: MCFC and PEM. The program for 2000-2004 involves close cooperation between
125

government, and the fuel cell, automobile and oil industries with the objective of developing a fuel cell vehicle by 2004. The goal for 2005-2009 will be to commercialize this vehicle. The budget request for 2000-2004 is approximately $108.5 million.
Public players : public R&D is supported by: the Ministry of Education, University and Research, Ministry of Environment. The players are: CNR (National Research Council), ENEA, Universities of Pisa, Cassino and Turin.
Industrial players : Ansaldo Fuel Cells, Nuvera, Fiat, Iveco, Sapio, Sol, Aprilia. The personnel resources allocated come to 100 man years, or around 15 M€/year. Work on public acceptability has taken the form of a few demonstrations, such as the Citybus project in Torino.
Projects:
Milan: hydrogen and fuel cell activities are carried out around the old 1.3 MW PAFC plant. An agreement has been signed with the municipality of Hamburg (Germany), which will act as a consultant for safety matters and for hydrogen distribution technologies.
Torino/2006 Winter Olympics28 A project supported by the Ministry of the Environment is promoting hydrogen fuelled buses on the occasion of the Olympics.
An all-Italian pool of companies and scientific institutes (Irisbus-Iveco, Centro Ricerche Fiat, ENEA, Cva and Ansaldo research), coordinated by the Ministry of the Environment and in conjunction with the urban transportation authorities of the city of Torino and Sapio, has built a hydrogen fuelled bus which will be tested in Torino and be ready for entry into service in any Italian city by 2005. Track tests began in January 2002 and have registered almost 5000 km. The bus is a regular Cityclass Iveco-Irisbus vehicle which has been available in diesel and natural gas versions for several years. It is 11 meters long, 2 meters wide and carries a maximum of 73 passengers.
The hydrogen-fuelled bus has a range of approximately 200 km on 18-20 kg of hydrogen. It takes about 15 minutes to fill up the tank. To ensure the best environmental performance, hydrogen will probably be produced by electrolysis. Having perfected the version for road vehicles, the Ministry of the Environment intends to apply the system, following suitable adjustments, to locomotives, which would be very beneficial for use on non-electrified mountain lines where the environmental impact of diesel locomotives is very damaging.
Association: Italian Hydrogen Forum (IIF). The hydrogen International Symposium HYPOTHESIS V, will take place on September 7-10, 2003 at Porto Conte.
2.5.1.10 Netherlands
The present Dutch energy supply is split between natural gas (49%), oil (35%), coal (10%), and a mix of various other resources, which include nuclear, biomass, wind and solar energies (6%).
In the Netherlands, the national policy does consider hydrogen as a potential energy carrier, with specific features compared to hydrocarbons and coal. When hydrogen energy projects can contribute to national targets, subsidies or tax reductions are available. The main targets are the reduction of noxious and CO2 emissions and the increase in energy efficiency. Electricity from renewable sources -solar and wind- is not expected to reach the critical level above which grid performance would be disturbed, before several years. Therefore, hydrogen is not yet considered necessary for solving that potential problem. Consequently, there is no specific national program for hydrogen but numerous hydrogen energy activities exist which are part of the programs of the different ministries:
The Ministry of Economic Affairs (EZ) stimulates energy savings and CO2 reduction through the introduction of hydrogen rich fuels, hydrogen and renewable sources (wind and solar). This ministry no longer undertakes technology push activities, but rather facilitates market driven initiatives.
•
•
•
The Ministry of Housing, Spatial Planning and the Environment (VROM) encourages the reduction of NOx, SO2 and CO2 emissions, and promotes hydrogen as one of solution to the environmental problems. VROM sets limits for the allowed emissions of polluting species and orientates the market in the desired direction.
The Ministry of Education and Science (O&W) stimulates university research on energy related items and, in that framework, also hydrogen applications. Mainly, long-term objectives are studied such as hydrogen for fuel cells, hydrogen replacing natural gas and hydrogen as a
126

storable energy for wind turbines and solar PV.
The three ministries –EZ, VROM, O&W- together stimulate research institutes and industry to set up joint projects for a sustainable future. (Program EET - Energy, Ecology and Technology). Both EZ and VROM are studying the future energy supply and infrastructure development up to 2050. Hydrogen is incorporated in those studies, in particular, because a considerable degree of penetration of fuel cells in mobile and stationary applications is expected. Precise long term targets for renewable energy from solar and wind are not yet determined.
The national gas grid is operated by the Dutch Gas Transportation Company (Gastransport Services, a subsidiary of Gasunie). The yearly natural gas production is about 80 GNm3 (50% exported).
Two international merchant gas companies, Hoek Loos and Air Products, are active in hydrogen. Their strategy is focused on the production, storage and distribution of hydrogen. Therefore, they have a good knowledge of the complete chain, including renewable sources for producing hydrogen and the use of hydrogen, including in fuel cells.
As the Netherlands does not have a specific national "hydrogen" program, hydrogen related projects are subsidized through technology oriented, generic stimulation programs. These include, for instance, the different technology programs managed by Novem29 (Netherlands Agency for Energy and Environment). Furthermore, subsidies can be obtained from the programs managed by Senter30 and the SME stimulating development program of EET31, managed by both Novem and Senter. These programs are usually oriented towards implementation. Current examples of Novem programs include studies on liquid and gaseous energy carriers (GAVE), renewable energy (DEN-program), new energy technologies (NEO-program), clean and silent transportation (SSZ-program).
A large EET-sponsored project on pathways for the future has just started: “Greening of gas”. The main objective of this project is to study the possibilities of mixing hydrogen with natural gas in the transition period before renewables.
A new program is about to start called the Sustainable Hydrogen Program, which is managed by NWO32. The initial funding (4.5 M€) is provided by industry. The amount will be matched by the Ministry of Economic Affairs and internal funds of Universities. The total budget for the next years will be 18 M€.
In addition, the University of Delft enters the first phase of its interfaculty DIOC project on renewable hydrogen. This project is expected to grow and involves both fundamental research and technical and societal aspects.
Public players
ECN33 (Energy research Center of the Netherlands) has been the main Dutch player in fuel cells research (components and systems) -PEMFCs (1-20 kW) and SOFCs- since 1985. Hydrogen technologies became part of the activities. Currently, the institute has”Hydrogen Technologies & Applied Catalysis Group”, which studies the processing of fuels -hydrocarbons and methanol- for the production of hydrogen. Energy systems and infrastructure studies are also in progress. The total effort is estimated to approach 5 M€/year. The European co-funded Fresco Project (fuel cell scooter) project is in progress. The fuel cell developments are quite extensive: after 15 years of R&D on the National Fuel Cell Program, high skills and know how have been gathered. The estimated effort on fuel cells is in the order of 10 M€/year.
TNO, GASTEC and Kema- are active on several aspects of hydrogen technology, both experimentally and through studies. Universities also appear very keen to take part in the developments. In this way, a variety of subjects and methods to study can be addressed in a complementary fashion.
Hydrogen Demonstrations
European CUTE hydrogen/fuel cell bus project in Amsterdam. The project has started. It concentrates on hydrogen production, handling and public acceptance.
•
127

Addition of a few percents hydrogen in the natural gas grid (under consideration). The hydrogen would come from an ammonia plant with currently oversized H2 plants. The project could help the Netherlands meet its CO2 emission reduction target, as the CO2 emitted by the hydrogen reformers is utilized and would not be included in the emission tally.
•
• Some projects are considered which will demonstrate combinations of renewable energy, hydrogen and fuel cells. One of these may be the complete energy system of an island (Vlieland) in the Estuary Sea.
The energy industry shows an increasing interest. Shell appears as a major advocate of hydrogen, both in the Netherlands and internationally through its Shell Hydrogen subsidiary. Gasunie is active in aspects related to the transportation and utilizations -combustion characteristics, burners and industrial processes. Their motivation stems from their expectation that hydrogen may change their business.
The present hydrogen situation in The Netherlands
As in other countries, hydrogen in the Netherlands is divided into two markets: captive and merchant. Captive producers are the refining and petrochemical industries.
The merchant market is covered by the industrial gas suppliers. Hoek Loos (Linde) and Air Products get their hydrogen from an SMR plant owned by Air Products. The loading station for hydrogen tube trailers is a joint venture of the two companies. The total merchant market in The Netherlands amounts to approximately 14 million Nm3/year. The captive market is approximately 50-100 times larger.
Hoek Loos also operates electrolyzers on the premises of large users of hydrogen. For example, one plant is located at the Royal Glass Factory in Leerdam (NL), where oxygen is also produced
Association: the "Dutch Hydrogen Association"34 has been founded in 2001. The benefits are already apparent with respect to national contacts. International contacts exist also through the IEA- Hydrogen Implementing Agreement and EC projects (e.g., HyNet and HySociety).
2.5.1.11 Norway
Norway occupies a unique position on the European Energy scene. With a small population of only 4.5 million people, Norway has the largest energy resources in Europe, next to Russia. Norway's yearly production is 165 million tons of oil, 46 Mtoe of natural gas (99% exported) and around 120 TWh (10,3 Mtoe) of hydroelectric power. Norway produces around 12-14 times its total energy consumption, and is currently the world's 3rd largest oil exporter.
Close to 100% of the electricity demand is covered by hydropower in years with normal precipitation. In recent years, however, an imbalance in generation of new capacity and demand has altered the situation. From being a net exporter, Norway is now a net importer of electricity. Public opinion influenced by environmental groups has virtually brought the development of the remainder of the hydropower resources to a standstill.
This has turned the focus towards wind power35. Norway has extremely good wind resources along a sparsely populated coastline and a total potential of around 12 TWh/year in electricity production from wind resources. The Norwegian industry has examined the feasibility of several concepts associating wind energy and hydrogen for smaller communities, refuelling stations for hydrogen vehicles and larger hydrogen storage systems for wind farms load leveling. The companies involved in these activities are Norsk Hydro, Statkraft SF, ABB, Aker Kværner - Aker Elektro and Statoil. One example is the Utsira-project of Norsk Hydro and Aker Kværner - Aker Elektro, where a wind/hydrogen system is to be installed on the small Utsira island, off the west coast of Norway. A similar project concerns the island of Røst.
Producing hydrogen from renewable sources is the ideal solution but it is currently an expensive solution, furthermore unable presently to provide the necessary hydrogen quantities. Producing hydrogen from natural gas with sequestration of CO2 could be a transition solution that could make up for the electricity deficit and the limited contribution of renewables.
In addition to its gas resources, Norway has access to huge areas suitable for CO2 sequestration in the North Sea. As an oil producer, Norway has the possibility of using CO2 for
128

enhanced oil recovery. Also, it has been estimated that areas with saline aquifers suitable for CO2 sequestration have the capacity to store all of the CO2 from power production in the whole of Western Europe for at least 600 years. The extra cost of the separation and deposition adds around 1-1.5 cents (US) per kWh to the production cost of electricity. The whole Europe could fulfill its Kyoto obligations in this way with the indicated incremental cost.36.
129

A series of projects addressing distribution of natural gas as a hydrogen carrier for domestic hydrogen energy systems have been initiated by the Norwegian industry and R&D institutes. Materials challenges for pipeline distribution of hydrogen are examined.
In the White Paper presented by the Norwegian Ministry for Petroleum and Energy in November 2002 ambitions for a hydrogen future in Norway were outlined.
Several projects on hydrogen as a vehicle fuel are planned. One of them is Bellona 's hydrogen car project, with two hydrogen vehicles (Mercedes Sprinter) and a hydrogen filling station37. Furthermore, SL (Stor-Oslo Lokaltrafikk) has initiated a bus project aiming at putting 125 hydrogen buses into regular operation in Oslo by 2012. This project is a co-operation between Norsk Hydro, Bertel O. Steen and SL. Bertel O. Steen imports Mercedes and SL is the local bus company.
The Government supports research projects and basic research activities on Hydrogen through research programs managed by the Research Council of Norway. The Research Council currently support 29 R&D projects related to hydrogen and fuel cells. Some of the key actors here are the Norwegian University of Technology and Science (NTNU), the Foundation for Scientific and Industrial Research (SINTEF) and IFE (Institute for Energy Technology).
The activity related to hydrogen in Norway has increased substantially over the last 5-10 years, both in industry and at research institutes and universities. Funding of hydrogen related projects from the Norwegian Research Council (NRC) has increased 300% over the last 4 years.
The Labor Party proposed the establishment of a hydrogen fund to be used as an effort to strengthen hydrogen as an alternative fuel. The fund would permit a network of at least 65 hydrogen filling stations to be established in Norway within 2008. This would give the major part of the Norwegian population the opportunity to choose hydrogen automobiles.
Norway participates in international hydrogen programs. Norsk Hydro is the operating agent for the International Energy Agency (IEA) Hydrogen Programme. Norway takes part also in the IEA’s Greenhouse Gas programme, which includes activities related to hydrogen and fuel cells.
Public players: Universities (Oslo, Grimstad), NTNU, SINTEF, IFE. Their total 2001 budget is estimated at 2.5 M€.
Industrial players: Statoil, Statkraft, Norsk Hydro, Aker Kværner - Aker Elektro
Association: Norsk Hydrogen Forum
2.5.1.12 Portugal
Portugal is beginning to take an interest in hydrogen and fuel cell technologies. The EDEN38 project prepares the Action Plan for the Portuguese Hydrogen Society with fuel cells demonstration, pilot and research activities. The 11-member consortium leading the program includes industry, research centers and universities such as the University of Coimbra/Physics Department and the Instituton Superior Tecnico, FEUP/Dept de Engenharia Quimica.
2.5.1.13 Russia
Russia reiterated at the World Summit on Sustainable Development in Johannesburg in August 2002 that it would ratify the Kyoto Protocol. In order for the Protocol to now enter into force, 55 per cent of the developed world’s 1990 emissions must be covered. Ratification by Russia, with over 17 per cent of the emissions, is therefore crucial for the Protocol to come into force.
For economic reasons, it is unclear nevertheless that this commitment will actually help push the hydrogen topic in Russia, despite the long history of hydrogen developments dating back to the old USSR and the space race during the cold war.
Projects included hydrogen fuel road vehicles and the development of a fuel cell bus. There was also collaboration between Russia and Germany on the Cryoplane (LH2-fuelled aircraft). Russia has an impressive number of scientists working on hydrogen technologies but financial constraints are slowing down the developments and field demonstrations.
2.5.1.14 Spain
Since 1988, INTA (the National Institute for Aerospace Technology) has been coordinating hydrogen energy activities through its own funds and subsidies from the regional government of
130

Andalusia. At present, there is no specific hydrogen energy program in Spain. However, the Spanish Plan for Scientific Research, Technological Development and Innovation (2000-2003) contains strategic actions for "alternative fuels" and for the "development of technologies for a safe and competitive use of hydrogen." Additionally, there are strategic actions focused on “more efficient and less polluting energy systems” and "alternative propulsion systems for the transportation sector" in which the development of fuel cell systems and components is planned.
The public and industrial sectors are involved on hydrogen: production, in particular by electrolysis from photovoltaic solar sources, storage, regulations, safety, and fuel cells.
Public players: Ministry of Science and Technology, CSIC (National Council for Scientific Research), INTA, CIEMAT Center for Energy, Environmental & Technological Research), ITC/ITER Technological Institute of Canary Islands), Universities. A budget of approximately 1 M€/year appears to be a realistic figure for 2001.
Industrial players: Utilities): Gas Natural, Gas de Euskadi, Iberdrola, Endesa, Seat, Hispano
Project: INTA Solar Hydrogen Facility
CUTE (European project): demonstration of three hydrogen FC powered Citaro buses in various European cities
•
•
•
•
Barcelona. (Transports de Barcelona, TB). On site hydrogen generation with electrolysis with power partially coming from photo-voltaic panels. BP leads the project for the hydrogen production and supply. Madrid. (Entidad Metropolitana del Transporte, EMT). On site hydrogen production with a compact steam reformer fed with natural gas (50 Nm”/h). Additional and back-up hydrogen is supplied as compressed hydrogen in cylinders. The hydrogen refuelling station is designed and built through a cooperation between Air Liquide, Gas Natural (multi-utility group) and Repsol YPF (oil company). CITYCELL: EMT in Madrid will demonstrate a hybrid battery/FC powered Irisbus vehicle, model Citylass, built in Spain. Buses in projects CUTE and CITYCELLS will be refueled with hydrogen in a common refueling station located in the premises of EMT.
Association: Spanish Hydrogen Association
2.5.1.15 Sweden
There is no national hydrogen program in Sweden. However, minimizing the environmental impacts of fossil fuel utilization and, ultimately, ensuring a transition from fossil to renewable energy sources are important drivers in the country’s overall research and development strategy. The current hydrogen R&D policy in Sweden can be characterized as an active watch of technology development. The implementation of this policy is accomplished by funding research projects and case studies and by participation in international programs. The Swedish Energy Agency supports many of the hydrogen and fuel cells projects.
E.U. CUTE Programme: three buses in Stockholm (hydrogen from water electrolysis) •
•
•
•
H Power’s cogeneration fuel cell (4 kW PEMFC) system demonstration: start-up scheduled June 2002, hydrogen produced from solar and biogas (with solar Naps Systems Oy Company)
EU supported-Cryoplane Project: the Arlanda airport participates in the project.
EU supported USHER39: Urban Solar Hydrogen Economy Realisation Project. PV-hydrogen demonstrations in Cambridge UK and Gotland Sweden. The Swedish Energy Agency (Energimyndigheten) has awarded the municipality of Gotland funding amounting to SEK 8 051 660 for its EU project "Urban Integrated Solar Hydrogen Economy Realisation Project" (USHER). This project will continue until 2005, and the aim of the Swedish element of it will be to create a system powered by solar cells for the production of hydrogen gas in Visby. A similar system will be created in Cambridge in the United Kingdom. The energy from these solar cells will be used to produce hydrogen gas for fuel cell-based bus services and to produce electricity which will be used to supply the public grid. The reason why these projects
131

are taking place in Cambridge and Visby is that these towns both have a historical cultural heritage which has to be preserved. The total budget for the Swedish part of the project amounts to SEK 23.5 million (2.7 Million USD). Part of the project is being run by AGA Gas AB. Research funding allocated to the University of Lund will also be used.
A Hythane® project in Malmoe, to be carried out by Sydgas, with hydrogen produced by electrolysis with wind power
•
• Hydrogen 'Welgas' experiment financed in the town of Harnosand by the Swedish steel industry, SAAB and other firms. In Harnosand, Olaf Tegstrom designed and lived in a house where the electricity came from a small computer-controlled Danish windmill in the garden. The electricity was used to electrolyse filtered water, with hydrogen used for cooking and heating the house and as fuel for a SAAB car.
Industrial players: AB Volvo, Scania, Vattenfall, Sydkraft, Birka Energi, Stockholm energi, ABB, Opcon, Catella Generics, Catator, Morphic, Cellkraft, EKA Chemical, FMV, JM, NCC, Svenska Bostader, Linde.
Association: H2 Forum
2.5.1.16 Switzerland
In the Swiss National Energy Research and Development Program, hydrogen is considered an important future energy carrier as well as an economically important chemical commodity. Consequently, the Swiss authorities support R & D activities for the sustainable production, safe storage and efficient utilization of hydrogen. The main goals of the Swiss program are the production of hydrogen from primary renewable energy sources, and the substitution of fossil fuels by hydrogen in various applications.
there is a national program: the Swiss National Energy Research Program , financed by the Swiss Federal Office of Energy, with a program line on hydrogen (The Swiss Hydrogen Program), together with programs financed by federal and cantonal research institutes. Coordination has been set up with the Swiss National Science Foundation. The work is centered on the production (via solar energy), storage and use of hydrogen (with fuel cells). The main industrial player on fuel cells is Sulzer-Hexis, known for the development of a 1 kW SOFC flat technology stationary fuel cell, HXS 1000.
Association: Hydropole was created in 2001
2.5.1.17 Ukraine
A Joint Scientific and Coordinational Council on the Prospects of Transition to Hydrogen Economy” (JSC-Council) has been established. The founders of this action are the International Association for Hydrogen Energy (USA), the International Engineering Academy (Russia), the Engineering Academy of Ukraine, the Donetsk State Technical University and the Donetsk Engineering and Physical Center (Ukraine).
2.5.1.18 United Kingdom
Although major British industrial players have long been active in hydrogen and fuel cells, the British authorities are only now in the process of setting up a very ambitious program on hydrogen. The government announced in December 2001 the "Green Fuel Challenge", including hydrogen infrastructures for buses (starting in 2002).
Public players: Colleges and universities, such as Imperial College and Loughborough University. The Greater London Authority which announced (May 2002) the formation of a body called The Hydrogen Partnership to investigate the benefits of and uses for fuel cell technology in London. It includes BP, Evobus, BMW, Ford, DaimlerChrysler, Merril Lynch, British Gas, the Energy Saving Trust and the Environment Agency.
Industrial players : Johnson Matthey, B.P., Alstom, Enertech Ltd, Zero-M, CJB Developments Limited. Intelligent Energy.
Projects
Hydrogen Generation from Stand-Alone Wind-Powered Electrolysis Systems •
132

EU supported USHER40: -Urban Solar Hydrogen Economy Realisation- PV-hydrogen demonstrations in Cambridge, UK and Gotland, Sweden.
•
Association: H2 Net
2.5.1.19 Yugoslavia
The Yugoslav Association for Hydrogen Energy41 was established in April 2000, under the umbrella of the Yugoslav Association of Chemical Engineering.
2.5.2 America 2.5.2.1 Argentina
Argentina has two isolated regions in the country that could use renewable energy –wind power- and hydrogen. There are two million people in the country that could use remote power. Project descriptions can be found in the proceedings of the 12th World Hydrogen Energy Conference, 21-26 June 1998, Buenos Aires.
Association: Asociación Argentina del Hidrogenó
2.5.2.2 Brazil
In Brazil, 92% of electricity generation is from hydropower. There is enough surplus overnight electric power capacity in the São Paulo Metropolitan Region to fuel 12,000 buses. There is already substantial experience of refuelling with high-pressure gaseous fuel, through the fleet of over 300 CNG buses in São Paulo. The situation is therefore favorable for hydrogen as an energy carrier and the market is large as more buses are produced in Brazil than in any other country in the world.
In December 1993, an agreement was established between the Ministry of Mines and Energy (MME), the Electrical Company of São Paulo (CESP), the Metropolitan Urban Transport Company (EMTU/SP) and the University of São Paulo (USP), for the development of a pilot project for the production of electrolytic hydrogen to be used as a vehicle fuel for urban buses.
In 1994, the project Environmental Strategy for Energy: Hydrogen Fuel Cell Buses for Brazil was launched, implemented by the National Department of Water and Electrical Energy, linked to the Ministry of Mines and Energy, with resources from the Global Environment Facility (GEF)/United Nations Development Program (UNDP).
The Project was to be developed in two phases. Phase I, which was a study phase to verify the viability of the project has been completed. Phase II has been the object of another proposal to GEF.
Phase II is predicted to begin in year 2003, with the operation of fuel cell buses. Other states, along with São Paulo, have shown an interest in participating in the project, such as Minas Gerais, Rio de Janeiro, Paraná and Bahia. However, the plans are to concentrate 9 buses to run in a transport corridor in São Paulo. The expectations are that Phase II will last 4 years. Ballard (Canada) and Daimler-Benz (Germany) are involved. The project in Brazil is part of a large international project subsidzed by UNDP/GEF (§2.5.4).
In an independent study42, the Hydrogen demand in 2020 for Brazil has been estimated by the Hydrogen Laboratory –COPPE/UFRJ and the International Virtual Institute of Global Change to reach 900,000t/y in 2020, i.e; slightly less than 3% of the 80 Mtoe that the vehicle market will need in 2020, considering that the Brazilian fleet will double between 2000 and 2020. This demand will be satisfied by both natural gas and renewable energies (sugar cane bagasse gasification and hydropower). The share of renewable energies will remain at least as high as currently (60%) but the higher efficiency of hydrogen conversion technologies will limit the CO2 emissions.
2.5.2.3 Canada
Canada has become a world leader in the development of hydrogen energy technologies. The Canadian Hydrogen Energy Industry is involved in virtually all fields, including fuel cells, fuel cell systems, electrolysers, fuelling stations, storage technologies (compression and sorption storage) and safety assessments. According to Fuel Cell Canada (The Canadian Fuel Cell Industry, a Capabilities Guide; Fuel Cells Canada, June 2002), there are 13 companies focusing on fuel cell production or system integration, and 28 other firms and organisations heavily involved in the hydrogen and fuel cell industry. They contributed about 275 million dollars per year to the economy, employing about 1800
133
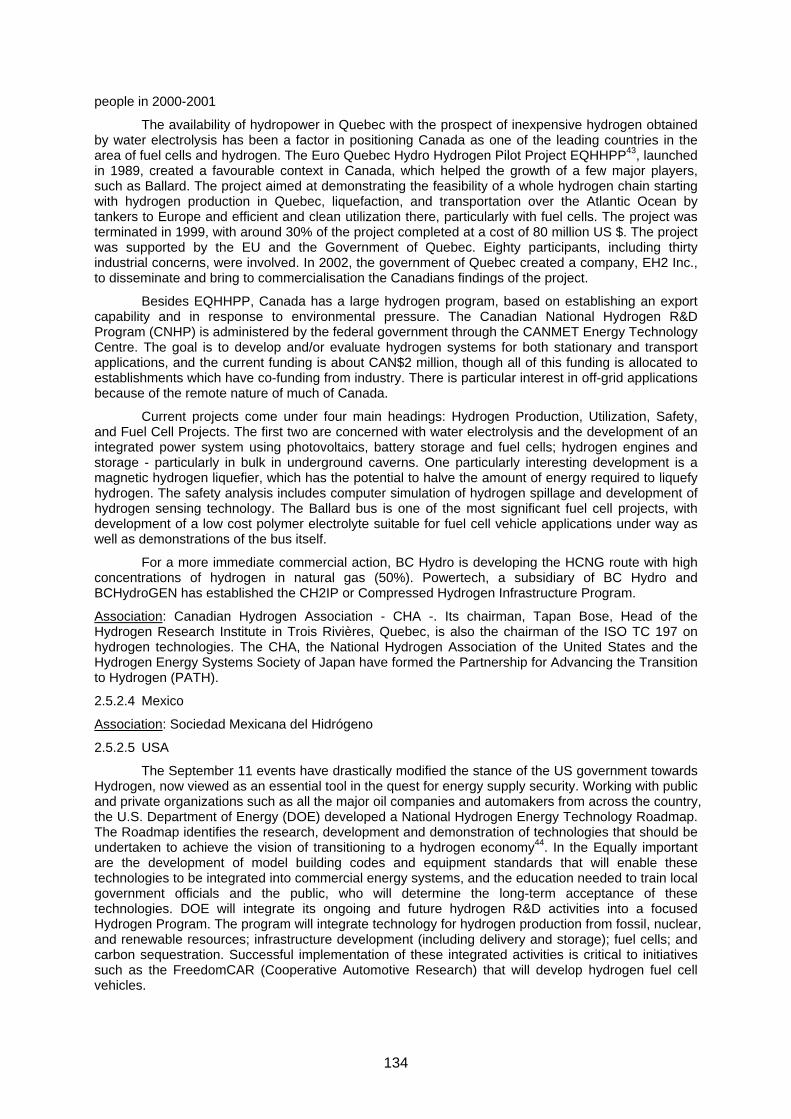
people in 2000-2001
The availability of hydropower in Quebec with the prospect of inexpensive hydrogen obtained by water electrolysis has been a factor in positioning Canada as one of the leading countries in the area of fuel cells and hydrogen. The Euro Quebec Hydro Hydrogen Pilot Project EQHHPP43, launched in 1989, created a favourable context in Canada, which helped the growth of a few major players, such as Ballard. The project aimed at demonstrating the feasibility of a whole hydrogen chain starting with hydrogen production in Quebec, liquefaction, and transportation over the Atlantic Ocean by tankers to Europe and efficient and clean utilization there, particularly with fuel cells. The project was terminated in 1999, with around 30% of the project completed at a cost of 80 million US $. The project was supported by the EU and the Government of Quebec. Eighty participants, including thirty industrial concerns, were involved. In 2002, the government of Quebec created a company, EH2 Inc., to disseminate and bring to commercialisation the Canadians findings of the project.
Besides EQHHPP, Canada has a large hydrogen program, based on establishing an export capability and in response to environmental pressure. The Canadian National Hydrogen R&D Program (CNHP) is administered by the federal government through the CANMET Energy Technology Centre. The goal is to develop and/or evaluate hydrogen systems for both stationary and transport applications, and the current funding is about CAN$2 million, though all of this funding is allocated to establishments which have co-funding from industry. There is particular interest in off-grid applications because of the remote nature of much of Canada.
Current projects come under four main headings: Hydrogen Production, Utilization, Safety, and Fuel Cell Projects. The first two are concerned with water electrolysis and the development of an integrated power system using photovoltaics, battery storage and fuel cells; hydrogen engines and storage - particularly in bulk in underground caverns. One particularly interesting development is a magnetic hydrogen liquefier, which has the potential to halve the amount of energy required to liquefy hydrogen. The safety analysis includes computer simulation of hydrogen spillage and development of hydrogen sensing technology. The Ballard bus is one of the most significant fuel cell projects, with development of a low cost polymer electrolyte suitable for fuel cell vehicle applications under way as well as demonstrations of the bus itself.
For a more immediate commercial action, BC Hydro is developing the HCNG route with high concentrations of hydrogen in natural gas (50%). Powertech, a subsidiary of BC Hydro and BCHydroGEN has established the CH2IP or Compressed Hydrogen Infrastructure Program.
Association: Canadian Hydrogen Association - CHA -. Its chairman, Tapan Bose, Head of the Hydrogen Research Institute in Trois Rivières, Quebec, is also the chairman of the ISO TC 197 on hydrogen technologies. The CHA, the National Hydrogen Association of the United States and the Hydrogen Energy Systems Society of Japan have formed the Partnership for Advancing the Transition to Hydrogen (PATH).
2.5.2.4 Mexico
Association: Sociedad Mexicana del Hidrógeno
2.5.2.5 USA
The September 11 events have drastically modified the stance of the US government towards Hydrogen, now viewed as an essential tool in the quest for energy supply security. Working with public and private organizations such as all the major oil companies and automakers from across the country, the U.S. Department of Energy (DOE) developed a National Hydrogen Energy Technology Roadmap. The Roadmap identifies the research, development and demonstration of technologies that should be undertaken to achieve the vision of transitioning to a hydrogen economy44. In the Equally important are the development of model building codes and equipment standards that will enable these technologies to be integrated into commercial energy systems, and the education needed to train local government officials and the public, who will determine the long-term acceptance of these technologies. DOE will integrate its ongoing and future hydrogen R&D activities into a focused Hydrogen Program. The program will integrate technology for hydrogen production from fossil, nuclear, and renewable resources; infrastructure development (including delivery and storage); fuel cells; and carbon sequestration. Successful implementation of these integrated activities is critical to initiatives such as the FreedomCAR (Cooperative Automotive Research) that will develop hydrogen fuel cell vehicles.
134
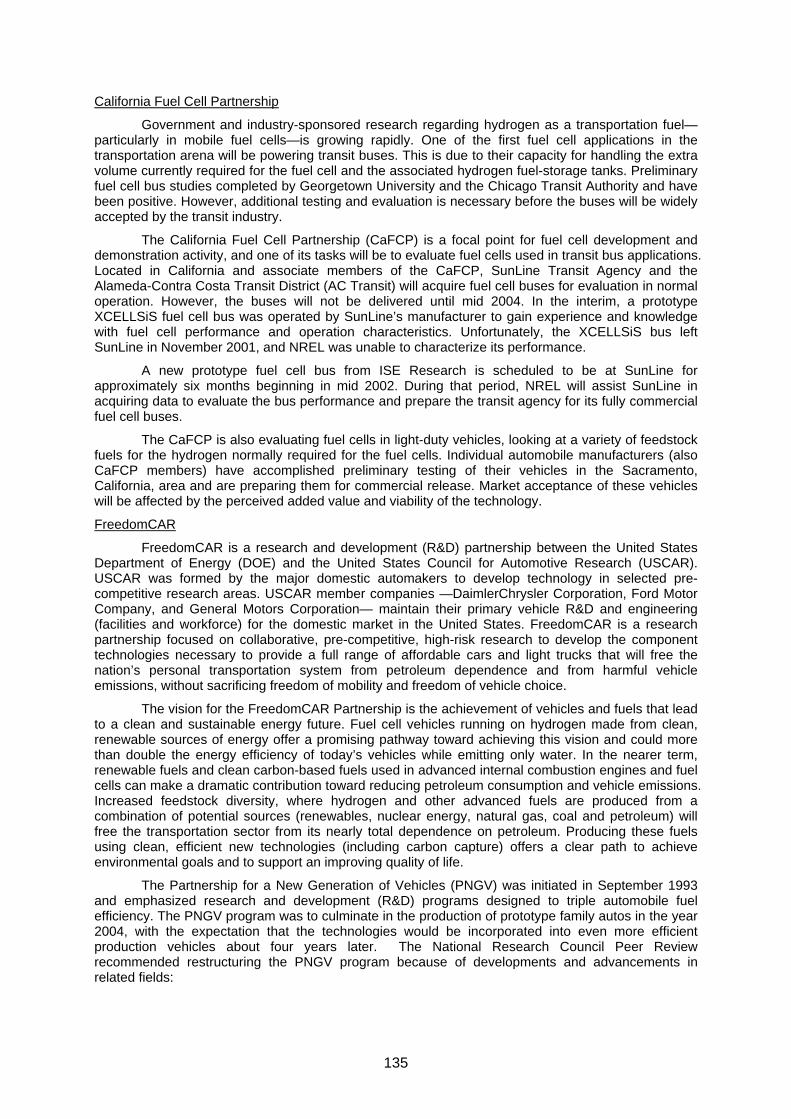
California Fuel Cell Partnership
Government and industry-sponsored research regarding hydrogen as a transportation fuel—particularly in mobile fuel cells—is growing rapidly. One of the first fuel cell applications in the transportation arena will be powering transit buses. This is due to their capacity for handling the extra volume currently required for the fuel cell and the associated hydrogen fuel-storage tanks. Preliminary fuel cell bus studies completed by Georgetown University and the Chicago Transit Authority and have been positive. However, additional testing and evaluation is necessary before the buses will be widely accepted by the transit industry.
The California Fuel Cell Partnership (CaFCP) is a focal point for fuel cell development and demonstration activity, and one of its tasks will be to evaluate fuel cells used in transit bus applications. Located in California and associate members of the CaFCP, SunLine Transit Agency and the Alameda-Contra Costa Transit District (AC Transit) will acquire fuel cell buses for evaluation in normal operation. However, the buses will not be delivered until mid 2004. In the interim, a prototype XCELLSiS fuel cell bus was operated by SunLine’s manufacturer to gain experience and knowledge with fuel cell performance and operation characteristics. Unfortunately, the XCELLSiS bus left SunLine in November 2001, and NREL was unable to characterize its performance.
A new prototype fuel cell bus from ISE Research is scheduled to be at SunLine for approximately six months beginning in mid 2002. During that period, NREL will assist SunLine in acquiring data to evaluate the bus performance and prepare the transit agency for its fully commercial fuel cell buses.
The CaFCP is also evaluating fuel cells in light-duty vehicles, looking at a variety of feedstock fuels for the hydrogen normally required for the fuel cells. Individual automobile manufacturers (also CaFCP members) have accomplished preliminary testing of their vehicles in the Sacramento, California, area and are preparing them for commercial release. Market acceptance of these vehicles will be affected by the perceived added value and viability of the technology.
FreedomCAR
FreedomCAR is a research and development (R&D) partnership between the United States Department of Energy (DOE) and the United States Council for Automotive Research (USCAR). USCAR was formed by the major domestic automakers to develop technology in selected pre-competitive research areas. USCAR member companies —DaimlerChrysler Corporation, Ford Motor Company, and General Motors Corporation— maintain their primary vehicle R&D and engineering (facilities and workforce) for the domestic market in the United States. FreedomCAR is a research partnership focused on collaborative, pre-competitive, high-risk research to develop the component technologies necessary to provide a full range of affordable cars and light trucks that will free the nation’s personal transportation system from petroleum dependence and from harmful vehicle emissions, without sacrificing freedom of mobility and freedom of vehicle choice.
The vision for the FreedomCAR Partnership is the achievement of vehicles and fuels that lead to a clean and sustainable energy future. Fuel cell vehicles running on hydrogen made from clean, renewable sources of energy offer a promising pathway toward achieving this vision and could more than double the energy efficiency of today’s vehicles while emitting only water. In the nearer term, renewable fuels and clean carbon-based fuels used in advanced internal combustion engines and fuel cells can make a dramatic contribution toward reducing petroleum consumption and vehicle emissions. Increased feedstock diversity, where hydrogen and other advanced fuels are produced from a combination of potential sources (renewables, nuclear energy, natural gas, coal and petroleum) will free the transportation sector from its nearly total dependence on petroleum. Producing these fuels using clean, efficient new technologies (including carbon capture) offers a clear path to achieve environmental goals and to support an improving quality of life.
The Partnership for a New Generation of Vehicles (PNGV) was initiated in September 1993 and emphasized research and development (R&D) programs designed to triple automobile fuel efficiency. The PNGV program was to culminate in the production of prototype family autos in the year 2004, with the expectation that the technologies would be incorporated into even more efficient production vehicles about four years later. The National Research Council Peer Review recommended restructuring the PNGV program because of developments and advancements in related fields:
135

Automobile fuel economy is declining as sport utility vehicle (SUV) market share increases. •
•
•
•
•
•
•
•
•
•
•
•
•
Significant R&D progress has been achieved.
Industry partners have announced they will introduce hybrid technology in production vehicles within the next few years.
Other PNGV technologies (e.g., lightweight materials) are being introduced in conventional vehicles.
Substantial programs similar to PNGV are underway around the world.
Full fuel efficiencies associated with PNGV technologies will not be realized in large numbers until breakthroughs render them more cost-competitive.
Re-evaluation is appropriate as PNGV approaches the end of a ten-year project.
In evaluating the PNGV program, DOE and auto industry partners agree that public/private partnerships are the preferred approach to R&D, as highlighted in the President's National Energy Plan, but the cooperative effort must be refocused to
Aim at longer range goals with greater emphasis highway vehicle contributions to energy and environmental concerns
Move to more fundamental R&D at the component and subsystem level
Assure coverage of all light vehicle platforms
Maintain some effort on nearer term technologies that offer early opportunities to save petroleum
Strengthen efforts on technologies applicable to both fuel cell and hybrid approaches (e.g., batteries, electronics, and motors)
The United States Secretary of Energy, Spencer Abraham, and senior executives of DaimlerChrysler, Ford, and General Motors announced the FreedomCAR Partnership on January 9, 2002. FreedomCAR is a research initiative focused on collaborative, pre-competitive, high-risk research to develop the component technologies necessary to provide a full range of affordable cars and light trucks that will help free the US personal transportation system from petroleum dependence and from harmful vehicle emissions, without sacrificing freedom of mobility and freedom of vehicle choice. The United States Department of Energy (DOE) and the United States Council for Automotive Research (USCAR)—representing DaimlerChrysler Corporation, Ford Motor Company, and General Motors Corporation—are the Partners in the initiative.
136

Fuels 5,6 million
4%
H2 25,8 million
17%
Fuel cells 50 million
34%
Hybrid vehicle 38,5 million
26%
Adv. IC engines
14,1 million9%
Electric vehicles
3,5 million2%
Automotive R&D CARAT
2 million1%
Materials 10,8 million
7%
Today, the United States use 26% of the world’s oil but produce only 9% of the total global supply and has only 2% of the world’s conventional petroleum reserves. Unless the United States are successful in energy efficiency efforts and utilizing more diverse resource feedstocks, its dependence on imported oil is expected to grow because of higher consumption and declines in domestic production. The long-term vision for the FreedomCAR Partnership is the achievement of vehicles and fuels that lead to a clean and sustainable energy future. While no single strategy will free the United States from petroleum dependency in the near term, it is apparent that addressing energy use in the transportation sector is particularly critical. The transportation sector consumes two-thirds of all the petroleum used in the USA and is almost completely dependent upon petroleum as its energy source. Therefore, the FreedomCAR Partnership gives the United States an historic opportunity to develop technologies that could lead to a personal transportation system that uses renewable energy resources and produces minimal criteria or net carbon emissions on a life cycle or well-to-wheel basis. Fuel cell vehicles running on renewable hydrogen offer a promising path toward achieving this vision. Success will establish the United States as a global leader in environmental and energy technologies and will be a key to ensuring future U.S. competitiveness.
The US auto makers are advancing the topic rapidly.
GM unveiled its hydrogen fuel cell prototype car at the October 2002 Paris auto show.
Figure 2.2.4.b: the GM Hy-wire hydrogen/fuel cell car
The fuel-cell propulsion system is the same GM system designed for the HydroGen3 concept, which is based on an Opel Zafira. Three cylindrical storage tanks compress hydrogen at a pressure of 35 MPa (that's 350 atmospheres) to supply the 94-kilowatt fuel stack. The generated electricity is then used to power a 60-kilowatt electric motor that drives the front wheels. GM says that with 70 MPa hydrogen tanks currently under development, the Hy-wire could have a range of 300 miles
The Hy-wire was a product of global cooperation. GM engineers in the United States
137

developed the chassis and body design. Engineers at GM's research facility in Germany integrated the fuel-cell propulsion system, while SKF Group, headquartered in Sweden, developed the by-wire technology in the Netherlands and Italy.
In 1997, Ford scientists built the P2000 fuel cell car, which still holds the record of traveling 1391 miles in a 24 hour period. By the end of 2003, there should be five Generation 3 modular integrated design Ford Focus vehicles operating on California roads.
The Generation 3 Focus fuel cell vehicle is a hybrid vehicle. Rather than getting all its power directly from the fuel cell, it uses a battery pack. The battery pack is a module containing 180 rechargeable "D" cell batteries (the production capabilities for this size already exist) producing a nominal 315 volts. Regenerative braking is used to help recharge the battery pack during deceleration.
Fuel cells don't accelerate as fast as battery powered vehicles, so using a hybrid design enables reasonable performance in a zero emissions vehicle. Ford specs list the Focus's performance as 260 to 320 km driving range, and a top speed of 128+ kph. The powertrain produces 87 horsepower and an impressive 170 ft-lb. torque.
Besides actions at the federal government level, there are initiatives at the state level. The involvement of Califonia through the California Fuel Cell Partnership is well known but projects exist as well in other states.
The state of Ohio is investing $6.8 million for the first of four proposed public hydrogen fueling stations. The first station will open in Cleveland in about two years. The station will have three fuel pumps each for hydrogen and compressed natural gas, already used by buses and cars. Other hydrogen stations are planned for Cincinnati, Columbus and Toledo. The project complements Gov. Bob Taft’s $100 million, three-year fuel cell initiative launched in May 2002. Ohio sees the fueling stations as a critical first step toward a hydrogen infrastructure.
Texas is taking action with stationary and portable applications through the newly formed Texas Fuel Cell Alliance. Florida has launched a hydrogen business council to increase awareness and initiate hydrogen projects, building on NASA’s longstanding commitment to hydrogen
In California, the first hydrogen fueling station of the San Francisco area opened in Richmond in October 2002. The station also serves as the California Fuel Cell Partnership’s (CaFCP) first satellite station. This AC Transit bus facility is about 70 miles from the CaFCP refueling station in Sacramento. This represents the first of several planned satellite refueling stations for the CaFCP.
Other projects:
Hydrogen for Remote Power: SERC/YUROK Telecommunications Station (IEA http://www.eren.doe.gov/hydrogen/iea/pdfs/serc_yurok PDF 356 KB)
•
Palm Desert Renewable Hydrogen Transportation Project (PDF 297 KB) •
Clean Air Now: Solar Hydrogen Fueled Trucks (PDF 366 KB) •
Schatz Solar Hydrogen Project (PDF 234 KB) •
Hawaiian hydrogen economy system: The $3 million Natural Energy Laboratory of Hawaii (NELHA), located on the Big Island, is the proposed site for the Hydrogen Power Park. The goal of phase two of the Hydrogen Power Park is to engineer and introduce a working renewable energy-to-hydrogen-to-electricity system and bring hydrogen systems into the marketplace.
•
Although less glamorous, coal is another source of hydrogen and the United States have plenty of coal. The resource is not ignored by the DOE. The opening round of the Department of Energy’s Clean Coal Power Initiative (CCPI) Solicitation has resulted in 36 companies proposing projects valued at more than $5 billion that seek over $1 billion in federal cost sharing support. A third of the projects proposed include co-production concepts where hydrogen is one of the products. President Bush has pledged to invest $2 billion over the next 10 years to demonstrate advanced clean coal technologies. The Department of Energy plans to award approximately $330 million in federal matching funds for this first round of proposals. Private sector proposers fund at least half the cost of any project selected by the department. The projects were selected in January 2003.
2.5.3 Asia, Pacific
138

2.5.3.1 Australia
Western Australia has been invited by DaimlerChrysler to participate in an international evaluation of three hydrogen fuel cell buses. Its purpose is to determine the critical technical, environmental, economic, and social factors that need consideration in the introduction of hydrogen fuel cell vehicles. The project is associated with the European Projects ECTOS and CUTE in the framework of the EC/Australia Science & Technology Agreement).
Perth was chosen because of the long distances and high speeds the buses travel at, compared to those in Europe. The Australian Federal Government's Alternative Fuels Programme has committed $2.5M to the Perth trial. The United Nations Environment Program (UNEP) and the United Nations Industrial Development Organisation (UNIDO) have both endorsed the project.
The participants to the project are: Ballard, Xcellsis, DaimlerChrysler, EvoBus, BP, Murdoch University and ACRE, European Integrated Hydrogen Project, California Fuel Cell Partnership, UNEP –IETC-, UNIDO, Princeton University
Association: National Hydrogen Association of Australia, formed in June 2001
2.5.3.2 China
Small fuel cells might be economically attractive to replace China’s large population of i.c.-powered mopeds and three-wheelers which are major contributors to air pollution and which are likely to be curbed. Shanghai, for instance, plans to replace 80% of its 470,000 gasoline-fueled mopeds with battery-powered versions.
A fuel cell vehicle is developed by a vehicle engineering joint venture of General Motors Corp. in China. A test drive took place during an exhibition arranged in conjunction with Earth Day to showcase Sino-US cooperation in the development of clean energy technology to improve the environment in Beijing and all of China. The zero-emission fuel cell wagon, called the Phoenix, is based on a Buick GL8 from Shanghai GM, GM's vehicle assembly joint venture in China. It was unveiled last November in Shanghai, China. PATAC (Pan Asia Automotive Technology Center), a joint venture of GM and Shanghai Automotive Industry Corporation, took the lead on the project, integrating the fuel cell system into the vehicle, using a fuel cell stack developed by GM. Scientists and engineers at GM's Global Alternative Propulsion Center in the United States and Germany provided fuel cell system, components and technical support. GM for the Phoenix supplied a portable hydrogen refueling station designed to be compatible with hydrogen sources in China also. The fully running, eight-passenger vehicle is powered by compressed hydrogen.
China has become a favorite location for hydrogen energy events: the 13th World Hydrogen Energy Conference, took place in Beijing in June 2000. HYFORUM 2003 will be held on 20-23 October, 2003 in Beijing.
Association: China Association for Hydrogen Energy
2.5.3.3 India
Researchers in India have developed a hydrogen-powered motorbike, with a novel metallic hydrogen storage system, that its developers believe is ready for commercialization.
Influent individuals are pushing the hydrogen energy topic in India, advocating mandates similar to the Supreme Court order on CNG for Delhi’s buses. Actions are yet to be taken. The participation of India in the United Nations Fuel cell bus project –buses in New Dehli- may act as a catalyst for further actions.
2.5.3.4 Japan
The number of current hydrogen projects in Japan is very high and this report does not have the ambition to describe all of them. For the immediate coming years, WE-NET has funding for both hydrogen and fuel cells, around US$20 million and US$50 million, respectively. Approximately ten times that amount is being spent by industry. Five refueling stations are planned now (4 compressed and one liquid hydrogen) and five more in 2004.
December 2, 2002 was an important date for the car world45: In presence of the Japanese Prime Minister Junichiro Koizumi, the presidents of Honda and Toyota delivered the world’s first commercial fuel cell cars to a few selected customers.
139

At present, leasing fuel cell cars costs some 6500 Euro (Honda) or 9500 Euro (Toyota) per month for 30 months. The first users are Japanese ministries. The same day, similar vehicles were delivered to the government of California, USA. Both Toyota and Honda will give 30 cars to these initial customers.
In Japan, hydrogen filling stations are planned for at least 9 locations. The 350 km autonomy of the cars together with the filling station network should permit the cars to be operated successfully.
Other projects in Japan: §3.2.2.2
2.5.3.5 Korea
The Korea Institute Energy Research, KIER, manages a hydrogen research center, which was launched as a research project of the Strategic National R & D Program of the Ministry of Science and Technology.
Association: Korean Hydrogen & New Energy Society, created in 1991. It has a journal, which is published quarterly and maintains close ties with its Japanese counterpart. Joint symposia have been held every other year since 1991.
2.5.3.6 New Zealand
There is a desire to replace imported oil that accounts for about 50% of New Zealand's energy use. Transport dominates New Zealand's oil use. Hydrogen is seen an energy carrier for the indigenously available coal and renewable energies.
The Ministry of Research, Science & Technology has launched an exploratory $NZ 1.2 million (USD 650,000) -annual program - Hydrogen for the new millenium - that provides a platform for New Zealand to start moving to a hydrogen based energy economy. The program is being undertaken jointly by Industrial Research Ltd and CRL Energy.
2.5.3.7 Singapore
Singapore aims to become a leading player in the development of alternative energy technology, with the government’s SINERGY program (Singapore Imitative in Energy Technology) designed to promote more research and development and testing activities for both automotive and stationary power.
Singapore has continued its push towards environmentally sustainable transport, with an agreement with BP to develop hydrogen-refuelling infrastructure, and to support the introduction of hydrogen fuel cell cars to the country. In May 2001, Singapore’s Economic Development Board (EDB) announced that DaimlerChrysler had agreed to co-operate on the launch and implementation of a fuel cell vehicle demonstration and development project. The installation of hydrogen delivery systems was planned for 2003, with the construction one year ahead of the introduction of the vehicles, which could be 2004.
Singapore will host the first World Hydrogen Technologies Convention in 2005.
140

2.5.4 International programs The United Nations Agency Fuel Cell Bus Project
As part of its ongoing strategy to introduce clean technologies and reduce greenhouse gas emissions in developing countries, the Global Environment Facility (GEF) a multilateral trust fund, which works through the United Nation’s Development Program (UNDP), the U.N.’s Environment Program, and the World Bank, aims to facilitate the use of fuel cell buses.
After more than 5 years of planning, GEF has given the go-ahead for a demonstration project that is expected to demonstrate clean fuel cell city buses in major cities with some of the world's worst air pollution levels in five developing countries. Sao Paulo, Brazil; Mexico City, Mexico; New Delhi, India; Cairo, Egypt; and Beijing and Shanghai, China, pending approval for the project from each country. Brazil is slated to be the first to use the fuel cell buses (§ 2.5.2.2). GEF expects that between 40 and 50 fuel cell buses will be delivered and deployed at a total cost of about $130 million. GEF will contribute about $60 million, with the rest coming from the five countries and a smaller share - about 20% of the total - from private industry.
141

3. FUTURE BUSINESS OPPORTUNITIES FOR THE GAS INDUSTRY IN A
HYDROGEN ECONOMY 3.1 OVERVIEW
The current world energy scenarios established by various international bodies (§2.1.2) hardly mention Hydrogen as a new potential energy carrier. This is not surprising for several reasons. First, energy scenarios are concerned essentially with primary energy issues and hydrogen is only an energy carrier. Second, many scenarios do not extend beyond 2030 and there are no chances that during a 30 year time frame a hydrogen economy could be in place whatever the will could be to develop a hydrogen economy.
Opportunities for the gas industry will be created by the early “Hydrogen econ omy” actions, even if it is acknowledged that it will take decades before the full fledge “hydrogen economy” is in place, in parallel with electricity as the other main energy carrier. The object of this section is to describe the opportunities that Study Group has identified. Many of them originate from the first demonstrations of the benefits of hydrogen as a fuel.
Most of the current demonstration projects concern the transport sector and aim at proving the feasibility of hydrogen to decrease the level of urban pollutants (NOx, CO, unburned hydrocarbons and particles).
The transport sector is a huge market that is as large as the entire natural gas market (figure 2.3 1.1.a). It is a market that natural gas has difficulties to penetrate because the competitive edge of CNG is not sufficiently clean. New diesel engines with clean-up devices emit low levels of NOx and particles. Also diesel engines may emit less CO2 than natural gas engines at identical power because efficiency is better. However, there is a major argument to put forward in favor of natural gas: CNG is a gaseous fuel to which hydrogen can be added in any amount as a fuel for thermal engines or even substituted 100% as a fuel for fuel cells. Switching to CNG can therefore be presented as the best way to get prepared for the hydrogen economy, which will come sooner or later.
This example shows that the natural gas industry is in a good position to seize the opportunities created by hydrogen as energy and that, in turn, hydrogen as an energy can already create opportunities for the current gas business. However, it is ironic that the most aggressive industrial proponent of hydrogen/natural gas mixtures as a new vehicle fuel is BC Hydro, in Canada, which offers the entire refueling infrastructure. It shows that if the gas industry does not grasp the opportunities, others will do it: the natural gas industry may keep providing the natural gas but this will be only a minor fraction of the value chain.
The opportunities identified by the Study Group are arranged by chronological order, listing first the opportunities that are likely to appear first in time.
3.2 FUTURE BUSINESS OPPORTUNITIES 3.2.1 On site Hydrogen production The natural gas industry has lost its experience in steam reforming since the switch from town gas to natural gas. The natural gas industry, except in Japan, is therefore not prepared to develop the small scale reformers that are needed to supply hydrogen at prices acceptable by the energy markets. Many others from a wide variety of industries – oil companies, engineering companies, industrial gas companies, fuel cell companies- are tackling the challenge in relation with the potentially large fuel cell markets. For those, the natural gas industry is a potential attractive partner as it controls the gas networks and the distribution of natural gas. In turn, the gas industry obviously welcomes the advent of the reformers for fuel cells. Establishing partnerships with developers of small-scale reformers is an opportunity for the gas industry.
Industrial gas market
The hydrogen industrial gas market is a small market in terms of potential natural gas sales. If on site 100 Nm3/h reformers could become competitive, there would be a market for a few hundred
142

generators in Europe, for example. That market would present an interest for natural gas companies if their motivation extend beyond the natural gas salesfor that particular market.
Electrolyzers
Electrolyzers will be a main instrument of the hydrogen economy as they will permit intermittent or remote renewable energies (wind, solar) to be steadily available. An involvement of gas companies in this area will obviously have to be motivated by arguments other than natural gas sales and will be dictated by the will of not to miss new business opportunities.
Participation in R&D programs on technology improvements
For gas companies that accept to be involved in long term projects, there exists opportunities at the R&D level:
Oxygen selective membranes: the AutoThermal Reforming technology (ATR) now competes with the steam reforming technology. As ATR, at the small scale, features a partial oxidation step performed with air, it would benefit from the availability of an inexpensive air separation technology that would permit the oxidation to be performed with pure oxygen46. Start-up companies active in the area are looking for investors.
•
• H2 selective membranes: the steam reforming reactions suffer from equilibrium limitations. Pumping out the hydrogen as it is formed in the reactor with hydrogen selective membranes would reduce these limitations. The currently commercially available palladium membranes are too expensive for this application. Inorganic membranes are currently investigated in academic R&D laboratories and start-up companies47.
3.2.2 Filling stations for buses and fleets 3.2.2.1 Hythane®
The ultimate zero emission urban vehicle is the fuel cell vehicle with on board storage of hydrogen produced from renewable electricity or biomass. This solution is for the long term. In the meantime and for the next three decades at least, fuel cell vehicles will still operate with hydrogen essentially from fossil fuels. However, technological and economical hurdles concerning the availability of fuel cells and the choice of the hydrogen providing primary energy shed uncertainty on the timetable for the commercial development of fuel cell vehicles. In this context, the utilization of a natural gas/hydrogen blend –HCNG- in traditional thermal engines would constitute a smooth transition towards the hydrogen economy that could be implemented immediately.
In addition, HCNG would permit the already good environmental performances of CNG vehicles to be improved even further, in particular with an additional 40% NOx reduction. That figure was obtained during the demonstration in commercial service of two Hythane® buses in 1996 in Montreal, as part of the Euro-Quebec Hydro Hydrogen Pilot Project48. Similar figures were obtained concerning CO and UHCs. Such a level of reduction would permit aging CNG buses to meet new, more stringent regulations. The word Hythane® is a trademark of HCI, Denver, Colorado and of EH2 in Quebec, Canada. HCI recommends 20% hydrogen in natural gas as the best compromise between performance and cost.
Only an engine tune up and a refurbishing of CNG filling stations is required to utilize this new fuel in recent turbo-charged lean burn CNG buses. Most buses are currently designed to run on diesel fuel. Diesel engines are lean burn engines because no material would withstand the very high adiabatic combustion temperature of diesel fuels. Burning lean limits the temperature level and NOx formation. Adding hydrogen to natural gas permits the lean combustion to be very stable and complete at high level of dilution with air. Very low levels of pollutants are then observed. The drawback of lean combustion is a loss of power. Boosting the action of the turbo-charger alleviates that problem. In principle, all engines could be easily adapted to the lean combustion of Hythane® by modifying engine mapping. Hythane® would also be beneficial as a fuel for stoichiometric engines with EGR -Exhaust Gas Recirculation-, as it would stabilize the combustion of the lean resulting mixture49.
Since the demonstration in Montreal in 1996, Hythane® has had no success because the better performance was not needed to satisfy the emission standards and because the cost for hydrogen was too high in relation with the benefits.
143

Now the situation has evolved with the requirement for lower pollutant emissions, with the push from the public and politicians for cleaner air and with the prospect of getting hydrogen at a lower price with a new generation of on site reformers.
Another reason to investigate now the potential of HCNG originates from the improved performance of diesel engines, which compete with CNG engines. HCNG is a potential solution to maintain the environmental edge of CNG engines compared to diesel engines and to permit aging CNG buses to meet new, more stringent regulations, as mentioned earlier.
In the US and Europe, major bus manufacturers (CumminsNorthwest, Irisbus, MAN, Volvo) have expressed their interest in HCNG and their attitude will be essential for the future of HCNG as a bus vehicle fuel. In Japan, several years ago, the bus manufacturers expressed no interest and there was no further investigation of HCNG despite a favorable economic assessment performed for the Japanese hydrogen program WE-NET that showed that for heavily polluted city centers like London and Tokyo, it would be economically advantageous to utilize Hythane® buses because the cost would be inferior to the cost generated by the pollution induced health problems, even if the hydrogen were supplied by an industrial gas company at the market price. As mentioned previously, for societal needs like clean air, a close collaboration with the public authorities is necessary for creating acceptable economics.
Obviously, adapting existing CNG filling stations is the best prospect for HCNG as essentially only a blender and a reformer would be necessary (there are more than 3000 CNG filling stations worldwide). The SunLine Transit Agency in Thousand Palms, California has several Hythane® bus running and they can provide investment and operating costs.
Finally, the most convincing argument for HCNG may arise from its ability to permit renewable energies to be introduced in the vehicle fuel pool, if the hydrogen is obtained from renewables sources. That possibility may provide a boost for CNG and may accelerate the construction of new CNG/HCNG facilities and provide a definite argument in favor of CNG against diesel.
HCNG and the thermal engines are not the ultimate vehicular combination compared to neat Hydrogen, fuel cell and electric engine. However, when comparing HCNG and fuel cell buses, one may consider the leverage effect of HCNG as a major factor: for the same consumption of hydrogen, the reduction of the emissions of local pollutants is higher with five HCNG (20% H2) buses than with four CNG buses and one pure hydrogen fuel cell bus (- 40% x 5 compared to - 100%). If in addition, prices are considered, HCNG, could develop even if fuel cells are on the verge of commercialization. No serious technological barrier could hamper the development of HCNG, which is not the case of fuel cells for vehicular applications. HCNG represent an opportunity for the gas industry that could be implemented right away in the burgeoning hydrogen economy. It could be competitive for decades.
3.2.2.2 Filling stations for hydrogen fuelled buses
The absence of satisfactory technologies to store hydrogen on passenger cars limits the short term opportunities for hydrogen as a fuel to buses (hydrogen contains three times less energy than natural gas on a volume basis). Considering the interesting features of HCNG, it is likely that neat hydrogen fueled buses will be fuel cell buses rather than buses equipped with thermal engines. The pace of demonstrations of fuel cell buses should accelerate in 2003 with numerous projects in Europe, the US50, Japan, Australia and developing countries.
144

Figure 3.2.2.2a: a few projects of hydrogen refueling stations (Courtesy LBST)
Opportunities in Europe
According to the European Commission’s Green Paper “Towards a European Strategy for the security of energy supply”51, the share of hydrogen as a vehicle fuel would be 2% by 2015 and 5% by 2020. If all this hydrogen were provided by on site natural gas reformers of 1000 Nm3/h capacity, that share would translate into 3500 hydrogen generators in 2015 and 10,000 in 202052.
Opportunities in Japan
50,000 FCVs (buses and passenger cars) in 2010 and 5 million FCVs in 2020 are expected by the Japanese government to enter the Japanese market. These figures are considered optimistic by a few automakers executives.
The hydrogen will be obtained as a by-product and/or from natural gas. According to WE-NET, at the early stage of introduction, most hydrogen filling station will be off-site supply stations that will gather hydrogen from outside suppliers. It’s only at a later stage that filling stations featuring on site SMR will appear. That projection was made considering the initial investment and the hydrogen price.
Hydrogen filling stations supplied with by-product hydrogen stored off site
Figure 3.2.2.2b shows a hydrogen supply infrastructure based on by-product hydrogen from three different sources. Hydrogen is mass produced and is delivered liquid or gaseous to the off site supplying station.
The cost of hydrogen, produced from coke oven gas (COG) at the production site, is between 30 Yen/Nm3 (0.25 $/Nm3) and 55 Yen/Nm3 (0.46 $/Nm3) at the production scale of 10 to 50 tons of liquid hydrogen per day. 10 tons per day (4635 Nm3/h) can provide hydrogen for ca.1,300 FC buses.
145

Coke oven
Blast FurnaceLD Furnace
DesulfurizationRemoval of BTX
PSA
Removal ofCarbonic
Acid/Rectification
CO ShiftConverter
HydrogenLiquefactionCOG
Steel Company
BFG
LDG
Off-PeakElectricity
Cold ThermalEnergy of LNG
Infrastructure ofSteel Company
Liquid HydrogenTank
H2 Distribution H2 Utilization
CompressedHydrogen
Lorry
SodaElectrolyzer H2 Piping or
Tube Trailer
SuctionSnubber Unit
Compressor
AccumulatorUnit
LiquidHydrogen
Lorry
HydrogenRefuelingStation
FCV(Public Fleet)
FCV
Soda Electrolysis Company
H2
Fig 3.2.2.2b: off-site hydrogen supply infrastructure based on by-product hydrogen
The cost for installation of hydrogen filling stations as estimated by WE-NET is shown in table 3.3.2.1.
Production
Type 2006 2010 2015 2020
100 Nm3/h
off-site 130 million yen
$ 1.06 million
- - -
300 Nm3/h
off-site - 210 million yen
$ 1.71 million
190 million yen
$ 1.55 million
-
500 Nm3/h
off-site - 330 million yen
$ 2.69 million
290 million yen
$ 2.37 million
250 million yen
$ 2.04 million
500 Nm3/h
on-site - 500 million yen
$ 4.08 million
410 million yen
$ 3.35 million
350 million yen
$ 2.86 million
Table 3.3.2.2: Installation costs for hydrogen refueling stations
Hydrogen filling stations with on-site SMR
Figure 3.2.2.2c shows a typical hydrogen infrastructure with filling stations featuring on site SMR. The cost of hydrogen is between 40 yen/Nm3 ($0.33/Nm3, $18,5/GJ) and 80 yen/Nm3.
146

H2, CO, CO2, H2O
High PressureDispenserHigh Pressure
Storage Unit
Hydrogen
Storage Pressure Filling Pressure
HydrogenPurifier
Gas Pipe
NG Reforming UnitH2 Purification Unit
Compressor
CH4HydrogenGenerator
Figure: 3.2.2.2c: hydrogen filling station featuring on-site SMR
It is estimated that the overall costs of hydrogen obtained from supply stations and filling stations with on site SMR should be similar. However, it is more expensive to install an on-site grass roots filling station than installing an off-site station.
Options for the Japanese Gas Industry
The Japanese gas industry has a choice between two strategies to play an important role in the introduction of hydrogen as a vehicle fuel for FCVs:
The off site storing/distribution/supply facility with mass production of hydrogen and deliveries to filling stations through transportation by trucks. Although the Japan’s by-product hydrogen is estimated to meet the demand, a thorough feasibility analysis should be carried over on the local availability.
The refueling station with on site production of H2 with SMR. The technology to produce hydrogen from on site SMR is almost ready. A few cost issues attached to the downscaling remain to be solved through the:
Improvement of burners (reduction of their number, utilization of improved burners such as regenerative burners)
•
•
•
•
•
•
Integration with pre-heater, heater etc,...
Integration of reactors for sulphur compound and CO removal
Integration of heat exchangers
Downsizing of Pressure Swing Adsorption (PSA)
Relaxation of the regulations applicable to hydrogen filling stations In the past, the Japanese gas industry and the Japan Gas Association have successfully pressured the government to relax the regulations on natural gas filling stations to permit the development of NGVs. Thanks to this experience, the Japanese Gas Industry will be able to make hydrogen for FCVs available as well, thanks to the proof of its ability to produce and/or store hydrogen while ensuring that all safety criteria are met.
The choice between the two options will be dictated by considerations concerning the local long term availability of by-product hydrogen and the prospects for the evolution of the number of fuel cell vehicles.
Also, actions should be undertaken to convince the public that hydrogen is a safe fuel. The demonstration of a hydrogen filling station, such as the one in Osaka, completed in February 2002 for WE-NET, (figure below), is a first action in that direction.
147

Figure 3.2.2.2.2.3: the WE-NET hydrogen filling station with SMR
Opportunities in North America
CNG has been developing at a reasonable rate in the U.S. but the number of CNG vehicles remains low at 126,000 vehicles i.e. 0.04% of the vehicles registered in the U.S. (table 3.2.2.2a). In addition, the growth appears to slow down. The natural gas industry should therefore watch closely and cooperate with public agencies like California’s AQMD - South Coast Air Quality Management District - that has identified a synergy between CNG and future Hydrogen refueling stations53 for lower investment and operating costs. In that particular situation, it appears that it is the prospect of a hydrogen economy that may give a boost to the current CNG business.
Fuel 1993 1994 1995 1996 1997 1998 1999 2000 2001 2002
LPGs 269,00
0 264,00
0 259,00
0 263,00
0 263,00
0 266,00
0 267,83
3 272,19
3 276,59
7 281,28
6
CNG
32,714
41,227
+ 20%
50,218
+ 17 %
60,144
+ 16%
68,571
+ 12%
78,782
+ 13%
91,267
+14%
100,738
+ 9%
113,835
+ 11%
126,341
+10%
LNG 299 484 603 663 813 1,172 1,681 2,090 2,576 3,187
Methanol, 85% (M85)
10,263
15,484 18,319 20,265 21,040 19,648 18,964 10,426 7,827 5,873
Methanol, Neat (M100) 414 415 386 172 172 200 198 0 0 0
Ethanol, 85% (E85) 441 605 1,527 4,536 9,130 12,788 24,604 58,621 71,336 82,477
Ethanol, 95% (E95) 27 33 136 361 347 14 14 4 0 0
Electricity 1,690 2,224 2,860 3,280 4,453 5,243 6,964 11,834 17,848 19,755
Non-LPG Subtotal 45,848 60,472 74,049 89,421 104,52
6 117,84
7 143,69
2 183,71
3 213,42
2 237,63
3
Total 314,84
8 324,47
2 333,04
9 352,42
1 367,52
6 383,84
7 411,52
5 455,90
6 490,01
9 518,91
9
Table 3.2.2.3.a: estimated number of Alternative-Fueled Vehicles (AFVs) in the United States, by fuel, 1993-2002. AFVs represent approximately 0.2 percent of total registered on-road vehicles in the U.S
148

(from eia.doe.gov.alternative fuels September 2002 data)
149

This opportunity is, of course, not limited to California, but it may be taken advantage of there earlier than in the rest of the world since the local public authorities are prepared to provide the necessary economic incentives.
Opportunities in other countries, developing countries
The fuel cell bus project announced by the UNDP/GEF (§2.5.4) may act as a catalyst for similar projects. Some of these projects may be based on hydrogen made from locally available renewable energy and represent an opportunity for gas companies to venture into a new business and to geographic area where natural gas infrastructures need not to exist.
3.2.3 Adding Hydrogen into the natural gas grid Adding some hydrogen to natural gas up to levels where the consumer would not see a difference with pure natural gas and using the natural gas grid for the transmission and the distribution of the blend is a solution for the smooth introduction of hydrogen into the energy pool. If the hydrogen originates from renewables or from fossil fuels with CO2 sequestration or utilization, the level of reduction of CO2 emissions is proportional to the hydrogen content in the blend. It is an option that countries that have commitments to reduce their CO2 emissions may consider. This is the case of the Netherlands where there is some excess hydrogen at an ammonia plant, that would be available for injection in the natural gas grid. That solution could be implemented relatively quickly because there is no new technology to be developed. However, because the effects of hydrogen in natural gas can be detrimental, inexistent or beneficial, it requires checking practically every link of the gas chain -storage, transmission lines, distribution grids and utilizations technologies-.
Checking all these items will be lengthy. A proposal in that direction has been submitted to the European Commission for co-funding by a few major gas and energy companies (NATURALHY project54). The IEA Greenhouse Gas R&D Programme will issue a review on that topic in 2003.
The Study Group views the addition of hydrogen to natural gas as one of the most practical and beneficial introduction to the hydrogen economy. In addition, it is a concept where there is obviously a wealth of opportunities for the natural gas industry, as every link of the traditional gas chain is concerned.
3.2.4 Hydrogen from renewables and wastes Japan and Europe have set ambitious targets for the increase of the share of renewable energies and will provide the necessary incentives. Europe has particularly emphasized the role that hydrogen should play as a carrier of renewable energies. Getting into the production of hydrogen from clean and/or renewable sources or wastes may be an opportunity for gas companies to diversify their activities in a fast growing area and be definitely viewed as environmentally concerned companies. They could also expand in geographic area where natural gas infrastructures need not to exist.
Hydrogen from renewables could be a good business in itself, but could also give the companies a more favorable image that will help them in other more controversial issues and projects. Two technologies must be controlled to produce hydrogen from these alternate sources: electrolysis and gasification. The decision of IGU to abandon the gasification topic at the end of the previous triennium, in 2000 may have to be reconsidered. The US DOE maintain a database on gasification projects in the world.
3.2.5 Distribution and utilization technologies of pure hydrogen Hydrogen is the ideal fuel of fuel cells and there may be benefits of utilizing hydrogen as a fuel in a number of conventional appliances and large energy production devices such as turbines. However, the prerequisite for the appearance of such applications on a large scale is the existence of hydrogen distribution and transportation networks. As detailed below, there may be opportunities for the Gas Industry in the adaptation of existing natural gas grids and the construction of dedicated hydrogen energy networks.
The topics of hydrogen fueled fuel cells and pure H2 distribution networks are obviously linked but the business opportunities for gas companies are different for each topic. We have therefore chosen to discuss them separately.
150

3.2.5.1 Hydrogen Distribution Networks
Hydrogen is the ideal fuel for fuel cells and that fact has spurred interest for hydrogen distribution networks. At this stage of early development of fuel cells with their dedicated natural gas reformers, the technical and economic optimum system configuration is not yet established and will depend on the context: it is conceivable that a small network of a few tenths of fuel cells fed with hydrogen from a single reformer may represent an optimum system configuration in a given context. Hydrogen distribution networks would then be necessary. This would certainly be a business for gas companies.
Polyethylene is the current and future material of choice for natural gas distribution networks. Since it is a relatively new material for gas distribution, there is no town gas experience that can be built on. Data have nevertheless been gathered by IGT (GTI now) and more recently by GASTEC (appendix). They tend to prove that plastic distribution networks for hydrogen are quite feasible and that the technologies developed by gas companies to install and service them could be adapted to hydrogen, as long as the hydrogen specific safety rules are obeyed. Hydrogen distribution networks appear as a business opportunity for natural gas companies. The time frame and the extent of the business will depend on the technical performances and prices of the dedicated individual fuel cell reformers to come.
3.2.5.2 Residential/domestic CHP with H2 fuel cells
The commercial justification of the use of hydrogen in stationary applications may appear only in a distant future as the competition from the existing systems is hard and as the driving forces to introduce hydrogen are not as strong as for vehicle applications. On the other hand, technical and price barriers are not as serious in stationary systems. As mentioned before, there are many factors and parameters that have to be taken into consideration for the ultimate solution on the market. Commercial breakthroughs for hydrogen as an energy carrier will take place only if there is a strong interaction between market driving forces, technological achievements and the attitudes of the authorities. There are different threats and opportunities at any of these levels.
The potential availability of pure hydrogen opens the door to small, low-price and reliable residential CHP systems.
These systems may either be of the stand-alone type or connected to the electric grid. Reversible stand-alone systems (fuel cell/electrolyzer) may permit each home to have its own hydrogen production from solar cells. A hydrogen storage facility and a compression unit would then be necessary for each home. Grid electricity may be used as back up in case the hydrogen storage is empty.
A CHP system may make the home self-sufficient, and in the future “surplus energy houses” may be able to produce hydrogen to the grid in periods where the solar cells of the house are producing surplus energy.
The flexibility of construction of hydrogen based CHP systems will make it easier for the gas companies to work out the best possible system for each case. CHP units will be based on PEMFCs or SOFCs. The PEM units have the advantage that they may also work as a producer of hydrogen (reversible FC).
The future will show which systems will be used. It is expected, though, that SOFCs - if affordable and reliable- will be most widely used in a –long- transitional period, before the full-fledged hydrogen economy. This type of fuel cell can accept less pure hydrogen because the reforming process is integrated in the fuel cell, for greater fuel flexibility.
It will be possible for the gas companies, in both periods, to provide a good service to the consumer and to run a profitable business by owning the CHP units and control the energy supply of homes. Thus it will be possible to optimize the operation of the units in relation with the spot energy prices and the load of the grid.
3.2.5.3 Domestic and Industrial appliances
It is unlikely that the performances of conventional appliances when burning hydrogen would justify the construction of hydrogen distribution or transport networks. However, if hydrogen is available for fuel cells, conventional appliances optimized for hydrogen combustion may appear
151

rapidly.
Most of the natural gas appliances that are used today in domestic applications may, in principle, be used with hydrogen. The question, however, is how many of these appliances will remain of interest when fuel cells and electricity from fuel cells become available.
Hydrogen combustion has some inherent inefficiency relative to other fuels due to the large amount of water vapor energy it forms, which is usually lost in the flue gas55. The low heating value (LHV) to high heating value (HHV) ratio of H2 is the lowest of any fuel—at only 84.6%. In other words, 15.4% of the H2’s HHV energy is lost in the flue gas water vapor’s latent heat and it is generally impractical to condense flue gas water vapor due to the high costs, corrosion, and low temperatures required. This 15.4% HHV energy loss is commonly ignored by H2 advocates with the convenient use of LHV in efficiency calculations.
In view of these inherent additional limitations, electricity may then appear as the most economical and safe fuel. It is too early to predict what the future will be in that respect. A few considerations on hydrogen fed appliances can be found in appendix 2.
3.2.5.4 Non residential power generation
Although the distributed generation of electricity has existed over a number of years, the term “Distributed Generation” is relatively new. It seems easy and elegant to produce electricity locally, but a number of problems have to be solved. Some of them are the integration to the existing grid, the way to control their operation (software, etc, ..), fuel/infrastructure etc. Even of more importance is the cost that must be lower than the systems installed today.. Also, the distributed generation does not permit CO2 sequestration.
Consequently, centralized large power generation based on high capacity turbines or fuel cells, will prove attractive again at some point in the future. Encouraged by deregulation, gas companies may want to seize the new opportunities that will appear, if hydrogen transmission lines exist and hydrogen becomes available in large amounts.
3.2.6 Neat H2 transmission In the long term, pure hydrogen will be available from renewable energies on a large scale and from reformers with CO2 sequestration and its transmission to the area where it will be distributed will offer business opportunities.
The industrial gas companies operate a few thousand kilometers of hydrogen pipelines in the United States and Europe. Their safety record is excellent, as a result of the implementation of specific risk analysis processes and specific safety devices such as excess flow valves. This mechanism for shutting off gas moving through a pipeline operates within two seconds, preventing major releases into the environment and minimizing or eliminating explosive risks. The industrial gas companies are therefore in an excellent technical position to grasp the business opportunities that will appear when large amounts of hydrogen energy will have to be transmitted from distant production sources.
However what is at stake here is the progressive replacement of natural gas by hydrogen and obviously the natural gas companies should react to the threat.
The construction of new hydrogen dedicated transmission lines will take place but the utilization of pipelines currently transporting natural gas will be the only cost effective solution. considered as well. Based on experimental studies, it was concluded by some56 that if the hydrogen contains a small proportion of methane or inert gas (1 to 5%), the steel pipelines carrying natural gas could still be used, except in certain sections prone to metal fatigue where the risks of stress corrosion cracking must be considered.
3.2.7 Bulk storage of H2; underground storage of H2 The possibility of using hydrogen as a storage medium of renewable energies such as wind power and solar energy has been demonstrated in several occasions. (Palm Springs, California, e.g.). It is now considered in many parts of the world, particularly in isolated area not connected to an energy grid, such as islands. New entire energy chains are considered for these locations. Gas companies, which are familiar in their day-to-day operations with natural gas storage, may find opportunities to apply their knowledge in these new endeavors. Those who kept a knowledge of town
152

gas storage may have an edge, since town gas contained up to 60% hydrogen.
153

In the United States, the current National Fire Protection Association (NFPA) code 50 A&B for H2, does not allow underground storage, requires large clearances from all combustible materials, and requires massive ventilation to avoid very expensive explosion-proof equipment57.
3.2.8 Large dedicated SMR plants with CO2 sequestration The decarbonization of natural gas into pure hydrogen is an option that would permit natural gas to continue to be utilized without generating CO2. The cost of that process per kWh of hydrogen produced and CO2 collected and sequestrated, will be the lowest in large Steam Methane Reforming (SMR) plants.
Obviously gas companies are not going to get into dedicated projects of that nature unless it is mandated and even if collecting CO2 could become a business itself. Such mandates will not come until less costly options for limiting the CO2 emissions have been implemented. The concept of large dedicated SMR plants with CO2 sequestration and transmission/utilizations of pure hydrogen, is therefore only a long term opportunity that will materialize when a hydrogen economy will be fully in place, i.e. probably not before 2050. It is very long term compared to the somewhat similar idea described in §3.4 where the excess hydrogen from an existing plant is mixed to the level of a few percents with natural gas to be transported, distributed and utilized like pure natural gas. 3.3 SUMMARY AND CONCLUSIONS; OPPORTUNITIES IN A LIBERALIZED
MARKET STRUCTURE Opportunities for gas companies will depend upon their role and position in the value chain. Sector specific specialist companies operating in a liberalized and more de-regulated market are progressively replacing the vertically integrated national monopoly structures adopted by the gas industry in many countries. Thus, companies involved in gas production will need to review and consider if they have the skills and know-how necessary to move into hydrogen production. As outlined in this paper, hydrogen produced from natural gas will continue for many years to be the most significant route for hydrogen production at least until the economics of producing hydrogen using renewable energy combined with water electrolysis improves.
Gas transportation companies will look for opportunities in energy transport, but will necessarily need to demonstrate to the regulatory authorities that all safety related issues associated within the transport of either pure hydrogen or hydrogen added to natural gas in both existing and new build pipelines have been properly addressed. It is also possible that the natural gas transportation network could be used as a basis for hydrogen transport. Fuel cell refuelling sites or example, with relatively small concentrations of hydrogen added, being extracted using gas separation technologies and stored locally, for use in stationary or vehicle fuel cells.
In this case, new transport tariff structures would need to be implemented taking account of both energy flows and the premium application use offered by the use of hydrogen. Installation and use of gas separation facilities in such a case would offer a new business service/opportunity. Finally of course, the development of a market and infrastructure for hydrogen transportation by pipeline will also offer new opportunities for those involved specifically in gas trading and supply, including the possible introduction of different billing and tariff structures to allow both normal gas energy and premium hydrogen energy supply.
If natural gas provides the basis for the hydrogen economy in the medium term, then the management of CO2 from reforming will present a further potential opportunity for gas industry players. This might include the separation and disposal of CO2 through sequestration, storage for subsequent use or the transportation of CO2. Some fiscal or other levers to encourage the investment in a CO2 infrastructure might underpin this.
Table 3.10.a below lists a number of specific opportunities for the gas industry, per order of likely appearance. The inception date determines whether the opportunity is a short or a long-term opportunity.
The opportunities concern the entire hydrogen energy chain and relate to different terms of inception. Many of the opportunities are linked, e.g. on-site reformers and fuel cell buses on CNG refueling stations. Long term opportunities - ~40 years from now- are mentioned to appreciate the
154

extent to which the path shaped by the various opportunities is in line with long term energy scenarios which recommend that, at some point, the decarbonization of fossil fuels, including natural gas, should take place. In that respect, it appears that distributed energy concepts, even if they induce initially a CO2 reduction because of efficiency gains, do not qualify, in the long run, as sustainable development concepts because they do not allow for CO2 sequestration.
Natural gas
2003-2050 1. Hydrogen from natural gas, small scale, on site2003-2050 2. Refueling stations for HCNG buses (Hythane®)2003-2050 3. Addition of a few percents hydrogen in natural gas2003-on 4. Hydrogen from renewables
2010-on 5. Hydrogen distribution networks2010-on 6. CHP with hydrogen as a fuel2010-on 7. Refueling stations for Hydrogen fuel cell vehicles
2020-on 8. Neat H2 transmission 2050-2150 9. Large SMR with CO2 sequestration2050-on 10. Large scale hydrogen storage (underground storage)2030-on 11. Hydrogen appliances2020-on 12. Power generation with hydrogen
Short term opportunities
Medium term opportunities
Long term opportunities
Renewables
Table 3.10 a: Business opportunities for the gas industry created by the burgeoning “Hydrogen Economy, as identified by Study Group 7.4
A few opportunities lead to a potential increase in natural gas sales while the thrust towards renewables could create additional opportunities for gas companies if they were willing to depart from their exclusive interest for natural gas. The launch of specific and massive Hydrogen Energy programs by the US and then Europe (2.1 billion € in R&D in the E.U’s. 6th Framework Program) should encourage gas companies to move in that direction.
Natural gas should provide the largest fraction of the huge amounts of hydrogen that will become necessary if hydrogen is to become a vehicle fuel, in particular. However, it will take many years before hydrogen becomes a significant energy carrier with an impact on gas sales and the report does recommend the gas industry to consider the opportunities that are created already now, outside of gas sales. The prospects created by the forthcoming hydrogen economy, are so numerous that many potential players are getting prepared now through alliances and new ventures. With a few exceptions, particularly in Japan, the natural gas industry is not yet part of that endeavor. There is a risk involved, even if some consider that maintaining only a technology and strategy watch makes sense as well.
In the most probable energy scenarios, natural gas has a bright future. It should be the fastest growing energy during the first half of the century. Consequently, it could be tempting for the natural gas industry to adopt a complacent attitude and stick to its traditional business without venturing into new area such as hydrogen where the economic uncertainties are high. However, not taking advantage of the opportunities that the burgeoning hydrogen economy is creating right now may restrict the future role of the natural gas industry to that of a supplier of raw material, which is unlikely to be the most rewarding position in the value chain.
Many companies have already seized some of the short terms opportunities. It is clear that others will take advantage of the opportunities if gas companies won’t. There may be advantages for gas companies to collaborate with potential competitors (oil companies, industrial gas companies, power companies) rather than not being part of the early developments and have to join later at risk or with greater difficulty and higher costs.
155

The present report is not a plea for hydrogen. It aims at showing that a serious evolution, even a revolution, has started and that the burgeoning move towards a hydrogen economy cannot be ignored, even if the topic is still controversial. The report will meet its objective if it contributes to permit a well-informed gas industry to make the right decisions concerning the level of its future involvement. 4. PROPOSED ACTIONS FOR IGU It is recommended that IGU perpetuate the existence of a dedicated group on hydrogen. The reasons behind this are the following:
Hydrogen will be a major energy carrier in the future, along with electricity. It will be a threat to natural gas if the gas industry ignores it, while it will provide a wealth of opportunities if the gas industry is involved in its development.
•
•
•
•
•
•
•
•
The efforts for actions and R&D budgets in USA, Japan and Europe will be enormous (2,1 bIllion € in the European Union for the coming four years).
In the U.S. Europe and Japan, the governments have established high level consulting groups with industry to decide the most suitable paths toward the hydrogen economy. The role of governments is essential regarding hydrogen as hydrogen is exclusively an answer to various societal needs which are the responsibility of the governments
All the main energy players around the world are active in the area.
The group will maintain its objective to keep the gas industry informed of the threats and opportunities created by the hydrogen topic.
Upon IGU’s decision, a stronger presence of IGU among decision-making bodies on hydrogen policies should be sought. Stronger collaborations with IEA’s Hydrogen and Greenhouse gas programs and others should be initiated.
In Europe, and in the U.S., the natural gas industry is not involved in hydrogen as much as some of its potential future competitors
Other proposed actions for IGU:
A «sponsoring» of a few significant natural gas based hydrogen projects
A support of H2 projects in developing countries
More information exchange/joint symposia with government bodies supporting Hydrogen (IEA, United Nations,..)
More contacts with the financial community
156

APPENDIX 1:
STATUS OF KNOWLEDGE ON PURE HYDROGEN NETWORKS
In transporting natural gas over rather large distances (hundreds to thousands of kilometers) pressures usually exceeding largely 16 bar, up to 80 bar, are applied. For transport inside cities and villages normally interconnected pipeline systems are used which operate at pressures below 16 bar. A large part of a distribution network normally will be under operation at pressures below 4 bar or even 0.1 bar.
For distribution of natural gas, extensive pipeline systems are in operation in many countries. In these systems various pipeline materials are used, like steel, cast iron, ductile iron, polyethylene and PVC. For future distribution of hydrogen such pipeline systems may be used as well. In this section, the suitability of such distribution pipeline systems for distribution of hydrogen is discussed in order to suggest business opportunities for natural gas companies. The following aspects will be discussed:
Effects of hydrogen on the various pipeline materials •
•
•
•
•
•
•
The network capacity for the distribution of hydrogen
The issue of leakage rate
The permeability of the plastic pipelines
The metering of hydrogen gas
The impact of hydrogen gas pressure reduction
The safety aspects of the distribution of hydrogen.
The knowledge that the gas industry has accumulated on all these items for natural can be extended to hydrogen and constitute an opportunity for the gas industry to be able to convert its existing distribution grid to transport hydrogen and/or construct new ones.
Effects of hydrogen on the lines distribution gridlines From literature58, it is known that steel can be embrittled by very pure hydrogen at higher pressures. For the pressure in hydrogen distribution systems (< 4bar), it is very unlikely that embrittlement of steel pipelines will take place. The same holds for cast iron and ductile iron. There is no report indicating deterioration of these materials by hydrogen.
Plastic pipe materials are nowadays the preferred materials in modern gas distribution systems. These materials are vulnerable to higher hydrocarbons, but are not affected by smaller molecules, like methane and hydrogen.
In distribution systems, joint rubber rings can be present. There is no indication that rubbers are deteriorating by hydrogen.
So, it is concluded that the present pipeline materials in gas distribution systems are not affected by the presence of hydrogen.
Capacity of hydrogen networks Gas distribution systems are highly interconnected which results in a high level of supply security. By using advanced gas flow analysis the dimensioning of the interconnected network can be done. For these calculations software programs are available.
In order to investigate the consequences of distributing hydrogen through existing natural gas pipelines, it is possible to simply look at a linear pipeline with a given pressure drop over this pipeline. Given this allowed pressure drop, the flow of gas can be calculated for both natural gas and hydrogen. It has been found that for the same pressure loss, about 3 times more hydrogen per volume can be transported than natural gas.
157

158

This means that the transported amount of energy for a given pressure loss is about the same as for natural gas distribution, since hydrogen contains per volume 3 times less energy than methane.
It must be remarked, however, that the much higher volume flow of hydrogen results in rather high gas velocities. These velocities may exceed the allowable speed limit in distribution systems (<20 m/s) and cause excessive noise.
In conclusion, the existing natural gas distribution networks have sufficient capacity to distribute hydrogen but noise problems, caused by the high gas velocities, may limit this capacity.
Leakage rate In a gas distribution system, many joints are present. These joints may cause leakage. Many years ago, IGT59 has carried out leakage measurements on gas distribution systems composed of various pipeline materials. The leakage rate of hydrogen has been compared to that of natural gas. It was found that the leakage rate (in volume) is a factor of about 3 higher for hydrogen than for natural gas. This means that the energy loss due to leaks is about the same for the distribution of natural gas and hydrogen.
Moreover, the leakage rate in modern gas distribution systems (steel, plastics) is very low. It is generally accepted that the leakage rate is less than 0,1 % of the throughput.
Permeation of hydrogen through plastic pipelines All plastic pipe materials are to a certain degree permeable for the gases they transport. The small gas (hydrogen) molecules may permeate through the pipe wall. This permeation should be limited, also in the case of hydrogen. Too much permeation may result in significantly unaccounted gas loss or serious safety problems. To determine the permeation in a quantitative way, Gastec has performed so-called permeation experiments60. The permeation of hydrogen through various plastic pipe materials – PE, (ductile) PVC, PEX – has been measured and the permeation coefficient calculated. The obtained values have been compared to data from literature61 for diffusion of hydrogen and methane (natural gas). A summary of the data is given in table 1.
Material Experimentally determined Permeation Coefficient
(ml.mm/mm2/ 24h/bar)
Permeation Coefficient from litterature.
(ml.mm/mm2/24h/bar)
PE 80 (HDPE) 17.1.10-5 22.7.10-5
PE 80 (MDPE) 18.5.10-5 12.5 - 23.8.10-5
PE 100 16.6.10-5
PEXa 38.3.10-5
Rigid PVC 10.3.10-5 7.81.10-5
Ductile PVC (PVC/CPE)
11.0.10-5
Table 1. Permeation coefficients for hydrogen through plastic pipe materials at 20 C
From this table is clear that there is generally a good agreement between the measured values of Gastec and data from literature. The permeation coefficient of PE materials is about a factor 2 higher than for PVC materials. Surprisingly, the diffusion of hydrogen through PEX is considerably higher, by about a factor 3, compared to PE.
The diffusion of hydrogen through plastic pipelines is about a factor 5 higher than the diffusion of methane through these materials62. Based on the experimentally determined permeation coefficients, the predicted yearly diffusion of hydrogen through the existing plastic pipeline gas distribution network in the Netherlands has been calculated. These losses are very low, in the order of 0,001 % of the throughput. So permeation of hydrogen through plastic pipelines is not a real problem.
159

Gas volume metering The users connected to gas distribution networks use various gas meters, e.g. turbine meters, rotary meters and diaphragm meters. The accuracy of gas volume metering should be extremely high. In turn, the accuracy of these meters for the supply of natural gas is carefully controlled. By distributing hydrogen, the accuracy of these meters may be affected. Therefore, Gastec recently performed a number of measurements to determine the accuracy of various gas meters in using hydrogen. The results were compared with supply of natural gas by the same gas meters. From this study it was found that the accuracy of the meters tested (diaphragm meters, rotary meters and turbine meters) was the same for natural gas and hydrogen. It has to be remarked, however, that the capacity of many installed gas meters will be insufficient to supply the same amount of energy. This is caused by the fact that the flow of hydrogen must be about 3 times as high as that of natural gas to deliver the same amount of energy.
Gas pressure reduction stations A gas distribution system is usually built up of various pressure stages (e.g. 8 bar, 4 bar, 100 mbar). Gas pressure reduction equipment is used to bring the pressure at the required level. In using hydrogen in existing natural gas networks, the capacity of this equipment may be insufficient, because the volume flow is much higher for hydrogen. (This will be evaluated furthermore).Hydrogen can be distributed with the same (low) risks as natural gas. If hydrogen escapes from a pipeline, it diffuses very quickly in the air. The chance to have an explosive mixture is very low and certainly not higher than for natural gas. This is substantiated by experiments performed by IGT.
Also, the distribution of town gas in the past (having a hydrogen content of about 50 vol. %) was accomplished with a very good safety record. There were very few accidents with the pipelines that resulted in fires or explosions and certainly not more than for natural gas distribution pipelines
160

APPENDIX 2
HYDROGEN APPLIANCES
Two hydrogen characteristics may create to problems when using it as a fuel in domestic applications:
Hydrogen burns four times as fast as e.g. natural gas, which makes heavy demands on the appliances.
•
• Hydrogen burns with an almost invisible flame: For some appliances this may cause some concern in relation to safety.
These problems will disappear if more sophisticated energy transducers than plain burners are used, such as catalytic burners.
The only emissions produced by hydrogen in energy conversion processes are water vapor and, possibly, NOx during combustion. The NOx formation can be reduced to very small amounts by adjusting the amount of excess air during combustion. This can be done very effectively, without any risk of unstable combustion, in catalytic burners.
The hydrogen appliances may not require flue gas evacuation systems, since the flue gases are so clean. A drain will evacuate the condensed water.
The future may see a number of domestic appliances: cooking ranges with catalytic burners, domestic heaters (boilers), washing machines, dishwashers and tumblers. Domestic heaters may be integrated in a directly heated ventilation system.
The gas companies will compete with other energy companies for the supply of hydrogen for appliances. Commercializing and servicing the hydrogen appliances may also become a business opportunity.
161

APPENDIX 3
MEMBERS OF IGU SG 7.4 Chairman Jacques Saint-Just Gaz de France
Secretary Marc Berger Gaz de France
Denmark Bjarne Spiegelhauer Danish Gas Technology Centre
Italy Gianfranco Visigalli Snam S.p.A.
Japan Takayuki Azuma Osaka Gas Co., Ltd
Japan Kenzo Fukuda IAE WE-NET center
Netherlands Renée Janssen Energy+ID
Spain Fidel Valle Gas Natural sdg, S.A.
Sweden Lars Sjunnesson Sydkraft AB
USA Cathy Gregoire-Padro National Renewable Energy Lab./DOE WOC2
Germany Klaus Ziegler UGS GmbH
WOC5
Netherlands Mannes Wolters Gastec NV
WOC6 Netherlands Jeffrey Seisler European Natural Gas Vehicle Association
162

REFERENCES
1. United States Department of Energy. (February 2002) - A National Vision of America’s Transition to a Hydrogen Economy – to 2030 and Beyond. http://www.eren.doe.gov/hydrogen/pdfs/summary.pdf
2. Hydrogen Energy System; Production and Utilization of Hydrogen and Future Aspects (1995) Yürüm, Y. Editor. Nato ASI Series. Series E; Applied Sciences, Vol. 295. Kluwer Academic Publishers.
3. Simbeck, D and Johnson, H. (2001). World Gasification Survey. Gasification Technologies 2001 Conference. October 8, 2001, San Francisco , CA.
4. 1999-2000 Worldwide Catalyst Product, Process Licensing & Service Directory, Catalyst Consultant Publishing, the Catalyst Group, Spring House, PA, USA.
5. http://www.undp.org/seed/eap/activities/wea/drafts-frame.html
6. http://www.transportation.anl.gov et http://www.lbst.de/gm-wtw
7. IEA Energy data.
8. European Commission; Green Paper “Towards a European Strategy for the security of energy supply” http://europa.eu.int/comm/energy_transport/en/lpi_en.html
9. WE-NET Report Fiscal Year 2000
10. European Commission; Green Paper “Towards a European Strategy for the security of energy supply” http://europa.eu.int/comm/energy_transport/en/lpi_en.html
11. http://www.eia.doe.gov/oiaf/ieo/chinaboxtxt.html
12. Anonymous (2002). People’s Daily. Friday, January 18.
13. BP Statistical Review 2002, and “World Consumption of Primary Energy by Selected Country Groups” in EIA’s web site “http://www.eia.doe.gov/emeu/iea/wec.html”
14. ISO: International Organization for Standardization. IEC: International Electrotechnical Commission. SAE: Society of Automotive Engineers (USA)
15. Hileman, B. (2001). United Nations Environment Program (UNEP)’s report as quoted in C&E News, 79(8):53.
16. Bockris, J.O’ M. (2001). The origin of ideas on a hydrogen economy and its solution to the decay of the environment.. Proceedings of the Third International Conference “Hydrogen Treatment of Materials” (HTM-2001), Donetsk, May 14-18, 2001.
17. http://www lbst.de
18. http://www.eren.doe.gov/hydrogen/iea/
19. http://www.ieagreen.org.uk
20. Bila, A. (2001). Arcelor (the largest steel company in the world). Private communication
21. Cunningham, W. A. (2001). Sensible Response to Global Warming Hysteria. World Energy, 4(1):158-163.
22. http://www.eren.doe.gov/hydrogen/iea/case_studies.html
23. http://www.h2euro.org/publications/docs2002/EHA_WHEC14_JUNE2002.pdf
24. Gretz, J. and Drolet, B. (2002). The Euro-Quebec Hydro-Hydrogen Pilot Project. The beginning of the industrialisation of hydrogen. Proceedings of the 14th World Hydrogen Energy Conference, Montreal, June 9-13 2002. http://www.hydrogen2002.com/
25. http://www.miljo.lth.se/Helby/USHER summary -.htm
26. ADEME (Agence de l’Environnement et de la Maîtrise de l’Energie)
163

27. PACo : Pile A Combustible (Fuel Cell) network
28. http://www.torino2006.it/eng/toroc_198.htm
29. http://www.Novem.nl
30. http://www.senter.nl
31. http://www.EET.nl
32. http://www.nwo.nl/NWOHome.nsf/pages/NWOP_59HK9A
33. http://www.ecn.nl
34. Nederlandse Waterstof Vereniging; NWV.
35. http://www.hydrogems.no/workshops/H2002/H2002_Gloeckner.pdf
36. SINTEF (1994). http://www.ntnu.no/gemini/1994-02E/sog_side_12.html
37. http://www.bellona.no/en/energy/hydrogen/18283.html
38. EDEN : Endogenizar o Desenvolvimento das Energias Novas
39. http://www.miljo.lth.se/Helby/USHER summary -.htm
40. http://www.miljo.lth.se/Helby/USHER summary -.htm
41. Kneza, M. 9/l, 11000 Beograd, Tel: 381 11 3240-018, Fax 3231-397
42. Miranda, P. E. et al. (1999), Results of a Brazilian Study on Large Scale Production of Hydrogen for the National Automobile Market. Euroforum Conference, Paris.
43. Gretz, J. and Drolet, B. (2002). B. the Euro-Quebec Hydro-Hydrogen Pilot Project. The beginning of the industrialisation of hydrogen. Proceedings of the 14th World Hydrogen Energy Conference, Montreal. http://www.hydrogen2002.com/
44. United States Department of Energy. (2002) – A National Vision of America’s Transition to a Hydrogen Economy – to 2030 and Beyond. http://www.eren.doe.gov/hydrogen/pdfs/summary.pdf
45. Hy-Web Gazette 20/12/2002
46. http://www.fischer-tropsch.org/DOE/DOE_reports/400054/400054_08/400054_08.pdf
47. http://www.netl.doe.gov/publications/proceedings/98/98ps/pspa-23.pdf
48. Hydrogen Energy System
49. Lynch, F. (2001). Personal communication
50. http://www.fuelcells.org/fct/buses.pdf
51. http://europa.eu.int/comm/energy_transport/en/lpi_en.html
52. Calculation basis: consumption and forecast figures from the above reference with 1 toe = 3876 Nm3 d’H2
53. Verdugo-Peralta, C. (2002). Accelerating Hydrogen refueling infrastructure by jointly harnessing resources with CNG refueling stations. Proceedings of the 14th WHEC, Montreal.
54. www.hynet.info (2002). “Expression of Interest” list
55. Simbeck, D. R. (2002) CO2 Capture and Storage -The Essential Bridge to the Hydrogen Economy-. Proceedings of the 6th International Conference on Greenhouse Gas Control Technologies (GHGT-6) October 1-4, 2002 Kyoto, Japan
55. Pottier, J. D. Hydrogen Transmission for Future Energy Systems. In Hydrogen Energy System, Y. Yurum Ed. NATO ASI Series. Series E: Applied Sciences- Vol.295. 181-193. Kluwer Academic Publishers. 1995.
56. Simbeck, D. R. (2002) CO2 Capture and Storage -The Essential Bridge to theHydrogen Economy-. Proceedings of the 6th International Conference on Greenhouse Gas Control
164

Technologies (GHGT-6) October 1-4, 2002 Kyoto, Japan
57. Nelson, H. G. (1984). A Review- Materials and Safety Problems Associated with Hydrogen Containment. Proceedings of the 5th World Hydrogen Energy Conference, 1984. 1841-1854
58. Schlum, P. D., Hydrogen Networks (1978), Proceedings, IGT, 2nd International Symposium on Plastic Materials, Cocoa Beach, Fl.
59. Scholten, F. L and Wolters, M. (2002). Hydrogen Diffusion Through Plastic Pipes. Proc. 17th Int. Fuel Gas Pipe Symposium. San Francisco, USA, Oct. 20-23, 2002
60. Yasionowski, W. Y. and Ding Huang, H. (1980). Gas Distribution equipment in hydrogen Service-Phase II. Proc. 15th Intersoc. Energ. Conv. Eng. Conf. 3:2295-3000
61. Kraut, E. and Sauer, A. (1979). Gas diffusion an Kunstoffrohren. GWF Gas/Erdgas, 120(7):327-334
165

APPENDIX 1
MEMBERS OF THE COMMITTEE Chairman Dr Robert Harris, Advantica, UK Vice-Chairman Mr Jean Pierre Roncato, Gaz de France, France Secretary Mr Colin Heap, Advantica, UK Study Group Coordinator 7.1 Dr Sam Bernstein, Energy international / Gastech, USA Study Group Coordinator 7.2 Dr Klaas Buekema, Gasunie, Netherlands Study Group Coordinator 7.4 Dr Jacques St Just, France Algeria Abdoun Rachid Sonatrach AIG Argentina Alberto Rucks Reyes Camuzzi Gas Australia Patrick Daley The Australian Gas Association Belgium Jean Pol Blondiau Steirische Ferngas AG Bosnia & Herzegovina Hilmo Sehovi Federalno Ministarstvo Energije,
Rudarstva I Industrije Colombia Leopoldo Carvajal Croatia Tomislav Jurekovic Gradska Plinara Zagreb Czech Republic Jan Ruml Plynoprojekt Praha,a.s Denmark Ole Sundman DONG A/S Finland Björn AHLNÄS Gasum Oy France Philippe Buchet Gaz de France Germany Hans Wackertapp Ruhrgas AG Iran Mahmood Tavajjoh National Iranian Gas Company Italy Massimo Rivara SNAM S.p.A Japan Masao Wada Osaka Gas Co., Ltd Malaysia Ahmad Jauhari Yahya Segari Energy Ventures Sdh Bhd Norway Bjorn Drangsholt Norsk Hydro ASA Pakistan M.Inam-us-Samad Sui Southern Gas Co.,Ltd Poland Rados aw Dudziski Polish Oil and Gas Company Warsaw Portugal Luis Moura TRANSGAS,S.A Russia G.P.Shvartz GASPROM Slovak Marian Kosnac Istroenergo Group a.s. Spain Fidel Valle Gas Natural SDG,S.A. Sweden Anders Molin Sydgas AB Switzerland A.Kilchmann SVGW Tunisia Zouhaier Amara STEG Ukraine Dr.Igor Karp National Academy of sciences of Ukraine
166

167
APPENDIX 2
COMMITTEE MEETINGS 17th October 2000 Paris, France 20th March 2001 Copenhagen, Denmark 7th – 8th March 2002 Madrid, Spain 17th –18th October 2002 Malmo, Sweden 11th March 2003 Prague, Czech Republic