report of the statistics committee
TRANSCRIPT

2011 – 2012 report
Statistics Committee
Wednesday, June 13, 2012

2
2
Wednesday, June 13, 2012
• STA Committee membership:Chair: Jean-Louis Laffont FranceVice: Kirk Remund USAMembers: Julianna B nyai Hungary
Julia Barabas HungaryOlfat H. El Bagoury EgyptMustapha El Yakhlifi FranceMohamed Hanafi FranceBonnie Hong USAWinfried Jackisch GermanyZivan Karaman FranceTim Perez USA
Gabriel CarréFrance

3
3
Wednesday, June 13, 2012
Overview of support activities from June 2011 to June 2012:
Report reviews
Statistical analyses
Consulting
Statistical tools
Workshops/Seminars
Support to GMO Committee activities
Announcement: 9th ISTA Seminar on Statistics in Seed Testing
Working programme June 2012 – June 2013
Outline

4
4
Wednesday, June 13, 2012
Report reviews: 4 test plan reviews,1 validation report review
Statistical analysis: 2 Method Validationstudies (germination), 1 Comparative Test
(June 2010 – June 2011: 8 test plan reviews,8 validation report reviews
June 2009 – June 2010: 3 test plan reviews,2 validation report reviews
June 2008 – June 2009: 8 test plan reviews,8 validation report reviews)

5
5
Wednesday, June 13, 2012
Consulting:

6
6
Statistical tools

7
7
Wednesday, June 13, 2012
Statistical tools:

8
8
Wednesday, June 13, 2012
Statistical tools:
… also from:
Number of downloads for the period 01/06/2011 31/05/2012

9
9
Wednesday, June 13, 2012
Number of stat tools downloads for theperiod 01/06/2011 31/05/2012
Grand total: 2818

10
10
Wednesday, June 13, 2012
Statistical tools: 2 new tools published
8 downloads since publishing date (21/11/12)New version in preparation
Thanks for the support (testing, documentation)from the Bulking and Sampling Committee, inparticular Leena Pietilä and Dot Vittrup Pedersen.

11
11
Wednesday, June 13, 2012
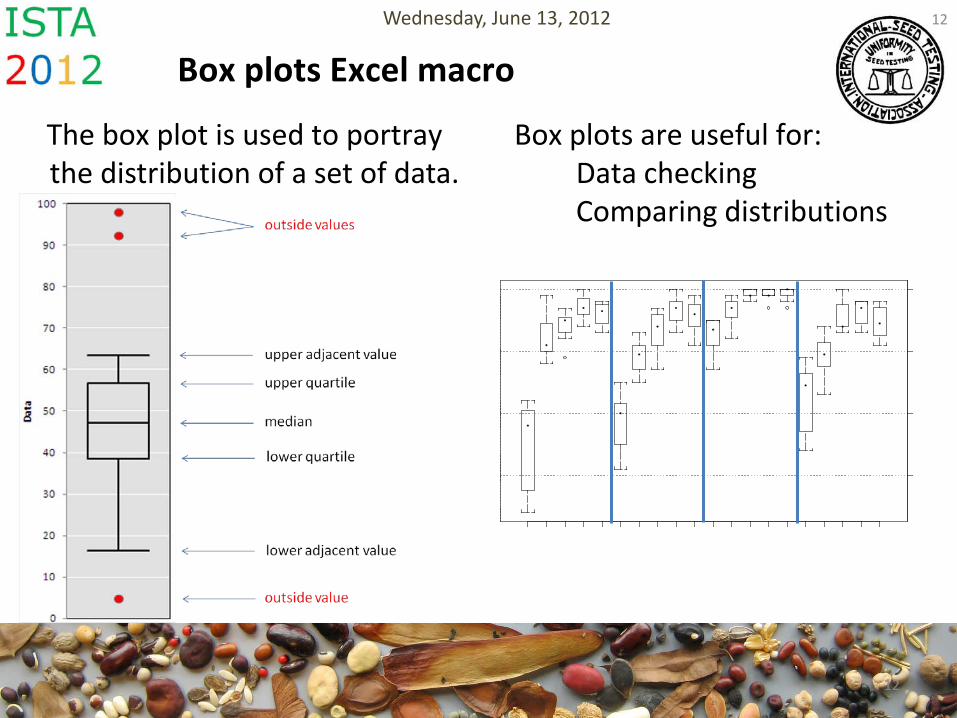
Box plots Excel macro
Microsoft® Excel is widely used for graphing data, but has no included method for creating box plots in the style of Tukey (1977).
There are numerous commercial or free Excel add-ins and macrosfor creating box plots… which are not fully satisfactory.
The macro developed for ISTA provides an easy way to producehigh-quality box plots.
12
12
Wednesday, June 13, 2012
Box plots Excel macro
The box plot is used to portray the distribution of a set of data.
Box plots are useful for:Data checkingComparing distributions

13
13
Wednesday, June 13, 2012
Box plots Excel macro: input data

14
14
Wednesday, June 13, 2012
Box plots Excel macro: output

15
15
Wednesday, June 13, 2012
Box plots Excel macro: next version (thanks to Gabriel Carré)

16
16
Wednesday, June 13, 2012
Heterogeneity Testing Calculator for seed lots in multiple containers
To support Chapter 2.9 of the ISTA Rules
Microsoft® Excel workbook with 9 worksheets:
Purity worksheets: Total pure seedsPurity-Inert matterPurity-Other seeds
Germination worksheets: Germ-Normal SeedlingsGerm-Abnorm SeedsGerm-Dead Seeds
Other seed worksheets: Total number of other seedsNumber of species with the highest numberNumber of species with the second-highest number

17
17
Wednesday, June 13, 2012
Heterogeneity Testing Calculator for seed lots in multiple containers

18
18
Workshops/Seminars
19
19
Wednesday, June 13, 2012
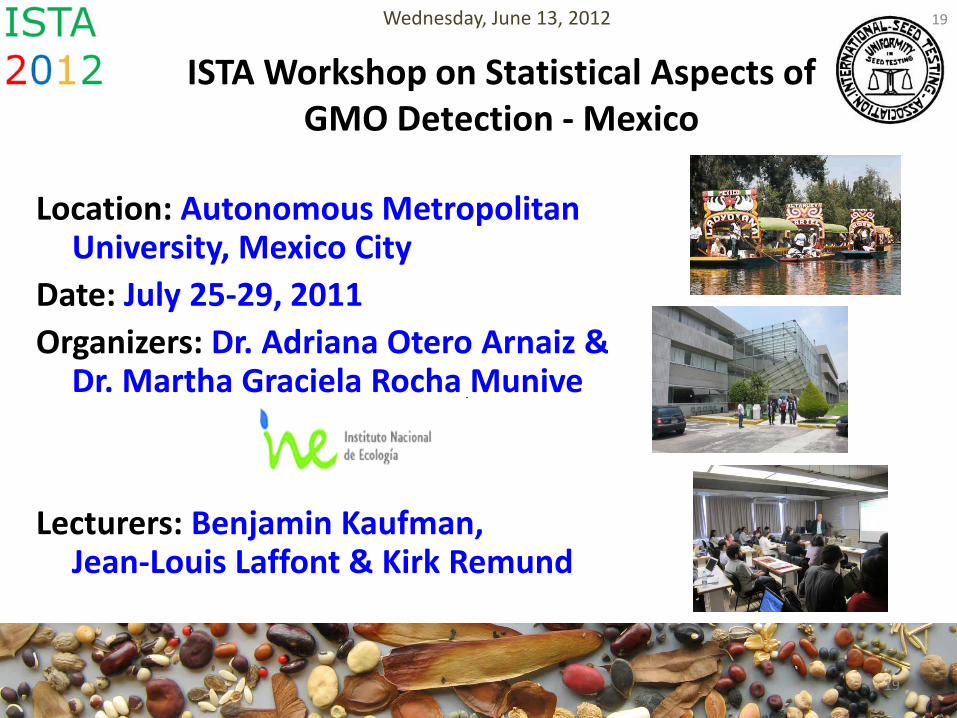
ISTA Workshop on Statistical Aspects of GMO Detection - Mexico
Location: Autonomous Metropolitan University, Mexico City
Date: July 25-29, 2011Organizers: Dr. Adriana Otero Arnaiz &
Dr. Martha Graciela Rocha Munive
Lecturers: Benjamin Kaufman, Jean-Louis Laffont & Kirk Remund

20
20
Wednesday, June 13, 2012
22 participants from Mexico, Uruguay, France, Canada,Kenya and United States
Statistics Topics Useful statistical tools in GMO testing: ANOVA, box plots, QQ plots, …
Qualitative & quantitative seed testing plans - SeedcalcData checkingMeasurement uncertainty NEW!
ISTA Workshop on Statistical Aspects of GMO Detection - Mexico

21
ISTA Workshop on Biotechnology Trait Detection - China
Location: Shanghai Jiao Tong University
Date: December 5-9, 2011Organizers: Dr. Dabing Zhang &
Dr. Litao YangLecturers: Benjamin Kaufman,
Bruno Zaccomer, Cheryl Dollard, Kirk Remund

22
23 participants from China, Taiwan, Brazil, South Korea, Croatia and United States
Statistics TopicsQualitative & quantitative seed testing plans using SeedcalcGM impurity estimation using SeedcalcNew Tools: box plot macro
ISTA Workshop on Biotechnology Trait Detection - China

23
ISTA Workshop on Biotechnology Trait Detection - China
We had lots of fun!!

24
24
Participation (JL Laffont) in:ISTA SEED HEALTH & STATISTICS SEMINAR
Paris, 22 May 2012
Working areas for statisticians:Homogeneity testStability testSH PT rating: binary dataGeneralized Linear Mixed Model for the analysis of proportions: theoretical developments, tools
25
STA contributions to ISTA GMO Testing Rules Chapter
Calculations and expression of results sectionDefinition of seed lot population
Testing objectives
Testing methods
ISTA tools for results calculation

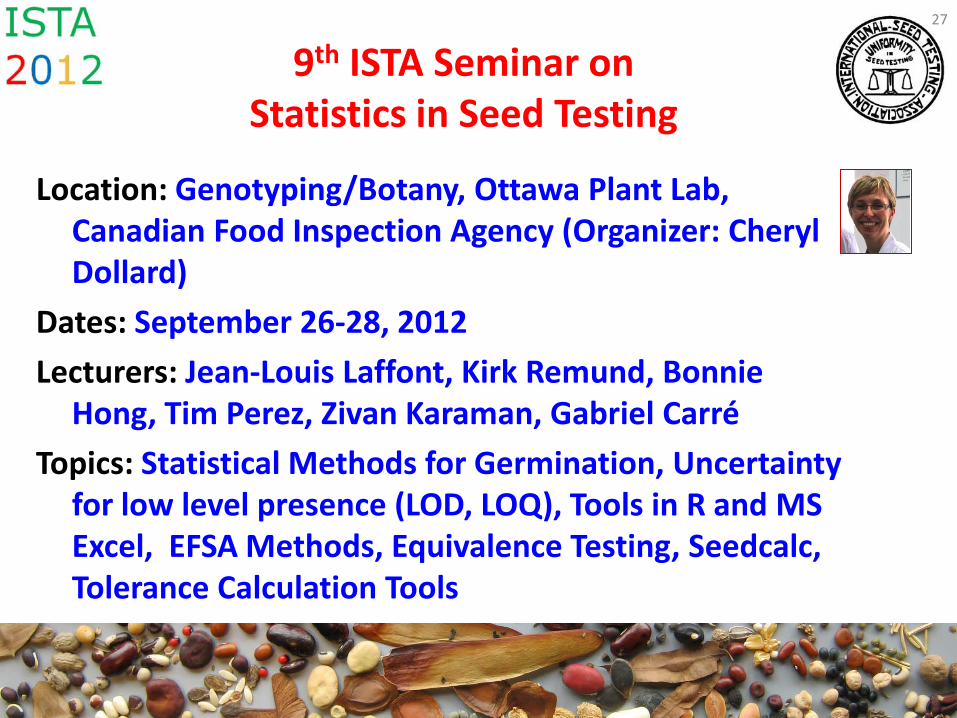
269th ISTA Seminar on Statistics in Seed Testing
27
Location: Genotyping/Botany, Ottawa Plant Lab, Canadian Food Inspection Agency (Organizer: Cheryl Dollard)
Dates: September 26-28, 2012
Lecturers: Jean-Louis Laffont, Kirk Remund, Bonnie Hong, Tim Perez, Zivan Karaman, Gabriel Carré
Topics: Statistical Methods for Germination, Uncertainty for low level presence (LOD, LOQ), Tools in R and MS Excel, EFSA Methods, Equivalence Testing, Seedcalc, Tolerance Calculation Tools
9th ISTA Seminar on Statistics in Seed Testing

28
28
Working programmeJune 2012 – June 2013

29
29
Continue to deliver report reviews, statisticalanalyses, stat consultancy (e.g. answering questions)
Working programme - June 2012 – June 2013
Support
Specific support to:Germination Committee: analysis of in-housegermination method validation study, …GMO Committee: GMO PT rating, GMO PT ratingenhancements, ISTA GMO Testing Rules Chapter,…Bulking and Sampling Committee: check sampling,sample size for other seed count in the heterogeneity test, …
30
30
Working programme - June 2012 – June 2013
Workshops / Seminars
ISTA Seed Health & Statistics SeminarSpring 2013
9th ISTA Seminar on Statistics in Seed TestingOttawa – September 26-28, 2012

31
31
New version of the box plot macro
Analysis of germination validation studies
Seedcalc and SeedcalcStack update
Working programme - June 2012 – June 2013
Excel tools

32
32
Wednesday, June 13, 2012
Acknowledgements
• STA Committee members
• ISTA Secretariat and ISTA ECOM
• TCOM members
• Users of the tools developed by the STA Committee

33
33
Wednesday, June 13, 2012
Thank you for your attention
www.seedtest.org