report of the committee on unorganised sector statisticsreport of the committee on unorganised...
TRANSCRIPT

Report of the Committee
on
Unorganised Sector Statistics
National Statistical Commission
Government of India
February 2012

Preface
Indian economy has preponderance of informal and unorganised sector both in terms of number
of workers and enterprises. This segment of economy has inbuilt vulnerabilities, and the study of
unorganised sector based on reliable data is important for informed decision making and
addressing the problems faced. The National Statistical Commission constituted a Committee on
Unorganised Sector Statistics to identify major data gaps relating to unorganized enterprises and
unorganized workers and to suggest ways and means for developing statistical data base on
unorganized sector with standardized concepts, definitions, coverage and comparability over time
and space.
The task under the purview of the Committee was enormously diverse and multifaceted and
needed to be synthesized, critically reviewing the system in vogue and conceptualising an ideal
system for unorganised sector statistics in order to capture its characteristics in a seamless
manner. I am happy to note that the Committee attempted to accomplish it and in this, the efforts
and intellectual inputs provided by the sub-committee steered by Prof. Sheila Bhalla, IHD is
acknowledged. The other sub-committees steered by Prof. Ravi Srivastava, JNU and Dr. S. L.
Shetty, EPW Research Foundation also made significant contribution, collating the aspects of
data base on the profile of the unorganised enterprises and the associated issues of concept,
definitions and coverage of informal sectors, informal workers and informal jobs; data required to
measure sustainability and risk management issues in respect of the unorganised enterprises and
access to credit and factor and product markets, as depicted in relevant statistics. The deep
involvement of Prof. D. N. Reddy, IHD in preparation of the report and Shri A. B. Chakraborty,
RBI in providing detailed insight on credit issues are appreciated.
The Committee wishes to place on record the valuable assistance provided by different
professional experts including Dr. N. S. Sastry in accomplishing its task. The Committee is
grateful to Dr. Manoj Panda, Director, CESS, Dr. C. Ravi and Dr. B. Sambi Reddy of CESS, for
providing logistic and research support to the Committee meetings at Hyderabad.
Dr. Rajiv Mehta, ADG, NSSO(SDRD) deserves credit for his significant role as the Member
Secretary. The Committee appreciates the untiring contribution of Shri P. K. Mahapatra, DDG,
Shri T. K. Sanyal, DDG, Shri Asis Ray, DDG, Shri Salil Kumar Mukhopadhyay, Director and
other officers of NSSO(SDRD) for providing the technical and professional support. The
Committee places on record its appreciation for Shri M. V. S. Ranganadham, DDG, NSC
Secretariat and his team for extending valuable support to the Committee for its smooth
functioning.
Dated: February, 2012 (Prof. R. Radhakrishna)
Chairman

Report of the Committee
on
Unorganised Sector Statistics
We the undersigned, Chairman and Members of the Committee have adopted
the Report for submission to the National Statistical Commission
(Prof. R. Radhakrishna)
Chairman
(Prof. Sheila Bhalla)
(Prof. Ravi Srivastava)
(Prof. D. N. Reddy)
(Dr. Srijit Mishra)
(Prof. Alakh N. Sharma)
(Shri A. B. Chakraborty, RBI)
(Dr. S. L. Shetty)
(Dr. Asis Kumar, ADG, CSO
(NAD))
(Shri H. P. Sharma,
ADG, CSO(ESD))
(Shri Servesh Kumar, DDG,
NSSO(FOD))
(Shri G. Sajeevan, DDG,
MSME)
(Director, DES, Govt. of
Karnataka)
(Dr. Rajiv Mehta)
ADG, DPD & SDRD & Member
Secretary

List of abbreviations used in the report Abbreviation Description
AIDIS All-India Debt and Investment Survey
AITOT All India Training of Trainers
ASI Annual Survey of Industries
BSR Basic Statistical Returns - RBI
CACP Commission for Agricultural Costs and Prices
CCS Comprehensive Scheme for Study of Cost of Cultivation
CDF Cumulative Density Function
CDS Current Daily Status
CESS Centre for Economic and Social Studies
COCSSO Conference of Central and State Statistical Organisations
CPI Consumer Price Index
CPIAL Consumer Price Index for Agrictural Labour
CPIIW Consumer Price Index for Industrial Workers
CSO Central Statistical Office
CWS Current Weekly Status
DDG Deputy Director General
DDP District Domestic Product
DES Directorate of Economics and Statistics
DPD Data Processing Division
DSO District Statistical Office-DES
EC Economic Census
EDP Electronic Data Processing
ES Enterprise Surveys
EUS Employment and Unemployment Survey
FAO Food and Agriculture Organisation- UN
FARMAP Farm Analysis Package
FOD Field Operation Division
GC Governing Council-NSSO
GDP Gross Domestic Product
GFCF Gross Fixed Capital Formation
GSDP Gross State Domestic Product
GVA Gross Value Added
GVAPW Gross Value Added per Worker
ICLS International Conference of Labour Statisticians
IHD Institute of Human Development
ILO International Labour Organisation
ISIC International Standard Industrial Classification

Abbreviation Description
IT Information Technology
LFPR Labour Force Participation Rate
MPCE Monthly per Capita Expenditure
MSE Mean Standard Error
MSME Micro, Small and Medium Enterprises
NABARD National Bank for Agriculture and Rural Development
NAD National Accounts Division
NAS National Accounts Statistics
NCEUS National Commission on Enterprises in Unorganized Sector
NGO Non-Governmental Organisations
NSC National Statistical Commission
NSO National Statistical Organisation
NSSO National Sample Survey Office
OAE Own Account Enterprises
PDS Public Distribution System
PLFS Periodic Labour Force Survey
PS Principal Status
PU Proportion Unemployed
RBI Reserve Bank of India
RIDF Rural Infrastructure Development Fund
RO Regional Office-NSSO
RSE Relative Standard Error
RTC Regional Training Camp
SC Steering Committee-NSSO
SDDS Special Data Dissemination Standards
SDP State Domestic Product
SDRD Survey Design and Research Division
SHG Self-Help Groups
SIDBI Small Industries Development Bank of India
SNA System of National Accounts
SRO Sub-regional Offices - NSSO
SS Subsidiary Status
SSB State Statistical Bureau
TUS Time Use Survey
UFS Urban Frame Survey
UR Unemployment Rate
USU Ultimate Stage Units
WPR Worker Population Ratio

CONTENTS
Pages
Chapter 1 Importance of Unorganized Sector Statistics
1-3
Chapter 2 Framework of Statistical System for Unorganised
Sector
4-8
Chapter 3 Unorganized Sector Statistics - Current Status 9-24
Chapter 4 Economic Contribution of Unorganised Sector 25-34
Chapter 5 Credit and Institutional Linkages 35-46
Chapter 6 The Challenge of Ensuring the Quality and Credibility
of Statistical Base
47-61
Chapter 7 Recommendations 62-68
Appendix - 1 Constitution of Professional Committee and sub-
committees
69-72
Appendix - 2 Resolution Concerning Statistics of Employment in the
Informal Sector, adopted by the Fifteenth International
Conference of Labour Statisticians (January 1993)
73-76
Appendix - 3 Guidelines Concerning a Statistical Definition of
Informal Employment, endorsed by the Seventeenth
International Conference of Labour Statisticians
(November-December 2003)
77-80
Appendix - 4 Some Concepts Used in
Employment and Unemployment Survey of NSSO
81-82
Appendix - 5 Items of Information of NSS 66th
round (2009-10)
Schedule 10 that can be used to identify workers in
informal sector and informal employment
83
Appendix - 6 Introduction to BSR System 84-87

1
Chapter 1
Importance of Unorganized Sector Statistics
1.1 Introduction
1.1.1 Unorganised or informal sector constitutes a pivotal part of the Indian
economy. More than 90 per cent of workforce and about 50 per cent of the
national product are accounted for by the informal economy. A high
proportion of socially and economically underprivileged sections of society are
concentrated in the informal economic activities. The high levels of growth of
the indian economy during the past two decades is accompanied by increasing
informalisation. There are indications of growing interlinkages between
informal and formal economic activities. There has been new dynamism of the
informal economy in terms of output, employment and earnings. Faster and
inclusive growth needs special attention to informal economy. Sustaining high
levels of growth are also intertwined with improving domestic demand of those
engaged in informal economy, and addressing the needs of the sector in terms
of credit, skills, technology, marketing and infrastructure. 1.1.2 It is increasingly realized that “lack of reliable statistics on the size, distribution and
economic contribution of the sector. . . has been a major constraint in providing a realistic
understanding of the significance of the Indian economy, leading to its neglect in development
planning.“ (NCEUS 2008, P.64). Under the changed circumstances where informal sector is
increasingly interlinked with the formal, and plays pervasive role in the economy and in the
livelihoods of the people, it is imperative to improve the information base of the sector. It is
necessary to build a comprehensive statistical base on various dimensions of the informal
economy as an integral part of the national statistical system.
1.1.3 Clarity of concepts and uniformity of definitions are basic requirements for building a
sound system of statistics. Unorganized sector or informal economy is replete with diverse
concepts and lack uniformity of definitions. The first step in building database on informal sector
is to arrive at definitions that reflect the specific characteristics, and to adopt these definitions for
unambiguous identification of the various components of the sector. Further, it is desirable to
specify the core statistics relating to unorganized sector that needs to be collected and
disseminated with certain regularity as a part of an ideal statistical system that would ensure
reliability and credibility.
1.2 Constitution of NSC Committee on Unorganized Statistics
1.2.1 The National Statistical Commission (2001) and several expert committees recognized the
need for unorganized sector statistics with standardized concepts, definitions, coverage and
comparability over time and space. The task still remains unfinished. There is an urgent need to

2
address the limitations of the present state of unorganized sector statistics without which the
Indian statistical system would not be complete and effective. Putting in place a cohesive,
comprehensive and responsive system of unorganized sector statistics is a daunting task. To
examine this issue in all its dimensions and to make necessary recommendations, the National
Statistical Commission (NSC) constituted a committee on unorganized sector statistics under the
chairmanship of Prof. R. Radhakrishna (see Appendix 1 for the notification of the Committee).
The terms of reference of the Committee are:
i. To examine the existing definitions of informal enterprises and employment and suggest
appropriate modifications with specific objective of their amenability towards better
measurement.
ii. To identify major data gaps relating to unorganized enterprises and unorganized workers.
iii. To review the existing methodologies and arrangements for estimating informal employment
and income arising from informal enterprises and suggest modifications.
iv. To examine the existing databases for estimation of income and employment in informal
sector and suggest improvements .
v. To analyse the present system of data collection relating to informal sector and suggest
modification needed in the coverage and content in the existing surveys or new surveys.
1.3 Proceedings of the Committee.
1.3.1 The Committee held series of meetings and deliberated on different dimensions of
unorganized sector statistics ranging from conceptual and definitional problems to evolving an
ideal system and its implementation. Recognizing the complexity of issues and the need for in
depth attention, four sub-committees, one each on the following issues, were constituted (see
Appendix I for details):
i. Ideal system for unorganized sector statistics
ii. Critical review of employment and unemployment
iii. Critical review of the existing data based on unorganized enterprises, and
iv. Appraisal of the present system of data collection on unorganized sector.
1.3.2 In the deliberations of the Committee, beside the members, there was active participation by
a number of experts and representatives from various ministries as stake holders in the collection,
use and dissemination of statistics relating to unorganised sector. The Committee paid attention
to some of the much neglected aspects like the data required to measure sustainability and risk
management issues, access to credit and the factor and product markets relating to unorganized
sector. Similarly, the NAD‟s requirements of unorganized sector statistics including construction
sector were also deliberated.

3
The reports of earlier expert bodies like the National Statistical Commission (2001) and National
Commission on Enterprises in Unorganized Sector (NCEUS), their recommendations and the
status of action taken on them were very useful in the Committee‟s work. The Committee paid
special attention to the review of existing data bases of unorganized sector and identifying gaps
therein to evolve an ideal system of informal sector data base in terms of adequacy, timeliness
and reliability, and to evolve a road map for smooth transition from the existing system to an
ideal one.
1.3.3 The finalization of the report of the Committee was facilitated by the drafting Committee
chaired by Prof. R. Radhakrishna with Prof. Shiela Bhalla, Prof. D.N.Reddy and Dr. Rajiv Mehta
as members, and ably supported by Mr. P.K.Mahapatra, Deputy Director General, NSSO
(SDRD).
1.4 Structure of the Report
1.4.1 The Report is divided into seven chapters. This introductory chapter is followed by the
second, which gives a comprehensive conceptualistion of a desirable statistical system for the
unorganized sector in the light of international standards but tuned to the Indian conditions.
Chapter 3 analyses the status of the availability of data bases from existing NSS Employment and
Unemployment and Enterprise Surveys, Labour Bureau Annual surveys on Employment and
Unemployment, PLFS, Comprehensive Scheme for Study of Cost of Cultivation of Ministry of
Agriculture, Time Use Survey, Censuses on Micro, Small and Medium Enterprises, Economic
Census – all in terms of content, coverage, conformities and deficiencies with respect to desirable
system. In Chapter 4, a detailed account of the economic contribution of unorganized is given.
Chapter 5 deals with the statistics on credit and institutional linkages of unorganized sector
enterprises. The Chapter 6 discusses the institutional issues relating to challenges of ensuring
quality and credibility of the unorganized sector database. Chapter 7, presents the basic
recommendations of the Committee.

4
Chapter 2
Framework of Statistical System for Unorganised Sector
2.1 Conceptualization
2.1.1 The terms „unorganized‟ and „informal‟ sectors are often used interchangeably. The
informal sector may be broadly characterized as consisting of units engaged in the production of
goods or services with the primary objective of generating employment and incomes to the
persons concerned (15 ICLS, ILO, 1993). These units typically operate at a low level of
organization, with little or no division between labour and capital as factors of production and on
a small scale. Labour relations - where they exist - are based mostly on casual employment,
kinship or personal and social relations rather than contractual arrangements with formal
guarantees.
2.1.2 The prevailing definitions of informal sector emerge from the conceptual framework
evolved by the International Conference of Labour Statisticians (ICLS) under the aegis of
International Labour Office. Concurrently, the conceptual issues are deliberated and synthesized
in two important forums who dealt the issues of informal sector in considerable depth. The
National Commission for Enterprises in the Unorganized Sector (NCEUS) was set up by the
Government of India in 2004, to "review the status of unorganized/informal sector in India
including the nature of enterprises, their size, spread and scope, and magnitude of employment”.
The Expert Group on Informal Sector Statistics, commonly known as the “Delhi Group”, was set
up in 1997 as one of the city groups of the United Nations Statistical Commission to address
various methodological issues involved in the treatment of the informal sector.
2.1.3 “India has built up, over the years, an elaborate and competent statistical system both in
terms of institutions as well as professional manpower.”1 Within the ILO, and beyond it, India‟s
„Delhi Group‟ is recognised as a leader in setting standards for informal economy statistics.
However, the fact that two different systems of the organisation of production coexist side by
side in India is still not adequately reflected in the coverage of India‟s statistical system. The
lack of complete, coherent and comparable data-sets on basic economic variables such as GVA
and employment in the formal and informal segments of the Indian economy constitutes a
challenge to informed development policy and practice.
2.1.4 Two fundamental features of the Indian economy underline the study of informal sector: (i)
the overwhelming predominance of informal enterprises and informal workers and (ii) the fact
that the Indian workforce is a workforce in transition. It was recognised that, in an ideal statistical
system, data would be required to monitor the long run transition from a predominantly rural and
agricultural economy and society to a predominantly urban and non-agricultural one.
1 Page 7, NCEUS (2008) Report on Definition and Statistical Issues Relating to Informal Economy, New Delhi.
5
2.1.5 It is desirable that any statistical system, including that for unorganized sector, should be
such that:
(i) the development of concepts, definitions and demarcation of area for coverage of the survey
are in conformity with those of International Standards, but tuned to country conditions,
(ii) it is possible to segregate the economy into a number of disjoint components (sectors) with
the developed concepts as envisaged in (i) above, ensuring seamless additivity,
(iii) the data-collection strategies are simple and unambiguous for the data-collectors, and
(iv) there will be due consideration for adequate human and financial resources.
2.1.6 The paramount importance of unorganized sector in the economy from the point of view of
not only its contribution and share but also for sustaining the livelihood and well being of a large
section of population is well recognised. Consequently the necessity of well structured and well
defined framework of statistics and its development perspective is also recognized. The
development of unorganized sector has a potent role in the „inclusive growth‟ in the current
paradigm of planning, and such a framework of statistics for formulation of policies and decision
support is the need of the hour. The conceptualization and development of an ideal system of
statistics for unorganized sector is, therefore, to be aimed at bringing clarity in concepts,
definitions, appropriate classification and coverage to meet the diverse requirements of the users.
2.1.7 A system for statistics on informal economy should have the mechanism to capture data on
direct and indirect linkages between the formal and informal sectors, taking into account aspects
like:
(i) forms of organisation e.g. agriculture, which has a different form of organisation than that of
other sectors, like manufacturing,
(ii) existence of differences in labour status like unpaid family workers including self
employment, women‟s participation in extended SNA activities, and
(iii) variation in the nature of unorganised sector across different locations, and
(iv) vulnerability of unorganised sector to shocks.
2.2 The desirable system for unorganised sector in the Indian context
2.2.1 The salient characteristics of a desirable system for an Indian informal economy data base
may need to be identified in terms of four interrelated dimensions:
i) conceptual categories,
ii) coverage,
iii) capability to monitor development, and
iv) institutional issues, including issues of staffing, coordination, accountability, the
credibility of the statistics generated and their effective dissemination.
2.2.2 Concepts and definitions: In a desirable system, concepts and definitions should be broadly
consistent with international practices followed in data collection and dissemination. In the
Indian context, comparability of concepts and methodologies would need to be ensured so that

6
estimates of absolute number of workers, enterprises and GVA by economic sectors would be
consistent and comparable across surveys.
2.2.3 In cases where, for historical reasons, the conceptual categories in the surveys of the data
bases on informal and formal enterprises differ, it is essential that steps are taken to make it
possible to harmonise for their reconciliation. In India, the problem of incompatible conceptual
categories used in complementary surveys is endemic. Surveys of one sector of any particular
industry, say manufacturing, services and construction must use the same conceptual categories.
Similarly, surveys of organised enterprises must use the same definitions and concepts as the
complementary surveys of unorganised enterprises. Conceptual differences in different surveys
are due to the specificity of the surveys and hence any absolute comparability and harmonisation
of the concepts have inherent limitation.
2.2.4 The case of organised and unorganised manufacturing (as conducted during NSS 62nd
round) is one of the examples in India of complementary surveys covering both organised and
unorganised enterprises in the same industrial category. The unorganised manufacturing survey
had covered many enterprises larger than the widely accepted cut off point of under 10 workers.
At the same time, it is known that the Annual Survey of Industries (ASI), which uses a different
sample frame, fails to capture many enterprises, particularly those employing between 10 and 20
workers. Ideally, the solution is to ensure that complementary surveys, such as those of organised
and unorganised manufacturing, are based on a common sampling frame, which, in India, can be
provided by the Economic Census. However, the unorganised enterprise surveys could use the
Economic Census lists for their area sample frame. Economic Census must be updated in a
manner that would provide a usable sampling frame for follow up surveys.
2.2.5 One of the fundamental issues in conceptualisation of unorganised sector is the definition
itself. The definition suggested by ICLS relies on the type of enterprise without any mechanism
of registration such as un-incorporated enterprises. The definition as recommended by the
NCEUS for classifying the informal sector is in terms of number of workers. Therefore, the
framework of the system of unorganised sector statistics should attempt to generate database with
flexibility to meet diverse requirements of users.2
2.2.6 Coverage : The time has come to take a holistic and comprehensive view of the data base
on formal and informal enterprises and formal and informal workers, in each of the primary,
secondary and tertiary sectors, with disaggregation to at least the standard nine-fold industrial
classification of the workforce and production units. The ideal system distinguishes between
formal and informal workers, formal and informal enterprises and between GVA generated in the
formal and informal sectors and collects the data required to monitor trends in these data. In
2 In the case of informal enterprises classified in terms of number of workers, all unincorporated private enterprises
employing less than 10 workers will belong to the informal sector. Should the inclusion and exclusion be solely on
workers criterion or on the nature of enterprise? It is well known that the production units of the informal sector have
the characteristic features of household enterprises and the fixed and other assets used do not belong to them as such
but to their owners. The technology factor may also be determining the deployment of labour for production of
similar goods and services within the similar characteristics of ownership and operation.

7
addition to this, the unorganised sector statistics should bring out the role of the unorganised
sector in the overall economy meaningfully. The data profile should also cover aspects of
institutional and non-institutional credit, their reach and other aspects like trade linkages and
exports.
2.2.7 The data bases of the economy should be complete and coherent in the sense that formal
and informal sector data should fit seamlessly together, leaving no subset of informal workers or
informal economic activities uncovered, and none double-counted. The result should be that
estimates of absolute number of enterprises, workers and GVA in every branch of economic
activity in formal and informal sectors would be additive.
2.2.8 In the case of labour force surveys, the requirements of completeness, seamlessness and
additivity seem largely satisfied. In contrast, it is not so in case of enterprise surveys both for
agricultural and non agricultural sectors. The coverage of enterprises in sectors other than
manufacturing is incomplete. The criteria used for classifying unorganised and organised
manufacturing in vogue do not hold for services, trade and construction. In order to have
seamless coverage of organised and unorganised service sector, an Annual Survey of Services in
respect of its organised sector, similar to the Annual Survey of Industries, should be conducted.
2.2.9 Further, the coverage of the agriculture and allied sectors is also inadequate. The
deficiencies in terms of data compilation, validation and dissemination of the data generated by
the farm level surveys under the Ministry of Agriculture‟s Comprehensive Scheme for Studying
the Cost of Cultivation of Principal Crops in India are discussed in Chapter 3. With respect to
other primary sector activities, the National Accounts Division (NAD) points out, for example,
that with respect to the fishing sector that: i) there is no uniform procedure followed by states to
estimate fish production; ii) subsistence fishing production is not measured scientifically; iii) no
input data is available for fish production. A similar array of deficiencies with respect to the
forestry sector is noted in a background note by the NAD. In short, there is inadequacy of farm
enterprise data for directly estimating GVA generated by enterprises in agriculture, fisheries or
forestry and no data whatsoever on some activities within these broad activity categories.
2.2.10 With respect to the coverage of the unorganised and organised sectors in existing
statistical system, these conspicuous data gaps need to be filled up, and such ambiguities
eliminated.
2.2.11 Monitoring development3 : The early ILO inspired studies underlined the need to capture
the grass roots realities, giving high priority to identify factors constraining decent work and
earnings of informal sector workers.4 These and other studies thought it is important to include a
technology variable in their questionnaires, either the use of electricity in production, or, more
generally, the use of motorised equipment. In India, information on the prevalence of multiple
3 This section relies heavily on passages in chapter 5 in NCEUS Working Paper No 3 (2009) titled Definitional and
Statistical Issues Relating to Workers in Informal Employment. 4 Lack of access to infrastructure services and the inadequate education and skill levels of informal workers were identified as key
constraints.
8
income sources among operators of informal enterprises and members of their households, and
their employment status, has proved analytically useful. So is the information about whether or
not enterprise operators or members of their households own or operate agricultural land.
Similarly, the extent to which those who run informal enterprises are independent decision-
makers with respect to what to produce and how much to produce, and when, information on
these aspects can provide insights into the character of their operations. Finally, social group has
been shown to be a decisive factor in determining what kind of enterprises people operate, and
their links with input suppliers and buyers of final output in both rural and urban areas. Data on
some of these indicators are needed to track the transition from a predominantly rural and
agricultural economy to an urban and non-agricultural one.
2.2.12 Institutional issues: The refinement in the framework of unorganised sector statistics
conceived on the lines of concepts, definitions and the capability to meet the objectives of
development planning seeks to address pertinent institutional issues relating to their quality and
reliability. The mechanism of data collection and the resources used for this purpose at present,
are not adequate There are serious institutional issues, including issues of staffing, supervision,
coordination, accountability and credibility of statistics generated and these need to be addressed
with at most priority.
2.2.13 In order to bridge the divergence in concepts and harmonization thereof, in the spirit of
developing an ideal system, an important institutional mechanism can be set up as a dedicated
unit within NSO for standardizing the concepts, definitions and coverage for surveys on each of
the subjects and for promoting their adoption by all official agencies who conduct the surveys. It
should also ensure avoidance of duplication and discrepancy among the data sets.
2.3 The Committee recognized the paramount importance of unorganized sector in the economy
from the point of view of not only its contribution to and share in the economy but also for
sustaining the livelihoods in the economy and well being of a large section of population.
Consequently, the necessity for a well structured and well defined framework of statistics is
recognized as essential. The development of unorganized sector has a potential role in the
inclusive growth in the current paradigm of planning, and an ideal framework of informal sector
statistics for formulation of policies and decision support is the need of the hour. The
conceptualization and development of an ideal system of statistics on unorganized sector is
therefore to be aimed at bringing clarity in concepts, definitions and coverage to meet the diverse
requirements of the users.
2.4 The Committee feels that effective dissemination of official statistics on informal sector
should also be an important function of a desired system of statistics. The Committee
recommends that regular and timely dissemination of informal sector statistics collected by the
public agencies should form part and parcel of the national policy on dissemination of statistics.

9
Chapter 3
Unorganized Sector Statistics- Current Status
3.1 Prologue
3.1.1 The existing data bases of unorganized sector are briefly appraised here in terms of the
definitions and concepts used, the methods of collection, the extent of coverage with a view to
identify the conceptual deficiencies, limitations of techniques of collection and coverage keeping
in view the demands for evolving an ideal system. This chapter provides a synopsis of conceptual
framework of informal sector and the status of nationwide surveys on Employment-
Unemployment and Enterprise Surveys carried out by National Sample Survey Office, Labour
Bureau etc.
3.2 Concepts and definitions of informal sector
3.2.1 A review of concepts and definitions associated with the collection of data in India on
informal sector and informal employment by various organisations is presented below. A
conceptual framework of broad „Ideal System‟ of statistical database of informal sector has
already been deliberated in Chapter 2.
3.2.2 In 1972, the term informal sector was first used by the International Labour Organisation
(ILO) to denote a wide range of small and unregistered economic activities. Since then, the term
has been debated much for want of a universally acceptable definition. In the Fifteenth
International Conference of Labour Statisticians (15th
ICLS) held in 1993 at Geneva, the Labour
Statisticians discussed various issues relating to the concept and definition of informal sector and
took a resolution concerning statistics of employment in the informal sector. Later, the System of
National Accounts (SNA 1993) recommended by the United Nations also endorsed this
resolution with regard to the concept of informal sector.
3.3 Definition of informal sector as per 15th
ICLS (January 1993) and informal
employment as per 17th
ICLS (November-December 2003)
3.3.1 Operational definitions: For statistical purposes, the informal sector is regarded as a group
of production units which, according to the definitions and classifications provided in the United
Nations System of National Accounts (Rev. 4), form part of the household sector as household
enterprises or, equivalently, unincorporated enterprises owned by households.
3.3.2 The 15th
ICLS recommends that for practical reasons, the scope of the informal sector may
be limited to household enterprises engaged in non-agricultural activities. Informal employment,
as per 17th
ICLS, comprises the total number of informal jobs, whether carried out in formal
10
sector enterprises, informal sector enterprises, or households, during a given reference period.
Broadly, the following can be treated as having informal employment:
(i) own-account workers employed in their own informal sector enterprises;
(ii) employers employed in their own informal sector enterprises;
(iii) contributing family workers, irrespective of whether they work in formal or informal
sector enterprises ;
(iv) members of informal producers‟ cooperatives ;
(v) employees holding informal jobs in formal sector enterprises, informal sector
enterprises, or as paid domestic workers employed by households ;
(vi) own-account workers engaged in the production of goods exclusively for own final use
by their household.
3.3.3 Resolution concerning statistics of employment in the informal sector, adopted by the
Fifteenth International Conference of Labour Statisticians (January 1993) and Guidelines
concerning a statistical definition of informal employment, endorsed by the Seventeenth
International Conference of Labour Statisticians (November-December 2003) are given at
Appendix- 2 and Appendix- 3 respectively for ready reference.
3.4 Informal sector in the context of SNA
3.4.1 The 2008 SNA contains a chapter dedicated to the question of measuring activity carried
out within households on an informal basis (the so-called informal sector) and activity that
escapes formal statistical measurement (the so-called not-observed economy). This chapter deals
with the conceptual framework for preparing tables presenting data on informal sector and
informal employment, one on the production and income generated and the other on employment,
supplementary to the national accounts.
3.4.2 In the SNA, household enterprises do not constitute separate legal entities independently of
the household members who own them. Fixed capital used in production may also be used for
other purposes and as such the assets do not belong to the enterprise as such but to the household
members. As a result, it may be impossible to compile a complete set of accounts for the
household productive activities including the assets, financial and non-financial, attributable to
those activities. It is for this reason, the lack of complete accounts, that the production activity
remains within the households sector as an unincorporated enterprise rather than being treated as
a quasi-corporation in the corporate sectors.
3.5 Coherence between ILO and SNA
3.5.1 The ILO concept of the informal sector takes household unincorporated enterprises and
further subdivides them into three: one part forming the informal sector, a second part being units
treated as formal, based on the number of employees or registration, and the third part being
referred to simply as households. The subset of household enterprises treated as belonging to the
informal sector have economic objectives, behaviour and a form of organization that sets them

11
apart from other unincorporated enterprises. Specifically, the informal sector is defined according
to the types of production the enterprise undertakes, still maintaining the production boundary of
the SNA and not extending it to include own use household services.
3.5.2 The 15th
ICLS distinction between units exclusively engaged in production for own final
use and other units does not match precisely the SNA 2008 distinction between households as
market producers and producers for own final use. The SNA considers the enterprises most or all
of whose output is marketed as market producers only, and those most or all of whose output is
intended for own final use as producers. The 15th
ICLS chose a wider concept of market
producers (i.e. household unincorporated enterprises with at least some market production) and a
narrower concept of producers for own final use (i.e. household unincorporated enterprises not
marketing any of their production), because it realized the practical difficulties involved in
determining „most‟ and felt the need, in the context of informal sector measurement, to take all
market activities into account.
3.6 National Commission for Enterprises in the Unorganized Sector
3.6.1 It is pertinent to note that the National Commission for Enterprises in the Unorganized
Sector (NCEUS) has extensively referred to the concepts and results of NSS survey on
Employment and Unemployment. While addressing the issues of employment in informal
sectors, the NCEUS noted that: „employment in India can be meaningfully grouped into four
categories to reflect quality and its sectoral association. These are (a) formal employment in the
formal or organised sector, (b) informal employment in the formal sector, (c) formal employment
in the informal sector, and (d) informal employment in the informal sector. We find that the
Indian economy is dominated by (d) constantly around 86 percent of employment as of 2004-05.‟
The related issues of statistical framework for the unorganized sector statistics were also detailed
in NCEUS reports on Definitional and Statistical Issues relating to the Informal Economy
(NCEUS 2008)
3.6.2 The Commission‟s recommendation relating to the definition of informal sector is as
follows:
Informal Sector: “The unorganized sector consists of all unincorporated private enterprises
owned by individuals or households engaged in the sale and production of goods and services
operated on a proprietary or partnership basis and with less than ten total workers”.
Informal worker/employment: “Unorganized workers consist of those working in the
unorganized sector or households, excluding regular workers with social security benefits
provided by the employers and the workers in the formal sector without any employment and
social security benefits provided by the employers”.
Informal economy: The informal sector and its workers plus the informal workers in the formal
sector constitute the informal economy.

12
The Commission considered all agricultural activities undertaken on agricultural holdings, either
individually or in partnership, as being in the unorganised sector. According to this definition, it
excludes only the plantation sector and other types of organised agriculture (e.g. corporate or
cooperative farming) and covers a very large part of agriculture.
It is therefore to be noted that the Commission has also made an important distinction between
organized or formal and unorganised or informal employment as outlined above.
3.7 Delhi Group and Country Contexts
3.7.1 The International Labour Organization (ILO) has been instrumental in establishing a
concept of an informal sector to identify a set of production units within the SNA household
sector that are particularly relevant for policy analysis and formulation, especially in many
developing countries and countries in transition. This work addresses the question of how the
market economy is penetrating areas outside the formal parts of the economy. The ILO work is
pragmatic in realizing that it is very difficult to establish a definition of the informal sector that is
strictly comparable across countries given the difference in the structure of micro and small
enterprises, the national legislation covering registration of enterprises and the labour laws. An
Expert Group on Informal Sector Statistics (known as the Delhi Group) was set up in 1997 to
address, among other issues, both the conceptual and operational aspects of the ILO definition.
3.7.2 Since the informal sector manifests itself in different ways in different countries, national
definitions of the informal sector cannot be fully harmonised at present. International agencies
should disseminate informal sector data according to the national definitions used. In order to
enhance the international comparability of informal sector statistics, they should also disseminate
data for the subset of the informal sector, which can be defined uniformly (CSO, 1999). To arrive
at this subset, the Delhi Group adopted a set of recommendations. Some of the important
recommendations are given below:
i. All countries should use the criteria of legal organisation (unincorporated enterprises), of
type of accounts (no complete set of accounts) and of product destination (at least some
market output).
ii. Specification of the employment size limit of the enterprise in the national definition of
the informal sector is left to the country‟s discretion. For international reporting, however,
countries should provide figures separately for enterprises with less than five employees.
In the case of multiple-establishment enterprises, the size limit should apply to the largest
establishment.
iii. Countries using the employment size criterion should provide disaggregated figures for
enterprises, which are not registered, as well as for enterprises, which are registered.

13
iv. Countries using the criterion of non-registration should provide disaggregated figures for
enterprises with less than five employees as well as for enterprises with five and more
employees.
v. Countries, which include agricultural activities, should provide figures separately for
agricultural and non-agricultural activities.
vi. Countries should include persons engaged in professional or technical activities if they
meet the criteria of the informal sector definition.
vii. Countries should include paid domestic services unless these are provided by employer.
3.8 Measuring Informal Economy through NSS Surveys
3.8.1 As mentioned earlier, the terms unorganized and informal sectors are often used
interchangeably and are interrelated as per definitional framework. The main sources of data
relating to unorganized and informal sector are the socio-economic surveys conducted by the
National Sample Survey Office (NSSO). These surveys capture the aspects of unorganized
economy in two broad dimensions, viz. in the context of enterprises and the nature of
employment. The NSS enterprise surveys, in the past, have covered unorganized non-agricultural
enterprises, covering manufacturing, services and trade. In the NSS 55th
round, the subject of
informal sector enterprises was covered where the informal sector comprised proprietory and
partnership enterprises. The NSS 67th
round is the exclusive enterprise survey covering
unincorporated non-agricultural enterprises (manufacturing, trade and other services, excluding
construction).
3.8.2 The employment and unemployment surveys conducted by NSS periodically provide
comprehensive account of work force of informal nature as well as workforce engaged in
informal sector. NSSO conducted an integrated survey of households and enterprises in its 55th
round during July 1999 to June 2000. In this survey, besides collection of usual information on
employment-unemployment indicators, certain information on workers in the non-agricultural
sector was collected, to measure employment in the informal sector. Information on
characteristics of the enterprises, fixed assets, employment, expenses and receipts, value added,
employment etc. was collected from the enterprises surveyed. In this survey, all unincorporated
proprietary and partnership enterprises were defined as informal sector enterprises.
3.8.3 NSS Surveys on Unorganized Enterprises: NSS enterprise surveys carried out in the past as
part of socio-economic surveys mainly dealt with unorganized enterprises. The term unorganized,
however, is less precise in case of service and trade sectors as compared to manufacturing sector
where organized sector comprises factories with 10 or more workers using power or with 20 or
more workers without using power, which are registered under section 2m(i) and 2m(ii) of
Factories Act, 1948. The organised manufacturing industries are otherwise covered under Annual
Survey of Industries (ASI). However, in case of services and trade, no such distinction exists. In
NSS 55th
round, survey on informal non-agricultural enterprises was undertaken. In this survey
all unincorporated proprietary and partnership enterprises were defined as informal sector.

14
3.8.4 NSS 67th
round enterprise survey (July 2010 to June 2011) is of specific significance from
the point of view of informal sector, as the subject coverage is exclusively of unincorporated non-
agricultural enterprises in manufacturing, trade and other services, excluding construction. The
main aim of this survey is to estimate the total number of enterprises, number of workers, gross
value added per worker, fixed capital per enterprise, gross fixed capital formation (GFCF) per
enterprise, outstanding loan per enterprise, capital productivity (GVA/Fixed Capital) and other
operational/economic characteristics of enterprises.
3.8.5 For construction, there is hardly any enterprise survey at all – neither for the formal sector
nor for the informal sector. In the words of the National Accounts Statistics – Sources and
Methods 2007: “In the estimation of GVA of construction, indirect approaches are adopted, in the
absence of direct data on construction works. As a result, a number of rates and ratios are used.
Although, most of these are updated at the time of revision of base year, the year to year changes
in these rates are also expected to be significant. Presently, only five basic materials are examined
in detail to estimate the value of output of accounted construction.” “The proportions of GVA to
value of output for kutcha, (unaccounted) construction works are not based on satisfactory data.”
Similarly, in the case of unorganised services, as an NAD note puts it: “All enterprises other than
public sector – administrative, local bodies are treated as unorganised.” There is an urgent need
to improve the methods of arriving at estimates of GVA from service and construction sector
based on sound methodology and database.
3.9 NSS Surveys to measure Informal Sector employment and Informal Employment
3.9.1 Basis of classification of workers in informal sector and informal employment: In the
determination of workers in the informal sector, the basic elements are identification of the
household enterprises and the persons working in such enterprises. In NSS surveys, information
on the type of enterprise in which the persons are engaged is collected in both usual principal
status and subsidiary status. The enterprises are classified in the following categories:
i. Proprietary
ii. Partnership
iii. Government/public sector
iv. Public/private limited company
v. Co-operative societies/ trusts/other non- profit institutions
vi. Employer‟s households
vii. Others
Among these enterprises, proprietary and partnership enterprises are classified as informal sector
enterprises. The important concepts used in NSS Employment and Unemployment survey are
given in Appendix - 4.

15
3.9.2 In NSS 61st round and NSS 66
th round, besides collection of information on the
characteristics of the enterprises, which is essential for identification of informal sector, a set of
probing questions were asked to those engaged in economic activities in the principal status and
subsidiary status in the capacity of regular wage/salaried employment and casual status. These
probing questions were asked to those engaged in non-agricultural sector and a part of the
agricultural sector excluding „growing of crops‟ and „growing of crops combined with farming of
animals‟. Using the information on conditions of employment, jobs were categorised as informal
or otherwise. The specific questions on conditions of employment were as follows:
i. type of job contract (no written job contract, written job contract: for 1 year or less, more
than 1 year to 3 years, more than 3 years).
ii. whether eligible for paid leave,
iii. availability of social security benefits (PF/pension/ gratuity/health care and maternity
benefits).
Conceptual Framework of Informal Employment as endorsed by the Seventeenth International
Conference of Labour Statisticians has been placed in Appendix -3. Items of information
collected in EUS and ES of NSSO to measure informal sector employment and informal
employment, in conformity with the ICLS conceptual framework is summarised in Table 3.1.
3.9.3 The Committee took note of the preponderance of the workforce in the sector with
symptoms of informality such as deprived job- security, tenurial security, guard against arbitrary
dismissal, safety in work-profile, social security benefits etc. It also noted that NSSO
Employment-Unemployment Survey (EUS) and Enterprise Surveys (ES) up till now are able to
depict some notable features of the growing Informal sector and Informal employment but not
enough for proper policy framing addressing their concerns. The Committee also recognized that
the present questionnaire of NSS EUS is already heavy. However, considering the importance of
data on informal employment, it recommends to incorporate in the present EUS schedule a few
more probing questions pertaining to informal characteristics of the enterprises and the
workforce, as stated earlier and conduct the survey quenquennially. If such augmentation is
found to be not feasible, then a full fledged survey on informal sector alone (based on usual
activity status approach for principal and subsidiary status) can be conducted on quinquennial
basis as the follow up of quinquennial EUS. Similar exercise can be thought of in respect of EC
& ES as well.

16
3.10 Limitations of the NSS surveys in estimating the magnitude of workers in informal
sector and informal employment:
3.10.1 Most countries exclude agricultural and related activities from the scope of statistics on the
informal sector, but some include them. The 15th
ICLS recognized that, from a conceptual point
of view, there was nothing against the inclusion, within the scope of the informal sector, of
household unincorporated enterprises engaged in agricultural and related activities, if they meet
the criteria of the informal sector definition. For practical data collection reasons, however, the
Table 3. 1: Sources of data from NSS surveys for the different cells of the Conceptual Framework of Informal
Employment
description of type of worker in the
production unit
numbered cell in
the conceptual
framework of
informal
employment vide
Appendix- 3
source of
information
through NSS
surveys*
comments
(for ES with reference to NSS 67th
round and for EUS with reference to
NSS 66th
round) EUS* ES**
(1) (2) (3) (4) (5)
contributing family workers in formal
sector enterprises
1 √ X
informal employees in formal sector
enterprises
2 √ X
informal own-account workers in
informal sector enterprises
3 √ √ if all the household enterprises are
considered informal
informal employers in informal sector
enterprises
4 √ √ if all the household enterprises are
considered informal
contributing family workers in
informal sector enterprises
5 √ √ For ES this also includes the
exchange labours working without
payment
informal employees in informal sector
enterprises
6 √ √ if all the household enterprises are
considered informal
formal employees in informal sector
enterprises
7 √ √ if all the household enterprises are
considered informal
members of producers‟ co-operatives 8 x x in EUS no separate statuses in
employment is identified as
„members of producers co-operative‟
and no separate enterprise type code
is also identified
own account worker in household
sector (i.e., households producing
goods exclusively for their own final
use and households employing paid
domestic workers)
9 x x household sector producing goods
exclusively for their own final use is
not separately identified
informal employees in household
sector
10 √ x
*: EUS: employment and unemployment survey **ES: Enterprise survey
ES: enterprise survey

17
15th
ICLS provided the option to exclude agricultural and related activities from the scope of
informal sector surveys and to measure them separately.
3.10.2 In the Indian context, about 52 per cent of workers are engaged in agricultural activities
which are outside the coverage of employment-unemployment surveys for measurement of
workers in informal sector or informal employment (about 65 per cent of the rural usual status
workers and nearly 7 per cent of urban usual status workers are excluded from the coverage).
Thus, from the employment and unemployment surveys of NSS, information on informal sector
and informal employment cannot be generated for all those engaged in the agricultural sector.
3.10.3 One of the areas of data gap in the study of informal employment is the quality of
employment. The issue of quality may need to be seen in terms of working conditions and
environment, durability of employment, duration of work, earnings and labour productivity,
protection of labour rights, safety of workers and similar other criteria and conditions. NSS
survey, within its limitations, captures some of these aspects of employment, and some more
items can be improvised in the survey instruments. Some of these characteristics are also
overlapping and may need to be defined more specifically.
3.10.4 Durability of employment is an important qualitative characteristic. Its absence renders the
employment precarious, reduces productivity and leads to the prevalence of under- employment.
This condition is analogous to the insecurity of employment. In the NSS 61st round, information
on non- regularity of work and part time work for usually active workers was captured and its
prevalence was found to be significant for female workers. To ascertain the causes of such
precarious employment, methodological studies should be undertaken and specific indicators and
data needs be identified.
3.10.5 Regarding the aspects of labour productivity and labour efficiency, data are required for
earnings corresponding with the more detailed information on time duration of work. Though,
there is preponderance of self employment in overall work profile and more pronouncedly in
informal employment, there are inherent constraints in collection of data on earning from self
employment. The proposed Periodic Labour Force Survey will be attempting to capture earnings
from self employment besides recording the working details in hours in its approach of Current
Weekly Status (CWS). In the normal Employment and Unemployment Survey instruments, in
case of Current Daily Status (CDS) the hours worked on one day (last working day) out of seven
days activity profile may elucidate some useful information on the aspect of days worked.
3.10.6 Though the information on safety provision is also an important dimension of quality of
work, there are practical difficulties in capturing this information. The safety is an issue that
varies from activity to activity and different occupations may have respective protocol of safety.
Before furthering the exploration and feasibility of such data collection, the variable standards of
safety would need to be studied.

18
3.11 Annual Surveys of Labour Bureau
3.11.1 Labour Bureau at the behest of the Ministry of Labour & Employment, undertook a
survey on employment & unemployment in 2010 primarily to gauge the situation of employment
and unemployment in the wake of volatile economic scenario resultant to global recession.
Labour Bureau conducted the first Employment-Unemployment Survey for the year 2009-10
during April-August, 2010 covering 300 districts of 28 States/UTs selected from four strata
within each State/UT, based on population of 2001 census followed by selecting 16
villages/urban blocks from selected districts.
3.11.2 The second Annual Employment-Unemployment Survey for the year 2010-11 is being
conducted in all the States/UTs by covering all the districts. The survey has been launched from
July, 2011 and the field work is expected to be completed within 4-5 months from the date of
launch. During the present survey, proportionate allocation technique is used based on rural-
urban population for deciding the sample size in each district. About 1.25 lakh household
schedules are proposed to be covered in all the States/UTs. Each district of a State/UT has been
divided into two strata: i) rural stratum comprising all the rural areas of the district and ii) urban
stratum comprising all the urban areas of the district.In all 35 States/UTs, a total sample of 12044
FSU‟s is allocated at All India level keeping in view the resource availability and other logistics.
Broadly considering the population proportion, a sample of 7256 FSUs is allocated to rural sector
in 35 States/UTs, while rest 4788 FSUs are allocated to urban sector.
3.11.3 The rural and urban sample size in the Labour Bureau survey is almost same as NSS
Employment-Unemployment survey. In the approach of usual status, the fixed reference period
of last financial year (April - March) is taken, unlike in NSS where the reference period is
preceding 365 days. There is some difference in second stage stratification from NSS. The
Labour Bureau survey follows the same classification of activities as followed in NSS.
3.11.4 However in Labour Bureau survey, the aspects of informal employment and characteristics
of employer to classify the sector of employment as formal or informal is not envisaged. The
survey also does not envisage to collect data on earnings from self employment, though provision
in made to collect some information on wage rate for regular and casual wage earners. Data
collection and supervision work is done by the state DESs, in some States, and in other States it is
done by contract personnel. The overall supervision is done by the Labour Bureau officials.
3.11.5 In the context of recent initiative to conduct the Annual EUS by Labour Bureau, primarily
to gauge the impact of economic volatility on the labour market, the Committee felt the need of
such assessment for informal employment as well, since these workers are expected to be more
vulnerable. The Committee therefore recommends exploring the possibilities of capturing the
salient aspects of informal employment in the Annual EUS conducted by Labour Bureau, on the
lines of NSSO EUS.

19
3.12 Periodic Labour Force Survey (PLFS) of NSSO
3.12.1 As already discussed, the employment and unemployment surveys undertaken by the
National Sample Survey Office (NSSO) are the prime source of statistics on labour market in
India. These surveys provide basic labour force indicators in cross classification of age, sex,
education, industry, occupation, etc. in an interval of one year or more. Considering the need for
data to measure the dynamic behavior of labour market at short intervals, the National Statistical
Commission (NSC) recommended collection of labour force data more frequently. On the
recommendation of the National Statistical Commission (NSC), the Ministry of Statistics and
Programme Implementation (MoS&PI) constituted a Committee on „Periodic Labour Force
Survey (PLFS)‟, during February, 2009, to develop survey methodology for generating
monthly/quarterly labour market data at the national and state levels in urban areas. The
Committee on PLFS recommended for generation of quarterly labour force indicators on Worker
Population Ratio (WPR), Labour Force Participation Rate (LFPR) and Unemployment Rate (UR)
by adopting Current Weekly Status (CWS) approach followed by NSSO in the usual employment
and unemployment surveys. The Committee also recommended collection of data on earnings
from employment for broad categories of workers viz. casual labour, regular salaried/wage
employees and self employed. With the objective to provide estimate of both level parameter and
change parameter with quarterly periodicity, the Committee recommended for rotational panel
survey. The sampling design specified by the Committee is stratified multi-stage design with
3128 Urban Frame Survey (UFS) blocks as first stage units (FSU) and 12 households per block
as the ultimate stage units (USU).
3.12.2 The Committee on „Periodic Labour Force Survey (PLFS)‟ felt the necessity of
conducting a pilot survey before launching regular PLFS. Accordingly, a committee was set up
by NSSO to address the issues to conduct pilot survey for generating quarterly indicators of
labour force. The Committee viewed that the pilot survey will be conducted in the urban sector of
three States viz., Gujarat, Himachal Pradesh and Orissa. The finalized survey instruments and
sample design for pilot PLFS were endorsed by the NSC in its 40th
meeting. The pilot survey on
PLFS has been started from July 2011 and will be conducted for a period of one year with a
sample size of 288 FSUs in each of the four quarters.
3.12.3 Three schedules viz. (i) Schedule 0.0PL (List of households), (ii) Schedule 10.1(First
Visit) and (iii) Schedule 10.1(Revisit) are being canvassed.
3.12.4 The rotational panel survey has been adopted in PLFS. In this design, 25 per cent of the
FSUs of each quarter are being replaced by a new set of FSUs. The selected households in an
FSU will be surveyed for the successive periods during which the FSU remains in the sample.
3.12. 5 Items of information collected through PLFS Pilot:
(i) household characteristics: household size, household type, religion and social group.

20
(ii) demographic particulars of the household members: sex, age, marital status, education
level, number of years in formal education.
(iii) current weekly activities of the household members of age 15 years and above: (a)
whether worked for at least 1 hour on any day of the reference week, (b) Whether
sought/available for work for at least 1 hour on any day during the week, (c) ‘hours
worked‟ by the workers on each day of the week; (b) weekly activity status, industry,
occupation for two major work activities of the week; (d) earning from employment, (e)
type of enterprise for the regular wage/salaried employees, etc.
3.12.6 The survey findings of PLFS will be released in the form of summary of results of various
indicators and their changes for every quarter. The indicators are labour force participation rate
(LFPR), worker population ratio (WPR), unemployment rate (UR), wages, industrial and
occupational distribution of workers for states and all-India. The estimates will be released for
persons of age 15 years and above for the classificatory variables sex (male/female/person), age
(15-29 years, 15-59 years, 15 years and above), educational level (not literates, literate but below
secondary, secondary and above), social group (ST, SC, OBC, Others).
3.12.7 It may be seen that the data relating to informal employee and the employment in informal
sector through the Labour Force Surveys of NSSO, is based on the approach of usual status.Such
indicators are generated on the basis of usual employment characteristics pertaining to the aspect
of security (social and job) corresponding to the activity status. In addition to this, the
characteristics of the enterprise corresponding to activity status facilitate the measurement of
informal employment and employment in informal sector. In the current status approach, a
person is likely to have multiple activities with corresponding industry and occupation
classification. Since the measurement of informalisation corresponds to activity status, there are
practical constraints in capturing the information.
3.12.8 As against the usual employment and unemployment surveys of NSSO, the PLFS can not
provide estimates for (a)underemployment: information like „whether sought/available for
additional work‟ or „whether sought/available for alternative work‟ is not collected through PLFS
and (b) informal sector employment/informal employment: information on (i) number of workers
in the enterprise in which a person is employed, (ii) type of enterprise for all workers, (iii)
conditions of employment like „type of job contract‟, „eligibility of paid leave/social security
benefit‟ etc. is not collected through PLFS Pilot.
3.13 Time Use Survey (TUS)
3.13.1 The coverage of the conventional Labour- Force surveys as conducted by NSSO does not
include some SNA activities predominantly done by females and children, mostly in rural areas.
These activities include domestic work e.g. cooking for household members, looking after the
children etc. Multiple activities pursued by the persons, whether simultaneously or not, cannot be
accounted for, when the number of activities exceed two. Time Use Survey is conceived to take
account of all theses aspects of the labour market with special emphasis on women participation,
in particular. In fact, it can supplement and complement the conventional Labour- Force surveys

21
by way of collecting data on how people spend their time in an entire 24 hour period. But it is a
very difficult survey to undertake, as it requires collection of data for each person of the selected
households for his/her activities during 24- hour period. In India, a pilot of TUS was conducted
by CSO in 6 selected States, namely, Haryana, Madhya Pradesh, Gujarat, Orissa, Tamil Nadu and
Meghalaya during July, 1998 to June, 1999 to assess the difficulty in conducting the survey.
Although interesting results came out of this pilot, as far as the women‟s participation in SNA
and extended SNA activities are concerned, the survey appears to be highly resource- intensive
both in number of skilled investigators, time and money. If the constraints in the resources are
overcome, the survey can be conducted with a reasonable periodicity, say every 10 years.
3.13.2 Another issue relating to TUS is the classification of activities and its convergence with
the classification used in labour force surveys. To ensure comparability, TUS should be
conducted by bringing about harmonized classification of activities.
3.14 MSME
3.14.1 The Ministry of Micro , Small and Medium Enterprises (MSME), Govt. of India, entrusted
to develop the enterprises operating on small scale, in terms of output, has been collecting data on
the SSI sectors right from 1973-74 only through census of SSI units, the concepts and definition
of which have undergone several changes, making the comparability among the data-sets of
different censuses impossible. Till now, four All India censuses have been conducted. However,
only during 3rd
and 4th
census of small sector enterprises covered under MSME, some
information on unregistered enterprises (i.e. the enterprises not registered with District Industries
Centres) were collected. Some of these unregistered units may fall under the category of
unorganized enterprises if judged by the available definitions followed in practice. However, it is
to be seen how far the concepts conform to the Ideal system and what measures are to be taken to
rectify the position for capturing meaningful data on unorganized enterprises of this sector from
the MSME census data in their present status. The Committee noted that MSME is taking
initiative to evolve production index based on MSME Census data. It is recommended that an
exercise of statistical auditing of production index may also be undertaken. For enhancing the
utility of MSME census and its comparability with other surveys on unorganized sector, the
schedule of enquiry should incorporate information on type of enterprise, and the employment
size. The unit level data of MSME census should also be disseminated, maintaining the
confidentiality.
3.14.2 Considering the important role of micro, small and medium enterprises in the national
economy, the Committee recommends that systematic studies may be undertaken on their role in
terms of output, employment, export. In addition, studies may be sponsored on value added and
technology absorption.

22
3.15 Economic Census
3.15.1 Economic census is intended to enumerate all enterprises: agricultural and non-
agricultural; organized (formal) and unorganized (informal); household and non-household; with
fixed premises and also without fixed premises. However, Economic censuses carried out in
India five times so far were limited to cover only the non agricultural enterprises and agricultural
enterprises not engaged in crop production and plantations. The major deficiency of the past
Economic Census was that it could not cover all enterprises without fixed premises and the
enterprises carried out in residential premises due to field difficulties. . As a result, ECs suffered
from the undercount of enterprises, especially own account enterprises and its use as the sampling
frame for the follow-up surveys was constrained.
3.15.2 In the Sixth EC, which is likely to be launched in 2012 with an army of about 8 lakh
enumerators, special care is being taken to capture OAEs, including those invisible from outside
and without fixed premises, to guard against possible undercount of OAEs from EC. Enumerators
are likely to be better- qualified, better -trained and better- supervised in Sixth EC. But it, too,
will not cover the agricultural enterprises engaged in crop production and plantation in its ambit.
3.15.3 As EC, in essence, covers all enterprises( except those engaged in crop production &
plantation), it will certainly prove to be proper comprehensive frame for any future enterprise
survey – organized or unorganized, formal or informal – without any distinction for
manufacturing and non-manufacturing, trade and other service sectors. In fact, Business
Registers can be developed from a well organized EC to form a well-groomed frame for
organized manufacturing (i.e. ASI in current practice) and also for organized (i.e. incorporated)
non-manufacturing integrated enterprise surveys, every year and unorganized non-agricultural
integrated surveys (in the model of NSS 67th
round) every 2nd
& 4th
year after the completion of
EC.
3.15.4 In order that EC can live up to the expectation of serving as an effective and reliable
sampling frame for all kinds of enterprise surveys in future, it must have an embedded quality-
assuring mechanism consisting in incorporating lessons from pre-, on & post- census data-
analysis. It must also have a regular updating mechanism for inter-census period as well. This
necessitates to have regular staff both at central and state levels, who can undertake two very
important exercises like monitoring and supervising. Updation of frame, whether at central or
state level is necessarily to be done with administrative records that emerge out of various
administrative measures and exercises undertaken on the relevant areas. It is, therefore,
imperative for the central or state updation machinery to have an access to these records for
carrying out constant updation of list. One such but very important exercise that may be taken up
is to get the help of the forthcoming „Goods and Services Act‟ which inter alia, perhaps entails
assignment of unique identification number or code to all enterprises producing goods and
services.

23
3.16 Comprehensive Scheme for Study of Cost of Cultivation (CCS):
3.16.1 Huge chunk of unorganised enterprises and also of informal employment are in the
agricultural sector. India being a predominantly agro-based economy, it is felt necessary to have
detailed database on various dimensions of this sector in terms of number of unorganised
enterprises and informal employment. The 15th
ICLS recognised the peculiarity of this sector in
terms of measurement and therefore suggested to consider measurement strategies for it
separately from non-agricultural sector to start with. Rangarajan Commission (2001) also
emphasised on collection of data on this sector and recommended to go for Comprehensive
Scheme for Study of Cost of Cultivation (CCS) on regular basis. The Committee appraised the
status of the Scheme with the objective of improving the database on the agriculture sector.
3.16.2 The Comprehensive Scheme for Study of Cost of Cultivation (CCS) is the regular survey
programme providing detailed data on farm management, particularly on cost of cultivation and
cost of production. This scheme was initiated in 1971 and is administered by the Directorate of
Economics and Statistics, Ministry of Agriculture. Objective of the Comprehensive Scheme is
primarily to generate estimates of cost of cultivation (i.e., cost/hectare) and cost of production (
i.e. cost/tonne) of different crops for the use of Commission for Agricultural Costs and Prices
(CACP) to fix Minimum Support Prices of important crops covered. The Survey operations under
the scheme cover 19 states and are implemented mainly through Agricultural / general
universities. The sampling methodology is three stage stratified random sampling and each state
is divided into homogeneous agro climatic zones. Primary sampling unit is sub District (Tehsil)
allocated to different zones, Second stage unit is village / cluster of villages and final stage units
are Operational Holdings selected at random from each land size class. The sample size of the
scheme is 840 Tehsils (sub district) covering 8400 Operational Holdings (final sampled units) out
of about 120 million Operational Holdings. These operational holdings are further stratified in
five size classes to provide representation to marginal, small and large holdings.
3.16.3 The CCS follows the cost accounting method and adopts the crop complex approach.
Under this approach, data on inputs and outputs in physical and monetary terms are collected in
respect of all the crops cultivated in the sampled operational holding. Presently, there are 28
Crop Coverage Total Crops Covered for 2008-2011: 28
Crop Group/ No. of crops
Cereals (7)
Paddy, Jowar, Bajra, Maize, Wheat, Ragi and Barley
Pulses (6)
Bengal Gram, Arhar (Red Gram), Moong (Green Gram),
Urad (Black Gram), Peas and Masur (Lentil)
Oilseeds (7)
Groundnut, Rapeseed and Mustard, Soyabean,
Sunflower, Safflower, Sesamum and Nigerseed
Fibers (2)
Cotton and Jute
Sugar (cane) (1)
Sugarcane
Fruits and Vegetables (3) Onion, and Potato
Miscellaneous (2) Coconut , VFC Tobacco, Black Pepper

24
crops for which estimates of cost of cultivation and production are generated. The survey
provides daily entries of debt/credit for expenditure/income mode to assess total cost/benefit. For
processing of data, Farm Analysis Package (FARMAP) developed by FAO in 1992 is used.
3.16.4 The Committee appraised itself of the constraints in monitoring the scheme and data
validation due to acute shortage of staff. As such, validated unit level data are not disseminated.
The data users, on request, are provided with the un-validated unit level data only. However,
validation done by the users is not consistent with the unit level data maintained by the Ministry
of Agriculture. The Committee also noted the inadequacy of the present sample size to provide
the reliable estimates on operational and economic characteristics of farm enterprises, although
the data are being used by NAD, CSO for disaggregating factor income. It may be mentioned
here that the sample size of the just concluded NSS 67th
round survey of unincorporated non-
agricultural enterprises (excluding construction) was about 3 lakhs out of about 5 crores of such
enterprises in the frame.
3.16.5 The Committee recommends that the operation of the cost of cultivation studies (CCS)
should be strengthened and vitalized inducting inbuilt mechanism of data validation,
consolidation and dissemination. The central unit managing the cost of cultivation studies in the
Ministry of Agriculture needs to be suitably strengthened and the dissemination of validated unit
level data should be put in place.

25
Chapter 4
Economic Contribution of Unorganised Sector
4.1 The informal sector contributes to the economy and caters to the wide ranging requirements
of formal sector. The non-farm informal enterprises are predominantly own account enterprise
and enterprises operated in self employed mode, more particularly in urban areas. This chapter
reviews the existing databases on unorganized sector enterprises for assessing its contribution in
the labour market and in the economy in terms of its share in GVA.
4.2 In the informal sector persons often undertake multiple jobs, pursuing of multiple jobs by a
person may be taken as a sign of insecurity in jobs. A single job or even two may generate
income barely enough for subsistence. It therefore necessitates knowing the size of the class of
persons who are forced to take up multiple jobs just for a living to address the issue of how to
mitigate these conditions of job- insecurity. In India, National Accounts Division (NAD) of CSO
tries to get an idea of multiple jobs, both for formal and informal employment from EUS of
NSSO. It may be mentioned here that NSSO (EUS) can give an estimate of number of jobs from
the workforce engaged in Usual Principal Status(PS) and in Usual Subsidiary Status(SS)
combined but it cannot give the estimate of jobs for the workforce engaged in more than one SS
job, as EUS schedule has not been provisioned for capturing this particular aspect so far;
nevertheless this is the only source from which at least some reasonable estimate of number of
jobs can be had, presuming that the size of workforce performing more than one SS job is not
large enough to bother about.
4.3 Workforce and Number of Jobs5 in Unorganized Sector
4.3.1 The labour contribution in the economic activities is generally seen from two main
dimensions: (i) population share in workers, their nature and type of participation, and (ii)
number of jobs/positions in the enterprises. The estimates of workforce and jobs in unorganised
sector may be worked out from workforce participation rates (WPRs) of NSSO Employment
Unemployment Surveys (EUS) and population estimates from the Population Census, separately
for rural and urban areas and also by gender. The total workforce so estimated through this
procedure refers to the number of jobs performed and is taken as the controlling total. The
workforce in each industry group estimated from the EUS is then cross-validated with the
workforce data available from the decennial population census, to check for inconsistencies.
Suitable adjustments in workforce estimates are made from the population census for some of the
industry groups, for which the sample survey estimates are not considered reliable, without
changing the total estimated level of workforce from the EUS.
5 All the estimates are quoted from Ramesh Kolli and Anindita Sinharay‟s paper

26
4.3.2 Once the industry-group wise total workforce is estimated by using workforce participation
rates (WPRs) from EUS, the workforce is divided between organized (comprising public sector
and private organized sector) and unorganized sectors. The total labour input and the share of
organsied sector is presented in Tables 4.1 and 4.2 below. The data on total estimated workforce
in public sector and private organized sector is available annually from the administrative
sources6, which was used in the Indian NAS till the 1999-2000 base year series. However, in the
NAS series with 2004-05 base year, data on employment in organized sector7 too (along with the
total employment) has been taken from the EUS of NSSO, which provides employment by type
of units (enterprise type code in the questionnaire), in which they are employed. The residual is
the labour input in unorganized sector.
Table 4. 1: Estimated Workforce and Number of Jobs from the 61st Round of EUS
Adjusted for Census Projected Population for the Year 2004-05
(in millions)
Item
61st round –EUS (2004-05) Final estimates after upward
correction as per RGI-population rural
male
rural
female
urban
male
urban
female total
Usual status worker as per
NSS definition8
202 116 71 20 408 456
Labour Input (jobs) 263 142 75 21 500 556
Jobs, minus, workers 62 25 4 1 92 100 [22%*]
*: (jobs – workers)x100/worker
Table 4.2: Share of Labour Input in unorganized Sector (%)
Tabulation category/Description
2004-05
Share of Unorganised Sector
A: Agriculture and forestry 99.9
B: Fishing 98.7
C: Mining 64.4
D: Manufacturing 87.7
E: Electricity, Gas, Watersupply 12.4
F: Construction 92.4
G: Wholesale and Retail Trade, 98.3
H: Hotel & Restaurants 96.7
I: Transport, Storage & Communication 82.2
6 Directorate General of Employment and Training, Ministry of Labour.
7 For the purpose of employment, organized sector definition includes the units in government/public sector, private
corporate sector and cooperatives 8 Usual status (ps+ss) workers as per NSS are those who perform some work activity either in the principal status or
in the subsidiary status. In this case, the persons who perform work in both principal status as well as in the
subsidiary status are counted only once, whereas such persons have been counted twice according to labour input
method.

27
Table 4.2: Share of Labour Input in unorganized Sector (%)
Tabulation category/Description
2004-05
Share of Unorganised Sector
J: Financial Intermediation 32.4
K: Real estate, renting and business activities 81.4
L: Public Administration and Defence, etc. 2.6
M: Education 37.9
N: Health and social work 55.1
O: Other Community, Social and Personal
Services 92.5
P: Private Households With Employed Persons 100
Q: Extra Territorial Organizations And Bodies 87.8
Grand Total 93
4.3.3 The estimates of workforce and number of jobs both are required by National Accounts
Division (NAD) of CSO for compilation of National Accounts Statistics (NAS) of India. Census-
adjusted workforce estimates are first arrived at by NAD using workforce participation rates
(WPRs) from (PS+SS) workforce data of the NSSO (EUS) and population estimates from RGI‟s
office, separately for rural and urban areas and also by gender. However total job count is first
arrived at by adding the head- count of the PS workforce (i.e. consisting of those engaged in PS
work alone and also those, in PS and SS work together) and that of the SS workforce, not
engaged in PS work at all in the usual activity status of NSSO (EUS). The total workforce in the
country estimated through this procedure refers to the number of jobs performed and is taken as
the controlling total. The workforce in each industry group estimated from the EUS is then
cross-validated with the workforce data available from the decennial population census, to check
for inconsistencies. Suitable adjustments in workforce estimates are made from the population
census for some of the industry groups, for which the sample survey estimates are not considered
reliable, without changing the total estimated level of workforce from the EUS. Once the total
workforce is estimated by industry-group using workforce participation rates (WPRs) from EUS,
the workforce is divided between organized (comprising public sector and private organized
sector) and unorganized sectors. The industry-wise estimates of total labour input and the share of
organsied sector are then worked out. The data on total estimated workforce in public sector and
private organized sector are available annually from the administrative source9, which was used
in the Indian NAS till the 1999-2000 base year series. However, in the NAS series with 2004-05
base year, data on employment in organized sector10
too (along with the total employment) have
been taken from the EUS of NSSO, which provides employment by type of units (enterprise type
9 From Directorate General of Employment and Training of Ministry of Labour.
10 For the purpose of employment, organized sector definition includes the units in government/public sector, private
corporate sector and cooperatives
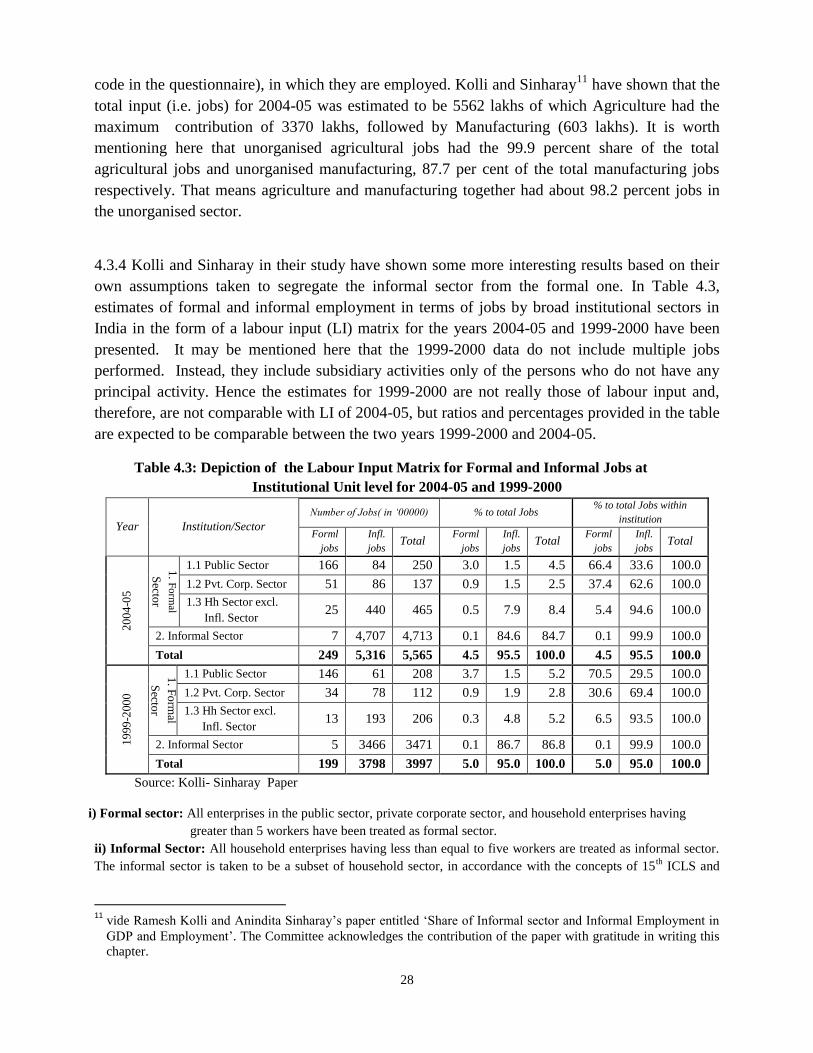
28
code in the questionnaire), in which they are employed. Kolli and Sinharay11
have shown that the
total input (i.e. jobs) for 2004-05 was estimated to be 5562 lakhs of which Agriculture had the
maximum contribution of 3370 lakhs, followed by Manufacturing (603 lakhs). It is worth
mentioning here that unorganised agricultural jobs had the 99.9 percent share of the total
agricultural jobs and unorganised manufacturing, 87.7 per cent of the total manufacturing jobs
respectively. That means agriculture and manufacturing together had about 98.2 percent jobs in
the unorganised sector.
4.3.4 Kolli and Sinharay in their study have shown some more interesting results based on their
own assumptions taken to segregate the informal sector from the formal one. In Table 4.3,
estimates of formal and informal employment in terms of jobs by broad institutional sectors in
India in the form of a labour input (LI) matrix for the years 2004-05 and 1999-2000 have been
presented. It may be mentioned here that the 1999-2000 data do not include multiple jobs
performed. Instead, they include subsidiary activities only of the persons who do not have any
principal activity. Hence the estimates for 1999-2000 are not really those of labour input and,
therefore, are not comparable with LI of 2004-05, but ratios and percentages provided in the table
are expected to be comparable between the two years 1999-2000 and 2004-05.
Table 4.3: Depiction of the Labour Input Matrix for Formal and Informal Jobs at
Institutional Unit level for 2004-05 and 1999-2000
Year Institution/Sector
Number of Jobs( in „00000) % to total Jobs % to total Jobs within
institution
Forml
jobs
Infl.
jobs Total
Forml
jobs
Infl.
jobs Total
Forml
jobs
Infl.
jobs Total
20
04
-05
1. F
orm
al
Secto
r
1.1 Public Sector 166 84 250 3.0 1.5 4.5 66.4 33.6 100.0
1.2 Pvt. Corp. Sector 51 86 137 0.9 1.5 2.5 37.4 62.6 100.0
1.3 Hh Sector excl.
Infl. Sector 25 440 465 0.5 7.9 8.4 5.4 94.6 100.0
2. Informal Sector 7 4,707 4,713 0.1 84.6 84.7 0.1 99.9 100.0
Total 249 5,316 5,565 4.5 95.5 100.0 4.5 95.5 100.0
19
99
-200
0
1. F
orm
al
Secto
r
1.1 Public Sector 146 61 208 3.7 1.5 5.2 70.5 29.5 100.0
1.2 Pvt. Corp. Sector 34 78 112 0.9 1.9 2.8 30.6 69.4 100.0
1.3 Hh Sector excl.
Infl. Sector 13 193 206 0.3 4.8 5.2 6.5 93.5 100.0
2. Informal Sector 5 3466 3471 0.1 86.7 86.8 0.1 99.9 100.0
Total 199 3798 3997 5.0 95.0 100.0 5.0 95.0 100.0
Source: Kolli- Sinharay Paper
i) Formal sector: All enterprises in the public sector, private corporate sector, and household enterprises having
greater than 5 workers have been treated as formal sector.
ii) Informal Sector: All household enterprises having less than equal to five workers are treated as informal sector.
The informal sector is taken to be a subset of household sector, in accordance with the concepts of 15th
ICLS and
11
vide Ramesh Kolli and Anindita Sinharay‟s paper entitled „Share of Informal sector and Informal Employment in
GDP and Employment‟. The Committee acknowledges the contribution of the paper with gratitude in writing this
chapter.

29
1993/2008 SNA. The size of informal sector has been determined on the basis of Delhi group recommendations on
international comparability of informal sector statistics.
4.3.5 The labour input matrix presented above is at the overall economy level. It may be
mentioned that both the formal and informal employment can exist in both the formal and
informal sectors. This matrix provides the estimates of formal and informal employment in
various cells of the matrix. Overall, informal employment accounts for 95.5 per cent of total
employment in 2004-05, with 1.5 per cent each in public and private corporate sectors, 7.9 per
cent in household excluding informal sector and the balance 84.6 per cent in the informal sector.
In the public sector, of the total 25 million jobs in 2004-05, as many as 84 lakh jobs were
informal jobs, accounting for 33.6 per cent of total jobs in the public sector. This is showing
that almost one-third of jobs performed in public sector are of informal nature. These jobs could
be contracted jobs or outsourced jobs, where a person reports to the investigators as being
employed in public sector, though may not have a regular job in public sector or written contracts
for performing such jobs. Such informal jobs in public sector are found to rise from 29.5 per cent
in 1999-2000 to 33.6 per cent in 2004-05, indicating an increase of informalisation of jobs in
public sector through outsourcing or contracting by about 4 per cent, over this 5-year period. It
also appears that most of the additional jobs between 1999-2000 and 2004-05 in public sector (42
lakh) appear to have gone to informal employment (23 lakh).
4.3.6 The presence of informal employment is more glaring in the case of private corporate
sector, accounting for as much as 62.6 per cent of total jobs in this sector. The corresponding
figure in 1999-2000 was 69.4 per cent. This is contrary to the informal employment position in
public sector, as there is significant fall in informal employment share in private corporate sector
in this 5-year period. Of the 25 lakh jobs created between 1999-2000 and 2004-05 in private
corporate sector, a majority of these jobs went to formal employment (17 lakh) as compared to
informal employment (8 lakh). There is a presence of small formal employment in the informal
sector enterprises to the extent of 25 lakh formal jobs or 5.4 per cent in 2004-05 (it was 6.5% in
1999-2000).
4.3.7 Most of the informal employment is, however, in informal sector accounting for 99.9 per
cent of total jobs in informal sector. There is a marginal presence of formal employment in
informal sector of about 5 lakhs accounting for just 0.1 per cent of its total employment.
4.3.8 The original study by Ramesh Kolli and Anindita Sinharay (2011), which is the source of
the above estimates, contains detailed labour input matrices at industry level, has also provided
disaggregated data by institutional sectors along with percentage shares for the years 2004-05 and
1999-2000. Those data depict at length in which industries and institutional sectors in the
country formal and informal employment co-exist and with what extent.

30
4.4 Estimation of GVA of unorganized sector
4.4.1 As per statistics available in India so far, it has been seen that GDP from unorganized
sector is almost half of the total GDP. However, the very nature of this sector mostly
characterized by the huge proliferation of tiny production units not or hardly maintaining any
accounts and remaining invisible or non-observable in most of the times, does not allow direct
measurement. In the Indian NAS therefore, the estimates of GDP and also of GVA for
unorganized sector12
by activity are compiled through indirect methods, using the benchmark-
indicator procedure. In this procedure, the benchmark GVA estimates are initially prepared at
detailed economic activity level for the base year of national accounts series using the estimated
workforce engaged in the particular activity and the value added per worker (VAPW) in the same
activity13
. While preparing benchmark estimates, alternative data sources such as those available
on consumption are also examined (for example in the case of health and education services), in
addition to the data on employment from India‟s employment and unemployment surveys and
population censuses. For subsequent years, the base year GVA estimates are extrapolated with
appropriate proxy indicators relevant to the economic activity.
(i) Benchmark estimates
Estimates of total workforce by economic activity
To arrive at the benchmark estimates for the total workforce and the GVA, labour input
method is resorted to, as it takes care of the possible under-reporting by the informal sector units
while trying to evade taxes or administrative regulations. One of the key components of labour
input method is to estimate the total number of jobs performed, activity-wise. In India, (i) large-
scale household sample surveys on Employment and Unemployment (EUS) conducted by the
National Sample Survey Office (NSSO) and (ii) the decennial population censuses provide
workforce estimates, by industry groups, as per National Industrial Classification (NIC), which is
similar to the International Standard Industrial Classification (ISIC). Of these two, the EUS is
the preferred source in the NAS compilation.
However, as already discussed , workforce estimates for use in national accounts compilation
are required for the estimation of the number of jobs performed, rather than the headcount, as the
value added per worker estimate comes from the enterprise surveys, which include multiple jobs
performed by individuals. The data on total number of jobs performed in each economic activity
are not directly available. The available data on employment from the NSSO is through
household enquiry method, which gives data on number of workers. The difference between the
number of workers and the number of jobs is the multiple jobs performed by employed persons,
data on which are, however, available from the NSSO reports, and are thus used to estimate the
total number of jobs. The estimated workforce and labour input for 2004-05 are 408 million and
12
Excepting for agriculture and allied and mining activities, where direct data on production and prices are available
both in respect of organized and unorganized segments. 13
This procedure essentially follows the labour input method.

31
500 million respectively. When census-adjusted, these turned out to be 456 million and 556
million respectively.
(ii) Benchmark estimates of value added per worker (VAPW) by economic activity
The benchmark estimates of VAPW for the unorganized manufacturing and services sectors are
derived by NAD of CSO from the detailed data available from the enterprise surveys conducted
by the NSSO, from time to time on different industries in the unorganized sector of the economy.
These enterprise surveys typically cover all units other than those covered in the public sector,
except the manufacturing industry. Kolly- Sinharay in their study has detailed the procedure and
hence it is not repeated here.
(iii) Annual estimates of value added of unorganised segments: The above stated procedure
provides estimates of GVA for the unorganized sector by activity and forms benchmark
estimates. For the years when the relevant data are not available from NSSO, these benchmark
estimates are extrapolated with suitable indicators to get the yearly estimates. Following this
procedure, estimated share of unorganized sector in GVA at current prices turned out to be 56.4%
in 2004-05 and 54.4% in 2008-09 respectively.
4.4.2 Translation of employment and jobs estimates into GVA shares by sectors
From Table 4.4 below, it is seen that the contribution of informal sector to the GDP in
2004-05 is about 48 per cent, as against the Indian NAS „unorganised‟ sector GVA contribution
of 56.4 per cent ; the government and corporations account for the balance 43.6 per cent of GVA.
These numbers are much smaller than the informal sector shares in employment, evidently due to
their lower GVA per employee and being employment-intensive.
4.4.3 Table 4.4 also presents and contrasts, the contribution of informal employment to GDP
against the share of informal jobs shown earlier. The share of informal jobs in total GDP which
is 53.9 per cent (against of 95.5 per cent share of total jobs) in 2004-05 has depicted a 1 % rise
when compared with that for 1999-2000. On the other hand, formal jobs contributed as much as
46.1 per cent to the GDP as against their employment share of just 4.5 per cent for 2004-05.
4.4.4 Kolli- Sinharay showed in their study that, about 48 per cent of the total GVA of 2004-05
came from the informal sector at the overall economy level, and 8.4 per cent in household sector
excluding informal sector in 2004-05. Within this 48 per cent, 17.7 per cent is from agriculture
and the balance in non-agricultural activities, mainly in manufacturing (3.6%), construction
(2.7%), trade and hotels (11.2%) and all others (7.6%). The informal sector in agriculture
employs 60.4 per cent, though its GVA share is just 17.7 per cent. The non-agriculture informal
sector, which has a share of 24.2 per cent in total jobs, contributed 30.3 per cent of total GVA of
the economy. The household sector (excluding informal sector) has more or less the same shares
in jobs and GVA. On the other hand, public sector, which has a share of 4.5% of total jobs in the
economy, contributed 23 per cent to the total GVA, mostly in activities of manufacturing (2.2%
share in GVA against 0.2% share in jobs), and others (19% share in GVA against 3.9% share in

32
jobs). The private corporate sector, which had a share of 2.5 per cent in jobs, contributed 20.6
per cent to total GVA, mostly in manufacturing (7.6% share in GVA against 1.2% share in jobs),
trade and hotels (3.4% share in GVA against 0.15% share in jobs) and others (7.1% share in
GVA against 1% share in jobs).
4.4.5 As regards the informal jobs, these have a share of 53.9 per cent in total GVA (against
95.5 per cent of total jobs) in 2004-05, and this share comes mainly from agriculture (17.8%
against jobs share of 60.9%), manufacturing (5.8% against jobs share of 10.1%), construction
(5.3% against jobs share of 5.7%), trade and hotels (12.5% against jobs share of 9.5%) and all
other activities (12.6% against the jobs share of 9.3%).
4.4.6 Of the contribution in overall GVA of informal jobs in non-agricultural activities (36.2%),
the respective sectoral shares are 25 per cent in informal sector, 6.6 per cent in households
(excluding informal) sector, 1.3 per cent in corporate sector and 3.2 per cent in public sector. The
formal jobs in public sector (3%) contributed 19.8 per cent to the GVA and in private corporate
sector (0.9%) contributed 19.3 per cent of GVA.
Table 4.4: Estimates of GVA for 2004-05 and 1999-2000
Year
Institution/Sector
GVA at current price
(in Rs.10bn.)
% to total GDP
% to total GVA with in
institution
Forml
jobs
Infl.
jobs Total
Forml
jobs
Infl.
jobs Total
Forml
jobs
Infl.
jobs Total
2004
-05
1.
Fo
rmal
Sec
tor 1.1 Public Sector 587 94 682 19.8 3.2 23.0 86.2 13.8 100.0
1.2 Private Corporate Sector 572 39 611 19.3 1.3 20.6 93.6 6.4 100.0
1.3 Household Sector
excluding Informal Sector 51 200 250 1.7 6.7 8.4 20.2 79.8 100.0
total formal sector 1,210 333 1,543 40.8 11.2 52.0 78.4 21.6 100.0
2. Informal Sector 156 1,268 1,424 5.3 42.7 48.0 11.0 89.0 100.0
Total 1,367 1,601 2,968 46.1 53.9 100.0 46.1 53.9 100.0
1999
-20
00
1.
Fo
rmal
Sec
tor 1.1 Public Sector 435 15 450 24.3 0.9 25.2 96.6 3.4 100.0
1.2 Private Corporate Sector 296 24 320 16.6 1.4 17.9 92.4 7.6 100.0
1.3 Household Sector
excluding Informal Sector 23 64 87 1.3 3.6 4.9 26.0 74.0 100.0
total formal sector 753 104 858 42.2 5.8 48.0 87.9 12.1 100.0
2. Informal Sector 95 834 929 5.3 46.7 52.0 10.2 89.8 100.0
Total 848 938 1,787 47.5 52.5 100.0 47.5 52.5 100.0
Note: 2004-05 data relates to new series, base year 2004-05 and 1999-2000 data from the old series, base year
1999-2000
Source: Kolli- Sinharay Paper
4.4.7 The National Commission for Enterprises in the Unorganised Sector (NCEUS), constituted
by the Government of India, also compiled estimates of value added for the informal sector and
informal employment for the years 1999-2000 and 2004-2005, using the available information on
labour input and value added per worker from the above mentioned survey results, but using a
slightly different set of definitions.

33
4.4.8 In its “Definitional and Statistical Issues Relating to the Informal Economy”, the NCEUS
defined the informal sector as consisting of all unincorporated private enterprises owned by
individuals or households engaged in the sale and production of goods and services operated on a
proprietary or partnership basis and with less than ten total workers.
4.4.9 Estimates of gross value added by economic activities, as presented in the report of the
Commission, are presented in Table 4.5 below:
Table 4.5: Estimated Gross Value Added by Economic Activities: 1999-2000 and 2004-2005
(Rs. ten million)
Economic activities 55th
Round (1999-2000) 61st Round (2004-05)
GVA share of
Informal
Sector
GVA* share of
Informal
Sector
Informal
Sector
Total Informal
Sector
Total
Agriculture 431131 446515 96.55 506990 536629 94.48
Mining 12478 41594 30.00 15204 84464 18.00
Manufacturing 77579 268927 28.85 123859 461531 26.84
Electricity, Gas & Water 1781 44526 4.00 1818 60607 3.00
Construction 45559 102007 44.66 86024 185669 46.33
Trade 179349 231878 77.35 318753 424552 75.08
Hotels & Restaurants 12511 22265 56.19 20211 39781 50.80
Transport & Storage 76381 133373 57.27 111220 250214 44.45
Banking, Finance & Insurance 7852 105662 7.43 15588 167831 9.29
Real est. & Business Services 98778 127887 77.24 155620 245298 63.44
Public Administration & Def 4467 122384 3.65 710 177496 0.40
Education 9608 69563 13.81 13145 106580 12.33
Health & Social Work 6026 27640 21.80 12323 53137 23.19
Comm.,social&pers. servs. 23527 38545 61.04 38860 55961 69.44
Pvt. Hhs & extra-terr. Orgns. 3014 3762 80.11 5894 6185 95.29
Total 990041 1786528 55.42 1426218 2855934 49.94
* old series (1999-2000 base year) estimates
Source: Kolli- Sinharay Paper
Table 4.6: Estimated Number of Informal/Formal Sector Workers in 1999-2000 and 2004-05
(in million)
2004-05
category of workers Informal Formal Total
Sector Sector
Informal Workers 391.73 (99.6) 28.91 (46.2) 420.67 (92.3)
Formal Worker 1.42 (0.4) 33.65 (53.8) 35.03 (7.7)
Total 393.15 (100.0) 62.56 (100.0) 455.7 (100.0)
1999-2000
Informal Workers 339.71 (99.5) 23.04 (42.0) 362.76 (91.5)
Formal Worker 1.79 (0.5) 31.85 (58.00) 33.64 (8.5)
Total 341.50 (100.0) 54.89 (100.0) 396.4 (100.0)

34
4.4.10 Earlier, the NCEUS had presented in one of their reports the distribution of workers as
between formal and informal sectors. As per that data presented in Table 4.6, of the total
workforce, informal sector accounted for 85%, but informal workers without any social or job
security accounted for 92%. This contrasts with the labour input matrix constructed in the Kolli –
Sinharay study which has placed the corresponding proportions at 84.7% and 95.5%,
respectively. It is understandable that the informal sector share is somewhat higher in the
NCEUS study as Kolli- Sinharay took 5 workers as the cut-off point, while the NCEUS took 9
workers as the cut-off point for each informal sector enterprise.
4.5 Revelation from the three estimates
4.5.1 As for the informal sector share in GVA, the three estimates surprisingly stand-apart
somewhat, for 2004-05 for instance; 56.4% for unorganized sector as per the NAS estimates;
48.0 % for the informal sector and 53.9% for informal workers as per the Kolli-Sinharay paper,
and 49.9% for the informal workers as per the NCEUS paper. From the analysis what has been
discussed above it has become clear to the Committee that different concepts and methodology
used by different users with respective arguments and logic, have perhaps led to such
divergences. The Committee therefore feels it necessary to standardise the usage of concepts and
definitions mandatorily to be followed by users for the estimations of „informal sector‟ and
„informal worker‟ shares. The Committee also recommends that the satellite account for the
informal sector be prepared, once in five years.

35
Chapter 5
Credit and Institutional Linkages
5.1 Statistics on Credit to unorganized sector enterprises
5.1.1 The issue of credit to the unorganized sector enterprises assumes critical importance in the
context of the large number of such entities operating in India, their contribution to the economy,
their distribution across various sectors, geographical spread and the welfare needs for those
engaged in these enterprises. Recently, the Prime Minister‟s Task Force on the MSME
enterprises (January, 2010) has highlighted various issues relating to credit to these enterprises, a
large part of which are in the unorganized or informal sector. Earlier, on the advice of National
Statistical Commission, a Committee set up by RBI under the Chairmanship of Prof. P.
Venkataramaiah (2001) had examined the status on Informal Financial Sector Statistics and made
recommendations for improving such statistics.
5.1.2 At present, there are several different statistical systems for collection of data on
unorganized sector enterprises as discussed in Chapter 3. While data on various aspects of
unorganized sector enterprises are collected through surveys conducted by NSSO and CSO, data
on credit extended to this sector by both formal and informal agencies comprising both bank and
non-bank sectors is collected through the AIDIS survey conducted by NSSO. RBI and
NABARD, on the other hand, collect data on bank finance and some categories of non-bank
finance to enterprises in various sectors. It needs to be recognized, however, that the scope,
coverage, classification, mode and frequency of data collection of the existing statistical systems
on finance to unorganized enterprises are quite different and do not provide a complete picture of
the sector. For example, while AIDIS covers various types of credit agencies in the formal and
informal sector, its focus is more on households rather than informal sector enterprises. Although
loans to various categories of household enterprises are covered, the classification of activities is
not quite limited. Besides, it is conducted once in every ten years. On the other hand, although
the RBI database provides a detailed classification and coding of the activities following NIC
classification, its primary focus is the credit from banks and as such does not cover many
informal sources of finance, which has a substantial share in provision of credit according to the
AIDIS 2002-03. Before deliberating on the various sources of data on credit to unorganized
sector enterprises, the issues examined by the Venkataramaiah Committee are briefly discussed
below.

36
5.2 Informal Financial Sector Statistics and Its Status:
5.2.1 The Venkataramaiah Committee on Informal Financial Sector Statistics was set up by RBI
with the main objective to critically examine the current status of statistics on the Informal
Financial Sector. The Report of the Committee (2001) recommended a statistical system for
improving collection of statistics on the sector. The Committee identified two purposes for which
data are to be collected on various aspects of Informal Financial Sector Statistics namely, (a) to
measure the extent of informal credit and to understand the dynamics of informal financial
markets, and (b) to facilitate generation of inputs on informal finance for the compilation of
National Accounts.
5.2.2 The Committee deliberated on two interrelated issues, viz., the definition of Informal
Financial Sector Statistics, and the type of institutions to be covered in this sector. As opined by
the Committee, although there is no accurate definition of „informal sector‟, the UN System of
National Accounts (SNA) had broadly characterised the informal sector as consisting of units
engaged in the production of goods and services with the primary objective of generating
employment and incomes to the persons concerned. The production of units of the informal
sector has the characteristics of a household enterprise. According to the classification adopted by
the UN SNA, the production units owned by a single household or a group of households form
part of the household sector as household enterprises or unincorporated enterprises.
5.2.3 For the purpose of identifying the informal financial sector enterprise, the Venkataramaiah
Committee adopted the criterion of „incorporation‟ as a guiding factor, according to which the
enterprises that are „incorporated‟ constitute the formal sector and those that are not so
incorporated constitute the informal financial sector. The status of availability of data in respect
of the informal financial sector, consisting of „unincorporated financial enterprises‟, was
examined and recommendations were made for instituting and improving collection of statistics
on this sector. This concept of un-incorporated enterprises for studying informal sector,
incidentally, is similar to the one adopted in the NSS 67th
round enterprise survey.
5.2.4 Venkataramaiah Committee studied the major formal and informal systems of data on
credit. It noted that the structure of the informal financial market is extremely heterogeneous.
This sector comprises partnership firms, sole proprietary concerns, own account enterprises,
financial auxiliaries such as share broking firms, loan brokers, Non-Governmental Organisations
(NGOs), Self-Help Groups (SHGs), share brokers and traders, multani shroffs, pawnbrokers,
chettiars, etc. Data on this segment are available neither regularly nor on an ad hoc basis except
that certain pieces of information are collected and are available from various sources.
5.2.5 Existing databases on credit to unorganized sector enterprises: With this backdrop, an
overview of the existing statistical systems for credit to unorganized sector enterprises is
provided below. These include: (i) data collected by RBI through the BSR system, by other

37
departments of RBI such as Rural Planning and Credit Department, data collected by NABARD;
and (ii) data collected through NSSO and CSO surveys.
5.2.5.1 Existing databases of both the organized and unorganized credit structure system coming
under the purview of All-India Debt and Investment Survey (AIDIS) as well as credit flow
information reported by the banking industry to RBI, SIDBI and NABARD could be considered
for examination and development of a framework for sourcing the credit information in respect of
the unorganized sector enterprises. The database of organized credit coming under the
supervisory jurisdiction of RBI, SIDBI and NABARD was examined. In particular, RBI‟s Basic
Statistical Returns (BSR), data collected by other departments of RBI as also co-operative credit
flow were examined. As unorganized enterprises do not have unique definitional perspective, an
approximate frame based on the BSR classification system would at best help cover the
unorganized sector only in part. The BSR system follows NIC/ISIC classification which is quite
comprehensive but not exhaustive.
5.3 BSR-1 Data
5.3.1 Basic Statistical Return 1 (BSR-1) was introduced in December 1972 and has been in
existence over the last 38 years. The main objective of this return is to capture micro level
information from the commercial banks about their operations on credit, which are not otherwise
secured from banks for regulatory purposes. BSR-1 contains two parts BSR-1A and BSR-1B.
Under BSR-1A, banks report loan account level data for large borrowal accounts. For each
account, information such as occupation, organization, type of account, interest rate, credit limit,
amount outstanding, etc., are collected. Under BSR-1B, occupation wise totals for small borrowal
accounts are collected. With the passage of time, a number of revisions have been made in the
BSR-1 system. Some of the changes which were introduced are:
It was a half yearly (June and December) return till 1989 and became annual from 1990 (as
on 31 March).
Till 1983 accounts with credit limit over 10,000 were classified as large borrowal and up to
10000 as small borrowal. This limit was revised to Rs.25000 from 1984 and again to
Rs.200000 from 1999.
Over the period some new parameters have been added. Detail codes of the parameters also
got revised to match with economic condition and related systems.
5.3.2 Further, certain other aspects of the informal financial sector are available from BSR-1.
The financial auxiliaries covered under „finance activity‟ relate to those of the informal financial
sector namely, shroffs, moneylenders, stockbrokers, share brokers, dealers in bullion, etc. apart
from those of formal sector. Further details about the classification of BSR-1 data reporting,
particularly with reference to unorganised sector, is presented in Appendix-7.

38
5.3.3 The Non-Governmental Organisations (NGOs) and Self-Help Groups (SHGs) are another
category of institutions working in the informal financial sector for implementing special
programmes and formulating development policies. Most of these NGOs/ SHGs are credit-
linked by banks. These organisations receive funds from Indian financial institutions as also
from abroad. NABARD publishes certain data on total credit extended by NABARD to these
organisations. NABARD also publishes the State-wise number of SHGs being financed by
banks.
5.3.4 The data collected and published by NABARD relate only to a particular aspect namely,
the credit disbursed to NGOs and SHGs by banks and NABARD. As NGOs and SHGs
intermediate a large amount of funds between banks and financial institutions and households, it
is necessary to build a database of these organisations. Data on the operations of SHGs and
NGOs are not available although banks submit a “Micro-credit progress Report” to RBI, and
NABARD provides certain particulars of credit extended by them to these NGOs under different
schemes on a half-yearly basis.
5.4 Other Existing Data Sources
5.4.1 All-India Debt and Investment Survey (AIDIS) data, as available at decennial intervals,
provide information on composition of assets, capital formation, and indebtedness of rural and
urban households. A distinguishing feature of the AIDIS is the collection of loan-wise details
such as credit agency (institutional and non-institutional), rate of interest, duration of loan,
purpose, etc. The non-institutional agencies refer to the landlords, moneylenders, traders,
relatives and friends, doctors, lawyers, etc. The data collected through AIDIS are used in the
compilation of National Accounts.
5.4.2 Data collected in AIDIS, however, relate only to pure households and as such quasi-
corporations of business households namely, partnerships, proprietary concerns, etc. in trade;
transport and other activities are not covered. The survey collects details on the occupation of
the head of the households and the flow of funds within the informal sector from the financial to
the real sector. One of the occupation groups is “finance, insurance, real estate and business”.
But the data classified by this occupation group are not published by the NSSO. These surveys
provide at best a truncated picture of the assets and liabilities, and also exclude receipts and
payments of the households.
5.4.3 Though the surveys of NSSO/CSO are supposed to have covered informal financial
services but no data have been reported separately for this sector. The enterprise surveys do not
collect loan-wise details such as interest rate and duration of the loan. As such, it is not feasible
to measure the extent of financial accommodation and interest paid on these loans to the
informal credit agencies.

39
5.5 Suggestions for Developing a Comprehensive Database
5.5.1 It would be in order to discuss the definitional scope of unorganized sector enterprises
before embarking on suggestions for development of credit database. The definitional scope of
unorganized sector enterprises has been outlined in Chapter-2. The Task Force Report on
Definitional and Statistical Issues (NECUS 2008) identified unorganized enterprises as the
entitities with (a) no legal standing other than the single ownership, (b) small in employment size,
low in capital and productivity etc. as per the National Commission for the Enterprises in the
Unorganized Sector (NCEUS). For several reasons of "smallness" associated with unorganized
sector (all unincorporated private enterprises owned by individuals/households engaged in sale
and production of goods and services operated on a proprietary or partnership basis and with less
than 10 total workers), they mostly centre around the economic activities pursued in Priority
Sector. These include 'Agricultural and Allied Activities', 'Small Enterprises', small sized village
entities like 'Artisans, village & cottage industries‟ with specified credit limit, coupled with
organizations types covered under household sector, comprising mainly 'Individuals' (in the
capacity of farmers, business-persons, traders, professional and self-employed, wage and salary
earners, pensioners, unemployed, house-wife, students, money lenders, shroffs, stock-brokers,
dealers, etc.), and other entities like 'proprietary concerns', 'partnership firms', 'Self Help Groups'
covered under Microfinance institutional activities. While most of the above entities encompass a
good chunk of unorganized enterprises having access to organized loans and refinance facilities
extended by the Scheduled Commercial Banks (including RRBs), some more such could be
covered under three-tiered cooperative credit structure system comprising PACS (Primary
Agricultural Cooperative Societies), FSS/ LAMPS (Farmers Service Societies/Large sized
Adivasi (Multi-purpose Societies)) and other financial co-operative institutions (Primary & State
Cooperative Agriculture and Rural Development Banks (PCARDBs / SCARDBs), State Co-
operative Banks (SCBs), District Central Cooperative Banks (DCCBs), Urban Cooperative Banks
(UCBs), etc.
5.5.2 However, it needs to be kept in view that it is necessary to adopt a specific verifiable
definition of unorganized sector enterprises and develop a detailed classification and coding
structure of this sector in order to establish clear linkages between priority sector and
unorganized sector enterprises. At present, the approach to classify unorganized enterprises
leaves some scope for different ways of interpreting and usages adopted by several organizations.
For example, NSSO classifies entities not covered under ASI as unorganized manufacturing
entities. Similarly, NAS identifies them as residual enterprises depending on data availability.
Special purpose classifications are adopted basically depending on data availability with different
statistical bodies in the country. Likewise, the credit flow information as culled out through
different returns submitted by the banks to RBI follows their own classification system to identify
relevant entities critical for policy and operations adopted for smooth running of the banking
system. For example BSR 1 captures branch level credit data on different parameters across

40
different dimensions of organization, occupation and account type applicable at the lowest
possible level (i.e., at the account level) (cf. Annexure - 1).
5.5.3 It may be seen from the above overview that at present, there is no unique system, which
captures the credit information in respect of unorganized sector enterprises satisfactorily in terms
of coverage; classification of activities, type, sources, etc.; regularity of information flow; and so
on. RBI does not have any data system specifically related to unorganized sector. The problem is
formidable in view of the heterogeneity of the sector as also multiplicity and heterogeneity of the
credit sources, including informal sources.
5.5.4 In this background, it is necessary to consider first developing a suitable sampling frame of
the unorganized sector enterprises, which will provide a basis for collecting data not only on
credit but also other important variables such as production, value added, employment and other
related information from the same set of entities in order to ensure comparability over time and
across sectors. From the various surveys discussed in the previous chapter, it appears that the
scope of the Economic Census of the CSO can be suitably augmented so as to provide a platform
to develop such a sampling frame. In order to pursue this objective, it is necessary to use an
appropriate classification and coding system for the enterprises. The latest available NIC 2008
classification may be considered for this purpose. If this coding system (to be developed) can be
made compatible with the BSR coding system, it would provide a mechanism to combine the
credit data from banks with those collected from other sources.
5.5.5 After having developed a frame and a classified /coded structure of the unorganised
enterprises, it may be considered to use the NSSO‟s AIDIS/ Enterprise survey mechanism for
capturing the data on credit extended to the unorganised sector enterprises by different types of
both formal and informal sources by using a suitable sample design based on the population
provided by the Economic Census. Such a survey may be conducted at least once in 5 years. It
may be recalled that the Venkataramaiah Committee also recommended that the coverage of the
AIDIS needs to be improved by pooling the estimates of Central and State samples on the one
hand and by increasing the sample size on the other. It is necessary that the RBI and the NSSO
should have a close collaboration in the conduct of AIDIS.
5.5.6 The Enterprise Surveys of NSSO/CSO need to specifically cover financial service
enterprises and provide data needed to derive value-added details as also the details of credit. This
is now being done in NSS 67th
round. The RBI should closely liaise with CSO and NSSO on the
technical aspects of these surveys and ensure the coverage of all known household financial
enterprises like, share brokers, multani shroffs, chettiars, marwari kayas and pawnbrokers and
various kinds of moneylenders.
5.5.7 Once such a system is established, the linkage between such survey data and those collected
by the BSR system may be explored. The use of a common classification system based on NIC
codes in the survey and the BSR system would facilitate this exploration. It would in turn help in

41
estimating bank credit to unorganized sector enterprises based on AIDIS survey and its
interpolation using BSR data.
5.5.8 If classified, according to organization types encompassing individuals and then augmented
with occupations, the data segment would contain significant part of organized credit amount
flowing to unorganized sector. As of now, one-to-one mapping of BSR codes to extract the
identifiable unorganized enterprise entity is not possible in the absence of a clear-cut codified
identification structure for unorganized entities. Such classification issues are examined from
time to time to expand the coding structure of BSR system in a consistent manner. Scope of BSR
system has recently been expanded (cf. Handbook of Instructions, 2008), which already factored
in the recommendations of the Committee on Informal Financial Sector Statistics set up by RBI
(Informal Financial Sector statistics, 2001) and consequent needs of financial inclusion, raised
from time to time by financial regulatory bodies. Even though BSR system has become a
comprehensive source for reporting banking statistics, it has become overbearing load for the
banking system to maintain requisite reporting standards and data quality because of incremental
reporting needs. Extending the statistical reporting needs from the banking sector is also
becoming very much onerous because of them being turning out to be the main vehicle for
meeting voluminous needs of financial services required by the informal sector under the
framework of the financial inclusion policy.
5.5.9 Apart from nation-wide surveys, which provide macro-estimates, it is necessary to promote
regional and micro-level studies on the informal financial sector activities considering the
diversity across the regions.
5.5.10 It is observed that information availability on the credit flow to the unorganised sector is
far from complete. This is more pronounced because of definitional inconsistencies and reporting
problems. BSR system provides a comprehensive database on credit flow from Scheduled
Commercial Banks. It presents detailed classificatory data annually according to occupation and
organisation types. However, such classified information does not help in obtaining credit flow
from SCBs to the unorganised sectors. In this background, the following issues were considered:
Development of representative database on the credit flow to unorganised sector
enterprises call for precise coding structure for identification and classification of such
activities.
So far as the credit flow data to unorganised sector from the Scheduled Commercial Banks
is concerned, BSR-1 data reporting is at best partial. Potentially, a huge concentration of
credit to unorganised sector is covered in BSR-1B which however is not useful for
extracting any comparable data relevant to unorganised sector since account-level
information is not collected here.
Extending small borrowal account (BSR-1B) to incorporate organisation types in line with
BSR-1A is not feasible because of large data requirement from the banking system.

42
5.5.11 To build up a workable data-base for this purpose, the following measures are suggested:
First, apart from credit extended by scheduled commercial banks, it is necessary to cover
two other sources of institutional credit delivered by (a) the cooperative sector; and (b)
SIDBI and SFCs. It is also necessary to examine the status of the current data available
and make suggestions to the RBI/NABARD with a view to presenting a consolidated
picture of formal sector credit outstanding in favour of different categories of informal
sectors (of course, avoiding duplications).
Second, BSR system provides a comprehensive database on credit flow from Scheduled
Commercial Banks. It presents detailed classificatory data annually according to
occupation and organisation types. However, such classified information does not
directly provide information on credit from SCBs to the unorganised sectors. However,
BSR-1A format captures classification according to economic activity (occupation) and
type of organisation. For example, the occupation codes include agriculture - direct and
indirect and organisation type includes MSMEs, separately for the three categories:
micro, small and medium; household enterprises: MFIs, JLGS, NGOs, Trusts and Groups
and pure households and NPISHs. Therefore, availability of such cross-classification in
BSR 1A data may facilitate exploration of data on finance to these unorganised sectors. In
this background, a suitable method of data extraction/augmentation may be adopted for
combining occupation and organisation classification as available in the BSR-1A
reporting system as per the data requirement of important categories of informal sectors.
For this purpose it is necessary to follow two key additional steps to classify the account
wise data as contained in BSR-1A format for loan accounts above two lakh each.
Third, the above still leave behind the loan account reported under BSR-1B which
provide only broad occupation break up and not by organisation and hence many of the
non-farm categories cannot be separately covered in it. To take these into account of the
informal sector data base, feasibility of some type studies may be explored as part of the
RBI‟s survey of small borrowal accounts.
Fourth, as far as the SHG and private MFI sector are concerned, the NABARD reports
generally provide state-wise and bank-wise information on the progress of SHG savings
account maintained and loans utilised. But they do not provide (a) any dossier of the
NGO sector operating in MFI field (b) any information on their financial operations and
(c) details of the operation of private MFIs. To bridge the data gap it is suggested (i) a
comprehensive census study by NABARD on all NGOs operation in the financial sector
field as one–off benchmark exercise and (2) a half yearly reporting system on the detailed
financial operations. It is also suggested that a sample survey of NGOs and SHGs should
be undertaken by NABARD at quinquennial intervals. NABARD may also consider such
data at more frequent and regular intervals.
Fifth; for carrying forward, the spirit of informal sector definition and informal
employment issues, it is necessary to delineate informal enterprise from pure households.
It may be mentioned that farmers, business persons, traders, professionals & the self-

43
employed, money-lenders, shroffs, stock brokers and dealers are all enterprises whereas
wage and salary earners, pensioners, the unemployed, house-wives and students are pure
households. However, for the credit data there is no way to make distinction between
OAEs and establishments.
Sixth, though priority sector credit has come to assume critical importance, there are gaps
in information relating to some of the informal activities. A major gap in the data base on
priority sectors, particularly in favour of agriculture, concerns the absence of data on
shortfalls and the consequential allocations under RIDF. The RBI should set out a full
picture of these shortfalls and the operation of the RIDF arrangement. Further, from the
year 2008 onwards, the RBI has received the BSR guidelines and introduced a new
„category of borrowers‟ covering the various sections of SMEs and farmers. The entire
data set for these categories deserves to be disseminated by the RBI on a regular basis.
Apart from credit extended by scheduled commercial banks, institutional credit advanced
by (a) the co-operative sector, and (b) by SIDBI and SFCs, should also be covered in total
credit flow and/or outstanding in favour of different categories of informal sectors
5.5.12 Finally, it may be mentioned that RBI has recently set up a Committee Chaired by Shri M.
V. Nair, to re-examine the existing classification and suggest revised guidelines with regard to
priority sector lending classification and related issues. This Committee will go into various
issues relating to priority sector credit. It will inter alia review the existing Management
Information System prevalent in banks, and suggest ways to streamline the same in terms of
frequency of compliance, data consistency and data integrity.
5.6 Need for the BSR Data Dissemination to be More Wholesome
5.6.1 Data for new “Category of Borrowers” based on the size of Borrowing Unit: From the
year 2008 onwards, the RBI revised the BSR guidelines and introduced, for data coding, a new
“category of borrowers” for the MSE sector. The coding pattern suggested for the new “Category
of Borrowers” is reproduced in Table 5.1. RBI may explore dissemination of data on such
classification in future.

44
Table 5.1: List ‘F’ - Category of Borrowers - 2008
Serial
No. Category of Borrowers (by size) Code
Manufacturing Enterprises (Industries) *
I. Micro (Manufacturing ) Enterprise
Weavers- Handloom 01
Weavers- Powerloom 02
Rural Artisans/Craftsmen 03
Village/Cottage Industries (except promoted by KVIC/KVIB) 04
Tiny Industries 05
II. Small (Manufacturing) Enterprises 11
III. Medium (Manufacturing) Enterprises 12
IV. Large (Manufacturing) Enterprises 19
V. Khadi and Village Industries Sector 29
Business/Trade and Service Enterprises &
VI. Micro (Service) Enterprises 31
VII. Small (Service) Enterprises 32
VIII. Medium (Service) Enterprises 33
IX. Large (Service) Enterprises 39
Farmers (Agriculture and allied activities) $
X. Small Farmers 41
XI. Marginal Farmers 42
XII. Agricultural Labourers 43
XIII. Tenant Farmers/ Sharecroppers/ Oral lessees 44
XIV. Other Farmers (Medium & Large) 45
XV. Other borrowers engaged in agriculture and allied activities 49
XVI. All Others 99
* The Enterprises, engaged in manufacture/production, processing or preservation of goods have been classified into
Micro, Small, Medium and Large (Manufacturing) Enterprises, based on their investment in plant and machinery (original
cost excluding land and building) (items I to IV). All units in Khadi and Village Industries (KVI) Sector, Irrespective of
their
size of operations, amount of original investment in plant and machinery, etc., should be classified in item V.
& The Enterprises, engaged in providing/rendering services in selected area and included in trade/service sector, have
been classified into Micro, Small, Medium and Large (Service) Enterprises, based on their investment in equipment
(original cost excluding land and building and other items) (items VI to IX). These shall include road & water transport
operators, business, professional & self employed and other service enterprises.
$ All units, including individuals, engaged in agriculture and allied activities should be classified in items X to XV. The
individual farmers should be given codes from X to XIV. The other borrowers like companies, government entities,
firms, etc, should be classified in XV.
The definitions and limits for classifications are based on RBI circulars issued time to time.
5.6.2 More Comprehensive Estimates for the Tables Which are Based on Large Accounts only:
In the BSR volume, there are a few tables which are based on data for large accounts only (i.e.,
accounts with credit limits of above Rs. 2 lakh). In some of them, small-size accounts may be
relatively more important. For instance, this may be true in the case of individuals, JLGs and
microfinance institutions. To obviate the above problem, the RBI may make use of the results of
its sample surveys of small borrowal accounts undertaken at present biennially and explore

45
estimation for the categories covered in the above tables as Supplementary information giving
distributions across categories covering both small as well as large borrowal accounts.
5.6.3 Necessary for the RBI to Publish Data on Priority Sector Short Falls: Its importance has
come up after the doubling of credit for agriculture and the SSI sector.
5.6.4 Data on NBFCs need to be collected; however some type-studies or pilot studies may be
undertaken to appraise the difficulties involved in collection of data especially when NBFCs are
not regulated by any stipulations from RBI.
5.6.5 Data on the Financial Companies.
5.7 Linkages between Informal and Formal Sectors
From what have been put forward so far, it is clear that the fields of definitional and estimational
issues of informal sectors have been fairly comprehensively surveyed. It is also focussed on
support issues such as the institutional finance for the informal sectors. While doing all these
exercises, some serious data gaps on the linkages between the informal and formal sectors have
been noticed. These information bases when plugged against such serious data-gaps, if available
in a studied manner, are sure to provide some sound basis for promotional and other policy
issues. While it is not attempted any thorough analysis of these linkages and the nature of their
data gaps, it has been chalked out some tentative list of possible areas of such linkages which
deserve attention and possible exploration by public institutions concerned with policy and
macro-economic data. Key areas which can be the candidates for such periodical publications on
the linkages in question are enumerated below:
The phenomenon of outsourcing by manufacturing firms for industrial products to MSME
units.
The incidence of labour outsourcing for different services by organised firms.
Linkages between informal sector products and marketing.
Enforcement of prompt payment of bills of MSME sector by large corporate borrowers,
legal provisions, various RBI regulations and the corporate sector data on sundry creditors
and sundry debtors, etc.
Linkages between formal bank finance and NBFCs and their operations
Linkages between formal bank credit and the lending activities of micro-credit/
microfinance sector.
Linkages between banks and informal indigenous financiers including money lenders.
In the formal banking system, the role of loans for unorganised sector vis-à-vis
unorganised sector deposits.
5.8 The Committee endeavoured to get a view on the aspects of sustainability and risk –
managements by unorganised entrepreneurs (including the self-employed) in the wake of
46
suspension / stop of credit flows in terms of cash or raw materials and/or suspension / stop of
access to markets. As there are so many causes to affect the smooth entrepreneurial activities
leading to death of such enterprises, the Committee found it difficult to get any data on these
aspects to analyse and come out with any concrete recommendation. It, however, perceived that
character of risk and its management for the sustainability is different for different industries and
as such, it would be best to undertake case studies or type studies or pilot surveys to investigate
the data intricacies and subsequent analysis to come out with specific recommendations for
specific maladies.
5.9 The Committee found that no serious attempt has been made so far to study the kind of
linkages between the factor and product markets or more generally, those between the organized
and unorganised sectors, even though these are omni-present. It felt that a task force be
constituted by NSC to look into this important matter with the responsibility to undertake all
ways and means to bring out an Input-Output Table for the unorganized sector first with the
readily available data-sets, suggest measures to rid out the problems they faced for the said table
and then suggest means to bring the comprehensive I-O table combining both the organized and
unorganized sectors. Once this is done, the Committee felt that the linkages between unorganized
and organized sectors could be appreciably understood and the planners would be able to gauge
where such linkages require strengthening and what remedial measures to be taken to do this.
5.10 The Committee also realized the problems associated with deducing refined data on linkages
of the informal sector with formal sector particularly on the flow of commodity and services.
Nevertheless, the importance of the informal sector in meeting the requirement of formal sector
as a supplier of inputs and services is acknowledged for ascertaining their potential role in the
overall economy. The Committee recommends that the National Statistical Organisation (NSO)
may formulate methodological studies for strengthening data base on such aspects of linkages of
informal sector and formal sector as well as their trade relevance.

47
Chapter 6
The Challenge of Ensuring the Quality and Credibility of Statistical Base
6.1 Introduction
6.1.1 There has been growing concern about the quality and credibility of the data made available
by the Indian Statistical System. The NSC (2001) observed that the operational efficiency of the
System was compromised by serious deficiencies.14
There is evidence that matters may have
deteriorated since then.
6.2 Four Deficiencies
6.2.1 The four current practices that undermine the quality and credibility of India‟s database are:
i. Reduction of the number of sanctioned posts of the NSSO field investigators and their
immediate supervisors, and filling up the vacancies with inexperienced contract workers.
This institutional problem has been exacerbated by certain features of the recruitment process
that came into place since 2002.15
There are serious doubts about the capacity of contract
investigators to conduct surveys like the one on unorganized enterprises. The situation has
turned more complex with the Supreme Court effectively banning engagement of school
teachers as Economic Census enumerators. There exists no longer a designated permanent
cadre at the operational base of the Economic Census at a time when the upcoming Sixth
Economic Census is estimated to require seven lakh enumerators.
ii. Reductions in sample size along with deficient sample frame resulting in unacceptably large
standard errors. The reduced sample size because of restriction on the recruitment of
additional qualified field workers seriously compromised the quality of the Annual Survey of
Industries.
iii. Unacceptably large revisions (like for instance, the Index of Industrial Production-IIP) that
not only damage the public credibility but also diminish their utility for making official policy
decisions.
iv. Failure to initiate surveys that would provide the basic source data required for National
Accounts Statistics that has led to the adoption of excessively round about procedures making
the estimates highly suspect.
These four deficiencies are elaborated, and corrective measures suggested in the following
sections.
14
See Volume I, chapter 1 paragraph 1.1.2 of The Report of the National Statistical Commission, 2001. 15
An Order constituting the centralised Subordinate Statistical Service was issued in 2002. This replaced the pre-
existing decentralised NSSO recruitment system.

48
6.3 Functionally Debilitating Institutional Changes: Two Cases:
i. Reduced Professional Staff of NSSO and ii. Weakened Economic Census
6.3.1 Reduction of the Number of Professional NSSO FOD Field Investigators: Two Phases.
The number of field investigators in position was much larger (1189) in 1990-91, than
two decades later in 2009-10 (1109). Sanctioned posts did increase from 1469 to 2009 during the
period, but the number actually in position had gone down from 81 to 55 percent. In 2009-10,
contract investigators (1569) hired to fill the gap out-numbered the regular FOD field
investigators. These changes have taken place in two phases16
. First, in the mid-1990s by
reduction of sanctioned posts by 10 percent,17
and then the second, from the start of the
millennium, by a new recruitment system that increased the share of contract field investigators.
6.3.1.1 The First Phase: The Reduction in the Sanctioned Posts: The Finance Ministry‟s
instructions of 1995 to reduce sanctioned positions by ten percent meant the number of
sanctioned NSS field investigators fell from 1469 in 1993-94, to 1199 in 1997-98, and a similar
reduction in field supervisors from 1920 to 1745. This happened at a time when India was about
to adopt SNA1993 standards and sign up to the SDDS, which together required an improvement
in the quality and coverage of existing data, and the collection of large volumes of additional data
with increased periodicity in some existing surveys.18
The shortfall was sought to be made good
by ad hoc expansion of the Indian Statistical Services (ISS)19
and the outcome was that the base
of the service was “extensively widened while the number of positions at higher levels …
remained the same”.20
The shortage of field workers continued, and the NSSO started hiring
contract workers for the first time in 1999-00. Apparently hiring contract workers may appear
similar to the earlier practice of making ad hoc appointments. But the real difference lies in the
fact that regularized ad hoc appointments had the advantage of retaining the experienced, while
the same cannot be said of the contract workers who keep changing.
6.3.1.2 The Second Phase: In 1997, the Fifth Central Pay Commission recommended a
Centralized Subordinate Statistical Service which was a major restructuring of recruitment
institutions,21
and a shift from the erstwhile three-tier manpower structure, to a two-tier structure
which left the vast majority of FOD Sub-regional Offices (SROs) with no ISS Officer to carry out
16
Evidence from the FOD records on the size of the impact of both changes is presented for all the years from 1990-
91 to 2010-11 in Annexures A, B and C. 17
According to the instructions issued by the Finance Ministry for ten percent but in staff strength 150 posts of
Assistant Superintendents and 220 field investigators posts were required to be abolished (Office Order of NSSO‟s
FOD dated 7 March 1995). 18
S.M. Vidwans, an eminent statistician and a member of the 2001 NSC, has given a detailed account of these
events in a series of three special articles in Economic and Political Weekly, starting with the September 14th
2002
issue. 19
Only Supreme Court intervention regularized their services 20
See page 490, paragraph 14.10.27 in NSC 2001 Report, Volume II. 21
See especially Fifth Central Pay Commission Report, Volume II, chapter 81, titled “Ministry of Planning and
Programme Implementation”, page 1313, paragraph 81.17.

49
the functions of inspection and scrutiny. Before the Fifth Pay Commission recommendations
were implemented, the NSSO had a separate cadre. Recruitment of field investigators for NSS
surveys was done locally, at the level of NSSO regional offices directly. The Fifth Pay
Commission recommendation of a unified cadre for a Subordinate Statistical Service had its own
rationale22
but the new recruitment system had an immediate and significant negative impact on
the strength of NSSO investigators and superintendents who were recruited. Once it became
operational, other major shortcomings in the new system were revealed. The recruitment process
took longer, and the recruits who joined the service were not necessarily proficient in the
languages of the regions where their services were required.
6.3.1.3 The Working of the New Recruitment System: The new recruitment system was actually
launched only in 2004. But the system does not seem to be working well.23
During these years,
intake was less than outgo. The backlog of unfilled posts rose to about 800. At its worst, the
shortfall was 1100 people.24
The rate of attrition was as high as 150 to 160 per year. The
attrition is normally at the supervisory level, but due to the huge shortage at the field
investigators‟ level, the NSS decided not to promote anybody for 4 or 5 years, although eligible
cadre as well as vacant supervisory posts did exist. Thus, to maintain field staff, promotional
prospects of personnel were sacrificed. Presumably, so was the morale. Allowing attrition at the
supervisory level to continue proved to be a “most damaging” decision. Scrutiny, inspection and
supervision of field staff suffered. To deal with the problem, in 2008 a large number of field
investigators (56) were promoted as supervisors. This created a gigantic gap at the field
investigator level (vide figures for 2008-09 and 2009-10 in Annexures A and B).
6.3.1.4 Towards an Interim Solution: While filling up of all sanctioned posts is of top priority, the
task could be accomplished satisfactorily subject to the fulfillment of certain complementary
reforms. First, the recruitment rules need to be amended to ensure that there is sufficient number
of field workers in each region knowing the regional language. Second, a three-tier manpower
structure needs to be reintroduced. Until such changes are introduced, an interim solution is to
make provision for recruitment of field investigators to have 30 percent induction through local
recruitment and seventy percent through Staff Selection Commission.
22
“81.17. A large number of posts of Junior and Senior Statistical investigators in the scales of 1400-2300 and 1640-
2900 are spread over different Ministries and Offices of the Government of India. We observe that some of these
posts are isolated and the chances of promotion are very weak.” And the recommendation was “that all such posts
with statistical functions be constituted into a subordinate statistical service and all recruitment to feeder posts in
Indian Statistical Service be centralized and placed under the ISS Cadre Controlling Authority”. Fifth Pay
Commission Report, Vol. II p. 1313. 23
To illustrate, in 2006-07, MOSPI, on behalf of the NSSO asked the Staff Selection Commission (SSC) to recruit
about 350 fresh recruits at the „investigator grade 2‟ level. 350 names were provided and appointment letters were
sent but only 110 joined. MOSPI wrote again to the SSC, asking for an additional panel. They got 100 names to
whom letters were sent but only one joined. In 2007-08, MOSPI tried again to recruit. Three hundred and fifty
names were sent, eventually 90-95 joined. The story was repeated in 2008-09. 24
The Committee is indebted to a senior MOSPI official for these estimates.

50
6.3.1.5 Issues of Field Workers‟ Qualifications and Delays in the Recruitment Process: Besides
the basic academic qualifications, the most important requirement “for primary field workers is
knowledge of local language, culture and traditions, as well as topography”.25
Yet under present
dispensation, primary field workers are recruited on an all India basis and deputed to work in
field offices of particular regions without regard to their knowledge of the regional language,
culture and traditions which results in major problems. Not only is the quality of data collected
compromised; the freshly recruited and posted field workers involved in such mismatches are
more likely to resign. The „language and culture‟ problems have proved to be the most serious.
The inordinate delays in the process of recruitment are yet another cause for concern. At present,
there is a two-year gap between the initiation and completion of the recruitment process. In the
interval, the applicants may well find other jobs. The delays may make it necessary to hire
contract workers locally which means that local FOD officials must make arrangements to invite
applications, recruit and train them, only to lose them again at the expiry of their contracts.
Moreover, statistics on informal sector are generated primarily through large scale sample
surveys involving personal interview approach. To overcome these problems, it is recommended
that the requirements for primary field workers should be identified not only in terms of a
minimum educational standard, but also in terms of language qualifications that would specify
working knowledge of English, proficiency in the language of the region, and basic knowledge of
computers. Further, to avoid undue delays in recruitment, steps should be taken to streamline
present procedures with a view to ensuring that the time taken is reduced to a minimum two to
three months. A Committee may look into the matter to evolve suitable measures.
6.3.1.6 Manpower Structure, Quality Control Functions and the Need to Switch to Three-tier
System: The introduction of two-tier manpower structure and the Subordinate Statistical System
recommended by the Fifth Central Pay Commission (1997) suffers from serious deficiency.
Under the two-tier system the quality of data collected is being compromised by a reduction in
two quality control procedures viz. inspections and scrutiny. Before the SSS was set up there
was a three-tier manpower structure. At the top were Superintendents who worked as
supervisory officers. In the middle, Assistant Superintendents worked as the first-level
supervisors. Field investigators constituted the primary tier. Assistant Superintendents also
worked as primary data collectors for the Annual Survey of Industries, crop statistics and the
Urban Frame Survey. Indian Statistical Service Officers exercised overall control of survey
operations, monitored the progress of schemes and administered the FOD offices.26
6.3.1.7 Under the present two-tier structure, the work of the Sub-regional Office (SRO) is not
being properly monitored. A systematic procedure was followed in the earlier three-tier
structure. Assistant Superintendents were identified for each scheme – Socio-economic surveys,
the Annual Survey of Industries and the agricultural survey – on a rotational basis. All the First
25
Page 7, paper prepared by the FOD (2011) titled Present System of Data Collection in Unorganised Sector
Statistics – an appraisal. 26
This account is based on the 2011 FOD paper titled Present System of Data Collection in Unorganised Sector
Statistics – an appraisal. See page 4.

51
Stage Units covered in the socio-economic surveys of each NSS round were inspected by the
Assistant Superintendents. This 100 percent inspection norm was maintained as long as the three-
tier structure was in place. The work of the Assistant Superintendents was, in turn, inspected by
officers of the rank of Superintendent and above. This no longer happens and inspections and
scrutiny are seriously compromised. To ensure that high standards of data quality are maintained
through regular inspections and scrutiny, and to take charge of field offices at the SRO/NSRO
levels, it is therefore recommended that a third, supervisory tier, should be re-introduced.
6.3.1.8 Other issues: Lack of pay parity and losses of experienced cadre through resignation.
There is now a persistent brain-drain from the Subordinate Statistical Service. Pay scales are too
low and opportunities for promotion too few to retain trained and experienced workers. The entry
level grade pay is higher for recruits to other services such as Customs and Income Tax, although
recruited through the same combined examination by the Staff Selection Commission. It is
therefore recommended that the entry level grade pay for ASOs be raised to the same level as
that for recruits to other services, and that the grade pay for SOs be correspondingly increased.
An appropriately higher entry level grade pay for third tier supervisory officers will be
necessary.
6.3.1.9 How to get the best from the employment of Contract Workers: The FOD had a „mixed
experience‟ with the contract workers in quality of their work and their motivation. On the one
hand there was the attitude that „we are only here for a few months‟, and on the other, at the end
of the contract, there was loss of experienced workers, waste of funds spent on their training and
resentment among those who liked to continue as field investigators. Their educational
qualifications are similar to ASOs. To minimise the loss of experienced staff and training
expenses, it is recommended that contract workers with about two years‟ experience could be
given an opportunity to enter regular service through Limited Departmental Examination.
6.3.1.10 The Committee recommends filling up all the vacant posts of investigators in FOD. In
this regard care should be taken that appropriate „language and culture‟ qualifications have
been adopted for recruitment to regional offices. Supervisory officers should also know the local
language to ensure proper inspection and scrutiny standards.
6.3.2 India‟s Economic Census was designed explicitly to provide a sampling frame for
conducting „follow-up‟ surveys of unorganised enterprises. The first Economic Census was
carried out in 1977. The first „follow-up‟ unorganised enterprise survey was undertaken the next
year, in 1978. It covered unorganised manufacturing enterprises, complementing the already
existing Annual Survey of Industries, which had been launched in 1959. The idea was that the
two surveys, together, would cover the entire population of manufacturing enterprises, large and
small, including tiny own account enterprises engaged in manufacturing activities. The Economic
Census does a complete count of all enterprises, except agricultural enterprises engaged in crop
production and plantations. It covers all states, and generates data at the village, urban block,

52
district, state and all India levels. The Economic Census is the only source of statistics on both
formal and informal enterprises, and the only comprehensive source of data on the unorganised
sector.27
The main objective of the Economic Census continues to be the generation of an
updated frame of enterprises for the „follow-up‟ surveys. An equally important function,
introduced from the 1998 Fourth Economic Census, is to generate data for a state-wise Directory
of Establishments having 10 or more workers. This is to be used for the preparation of a Business
Register.28
6.3.2.1 Reduced Capacity of the Economic Census due to restructuring of the Economic Census
from1998: Until 1998 there had been a full-fledged Enterprise Survey unit within the Economic
Census which conducted the follow-up surveys on Directory of Establishments. The NSSO did
the Non-directory and Own Account Enterprise surveys. This practice continued from 1977 up to
the 1998 Economic Census. From the Fourth Economic Census in 1998 onwards, the Census has
been conducted in collaboration with the Directorates of Economics and Statistics (DES) of
States and Union Territories. As one informant put it “Gradually, the Enterprise Survey unit
became defunct,” as normal attrition took place and vacant sanctioned posts remained unfilled.
6.3.2.2 Need to strengthen Economic Census and the MOSPI Working Group on the Sixth
Economic Census: For effective conduct of Economic Census every five years and to compile
and update the Business Register, the MOSPI Working Group on the Sixth Economic Census
suggested a number of measures to strengthen the Economic Census from the Centre (CSO),
State to the District level.29
It is recommended that these recommendations should be adopted as
guidelines for the conduct of the Sixth Economic Census and their efficacy should be reviewed
subsequently in the light of the experience.
6.3.2.3 Gross Underlisting and Poor Quality – The Achilles‟ heel of the Economic Census: It was
widely noticed that in the Third Economic Census (1990) there was massive undercount of both
enterprises and employment.30
Wide divergences between the Economic Census and the NSS
results were noticed and commented with concern by the NSC (2001).31
The gross
underestimation of the number of enterprises, and therefore the number of workers, compared to
the NSS, persists even in the Fifth Economic Census as instanced below (Sanyal 2011).32
27
The unorganized enterprises cover only specified branches of the economy, eg. manufacturing, trade and specified
services. Economic Census, however, tends to miss enterprises with no fixed place of work and those conducted
within residential premises. 28
The Business Register was recommended by the Rangarajan Commission, 2001 and reiterated by the NCEUS
2008 Report on Definition and Statistical Issues. 29
Report of the Working Group on the Sixth Economic Census, MOSPI (8 October 2010). 30
See the results of the Report of the Expert Committee to Examine Wide Variations in Data Sets on the Same
Subject (February 2000), which was much quoted by the Rangarajan Commission (2001). 31
The two sources are the Economic Census of 1990 and the Unorganised Enterprise Surveys of Trade, Hotels and
Restaurants and Transport of 1990-91. See page 192 of the 2001 Report of the National Statistical Commission,
Volume II. 32
T.K. Sanyal (2011) A Note on Comparison of EC 2005 estimates and NSS estimates of 62nd
Round and 63rd
Round.

53
i. NSS estimates of manufacturing enterprises and workers are about twice the corresponding
2005 Economic Census (EC) estimates.
ii. NSS estimates of manufacturing own account enterprises (OAEs) are almost three times the
corresponding EC estimates.
iii. NSS estimates of the number of manufacturing workers in unorganised manufacturing in the
62nd
Round is 1.4 times the total (organised plus unorganised), compared to such workers in
EC 2005.
iv. NSS estimates of OAEs in the service sector, excluding trade, are nearly three times the EC
estimates. But, the EC estimates of Government and Public Sector units are higher than the
NSS estimates, showing that Directory and Non-Directory numbers generated by the EC are
not undercounts.
v. EC estimates of manufacturing enterprises at the state level are lower than the NSS in all of
35 States and Union Territories.
vi. Over time, in the last three ECs and NSS unorganised manufacturing surveys, the NSS
estimates of unorganised enterprises are always higher than the number of all, (unorganised
plus organised), manufacturing enterprises by the EC by two to three times.
The crux of the problem is that “NSS surveys were carried out with the help of permanent and
experienced field staff of NSSO whereas EC was carried out with the help of a large number of
ad hoc enumerators who were given training for the specific job lasting only for a short period”.33
6.3.2.4 Problems at the Operational Base – The Quality of Enumerators: Enumerators hired for
EC have been under-qualified, under-trained, inexperienced and under-supervised. Training
deficits are at two levels: at the training of enumerator, and at training in tabulation and coding.
Inadequacies in the design of the schedules and lack of clarity in instructions add to the problems.
That the enumerators are of indifferent quality is reflected from the fact that they range from
school teachers, educated unemployed youth to Angawadi workers and college students.34
Adequate number at the expected qualifications for enumerators and supervisors may not
materialise.35
Enumerators are hired for a very short period and paid insufficient honorarium
without any reference to the diverse field conditions where they have to work. The 2006
Supreme Court ruling against using of school teachers as enumerators may pose further
problems. These deficiencies may jeopardise the design improvements, especially in OAEs,
introduced in the questionnaire of the Sixth EC.
6.3.2.5 Five Specific Problems: Each of the following problems needs immediate attention:
i) Economic Census. Over the years an ad hoc approach to the timing of the Census, its
periodicity, and provision for updating the data for inter-census years has played havoc with
33
See page 7, op cit. 34
See ESD CSO (2009) Planning for the Conduct of the 6th
Economic Census, pages 3 and 4. 35
See Minutes of a meeting of the Working Group held 8th
October 2010.

54
the systematic development of appropriate institutional and procedural measures for
conducting India‟s Economic Census. Further, delays in the publication of results have been
the cause of complaints from the Parliamentary Standing Committee on Finance.36
This has
to end. First, the timing of the Economic Census should be predictable, and its periodicity
should be every five years. Second, the quinquennial Economic Census results should be
published, and made available to all levels of government, ideally a year before the
preparation for successive Five Year Plans begin.
ii) Failure of three-tier training model. For instance, the Fifth EC top-down approach in training
first the top layer of trainers from CSO, and State Directorates, then at the State and District
level, and finally at the lower level, resulted in a great loss in transmission37
. The lowest
level of training was hardly for two days, and the numbers thus trained at any one place were
too large to expect proper instruction or reception. It is recommended that arrangements be
made, first, by extending the training period to three days, and second, to reduce the number
trained at any place to be of moderate size. And the training of lower level officials should be
from the experienced, core group of trainers to avoid failure of „instructional trickle down‟.
iii) Lack of a designated, professional cadre for Economic Census and Sample Surveys at the
State and District Levels. The National Strategic Statistical Plan (2008)38
and the India
Statistical Strengthening Project (ISSP) recognised the need for adequate, careful and urgent
attention towards enhancing the capacity of the (DES) to organise large-scale surveys, use of
advanced software for processing and report generation.39
The better equipped State DESs are
expected to participate effectively in the conduct of sample surveys matching the NSS
sample.40
The Thirteenth Finance Commission recommends financial aid for improving
statistical competence at the District level.41
The need for strengthening EC in evolving a
dependable Business Register for introducing Annual Survey of non-manufacturing industries
is also an important consideration.42
The Committee therefore recommends a planned
programme to bring the four complementary projects viz., (i) Economic Census, (ii) Business
Register, (iii) Annual Survey of Industries and (iv) Annual Survey of Non-Manufacturing
Industries (including construction and ITC sector), on a compatible platform to derive fuller
36
See Issues for the Conduct of the 6th
Economic Census, Presentation at the 17th
COCSSO, February, 2010, by the
ESD CSO. The Parliamentary Committee expressed the hope that the 6th
EC would be completed during the 11th
Five Year Plan itself. 37
Ibid, page 3 38
Available at mospi.nic.in/Mospi_New/upload/nssp_2July 08_files/nssp_2july08.htm 39
Page 11 op cit. 40
Page 11 op cit. 41
This rationale for their approach was stated explicitly on page 3 of the Ministry of Finance, Department of
Expenditure, Finance Commission Division ( January 2011) document Guidelines for Release and Utilisation of
Grant-in-aid for Improvement of Statistical Systems at State and District Levels. 42
Quoted from page 6, Draft Expenditure Finance Committee (ESD) for Central Sector Plan Scheme on Sixth
Economic Census, prepared by the Economic Statistics Division (ESD) of MoS&PI

55
advantages of complementarities. The Committee also recommends that this programme
should be treated as a Central Sector Plan Scheme.
iv) Worries about the likely impact of the 2006 Supreme Court ban on school teachers as
enumerators: The immediate solution for this problem may involve certain ad hoc measures
but the longer-term challenge is to construct a durable solution by attracting qualified people
who are currently unemployed. A suitable incentive might be a scholarship examination to
field investigators at the end of the stint with the Economic Census leading to scholarships for
pursuing higher studies at the State level. Another possibility is an annual summer holiday
internship. It is recommended that incentive programmes of this type be initiated in advance
of the Sixth Economic Census in at least some States on a trial basis.
6.3.3 Inadequate Sample Size – the Annual Survey of Industries: Normally a survey is designed
by first deciding on the appropriate size of the sample and then executing the survey with the
required number of field staff. But over the years, in the case of Annual Survey of Industries
there emerged a strange situation of the “determination of sample size for various states and
union territories … solely based on the number of field investigators available. The practice
followed has no statistical justification.”43
This practice, combined with a sampling frame based
on a highly defective list of factories maintained by the Chief Inspector of Factories (CIF) has
seriously undermined the quality and credibility of the Annual Survey of Industries (ASI). The
sample size was halved in 1997-98 and was further reduced to ten percent in the following year,
and as a result the very objective of the ASI is reduced to estimating national, or at best, state
totals of those numbers.44
The reduced sample size resulted in unacceptably large sampling
errors of estimates even at the all-India level45
and the NSC (2001) suggested that the sample size
should be increased for at least those industries where errors of estimation are very high.46
Very
high relative standard errors are reported for some of the recent years47
and more so between
2002-03 and 2007-08,48
making it difficult to arrive at 2-digit industry-wise estimates for the
Registered Manufacturing Sector at the State level. To overcome the problem of inadequate
sample size, on the lines of the suggestions made earlier by the National Accounts Division
(NAD) 49
and the NSC (2001),50
it is recommended that States and Union Territories should
43
Report of the National Statistical Commission (2001) Volume II, page 444, paragraph 14.2.55. See also page 153
paragraph 5.130, where the NSC 2001 concluded that “the existing sample design of the ASI with its present sample
size results in fairly large sampling errors of estimation even at the all-India level…” 44
Vidwans‟ (2002) op cit, description related to changes in the Population Census methodology but his objection
applies as well to what happened to the ASI. See page 3823. 45
NSC 2001 Report, Volume II, page 153, paragraph 5.1.30. 46
See NSC Report Volume II, paragraph 5.1.29. 47
G.C. Manna (2010) Current Status of Industrial Statistics in India: Strengths and Weaknesses, table 4, page 71 in
Economic and Political Weekly, Volume XLV Number 26, 13 November 2010. 48
2005-06 seems to have been a particularly bad year; there was one case of an RSE for GVA of 65.73 and another
of 35.28. In 2004-05, there were two cases of RSEs between 35 and 36. In 2002-03, there was one case of an RSE of
29.02. 49
See page 2, item v) of a note prepared by the NAD (2011) titled Material for Sheila Bhalla on Data Gaps. 50
NSC Report 2001 Volume II page 155, paragraph 5.1.37 (ii).

56
canvas the ASI schedules in the residual units (i.e, not covered by the NSSO) in their respective
States and Union Territories, either on sample or on complete enumeration basis.
6.3.4 Short-term Periodic Indicators have a poor credibility record in India. Monthly Index of
Industrial Production (IIP) is one such indicator discussed here.
6.3.4.1 The Index of Industrial Production (IIP) is characterized by a combination of institutional
and related deficiencies which is common to periodic indicators that are heavily dependent on
multiple data sources.51
The IIP covers mining, manufacturing and electricity, and is compiled
and released by the Central Statistics Office (CSO). Under the Special Data Dissemination
Standards (SDDS), the IIP for any reference month has to be released within six weeks from the
end of the month. To achieve this, all source agencies are required to furnish data to the CSO
within four or five weeks from the end of the month. Since production units at the base of the
data collection system commonly fail to provide data on time, the source agencies resort to
„estimation‟ for the non-responding units. These data are used to compute the Quick Estimates
(QE) for the month, which are released by the CSO in six weeks. Later, on the basis of revised
production data received, the index is revised and released as Revised Estimates (RE) in the next
month and finally, three months after the release of the QE, a revised Final Estimate is published
along with the Quick Estimates for the month. The wide variations between these different
estimates are the butt of severe criticism.52
6.3.4.2 Multiple Data Source Agencies and Poor Response Rates: One of the major causes that
results in serious compromise of the quality of IIP relates to multiple data source agencies which
are afflicted with a number of serious deficiencies.53
Currently sixteen agencies, one for mining,
one for electricity and fourteen for manufacturing, provide monthly production data to the CSO.
Of all the agencies that provide data on manufacturing, the Department of Industrial Policy and
Promotion (DIPP) is the most important, accounting for almost half of the IIP. The response rates
experienced by DIPP appear to be often not satisfactory54
. Further in the new policy regime of
liberalistaion of the Industrial Sector, the Government machinery‟s ability to induce a good
response from the industrial units for providing statistics on a monthly basis has been
considerably eroded” and the available legal backing has been ineffective.55
The proposals for
streamlining the IIP include construction of additional IIP based on bigger units,56
preceded by a
comparative study of annual growth rates in production based on ASI data for recent years and
51
The weekly Wholesale Price Index has been subject to similar problems. 52
See page 14, paragraph 15, Inaugural Address by Dr. D. Subbarao, Governor RBI at the Statistics Day Conference
of RBI, 5th
July 2011 titled Statistics and the World of RBI. (available at rbidocs.rbi.org) 53
NSC 2001 Report, Volume II, page 8, paragraph 2.4.4. 54
For details see 2001 NSC report Vol. 1, page 537, Annexe 5.22 55
On these points see paragraph 2.4.4, page 8 NSC 2001 Report Volume I, chapter 2. 56
See paragraph 2.4.4, page 8, ibid.

57
current IIP;57
compilation of comparable State-level IIPs,58
which some state have been carrying
out more systematically59
but not in favour of any Central agency doing it;60
and preparation of
separate IIPs for organized and unorganized manufacturing. 61
62
In the interests of providing
more useful, more timely and more credible IIP, it is recommended that an Expert Committee
should be constituted to look into the feasibility of implementing these possibilities. It is also
recommended that an Expert Committee be appointed to undertake detailed industry-wise
investigation into the sources of volatility and to recommend corrective measures. Further, to
avoid long gaps between updates of IIP base year, it is recommended, as suggested by the UN
Statistical Office, that the CSO be mandated to revise the base year of the IIP every five years.63
6.3.5 Failure to initiate surveys and to compile basic sources of data required for the National
Accounts Statistics (NAS) resulting in adoption of round about estimation procedures by NAD
especially in agriculture and allied activities, forestry, fishing and construction.
6.3.5.1 Agriculture: The Gross Value Added (GVA) by agriculture sourced from the Ministry of
Agriculture‟s Directorate of Economics and Statistics (DES) which builds up estimates from a
multiplicity of sources.64
The limitations of various sources on major and minor crops and their
by-products, sources on inputs, data on vegetables and fruits, plantation etc. are well
documented.65
There are huge time lags of data on wholesale prices of primary markets, and the
result is “large scale estimates”.66
Some of the major data gaps include non-capturing of value
added due to storage of produce; valuation of „miscellaneous‟ crops” on the basis of other and
related crops”; lack of complete data on floriculture, mushroom culture, medicinal and aromatic
plants, betel leaf and toddy; and methods like estimation of grass as livestock feed based on the
1955-56 NSSO Survey. Discontinuation of data supply in certain areas like minor crops and late
supply of data are some of the other problems.67
The NSC (2001) recognized the need for special
surveys,68
including farm-management survey on all-India basis.69
However, it may be pointed
out that the Comprehensive Scheme for Studying the cost of cultivation of Principal Crops in
57
These recommendations appear in paragraph 5.4.17 (xiii) and (xv) on page 173 of Volume II, NSC Report 2001. 58
NSC 2001 Report, Volume II, page 174, paragraph 5.4.18. 59
Paragraph 5.4.19, page 174 ibid. 60
Paragraph 5.4..20, page 174, ibid. 61
G.C. Manna 2010, Current Status of Industrial Statistics in India: Strengths and Weaknesses, in Economic and
Political Weekly, Volume XLV Number 26, 13th
November. 62
NAD (2011), Material for Sheila Bhalla on Data Gaps, page 2. 63
See paragraph 5.4.17 (v), page 172, NSC Report, Volume II. 64
Quoted from paragraph 9.16 on fertilizer statistics in National Accounts Statistics – Sources and Methods 2007
(NAS 2007). 65
Chapter 9 on Agriculture and allied activities in NAS 2007 provides an official account of some of these
limitations. See especially paragraphs 9.70, 9.71 and 9.72. 66
Page 4, NAD (2011) Material for Sheila Bhalla on Data Gaps. 67
See page 4, NAD (2011) ibid. 68
Report of the National Statistical Commission (2001) Volume II, page 144, paragraph 4.22.1. 69
Paragraph 4.22.8 (ii), page 145, NSC 2001 Report, Volume II.

58
India gathers much of the required farm-level data, and further utilization of this source could
help in overcoming some of the limitations.
6.3.5.2 Forestry and Logging: In the National Accounts, the GVA is estimated based on
production approach but in some categories of forest products, production data are incomplete or
non-existent. Added to this, States tend to accord low priority to reporting data and some fail to
furnish statistics on time.70
The contribution of forest sector to GDP is underestimated since
these do not take into account several important items.71
For instance, the estimates of industrial
wood are “generally considered to be quite an underestimate”.72
To improve the estimates
related to the production and value of industrial wood, it is recommended that State Forest
Departments should be required to provide species and quality-wise quantity and current price
estimates for the output produced by Government forests. Data on production of fuel wood are
not available but estimated on the basis of information on the consumption of fuel wood by
households73
and the data on firewood are estimated on the basis of NSS quinquinnial survey
data on household consumption and hence these estimates are likely to be less reliable.74
The
value of minor forest produce (MFP) is estimated on the basis of royalties received but are
considered to be under estimates. The NSC (2001) recommendation in this regard remains on
paper.75
There are no data at all on the production from social forestry and related programmes.76
There are rough estimates of input costs as ten percent of the total value of output.77
An another
major problem is the inordinate delay in the availability of data for compiling GVA by forestry
and logging.78
Following the NSC (2001), it is recommended that “State Forest Departments
should be adequately supported by the establishment of appropriate statistical units to oversee the
collection and compilation of forestry statistics from diverse sources on forest products”.79
6.4 Enhancing informant‟s cooperation: All the statistical exercises while adopting appropriate
methodology, concept, design and the procedures for generating statistics with due concern for
reducing non-sampling errors do need to have cooperation of informants and the units providing
the data. It is well recognized that a good data base depends upon the cooperation of the
respondents. Towards this end, the measure to sensitise the general public on the importance of
data through publicity is equally important for quality of data and control of non-sampling
errors.
70
For this summary, see paragraph 10.17, page 116, National Accounts Statistics – Sources and Methods 2007. 71
See paragraph 4.17.5, page 138, NSC 2001 Report, Volume II. 72
NAS 2007, paragraph 10.17. 73
Paragraph 10.10, page 115, NAS 2007. 74
Paragraph 10.16, NAS 2007. 75
Paragraph 10.16, page 115, NAS 2007. 76
Page 5, NAD Material 2011. 77
Based on paragraphs 10.12 and 10.17 of NAS 2007 and material from NAD 2011. 78
NAS 2007, paragraph 10.12. 79
NSC 2001 Report, Volume II, paragraph 4.17.10.

59
Annexure - A
A. NSS Field Investigators
Year Sanctioned
In
Position
Retd+
VRS Resignation Promotions Other Attrition
Total Attrition (Col.
4+5+6+7) Rectt.
Contract
Investigators
(1) (2) (3) (4) (5) (6) (7) (8) (9) (10)
1990-91 1469 1189 - - - - - - -
1991-92 1469 1215 - - - - - - -
1992-93 1469 1161 - - - - - - -
1993-94 1469 1100 - - - - - - -
1994-95 1231 1054 - - - - - - -
1995-96 1199 1015 - - - - - - -
1996-97 1199 998 - - - - - - -
1997-98 1199 1170 - - - - - 214
1998-99 1482 1215 - - 66 66 - -
1999-00 1482 1165 - - 56 56 171 240
2000-01 1482 1215 - - - - - -
2001-02 1482 1242 - - - - - 55 104
2002-03 1482 1223 - - - - - - -
2003-04 1482 1215 - - - - - 120 -
Field Investigator (Gr. III and IV From 2004-05 to 2007-08
2004-05 2009 1519 - - - - - - 437
2005-06 2009 1525 4 58 - 4 66 436 -
2006-07 2009 1456 1 38 - 3 79 - -
2007-08 2009 1683 3 100 - 4 107 165 -
Asstt Superintending Officer Gr. II 2008-09 onwards-
2008-09 2009 1633 3 99 481 5 588 - -
2009-10 2009 1109 1 35 253 3 292 286 1569
2010-11 - - - - - - - - 1020
Note: For Promotion/Resignation/Retd/VRS and other Attrition figures files of individual incumbents have to be checked (around 3500 to 4000) which will take
lot of time. Thus, above figures may be treated as tentative
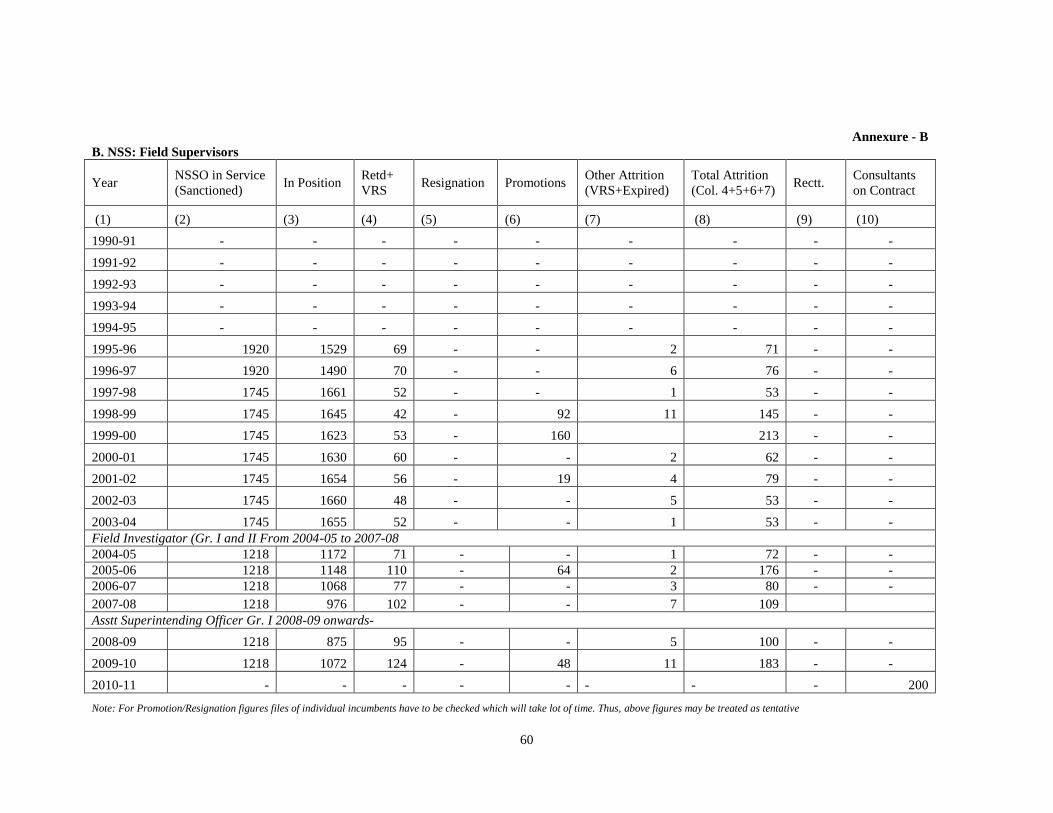
60
B. NSS: Field Supervisors
Annexure - B
Year NSSO in Service
(Sanctioned) In Position
Retd+
VRS Resignation Promotions
Other Attrition
(VRS+Expired)
Total Attrition
(Col. 4+5+6+7) Rectt.
Consultants
on Contract
(1) (2) (3) (4) (5) (6) (7) (8) (9) (10)
1990-91 - - - - - - - - -
1991-92 - - - - - - - - -
1992-93 - - - - - - - - -
1993-94 - - - - - - - - -
1994-95 - - - - - - - - -
1995-96 1920 1529 69 - - 2 71 - -
1996-97 1920 1490 70 - - 6 76 - -
1997-98 1745 1661 52 - - 1 53 - -
1998-99 1745 1645 42 - 92 11 145 - -
1999-00 1745 1623 53 - 160 213 - -
2000-01 1745 1630 60 - - 2 62 - -
2001-02 1745 1654 56 - 19 4 79 - -
2002-03 1745 1660 48 - - 5 53 - -
2003-04 1745 1655 52 - - 1 53 - -
Field Investigator (Gr. I and II From 2004-05 to 2007-08
2004-05 1218 1172 71 - - 1 72 - -
2005-06 1218 1148 110 - 64 2 176 - -
2006-07 1218 1068 77 - - 3 80 - -
2007-08 1218 976 102 - - 7 109
Asstt Superintending Officer Gr. I 2008-09 onwards-
2008-09 1218 875 95 - - 5 100 - -
2009-10 1218 1072 124 - 48 11 183 - -
2010-11 - - - - - - - - 200
Note: For Promotion/Resignation figures files of individual incumbents have to be checked which will take lot of time. Thus, above figures may be treated as tentative

61
Annexure - C
Statement showing the number of contract investigators (C.I.s.) and Consultants engaged by NSSO (FOD)
since 1990-91
Sr. No. Year (Period)
Contract
Investigators
Consult
ants Period of Engagement
1 1990-2000 240 - Exact period of engagement is not available Probably from July to June
2 2002-03 104 - do-
3 2004-05 437 - do-
4 2009-10 1569 -
1. 616 Contract Investigators for 66th round of NSS from July 2009-June 2010
2.. 600 Contract Investigators for Urban Frame Survey (UFS) from July, 2009 to
March 2011
3. 126 Contract Investigators for NREGA Survey for twenty five months from July
2009 to July 2011
5 2010-11 1020 200 1. 1020 Contract Investigators and 200 Consultants for 67 round of NSS from June
2010 to July 2011

62
Chapter 7
Recommendations
7.1 Introduction
7.1.1 There are a number of gaps in the statistics on enterprises and employment in informal
sector in India. The Committee noted that the data gaps emanate from the divergence of the
existing data collection mechanism relating to concepts, definitions and coverage required for an
effective data system conforming to the ILO frame work. The Committee considered the
unorganized sector in a holistic perspective, in terms of their characteristics, their linkages and
inter-relationship with organized sector as well as linkages with institutions and processes such
as credit, marketing, trade and risk management. The Committee recommends that a dedicated
unit should be created within NSO for standardizing concepts, definitions and harmonization
thereof and promoting their use in census and surveys. This unit will also regularly interact with
all national level institutions involved in conduct of such surveys on the need for adopting
harmonized concepts and definitions. [Paras: 2.2.14 and 4.5.1]
7.2 Informal Employment
7.2.1 The Committee noted that the present questionnaire of NSS Employment and
Unemployment Survey (EUS) is very lengthy. However, in view of the importance of data on
informal employment, the Committee suggests the incorporation of a few more probing
questions pertaining to informal characteristics of the enterprises and the workforce, particularly
in the quenquennial surveys. If such an augmentation is not feasible, then a full-fledged survey
confined only to informal sector (based on usual activity approach for principal and subsidiary
status) should be conducted as a follow up of EUS survey. [Para: 3.9.3]
7.2.2 A major limitation of the EUS is inadequate information on the quality of employment. The
Committee recommends that some additional items of information to capture the quality of
employment (productivity, durability, regularity of work, security and safety), with proper
specification, may be incorporated in the survey instruments. The Committee also recognised the
importance of statistics on earnings. However, there are constraints in the collection of reliable
data on earnings from self employment. To overcome these limitations, appropriate
methodological studies may have to be undertaken and specific indicators and data needs to be
identified. [Para: 3.10.3 and 3.10.4]
7.2.3 The recent initiative of the Labour Bureau to conduct Annual EUS is primarily meant to
study the impact of economic volatility on the labour market. However, the surveys do not
distinguish formal and informal employment. The Committee while appreciating the initiative
suggests that the Annual EUS be redesigned to capture the informal employment as well. [Para:
3.11.5]

63
7.3 Informal Enterprises
7.3.1 The Committee recognises the importance of cost of cultivation data in bridging the vital
data gap for studying various aspects of farm enterprises and recommends that the
Comprehensive Scheme for Study of Cost of Cultivation should be strengthened by inducting
inbuilt mechanism of data validation, consolidation and dissemination. The central unit
managing the cost of cultivation studies in the Ministry of Agriculture needs to be suitably
strengthened and the validated unit level data should be put in public domain. In the process of
data dissemination, corrections incorporated at the central unit level should also be
communicated to the primary data collection units (i.e., Agricultural Universities). [Para: 3.16.5]
7.3.2 The Committee noticed the virtual absence of data on the construction sector. Since
informal workers are found in large number in this rapidly expanding sector, the Committee
recommends that a special survey on informal sector relating to construction activities be
undertaken on a priority basis. [Para: 3.8.5]
7.3.3 The Committee noted that the Ministry of MSME is taking initiative to evolve production
index based on MSME census/sample data. For enhancing the utility of MSME surveys and their
comparability with other surveys of unorganized sector, the schedule of enquiry should
incorporate information on the type of enterprises, and the employment size. The Committee
suggests that the unit level data of MSME surveys should also be put in public domain,
maintaining the confidentiality. [Para: 3.14.1]
7.3.4 Considering the important role of micro, small and medium enterprises in the national
economy, the Committee recommends that systematic studies may be undertaken on their role in
terms of output, employment and export. In addition, studies may be sponsored on value added
and technology absorption in these enterprises. [Para: 3.14.2]
7.4 Economic Census
7.4.1 In view of the weakness and deficiency in the data-capture, coverage and under-reporting
as observed in the past ECs, the Committee recommends setting up of a permanent unit, both at
Central and State level, in line with the Population Census, to conduct the ECs at regular and
fixed interval of five years. The Committee recommends to equip the Central and State units
with adequate manpower and financial resources and with the provision to enhance the
capabilities of human resources through up-to-date training. The human resources should be
capable of updating the EC frame and preparing the Business Register during the inter-census
period based on administrative records. The guidelines of the Working Group on Business
Register constituted by the MOSPI should be followed. The Committee also recommends that
the quinquennial Economic Census results should be published, and made available to all levels
of government and other users, ideally a year before the preparation of successive Five Year
Plans, bringing EC in alignment with Planning cycle. [Para: 3.15.4 and 6.3.2.5 (i)]

64
7.4.2 The MOSPI Working Group on the Sixth Economic Census suggested a number of
measures to strengthen the Economic Census. The Committee recommends that these
suggestions should be adopted as guidelines for the conduct of the Sixth Economic Census and
their efficacy should be reviewed subsequently in the light of the experience. [Para: 6.3.2.2]
7.4.3 The Committee recognises the critical importance of training in the conduct of Economic
Census and recommends that arrangements be made, first, by extending the training period to
minimum of three days, and second, to reduce the number trained at any place to be of moderate
size. The training of lower level officials should be by the experienced core group of trainers to
avoid failure of „instructional trickle down‟. [Para: 6.3.2.5 (ii)]
7.4.4 The National Strategic Statistical Plan (2008) and the India Statistical Strengthening
Project (ISSP) recognised the need for adequate, careful and urgent attention towards enhancing
the capacity of the DES to organise large-scale surveys, use of advanced software for processing
and report generation. The Thirteenth Finance Commission recommended financial aid for
improving the statistical competence of the DES at the District level. The Committee recognises
the need for strengthening EC in evolving a dependable Business Register for introducing
Annual Survey of non-manufacturing industries. The Committee therefore recommends a
planned programme to bring the four complementary projects viz., (i) Economic Census, (ii)
Business Register, (iii) Annual Survey of Industries and (iv) Annual Survey of Non-
Manufacturing Industries (including construction and ITC sector), on a compatible platform to
derive fuller advantages of complementarities. The Committee also recommends that this
programme should be treated as a Central Sector Plan Scheme. [Para: 6.3.2.5 (iii)]
7.4.5 In view of non-availability of school teachers for data collection and survey activities,
immediate solution may need to be evolved in the case of conduct of EC, and a strategy may be
adopted by attracting qualified people who are currently unemployed with suitable incentives
and providing them appropriate training. [Para: 6.3.2.5 (iv)]
7.5 Economic Contribution of Informal Sector
7.5.1 The Committee recommends that a system for statistics on informal economy should have
the mechanism to capture data on direct and indirect linkages between the formal and informal
sectors, taking into account aspects like (i) forms of organisation, (ii) existence of differences in
employment status like unpaid family workers including self employment, women‟s
participation in extended SNA activities, (iii) variation in the nature of unorganised sector across
different locations, and (iv) vulnerability of unorganised sector to shocks. (Para 2.1.7)
7.5.2 The Committee felt that there is an urgent need to improve the methods of arriving at
estimates of GVA from service and construction sectors based on sound methodology and
database, separately for organised and unorganised segments. The Committee also recommends

65
that „satellite account‟ for the unorganised sector be prepared once in five years. [Paras 3.8.5
and 4.5.1; and Section 4.4]
7.6 Credit Issues
7.6.1 The Committee recognized that there is no unique system which captures credit
information in respect of unorganized sector enterprises satisfactorily. In order to effectively
address the issues concerning informal sector enterprises, the Committee recommends
development of a suitable frame of the unorganized sector enterprises. The classification and
coding system that will be used to collect data on credit, production, value added, employment
and other related information from the same set of entities should be made compatible with the
BSR coding system. To capture such data, surveys are to be undertaken on the lines of NSSO‟s
AIDIS/ Enterprise survey at least once in five years using this frame and classification/coding
structure. [Paras: 5.5.3, 5.5.4 and 5.5.5]
7.6.2 The Committee recommends that the Enterprise Surveys of NSSO/CSO need to specifically
cover financial service enterprises and provide data needed to derive value-added details as also
the details of credit. The RBI should closely liaise with CSO and NSSO on the technical aspects
of these surveys and ensure the coverage of all known household financial enterprises like, share
brokers, multani shroffs, chettiars, marwari kayas and pawnbrokers and various kinds of
moneylenders. [Para: 5.5.6]
7.6.3 In order to collect financial data in respect of all NGOs and SHGs involved in micro
financing, the Committee recommends that a sample survey of NGOs and SHGs should be
undertaken by NABARD at quinquennial intervals. NABARD may also consider such data at
more frequent and regular intervals. Apart from nation-wide surveys which provide macro-
estimates, considering the diversity across regions, it is necessary to promote regional and micro-
level studies on the informal financial sector activities. [Para 5.5.11(iv)]
7.6.4 The Committee noted some serious data gaps on the linkages between the informal and
formal sectors and recommends that these information gaps be plugged and, data be made
available in a studied manner, to provide adequate basis for promotional and other policy issues.
The Committee identified some areas for periodical studies on linkages between formal and
informal sectors. It recommends special studies on linkages between formal bank finance and
NBFCs and their operations, linkages between formal bank credit and the lending activities of
micro-credit/ microfinance sector, linkages between banks and informal indigenous financiers
including money lenders. It also recommends studies on the role of formal banking system in
loans for unorganised sector vis-à-vis unorganised sector deposits. [Para 5.7]
7.6.5 On the aspects of credit flows to informal sector, the Committee noted that the database
maintained by RBI does not have any thing specifically related to unorganized sector. The
Committee recommends that the details collected under various returns of RBI should be

66
tabulated against the informal financial sector to understand the extent of linkages between the
formal and informal segments. A few tables presenting disaggregated data in the BSR volumes
for scheduled commercial banks are based on only large loan accounts (that is, presently with
credit limits of above Rs. 2 lakh). These tables are: 1.13 (by interest rate range), 1.14 (by type of
account), and 1.15 (according to organisation). Under many sub-categories represented in them,
small-size accounts are sure to be important. To present consolidated accounts of such
distributions, the RBI may make use of its sample surveys on small borrowal accounts, presently
undertaken biennially, and explore aggregate estimation for the relevant categories covering both
small and large accounts. [Paras: 5.5.10 and 5.6.2]
7.6.6 Though priority sector credit has come to assume critical importance, there are gaps in
information relating to some of the informal activities. A major gap in the data base on priority
sectors, particularly in favour of agriculture, concerns the absence of data on shortfalls and the
consequential allocations under RIDF. The RBI should set out a full picture of these shortfalls
and the operation of the RIDF arrangement. Further, from the year 2008 onwards, the RBI has
received the BSR guidelines and introduced a new „category of borrowers‟ covering the various
sections of SMEs and farmers. The entire data set for these categories deserves to be
disseminated by the RBI on a regular basis. Apart from credit extended by scheduled commercial
banks, institutional credit advanced by (a) the co-operative sector, and (b) by SIDBI and SFCs,
should also be covered in total credit flow and/or outstanding in favour of different categories of
informal sectors. [Para: 5.5.11 (vi)]
7.7 Linkages between Informal and Formal Sectors
7.7.1 Committee recommends that a task force be constituted by NSO to examine and bring out
an Input-Output Table for the unorganized sector, to begin with on the basis of the readily
available data-sets, and then suggest measures to overcome problems faced in preparing the I-O
table. The suggestions should aim at bringing out a comprehensive I-O table combining both the
organized and unorganized sectors. [Para 5.9]
7.7.2 The importance of the informal sector in meeting the requirements of formal sector as a
supplier of inputs and services is well acknowledged. The Committee recommends that the
National Statistical Organisation (NSO) may formulate methodological studies for strengthening
data base on such aspects of linkages of informal sector and formal sector as well as their
relevance in activities like trade. [Para 5.10]
7.8 Sustainability and Risk
7.8.1 The Committee recognized the development concerns of unorganized sector in the wake of
its vulnerability of operation, sustainability and risk arising out of factors such as suspension /
stop of credit flows in terms of cash or raw materials, suspension / stop of access to markets and
other non market factors such as absence of information, communication and connectivity but

67
noted that there are so many causes to affect the smooth entrepreneurial activities leading to
death of such enterprises. The character of risk and its management for the sustainability are
different for different industries and as such, the Committee recommends that it would be best to
undertake case studies or type studies or pilot surveys to investigate the data needs for
understanding vulnerabilities. [Para 5.8]
7.9 Institutional Issues
7.9.1 Statistics on informal sector are generated primarily through large scale sample surveys
involving personal interview approach. Keeping this in view, the Committee recommends that
the primary field workers should not only have minimum educational standard, but also working
knowledge of English, proficiency in the language of the region, and basic knowledge of
computers. To ensure sufficient number of field workers in NSSO in each region with
knowledge of regional language, the Committee recommends for necessary amendment of the
recruitment rules. [Para: 6.3.1.5]
7.9.2 The Committee recommends filling up all the vacant posts of investigators in FOD. In this
regard care should be taken that appropriate „language and culture‟ qualifications have been
adopted for recruitment to regional offices. Supervisory officers should also know the local
language to ensure proper inspection and scrutiny standards. [Para: 6.3.1.10]
7.9.3 The present recruitment procedures are to be streamlined to avoid undue delays in
recruitment and a Committee may look into the matter. In the interim, a provision to be made for
recruitment of field investigators with 30 percent induction through local recruitment and
seventy percent through Staff Selection Commission. [Para: 6.3.1.5]
7.9.4 In the eventuality of hiring contract investigators in FOD and to minimise the loss of
experienced staff and training expenses, the Committee recommends that contract workers with
about two years‟ experience could be given an opportunity to enter regular service through
Limited Departmental Examination. [Para: 6.3.1.9]
7.9.5 For improving the respondent‟s cooperation towards surveys, the Committee recommends
for strengthening measures to sensitize the general public on the importance of data through
publicity. Any large scale survey should be preceded with adequate publicity. [Para: 6.4]
7.9.6 The Committee felt that there were failures to initiate surveys in minor agricultural crops,
horticulture crops, floriculture crops, aromatic and medicinal plants to provide information to
compile basic data required for the National Accounts Statistics (NAS). This has resulted in
adoption of roundabout estimation procedures by the NAD especially in agriculture and allied

68
activities and construction. The Committee recommends that these limitations should be rectified
by initiating special type studies on priority basis. [Para: 6.3.5]
7.9.7 In view of the severe data gaps in the unorgansied sector the Committee reiterates the
recommendation of NSC (2001), that “State Forest Departments should be adequately supported
by the establishment of appropriate statistical units to oversee the collection and compilation of
forestry statistics from diverse sources on forest products.” [Para: 6.3.5.2]
7.10 Dissemination of Informal Sector Statistics
7.10.1 The Committee feels that effective dissemination of official statistics on informal sector
should also be an important function of a desired system of statistics. The Committee
recommends that regular and timely dissemination of informal sector statistics collected by the
public agencies should form part and parcel of the national policy on dissemination of statistics.
[Para: 2.4]

69
Appendix-1
F.No.8(64)/2010-NSC
Government of India
Ministry of Statistics and Programme Implementation
National statistical Commission Secretariat
II Floor, Sardar Patel Bhawan,
Sansad Marg, New Delhi-110001,
The 30th
July 2010
ORDER
Sub: Constitution of Professional Committees by the NSC.
The issue of constituting professional Committees to assist it on various
technical issues was under the consideration of the National Statistical
Commission (NSC) for quite some time. It has now been decided by the NSC to
constitute eight professional Committees. The details of composition and terms of
reference of each Committee are given in the Annexure. The Committee on
Statistics of Agriculture & Allied Sectors will have tenure of twelve months. All
the remaining Committees will have tenure of six months. The Committees shall
accordingly submit their reports to the NSC.
2. With the approval of the Chairman of the NSC, each of the Committees may
also enlist the assistance of subject matter experts within and/or outside the
Government and may co-opt them as members according to necessity.
3. The expenditure of TA /DA of the official members will be borne by their
respective Ministries / Departments / Organizations. Each of the non-official
Members would be entitled for a sitting fee of Rs. 1,000/- per day for attending
meetings. They will be entitled to travel by air in executive class or by rail in air-
conditioned first class while undertaking tours in connection with the meetings of
the respective Committees. They will also be entitled to TA/ DA on tours as
admissible to a Joint Secretary to the Government. Besides, they will also be

70
entitled to transport or transport charges for local travel for attending the meetings
of the respective Committees.
4. Secretariat support to the Committees would be provided by the Central
Statistical Organisation. The expenditure on conducting the meetings of the
Committees and payments/ reimbursements made to the non-official Members
will, under the relevant heads, be debitable to the budget allocated to the NSC
under the non-plan grant of the Ministry of Statistics & Progrmme Implementation
(MOSPI).
5. This issue with the concurrence of IFD vide Dy. No. 514/ B& F dated
29th July 2010.
6. This order comes into effect from 1st August 2010.
Sd/-
(M.V.S. Ranganadham)
Dy. Director General
Telefax: 011-23367128
Mob: 919818878155
E-mail: [email protected]
Committee on unorganised sector statistics
Composition:
1. Prof. R.Radhakrisha, Chairman, NSC
E-Mail: [email protected]
Chairman
2. Prof. Sheila Bhalla, Former JNU Professor,
Institute of Human Development, New Delhi,
E-Mail:[email protected]
Member
3. Prof. Ravi Srivastava, JNU, New Delhi
E-Mail:[email protected]
Member
4. Prof. D. Narashimha Reddy, Former Dean,
University of Hyderabad
E-Mail:[email protected]
Member
5. Dr. Srijit Mishra, IGIDR, Mumbai
E-Mail:[email protected]
Member

71
6. Prof. Alakh N. Sharma, Institute of Human Development,
New Delhi
E-Mail:[email protected]
Member
7. Representative of the Reserve Bank of India (RBI) Member
8. Representative of B&F Division, M/o Finance Member
9. Representative of Indian Statistical Institute Member
10. Addl. DG, CSO(ESD) Member
11. Addl. DG, CSO(NAD) Member
12. DDG, NSSO ( FOD,Hqrs), New Delhi Member
13. DDG, DCSSI Member
14. Director, DES, Govt. of Punjab Member
15. Director, DES, Govt. of Karnataka Member
16. Director, DES, Govt. of Bihar Member
17. Director, DES, Govt. of Gujarat Member
18. Addl. DG, NSSO(SDRD) Member
Secretary
Terms of Reference:
1. To examine the existing definitions of unorganized / informal enterprises
and employment and suggest appropriate modifications with specific
objective of their amenability towards better measurement.
2. To identify major data gaps relating to unorganized enterprises and
unorganized workers.
3. To review existing methodologies and arrangements for estimating
unorganized / informal employment and income arising from unorganized /
informal enterprises and suggest modifications.
4. To examine the existing databases for estimation of income and employment
in unorganized /informal sector and suggest improvements.
5. To analyze the present system of data collection relating to unorganized /
informal sector and suggest modifications needed in the coverage and
content in the existing surveys or new surveys.

72
Constitution of sub-committees
In the first meeting of the NSC Committee on Unorganised Sector Statistics held on 16th
September, 2010 at New Delhi under the chairmanship of Prof. R. Radhakrishna, Chairman,
National Statistical Commission, 4 sub-committees were constituted as follows:
i. Sub-committee 1 comprising Professor(Mrs.) Sheila Bhalla, Prof. A. N. Sharma, Prof.
D.N.Reddy, Dr, N,S. Sastry, Dr, Savita Sharma (facilitator) to look into what could be the
ideal system for forming the desired data base
ii. Sub-committee 2 comprising Prof. Ravi Srivastava, Dr. Rajiv Mehta (facilitator) and Sri
Servesh Kumar to have critical review of Employment and Unemployment Survey and
qualitative dimensions.
iii. Sub-committee 3 comprising Dr. S.L.Shetty of EPW, Dr. Sandeep Sarkar of IHD, Dr.
Srijit Misra, Adviser RBI and Sri Sajeevan (facilitator) to have a critical review of the
existing data bases on unorganised enterprises in totality covering different dimensions
of organisation, multiple sources of income, sustainability, risk management ,access to
credit.factor and product markets,and linkages with organised and unorganised sectors
and suggest improvements.
iv. Sub-committee 4 comprising Professor(Mrs.) Sheila Bhalla , Prof. A. N. Sharma, Prof.
Ravi Srivastava , Sri Servesh Kumar (facilitator), DES representatives, to have an
appraisal of present system of data collection
The committee co-opted Dr.SL Shetty of EPWRF as member of the committee on Unorganised
Sector Statistics.

73
Appendix –2
Resolution concerning statistics of employment in the informal sector,
adopted by the Fifteenth International Conference of Labour Statisticians (January 1993)
[Extract]
Concept
5 (1) The informal sector may be broadly characterized as consisting of units engaged in the
production of goods or services with the primary objective of generating employment and
incomes to the persons concerned. These units typically operate at a low level of organization,
with little or no division between labour and capital as factors of production and on a small scale.
Labour relations - where they exist - are based mostly on casual employment, kinship or personal
and social relations rather than contractual arrangements with formal guarantees.
(2) Production units of the informal sector have the characteristic features of household
enterprises. The fixed and other assets used do not belong to the production units as such but to
their owners. The units as such cannot engage in transactions or enter into contracts with other
units, nor incur liabilities, on their own behalf. The owners have to raise the necessary finance at
their own risk and are personally liable, without limit, for any debts or obligations incurred in the
production process. Expenditure for production is often indistinguishable from household
expenditure. Similarly, capital goods such as buildings or vehicles may be used indistinguishably
for business and household purposes.
Operational definitions
Informal sector
6 (1) For statistical purposes, the informal sector is regarded as a group of production units
which, according to the definitions and classifications provided in the United Nations System of
National Accounts (Rev. 4), form part of the household sector as household enterprises or,
equivalently, unincorporated enterprises owned by households as defined in paragraph 7.
(2) Within the household sector, the informal sector comprises (i) "informal own-account
enterprises" as defined in paragraph 8; and (ii) the additional component consisting of
"enterprises of informal employers" as defined in paragraph 9.
(3) The informal sector is defined irrespective of the kind of workplace where the productive
activities are carried out, the extent of fixed capital assets used, the duration of the operation of
the enterprise (perennial, seasonal or casual), and its operation as a main or secondary activity of
the owner.
Household enterprises

74
7. According to the United Nations System of National Accounts (Rev. 4), household enterprises
(or, equivalently, unincorporated enterprises owned by households) are distinguished from
corporations and quasi-corporations on the basis of the legal organization of the units and the
type of accounts kept for them. Household enterprises are units engaged in the production of
goods or services which are not constituted as separate legal entities independently of the
households or household members that own them, and for which no complete sets of accounts
(including balance sheets of assets and liabilities) are available which would permit a clear
distinction of the production activities of the enterprises from the other activities of their owners
and the identification of any flows of income and capital between the enterprises and the owners.
Household enterprises include unincorporated enterprises owned and operated by individual
household members or by two or more members of the same household as well as
unincorporated partnerships formed by members of different households.
Informal own-account enterprises
8 (1) Informal own-account enterprises are household enterprises (in the sense of paragraph 7)
owned and operated by own-account workers, either alone or in partnership with members of the
same or other households, which may employ contributing family workers and employees on an
occasional basis, but do not employ employees on a continuous basis and which have the
characteristics described in subparagraphs 5 (1) and (2).
(2) For operational purposes, informal own-account enterprises may comprise, depending on
national circumstances, either all own-account enterprises or only those which are not registered
under specific forms of national legislation.
(3) Registration may refer to registration under factories or commercial acts, tax or social
security laws, professional groups' regulatory acts, or similar acts, laws, or regulations
established by national legislative bodies.
Enterprises of informal employers
9 (1) Enterprises of informal employers are household enterprises (in the sense of paragraph 7)
owned and operated by employers, either alone or in partnership with members of the same or
other households, which employ one or more employees on a continuous basis and which have
the characteristics described in subparagraphs 5 (1) and (2).
(2) For operational purposes, enterprises of informal employers may be defined, depending on
national circumstances, in terms of one or more of the following criteria:
(i) size of the unit below a specified level of employment;
(ii) non-registration of the enterprise or its employees.
(3) While the size criterion should preferably refer to the number of employees employed on a
continuous basis, in practice, it may also be specified in terms of the total number of employees
or the number of persons engaged during the reference period.
(4) The upper size limit in the definition of enterprises of informal employers may vary between
countries and branches of economic activity. It may be determined on the basis of minimum size

75
requirements as embodied in relevant national legislations, where they exist, or in terms of
empirically determined norms. The choice of the upper size limit should take account of the
coverage of statistical inquiries of larger units in the corresponding branches of economic
activity, where they exist, in order to avoid an overlap.
(5) In the case of enterprises, which carry out their activities in more than one establishment, the
size criterion should, in principle, refer to each of the establishments separately rather than to the
enterprise as a whole. Accordingly, an enterprise should be considered to satisfy the size
criterion if none of its establishments exceeds the specified upper size limit.
(6) Registration of the enterprise may refer to registration under specific forms of national
legislation as specified in subparagraph 8 (3). Employees may be considered registered if they
are employed on the basis of an employment or apprenticeship contract which commits the
employer to pay relevant taxes and social security contributions on behalf of the employee or
which makes the employment relationship subject to standard labour legislation.
10. For particular analytical purposes, more specific definitions of the informal sector may be
developed at the national level by introducing further criteria on the basis of the data collected.
Such definitions may vary according to the needs of different users of the statistics.
Population employed in the informal sector
11 (1) The population employed in the informal sector comprises all persons who, during a given
reference period, were employed (in the sense of paragraph 9 of resolution I adopted by the
Thirteenth International Conference of Labour Statisticians) in at least one informal sector unit
as defined in paragraphs 8 and 9, irrespective of their status in employment and whether it is
their main or a secondary job.
Treatment of particular cases
14. Household enterprises, which are exclusively engaged in non-market production, i.e. the
production of goods or services for own final consumption or own fixed capital formation as
defined by the United Nations System of National Accounts (Rev. 4), should be excluded from
the scope of the informal sector for the purpose of statistics of employment in the informal
sector. Depending on national circumstances, an exception may be made in respect of
households employing domestic workers as referred to in paragraph 19.
16. For practical reasons, the scope of the informal sector may be limited to household
enterprises engaged in non-agricultural activities. With account being taken of paragraph 14, all
non-agricultural activities should be included in the scope of the informal sector, irrespective of
whether the household enterprises carry them out as main or secondary activities. In particular,
the informal sector should include secondary non-agricultural activities of household enterprises
in the agricultural sector if they fulfil the requirements of paragraphs 8 or 9.
17. Units engaged in professional or technical activities carried out by self-employed persons,
such as doctors, lawyers, accountants, architects or engineers, should be included in the informal
sector if they fulfil the requirements of paragraphs 8 or 9.

76
18 (1) Outworkers are persons who agree to work for a particular enterprise, or to supply a
certain quantity of goods or services to a particular enterprise, by prior arrangement or contract
with that enterprise, but whose place of work is not within any of the establishments, which
make up that enterprise.
(2) In order to facilitate data collection, all outworkers should be potentially included in the
scope of informal sector surveys, irrespective of whether they constitute production units on their
own (self-employed outworkers) or form part of the enterprise, which employs them (employee
outworkers). On the basis of the information collected, self-employed and employee outworkers
should be distinguished from each other by using the criteria recommended in the United Nations
System of National Accounts (Rev. 4). Outworkers should be included in the informal sector, or
in the population employed in the informal sector, if the production units, which they constitute
as self-employed persons or for which they work as employees fulfil the requirements of
paragraphs 8 or 9.
19. Domestic workers are persons exclusively engaged by households to render domestic
services for payment in cash or in kind. Domestic workers should be included in or excluded
from the informal sector depending upon national circumstances and the intended uses of the
statistics. In either case, domestic workers should be identified as a separate sub-category in
order to enhance international comparability of the statistics.

77
Appendix-3
Guidelines concerning a statistical definition of informal employment,
endorsed by the Seventeenth International Conference of Labour Statisticians (November-
December 2003)
The Seventeenth International Conference of Labour Statisticians (ICLS),
Acknowledging that the relevance of informal employment varies among countries, and that a
decision to develop statistics on it is therefore determined by national circumstances and
priorities,
Noting that the term „informal economy‟ is used by the ILO as including the informal sector as
well as informal employment, and that as a supplement to the System of National Accounts 1993
an international conceptual framework for measurement of the non-observed economy already
exists, which distinguishes the informal sector from underground production, illegal production,
and household production for own final use,
Recalling the existing international standards on statistics of employment in the informal sector
contained in the Resolution concerning statistics of employment in the informal sector adopted
by the Fifteenth ICLS (January 1993),
Noting the recommendation made by the Expert Group on Informal Sector Statistics (Delhi
Group), during its Fifth Meeting, that the definition and measurement of employment in the
informal sector need to be complemented with a definition and measurement of informal
employment,
Emphasizing the importance of consistency and coherence in relating the enterprise-based
concept of employment in the informal sector to a broader, job-based concept of informal
employment,
Considering the methodological work, which the International Labour Office and a number of
countries have already undertaken in this area,
Supporting the request, which was made by the International Labour Conference in paragraph
37(n) of the Resolution concerning decent work and the informal economy adopted during its
90th
Session (2002), that the International Labour Office should assist countries in the collection,
analysis and dissemination of statistics on the informal economy,
Recognizing that the considerable diversity of informal employment situations poses limits to the
extent to which statistics on informal employment can be harmonized across countries,

78
Realizing the usefulness of international guidelines in assisting countries in the development of
national definitions of informal employment, and in enhancing the international comparability of
the resulting statistics to the extent possible,
Endorses the following guidelines, which complement the Resolution concerning statistics of
employment in the informal sector of the Fifteenth ICLS, and encourages countries to test the
conceptual framework on which they are based.
1. The concept of informal sector refers to production units as observation units, while the
concept of informal employment refers to jobs as observation units. Employment is defined in
the sense of paragraph 9 of the Resolution concerning statistics of the economically active
population, employment, unemployment and underemployment adopted by the Thirteenth ICLS.
2. Informal sector enterprises and employment in the informal sector are defined according
to the Resolution concerning statistics of employment in the informal sector adopted by the
Fifteenth ICLS. For the purpose of statistics on informal employment, paragraph 19 of the
Resolution concerning statistics of employment in the informal sector adopted by the Fifteenth
ICLS should be applied to exclude households employing paid domestic workers from informal
sector enterprises, and to treat them separately as part of a category named „households‟.
3. (1) Informal employment comprises the total number of informal jobs as defined in
subparagraphs (2) to (5) below, whether carried out in formal sector enterprises, informal sector
enterprises, or households, during a given reference period.
(2) As shown in the attached matrix, informal employment includes the following types of
jobs:
(i) own-account workers employed in their own informal sector enterprises (cell 3);
(ii) employers employed in their own informal sector enterprises (cell 4);
(iii) contributing family workers, irrespective of whether they work in formal or informal
sector enterprises (cells 1 and 5);
(iv) members of informal producers‟ cooperatives (cell 8);
(v) employees holding informal jobs (as defined in subparagraph (5) below) in formal
sector enterprises, informal sector enterprises, or as paid domestic workers employed
by households (cells 2, 6 and 10);
(vi) own-account workers engaged in the production of goods exclusively for own final use
by their household (cell 9), if considered employed according to paragraph 9 (6) of the
Resolution concerning statistics of the economically active population, employment,
unemployment and underemployment adopted by the Thirteenth ICLS.
(3) Own-account workers, employers, members of producers‟ cooperatives, contributing
family workers, and employees are defined in accordance with the latest version of the
International Classification of Status in Employment (ICSE).

79
(4) Producers‟ cooperatives are considered informal, if they are not formally established as
legal entities and also meet the other criteria of informal sector enterprises specified in the
Resolution concerning statistics of employment in the informal sector adopted by the Fifteenth
ICLS.
(5) Employees are considered to have informal jobs if their employment relationship is, in
law or in practice, not subject to national labour legislation, income taxation, social protection or
entitlement to certain employment benefits (advance notice of dismissal, severance pay, paid
annual or sick leave, etc.). The reasons may be the following: non-declaration of the jobs or the
employees; casual jobs or jobs of a limited short duration; jobs with hours of work or wages
below a specified threshold (e.g. for social security contributions); employment by
unincorporated enterprises or by persons in households; jobs where the employee‟s place of
work is outside the premises of the employer‟s enterprise (e.g. outworkers without employment
contract); or jobs, for which labour regulations are not applied, not enforced, or not complied
with for any other reason. The operational criteria for defining informal jobs of employees are to
be determined in accordance with national circumstances and data availability.
(6) For purposes of analysis and policy-making, it may be useful to disaggregate the different
types of informal jobs listed in paragraph 3 (2) above, especially those held by employees. Such
a typology and definitions should be developed as part of further work on classifications by
status in employment at the international and national levels.
4. Where they exist, employees holding formal jobs in informal sector enterprises (cell 7 of
the attached matrix) should be excluded from informal employment.
5. Informal employment outside the informal sector comprises the following types of jobs:
(i) employees holding informal jobs (as defined in paragraph 3 (5) above) in formal
sector enterprises (cell 2) or as paid domestic workers employed by households (cell
10);
(ii) contributing family workers working in formal sector enterprises (cell 1);
(iii) own-account workers engaged in the production of goods exclusively for own final
use by their household (cell 9), if considered employed according to paragraph 9 (6)
of the Resolution concerning statistics of the economically active population,
employment, unemployment and underemployment adopted by the Thirteenth ICLS.
6. Countries, which do not have statistics on employment in the informal sector, or for
which a classification of employment by type of production unit is not relevant, may develop
statistics on informal employment, if desired, in specifying appropriate definitions of informal
jobs of own-account workers, employers and members of producers‟ cooperatives.
Alternatively, they may limit the measurement of informal employment to employee jobs.
7. Countries, which exclude agricultural activities from the scope of their informal sector
statistics, should develop suitable definitions of informal jobs in agriculture, especially with
respect to jobs held by own-account workers, employers and members of producers‟
cooperatives.

80
Conceptual Framework: Informal Employment
Production
units by type
Jobs by status in employment
Own-account
workers
Employers Contrib-
uting
family
workers
Employees Members of
producers‟
cooperatives
Informal Formal Informal Formal Informal Informal Formal Informal Formal
Formal
sector
enterprises
1
2
Informal
sector
enterprises(a)
3
4
5
6
7
8
Households(b)
9
10
(a) As defined by the Fifteenth International Conference of Labour Statisticians (excluding
households employing paid domestic workers).
(b) Households producing goods exclusively for their own final use and households
employing paid domestic workers.
Note: Cells shaded in dark grey refer to jobs, which, by definition, do not exist in the type of
production unit in question. Cells shaded in light grey refer to formal jobs. Un-shaded cells
represent the various types of informal jobs.
Informal employment: Cells 1 to 6 and 8 to 10.
Employment in the informal sector: Cells 3 to 8.
Informal employment outside the informal sector: Cells 1,2, 9 and 10.

81
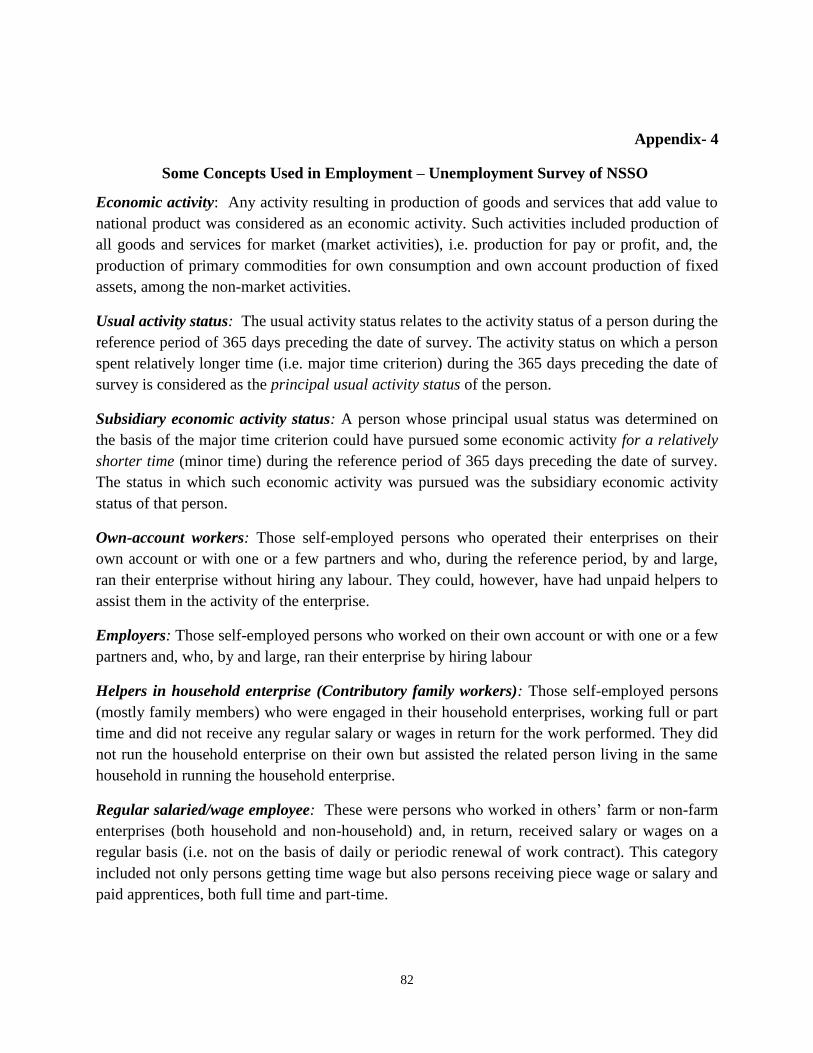
82
Appendix- 4
Some Concepts Used in Employment – Unemployment Survey of NSSO
Economic activity: Any activity resulting in production of goods and services that add value to
national product was considered as an economic activity. Such activities included production of
all goods and services for market (market activities), i.e. production for pay or profit, and, the
production of primary commodities for own consumption and own account production of fixed
assets, among the non-market activities.
Usual activity status: The usual activity status relates to the activity status of a person during the
reference period of 365 days preceding the date of survey. The activity status on which a person
spent relatively longer time (i.e. major time criterion) during the 365 days preceding the date of
survey is considered as the principal usual activity status of the person.
Subsidiary economic activity status: A person whose principal usual status was determined on
the basis of the major time criterion could have pursued some economic activity for a relatively
shorter time (minor time) during the reference period of 365 days preceding the date of survey.
The status in which such economic activity was pursued was the subsidiary economic activity
status of that person.
Own-account workers: Those self-employed persons who operated their enterprises on their
own account or with one or a few partners and who, during the reference period, by and large,
ran their enterprise without hiring any labour. They could, however, have had unpaid helpers to
assist them in the activity of the enterprise.
Employers: Those self-employed persons who worked on their own account or with one or a few
partners and, who, by and large, ran their enterprise by hiring labour
Helpers in household enterprise (Contributory family workers): Those self-employed persons
(mostly family members) who were engaged in their household enterprises, working full or part
time and did not receive any regular salary or wages in return for the work performed. They did
not run the household enterprise on their own but assisted the related person living in the same
household in running the household enterprise.
Regular salaried/wage employee: These were persons who worked in others‟ farm or non-farm
enterprises (both household and non-household) and, in return, received salary or wages on a
regular basis (i.e. not on the basis of daily or periodic renewal of work contract). This category
included not only persons getting time wage but also persons receiving piece wage or salary and
paid apprentices, both full time and part-time.

83
Casual wage labour: A person who was casually engaged in others‟ farm or non-farm
enterprises (both household and non-household) and, in return, received wages according to the
terms of the daily or periodic work contract, was a casual wage labour.
Enterprise type: The type of enterprise in which the household member was working was recorded in terms of codes as given below:
proprietary: male ........................................................ 1
female ...................................................... 2
partnership: with members from same hh. ................. 3
with members from different hh. ............. 4
public sector (govt. enterprises) .................................. 5
semi-public (semi-govt. enterprises) .......................... 6
others ............................................................................... 7
(include co-operative society, public limited
company, private limited company and other
units covered under ASI)
not known ....................................................................... 9
Is there any union/association in your activity?: Union/association meant any
registered/recognised body whose membership was open to a section of those engaged in a
specific activity or trade and whose main objective is to look into the interests of its members.
Nature of employment: The nature of employment (i.e., whether permanent or temporary) was
recorded in terms of code. Nature of employment was considered permanent if the person in
normal course would likely to continue in the same employment.
Whether covered under Provident Fund: It was ascertained from the employees whether they
were covered under any Provident Fund or not.
Whether engaged mostly in full time or part time work during last 365 days: For all those who
are employed either in the principal or subsidiary status, it was be ascertained if the person was
engaged mostly in full time work or part time work during last 365 days.
Whether keeps written accounts: Information on whether the enterprise, in which the person
wasworking, keeps written accounts or not was collected.

84
Appendix- 5
Items of information of NSS 66th
round (2009-10) Schedule 10 that can be used to identify
workers in informal sector and informal employment
srl no. of items items in the schedule and detailed structure of the items
(i) Enterprise Type Proprietory, Male
Proprietory, Female
Partnership with members from same household
Partnership with members from different household
Government/public sector
Public/Private limited company
Co-operative society/trust/other non-profit institutions
Employer‟s households (i.e. private households)
Employing maid servant, watchman, cook, etc.
Others
(ii) Number of workers Less than 6
6 and above but less than 10
10 and above but less than 20
20 and above
Not known
(iii) Whether uses
electricity for production
Yes
No
Not known
(iv) Status of
employment
Self-employed, own account worker
Self-employed, employer
Worked as helper in house hold enterprise (unpaid family worker)
Worked as regular salaried/wage employee
Worked as Casual wage labour in public works
Worked as casual wage labour in other types of work
Did not work but was seeking and/or available for work
Attended educational institution
Attended domestic duties only
Attended domestic duties and was also engaged in free collection
of goods, sewing, tailoring, weaving, etc. for household use
Rentiers, pensioners, remittance recipients, etc.
Not able to work due to disability
Others

85
Appendix-6
Introduction to BSR System
Basic Statistical Returns (BSR) system came into existence in the year 1972 to capture detailed
information regarding Credit, Deposits, Inveastment, etc., of the scheduled commercial banks
which are otherwise not captured for regulatory purpose. The main return under BSR system is
BSR 1 and it captures granular level bank credit data. Each branch/office of bank is required to
submit this return to the Reserve Bank of India as on 31st March of every year. It is divided into
two parts viz. BSR 1A and BSR 1B. Under BSR 1A banks are submitting account wise
information for Large Borrowal Accounts (LBA) whereas under BSR 1B data consolidated at
different level (mainly occupation) for Small Borrowal Accounts (SBA) are submitted.
2. The bank credit data required to be reported in BSR 1 return comprise (i) bank credit
including „dues from banks‟ within the meaning of fortnightly return under Section 42(2) of
the Reserve Bank of India Act, 1934 and (ii) bills rediscounted with the Reserve Bank of India
and other financial institutions. This is referred as Gross Bank Credit.
3. As per the latest revision undertaken since March 2008 round of BSR survey, BSR 1A
endeavors to gather account level information for accounts with credit limit more than 2 lakh.
Various attributes of the credit accounts viz. place of utilization of credit (district and population
group code), type of accounts, organization, occupation, category of borrowal accounts, asset
classification, secured/unsecured, fixed/floating interest rate, interest rate, credit limit and
amount outstanding are captured. In regard to organization classification we follow the following
system, which is close alignment with NIC and NAS classification of occupation and economic
activities.

86
TYPE OF ORGANISATION (BSR code adopted since 2008)
Serial no. Organisation Code
I.
Public Sector
1.1 Central Government departments including departmental
commercial undertakings (Railways, Post & Telegraphs,
Communication, etc.)
1.2 General State Government
1.3 State Government departmental commercial undertakings
(Irrigation, Road & Water Transport, Food & Civil Supplies
etc.)
1.4 Local and Quasi-Government (Local Authorities,
Municipalities, Zila Parishads, Village Panchayat, Universities,
ICMR, ICAR, CSIR, etc.)
1.5 Public Financial Corporations (Non-Departmental Commercial
Undertakings: Financial Enterprises - Public Sector Banks,
RRBs, UTI, NHB, LIC, GIC, Exim Bank, Public Finance
Companies, Public Mutual Funds, etc.)
1.6 Public Non-Financial Corporations (Non-Departmental
Commercial Undertakings: Non-Financial Enterprises - PSUs/
Companies, State Trading Corporations, State Road Transport
Corporation, Electricity Boards, Housing Boards, Warehousing
Corporation, Food Corporation of India, Port Trusts, etc.)
11
12
13
14
15
16
II.
Cooperative Sector
II(a) Financial Cooperative Sector
2.1 Primary Agricultural Cooperative Societies (PACS)
2.2 Farmers Service Societies (FSS) /Large sized Adivasi
Multi-purpose Societies (LAMPS)
2.3 Other Financial Co-operative institutions (Primary & State
Cooperative Agriculture and Rural Development Banks
(PCARDBs / SCARDBs), State Co-operative Banks, District
Central Cooperative Banks (DCCBs), Urban Cooperative
Banks (UCBs), etc.)
21
22
23

87
Serial no. Organisation Code
II(b) Non-Financial Cooperative Sector
2.4 Non-Financial Co-operative Sector (Housing Co-operative
Societies, Salary Earners Societies, Agricultural Co-operative
Societies, Marketing & Trade Co-operative Societies, etc.)
24
III. Private Corporate Sector
3.1 Private Financial Corporations (Private Banks, Foreign Banks
having branches in India, Private Mutual Funds, Private
Insurance Companies, Non-Banking Financial Companies, etc.)
3.2 Private Non-Financial Corporations (Private Companies,
including Public and Private Limited companies, etc.)
[Non-profit institutions (NPIs) serving business, like, FICCI,
ASSOCHEM, CII, etc. and privately funded quasi - corporate
institutions, like, large educational institutions which are funded
privately, for serving specifically the private corporate sector
should also be included here]
31
32
V. Micro Finance Institutions (MFI)
6.1 Self-Help Groups (SHGs)- Direct - Women
6.2 Self-Help Groups (SHGs)- Direct - Others
6.3 Self-Help Groups (SHGs)- Through NGOs - Women
6.4 Self-Help Groups (SHGs)- Through NGOs - Others
6.5 Self-Help Groups (SHGs)- Through MFIs – Women
6.6 Self-Help Groups (SHGs)- Through MFIs - Others
6.7 Other MFIs not engaged in promotion of SHGs
61
62
63
64
65
66
69
Serial No. Organisation
Code
VI.
NPISH
Non-Profit Institutions Serving Households (Non-Government)
(Charitable organisations- Religious Institutions, Health
Institutions, Educational Institutions, Research & Development
Institution; Associations- Professional, Consumer, Employee
Associations, Political Parties, Social/ Cultural/ Recreational Clubs,
etc.)
71

88
Serial no. Organisation Code
VII. Non-Residents
Foreign Governments, Foreign Consulates, Embassies, Trade
Missions, Non-resident companies/ Institutions/ Firms/ Societies/
Individuals
(Foreign Governments for turn-key projects under buyers‟ line of
credit and Foreign banks under agency arrangements)
81
4. Unorgnaised enterprises' accounts are, by and large, identifiable with a subset of Household
Sector (BSR Organisation Codes: 41,42,51,52,53), suitably crossed by Category of Borrowers
( codes introduced 2008 rounds onwards and data are yet to stabilise) and then classified
according to Occupation Classification Codes. [Applicable to BSR 1 A (Cr. Limit more than RS.
2lakh) data].
-------------