report no. 20283-et ethiopia public expenditure...
TRANSCRIPT
Report No. 20283-ET
EthiopiaPublic Expenditure Review(In Two Volumes) Volume 1: Main Report
November 30, 1999
World Bank Country Office in EthiopiaCountry Department 6Africa Region
Document of the World Bank
Pub
lic D
iscl
osur
e A
utho
rized
Pub
lic D
iscl
osur
e A
utho
rized
Pub
lic D
iscl
osur
e A
utho
rized
Pub
lic D
iscl
osur
e A
utho
rized
Pub
lic D
iscl
osur
e A
utho
rized
Pub
lic D
iscl
osur
e A
utho
rized
Pub
lic D
iscl
osur
e A
utho
rized
Pub
lic D
iscl
osur
e A
utho
rized

GOVERNMENT FISCAL YEARJuly 8 - July 7
CURRENCY EQUIVALENTSCurrency Unit: Ethiopian Birr (Br)
Official Rate: US$ 1.00-Br 8.00 (September 7, 1999)
ACRONYMS AND ABBREVIATIONS
AfDB African Development BankARM Annual Review MeetingCAD Central Accounts DepartmentCSC Civil Service CollegeCSR Civil Service ReformDIFD Department for Intemational DevelopmentDSA Decentralization Support ActivityEC European CommissionEFY Ethiopian Fiscal YearEMC Expenditure Management and ControlERA Ethiopian Road AuthorityESDP Education Sector Development ProgramFAGO Federal Auditor General's OfficeFDRE Federal Democratic Republic of EthiopiaFIS Financial Information SystemGDP Gross Domestic ProductGoE Govemment of EthiopiaHIID Harvard Institute for Intemational DevelopmentHIPC Healthy Indebted Poor CountriesHSDP Health Sector Development ProgramIMF Intemational Monetary FundIPF Indicative Planning FiguresMEDaC Ministry of Economic Development and CooperationMEFF Macroeconomic and Fiscal FrameworkMoE Ministry of EducationMoF Ministry of FinanceMoH Ministry of HealthMTEF Medium-Term Expenditure FrameworkPAP Program Action PlanPEP Public Expenditure ProgramPER Public Expenditure ReviewPIM Program Implementation ManualPIP Public Investment ProgramPMO Prime Minister's OfficeRMI Regional Management InstitutesSDP Sector Development ProgramSIDA Swedish Intemational Development AssociationSNNPS Southem Nations, Nationalities and People's StateTA Technical AssistanceUNDP United Nations Development ProgramUSAID United States Agency for Intemational Development
Vice President Callisto E. MadavoCountry Director Oey Astra MeesookSector Manager Peter MiovicTask Team Leader Hart Schafer

PREFACE
The 1999 Public Expenditure Review (PER) for Ethiopia was prepared by a teamfrom the government and a donor team.
The government team was led by H.E. Ato Hailemelekot T/Giorgis, Vice Ministerof Finance, and included Ato Asrat K/Work, Ato Amare Gebrewold, Ato Tesfaye Kassa,Ato Mesfin Asrat, Ato Anemwa Ebay, Ato Fantahun Belew (MoF), Ato Melaku Kifle,Dr. Meshesha Getahun (MEDaC), Ato Tesfamichael Nahusenay (ERA), Dr. DemekeYigletu, Ato Kassahun Habte-Mariam (MoT), Ato Gebre-Medhin Belay (MoA), AtoGirma Asfaw, Ato Teferi Hagos (MoE), Ato Ketemaw Yimam (MoTC), Dr.Gebremaskal Habte-Mariam, and Ato Abebe Gesit (MoH).
The donor team was led by Hart Schafer (World Bank) and included DavidCowen (EMF), Kurt Cornelis (EC), Roland Martin (Netherlands), Stephen Lister (DFIDConsultant), Stephen Olanrewaju (AfDB), Filiberto Sebregondi (EC), and Doug Addison,Nicholas Bennett, Eyerusalem Fasika, and Fred Kilby (World Bank). During the fieldwork, the team liaised closely with Nigel Roberts (World Bank Country OfficeManagers/Ethiopia).
The main field work for the 1999 Ethiopia PER was carried out jointly fromMay 3 through May 18, 1999. The PER teams visited regional authorities in AddisAbaba, Amhara, Oromiya, Harari, and Dire Dawa. This report was prepared under thegeneral guidance of Oey Astra Meesook (Country Director) and Nigel Roberts (WorldBank Resident Representative in Ethiopia). Peter Miovic was the Sector Manager(AFTM2), Vinaya Swaroop (DECRG) the Lead Advisor, and Gene Tidrick (AFTMI) thePeer Reviewer. Special thanks goes to Tanisha McGill for editing and desk-toppublishing support of the final report.
The draft 1999 Ethiopia PER was discussed with the government in workshopsheld in Debre Zeit, Ethiopia (September 13-15, 1999) and Brussels, Belgium (October27-28, 1999).

Contents
PREFACE ...... .............................................................. I
EXECUTIVE SUMMARY .................................................................... I
CHAPTER 1: INTRODUCTION .................................................................... 1
SETTING ..................................................................... 1FOCUS OF THE 1999 PER .................................................................... 1STATUS OF PREVIOUS PER RECOMMENDATIONS .............................. ...................................... 3DATA ISSUES-AN IMPORTANT CAVEAT .................................................................... 5
CHAPTER 2: DEVELOPMENTS IN BUDGETARY AGGREGATES ............................................... 7
FISCAL TRENDS .................................................................... 7RECENT FISCAL PERFORMANCE: BUDGET TARGETS VS. OUTTTURNS ....................................................... 8ECONOMIC AND FUNCTIONAL EXPENDITURE CLASSIFICATION ............................................................. 13REAL AND PER CAPITA EXPENDITURE .................................................................... 16CONSTRAINTS To MOBILIZING EXTERNAL RESOURCES FOR SPS ........................................................... 20IMPACT ON SOCIAL SECTOR EXPENDITURE ..................... ............................................... 20
CHAPTER 3: FISCAL IMPLICATIONS OF THE WAR .................................................................. 25
FUNDING OF INCREASES IN DEFENSE BUDGET .......................... .......................................... 25SECOND ROUND EFFECTS OF THE WAR .................................................................... 26
CHAPTER 4: FISCAL SUSTAINABILITY OF SECTOR PROGRAMS ......................................... 29
BROAD MACROECONOMIC OBJECTIVES .................................................................... 3 1MACROECONOMIC SCENARIOS .................................................................... 31IMPLICATIONS FOR IMPLEMENTATION OF SECTOR PROGRAMS .............................................................. 35CONCLUSIONS .................................................................... 37
CHAPTER 5: CAPACITY BUILDING IN PUBLIC FINANCE MANAGEMENT .......... ............... 39
INTRODUCTION .................................................................... 39ONGOING REFORMS IN PUBLIC FINANCE MANAGEMENT .................................................................... 39FISCAL DECENTRALIZATION .................................................................... 40REFORM OF EXPENDITURE MANAGEMENT .................................................................... 44SECTOR DEVELOPMENT PROGRAMS .................................................................... 50RECOMMENDATIONS ON CROSS-CUTTING ISSUES ...................................... .............................. 56
CHAPTER 6: PER PROCESS .................................................................... 61
ANNEXES AND ANNEX TABLES .................................................................... 65
ANNEX 1: DESCRIPTION OF THE CGE MODEL .................................................................... 67
ANNEX 2: OUTCOME AND RECOMMENDATIONS OF DEBREZEIT WORKSHOP ............... 73
ANNEX 3: GOVERNMENT OF ETHIOPIA COMMENTS ON PER 1999 .............. ....................... 79
ANNEX 4: OUTCOME AND RECOMMENDATIONS OF BRUSSELS WORKSHOP .................. 81

Tables, Figures, and Boxes
Table 1: Fiscal Trends .......................................................... 8Table 2: Budget Execution .......................................................... 9Table 3: Economic Classification of Public Expenditures .............................................. 13Table 4: Functional Classification of General Government Expenditure ........................ 14Table 5: Real Expenditure .......................................................... 17Table 6: Real Per Capita Expenditure ........................................................... 18Table 7: Sectoral Expenditure-Actuals/Projections vs. Targets .................................... 21Table 8: Road Transportation Cost Addis Ababa to Assab and Djibouti ........................ 28Table 9: Macroeconomic Scenarios-Outcomes .......................................................... 33Table 10: SP Expenditures as Share in Total Spending .................................................. 36Table 11: Base Case Scenario - Per Capita Spending in Education, Health, Roads ......... 36
Figure 1: Capital Budget Implementation Rate in Priority Sectors ................................. 10Figure 2: Trends in Defense Expenditure .......................................................... 15Figure 3: Per Capita Spending in Social Sectors for Selected SSA Countries ................. 19Figure 4: Disbursement of Capital Expenditures by Source ........................................... 21Figure 5: Modified Implementation Path for Sector Programs ....................................... 38Figure 6: The Civil Service Reform Program .......................................................... 45Figure 7: Alternative Disbursement Channels for SPs ................................................... 52
Box 1: Economic Cost of Chronic Underspending on the Capital Budget ...................... 11Box 2: The Limited Effectiveness of Supplementary Budgets on Spending Levels ....... 11Box 3: EC Structural Adjustment Support and Stabex ................................................... 23Box 4: Important Deviations in FY99/00 Budget from Base Case ................................. 34Box 5: Budget Management Issues in Previous Studies ................................................. 39Box 6: Fiscal Devolution Below the Regional Level ...................................................... 41
Annex Tables
Annex Table 1: Progress on Previous PER Recommendations ....................................... 84Annex Table 2: Fiscal Trends FY98/87-FY98/99 .......................................................... 87Annex Table 3: Functional Classification of General Government Expenditures ........... 88Annex Table 4: Functional Classification of Recurrent Expenditures ............................. 89Annex Table 5: Functional Classification of Capital Expenditures ................................. 90Annex Table 6: Economic Classification of Public Expenditure .................................... 91Annex Table 7: Developments in Defense Expenditure ................................................. 92Annex Table 8: Real Per Capita Expenditure .......................................................... 93Annex Table 9: Financial Calendar .......................................................... 94

You cannot build a housefor lastyear's summer
(Ethiopian Proverb)
Ethiopia1999 Public Expenditure Review
An Exerciseby the Government ofEthiopia andDonors
EXECUTIVE SUMMARY
Focus of the 1999 PER1. Since May 1998, the war between Ethiopia and Eritrea has been the center ofattention of the Ethiopian government and its donors. In addition to the human toll of thewar, there have been concerns that the sharp rise in defense expenditure could jeopardizethe substantive macroeconomic and structural progress made in recent years.Consequently, one major area of attention of the present report is to review themacroeconomic impact of the war and the financing of the associated defenseexpenditures, and to determine whether defense spending pressures have divertedresources from priority development programs. At the time of writing this report, effortsto reach a peaceful resolution of the war are ongoing. Although the available fiscal datafor the past two years are still incomplete or preliminary, enough is available to allowsome important conclusions to be drawn'. The 1999 Public Expenditure Review (PER)
In the PER discussion workshops in Debre Zeit and Brussels, the Government made available revisedprojections for FY98/99. In comparison to the PER data base, the latest fiscal estimates indicate thatdefense expenditures may reach a share in GDP close to 7%, and 1.2 percentage points higher than the
ii Executive Summary
concentrates on: (a) recent fiscal developments with a specific focus on the fiscal impactof the war; (b) fiscal sustainability of the expenditure program in general and the sectorprograms in education, health, and roads in particular; (c) public finance management;and (d) the PER process itself
Recent Fiscal Developments2. Ethiopia has followed a policy of not permitting the war to interfere with theconsolidation of macroeconomic stability and continuation of structural reforms. Indeed,except for the floor on net foreign assets of the banking system, all quantitative targetsunder the 1998/99 program with the IMF were met. Despite the shortfalls in officialloans and grants official reserves at the end of FY98/99 were slightly higher than oneyear ago (in terms of months of import coverage). The government has appropriatelyprotected core spending in priority sectors, while financing the increased defense budgetthrough extraordinary revenue efforts, including one-time financing measures such asutilization of privatization receipts.
3. But, the fiscal stress posed by the war is reflected in the projected fiscal outcomefor FY98/99, which is a clear outlier to the trend and deviates substantially from thegovernment's intentions and objectives as reflected in the original and revised budgets forthe fiscal year. Unless timely corrective actions are taken, performance over the past twoyears could put the long-term positive trend in jeopardy. While capital spending willremain below budgeted figures, total recurrent expenditure is likely to exceed budgettargets because of the excess in defense outlays. Although real per capita spendingincreases are still projected for education, health, and roads, the chronic underspending inthese sectors (compared to budget targets) appears to be more pronounced in FY98/99than in previous years. This reflects capacity constraints and teething problems with thesector programs in education, health, and roads, as well as lower-than-expected aiddisbursements (overestimation of the availability of funds), rather than deliberate budgetcuts. So, while pre-war gains have been preserved, the past two years expose missedopportunities to accelerate progress toward a more poverty-sensitive expenditurecomposition.
Reasons for Underspending on the Capital Budget4. The puzzling chronic under-execution on the capital budget is a recurring themeof this PER because of concerns with regard to the ambitious sector programs (SPs) ineducation, health, and roads. The issue is reviewed from various angles, includingwhether the binding constraints to disbursement are external resource availability,administrative bottlenecks, limited implementation capacity, or fiscal constraints.
5. Observed delays in the disbursement of external resources for SPs point to start-up problems during FY97/98 and FY98/99 in concluding external assistance agreements.There were also significant delays in achieving effectiveness of aid agreements because
PER estimate. Despite the increase in defense spending (compared to earlier projections) it appearsthat core outlays for education, health, and roads are in line with the PER projections. Therefore, oneof the basic PER conclusions--that the government has so far protected per capita and real spendinglevels in priority areas-remains valid.
Executive Summary iii
the specific financial reporting system-which is required by donors and has been agreedto by the government-was not operational (such as, IDA support to the education andhealth sectors). In addition, there are technical bottlenecks within the government tomove funds to the beneficiary level, for example, the insufficient capacity to handle asubstantive increase in civil works contracts and tenders for procurement of goods.
6. Delays in the release of external resources due to political considerations arecertainly another reason for the slowdown in disbursement of external financing inFY98/99. In a number of cases, donors have adopted a wait-and-see approach infinalizing their support to sector programs because of concerns about the fungibility ofresources and the possibility to indirectly fund the defense budget, combined withhesitation in donor capitals to support countries in conflict. A quick survey of donorsshowed that the most serious impact has been on counterpart funds from balance ofpayment support and on new aid commitments, while disbursements under existingcommitments have only been affected marginally. However, future commitments couldbe seriously affected if peace remains elusive in FY99/00.
Expenditures Related to the War7. The long-term decline in Ethiopia's defense expenditure was reversed in FY97/98with the outbreak of the war with Eritrea. Defense expenditure as a share of GDP is nowapproximately triple its historically low level of the mid-1990s, but still significantlybelow the war-time levels in the 1980s. The PER mission estimated the costs of second-round effects of the war between Birr 1,100 million and Birr 1,600 million annually,comprising immediate assistance to the displaced, replacement of assets, and highertransport costs due to the rerouting of freight from Eritrean ports through Djibouti. Thisis equivalent to 2.5 percent and 3.3 percent of GDP per annum in FY97/98 and FY98/99,respectively. Together with the additional defense spending over and above levels of themid-1990s (about 3.8 percent of GDP in FY98/99), the fiscal burden of the war would beequivalent to between 6 percent and 7 percent of GDP per annum in the two yearsconsidered. In addition, because of donors' concerns about the war, external loans andgrants of some Birr 1,500 million have been delayed in FY98/99.2
Fiscal Sustainability of Sector Programs8. Ethiopia faces the challenge of having to balance the need for tremendousincreases in per capita spending in poverty-sensitive areas with the need to maintainfiscal stability. In the past, fiscal constraints have not been binding, becauseimplementation capacity and external resource flows were the primary factors thatdetermined expenditure levels in priority areas. If a peace agreement is reached, thebinding constraints are likely to change. External resource flows will probably notremain a binding constraint if all aid pledges are turned into formal agreements. Withtime, implementation capacity should also improve and help overcome the teethingproblems of the first few years of SP implementation. If so, the overall fiscalsustainability will become the major determinant for the balance between recurrent andcapital expenditure and between spending on SPs and in non-SP areas.
2 After the completion of the PER draft, the Govemnment shared revised projections for FY98/99 with thePER team. The revised data are reflected in Annex 2.

iv Executive Summary
9. A base case scenario-premised on Ethiopia's ability to reach lasting peace,rebuild investor confidence, and reduce the vulnerability to external shocks-assumessubstantial GDP growth of between 5 percent and 6 percent per annum over the next fiveyears. This outcome will require a gradual reduction in defense expenditures and atimely and realistic acceleration of development expenditures in infrastructure, education,health, and social services. Macroeconomic stability will also be underpinned byachieving overall fiscal objectives, including single digit budget deficits (includinggrants) supported by increased foreign exchange inflows and balance of payment support.Conversely, if the war continues, the government's long-term economic growthobjectives and poverty reduction strategy will be jeopardized. The main risks result fromthe cumulative negative impact that the war would continue to have on governmentfinances, public and private investment, and the external current account. These risks addto the challenges that Ethiopia already faces, including weakening of the terms-of-tradeand recurrence of drought in 1999.
10. The base case provides a fiscal envelope that has to accommodate fundingrequirements for SPs and non-SP activities. The appraisal documents for the three SPslay out ambitious annual expenditure targets, which may be feasible individually, but arenot consistent with a sustainable macroeconomic framework if taken together. Even withsufficient external funding, the government's entire resources would not be sufficient tomeet the domestic financing share under the SPs. By FY01/02, the SPs wouldcompletely exhaust the notional capital expenditure envelope and there would be no roomleft for capital expenditure outside the three SPs. This is clearly not a feasible option.
11. Alternatively, the base case could provide room for healthy growth in non-SPspending and still allow for substantial increases in real per capita spending in education,health, and roads, if the implementation timeframes for the three SPs were modified.Originally, all three SPs were heavily front-loaded with the lion's share of disbursementsexpected in the second and third year of a five-year implementation period. These targetsseem no longer attainable in view of the encountered obstacles to a timely mobilization ofexternal resources. In addition, these assumptions are not consistent with overall fiscalconstraints. It is therefore appropriate to envisage a more pronounced back-loading ofcapital expenditures, with gradually increasing disbursements for the education andhealth SPs-thereby maintaining the five-year implementation period-and the extensionof the implementation period for the roads SP from five to seven years'.
Capacity Building in Public Finance Management12. To some degree, the underspending on the capital budget reflects limitedimplementation capacity which is closely linked to the quality of budget planning and thefinancial relationship between the center and the regions. Public finance management inEthiopia is complex because three important reform exercises are proceeding
3Since the fiscal constellation in September 1999 was off the base case and worse than Scenario 3, whichhad assumed higher defense spending and a continued slow-down in aid disbursements, a 4h Scenariowas computed to gauge the impact of higher defense spending with a resulting higher fiscal deficit(financed by domestic credit expansion). The results for that scenario are presented in the Annex 2, aspart of the outcome of the Debre Zeit PER workshop.

Executive Summary v
simultaneously: fiscal decentralization, civil service reform, and comprehensive sectoralbudgeting and sector development programs. The PER reviews each area of reform withregard to its implications for effective expenditure execution.
Decentralized Budgeting13. In general, budgeting procedures in the regions broadly mirror the federal systemand echo federal financial regulations. Besides exhibiting the considerable strength of adisciplined, well-documented, systematic process, there are also inherent weaknesses inregional budgeting. These weaknesses are reflected by the pervasive separation betweenrecurrent and capital budgets. Budget preparation is often done without the knowledge ofceilings (so-called "blue-sky budgeting"). The one-year budgeting horizon createsinflexibility. There are capacity limits at zonal and especially woreda levels, and timelyreporting on budget implementation is weak. There are also problems with incorporatingaid into the regional planning and budget system. To incorporate donor funds into theirbudgets, regions and zones need to know the amount, the source, and any specialconditions attached to such funds. This information needs to be available well before thefiscal year begins to include it in the budget and allow the timely implementation ofdonor-funded activities. This PER develops the observation that the "offset" system, as itis currently operated, leads local governments to prefer central government fundingrelative to aid-financed projects, because of simpler procedures associated with theutilization of resources.
Reform of Expenditure Management14. In parallel with the decentralization, Ethiopia embarked on a comprehensive CivilService Reform (CSR). The PER focuses in particular on the Expenditure Managementand Control component (EMC) which aims at strengthening financial managementsystems.
* In 1996, the Financial Legal Framework was promulgated. Atpresent, the legislative drafting and approval process for numerousrequired regulations, directives and guidelines is underway. Priorityshould be given to issue the remaining financial directives, inparticular those on budget management, including the budget calendar,procedures of budget control, and procedures for submission ofsupplementary appropriation.
* The 1997 and 1998 PERs recommended the preparation of a three-yearMedium-Term Expenditure Framework (MTEF) to strengthen theweak link between policy formulation, planning, and budgeting. Thegovernment has accepted this recommendation and has launched aprocess that will eventually culminate in an MTEF by expanding thePublic Investment Program (PIP) into a Public Expenditure Program(PEP), which would cover both capital and recurrent expenditures andwould be based on a Macroeconomic and Fiscal Framework (MEFF)that accounts for total revenue and expenditure commitments. Thegovernment also plans to roll out the federal PIP to the regions. The
vi Executive Summary
first round of the PIP (FY98/99-00/01; EFYs 1991-1993) wasconsidered a dry run. The preparation of the second round PIP hasbeen obstructed by uncertainties about the war. Operationalization ofthe PIP/MEFF exercise is extremely important and should be the toppriority for the FY0O/Ol budget exercise. The Ministry of EconomicDevelopment and Cooperation (MEDaC), in conjunction with theMinistry of Finance (MoF), should take the lead: intensivecoordination with the donors will be indispensable.
+ The aim of the budget reform component is to produce annualbudgets of a higher quality on a federal and regional level in a moretimely manner by moving towards activity-center (also called cost-center) budgeting. The two Budget Reform Design Manuals that havealready been completed lay out the revised procedures for capital andrecurrent budgeting at federal and regional levels, and introducechanges in the structure of the budget with regard to classification,expenditure codes, revenue codes, financial calendar, and budgetformats. It is critical that the new principles and guidelines forbudgeting permeate through all government institutions, at a centraland regional level. Specific follow-up is required on theimplementation of the financial calendar, which covers both planningand budgeting cycles, and aims at the adequacy and the timeliness ofthe budgeting exercise. Some difficulties encountered during thepreparation of the budget for FY99/00 were to a large extent due to theabsence of such an authoritative calendar.
+ The components on accounting and audit are the least advancedwithin the EMC program because of a shortage of donor funding anddelays in contracting consultants. It is important that EMC-management accelerates the implementation of these components. Inparticular, the government needs to operationalize the financialreporting system on the use of donor funds under the SPs foreducation and health.
Sector Development Programs15. The preparation of SPs in education and health has materially assisted thedefinition of policies and expenditure programs. However, less attention seems to havebeen paid to the integration of SP implementation with regular government budgetprocedures, and in particular to the programming of donor funds. The PER missionfound large discrepancies between the government's estimates/projections of externalresource flows and donors' planned aid disbursements. This raises a number of issues.Inconsistency between donor and government records is clearly a problem (reflecting theextent to which disbursement is still taking place outside the government budget) becauseincomplete recording of aid flows make budget planning and the calculation of regionaloffsets a matter of chance.
Executive Summary vii
Cross-Cutting Issues16. The three areas of reform-decentralization, strengthening of expendituremanagement and control, and sector development programs-are all making goodprogress. All, however, involve major institutional change which naturally takes years toconsolidate. Moreover, donors have an important role to play in supporting the reformsthat the government is undertaking and in helping to ensure a coordinated approach. ThePER identifies steps to strengthen the government's strategic planning of publicexpenditure and makes recommendations for better management of aid within thegovernment's strategic planning framework.
* Important steps to improve the strategic planning of publicexpenditure have already been taken through the preparation of theSPs and the launching of the MEFF/PIP exercise. It is now importantto move swiftly to a full MTEF/PEP to ensure that medium-termexpenditure plans are consistent with resource availability, and thatbudget holders are able to plan and implement expenditures effectivelyand efficiently. To operationalize the medium-term planning of publicexpenditure, the government now needs to adopt and adhere to theproposed financial calendar. There needs to be broad acceptance of anMTEF or PEP as a new way of budget planning. The MoF andMEDaC need to collaborate systematically in preparing the MEFF andin proposing indicative planning figures. When the PIP is extended tothe regions, sector planners should be required from the outset toprepare consistent medium-term plans for both recurrent and capitalexpenditure, and regional and zonal councils should be required toundertake joint reviews of recurrent and capital budgets for eachsector.
+ The collaboration of aid agencies is essential to achieve more rationalplanning and utilization of public expenditure. Credible projections ofaid flows are an essential input into the MEFF and are needed for threeor four years ahead, not just for the imminent budget year. Anessential foundation for MEDaC is to maintain, with donor assistance,a reliable and comprehensive database of ongoing and expected aidprojects and programs, which can be clearly mapped into the SPs thathave been agreed, as well as into the PIP and successive annualbudgets. In addition, the government and donors need to collaboratein making projections of aid flows available to the regions withsufficient advance notice to take them into account for budgetpreparation (by end-December if the proposed financial calendar is tobe observed). The government should continue to encourage aidagencies to move towards unearmarked Channel 1 support.
* The budget "offset" system continues to be an obstacle to the rationalutilization of aid. The Government has taken steps to address this
viii Executive Summary
issue and has carried out an analysis with the aim to improve thesystem. Without departing from the principle of regional equity, thefollowing improvements could be adopted. The planning bodies'projections of aid flows should be published when ceilings areannounced, so that the offset is transparent. In subsequent years, theseprojections should be compared with actual aid flows, and, if there aresignificant divergences, adjustments should be made. The aim shouldbe to achieve equity in the actual flow of resources to regions (andwithin regions to zones) not just in the expected resource flows.Ceilings for Treasury funds and for aid should be clearly separated,and it should be made clear that if regions are unable to utilizeavailable aid in a given budget year, it will normally remain availablein subsequent years. If implementing agencies can clearly see that aidis additional, and can be drawn down over a practical time frame, theyshould be more ready to invest the additional effort needed to utilizeaid funds.
PER Process and Focus17. The Ethiopia PER is an annual exercise carried out by the government anddonors. The 1999 PER expands on previous PERs by focusing more on a continuousprocess and dialogue on public expenditures than on the production of a final report.With this objective in mind, two follow-up workshops are planned with the governmentand with the donors to explore the implementation of the PER recommendations and tolink the PER process closer with the budget planning cycle. The partnership aspect of thePER process is reflected by the close collaboration on analytical issues and the
4commitment to a more systematic follow-up process.
18. There are implications both for the scope and for the timing of future PERs. Asregards timing, it is proposed to undertake future PERs much earlier in the fiscal year inorder to support the planning phase, rather than the budgeting phase, of the financialcalendar. As regards their scope, future PERs can be important in reconcilinggovernment and donor estimates of aid flows, and could help extend the sector dialogueassociated with the SPs into a broader dialogue on overall public expenditures andenhancing the poverty impact of government and donor assistance. This could supportfurther progress towards provision of aid in the form of unearmarked budget support.While recent PERs have focused mainly on budget inputs, it will be necessary to shift thefocus of the next PER to the effectiveness and efficiency of public spending. This aspectwill become particularly relevant in the context of Ethiopia's envisaged participationunder the HIPC debt initiative.
4Summaries of the main findings and agreements of those two workshops are attached in the Annexes.
CHAPTER 1: INTRODUCTION
SETrING
1. Since May 1998, the war between Ethiopia and Eritrea has been the center ofattention of the Ethiopian government and its donors. In addition to the human toll of thewar, there have been concerns that the sharp rise in defense expenditure could jeopardizethe substantive macroeconomic and structural progress made in recent years. At the timeof writing this report, efforts to reach a peaceful resolution of the war are continuing.Although the fiscal data for the past two years is still incomplete or preliminary, it allowssome important conclusions.
2. Ethiopia has followed a policy of not permitting the war to interfere with theconsolidation of macroeconomic stability and continuation of structural reforms. Indeed,with the exception of the floor on net foreign assets of the banking system, all thequantitative targets under the 1998/99 program with the IMF were met. Despite theshortfalls in official loans and grants official reserves at the end of FY98/99 are expectedto be slightly higher than one year ago (in months of import coverage). The governmenthas appropriately protected core spending in priority sectors, while financing theincreased defense budget through extraordinary revenue efforts, including one-timefinancing measures such as utilization of privatization receipts.
3. Yet the fiscal stress posed by the war is reflected in the projected fiscal outcomefor FY98/99, which is a clear outlier to the trend and deviates substantially from thegovernment's intentions and objectives as reflected in the original and revised budgets forthe fiscal year. Prudent fiscal policies and the timely resolution of the conflict are twocritical elements that will help Ethiopia limit the short and medium-term economicimpact of the war. Conversely, if the war continues, the govemment's long-termeconomic growth objectives and poverty reduction strategy will be placed in jeopardy.The main risks result from the cumulative negative impact that the war would continue tohave on government finances, public and private investment, and the external currentaccount. These risks add to the challenges that Ethiopia faces including weakening of theterms-of-trade and recurrence of drought in 1999.
Focus OF THE 1999 PER
4. The Ethiopia PER is an annual exercise of the government and donors. The jointeffort is reflected by the strong collaboration during the field mission, sharing ofinformation, a common approach to the analyses, and a strong buy-in to the follow-upprocess and sharing of recommendations of the report. For the next PER, it is envisaged
2 Chapter ]
that the government will also share in the drafting of background notes for the PERmission.
5. The PER has become a key analytical tool for allocation of public expenditure inline with the overall resource envelope and the broad range of development priorities. Inline with Ethiopia's partnership approach to external assistance, PERs have becomeincreasingly important in the dialogue between the government and the donorcommunity. Typically Ethiopia's PERs center on the resource framework, budgetsystems, and expenditure patterns. In addition, each PER includes a specific analyticalfocus on key issues or recent developments with a view to developing specificrecommendations for improving the design and implementation of priority sectorexpenditure programs.
6. The 1999 PER-the sixth PER since 19945 -builds upon and expands thepartnership approach started in 1997. The 1999 PER expands on previous PERs in that itis no longer focused so much on the production of a final report, but aims at a morecontinuous process and dialogue on public spending. With this objective in mind, thegovernment shared the Aide Memoire of the main PER mission with the donorcommunity at large in May 1999. The donor community responded well to the AideMemoire and followed up on a number of findings individually, as well as in the contextof the Annual Review Meeting (ARM) of the Sector Programs6 (SP) for education andhealth. Two follow-up workshops are planned with the government and with the donorsto pursue the PER recommendations and to link the PER process closer with the budgetplanning cycle7.
7. The 1999 PER has a more limited scope than originally envisaged. The mainfield work for the PER was originally scheduled for mid-February 1999, with theintention to build upon the outcome of the IMF mission that, among other things, was toassess the government's current macroeconomic stance. As the IMF mission left AddisAbaba early because of security concerns, the PER mission was postponed. During thecontinuation of policy discussions between the IMF and the Ethiopian authorities in April1999, the government presented a revised set of fiscal projections for FY98/99, whichprovided the basis for the analyses during the May 1999 PER mission.
8. The main PER mission focused on the original issues presented in the ConceptPaper (January 15, 1999), except for the fiscal assessment of debt relief under the HiPC
5The previous reviews of Ethiopia's public finances were: Ethiopia: Public Expenditure Policy inTransition, Report No. 12992-ET, October 1994 (1994 PER); Ethiopia: Public Expenditure Review,World Bank "White Cover" Report, May 1995 (1995 PER); Paul Collier (ed.), Ethiopia: Social SectorReview, Center for the Study of African Economies, Oxford University, July 1996 (1996 PER);Ethiopia: Public Expenditure Review, Report No. 16593-ET, November, 1997 (1997 PER); andEthiopia: Public Finances, Report No. 18369-ET, December, 1998 (1998 PER).
6 The term Sector Programs is used to refer to Sector Investment Programs (SIP) as well as SectorDevelopment Programs (SDP).
Outcome and main findings of these two workshops are attached in the Annex.
Introduction 3
Debt Initiative8. The 1999 PER also deviates from the general trend of the "newgeneration" PERs, which focus more on effectiveness and efficiency of public spendingrather than on budget composition and inputs. In view of the war, there is an overridinginterest in the impact of the war on public spending. Consequently, one major area ofattention of the present report is to review the macroeconomic impact of the war and thefinancing of the associated defense expenditures, and to determine whether defensespending pressures have diverted resources from priority development programs. Themajor areas of focus of this report follow:
* Recent Fiscal Developments: Has the trend toward fiscalstabilization continued? How has the war with Eritrea affected fiscalaggregates?
* Fiscal Sustainability: In light of lessons learned from the first twoyears of implementation of SPs in education, health, and roads, whatare the implications for their fiscal sustainability? What are theoptions for modifications in the financing and timing framework of theSPs?
+ Public Finance Management: The PER reviews the progress inimplementing measures to improve budget formulation and execution,and identifies areas for additional measures to enhance theeffectiveness and efficiency of public spending by focusing on therelationship between the center and the regions.
* PER Process: The follow-up process to the PER and a morecontinuous dialogue on public expenditures between the governmentand the donors are central components of the. 1999 PER. The reporthighlights the implications for future PERs.
STATUS OF PREVIOUS PER RECOMMENDATIONS
9. Considerable progress has been made with regard to recommendations made inprevious PERs. A summary of previous PER recommendations and their status ofimplementation is presented in Annex Table 1. The main focus of the 1997 and 1998PERs was-in addition to the review of fiscal trends-on Ethiopia's expendituremanagement system, tax and expenditure assignments in the context of fiscaldecentralization, the sustainability of public expenditure, and revenue mobilization andaid management.
10. With a view to improve public expenditure management within a Medium-Term Expenditure Framework (MTEF)-a core recommendation of the 1997 PER- the
8The compilation of debt data for the HIPC Debt Initiative has been delayed with the IMF ESAF Mid-Term Review.

4 Chapter I
government has embarked on a complex process that will expand the Public InvestmentProgram (PIP) into a Public Expenditure Program (PEP). This will provide a mechanismfor linking the sector programs with the overall macroeconomic framework and capitalwith recurrent expenditures. Several PER recommendations are being implemented inthe context of the Civil Service Reform (CSR) program launched in 1996. Under theExpenditure Management and Control (EMC) component, good progress has been madewith regard to enhancing transparency of the budget process. For instance, two BudgetDesign Manuals have been prepared, the chart of accounts has been updated, and abudget calendar has been designed. In the next phase, these new procedures will need tobe implemented on the ground.
11. The fiscal relations between the center and the regions were addressed in both,the Regionalization Study and previous PERs. Only limited progress has been made oncore recommendations, such as the need to clarify the borrowing powers of regionalinstitutions, illuminate the responsibilities for setting local taxes, and improve the budgetoffset system. A study supported by UNDP focuses on the inter-governmental grantregime, and budget offset is ongoing. The other issues have not been resolved andprobably will need to be addressed in the context of a center-region dialogue.
12. Good progress has been made with regard to the implementation of a number ofrevenue mobilization measures. The Federal Inland Revenue Authority and CustomsOffice were initiated and the computerized customs reporting and recording system(ASYCUDA) was introduced at the main customs station. It is now being madeoperational along with the introduction of taxpayer identification numbers. Penalties andinterest charges are levied on late tax payments, and the tax fraud unit is being expanded.The expansion of cost recovery measures, user charges, and a greater role of the privatesector are under consideration, however, without visible progress to date.
13. The improvement of aid management has taken a major step forward with threeSPs in education, health, and roads. Policy discussions and aid flows are bettercoordinated and options for harmonization of implementation arrangements are beingexplored. However, there is still a long way to go toward providing budget support andadopting one set (preferably the government's) of implementation procedures. Theagreed financial reporting system for the SPs is not yet operational.
14. The fiscal sustainability of the three SPs and the required inter-sectoralexpenditure allocations have been investigated in the two previous PERs. Budgetprovisions for the three SPs have been increasing in recent years; yet these lag behind theambitious targets set out in the appraisal documents. Actual spending has not reachedbudgeted levels. There are clearly costs plus lost credibility-associated with over-optimistic implementation projections. In addition, it is necessary to identify the bindingconstraints to implementation. It has not become clear whether these are deficientimplementation capacity, insufficient external resources, or overall fiscal constraintswithin a sound macroeconomic framework. This aspect will be explored in the currentPER.

Introduction 5
DATA ISSUEs-AN IMORTANT CAVEAT
15. The main mission for the 1999 PER took place in May 1999. At that time,detailed fiscal accounts for FY98/99 were available for seven months of the fiscal year.For the mission's Aide Memoire, the PER teams decided to use the government'sprojections for the fiscal year. In May 1999, the government had projected a fiscal deficit(on a cash basis and including grants) of 2.1 percent of GDP and defense expenditure of4.6 percent of GDP.
16. As the fiscal year progressed and additional fiscal data were made available, itbecame clear that actual performance would probably not meet the government'sprojections. As a result, the IMF's 1999 Article IV consultation staff report (issued inmid-July 1999) projected a fiscal deficit of 4.3 percent of GDP and defense expendituresof 5.8 percent of GDP. From the most recent federal government data for 11 months ofthe fiscal year, it appears that defense expenditures might even reach a level of more than6 percent of GDP. Consequently, the fiscal deficit might be slightly higher than projectedby the LvIF.
17. The quantitative analyses of this report are based on federal budget data for thefirst 11 months of the fiscal year, and projections made by the PER teams. Theprojections for fiscal aggregates are broadly consistent with the data in the IMF's ArticleIV consultation staff report and will be revised in light of the planned discussions withthe government in September.
18. In the PER discussion workshops in Debre Zeit and Brussels, the Governmentmade available revised projections for FY98/99. In comparison to the PER data base, thelatest fiscal estimates indicate that defense expenditures may reach a share in GDP closeto 7 percent, and 1.2 percentage points higher than the PER estimate. Despite theincrease in defense spending (compared to earlier projections) it appears that core outlaysfor education, health, and roads are in line with the PER projections. Therefore, one ofthe basic PER conclusions--that the government has so far protected per capita and realspending levels in priority areas--remains valid.

CHAPTER 2: DEVELOPMENTS IN BUDGETARYAGGREGATES
FISCAL TRENDS
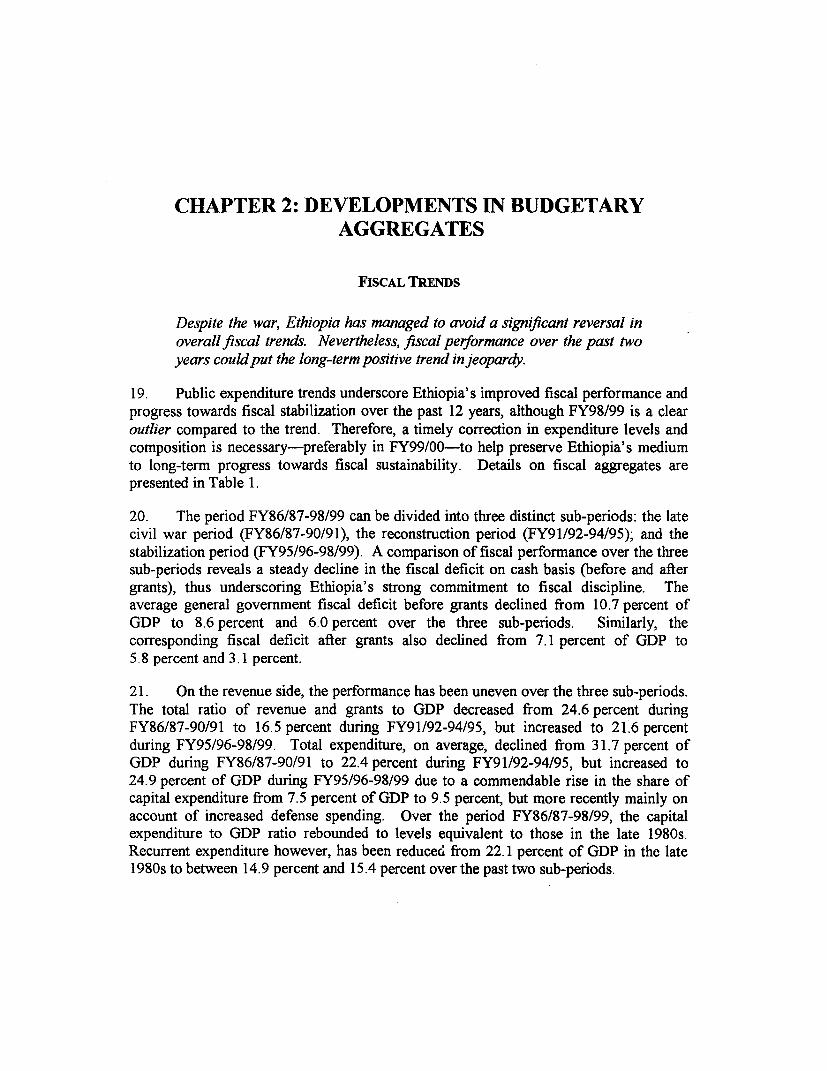
Despite the war, Ethiopia has managed to avoid a significant reversal inoverall fiscal trends. Nevertheless, fiscal performance over the past twoyears could put the long-term positive trend in jeopardy.
19. Public expenditure trends underscore Ethiopia's improved fiscal performance andprogress towards fiscal stabilization over the past 12 years, although FY98/99 is a clearoutlier compared to the trend. Therefore, a timely correction in expenditure levels andcomposition is necessary-preferably in FY99/00-to help preserve Ethiopia's mediumto long-term progress towards fiscal sustainability. Details on fiscal aggregates arepresented in Table 1.
20. The period FY86/87-98/99 can be divided into three distinct sub-periods: the latecivil war period (FY86/87-90/91), the reconstruction period (FY91/92-94/95); and thestabilization period (FY95/96-98/99). A comparison of fiscal performance over the threesub-periods reveals a steady decline in the fiscal deficit on cash basis (before and aftergrants), thus underscoring Ethiopia's strong commitment to fiscal discipline. Theaverage general government fiscal deficit before grants declined from 10.7 percent ofGDP to 8.6 percent and 6.0 percent over the three sub-periods. Similarly, thecorresponding fiscal deficit after grants also declined from 7.1 percent of GDP to5.8 percent and 3.1 percent.
21. On the revenue side, the performance has been uneven over the three sub-periods.The total ratio of revenue and grants to GDP decreased from 24.6 percent duringFY86/87-90/91 to 16.5 percent during FY91/92-94/95, but increased to 21.6 percentduring FY95/96-98/99. Total expenditure, on average, declined from 31.7 percent ofGDP during FY86/87-90/91 to 22.4 percent during FY91/92-94/95, but increased to24.9 percent of GDP during FY95/96-98/99 due to a commendable rise in the share ofcapital expenditure from 7.5 percent of GDP to 9.5 percent, but more recently mainly onaccount of increased defense spending. Over the period FY86/87-98/99, the capitalexpenditure to GDP ratio rebounded to levels equivalent to those in the late 1980s.Recurrent expenditure however, has been reduced from 22.1 percent of GDP in the late1980s to between 14.9 percent and 15.4 percent over the past two sub-periods.
8 Chapter 2
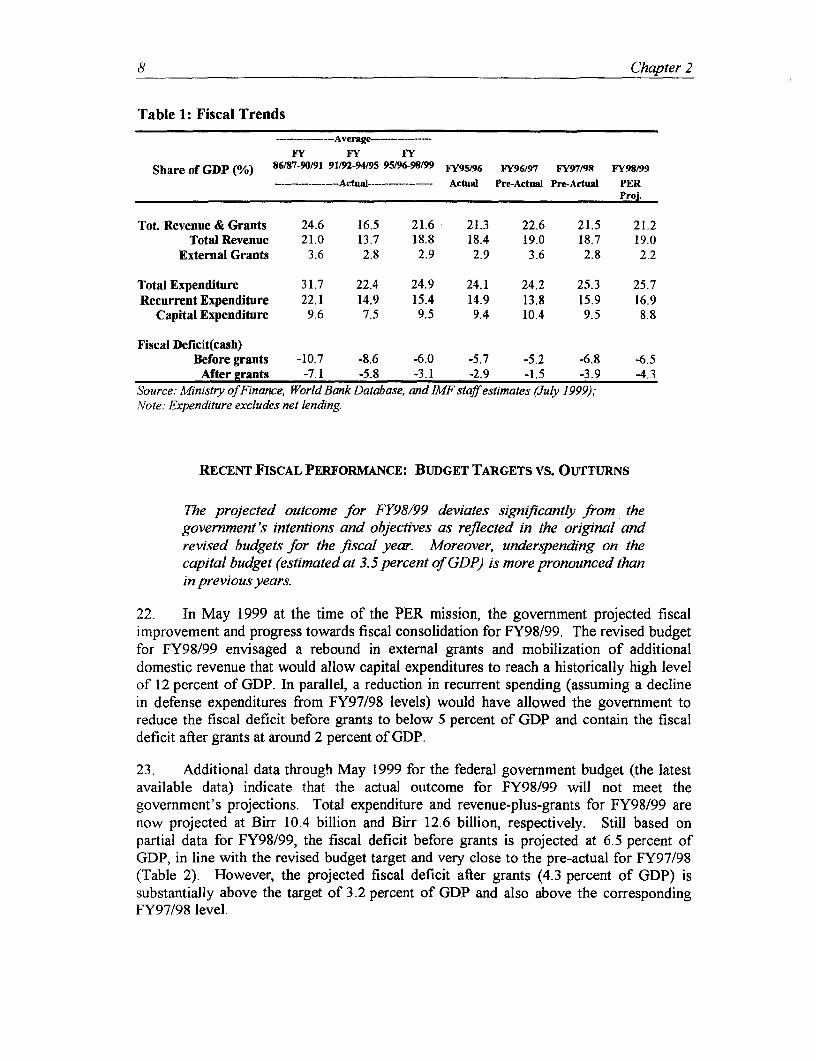
Table 1: Fiscal Trends
------------ Average-FY FY FY
Share of GDP (%) 86/87-90/91 91/92-94/95 95/6-98/99 FY9S/96 FV96/97 FY97/98 Ff98/99-------------- Actual--------------- Actual Pre-Actual Pre-Actual PER
Proj.
Tot. Revenue & Grants 24.6 16.5 21.6 21.3 22.6 21.5 21.2Total Revenue 21.0 13.7 18.8 18.4 19.0 18.7 19.0
External Grants 3.6 2.8 2.9 2.9 3.6 2.8 2.2
Total Expenditure 31.7 22.4 24.9 24.1 24.2 25.3 25.7Recurrent Expenditure 22.1 14.9 15.4 14.9 13.8 15.9 16.9
Capital Expenditure 9.6 7.5 9.5 9.4 10.4 9.5 8.8
Fiscal Deficit(cash)Before grants -10.7 -8.6 -6.0 -5.7 -5.2 -6.8 -6.5
After grants -7.1 -5.8 -3.1 -2.9 -1.5 -3.9 -4.3Source: Ministry of Finance, World Bank Database, and IMF staff estimates (July 1999);Note: Expenditure excludes net lending.
RECENT FISCAL PERFORMANCE: BUDGET TARGETS VS. OUTTURNS
The projected outcome for FY98/99 deviates significantly from thegovernment's intentions and objectives as reflected in the original andrevised budgets for the fiscal year. Moreover, underspending on thecapital budget (estimated at 3.5 percent of GDP) is more pronounced thanin previous years.
22. In May 1999 at the time of the PER mission, the government projected fiscalimprovement and progress towards fiscal consolidation for FY98/99. The revised budgetfor FY98/99 envisaged a rebound in external grants and mobilization of additionaldomestic revenue that would allow capital expenditures to reach a historically high levelof 12 percent of GDP. In parallel, a reduction in recurrent spending (assuming a declinein defense expenditures from FY97/98 levels) would have allowed the government toreduce the fiscal deficit before grants to below 5 percent of GDP and contain the fiscaldeficit after grants at around 2 percent of GDP.
23. Additional data through May 1999 for the federal government budget (the latestavailable data) indicate that the actual outcome for FY98/99 will not meet thegovernment's projections. Total expenditure and revenue-plus-grants for FY98/99 arenow projected at Birr 10.4 billion and Birr 12.6 billion, respectively. Still based onpartial data for FY98/99, the fiscal deficit before grants is projected at 6.5 percent ofGDP, in line with the revised budget target and very close to the pre-actual for FY97/98(Table 2). However, the projected fiscal deficit after grants (4.3 percent of GDP) issubstantially above the target of 3.2 percent of GDP and also above the correspondingFY97/98 level.

Developments In Budgetary Aggregates 9
Table 2: Budget Execution
Fiscal DeficitFY97/98 FY98199
Revised Pre-Actual Revised Pre-ActualBudget Budget
Fiscal Deficit (cash basis)Excluding Grants .- 7.4 -6.8 -6.7 -6.5Including Grants -2.8 -3.9 -3.2 -4.3
Total Revenue and Grants 24.5 21.5 24.0 21.2Total Revenue 19.9 18.7 20.5 19.0
External Grants 4.6 2.8 3.5 2.2
Total Expenditure 27.3 25.3 27.2 25.7Recurrent Expenditure 15.4 15.9 14.9 16.9
Capital Expenditure 11.9 9.5 12.3 8.3Source: Ministry of Finance, World Bank Database, and PER estimates (July 1999).Note: Expenditure excludes net lending.
24. Total revenue and grants are projected at 21.2 percent of GDP (similar inmagnitude to the 21.5 percent in FY97/98) and clearly below the FY96/97 pre-actual.The discrepancies between targets and projected outturns on the revenue side arecomparable to FY97/98, with external grants projected to reach only two-thirds of thebudget target and domestic revenues reaching 93 percent of the budget target. Theshortfall on domestic revenues is mainly attributable to the lower-than-budgeted taxreceipts. A closer examination of the past four fiscal years reveals the offsetting effectsof a continuous and substantive decline in the ratio of external grants to GDP and anincrease in the ratio of domestic revenue (tax revenue plus non-tax revenue) to GDP. Thedecline in external grants has been in the order of between 1 - 1.5 percent of GDPbetween FY96/97 and FY98/99.
25. Total expenditure is projected at 25.7 percent of GDP, thus remaining around thesame level as in FY97/98. Recurrent expenditure is projected to continue to increasefrom 15.9 percent of GDP in FY97/98 to 16.9 percent in FY98/99 while the share ofcapital expenditure is projected to further decline from 9.5 percent of GDP in FY97/98 to8.8 percent of GDP in FY97/98. It is striking, however, that the offsetting effects ofunderspending on the capital budget (equivalent to 3.5 percent of GDP) and overspendingon the recurrent budget (equivalent to 2 percent of GDP) are more pronounced inFY98/99 than in previous years.
26. The large discrepancy between capital expenditure budget targets and outcomes isof particular concern with regard to the ambitious sector programs in education, health,and roads. Disbursement of capital expenditures in the three priority sectors is expectedto reach only two-thirds of the revised target in FY98/99, and will remain even behind theprevious year's performance, thus exacerbating implementation delays (Figure 1).

10 Chapter 2
100
90-/_
80-/:0
Helt Education Reads
60 /0-: -0:;j4-
Percent 50 o_- 0 _I1FY79
Z'- 0 0 000i0i i0 FY98199|30- //j 02 0020- 000
20- /Z_ 0
Health Education Reads
Sectors
Figure 1: Capital Budget Implementation Rate in Priority Sectors
27. In theory, the chronic underspending on the capital budget could be (a) thereflection of chronic over-optimism when setting budget targets and/or (b) the effectof deliberate budget cuts (during the fiscal year) to increase funding for other budgetitems9. The former effect could be the result of either continuous overestimation ofimplementation capacity or recurrent overestimation of available resources. The lattereffect (deliberate budget cuts), because of the war, is a particular concern to donors, whowere alarmed by the rising financing needs for defense during the fiscal year. In anycase, chronic overestimation of budget allocations carries significant economic costswhich are summarized in Box 1.
9It should be noted that 100% implementation of capital budgets is unlikely to ever be achieved.Expenditure discipline means that all projects are prevented from spending more than the budgetedamounts. Inevitably some projects will experience delays. The overall implementation rate willtherefore never reach 100%.
Developments In Budgetary Aggregates 11
Box 1: Economic Cost of Chronic Underspending on the Capital Budget
Regardless of whethert.chronic.'undrspending' onthe capDil budget is the result ofoverly-optimistic' budget allocations:or deliberate budgetc..uts, there are serious long-termcosts to economic growth and poverty objectives,.because of insufficient investment nowfbr growth: in later years. In addition,. there are specific isecondary-but equally far-reaching-costs. As -a minimum, chronic over-optim,ism has costs in: loss of credibilityand a loss of faith in the planni.ng and budgeting proess, As long as underperformanceon the revenue and expenditure sides. of the.budget are of similar magnitude, short-termdistributional effects m,.ay be small, thou h the lon-term costs in frfeited growth are notnegligible. ' If, however, persistent u Ierspending on :the. cpital budget results in theaccumulation of "unplanned"' public savings, thenAthe public sector is taxing the privatesector more than::what.is. needed to sustain matcroeconomic stability (thus, exacerbatingthe dampening effect:on economic growth). Further, there.are distributional losses if anunrealisic(too optimisc) budg't iallcation in one sector (Sector A) implicitly reducesthe funds available to another sector (Sectr B). In.thatfcase, resource availability insteadof::abs,optiv,e capacity becomes the constraining factor fo:r expenditures in :Sector B.Sector B .culd spend .more than w'hat.h has been. allocated, but the 'rigidity of the budgetprocess does.not provide effective.options fobr in-year reallocation of unused funds.
28. The following analysis will show that the underspending on the capital budget ismainly the result of overestimating the availability of funds and implementation capacity,and not the result of deliberate budget cuts. In some cases aid disbursements weredelayed because of administrative bottlenecks; in other cases the aid flows nevermaterialized because of donors' concerns about the war. In addition, the firm budgetingsystem, which does not allow for provisional budget allocations unless aid agreementshave been finalized, hinders budget implementation if critical provisions for social sectorexpenditures are only voted into the budget at mid-year through supplementary budgets,as was the case in FY98/99 (Box 2).
Box 2: The Limited Effectiveness of Supplementary Budgets on Spending Levels
In FY98/99:the government-introduced three :supplementary.budgets, which increased theoriginal budget-allocations.'. Two of ithe sup lementary budgets represented additionalcapital appropriations. for education and health funded from.external. assistance,. the thirdwas additional recurrent expeindit.re fr dedense funde from n on-tax revenue and budgetcontingencies. These supplementary budgets were implemented in:a transparent mannerin accordance with the relevant legal provisions. 1lHowever, :the capital subsidyappropriations to, the regions appear to have come too late in. the fiscal year for them toreasotnably undertake associated -projects and: thus .will probably lead to shortfalls inexpenditure agains,t the revised targets fbr the fiscal year.

12 Chapter 2
29. The analysis on whether under-execution on the capital budget is the result ofchronic over-optimism or deliberate budget cuts, however, is only indicative because ofthe dearth of data on the availability of aid and the lack of quantitative data onimplementation capacity. Nevertheless, the following steps should help shed more lighton the issue:
+ As a first step, the development of expenditure shares and real percapita spending could indicate if there has been a deliberate andmajor reversal in the expenditure composition compared to previousyears. The analysis of year-to-year changes in the shares and in realper capita spending is presented in the following section.
+ Second, a review of external aid flows could provide information onwhether external resource availability was overestimated. This part ofthe analysis will be presented at the end of this chapter.
+ Finally, only qualitative information is available with regard toimplementation capacity constraints or over-rigid procedureswhich unduly delay implementation of development projects; thisanalysis is presented in the chapter on budget management.

Developments In Budgetary Aggregates 13
ECONoMIC AND FUNCTIONAL EXPENDITURE CLASSIFICATION
Notwithstanding an overall shift toward recurrent expenditures, especiallydefense, over the past two fiscal years, the functional expenditureclassification reveals that the spending shares for priority areas have beenby-and-large protected. Over the past three years, the expenditure sharesfor education, health, and roads-for total as well as capital spending-have continued to increase.
30. The sharp rise in defense expenditure has resulted in a substantial shift in theexpenditure composition. The year-to-year changes in expenditure shares are much moreremarkable than the development of nominal and real expenditure aggregates net ofdefense. Because of the defense-related increase in recurrent spending, the share ofcapital expenditures in total spending has dropped significantly. Higher defenseexpenditure is also reflected by the striking increase in the share of wages and salariesand of materials and supplies from a combined 38 percent of total expenditure in the pre-war years to over 50 percent in the past two fiscal years (Table 3).
Table 3: Economic Classification of Public Expenditures
FY FY FYIn Million of Birr 86/87- 91/92- 95/96- FY95/96 FY96/97 FY97/98 FY98/99
90/91 94195 98199----------- Actual------------ Actual Pre-Actual Pre-Actual PER
Proj.
Nominal ExpenditureTotal Expenditure 4,937 6,223 10,828 9,206 10,078 11,405 12,624Recurrent Expenditure 3,461 4,076 6,713 5,644 5,778 7,140 8,291
o/w Wages & Salaries 1,259 1,577 2,548 2,101 2,173 2,653 3,266Materials & Supplies 1,255 950 2,329 1,551 1,608 2857 3,300
Capital Expenditure 1,476 2,147 4,115 3,563 4,300 4265 4,333Share in Total Expenditure
Recurrent Expenditure 70.1 65.5 62.0 61.3 57.3 62.6 65.7o/w Wages & Salaries 25.5 25.3 23.5 22.8 21.6 23.3 25.9Materials & Suppies 25.4 15.3 21.5 16.8 16.0 25.0 26.1
Capital Expenditure 29.9 34.5 38.0 38.7 42.7 37.4 34.3Source: Ministry ofFinance, World Bank Database, and PER projections for FY98/99.Note: Covering general government expenditure and excluding net lending.
31. Nevertheless sectoral expenditure reflects the government's commitment toincrease expenditure shares for social services and economic infrastructure. At present,the three priority areas (education, health, and roads) account for almost one-third of totalspending and half of capital expenditures. The dramatic increase in spending shares forthese three sectors was accompanied by the long-term decline in the expenditure sharesfor economic services (excluding agriculture) and-until recently-defense. Theanalysis of sectoral expenditure shares, covering both federal and regional governmentexpenditures, is summarized in Table 4.
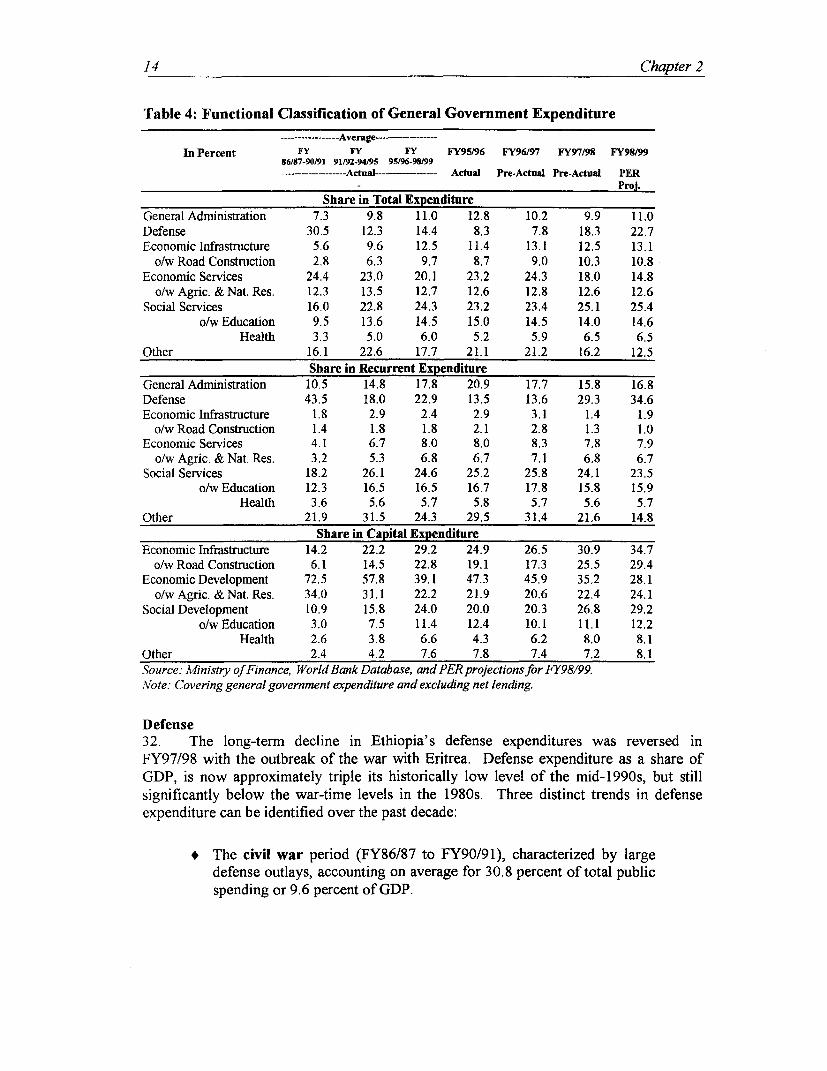
14 Chapter 2
Table 4: Functional Classification of General Government Expenditure
------ Average---------
In Percent FY FY FY FY95/96 FY96197 FY97198 FY98/9986/87-90/91 91s92-94n95 95196-9S199----------------- Actual---------- Actual Pre-Actual Pre-Actual PER
Proj.
Share in Total ExpenditureGeneral Administration 7.3 9.8 11.0 12.8 10.2 9.9 11.0Defense 30.5 12.3 14.4 8.3 7.8 18.3 22.7Economic Infrastructure 5.6 9.6 12.5 11.4 13.1 12.5 13.1
o/w Road Construction 2.8 6.3 9.7 8.7 9.0 10.3 10.8Economic Services 24.4 23.0 20.1 23.2 24.3 18.0 14.8
o/w Agric. & Nat. Res. 12.3 13.5 12.7 12.6 12.8 12.6 12.6Social Services 16.0 22.8 24.3 23.2 23.4 25.1 25.4
o/w Education 9.5 13.6 14.5 15.0 14.5 14.0 14.6Health 3.3 5.0 6.0 5.2 5.9 6.5 6.5
Other 16.1 22.6 17.7 21.1 21.2 16.2 12.5Share in Recurrent Expenditure
General Administration 10.5 14.8 17.8 20.9 17.7 15.8 16.8Defense 43.5 18.0 22.9 13.5 13.6 29.3 34.6Economic Infrastructure 1.8 2.9 2.4 2.9 3.1 1.4 1.9
o/w Road Construction 1.4 1.8 1.8 2.1 2.8 1.3 1.0Economic Services 4.1 6.7 8.0 8.0 8.3 7.8 7.9
o/w Agric. & Nat. Res. 3.2 5.3 6.8 6.7 7.1 6.8 6.7Social Services 18.2 26.1 24.6 25.2 25.8 24.1 23.5
o/w Education 12.3 16.5 16.5 16.7 17.8 15.8 15.9Health 3.6 5.6 5.7 5.8 5.7 5.6 5.7
Other 21.9 31.5 24.3 29.5 31.4 21.6 14.8Share in Capital Expenditure
Economic Infrastructure 14.2 22.2 29.2 24.9 26.5 30.9 34.7o/w Road Construction 6.1 14.5 22.8 19.1 17.3 25.5 29.4
Economic Development 72.5 57.8 39.1 47.3 45.9 35.2 28.1o/wAgric. &Nat.Res. 34.0 31.1 22.2 21.9 20.6 22.4 24.1
Social Development 10.9 15.8 24.0 20.0 20.3 26.8 29.2o/w Education 3.0 7.5 11.4 12.4 10.1 11.1 12.2
Health 2.6 3.8 6.6 4.3 6.2 8.0 8.1Other 2.4 4.2 7.6 7.8 7.4 7.2 8.1Source: Ministry of Finance, World Bank Database, and PER projectionsfor FY98/99.Note: Covering general government expenditure and excluding net lending.
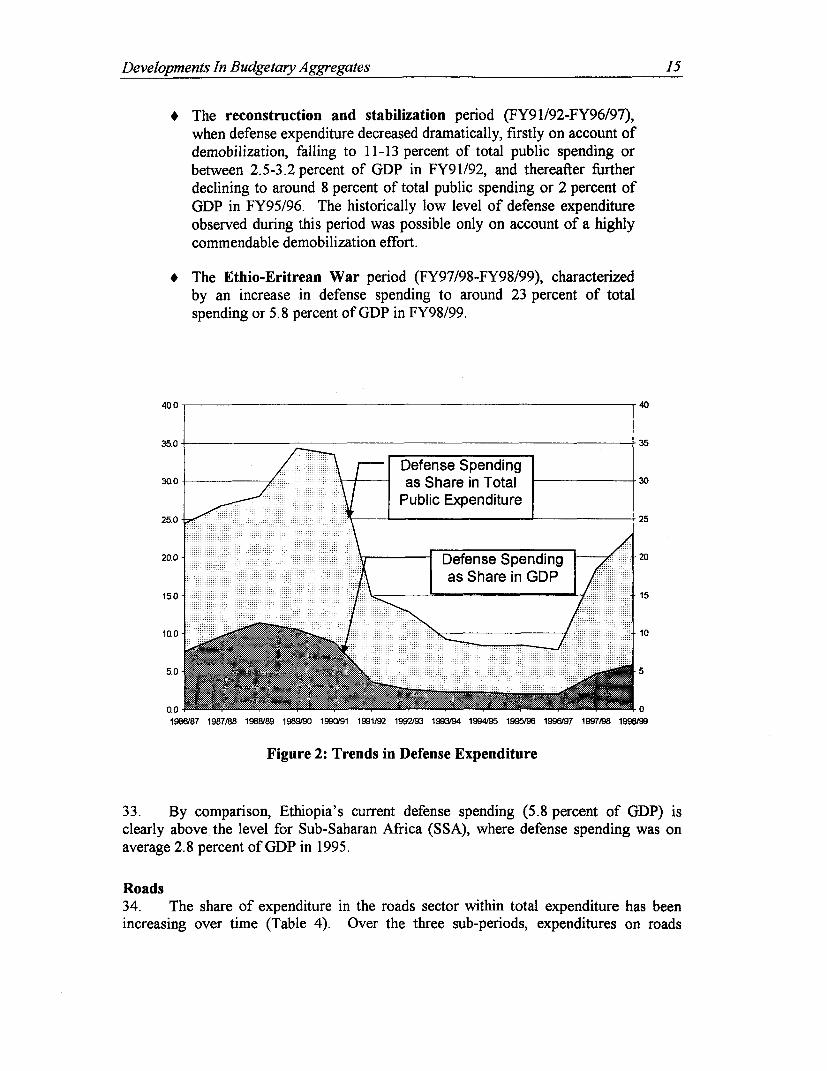
Defense32. The long-term decline in Ethiopia's defense expenditures was reversed inFY97/98 with the outbreak of the war with Eritrea. Defense expenditure as a share ofGDP, is now approximately triple its historically low level of the mid-1990s, but stillsignificantly below the war-time levels in the 1980s. Three distinct trends in defenseexpenditure can be identified over the past decade:
* The civil war period (FY86/87 to FY90/91), characterized by largedefense outlays, accounting on average for 30.8 percent of total publicspending or 9.6 percent of GDP.
Developments In Budgetary Aggregates 15
+ The reconstruction and stabilization period (FY91/92-FY96/97),when defense expenditure decreased dramatically, firstly on account ofdemobilization, falling to 11-13 percent of total public spending orbetween 2.5-3.2 percent of GDP in FY91/92, and thereafter furtherdeclining to around 8 percent of total public spending or 2 percent ofGDP in FY95/96. The historically low level of defense expenditureobserved during this period was possible only on account of a highlycommendable demobilization effort.
* The Ethio-Eritrean War period (FY97/98-FY98/99), characterizedby an increase in defense spending to around 23 percent of totalspending or 5.8 percent of GDP in FY98/99.
40.0 40
35.0 35
~~~~Defense Spending30,0 as Share in Total 30
250- S sL ~~~~Public Expenditure 225.0 25
200 Defense Spending 20
as Share in GDP15.0 15
5 .,' ' 5
0.0 ~~~~~~~~~~~~~~~~~~~~~~~~~~01986187 1987/88 1988/89 1989/90 1990/91 1991/92 1992/93 1993/94 1994195 1995/96 1998/97 1997/98 1998t99
Figure 2: Trends in Defense Expenditure
33. By comparison, Ethiopia's current defense spending (5.8 percent of GDP) isclearly above the level for Sub-Saharan Africa (SSA), where defense spending was onaverage 2.8 percent of GDP in 1995.
Roads34. The share of expenditure in the roads sector within total expenditure has beenincreasing over time (Table 4). Over the three sub-periods, expenditures on roads

16 Chapter 2
increased from 2.8 percent of total expenditure during FY86/87-90/91 to 6.3 percentduring FY91/92-94/95 and 9.7 percent during FY95/96-98199. In recent years, this trendhas continued with the share of roads expenditures rising from 8.7 percent in FY95/96(actual) to 10.4 percent in FY97/98 (pre-actual), and is projected to further increase to10.8 percent in FY98/99. Despite the increasing trend, actual spending continues to fallshort of budget targets, and future budget allocations may need to become more realisticwith regard to implementation capacity.
Education35. Total expenditure on education has followed an upward trend over the pastdecade. On average, sectoral expenditure shares increased from 9.5 percent of totalexpenditure during the civil war period to 13.6 percent during the reconstruction periodand 14.5 percent during the stabilization period. Despite the increasing trend fromFY86/87 to FY98/99, concerns were expressed in the 1998 PER report over the decline inthe share of education expenditure in recent years. Table 4 shows that expenditure oneducation declined from 15.0 percent of total expenditure in FY95/96 to 14.0 percent inFY97/98. The government is addressing this concern and the share of expenditure oneducation is projected to rise to 14.6 percent of total expenditure in FY98/99, with mostof the increase resulting from capital expenditures under the education SP.
Health36. The share of expenditure on health in total expenditure increased, on average,from 3.3 percent of total expenditure during the civil war period to 5.0 percent during thereconstruction period and 6.0 percent during the most recent five-year period. The trendhas also continued in recent years-from 5.3 percent in FY95/96 (actual) to 6.0 percent inboth FY97/98 (pre-actual) and FY98/99 (projection). Again, most of the increase isattributable to the capital budget where expenditures under the health SP are recorded.
REAL AND PER CAP1TA EXPEND1TURE
Real expenditure levels for capital expenditures and for non-defensespending are comparable with pre-war levels. The good news is that pre-war gains have been preserved However the past two years exposemissed opportunities to accelerate progress toward a more poverty-sensitive expenditure composition.
37. As indicated earlier, the recent nominal increases in total expenditures are mainlythe result of the increases in defense spending. Between FY96/97 and FY97/98, overallpublic expenditure increased in nominal terms by about Birr 1.3 billion, which wasbroadly equivalent to the increase in defense spending. In FY98/99, an increase of totalexpenditure by about Birr 1.2 billion is projected, of which the lion's share is again onaccount of the increase in defense expenditure in the fiscal year. Therefore, it is moreappropriate to look at real expenditure levels. Table 5 reveals that real non-defenseexpenditure has remained broadly constant at levels equivalent to pre-war years.

Developments In Budgetary Aggregates 17
FY98/99 real capital expenditure is comparable to FY97/98, yet about 10 percent lowerthan the historically high levels in FY96/97.
Table 5: Real Expenditure
------ Average ----- - -------
I million of Birr FY FY FY FY95/96 FY96197 FY97/98 FY98/9986/87-90191 91192-94/95 95196-98/99--- ----------- Actual------- Actual Pre-Actual Pre-Actual PER
Proj.
NominalTotal Expenditure 4937 6223 10828 9206 10078 11405 12624
o/w Non-Defense 3418 5514 9190 8444 9291 9315 9708Recurrent Expenditure 3461 4076 6713 5643 5778 7140 8291
Capital Expenditure 1476 2147 4115 3563 4300 4265 4333Real (GDP Deflator 1991/92 = 100)
Total Expenditure 6479 5411 7626 6969 7394 7629 8410o/w Non-Defense 4486 4795 6477 6392 6817 6231 6468
Recurrent Expenditure 4539 3543 4727 4272 4239 4776 5524Capital Expenditure 1936 1866 2898 2698 3155 2853 2887
Source: Ministry of Finance, World Bank Database, and PER projections for FY98/99.Nlote: Cavering general government expenditure and excluding net lending.
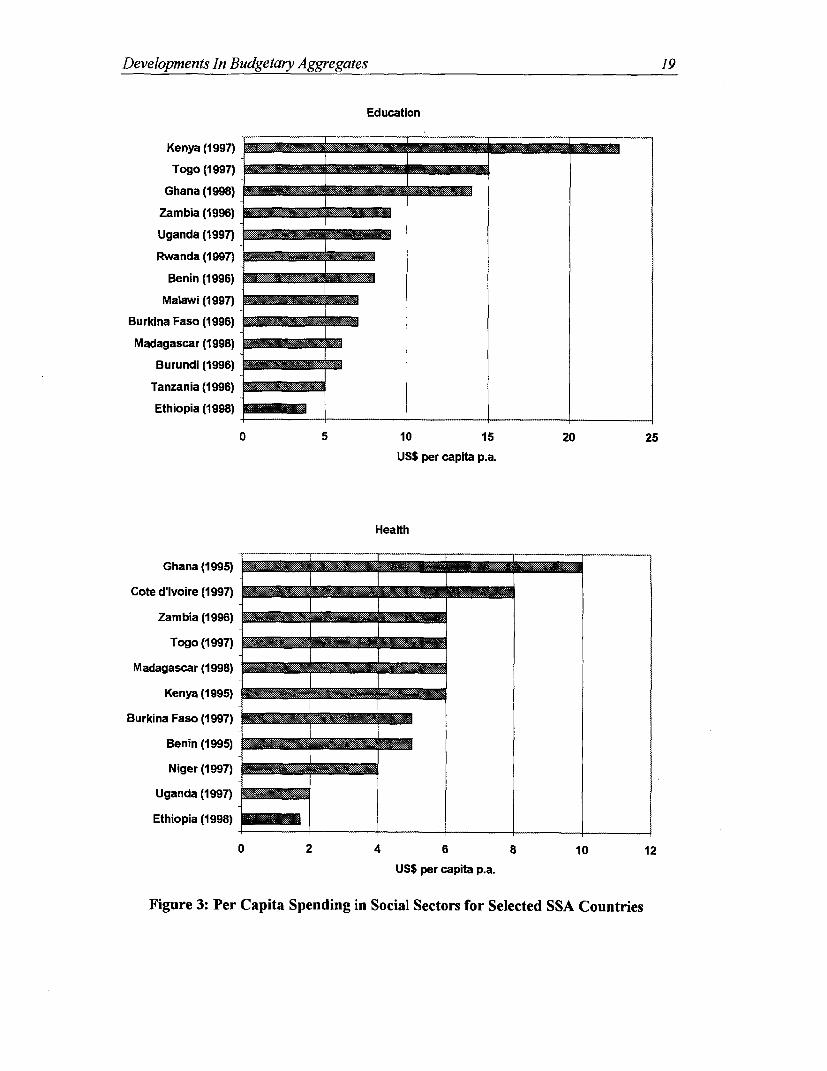
38. Despite the low budget execution rate (63 percent of the capital budget) and theoverall stagnation of real expenditure levels, FY98/99 projections indicate that real percapita spending in education, health, and roads has continued to improve over previousyears. While real per capita capital expenditures have declined from Birr 55 (in 1991/92Birr) to Birr 48 in FY98/99 (Table 6), the sectoral equivalent for the three priority sectorshave more than doubled since the early 1990s and have continued to rise in recentyears-reflecting the government's commitment to safeguard the three sectors from theimpact of war-related expenditure shifts. Nevertheless, there is no reason forcomplacency since Ethiopia's levels of per capita spending are lagging significantlybehind SSA averages (Figure 3). Per capita education and health expenditures in themajority of low-income Sub-Saharan African countries (for instance Kenya, Ghana, orMalawi) are two to three times higher than Ethiopia's current per capita spending onhealth and education of about $1.7 and $3.8, respectively.
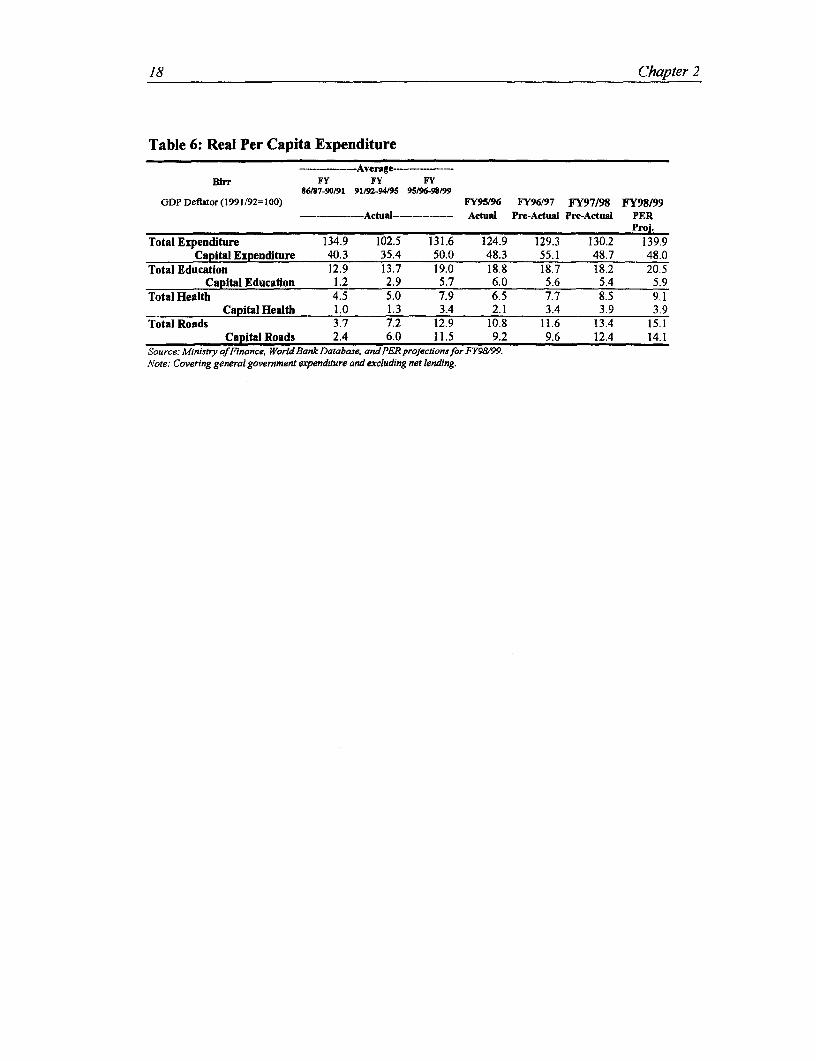
18 Chapter 2
Table 6: Real Per Capita ExpenditureAver*ge--- -
Blrr FY FY FY861/7-90/91 91/92-94/95 95/96-98/99
GDP Deflator (1991/92= 100) FY95/96 FY96t97 FY97/98 FY98/99-------- Actual------- Actual Pre-Actual Pre-Actual PER
Proj.
Total Expenditure 134.9 102.5 131.6 124.9 129.3 130.2 139.9Capital Expenditure 40.3 35.4 50.0 48.3 55.1 48.7 48.0
Total Education 12.9 13.7 19.0 18.8 18.7 18.2 20.5Capital Education 1.2 2.9 5.7 6.0 5.6 5.4 5.9
Total Health 4.5 5.0 7.9 6.5 7.7 8.5 9.1Capital Health 1.0 1.3 3.4 2.1 3.4 3.9 3.9
Total Roads 3.7 7.2 12.9 10.8 11.6 13.4 15.1Capital Roads 2.4 6.0 11.5 9.2 9.6 12.4 14.1
Source: Ministry ofTFInance, World Bank Database, and PER projectionsjfor FY9/&99.Note: Covering general government expenditure and excluding net lending.
Developments In Budgetary Aggregates 19
Education
Kenya (1997)
Togo (1997)
Ghana (1998)
Zambia (1996)
Uganda (1997)
Rwanda (1 997)Benin (1996)
Malawi (1997)
Burkina Faso (1996)
Madagascar (1998)
Burundi (1996)
Tanzania (1996)
Ethiopia (1998)
0 5 10 15 20 25
USS per capita p.a.
Health
Ghana (1995)
Cote d'lvoire (1997)
Zambia (1996)
Togo (1997)
Madagascar (1998)
Kenya (1995)
Burkina Faso (1997)
Benin (1995) _ _ _
Niger (1997)
Uganda (1997)
Ethiopia (1998)
0 2 4 6 8 10 12
US$ per capita p.a.
Figure 3: Per Capita Spending in Social Sectors for Selected SSA Countries

20 Chapter 2
CONSTRAINTS To MOBILIZING EXTERNAL RESOURCES FOR SPS
The analysis of available-but still partial-fiscal data for FY98/99 doesnot support concerns that the government initiated deliberate budget cutsto fund the increased resource requirements for the defense budget. Asubstantial shorlfall is projected for external resources. Estimates ofactual disbursement of external resources are expected to fall short byapproximately Birr 1,300 million, which would account for almost threequarters of the underspending on the capital budget. The reasons for thisshortfall are a combination of (1) the delays in turning aid pledges intoformal agreements due to donor 's concerns about the war; (2) proceduraldelays in taking formal aid agreements to effectiveness; (3) complexfinancial and reporting requirements on donors' side, particularly in thecase of SPs; and (4) technical capacity constraints within the governmentparticularly related to an increased amount of civil works. Theseproblems will need to be resolved within the government/donorpartnership.
IPACT ON SOCIAL SECrOR EXPENDITURE
39. A comparison of disbursement rates between external funds and the government'sown funds-cumulative for the third quarter of the fiscal year-confirms that lowdisbursement of external resources is a major factor for underspending on the capitalbudget. At the time of the May 1999 PER mission, expenditure data for three quarters ofthe fiscal year indicated that the disbursement rate for external resources on the FY98/99capital budget expenditures was significantly lower than the comparable figure forprevious years. Conversely, the disbursement rate for the government's own funds wasabove that for external resources and higher than in FY97/98 (Figure 4). Estimates ofactual disbursement of external resources are expected to fall short by approximately Birr1,300 million, which would account for almost three quarters of the underspending on thecapital budget.
40. The comparison of the planned average funding shares for the three SPs (asagreed between donors and the government during the program appraisal) withactual/projected funding shares is presented in Table 7. In the case of education, it wasplanned that the government would provide on average 73 percent of sectoralexpenditures and external resources would cover 27 percent. The government's share ofthe financing burden is 55 percent for health and between 40 percent and 50 percent forroads. In the past two years, the government's actual/projected financing shares haveexceeded targets across all sectors and external resources have lagged behind. Forexample, in education where external resources were expected to provide some27 percent of funding, only 6 percent and 8 percent of external funding was achieved inFY97/98 and FY98/99, respectively.

Developments In Budgetary Aggregates 21
50
45
,40 *|l
13535
la.
25
FY94/95 FY95/96 FY96197 FY97/98 FY9BW9
Fiscal Year
INDomeic Resoure lExtemal Resource.
Figure 4: Disbursement of Capital Expenditures by Source
Table 7: Sectoral Expenditure-Actuals/Projections vs. Targets
Education Health RoadsFY97F98 FY98/99 FY97/98 FY98/99 FY97/98 FY98/99Pre-Act. PER Proj. Pre-Act. PER Proj. Pre-Act. PER!Proj
Planned Average Funding SharesGoE Resources 73% 73% 55% 55% 50% 40%External Resources 27% 27% 45% 45% 50% 60%
Pre-ActuallProjected Average Funding SharesGoE Resources 94% 88% 82% 68% 670% 58%Extem|al Resources 6% 12% 18% 32% 33% 42%
41. The delays in mobilizing extenal resources for the SPs could be the result ofcapacity bottlenecks, extensive donor procedures, or political considerations associatedwith the war. The PER mission collected information from donors on expected andactual disbursement flows and on the reason for the slowdown in aid disbursements.There is quantitative and qualitative evidence to conclude that delays in closing exteealassistance agreements (converting donor pledges into formal agreements) and taking
22 Chapter 2
those agreements to effectiveness were the most important factors behind underspendingon the capital budget in the past two years. 10
42. Observed delays in the commitment of external resources for SPs point, first, toteething problems in the sense that FY97/98 and FY98/99 were special casesreflecting start-up difficulties in concluding external assistance agreements in support ofthe SPs. IDA support to health and education is an example of external assistance whichwas delayed because pre-requisites for effectiveness were not met before the start ofFY98/99. Two supplementary appropriations in January 1999 were necessary toaccommodate the support in the budget. However, the regions were not informed until acouple of months after such support was approved. Consequently, disbursements underthe two IDA operations lag behind projections.
43. There are, in addition, systemic delays resulting from difficulties in meetingspecific-and sometimes complex-donor procedures and extensive reportingrequirements (to which the government has agreed). For instance, the introduction of anew financial reporting system-agreed with donors in the context of the education andhealth SPs-is still not fully operational, and consequently effectiveness anddisbursements have been delayed. These issues will be addressed in a later section of thePER.
44. There are also technical bottlenecks within the government to moving funds tothe beneficiary level. The government has indicated that in some sectors where SPs werelaunched during the past years, the capacity to handle a substantive increase in civilworks contracts, tenders for procurement of goods etc., has become a constraint toabsorbing external resources.
45. Delays in the approval of external resources due to political considerations arecertainly a reason for the slow-down in external financing. In a number of cases, donorshave adopted a wait-and-see approach to finalizing their support to sector programs,because of concerns about fungibility of resources and the possibility to indirectly fundthe defense budget, combined with a negative public opinion in donor countries onsupporting countries in conflict. The PER mission tried to assess the extent of a "war-related" delay of external aid flows. Although the picture which emerged from the quicksurvey of donors is difficult to quantify, it is obvious that the most serious impact hasbeen on counterpart funds from balance of payment support and on new aidcommitments, while disbursements under existing commitments have been affected onlymarginally. The impact of this will be felt in the coming 1-3 years. The delay indisbursement of EC support (Adjustment Support and STABEX) is a prime example of
10 There are three distinct stages in the possible delay of disbursement of external assistance. The firststage is the conclusion of the assistance agreement between the GoE and the donor. The secondstage is the effectiveness of the agreement, which often requires compliance with donor-specificprocedures and accountability standards, as well as the detailed programming of aid (its allocation tospecific projects in the capital budget). The third stage is at the implementation level where eitherphysical implementation capacity or administrative capacity to ensure timely reimbursement ofexpenditures rnay be the limiting factor.

Developments In Budgetary Aggregates 23
how donors' concerns have affected fiscal aggregates in FY98/99 (Box 3). Moreover,future commitments could be seriously affected, if peace remains elusive in FY99/00.
Box 3: EC Structural Adjustment Support and Stabex
When the war between.. Ethiopia and Eritrea erupted in May 1998, the EuropeanCommission had prepared, in collaboration with the government, .financing proposals onstructural adjustment support and STABEX, to be submitted to the EU Member States forendorsement in July 1998. The second structural adjustment support program (SAS II)comprises a total amount of Euro.75,8 million of which Euro 74,4 million should bedisbursed in two tranches of' Euro 50.million and Euro 24.4 million, in the form ofbalance of payment support. Generated Counterpart Funds were; to be used as budgetarysupport. The remaining. balances and..'interests of STABEX transfers to. Ethiopia during1990-93 accounted for Euro 65 million to which the.same modalities as SAS II would beapplied It was foreseen. that a total amount of counterpart fu,nds of approximately Bir,r1.2 billion (equivalent to 17 percent of recurrent expenditures .and 2.5 percent of' (DP)would become available to the budget in FY98/99. However,-the prevailing concernswithin the European Commission and its Member States about the funibility of funds,but also about the ongoing ESAF negotiations with the IMF_ at that time, delayed thesigning of the grant agreements until December 18., 1998, when a first.tranche of Euro 50million was disbursed. In addition, the release scheme of countierpart. funds from thedouble signature account was modified to provide for a series of small installments:(equivalent to Euro 12.5.million for SAS,II and Euro 15 million for STABEX). Eachinstallment would be conditioned on a positive assessment by the European Commission"on. the evolution of the conflict and its impact on public expenditures, in particularwithin the social sectors." To this end, only one. SAS IT and one STABEX installmhent ofcounterpart funds (equivalent, in total, to Euro 27.5 million) have been released. Theconsequence is that instead of the planned Birr 1.2 billion, Ethiopia has probably receivedonly Birr :213 million during FY98/99.Source. Delegation of the European Commission in Ethiopia

CHAPTER 3: FISCAL IMPLICATIONS OF THE WAR
The PER mission estimated the costs of second-round effects of the warbetween Birr 1,100 million and Birr 1,600 million annually, comprisingimmediate assistance to the displaced, replacement of assets, and highertransport cost due to rerouting road freight from Eritrean ports throughDjibouti. This is equivalent to 2.5 percent and 3.3 percent of GDP perannum in FY97/98 and FY98/99, respectively. Together with theadditional defense spending over and above levels of the mid-1990s (about3.8 percent of GDP in FY98/99), the fiscal burden of the war would beequivalent to between 6 percent and 7 percent of GDP per annum in thetwo years considered. In addition, because of donors' concerns about thewar, external loans and grants of some Birr 1,500 million have beendelayed in FY98/99 (equivalent to approximately 3 percent of GDP).
46. This section of the PER focuses on the fiscal impact of the war beyond theimmediate financing requirements that have led to a sharp increase in the defense budget.First, the funding sources for the increase in defense spending are reviewed, then some ofthe second round effects of the war are assessed.
FuNDING OF INCREASES iN DEFENSE BUDGET
47. During the past two fiscal years, increases to the defense budget have been fundedthrough a combination of expenditure cuts in non-priority sectors, allocation of budgetcontingencies, additional non-tax revenues, such as transfers from extrabudgetary funds,and domestic financing.
48. In FY97/98, the originally budgeted level of military expenditure was Birr 847million compared to a pre-actual outturn of Birr 2,090 million. The difference of Birr1,247 million between budget and pre-actual was covered by higher-than-budgeteddomestic financing of Birr 742 million (of which Birr 664 million was bank financing)and under-execution of the domestically financed portion of the capital budget (in non-priority sectors) by Birr 500 million.
49. In FY98/99, the original defense budget was Birr 983 million (equivalent to2 percent of GDP). At the time of the PER mission in May 1999, the governmentprojected an increase in the defense budget to Birr 2,033 million as a result of theescalation of the conflict with Eritrea to a full-fledged war in early 1999. The authoritieshad identified Birr 1,050 million in extraordinary resources and spending allocationsthrough supplementary budget appropriations to cover the higher than originally

26 Chapter 3
budgeted defense expenditures. The increase in defense spending was expected to becovered by Birr 800 million in additional non-tax revenue identified in a supplementaryappropriation in January 1999 and Birr 250 million (of an original Birr 306 million) inthe allocation of several budget contingencies. Non-tax revenues were as follows: Birr362 million from Public Enterprises Privatization Fund; Birr 300 million released fromadditional dividends collected by the State-owned Enterprise Supervisory Authority; Birr81 million from the Fuel Stabilization Fund; and Birr 57 million from the Sugar AuctionFund.
50. Since the May mission, however, it has become evident that defense expenditureis likely to exceed the revised target of Birr 2,033 million because of continued fighting.Through May 1999, total federal defense spending was Birr 2,871 million. Thecontinued increase appears to have been covered by higher domestic financing andfurther non-defense spending cuts.
51. The use of extrabudgetary funds raises concerns about opportunity costs offunding. Revenue from privatization, as well as from other extrabudgetary funds, wouldhave been used in principle for developmental or revenue stabilization purposes. Theopportunity cost of the resources implies foregone spending on future investments-andpossibly spending in poverty-sensitive areas-with probably higher rates of return.
52. It is also important to highlight an additional caveat that may lead to anunderestimation of actual defense expenditure. A part of the war effort is being fundedby "patriotic contributions." This voluntary and individual support to the country's wareffort is not included in public accounts and may therefore mask the full magnitude of thewar-related costs. Because of a lack of sufficient data, it is not possible to quantify thiseffect.
SECOND ROUND EFFECTS OF THE WAR
Slow-down in Domestic Investment53. The war has had a dampening effect on economic activity, owing to the decline ininvestor confidence and possibly some crowding out of private sector credit. The pick upin the overall level of economic activity appears to have been less than originally targetedin FY98/99. At best, real GDP expanded by 6-7 percent (compared with an originaltarget of 8-9.5 percent), owing largely to a recovery in agricultural output from drought-affected production in the previous year. Nonagricultural output, which covers mainlythe formal sectors, grew at a considerably lower rate because of a loss in investor andconsumer confidence associated with the protracted war. Evidence of an economicslowdown in this area can be found in the lack of growth in non-aid imports and declinein tourist arrivals. Furthermore, the change in money demand was subdued in FY98/99.Broad money is estimated to have grown by 6 percent, around one-half or the originallytargeted rate of growth. Moreover, the financial health of several commercial banks wasimpaired by the seizure of imports and exports at Eritrean ports, which adversely affectedsome local borrowers.

Fiscal Implications Of The War 27
54. Private sector credit growth was also slowed, from around 15 percent in FY97/98to 10 percent in FY98/99, possibly reflecting the higher than planned recourse todomestic bank financing by the government. At the time of the PER mission, thegovernment was still seeking to finance larger than originally budgeted militaryexpenditure through supplementary appropriations (namely additional transfers fromextrabudgetary funds) and budget contingencies. The use of extraordinary resources ornon-priority expenditure cuts to cover additional defense spending was in line withunderstandings reached with the IMF in the context of the second annual ESAFarrangement. The principal aim was to avoid recourse to domestic bank financing andpotential crowding out of credit to the private sector. Data that have become availablesince the PER mission indicate that the govemment had a fairly large domestic bankfinancing requirement in FY98/99, equivalent to around 2.2 percent of GDP. In light ofconsiderably higher defense spending than envisaged at the time of the PER mission, itappears that at least some additional military expenditure was covered through recourseto domestic financing in FY98/99.
Assistance to the Displaced and Returnees55. About 315,000 people are displaced and there are 15,000 returnees from Eritrea.In May 1999, an additional 268,000 people were at risk of being displaced by thecontinued fighting. The annual cost of assistance to the displaced is estimated betweenBirr 550-950 million (US$60-120 million), depending on the severity and duration of thewar". In any case, the displaced will require the replacement of lost assets (such as oxen,ploughs, implements). Such requirements are estimated at between Birr 400 million andBirr 550 million, based on Birr 5000 to 7000 per family. When the displaced will be ableto return to their villages, additional funding will be needed for the repair and rebuildingof destroyed homes. To this end, donor response to the indicated needs has been positive,including US$3 million from USAID, US$2 million from the UN, and substantialfunding from the EC and bilateral assistance. 12
Re-routing of Road Freight via Djibouti56. The re-routing of freight from the Massawa and Assab Ports'3 in Eritrea to theDjibouti Port has resulted in additional costs of at least Birr 130 million and Birr 180million in FY97/98 and FY98/99, respectively. The incremental expenses on transportare equivalent to 0.3 percent of GDP in FY97/98 and 0.5 percent of GDP in FY98/99.The incremental transport cost could result in higher consumer prices, lower profitmargins, and a lower trade volume.
World Bank Poverty Study - Displaced, Disempowered and Distressed: a Focus on Poverty in Crisis, byP. Middlebrook and F. Conzato (first draft), Addis Ababa, February 1999. Much of the informationreported in this section is drawn from this study, as well as from the United Nations Country TeamRapid Assessment Mission of 7-8 April 1999.
12 Since the population affected by war originates from drought-affected areas (actually 200,000 of the totaldisplaced people were already declared in need of food assistance), the risk exists that estimates donot properly distinguish between war-related assistance and other assistance needs.
3 About USD 100 million is the estimate of goods and merchandise seized in the port of Assab at the startof the conflict.

28 Chapter 3
57. The unit cost of road transportation increased from Birr 20-35 cents/ton/km(variation due to differing rates in peak and low seasons) for Assab/Massava to Birr 40-48 cents/ton/km for Djibouti. Higher unit costs are the result of the higher truckmaintenance costs because of the poorer road conditions along the corridor to Djiboutiand a higher share of one-way freight because of the high lay-over cost in Djibouti. Inother words, transporters prefer to have one empty trip to/from Djibouti rather thanpaying high costs for storage or parking at the Djibouti port (Table 8). Considering thatthe distance between Addis-Assab and Addis-Djibouti is almost the same and that almosttotal substitution has taken place between the two traffic paths, the overall transportation
14cost followed the same trend as unit costs
Table 8: Road Transportation Cost Addis Ababa to Assab and Djibouti
Assab Djibouti_FY96/97 FY97/98 FY98/99
Distance in Km 882 910 910Volume of Dry Cargo in '000 tons (peak season) 361 657 563Volume of Dry Cargo in '000 tons (low season) 309 562 937Unit cost Birr/ton/km (peak season) 0.35 0.42 0.4.Unit cost Birr/ton/km (low season) 0.20 0.37 0.48Total cost of Dry Cargo (in million of Birr) 166 440 587
(NB: 98/99 estimates are based on 3rp Quarter data; distance from Addis to Djibouti is via Galafi)
58. In addition to redirecting roughly 55 percent of total dry cargo transport, Ethiopiahas to redirect road transportation of roughly 1.2 million tons of petrol per year. Underthe assumption that the cost structure and original distribution for petrol is similar to drycargo, the additional cost of re-routing all road transport via Djibouti is estimated at Birr152 million in FY97/98 and Birr 218 million in FY97/98. The rehabilitation of 40 km ofroads into the Djibouti territory has been a further cost factor equivalent to Birr 10million (paid for by the Ethiopian Road Authority).
59. The incremental sea freight and unloading charges are two cost effects that areoffsetting each other. On the cost side, in 1999, a user fee of US$1 per ton wasintroduced at Djibouti Port.15 The increased costs are outweighed by lower charges forunloading/loading of dry cargo in Djibouti because bigger vessels can serve its deep seaport. Sea freight for dry cargo to Djibouti is estimated at US$1,000 on average percontainer which is significantly less than the corresponding estimate of US$1,200 forAssab. The annual net savings effect of these offsetting charges and savings is estimatedbetween US$3 million to US$4 million, equivalent to between Birr 24 million and Birr32 million.
14 Information on traffic, volume and cost of transportation to/from Assab and Djibouti was collected at theEthiopian Road Transport Authority from Monthly Reports and specific studies. Another source ofinformation on the same topic is: USAID, Comnparative Transportation Cost Analysis Study, AddisAbaba, December 1996.
15 A similar fee was in levied at Assab Port; it is a new cost element in Djibouti in 1999.
CHAPTER 4: FISCAL SUSTAINABILITYOF SECTOR PROGRAMS
Ethiopia faces the challenge of having to balance the needfor tremendousincreases in per capita spending in poverty-sensitive areas with the needto maintain fiscal stability. In the past, fiscal constraints have not beenbinding, because implementation capacity and external resource flowswere the primary factors that determined expenditure levels in priorityareas. If a peace agreement is reached, the binding constraints are likelyto change. External resource flows will probably not remain a bindingconstraint if all aidpledges are turned into formal agreements. With time,implementation capacity should also improve and help overcome theteething problems of the first few years of SP implementation. Therefore,the overall fiscal sustainability will become the major determinant for thebalance between recurrent and capital expenditure and between spendingon SPs and in non-SP areas. Over the medium term, fiscal sustainabilitywill hinge on (1) realistic projections of grants, (2) a substantialadditional domestic revenue mobilization effort, and (3) an eventualcompression of defense outlays towards levels observed in the mid-199Os.This framework should help achieve the envisaged improvement in theexecution of the capital budget and higher associated recurrent spending.
60. Over the past two years, the wide gap between external financing requirementsand actual mobilization of aid resources had far-reaching consequences for theimplementation of the SPs. The immediate conclusion is that, at the end of the secondyear of implementation, the three SPs are already significantly behind schedule. It ishighly unlikely that implementation can be accelerated over the next three years to catchup and meet the five-year implementation timetable for the three programs.
+ The health SP is based on the assumption that Birr 2,024 million offoreign loans and grants will be used during the five-year period. Upto now, only Birr 251 million have been disbursed with about Birr 200million projected during FY98/99. The most that could be expected inthe near term would be a doubling of annual donor disbursements inthis sector.
* Similarly, with education, Birr 3,003 million of foreign loan and grantdisbursements have been planned, of which Birr 2,741 million stillremain to be disbursed. Expected FY98/99 disbursements are

30 Chapter 4
projected at Birr 216 million. Even a doubling of annualdisbursements will only result in total disbursements of Birr 2,324million over the five-year period. This would leave a shortfall of Birr417 million, which will thus have to be met from governmentresources or be deferred.
* Concerning roads, there are doubts about the feasibility of thegovernment's own expenditure targets. The first PIP exercise hasbrought into question the feasibility of projected road SP expenditures,which exceed the total of Treasury resources expected to be availablefor all capital investment in all sectors during FY98/99.
61. Out of the three broad categories of constraints that determine the path ofimplementation of the SPs-availability of resources, implementation capacity, overallmacroeconomic/fiscal constraints-the first two have been the binding constraints toimplementation in the past. Over the medium term, teething problems and externalresources could become less binding while macroeconomic prerogatives could becomethe determining constraints to implementation.
* Teething problems are likely to become less of a constraining factor toimplementation as the federal and regional authorities make progresstoward putting in place the administrative infrastructure for the SPs,enhancing implementation capacity in the context of the CSR, andtherefore being able to implement a larger volume of projects andabsorb additional funds.
* Similarly, premised on an end of the war with Eritrea, externalresource mobilization is likely to accelerate if all pledges are turnedinto financing agreements. A quick survey of donors' support to theeducation and health SPs indicates that substantial amounts will beavailable and external funding constraints should not be binding. Foreducation, financing of around Birr 1,100 million has been agreed buthas not been disbursed, while another Birr 1,455 million have beenpledged and could be turned into agreements. Similarly for health,support of approximately Birr 1,000 million has been formally agreedbut not yet disbursed, and another Birr 500 million have been pledgedbut not yet confirmed in formal agreements.
62. With external funding and implementation capacity becoming less of a bindingfactor, fiscal constraints will require that the three SPs fit into the overall macroeconomicframework and still leave room for other expenditures. Looking ahead, the governmentis challenged by the need to balance solid fiscal policy with the need to protect andincrease core outlays in priority sectors. This challenge requires prompt and sustainedactions, starting with the FY99/00 budget. To keep the fiscal deficit within theparameters envisaged, mobilization of resources-foreign and domestic-is a pre-requisite within Ethiopia's broad-based and ambitious development program. In this

Fiscal Sustainability Of Sector Programs 31
context, the government needs to strengthen the major domestic tax effort and maintainclose cooperation with the donor community to secure an adequate flow of concessionalexternal resources. This chapter illustrates some of the critical choices the governmentfaces over the next years to sustain its ambitious expenditure program.
BROAD MACROECONOMIC OBJECTIVES
63. The following broad macroeconomic objectives will provide the framework thatwill help secure sufficient funding for implementation of the three SPs while leavingroom for healthy growth in non-SP expenditures such as agriculture:
* sustained high rate of economic growth per capita;
* low and stable inflation;
* increased revenue performance, especially from domestic taxrevenue; 1 6
* substantial increase in external support through grants andconcessional loans; and
v maintenance of a low, single digit fiscal deficit (after grants) over theshort and medium term.
MACROECONOMIC SCENARIOS
64. The strong outcome outlined here is within the reach of the government, but suchan optimistic scenario is also fragile because of recurrent drought and volatile terms-of-trade. This section provides a comparison between the base case scenario and three lessoptimistic-but plausible-scenarios. The following scenarios are computed using asimple Computable General Equilibrium (CGE) model." The equations of the model arepresented in Annex 1. The three alternative scenarios illustrate the impact of changes andshocks in key assumptions and explanatory variables. The prime objective is to showhow public expenditure would need to be compressed in comparison to the base case andwhat the affect would be on overall growth and consumption.
Base Case65. The base case would allow Ethiopia to meet all debt service obligations and stillprovide room for real growth in non-SP expenditures. An ambitious real growth target of
16 The govermnent is encouraged to explore other revenue options as well. In particular, there may bescope for increased "cost-sharing" through cost-recovery for selected government services.
17 This is a slightly expanded version of the same model used in the 1998 PER.
32 Chapter 4
between 6 percent and 7 percent p.a. is sustained, monetary expansion is low, and thefiscal deficit (after grants) is contained below 5 percent of GDP. Therefore,macroeconomic stability under the base case assumption is underpinned by low inflation,not to exceed 3 percent yearly, and moderate net repayment by the government ondomestic debt, thus allowing a sensible expansion of domestic credit to the private sector.The base case is built upon the following key assumptions:
* Terms-of-Trade: The base case assumes further deterioration inEthiopia's terms of trade by 17 percent in 1998/99 and another7 percent in 1999/00. The terms of trade are assumed to slowlyimprove thereafter.
* Additional Domestic Revenue Mobilization: The base case assumesadditional revenue mobilization equivalent to 1.5 percent of GDPabove the level of FY97/98. This increased revenue effort is ambitioussince it is the net increase resulting from the offsetting effects ofimproved revenue collection efficiency and broadening of the tax baseand expected revenue losses on account of the ongoing tariff reformand privatization program. The government's commitment to agradual reduction in the effective tariff rate and to privatization, willimprove the prospects for strong future growth, though these reformswill also temporarily reduce the revenue base until growthaccelerates18. The assumed annual net gain of 1.5 percent of GDP(sustained over the next five years) yields an average revenue effortequivalent to 20.4 percent of GDP-just above the average of19 percent for Sub-Saharan Africa for 1990-95.
* Grants and Loans: The base case scenario also assumes a sizeableincrease in external grants equivalent to 0.5 percent of GDP above theFY92/93-FY97/98 average of 2.8 percent of GDP, and an increase inexternal loan drawings by another 1 percent of GDP over theFY92/93-FY97/98 average of 3.8 percent of GDP. By FY03/04,grants should reach a level of 3.1 percent of GDP and loan drawingsshould reach 5.5 percent of GDP.
* Defense Expenditure: It is assumed that, with the reaching of asustainable peace agreement, defense expenditure will be reducedfrom over 5 percent of GDP in FY98/99 to below 3 percent of GDP byFY03/04.
66. Under the base case assumption, the average real per capita GDP growth ratewould reach 3.4 percent p.a. between FY99/00 and FY03/04. Details on the outcome of
18 As was illustrated in the 1998 PER, the reformn programs will need to be backed by increased revenuesfrom domestic indirect and direct taxation.

Fiscal Sustainability Of Sector Programs 33
the various scenarios are presented in Table 9. Growth in real per capita consumption bythe private sector, where the private sector is a reference to the general population, wouldaverage 2.5 percent yearly. These parameters would augur well for helping Ethiopiareduce poverty levels in line with International Development Targets.
Table 9: Macroeconomic Scenarios-Outcomes
EFY 1992 1993 1994 1995 1996 1997 93-97FY 98/99 99/0 00/01 01/02 02/03 03/04 00-04
Public Spendhg/GDP (%) a/Base Case 23.7 24.3 25.2 25.8 26.4 26.8 25.7Scenario 1 -Weak Revenue 23.7 23.3 23.9 24.0 24.4 24.9 24.1Scenario 2 - ToT Shock 23.7 24.5 25.6 26.7 27.7 28.5 26.6Scenario3 -Hlgh Defense/Low Aid 23.7 22.8 23.1 23.5 23.8 24.1 23.5
Growth, Real per Capita Spending (%/ ) a/Base Case -0.6 2.8 7.1 6.4 6.7 6.5 5.9Scenario 1 -Weak Revenue -0.6 -1.5 5.6 4.0 5.6 6.0 3.9Scenario 2 - ToT Shock -0.6 3.4 5.4 5.8 5.4 5.1 5.0Scenario3-Eligh Defense/Low Aid -0.6 4.4 4.0 4.5 4.8 4.6 2.6
Growth, Real GDP per Capita (0/.)Base Case 4.4 2.4 2.9 3.4 3.9 4.4 3.4Scenario 1 - Weak Revenue 4.4 2.4 2.7 3.1 3.4 3.8 3.1Scenario 2 - ToT Shock 4.4 2.4 3.0 3.3 3.7 4.0 3.3Scenario3 -High DefenselLow Aid 4.4 2.4 2.3 2.7 3.1 3.3 2.8
Growth, Real Cp per Capita (%/ )Base Case 0.4 -2.1 2.7 3.1 4.1 4.7 2.5Scenario 1 -Weak Revenue 0.4 -1.0 2.8 3.4 3.8 4.2 2.6Scenario 2 - ToT Shock 0.4 -3.1 0.2 0.5 1.4 1.8 0.1Scenario 3 - Hlgh DefenselLow Aid 0.4 -2.7 1.9 2.2 3.1 3.6 1.6
a/ Excludes domestic and extemal interest payments due. Population growth rate is assumed to be 2.5 percent perannmunL
67. The average level of public expenditure, excluding interest due, would be25.7 percent of GDP. The average real per capita growth rate in public expenditurewould be 5.9 percent annually. This would be made possible by a fiscal deficit financing(excl. grants) that increases from 2.8 percent of GDP in FY99/00 to 5.0 percent of GDPin FY03/04 and a trade deficit that increases from 8.2 percent of GDP to 9.5 percent ofGDP over the same period. To this end, the FY99/00 general government budget doesnot meet the assumptions of the base case and shows undesirable deviations from theFY98/99 budget. The major deviations (Box 4) will be addressed during the Septembermission to Addis Ababa19 .
19 Subsequent to the Debre Zeit workshop a 4 h scenario was computed, assuming a more pronounceddeviation for the base case on account of high defense spending. This scenario is presented in Annex2.
34 Chapter 4
Box 4: Important Deviations in FY99/00 Budget from Base Case
The base i case is : built on optimistic prospects for resource mobilization and theconcurrent expenditure increases ln prioritywsectors. To this end, the FY99/00 budget isneither consistentwvithAthe envisaged improvement in tax revenuesA nor with the requiredincorease iln Cfederal capital expenditure. Federal $spendig ong social development isconsiderably smaller than planned.) This mayreflect the uncetaitnties regarding;0 thecom mniitment of extemal resources, which-as in previous yearsw ould be appbropriatethrough budgett supplements. However, going by experience,.Jitcould]againwbe that thesupplementary budgetvapproprations come too. late to bet effctively applied, Of greaterconcerni4s the drop in regional transfersomparedAto FY98/99which constrains& amnorer accelerated implemenitation: of the iSP
Scenario 1 - Weak Revenue Efforts68. Scenario 1 assumes that the revenue effort cannot be significantly expanded andthe privatization program does not advance. Consequently, public spending would needto be adjusted downward if deficit financing is ruled out as a credible option. Scenario 1applies the same tax revenue-to-GDP rates that were assumed for FY98/99 to allsubsequent years. Non-tax revenues, however, are reduced to the FY97/98 level and thenheld constant because non-tax collection in FY98/99 was extraordinary due to the defenseeffort. All other scenario assumptions remain unchanged. These assumptions result in arevenue effort that declines from 19.5 percent of GDP in FY99/00 to 18.2 percent ofGDP by FY03/04. Total revenues and grants over the period FY99/00-03/04 wouldaverage only 18.7 percent of GDP compared to 20.4 percent of GDP under the base casescenario. This is equivalent to a loss of 1.7 percent of GDP in revenue.
69. The loss in revenue is compensated by a reduction in expenditure to maintain thesame fiscal deficit and domestic financing requirements of the base case scenario. Totalspending, excluding interest, is constrained to 24.1 percent of GDP, compared to the25-7 percent of GDP in the base case scenario. This adjustment in public spending ismainly affecting capital expenditure, thus slowing real growth and providing fewerresources for future spending. The average real per capita GDP growth rate betweenFY99/00 and FY03/04 is therefore 0.3 percent annually lower than under the base casescenario. However, real per capita private consumption grows 0. 1 percent yearly fasterthan Scenario 1, because the lower govemment taxation increases private income andconsumption.
Scenario 2 - Terms-of-Trade Shock70. Ethiopia is vulnerable to terms-of-trade shocks because of its heavy reliance oncoffee as the main export good. Therefore, this scenario shows how public spendingwould need to be reduced in response to sustained deterioration in the terms of trade.Import prices are assumed to rise by 5 percent yearly for FY99/00-FY02/04 rather thanthe base case forecast of an increase by 1.7 percent yearly. It is also assumed thataggregate export prices will rise by only 1.5 percent yearly rather than the base case

Fiscal Sustainability Of Sector Programs 35
assumption of an increase by 2.3 percent yearly. All other scenario assumptions remainunchanged compared to the base case.
71. The terms of trade decline will force the government to choose betweenpreserving public sector purchasing power and softening the blow to the private sector. Ifthe government acts to preserve public rather than private sector consumption, real percapita consumption would drop initially (by 3.1 percent) and would not recover to currentlevels before FY03/04. Clearly, in reducing poverty, this would be detrimental.
Scenario 3 - Higher Defense Expenditure and Lower Aid Disbursements72. This third scenario illustrates how public spending would need to be compressedin the event that defense expenditures cannot be quickly reduced and current delays andshortfalls in disbursing official grants and loans continue. In this scenario, defensespending falls much more gradually than in the base case scenario, reaching only3.5 percent of GDP by FY03/04 rather than 2.8 percent of GDP.20 The level of externalgrants in FY99/00 is assumed to remain at the current low level of 2.4 percent of GDP(though in the case of continued war, it is likely to drop even further because of donorsconcerns).
73. This scenario produces the lowest growth rate among the three scenarios for realper capita government expenditure and the second lowest rate for real per capita privateconsumption. The former reaches an average annual rate of 2.6 percent compared to5.9 percent in the base case, and the latter averages at 1.6 percent p.a. compared to2.5 percent p.a. under base case assumptions.
TMPLICATIONS FOR IMPLEMENTATION OF SECTOR PROGRAMS
74. The base case scenario provides the overall fiscal envelope within a sustainablemacroeconomic framework. Assuming that start-up problems and external resourceconstraints for the SPs are overcome, the fiscal envelope becomes the binding constraintto implementation of the SPs. Expenditure for the three SPs would compete with capitalexpenditure in other sectors.
75. The appraisal documents for the three SPs lay out ambitious annual expendituretargets. While these targets may each be feasible and realistic they are not consistentwith a sustainable macroeconomic framework if taken together. Even with sufficientexternal funding, the government's own required contribution would exceed the availableresources. In other words, the government would not be able to meet the anticipatedfunding contribution. Table 10 presents the shares of the three SPs in recurrent andcapital expenditures that would be available under the base case scenario. Assuming theplanned five-year implementation period is maintained, the SPs would absorb 58 percentof the FY99/00 capital budget (up from 48 percent in FY98/99). Even within the mostoptimistic expenditure envelope of the base case scenario, by FY01/02, the SPs wouldcompletely exhaust the notional capital expenditure envelope and there would be no room
20 It is assumed that all defense spending is recorded in the recurrent budget.

36 Chapter 4
left for capital expenditure outside the three SPs. This is clearly not a feasible option.The same analyses applied to the other scenarios would result in even more seriouscrowding out of non-SP expenditures by the three SPs.
76. Alternatively, the base case could provide room for healthy growth in non-SPspending if the implementation timeframe for the three SPs is modified. Originally, allthree sector programs were heavily front-loaded with the lion's share of disbursementsexpected in the second and third year of a five-year implementation period. These targetsseem no longer attainable in view of the obstacles to a timely mobilization of externalresources. In addition, these assumptions are not consistent with overall fiscalconstraints. It is therefore appropriate to envisage a more pronounced back-loading ofcapital expenditures, with gradually increasing disbursements for the education andhealth SP-and maintaining the five-year implementation period-and the extension ofthe implementation period for the roads SP from five to seven years. This easing ofdisbursement pressure would also leave sufficient scope for non-SP expenditures, whichotherwise would need to be compressed to non-sustainable levels in order to preservemacroeconomic stability. The modified implementation path for capital expenditureunder the three SPs is illustrated in Figure 5. Stretching out the implementation of theroad SP to seven years provides for manageable increasing SP shares in the recurrent andcapital budgets. The share of SP expenditure in capital expenditure would rise from46 percent in FY99/00 to 56 percent in FY03/04 (Table 10).
Table 10: SP Expenditures as Share in Total SpendingEFY9I EFY92 EFY93 EFF94 EFY9S EFY96 EFY97 93-97
Base Case-SP as Share of... FY97198 FY98199 FY99/00 FY00/01 FY01102 FY02103 FY03104 00-04
Five-Year Implementation TimeframeRecurTent Spending 39 38 39 42 44 45 46 43Capital Spending 43 48 58 79 115 108 106 93
Modified Implementation Timeframe (515/7)Recurrent Spending 39 38 39 42 44 45 46 43Capital Spending 43 48 46 47 51 52 56 50a/ Total spending excludes interest due and defense.
77. The modified implementation path for the three SPs would allow a substantialincrease in the real per capita spending on education, health, and roads (Table 11) thus,bringing Ethiopia's per capita spending figures closer to those of other SSA countries andproviding the basis for improved service delivery and poverty reduction.
Table 11: Base Case Scenario - Per Capita Spending in Education, Health, Roads
Birr FY96197 FY97/98 FY98/99 FY99100 FYOO/O FY01/02 FY02/03 FY03/04Education 18.7 18.2 20.5 22.4 25.9 30.2 33.4 37.1Health 7.7 8.5 9.1 9.3 10.1 11.1 11.3 11.6Roads 11.6 13.4 15.1 17.4 20.4 24 28.4 33.8Note: Base on GDP Deflator 1991/92=100. Source: PER Projections

Fiscal Sustainability Of Sector Programs 37
CONCLUSIONS
78. Each of the four scenarios illustrates the need for the government to makestrategic choices about the sustainability of its expenditure programs. Such choices willbe necessary under almost any conceivable circumstance, even with the most optimisticoutlook for growth in revenues and external support of the base case scenario. Inparticular, it will be necessary for the government to balance an ambitious SPimplementation schedule with non-SP expenditures.
79. The four scenarios presented in this chapter clearly illustrate the importance ofincreased resource mobilization if Ethiopia's ambitious SPs are to proceed in a timelyfashion. External resources for implementation of the three SPs appear sufficient if allaid pledges are turned into formal agreements. Further, the ongoing donor/governmentdialogue may be used as a platform to revisit the implementation path of the SPs with aview to achieve more back-loading of the education and health SP and the expansion ofthe implementation timeframe for the roads SP to seven years, consistent with theprojected fiscal envelope.
80. The key assumptions on revenue and grants both contribute to higher GDP growthand higher public expenditure. If the revenue assumptions do not materialize,government expenditure will have to be reduced by roughly 1.7 percent of GDP betweenFY99/00 and FY03/04. This would be detrimental for the envisaged increase in percapita spending in social sectors and would be counterproductive for helping Ethiopiareach the International Development Goals by 2015. If the grant assumptions do notmaterialize, real government expenditure will have to be reduced by roughly0.8 percentage points of GDP between FY99/00 and FY03/04-with a larger reductionrequired if the government wishes to avoid a negative impact on private sector activitydue to exchange rate pressures and lower net imports.
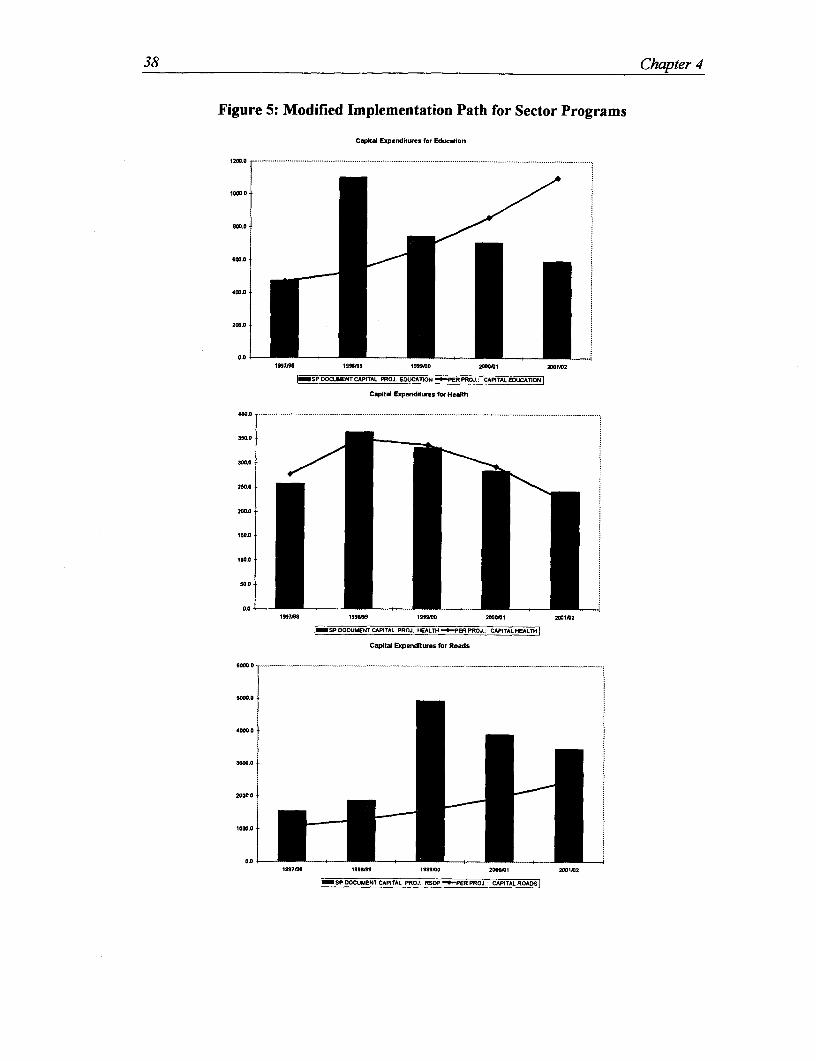
38 Chapter 4
Figure 5: Modified Implementation Path for Sector Programs
Capital Eop.nditure. for Edij.on
120O.0- ........................................... ....... ......................... ...... .... ...... ........... .... ...............
10.00
8000
6800.
48000
0.01997a08 199i69 19990D 2rI1 2001lD2
I_1SP DOCLAiENT CAPITAL PROJ EDLCATION _ R PROJ.: CAPITAL EDUCATION I
CapIta Expendltwes for Heath
400.0 ....... ... ... .................. ... ............ .......... ... ....... .............. ................ ... ............... . ... ......... ..............
350.0
380.0
380.0
80.0
1997as 199S699 1999UnD 20DOM1 2001n2
FE SPDJOCUWENTCAPITAL PROJ. HEALTH_-*PER PROJ:.C-A-P1TA-LH-EA-LTHIj
Capital Expenditures for Roads
1000.---- -
500.0
2000.0
1997d00 19ss9 s 19900O 200010 2Dn112
0SP DOCLMENT CAPITAL PROJ. RSDE P -- PER PROJ.: CAPITALROEADSI

CHAPTER 5: CAPACITY BUILDINGIN PUBLIC FINANCE MANAGEMENT
INTRODUCTION
81. To a certain degree the underspending on the capital budget is related to thequality of budget planning and the financial relationship between the center and theregions. The fact that aid flows are far below expected levels is not only the result ofdonors' concerns about the war, but also the consequence of capacity constraints andinsufficient communication between the institutions involved in budget management.
82. The aim of this chapter is to complement corresponding chapters in previousPERs and the Ethiopia Regionalization Study2 ' (Box 5) by reviewing decentralizedplanning and budgeting in more detail. This chapter will first review progress in theareas where the govemment has taken action, then highlight priorities for immediateattention, and identify any new and cross-cutting issues that need to be addressed.
Box 5: Budget Management Issues in Previous Studies
Previous PERs have focused on aspects of public expenditure management, includinglinks between planning and budgeting (with recommendations for.the development of, aMTEF) and fiscal decentralization. (with recommendations for refining the-mechanismsfor sharing revenues within the Federation). The Regionalization Study focused on theevolving federal system, mainly from the perspective of the .division of tax andexpenditure assignments between the- federal and regional governments and the relatedissues of budget transfers. The Regionalization Study noted that. the federal system isstill evolving. The system builds upon strong macroeconomic coritrol inherent in theblocki grant system and the equitable nature of the grant formula. Among other points thestudy draws attention to the counterproductive incentive structure of the revenue formula(block grants to the regions), which essentially penalizes the regions for additionalrevenue efforts; the disincentive effects of the budget offset system, and.the inherent risksposed by contingent liabilities of regional guarantees for agricultural loans.
ONGOING REFORMS IN PUBLIC FINANCE MANAGEMENT
83. Public finance management in Ethiopia is complex because three importantreform exercises are proceeding simultaneously:
2 Ethiopia: Regionalization Study, World Bank, Report No. 18898, February 3, 1999.

40 Chapter 5
+ A radical program of decentralization to regions and lower tiers ofthe government;
* Civil Service Reform, including a variety of measures to strengthenexpenditure management and control, and
* Comprehensive sectoral budgeting and Sector DevelopmentPrograms22.
FISCAL DECENTRALIZATION
Decentralized Budgeting84. The principal features of Ethiopia's budget system23 comprise of: the dualbudgeting with separate government bodies in charge of the recurrent and capitalbudgets; an annual budgeting horizon which lacks a strategic framework; and a budgetpreparation process that is bottom-up and a resource allocation process that is top-down.Generally, budget discipline is enforced as budgets are prioritized to fit withinexpenditure ceilings, and expenditures conform to authorized appropriations. However,the planning process is characterized by a bias in favor of capital expenditure andrecurrent expenditures are incremental. Line item budgeting is geared more towardexpenditure control and not so much to public finance management.
85. Under the decentralized system, the center gives regions considerable autonomyover their budgets. Moreover, within the regions, there are moves to decentralizebudgeting further, to zonal and even woreda level. In principle, the regions areautonomous in their budget preparation and execution since the federal 'subsidy'takes the form of an untied block grant. However, regional discretion is constrained sincethe federal government controls total expenditure and the constitutional frameworkobliges regions to follow federal policies24 (for example, regional salary scales are tied tofederal ones; school and health facilities follow national standards).
Regional Budget Preparation86. Regional budget planning in Ethiopia is a complex bottom-up process whichinvolves multiple channels of coordination.2 5 Traditional budgeting procedures in the
22 Three sector development programs are under way - for roads, education and health. The roads sectorprogram is implemented primarily by the (federal) Ethiopian Roads Authority (ERA). The Educationand Health Sector Development Programs are implemented at all levels of government, and thischapter therefore focuses more on them.
23 For more detail on present and proposed budget systems see, the Budget Reform Design Manuals.Version 1.0 (January 15, 1998) deals with Budget Processes and Preparation; Version 2.0 (March 25,1999) covers Chart of Accounts. Budget Preparation and Presentation.
24 See Lister, December 1998, Chapter 2 (especially §2.3).
25 Regionalization Study.

Capacity Building In Public Finance Management 41
regions mirror the federal system and echo federal financial regulations (although cautionis indicated in generalizing).2 6 In addition, there are important dynamics in some regionswith a shift from sector-wise to zone-wise budget planning (Box 6).
Box 6: Fiscal Devolution Below the Regional Level
For Oromia, the largest region, it is still tTue that regional sector bureaus are dominant inpreparing sector budgets. But the two next-largest regions-Amhara and SNNPR-havealready decentralized budget preparation to the zonal level, and.a similar move is underconsideration for Oromia. Thus, both Amhara and SNNPR. apply a formula to distributeavailable funds among zones, and the distribution of resources between capital. andrecurrent budgets and. between sectors is decided at the zonal level, Both regions apply aformula very similar to the formula used for sharing federal subsidy among the regio,ns.Amhara plans to carry the process a stage further and allocate lump sum budgets also toworedas. Decentralized budgeting places greater responsibility on the fina'ce andplanning bodies at the zonal level since they take the lead in supervising budgetpreparation, screening requests, and presenting consolidated budgets to- the zonaladministration for approval. It is sometimes argued: that it is inappropriate .-to focusresource allocation responsibilities at the zonal level, because the zones do not have ,thesame constitutional status as regions and woredas. ' However, devolution of the capita+l.budget down to woreda level could result in ,impracticably small allocations.Administrative capacity at woreda level is limited. There is no planning.body at woredalevel, and the PER team visited two woredas:that are sharing the same administratin..Zones, with average populations of around 850,000 do. offer at least the benefits ofdecentralization and a pragmatic compromise between top-down and bottom-upapproaches,
87. The regional budgeting system has considerable strengths.
+ It is disciplined and activities are not included in the budget unlessfunding is assured27 (this creates a degree of rigidity in dealing withaid funds, which is discussed later).
+ It is well documented and linked to implementation procedures.Budget documents themselves follow standard formats. Detailedannual work plans, which include specific financial and physicalinformation, are prepared project by project at regional and zonallevels.
26 PER mission members visited a small sample of regional, zonal and woreda bodies in Amhara, Oromnia,Southern Peoples, and Harari Regions, and the Dire Dawa city administration.
27 The PER team asked one zonal sector head whether projects could be included in the budget in the hopethat donor funding might be arranged in the near future; his response was that "planning withoutconfirmed money is a crime".

42 Chapter S
* It follows systematic channels, whereby sector bodies receiveguidance from finance bodies in preparation of the recurrent budget,and from the planning bodies in preparation of the capital budget.
* It takes account of local preferences, although lower levels are notautonomous, they are systematically consulted.
88. There are also inherent weaknesses in regional budgeting.
* These weaknesses are reflected by the pervasive separation betweenrecurrent and capital budgets.
* Generally budget preparation is done without ceilings (so-called"blue-sky budgeting"). Guidelines for priorities are provided by theregions' five-year plans. However, these plans do not include detailedexpenditure programs. This means either that the exercise has to berepeated once ceilings are known, or, more frequently, that thedecisive round of budget cuts occurs at upper levels of the system.
* The one-year budgeting horizon creates inflexibility. While thereare systematic procedures for carrying out the projects that areincluded in each annual budget, it is very difficult to incorporate andimplement projects for which funding is secured after the financialyear has begun.
* There are capacity limits at zonal and, especially, woreda level.There is no planning body at the woreda level. Even zones are oftenhandicapped by poor communications, reliance on manual systems,and limited staff training.
* Timely reporting on budget implementation is weak. Budgets andaction plans provide a good framework for supervision and monitoringof implementation at woreda and zonal levels, and the budget codingused is clearly aligned with the federal coding system. Expendituresare reported monthly, and the finance bodies maintain consolidatedrecords. However, the monthly reporting is very aggregated and doesnot generate the kind of detailed management information and analysisrequired, for example, for the SPs. Indeed, it is likely that theweakness of information flow upwards has led some observers tounderestimate the quality of the budgeting and planning processes thattake place at regional and zonal levels.
Capacity Building In Public Finance Management 43
Issues for Follow-up89. The PER focuses on three systemic weaknesses of the system between the centraland regional planning and budget system28. Each area is important with regard toeffective and efficient expenditure planning and execution: (a) incorporation of aid inregional budgets; (b) the budget off-set; and (c) the relevance of the financial calendar.
* Incorporation of aid into regional budgets requires advancednotification of the amount, source, and specific implementationrequirements of such funds. In order to fit in with the budget calendar,and allow timely implementation of donor-funded activities, thisinformation needs to be available well before the fiscal year begins.Timely notification can be facilitated by a systematic recording andupdating of all aid agreements and expected flows by MEDaC as wellas routine reporting (to MEDaC) of all ongoing and envisaged aidagreements by donors.29
* The "offset" system, as it is currently operated, leads localgovernments to prefer central government funding relative to aidfinanced projects, because of the simpler procedures associated withutilization of the resources.
i Promulgation of the financial calendar (Annex Table ) will helpensure a timely and effective budget planning process. A practical linkbetween federal and regional budgets, is that regional budget calendarsare dependent on the federal one. The federal subsidy is pivotal forregional budgets, since the regions cannot issue firm ceilings forbudget preparation until they know what the coming year's federalsubsidy will be. Indeed, there is a cascade involved, since the volumesof resources available at woreda and zonal level also depend on thefederal subsidy.
28 Aid principally affects the capital budget, since most donor finds are directed towards projects.However, this will not necessarily remain the case. Some donors are considering undifferentiatedbudget support, or channeling funds to the recurrent budget; and two traditional areas of donorsupport - text books and drugs - belong more in the recurrent than the capital budget.
29 Aid has to be considered in the context of federal policies. Dealings with international aid agencies are afederal prerogative, with MEDAC as the lead agency. Financial regulations now require that all aidbe accounted for as part of the consolidated fund. The federal subsidy is adjusted to take account ofexpected aid flows to the regions. Aid agencies are encouraged as far as possible to follow thegovermnent's financial channels and procurement procedures.
44 Chapter 5
REFORM OF EXPENDITURE MANAGEMENT
Civil Service Reform-Context, Structure, and Organization90. In parallel with the decentralization, Ethiopia embarked on efforts to strengthenthe efficiency and performance of the civil service. The CSR comprises five reformareas: Top Management Systems; Ethics; Human Resources Management; ServiceDelivery; and Expenditure Management and Control (Figure 6). The PER focuses inparticular on the Expenditure Management and Control component (EMC). The progressmade on CSR in general and EMC in particular, does not seem to be well known withinthe donor community, in spite of its comprehensive and important nature. It could bebeneficial-also in view of obtaining complementary external assistance-to organize abriefing on this subject and to keep the donors informed regularly.
Expenditure Management and Control Program91. The overall objective of the EMC is to bring financial management systems inline with current policy and redress structural weaknesses. Therefore, the EMC consistsof the following components:
* Development and adoption of a new financial legal framework;
* Implementation of a Public Investment Program to reform thebudget planning systems;
* Reform of the budgeting system;
* Capacity building in accounting and audit, including thedevelopment of a Financial Information System at federal and regionallevel and upgrade of computer facilities, clarification of the roles andresponsibilities of all audit institutions (internal and external) withinthe civil service; and development and improvement of the auditingand accounting profession.
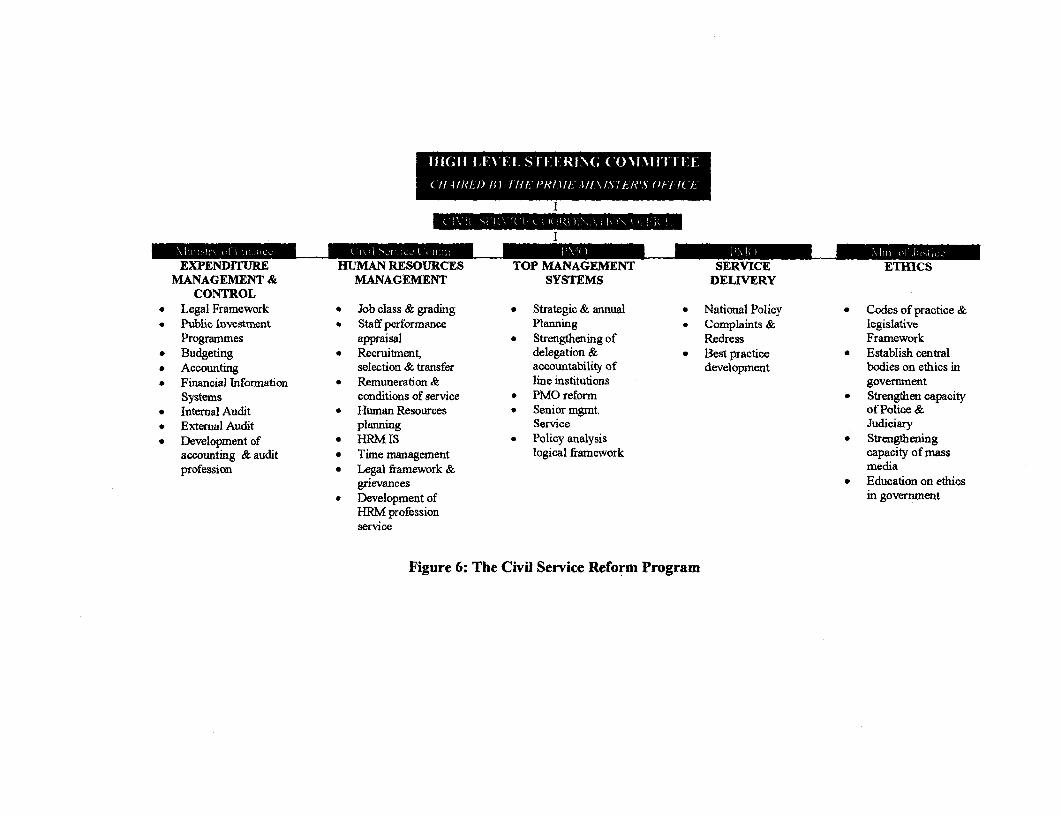
I
EXPENDITlRE HUMAN RESOURCES TOP MANAGEMENT SERVICE ETHICSMANAGEMENT & MANAGEMENT SYSTEMS DELIVERY
CONTROL* Legal Framework * Job class & grading * Strategic & annual * National Policy * Codes of practice &* Public Investnent * Staff performance Planning * Complaints & legislative
Programmes appraisal * Strengthening of Redress Framework* Budgeting * Recruitment, delegation & * Best practice * Establish central* Accounting selection & transfer accountability of development bodies on ethics in* Financial Information * Remuneration & line institutions government
Systems conditions of service * PMO reform * Strengtien capacity* Internal Audit * Human Resources * Senior mggmt. of Police &* External Audit planning Service Judiciary* Development of * HRM IS * Policy analysis * Strengthening
accounting & audit * Time management logical framework capacity of massprofession * Legal framework & media
grievances * Education on ethics* Development of in goverrnent
HRM professionservice
Figure 6: The Civil Service Reform Program
46 Chapter 5
Financial Legal Framework
92. In 1996 the Financial Legal Framework was drafted and adopted by the Councilof Peoples' Representatives30 . The framework calls for the preparation and drafting ofregulations, directives and guidelines. At present, the drafting and approval process forthese various pieces of legislative follow-up is in full swing and considerable progresshas been made. The Financial Regulation were passed by the Council of Ministers in19973'. Of the 21 financial directives that need to be issued, nine-including some ofcentral importance3 2 -have already been completed, and most of the others are in anadvanced stage of preparation. A considerable effort is currently being undertaken totrain and acquaint federal and regional staff with the new provisions and legislation andtheir consequences.
93. Next Steps. Priority should be given to issue the remaining financial directives,in particular those on budget management, including the budget calendar, procedures ofbudget control, procedures for submission of supplementary appropriation, and calendarfor supplementary appropriation.
Public InvestmentProgram andAidManagement
94. The 1997 and 1998 PERs recommended the preparation of a three-year MTEF toaddress the weak link between policy formulation, planning, and budgeting. The aim ofan MTEF is to ensure a strategic approach to public expenditures, which takes account ofinter-temporal and inter-sectoral tradeoffs, as well as ensuring consistency betweenrecurrent and capital budgets. The MTEF would help ensure consistency between SPsand the overall macroeconomic framework.
95. The government has accepted this recommendation and has started launching aprocess that will eventually culminate in an MTEF. The government decided to begin byintroducing a Public Investment Program (PIP). The PIP will be followed by a PublicExpenditure Program (PEP), the difference being that a PIP programs only capitalexpenditures, while a PEP programs both capital and recurrent expenditures. However,since the expenditure guidelines for the PIP have to be based on a Macroeconomic andFiscal Framework (MEFF) that considers total revenue and expenditure commitments,the PIP is regarded as an MTEF 'under construction'. The government also plans to rollout the federal PIP to the regions over the medium term.
96. Although, PIPs are rather outdated and inappropriate, it is important to seeEthiopia's PIP in perspective. Modern planning and budgeting systems emphasize the
30 Federal government Financial Administration Proclamation No 57/1996, 19 December 1996.
31 Council of Ministers Financial Regulations No 17/1997, 1 July 1997.
32 Directives issued until May 1999 covered: financial responsibilities, debt management, public property,procurement, fees &charges, retention of records, short term salary advances to civil servants, write-offs and government safes.
Capacity Building In Public Finance Management 47
importance of an integrated approach to recurrent and capital expenditure, whereas PIPsmay perpetuate a bias towards capital expenditure. If the only intention was to preparethree-year capital plans and budgets for the federal public bodies, it would be of verylimited value. However, the Ethiopia PIP is intended as a staging post towards a morecomprehensive Public Expenditure Program. The MEFF provides an appropriateframework for strategic planning of public expenditures. It introduces a multi-yearperspective, it requires analysis of overall resource availability and provides theopportunity to address tradeoffs between federal/regional, recurrent/capital, andalternative sectoral expenditures.
97. The PIP process is embedded in the budgetary system through the financialregulations, and would encourage both donors and government agencies to follow agreednational priorities. The problems the PIP approach addresses are almost equally relevantat regional level: here too a strictly annual perspective leads to inferior expenditurechoices, inefficient project implementation, and sub-optimal use of aid. The question ofhow to adapt the PIP to regional requirements is important.
98. At the time of the 1999 PER mission, one round of PIP preparation had beencompleted and the second was in process.
* The first version of the federal PIP covers the FY98/99-00/01(EFYs 1991-1993).33 It was decided to treat the exercise as a dryrun. The output is in two volumes. The first explains the process anddescribes the MEFF. The second includes project profiles for federalpublic bodies, which are maintained on a database developed for thepurpose. Instead of preparing the first PIP ahead of the budget, callcirculars for the first PIP were issued simultaneously with the capitalbudget call. The output is dated October 1998, and was thuscompleted well into the first fiscal year it covers. This PIP has notbeen submitted to Cabinet or to Parliament, nor has it been circulatedbeyond MEDaC. Moreover, submissions from public bodies werewell in excess of Indicative Planning Figures (IPF), and the exercise ofprioritization was not followed through.
* Uncertainties about the impact of the war have frustratedpreparation of the FY99/00 PIP. It was planned to get the secondround PIP (EFY 1992-1994) started earlier, and this time ensure atleast Cabinet if not Parliamentary approval. At the time of the PERmission Indicative Planning Figures (IPFs) had still not been issued.
* The PIP thus far only covers federal projects. However, calculatingthe funds available for federal capital expenditure requires projectionsof federal recurrent spending and of the federal transfer to the regions.
33 FDRE: Public Investment Program FY's 1991-1993, draft, October 1998 (2 Volumes).

48 Chapter 5
Preparation of PIPs at regional level would require the federalgovernment to give the regions forward projections of theirexpenditure ceilings and anticipated federal subsidy. The initialinclination was to defer the regional PIPs until the federal PIP wasbedded in. There is now more support for involving the regionssooner, partly because they too have made it a legal requirement, butalso because the current regional Five Year Plans will shortly expire,and it would be sensible to harmonize the five-year plan and PIP work.
* The PIP work has been primarily located in MEDaC. Revenueforecasts were sought from MoF, but MoF is not used to forecastingmore than one year ahead, and MNEDaC therefore made its ownassumptions about the medium term. In order to develop therevenue/expenditure forecasts, MEDaC also prepared (apparently forthe first time) a comprehensive set of projections of externalassistance. These are crucial to the exercise: without reliable andcomplete donor forecasts it is difficult to produce an accurate MEFFsince external funding accounts for 45-50 percent of capitalexpenditure.
99. Next Steps. Operationalization of the PIP/MEFF exercise is extremely important.It is important to recognize the MTEF as a new way of doing business that shifts thefocus of budget planning from being investment driven to being comprehensive, withadequate recurrent funding for existing infrastructure taking priority over new capitalexpenditures. The next round of the PIP should be started early--with a view to movingquickly to a PEP and should involve all players concerned. Lessons learned from the first"dry run" could be disseminated and applied. A review of the used MEFF methodologywill be useful. MEDaC could develop a process through which it will obtain from thedonors reliable and timely forecasts of foreign assistance, to be used as an importantinput into the MEFF. An intensive coordination with the donors will be indispensable. Astrategy for expansion of the PIP/PEP exercise to the regions will need to be developed.
Reform of the Budgeting System
100. The overall aim of the budget reform component is to produce annual budgets of ahigher quality on a federal and regional level in a more timely manner. The reforms aimat budget preparation compatible with resource ceilings and development priorities,improved budget management that will lead to a more appropriate expenditurecomposition, and more effective budget control through a strengthened budget processand revised budget codes. The underlying theme of the approach is to move towardsactivity-center (also called cost-center) budgeting. Activity centers will allow publicbodies to know the total cost of an activity and make budgeting decisions accordingly.The approach combines the virtues of a line item budget system that Ethiopia is used to,but aims to improve it as a tool of management and not just as a tool for expenditurecontrol. Priority actions for improvement include:

Capacity Building In Public Finance Management 49
* Development of a more appropriate budget calendar, that allowsstrategic planning and detailed budgeting to be properly sequencedduring the year.
* Development and introduction of a better chart of accounts, withbudget codes more suited to both management and reporting, andfacilitating self-accounting by agencies.
* Improved budgeting techniques, including the use of norms andstandards, and the timely preparation of budget ceilings.
101. Up to now, two Budget Reform Design Manuals have been completed.3 4
+ The first manual on Budget Process and Preparation3 5 lays out theprocedures for capital and recurrent budgeting at federal and regionallevels and makes recommendations for improvement. The manualidentifies a number of weaknesses that need be addressed, including:(1) considerable off-budget financing of capital expenditure; (2)chronic under-funding of the recurrent budget, in particularinsufficient non-wage recurrent expenditures to sustain capitalexpenditures; (3) uncertainty and inappropriate budget practicesbecause of the absence of an authoritative budget calendar; and (4) theuncertainty of externally financed capital expenditures.
* The second manual on Chart of Accounts and BudgetPresentation36 was presented in March 1999. It introduces changes inthe structure of the budget in five areas: classification, expenditurecodes, revenue codes, financial calendar, and budget formats.
102. Next Steps. Implementation of the Budget Manuals is the top priority now. It iscritical that the new principles and guidelines for budgeting should permeate through allgovernment institutions, at a central and regional level alike. Specific follow-up isrequired on the implementation of the financial calendar, which covers both planning andbudgeting cycles and aims at the adequacy and the timeliness of the budgeting exercise.Broadly speaking, the planning cycle would cover the first half, while the preparation andadoption of the budget would take place in the second half of the fiscal year. Thedifficulties encountered during the preparation of the budget for FY99/00 are to a largeextent due to the absence of such an authoritative calendar. Targeted dates have not been
34 The next volumes of the budget reform design manual will address organization and staffing of budgetinstitutions (volume 3.0) and aid management (volume 4.0).
35 Budget Reform Design Manual, Version 1.0, Budget Processes and Preparation, 15 January 1998.
36 Budget Reforn Design Manual, Version 2.0, Chart of Accounts, Budget Preparation and Presentation,25 March 1999.

50 Chapter 5
respected both during the planning and in the budgeting cycle. In the month of May forinstance, the regions still had not received their budget ceilings, which complicated theirtimetable for presenting realistic budgets. What is now needed is to ensure adoption ofthe calendar and discipline in following it through the fiscal year.
Accounting and Audit
103. The components on accounting and audit are the least advanced within the EMCprogram because of a shortage of donor funding and delays in contracting consultants. Itis important that the EMC-management accelerates the implementation of thesecomponents. In particular, it is important to operationalize the financial reportingsystem on the use of donor funds under the SPs for education and health. The financialreporting system on the use of donor funds broadly follows the current accountingpractice of the government. The major difference is the revised chart of accounts,especially developed for donor funding 7. Up to now, the interim reporting system is notyet operational.
SECTOR DEVELOPMENT PROGRAMS
104. The present PER and previous ones have questioned the realism and sustainabilityof the expenditure targets in SPs, but the striking innovative element is the level of detailat which it is now possible to conduct this analytical debate. Few countries havedeveloped comprehensive, resource-constrained sector programs that enable such issuesto be systematically considered. While expenditure patterns under the SPs are reviewedin other chapters of this PER; the following section is about underlying implementationissues. This section first provides overviews of the SPs and of the financing channelsfor aid disbursement, then turns to a more detailed review of the programming of aidfunds.
Overview of Sector Programs105. Sector strategies for roads, health, and education were first prepared by thegovernment and then further developed jointly with aid agencies involved in the socialsectors.3 9 The SPs are the first 5-year slice of 20-year strategies, and cover EFYs 1990-94. The SPs are characterized by a Program Action Plan (PAP), which summarizes thestrategy and its associated expenditure targets, more detailed Education and HealthSector Development Program documents for each region and the center, and aProgram Implementation Manual (PIM) which describes implementation proceduresfor each sector. Basic procedures are virtually identical for the two sectors, but eachversion also includes some sector-specific material. Important features of both SPs
For ESDP, see pages 13-14 of the ESDP Program Implementation Manual, December 1998.
38 The primary focus is on the health and education SDPs.
39 For a comprehensive account of the preparation of the ESDP, see Preparation of the Education SectorDevelopment Program in Ethiopia: Reflections by Participants, by John Martin, Riitta Oksanen andTuomas Takala, Final Report 7 June 1999. Preparation of the HSDP followed the same pattern.
Capacity Building In Public Finance Management 51
include the joint preparation by regions and federal governments in the spirit of
"cooperative federalism", the coverage of the entire sector, the prescribed discipline inplanning and prioritizing within expenditure ceilings, and ongoing efforts to simplifyand harmonize donor procedures.
Financial Channels for Implementation106. An important motive (especially for the government) was to improve the quality
of aid and of the aid relationship. Instead of fragmented, low-trust micro-management of
separate projects by donors, the SPs offer a platform for high-trust dialogue about
policies and implementation. A further objective was to achieve full pooling of aid
funds. However, it became clear that a step-by-step approach was inevitable. At aminimum, the aim is to harmonize donor and government procedures, and to focus donor
efforts on the priorities embodied in the government program, which will encourageregional uptake of available donor funding.
107. Three main channels for disbursement of aid have been identified:
* Channel 1 is the standard route for the flow of government funds.Because of the seamless integration of unearmarked donor fundingwith the government's own revenues, Channel 1 is the preferredmodality. Donors who are prepared to use Channel 1 fall into twogroups: those who nevertheless insist on being able to trace theirfunds to particular end-uses, and those who are prepared to considerunearmarked budget support.40
* Channel 2 involves transmission of funds via the Sector Ministries.Since Channel 2 undermines the integrity of planning, budgeting, andaccounting systems, it is to be avoided.
* Channel 3 depicts direct disbursement of funds by donors, in whichno government body is directly responsible for handling the funds. Inline with the government's policy that all aid must be brought toaccount in the consolidated fund, Channel 3 funds directly disbursedby donors should be appropriately recorded.
40 A number of donors envisage dividing their support between different disbursement channels, at least fora transitional period. IDA Bank has been foremost among donors prepared to use the earmarkedvariant of Channel 1 - so-called "Channel lb". To do this effectively depends on a strengthening offinancial reporting down to regional and zonal levels, so that expenditures are coded according tosource of funds, and prompt reporting on expenditures allows timely replenishment of initialadvances. The Excellence Report was commissioned in order to accelerate this aspect of budgetreform and install a functioning interim reporting system as rapidly as possible. Installation of thesystem is under way, but has taken longer than hoped and at the time of the PER mission was not yetdelivering consolidated reports.
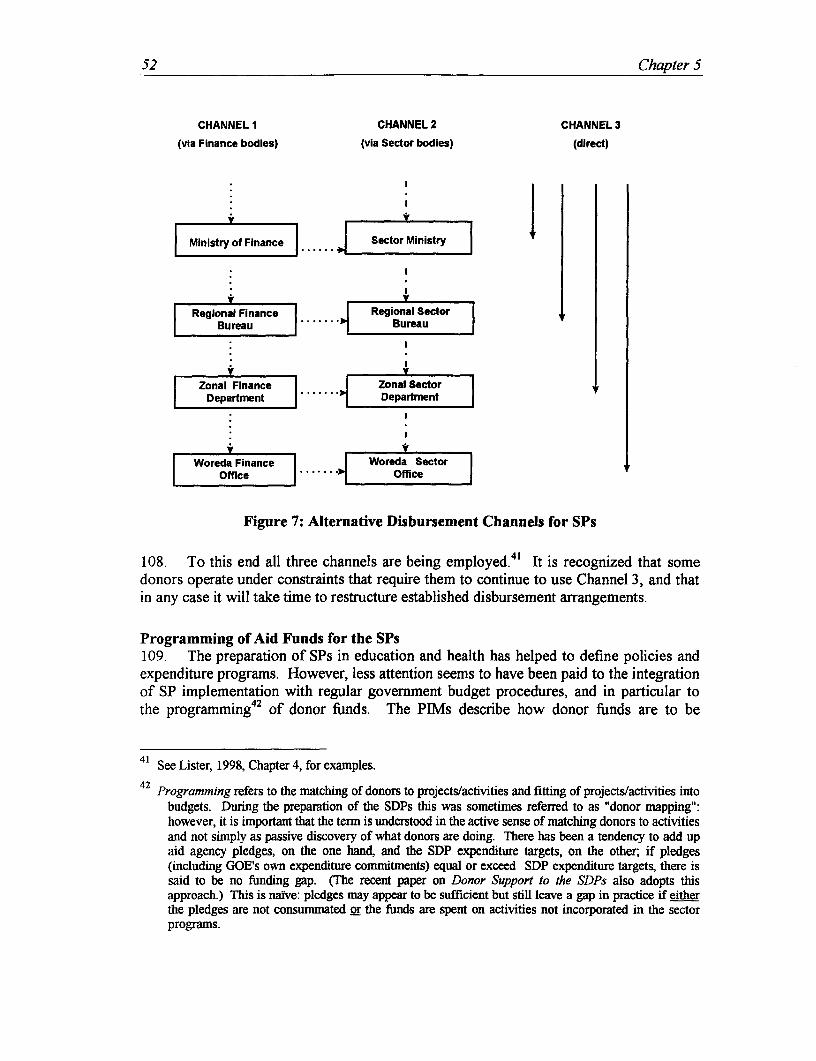
52 Chapter S
CHANNELI CHANNEL2 CHANNEL-3
(via Finance bodies) (via Sector bodies) (direct)
Minsty fFinance -SetorMinistry
Regional Finance Regional SectorBureau Bureau
V IZonal Finance ZonalSector
Departmnt Departrnt
Woreda Finance Woreda SectorOtrice Office
Figure 7: Alternative Disbursement Channels for SPs
41108. To this end all three channels are being employed. It is recognized that somedonors operate under constraints that require them to continue to use Channel 3, and thatin any case it will take time to restructure established disbursement arrangements.
Programming of Aid Funds for the SPs109. The preparation of SPs in education and health has helped to define policies andexpenditure programs. However, less attention seems to have been paid to the integrationof SP implementation with regular government budget procedures, and in particular tothe programming4 2 of donor funds. The PIMs describe how donor funds are to be
41 See Lister, 1998, Chapter 4, for examples.
42 Programming refers to the matching of donors to projects/activities and fitting of projects/activities intobudgets. During the.preparation of the SDPs this was sometimes referred to as "donor mapping":however, it is important that the term is understood in the active sense of matching donors to activitiesand not simply as passive discovery of what donors are doing. There has been a tendency to add upaid agency pledges, on the one hand, and the SDP expenditure targets, on the other; if pledges(including GOE's own expenditure commitinents) equal or exceed SDP expenditure targets, there issaid to be no funding gap. (Tbe recent paper on Donor Support to the SDPs also adopts thisapproach.) This is naive: pledges may appear to be sufficient but still leave a gap in practice if eitherthe pledges are not consummated or the fumds are spent on activities not incorporated in the sectorprograms.
Capacity Building In Public Finance Management 53
accounted for, but do not explain how donor funds are matched to particular componentsof the SPs in the first place.
110. In an ideal arrangement (from the government perspective), programming ofdonor funds would not be an issue. If all donor funds were provided as unearmarkedbudget support, the only task would be to forecast the total of government-plus-donorfunds available and use this in determining budgetary ceilings. Budget holders would notneed to know how much of the ceiling originated from aid, since implementation,procurement and accounting procedures for all components of the program would beexactly the same. In practice, budget holders do need to know the source of particularfunds and the conditions attached to their use4 3 - indeed, the quality of aid programmingmay have a profound effect on the speed and effectiveness of implementation of theESDP and HSDP. However, the move to more flexible aid modalities is a two-way streetand requires that donors' concerns about accountability of resource utilization are met.
111. The PER mission found large discrepancies between the government'sestimates/projections of external resource flows and donors' planned aid disbursements.44Inconsistency between donor and govemment records is a problem because the correctcalculation of regional offsets becomes a matter of chance. Even if the discrepanciesreflect the extent to which disbursement is still taking place outside the governmentbudget, it is important to get as accurate as possible ex-ante disbursement information. Itis, however, not clear whether all reported donor expenditures in the education and healthsectors should be counted as part of the SPs. In principle, they clearly should, becausethe SPs are intended as comprehensive programs that embrace all (federal and regional)government activities from primary to tertiary level in each sector. It may well be thatsome donor-supported activities (especially for projects and activities conceived beforethe SPs) do not fit well with the stated SP priorities. During SP preparation it wasrecognized that some donor activities may need to be realigned to fit with the redefinedpriorities of the programs. For example, technical assistance is particularly difficult tocapture within government expenditure records, and this may account for some of thedifference between donor and government figures. While donors have a responsibility toprovide timely and accurate information on their programs (especially whendisbursement does not follow regular government channels), the government itself needsto maintain continuous and consolidated records across donors and sectors. Within thegovernment, MEDaC is the appropriate agency to maintain such records, and should beable to relate all ongoing donor programs in health and education to the SPs.
Options for IDA Support to the Education and Health Sector Programs112. The experience with IDA funding is given special attention because it is pivotal inseveral ways. IDA is the largest single external funding agency for both health andeducation sectors and it has adopted the role of 'financier of last resort'. IDA coordinated
43 At the ARM2 meeting, regional participants stressed the importance of receiving such information asearly as possible in the budget cycle.
44 See Donor Supportfor SDPs: Some Supplementary Information for the 1999 PER, (Second Draft) WimOlthof, EC Delegation.
54 Chapter 5
the donors' preparation of the health and education SP. In principle, IDA funds areavailable to support any of the identified components of the two SPs and are disbursedvia Channel lb (following the finance body channel, and being disbursed at regional andeven zonal levels). IDA funds are earmarked to specific uses and IDA procurement andaccounting standards have to be satisfied by those projects. Separate accounts have beenopened by each region to facilitate the tracking and reimbursement of earmarkedexpenditures. To facilitate rapid and decentralized implementation, the World Bank tooka number of steps, including the posting of the Task Manager for the IDA educationproject in Addis Ababa (so that necessary approvals could be processed more rapidly)and holding in-depth seminars on IDA procurement procedures.
113. Agreements on the IDA support were concluded only after the commencement ofFY98/9945 because conditions for effectiveness were not met as planned. At negotiation,projected annual expenditure was one contentious issue. The government sought hightarget rates of expenditure in the first year, and IDA acceded to an upper limit of US$35million for the education SP with a projected disbursement target of US$15 million inFY98/99 (thought IDA expressed doubt that such a high figure was achievable inpractice). The present projection is that only a fraction will have been utilized by the endof FY98/99. For IDA's contribution to the health SP, it is expected that FY98/99disbursements will be negligible.
114. There are a number of contributing reasons for the slow start to disbursement.Impediments to meeting the pre-requisites for effectiveness delayed the implementationof the operation well into the fiscal year . In line with its proposed role as financier oflast resort, IDA sought information not only on the projects to be included in its own sub-program, but also on funding from other sources, so as to be assured that complementaryinputs were available. The Ministry of Education (MoE) was unable to provide rapid andcomprehensive information on the overall funding situation of the education SP-partlybecause it was not tracking donor funds in the necessary detail, but also becauseinformation on regional budgets had to be gleaned from their budget documents.
115. For its part, the government had to obtain Parliament's approval for asupplementary budget to allow expenditures to commence. The federal governmentdecided to allocate funds to the regions in proportion to their formula shares of federalsubsidy, which meant that allocations took no account of different regions' pipelines ofprepared projects or capacity to cope with IDA's administrative and accountingrequirements. The Ministry of Education (MoE) decided on the types of projects eachregion was to include because there was no time for a bottom-up identification process ofIDA subprograms. There was considerable confusion amongst regional EducationBureaus, who felt that they were given insufficient discretion, that they were not givensufficiently clear instructions, and that they were subject to repetitive and overlappingdemands for project information.
45 The IDA credit for health is running several months behind the education credit, and the latter thereforeprovides more relevant experience.
Capacity Building In Public Finance Management 55
116. The respective roles of the MoE and MEDaC were not clear; MEDaC and theplanning bodies in the regions are the usual channel for information and instructions onthe capital budget but MoE has been the channel for instructions on the use of the IDAcredit. Moreover, the perceived benefits of IDA funding were also unclear, since regionsexpected that IDA funds would substitute for Treasury funds which are much morestraightforward to deal with.
117. Now regions are concerned as to whether the IDA funds allocated for FY98199,which have not been spent, will be carried forward to the next fiscal year, and whatprecisely will be the mechanism for doing this. The normal procedure for governmentfunds46 is that an unutilized provision lapses and has to be re-voted in the following year'sbudget. At the time of the PER mission, the MoE had not decided the level of IDAfunding it would request for FY99/00 and, as already noted, no ceilings or indications ofoverall federal subsidy had been issued.
118. Some lessons have already been drawn from this first year's experience. It hasbeen decided that in future the regions will be responsible for proposing subprograms,and the need to ensure that IDA funds are reflected in government budgets is nowunderstood (although the delay in considering requirements for FY99/00 does not augurwell). Once the expenditure tracking system is operational, the process of claimingreimbursement for expenditures should proceed more smoothly.
119. The procedures for programming the available IDA funds should be reviewed to:
* Ensure that the concept of annual programming of IDA fundsprovides timely information to central and regional government levelson aid flows in line with IDA's role as financier of last resort. Theimplementation cycle (taking account of procurement lead times andso forth) is considerably longer than one year for most projects.Efficient implementation requires that the implementing body knowsthe source and availability of funds as early in the project cycle aspossible. For all practical purposes this information (even if only as anotional allocation) needs to be available some months before thecommencement of the budget year. In doing so, the government couldallocate IDA funds to components less likely to be sought by otherearmarking donors, taking into account IDA's willingness to financeany component of the SP. In addition, IDA funds might be reallocatedas the program is rolled forward.
* Finalize the standard format for project information for thegovernment and the donors, and implement the financial informationsystem.
46 Apart from a month's grace before the annual books are closed, to allow the completion of paymentsalready under way at the end of the fiscal year.
56 Chapter S
* Frequently review the appropriate amount in the Special Account(disbursement buffer) of advanced (but not yet accounted for)funds.47Decentralization does lengthen the chain of fund disbursementdownwards and expenditure reporting upwards. Because ofbottlenecks at earlier stages in the project cycle, this constraint has notyet been felt by the IDA credit. However, it is implausible that anadvance of only US$6 million can leverage annual expenditure of US$30 million or more.
RECOMMENDATIONS ON CROSS-CUTTING ISSUES
Overview120. The three inter-linked areas of reform reviewed in this chapter-decentralization,strengthening of expenditure management and control, and sector developmentprograms-are all making good progress. All, however, involve major institutionalchange which naturally takes years to consolidate. This final section first identifies cross-cutting issues to strengthen the government's strategic planning of public expenditure andthen makes recommendations for the better management of aid within the government'sstrategic planning framework.
Strategic Planning of Expenditures121. Important steps to improve the strategic planning of public expenditure havealready been taken, through the preparation of the SPs and the beginnings of theMEFF/PIP exercise. The next step is to move ahead with a comprehensive MTEF*because strategic planning of expenditure cannot take place within an annual budgetcycle. Annual budgets need to be drawn up within a medium-term perspective.Moreover, the multi-year planning and programming of expenditures needs to take placeat each level of Ethiopia's decentralized system, where not only federal public bodies butregions and zones need indicative figures for the forward planning of expenditures.These requirements have already been recognized within the government's proposal for afiscal calendar, which provides for multi-year planning and programming in advance ofthe drawing up of an annual fiscal plan and the detailed preparation of annual budgets.To operationalize the medium-term planning of public expenditure, the proposedfinancial calendar needs to be adopted now, with the following corollary initiatives:
+ Broad acceptance of the pivotal importance of the MEFF and itstimely adoption (including discussion at cabinet level).
* Systematic collaboration between MoF and MEDaC in preparingthe MEFF and proposing indicative planning figures. The PIP designteam has made proposals for the establishment of an appropriate inter-
47 Limited computerization makes it even harder to achieve the required velocity of circulation of funds.
Capacity Building In Public Finance Management 57
ministerial working group, which would also involve the CentralBank.
* Strengthened macroeconomic modeling capacity to be able to runconsistent scenarios on revenues and expenditures, and to be able toadjust these scenarios as events unfold. In preparing the MEFF, thefederal government should aim to provide reliable projections of thefederal subsidy to regions, so that regions, too, can prioritize theiractivities taking account of resource availability.48
+ Expansion of the PIP into a fully-fledged multi-year PEP byproviding recurrent as well as capital expenditure guidelines in theMEFF. When the PIP is extended to the regions, sector plannersshould be required from the outset to prepare consistent medium-termplans for both recurrent and capital expenditure, and regional andzonal councils should be required to undertake joint reviews ofrecurrent and capital budgets for each sector.
Aid Management to Support Strategic Expenditure Planning
AidAgency Collaboration
122. The collaboration of aid agencies is essential to achieve more rational planningand utilization of public expenditures:
* Aid Projections. Credible projections of aid flows are an essentialinput into the MiEFF, and are needed for three or four years ahead, notjust for the imminent budget year. An essential foundation is forMEDaC to maintain, with donor assistance, a reliable andcomprehensive database of ongoing aid projects and programs, whichcan be clearly mapped into the SPs that have been agreed, as well asinto the PIP and successive annual budgets. In addition, thegovernment and donors need to collaborate in making projections ofaid flows that extend beyond existing firm commitments so as toprovide a reasonable basis for expenditure planning.
* Notification of Aid Commitments. Against this background of bettermedium-term aid projections, implementing agencies also needconfirmation of specific aid commitments for the coming budget yearwith sufficient notice to take them into account for budget preparation
48 The Budget Reform Design Team has also pointed out that, to enable regions to proclaim their budgetson time, it may be necessary to appropriate the federal subsidy separately and in advance of the rest ofthe federal budget. (See Budget Reform Design Manual, Version 2.0, Annex 3.)
58 Chapter S
(by end-December if the proposed Financial Calendar is to beobserved).
+ Aid Focus. Aid agencies and the government together should ensurethat aid, through whichever channel of disbursement, is allocated onlyto the priorities defined in the government's strategic planningdocuments (SPs, PIP, etc).
* Aid Modalities. The government should continue to encourage aidagencies to move towards unearmarked Channel I support. This is notsimply a matter of exhortation. The government needs to address aidagencies' genuine concerns about accountability, reporting anddialogue.49 At the same time, aid agencies should recognize that theearmarking of funds has high costs in additional administration anddelay.
Offset and Regional Expenditure Ceilings
123. The offset system continues to be an obstacle to the rational utilization of aid.Without departing at all from the principle of regional equity, the followingimprovements could be adopted:
* The planning bodies' projections of aid flows should be publishedwhen ceilings are announced, so that the offset is transparent.50 Insubsequent years, these projections should be compared with actual aidflows, and, if there are significant divergences, adjustment should bemade. The aim should be to achieve equity in the actual flow ofresources to regions (and within regions to zones) not just in theplanned resource flows.
* Ceilings for Treasury funds and for aid should be clearly separated,and it should be made clear that if regions are unable to utilizeavailable aid in a given budget year, it will normally remain availablein subsequent years.5 ' If implementing agencies can clearly see that
49 These issues will have additional relevance when the modalities for HIPC debt relief are negotiated.
50 The budget refonn design team has already made a recommendation along these lines. The BudgetDesign Manual, Version 1.0: ¶7.22 includes a recommendation to: require that the regional affairsdepartment of MEDAC document the projects it has considered in adjusting a region's subsidy.Documentation would include the project agreement and proposed disbursements for the upcomingfinancial year.
51The standard formats for budget call circulars in Version 2.0 of the Budget Reform Design Manualalready stipulate that: The ceiling for your Capital Budget Request ..has four types of finance:(i) Treasury; (ii) Retained revenue; (iii) Assistance; (iv) Loan. Your request should strictly conform

Capacity Building In Public Finance Management 59
aid is additional, and can be drawn down over a practical time frame,they should be ready to invest the additional effort needed to utilize aidfunds. 52
* The sharing of experience from other countries, who are operatingsome type of off-set, may be a useful illustration of options.
Implications for Future PER Work
124. There are implications both for the scope and for the timing of future PERs. Asregards timing, it is proposed to undertake future PERs much earlier in the fiscal year (soas to support the planning phase, rather than the budgeting phase, of the financialcalendar). As regards their scope, future PERs be important in reconciling governmentand donor estimates of aid flows, and could help extend the sector dialogue associatedwith the SPs into a broader dialogue on overall public expenditures and enhancing thepoverty impact of government and donor assistance. This could support further progresstowards provision of aid in the form of unearmarked budget support.
to these ceilings, and ceilings earmarkedfor one type offinance cannot be transferred to other types.A similar provision is in the call circular for the recurrent budget.
52 A similar point is made in the regionalization Study, 12.22:

CHAPTER 6: PER PROCESS
The 1999 PER aims at adopting additional recommendations from theGuidance on Public Finance Management agreed by the Special Programof Assistance for Africa. Since 1997, the PER has already been carriedout in partnership with the government and donors. The next move is torefocus the PER from a product-driven exercise (focused on the finalreport) to a process-driven exercise which is fully owned and led by thegovernment. Therefore, the 1999 PER aims at initiating a continuousPER follow-up process, better linked with the budget cycle, that ensuresthe follow-up to PER recommendations, and improves the aid dialogue. Itis proposed to undertake future PERs much earlier in the fiscal year tosupport the planning phase, rather than the budgeting phase, of thefinancial calendar. As regards scope, it will be necessary to shift thefocus of the next PER from budget inputs to the effectiveness andefficiency of public spending. This aspect will become particularlyrelevant in the context of Ethiopia's envisaged participation under theHIPC debt initiative.
125. The government and donor teams have agreed that the annual PER should evolveinto a coordination exercise running in parallel with the different stages of the annualplanning and budgeting cycle. The government started in this new direction by sharingthe May mission's Aide Memoire with the donor community and discussing some of thepreliminary findings in a meeting chaired by the Vice Minister of Finance. This sharingof information was welcomed by the donor community. Subsequently donors prepared anote with issues for follow-up, comments on the findings of the PER, and suggestions forthe final report. This very constructive dialogue provides a good basis for a continuousPER follow-up process.
126. With a view to ensure a systematic dissemination of the PER findings and actionon the recommendations made, the government and the PER team agreed in principle-atthe end of the main mission in May 1999-on subsequent activities, consultations, andevents. This systematic follow-up should help strengthen the dialogue between thegovernment and its external partners on expenditure priorities, aid allocation andmanagement. The idea to organize one or more follow-up workshops a few months afterthe completion of the PER mission was welcomed by all parties involved.
127. More recently, the government's and the donors' PER teams explored the optionsfor holding two workshops in early fall to focus on the recommendations and findings ofthe 1999 PERReport.
62 Chapter 6
* A two-day workshop to be held in Ethiopia, in September, 1999, withparticipation by officials from MoF, MEDaC, sectoral ministries(including Health, Education, Transport), and the regions.5 3
+ A smaller workshop in Brussels, with participation of a high levelEthiopian Delegation (mainly MoF and MEDaC) at the end of October1999. 4
128. The September workshop in Ethiopia-besides presenting and discussing theconclusions and recommendations of the draft PER-report-will focus on the linkagebetween policy formulation, planning, and budgeting. The timing of this workshop isopportune since it coincides with the preparation of the MEFF and the IPF. Both, MEFFand IPF are inputs for the PIP, which will be prepared around December 1999 forpresentation to the Council of Ministers. The workshop participants would discuss thecurrent planning process and identify options for improvement in the following areas:
+ linkage between macro and sector expenditure targets;
* linkage between the central and line ministries budget planningprocess;
- information flows between the center and the regions and vice versa;and
* information flow between the government and the donors and viceversa.
129. The proposed topics address a broad-based audience. In addition to thegovemment's PER team, led by the Vice-Minister of Finance, it will be useful to secureparticipation of other main players from MoF, MEDaC, and line ministries, as well asregional authorities. It would be ideal to have a good representation from the PFP teamas well as the PIP team. From the donors' side, one would expect the PER team (about10 participants), basically operating as a resource team, to be available for inputs in thediscussions. As to a wider involvement of the donor community represented in AddisAbaba, it may be preferable to limit the donor participation in the two-day workshop tothose who collaborated on the PER team. This will allow the government to be the mainbeneficiary of the workshop and will facilitate frank and open discussions amonggovernment players. For a broader donor information, it could be useful to schedule ahalf-day briefing on the outcome the day after the workshop. Like the discussion of theAide Memoire, the Vice-Minister of Finance may wish to chair this workshop.
53 The outcome and agreements of the Debre Zeit workshop are attached in the Annexes.
54 The outcome and agreements of the Brussels workshop are attached in the Annexes. The Brusselsworkshop served as the launch meeting for the 2000 PER.

PER Process 63
130. Where the September workshop is meant to be practical and technical with abroad audience, the second workshop will have a more selected group of participants.The aim is (1) to focus on the recommended and agreed actions resulting from the DebreZeit workshop; (2) to have more in-depth discussions on how to approach and managethe future PER process; and (3) to jointly draft the Concept Paper for the PER 2000.
131. The workshop's output would be recommendations for actions (with well-definedscope and timing) that address weaknesses in identified areas of the budget process. Itwould help sharpen the focus on allocating expenditures to priority areas. It should alsohelp develop options to improve the flow of information between the center and theregion and between the government and donors. To continue the dialogue, one concreteaction from the seminar should be the forming of a PER working group, with broad-based participation from the government (region and center) and donors.
132. There are also important implications both for the scope and for the timing offuture PERs. With regards to timing, future PERs launched much earlier in the fiscalyear to support the planning phase, rather than the budgeting phase, of the financialcalendar. With regard to scope, future PERs will be important in reconciling informationon aid flows, and extending the sector dialogue on SPs into an dialogue on publicexpenditures. While recent PERs have focused mainly on budget inputs, it will benecessary to shift the focus of the next PER to the effectiveness and efficiency of publicspending. This aspect is particularly relevant in the context of Ethiopia's plannedparticipation under the HEPC debt initiative.


ANNEXES AND ANNEX TABLES

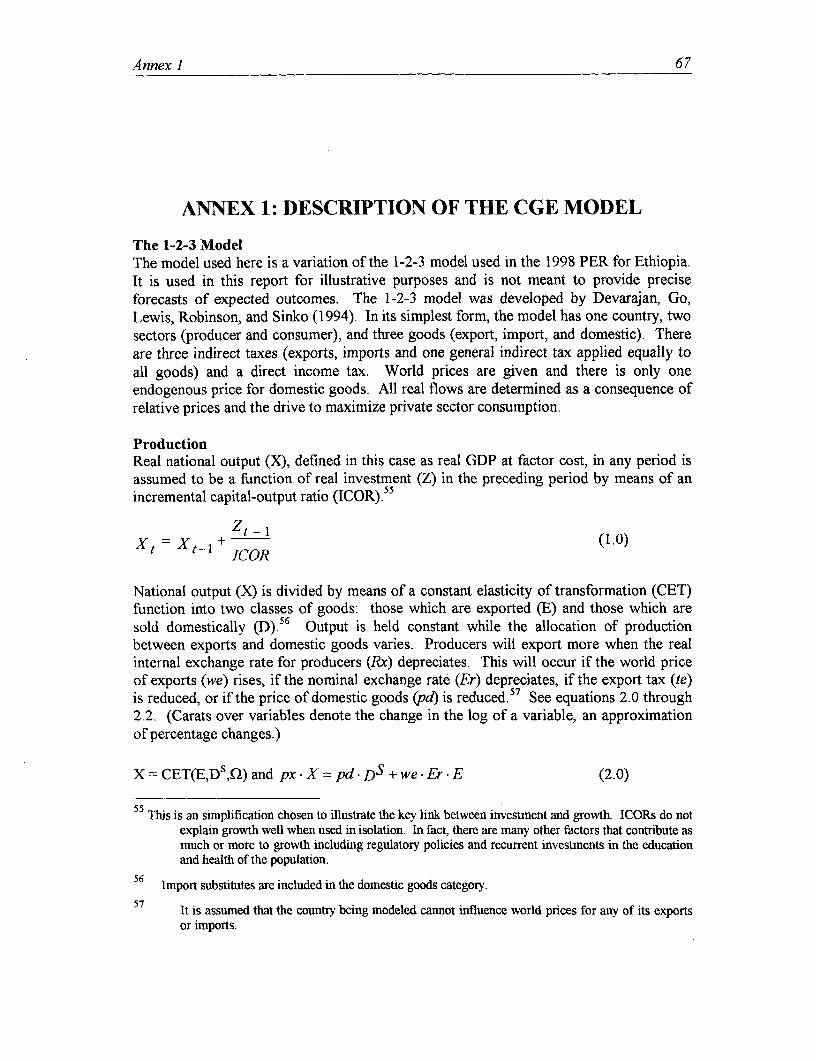
Annex 1 67
ANNEX 1: DESCRIPTION OF THE CGE MODEL
The 1-2-3 ModelThe model used here is a variation of the 1-2-3 model used in the 1998 PER for Ethiopia.It is used in this report for illustrative purposes and is not meant to provide preciseforecasts of expected outcomes. The 1-2-3 model was developed by Devarajan, Go,Lewis, Robinson, and Sinko (1994). In its simplest form, the model has one country, twosectors (producer and consumer), and three goods (export, import, and domestic). Thereare three indirect taxes (exports, imports and one general indirect tax applied equally toall goods) and a direct income tax. World prices are given and there is only oneendogenous price for domestic goods. All real flows are determined as a consequence ofrelative prices and the drive to maximize private sector consumption.
ProductionReal national output (X), defined in this case as real GDP at factor cost, in any period isassumed to be a function of real investment (Z) in the preceding period by means of anincremental capital-output ratio (ICOR).'5
zt - Ixt = + ztCl (1.0)
National output (X) is divided by means of a constant elasticity of transformation (CET)function into two classes of goods: those which are exported (E) and those which aresold domestically (D).5 6 Output is held constant while the allocation of productionbetween exports and domestic goods varies. Producers will export more when the realinternal exchange rate for producers (Rx) depreciates. This will occur if the world priceof exports (we) rises, if the nominal exchange rate (Er) depreciates, if the export tax (te)is reduced, or if the price of domestic goods (pd) is reduced.5 7 See equations 2.0 through2.2. (Carats over variables denote the change in the log of a variable, an approximationof percentage changes.)
X = CET(E,Ds,Q) and px * X = pd DS + we Er .E (2.0)
5 5 This is an simplification chosen to illustrate the key lirik between investment and growth. ICORs do notexplain growth well when used in isolation. In fact, there are many other factors that contribute asmuch or more to growth including regulatory policies and recurrent investments in the educationand health of the population.
56 Import substitutes are included in the domestic goods category.
57 It is assumed that the country being modeled cannot influence world prices for any of its exportsor imports.

68 Annex I
E we *Er/ITes =x- Rr where Rx = pd and Te = (I + te) and x is a scale factor (2.1)
A A A AE-Ds = Q (we Er- Te- pd) (2.2)
AbsorptionBy the same token, the consumer and government sectors maximize a constant elasticityof substitution (CES) function by choosing between domestic goods and imported goods(M). See equations 3.0 through 3.1. Consumers and the government will import more ifthe real internal exchange rate (Rq) appreciates. This will occur if the world price ofimports (wm) falls, if the nominal exchange rate (Er) appreciates, if the import tariff (tm)is reduced, or if the price of domestic goods (pd) is increased.
Maximize Q = CES(DD,M,a) subject to pq * Q = pd * DD + wm Er M (3.0)
D = q. Rq'fwhere Rq = wm Er Tm and Tm = (1 + tm) and q is a scale factor (3.1)
A A A A
LD) -M=f a (wm+ Er+ Tm- pd) (3.2)
Note that all elements of absorption are measured before taxes. Thus the post-tax(market price) concept utilized in the national accounts for domestic absorption would beexpressed as:
pq (+ts). QD =Er wm (l+tm) (l+ts) M+pd (l+ts) DD (3.3)
or
pq* (1 + ts) QD = pq (1 + ts) (C + G + Z) (3.4)
where ts is an indirect tax on all domestic absorption, C is private consumption, G isgovernment consumption, and Z is total investment.
The balance of paymentsThe difference between exports and imports, adjusted for net transfers to the government(ft) and the private sector (re), is defined as external savings which is financed by netforeign borrowing (B) as shown in equation 4.0.58 The balance of payments can also berewritten in ratios where X is the ratio of exports to imports where X increases with netborrowing or reserve drawings. See equations 4.1 through 4.2.
wm n M -we E -ft-re = B (4.0)
ss Net transfers, in both cases, include interest receipts and payments, dividend receipts andpayments, grants, and other forms of transfers.

Annex 1 69
M we we*E B+ft+re-=A. where A= = +1 '4.1'
E wm wm M we*E
. \A AM-E= A.+we-wm (4.2)
Domestic price adjustmentCombining equations 2.2, 3.2, and 4.2 allows us to solve for the one endogenous price inthe model, pd.
A A 1 A A A A Apd=Er+ .[we-(Q+l)+wm-(of-l)+Tm.ca-TeQ2+A] (5)
Note that a terms of trade improvement or increased capital inflows will increase pdwhile a lower import tariff will always decrease domestic prices.
GDP DeflatorMultiplying national output by the GDP deflator, px, gives GDP at factor cost in nominalterms. Percentage changes in the GDP deflator are assumed to be a simple function ofmoney growth, percent changes in the velocity of money and real growth in output.59
A A
A MQMt +t - + MQMt (6)
pxt =(6)1 + Xt
Trade-off between exchange rate and domestic price adjustmentConstructing the GDP deflator puts a constraint on equation 5 above because pd is alsothe weighted average of the GDP deflator, px, and the price of exported goods, pe.
px X - we -E Erpd = (7)
D
Solving equations 6 and 7 simultaneously determines how much adjustment to a shockwill be absorbed by domestic price changes versus nominal exchange rate movements.
Real internal exchange ratesWe can calculate the real internal exchange rates faced by producers (Rx) and consumers(Rq) by subtracting the percent change in pd from the percent change in tariff adjustedworld prices:
59 This is another simplification. This equation could be replaced by an econometric estimate.

70 Annex 1
A A A( 'A A(cTA(Rx =(we-wm) ) + Q)-(T +TQ) (C ) (8)
A A A Q +1 A A In) Rq = -(we -wm) _ +( (le+Tm)\ _ ._(9)
(U+OQo +Q +Q
From equations 5.0 and 6.0, it can be seen that a reduction in import tariffs would resultin a real internal exchange rate depreciation for producers and a real internal exchangerate appreciation for consumers. Thus, exports and imports would both rise.
Government sectorGovemment tax revenues (T) are the sum of direct taxes, indirect taxes on domesticgoods, import tariff receipts, and export tariff receipts.
T=ty. Y+ts pq QD+Er (tm. wm M+e we E) (10)
where
Y =px. X+ tr pq + re- Er (11)
Expenditures consist of government consumption (G), subsidies (SUB), net externaltransfers (ft), net domestic transfers (tr), and investment (Zg). 6 0 The entire budgetconstraint is:
T- pq (I +ts) G- pq tr -Er ft= Sg= Zg (12)
where G is real government expenditure before taxes, Sg is government savings and Zg isgovernment expenditures before taxes.
Private SectorThe budget constraint for the private sector is set up in a similar way so that privatesavings equals private investment. Thus, income less direct taxes less consumption atmarket prices equals private savings (a fixed share of income multiplied by income)equals investment:
Y- ty. Y-pq* (1 + ts)- C = s Y =Zp (13)
National Accounts IdentitiesIn addition to equations 1.0 and 2.0, we also require the sum of external savings,government savings and private savings to equal investment.
pq- (l+ts). (Zp+Zg) =Er-B+Sg+s. Y (14)
60 Net transfers include non-tax revenues, interest receipts and payments, dividend receipts and
payments, grants, and other forms of transfers.

Annex 1 71
Equilibrium ConditionsIn addition to equations 4, 12, 13, and 14, the model solves for equilibrium in the productand consumer markets so that:
D D = & (15)
and
QD =QS (16)

72 Annex I
Table B1: Summary and Description of Variables
Endogenous Variables: Exogenous Vaniables:E: Export good G: Real government demand, at factor costsM: Import good tr: Govermnent transfersD5: Supply of domestic goodDd: Demand for domestic goodQ5: Supply of composite goodQd: Demand for composite goodT: Tax revenueSg: Government savingsSp: Private SavingsZg: Government investment, at factor costsZp: Private investment, at factor costsX: Aggregate output, at factor costsY: Total incomeC: Private consumption, at factor costs
Endogenous Variables: Exogenous Variables:GDP: Gross domestic product at factor cost ft: External transfers to government
re: External remittances to private sectorB: Net external borrowingjMQM. Money and quasi-money
Endogenous Variables: Exogenous Variables:pd: Producer price of domestic good we: World price of export goodpq: Price of composite good te: Export tax ratepx: Price of aggregate output wm: World price of import goodEr: Nominal exchange rate (Birr/US$) tm: Tariff rateRx: Real internal exchange rate for producers t: sales/excise/value-added tax rateRq: Real internal exchange rate for consumers ty: direct tax rate
:. ---. ; ; EY InD .,- ,S, s, X,;% s .. ;~~~~~~~~~~~~~~~~~~~~~~~~~~~~~~~~~~~~~~. .. .. Endogenous Variables: Exogenous Variables:
s: Average savings rate for private sectorn: Producer transformation elasticityo: Consumer substitution elasticityp: Trade diversion elasticityICOR: Incremental capital-output ratiov: Velocity of money

Annex 2 73
ANNEX 2: OUTCOME AND RECOMMENDATIONS OFDEBREZEIT WORKSHOP
In line with the agreements reached during the main PER mission in May 1999, the donorPER team returned to Ethiopia to discuss the draft PER main report and hold a workshopon the PER recommendations.
Under the chairmanship of Ato Hailemelekot T/Giorgis, Vice Minister of Finance, a two-day workshop discussed the draft 1999 Public Expenditure Review for Ethiopia onSeptember 13-15 in Debre Zeit.
The workshop brought together some 25 government officials from the MoF, MEDaC,the central ministries for education, health, transport and communications, 15 participantsrepresenting ten regions of the Federation, and 11 donors representing the donor PERteam. The participation by the regions was a first for a PER and resulted in veryenthusiastic and stimulating discussions. It also highlighted the large information gapbetween the center and the regions, as well as between MoF/MEDaC and the central lineministries. The workshop provided a welcome opportunity to share with the regionssome of the latest developments Ethiopia is implementing in the area of budgetmanagement. The workshop also revealed that at least some regions have substantiveimplementation capacity and could be more effective and efficient in budget planning andimplementation if they had more timely information from the center.
Following are the main outcomes of the mission and updates of the macroeconomic data.
Macroeconomic Developments
*: Fiscal Outcome for FY98/99: The Government shared the updated (pre-actual)fiscal outcome for FY98/99 with the mission. In comparison to the PER data base,the latest fiscal estimates indicate that defense expenditures may reach a level of Birr3,406 million (compared to Birr 2,871 million projected under the PER). As share inGDP, this implies that defense expenditures will be close to 7 percent, and 1.2percentage points higher than the PER estimate. Consequently the fiscal deficit (cashbasis) is projected at 7 percent of GDP (before grants) and at 5.1 percent of GDP(after grants). The monetary data indicate that the additional defense expenditureswere probably funded through domestic credit from the banking system. Thefollowing table includes both the PER projections and the latest fiscal estimates forFY98/99:
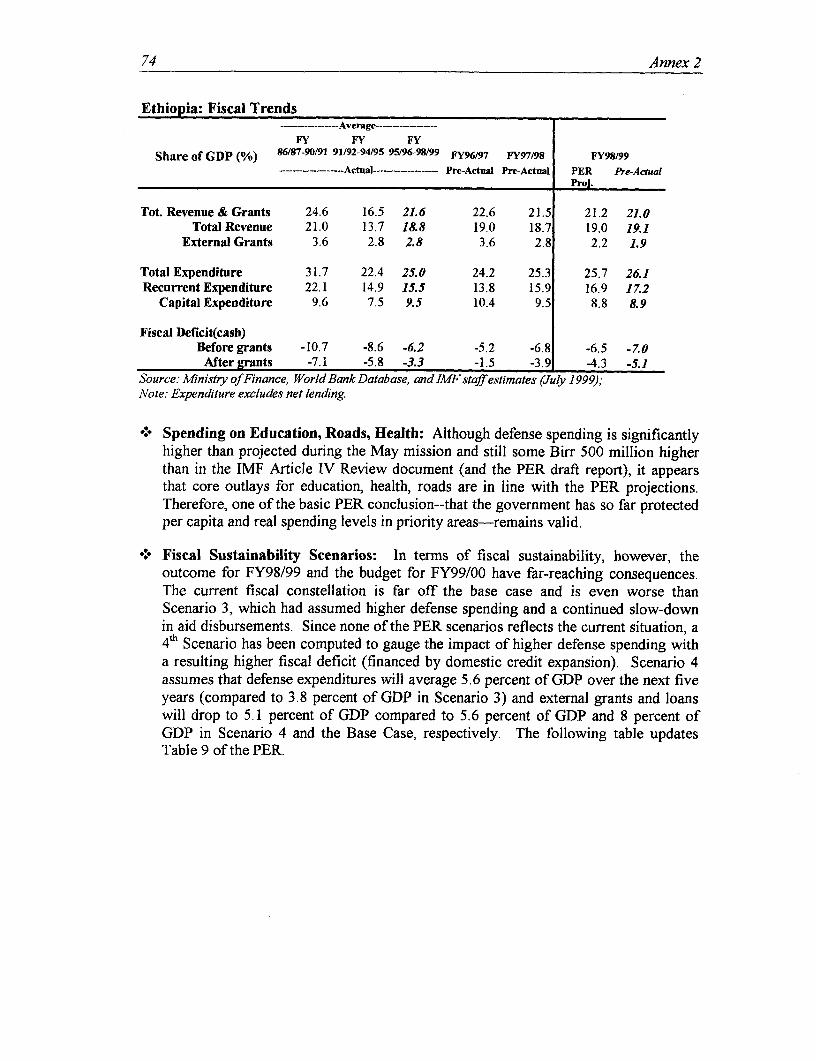
74 Annex 2
Ethiopia: Fiscal Trends-- Average-----------
I;Y FY FY
Share of GDP (%) 86/87-90191 91/92-94/95 95/96-98/99 FY96/97 FY97/98 FY98/99------- -Actal-------------- Pre-Actual Pre-Actual PER Pre-Actual
Proj.
Tot. Revenue & Grants 24.6 16.5 21.6 22.6 21.5 21.2 21.0Total Revenue 21.0 13.7 18.8 19.0 18.7 19.0 19.1
External Grants 3.6 2.8 2.8 3.6 2.8 2.2 1.9
Total Expenditure 31.7 22.4 25.0 24.2 25.3 25.7 26.1Recurrent Expenditure 22.1 14.9 15.5 13.8 15.9 16.9 17.2
Capital Expenditure 9.6 7.5 9.5 10.4 9.5 8.8 8.9
Fiscal Deficit(cash)Before grants -10.7 -8.6 -6.2 -5.2 -6.8 -6.5 -7.0Aftergrants -7.1 -5.8 -3.3 -1.5 -3.9 -4.3 -5.1
Source: Ministry of Finance, World Bank Database, and IMFstaff estimates (July 1999);Note: Expenditure excludes net lending.
: Spending on Education, Roads, Health: Although defense spending is significantlyhigher than projected during the May mission and still some Birr 500 million higherthan in the IMF Article IV Review document (and the PER draft report), it appearsthat core outlays for education, health, roads are in line with the PER projections.Therefore, one of the basic PER conclusion--that the government has so far protectedper capita and real spending levels in priority areas-remains valid.
: Fiscal Sustainability Scenarios: In terms of fiscal sustainability, however, theoutcome for FY98/99 and the budget for FY99/00 have far-reaching consequences.The current fiscal constellation is far off the base case and is even worse thanScenario 3, which had assumed higher defense spending and a continued slow-downin aid disbursements. Since none of the PER scenarios reflects the current situation, a4th Scenario has been computed to gauge the impact of higher defense spending witha resulting higher fiscal deficit (financed by domestic credit expansion). Scenario 4assumes that defense expenditures will average 5.6 percent of GDP over the next fiveyears (compared to 3.8 percent of GDP in Scenario 3) and external grants and loanswill drop to 5.1 percent of GDP compared to 5.6 percent of GDP and 8 percent ofGDP in Scenario 4 and the Base Case, respectively. The following table updatesTable 9 of the PER.

Annex 2 75
Macroeconomic Scenarios-Outcomes
EFY 1992 1993 1994 1995 1996 1997 93-97FY 98/99 99/00 00/01 01/02 02/03 03/04 00-04
Public SpendinglGDP (%/6) alBase Case 23.7 24.3 25.2 25.8 26.4 26.8 25.7Scenario 1 - Weak Revenue 23.7 23.3 23.9 24.0 24.4 24.9 24.1Scenario 2 - ToT Shock 23.7 24.5 25.6 26.7 27.7 28.5 26.6Scenario3-High Defense/Low Aid 23.7 22.8 23.1 23.5 23.8 24.1 23.5Scenario 4-Negligible reduction in 23.9 24.5 25.2 25.5 25.8 26.1 25.4
defense spending/drastic cutbacks in aidGrowth, Real per Capita Spending (%/e) a/
Base Case -0.6 2.8 7.1 6.4 6.7 6.5 5.9Scenario 1-Weak Revenue -0.6 -1.5 5.6 4.0 5.6 6.0 3.9Scenario 2- ToT Shock -0.6 3.4 5.4 5.8 5.4 5.1 5.0Scenario 3 -High DefenselLow Aid -0.6 -4.4 4.0 4.5 4.8 4.6 2.6Scenario 4 -Negligible reduction in -0.4 2.4 4.2 4.0 4.0 4.1 3.7
defense spending/drastic cutbacks in aidGrowth, Real GDP per Capita (%/0)
Base Case 4.4 2.4 2.9 3.4 3.9 4.4 3.4Scenario 1 -Weak Revenue 4.4 2.4 2.7 3.1 3.4 3.8 3.1Scenario 2 - ToT Shock 4.4 2.4 3.0 3.3 3.7 4.0 3.3Scenario3-High Defense/Low Aid 4.4 2.4 2.3 2.7 3.1 3.3 2.8Scenario 4 - Negligible reduction in 4.4 2.2 1.7 2.0 2.4 2.6 2.2
defense spending/drastic cutbacks in aidGrowth, Real Cp per Capita (%/ )
Base Case 0.4 -2.1 2.7 3.1 4.1 4.7 2.5Scenario 1-WeakRevenue 0.4 -1.0 2.8 3.4 3.8 4.2 2.6Scenario 2- ToT Shock 0.4 -3.1 0.2 0.5 1.4 1.8 0.1Scenario 3 -igh Defense/Low Aid 0.4 -2.7 1.9 2.2 3.1 3.6 1.6Scenario 4 - Negligible reduction in -1.0 -1.2 1.4 1.6 2.6 3.0 1.5
defense spending/drastic cutbacks In aida/ Excludes domnestic and extenial interest paymnents due. Population growth rate is assumied to bee 2.5 pecent peranU.
*. Scenario 4-Neglible reduction in defense spending/drastic cutbacks in aid: On acumulative base, over the next five years, total growth will only be 11.4 percentcompared to 18.2 percent in the Base Case and 14.6 percent in Scenario 3. Totalgrowth in real consumption per capita will be only 7.6 percent over the next fiveyears, that is roughly half of the consumption growth that could be achieved under theBase Case. These estimates are on the conservative side, since second round effectsof a prolonged war, such as a continuous decline in investment, drop in overalleconomic activity (e.g., signs are already showing in the tourism sector) wouldexacerbate the pressure on private consumption through further reducing availableincome. The current situation deviates significantly from the outlook portrayed in thePER, which is premised on corrective action-to be taken on a timely basis witheffect for FY99/00--with regard to expenditure composition and levels in FY99/00.
Subsequent to the overview of the main findings of the draft PER and discussion, it wasagreed to split the workshop into three working groups to develop recommendations inthree key areas:
76 Annex 2
(i) Integration of aid in the budget process;(ii) Center/Region linkages in budget planning; and(iii) Linkage between macroeconomics and sectoral planning.
Following rich discussions in the working groups, a plenary session was held to identifypriority actions for follow-up. Four common themes emerged.
Financial Calendar
The participants welcomed the proposed Financial Calendar, which aims at providingmore timely information on indicative budget planning figures as well as budget ceilingsand regional subsidies. The participants stressed that adhering to the proposed FinancialCalendar was crucial for improving effectiveness and efficiency of budget planning. Thisyear (preparation for EFY 1993) is a transition for testing the practicality of the proposedtimetable before it is brought into law. Every effort will be made to adhere to thecalendar and provide federal public bodies with indicative planning figures for EFY1993-95. In the course of the discussion it became clear that even provisional estimates of thelikely regional subsidy would be helpful in facilitating the regional budget planningprocess. Therefore, MEDaC should provide regions with indicative estimates of theregional subsidy prior to the January deadline for budget calls.
PIP/PEP
There was a broad consensus on the desirability of moving rapidly from a PIP to acomprehensive PEP. At the federal level the preferred course would be to study theimplication of expanding the PIP into a PEP this year with a view to preparing a concreteproposal for a phased introduction starting in EFY1994. At the regional level, however,since the majority of public spending falls within the sector programs for health andeducation, there is already a quasi PEP (planning of both recurrent and capitalexpenditure) in place. Moreover, since the regions have to begin preparation of their nextfive-year plan, there might be an opportunity to deepen this approach and embark directlyon a PEP without the intermediate step of a PIP. It was agreed to pilot this approach inone or two regions where the implementation capacity would permit.
At the same time, it was agreed that it would be useful to better coordinate the SPs(education, health, roads) with the PIP/PEP process. The group recommended setting upa permanent working group with participation from MEDaC, MoF, the PMO, the sectoralministries, and the regions to share information, identify and explore options forharmonization of these different initiatives.
The existing macroeconomic group, currently in charge of macroeconomic forecasting,would extend its mandate to prepare forecasts that take into account the recurrentexpenditure implications of capital spending as well as the sources of financing of suchexpenditure, in particular with regard to the sector programs. At the same time, the group
Annex 2 77
would strengthen its collaboration with the regional authorities, implementing agenciesand other stakeholders by utilizing available information and sharing their forecasts.
Integration of Aid FlowsThe workshop recommended specific steps to improve the system of aid monitoring andutilization. MEDaC plays a central role in collecting the relevant information and sharingit on a timely basis with stakeholders. As a concrete first step, participants suggested thatMEDaC brief partners (donors, MoF, sector ministries, and regional offices that areaccountable for donor budgets) on the status of the PIP/PEP. In this context, MEDaCshould discuss its current reporting format and modify it-if necessary-to simplifyreporting and provide information that other users may need. It was suggested to form atechnical working party (comprising of the government and donors) to work on thepreparation of consolidated aid information and forecasts. The eventual aim would be tohave a data base that would be continuously updated and available throughout the year,and provide the basis for aid forecasts at the time of the budget call.
PER ProcessThese recommendations have implications for the joint PER process. There was strongsupport for linking the PER timing with the budget cycle, in particular to start the processearlier than in previous years. A PER mission in October/November to support thegovernment's macroeconomic forecasting team would provide timely inputs in thebudget preparation.
To guide future PERs it was recommended to form a permanent PER steering groupinvolving key donors and the IIMF and federal ministries with representation by theregions on a rotating basis. Part of the working groups terms-of-reference would includeassisting the roll-out of the PEP to the regions and improving the integration of aid in thebudget process.
A number of specific suggestions were made with regard to the focus of the next PER,including evaluation of the development impact of public expenditure, assessment of the"fungibility" issue, review of the off-set system and the budget formula, assessment ofthe aid management system, and streamlining donor reporting mechanisms. The scope,participation, and timing of the next PER will be discussed at the envisaged follow-upworkshop in October in Brussels.


Annex 3 79
ANNEX 3: GOVERNMENT OF ETHIOPIA COMMENTSON DRAFT REPORT
The Government provided the Bank PER team with comments on the draft PER that hadbeen discussed in the Debre Zeit workshop in September,1999. The following commentsprovided by the Vice Minister Ato Hailemelekot T/Giorgis (dated October 13, 1999)have been taken into account in the final PER.
Page V Paragraph 14
In the case of drafting the Financial Legal Framework in the PER document it hasbeen mentioned that the drafting of 70 regulations directives and guidelines isundertaken. But the number 70 is an irrelevant figure. It has to be noted that theregulation is one for Federal Government and one each for Regional Governmentsindeed directives are many. But it is not possible to state specific number. So farabout 10 directives has been adopted. The drafting of directives is a continuousprocess and as a result it is expected to be drafted others in the near future includingthe budget calendar.
Page VII The Budget offset system
Please look on the paper produced by MEDaC on this issue presented at the DebreZeit meeting.
Page 15 Paragraph 32
Eritrea's defense Expenditure data are not presented for comparison.
Page - 24 Paragraph 53
It is stated that contributions made by private enterprises could reduce the taxableprofit and thus have a negative impact on tax revenue.
The contribution is not related with the enterprise profit. It is from individuals ownincome. It has no relation with the business. The contribution is from theindividual resource. Indeed the source of the individual income could be theenterprise but the contribution is made from the individual purse generated aftertax.

Annex 4 81
ANNEX 4: OUTCOME AND RECOMMENDATIONS OFBRUSSELS WORKSHOP
Ethiopia PER: The Way Forward
A workshop organised by the EC in Brussels on 27/28 October 1999 discussed thefollow-up on the recommendations of PER 1999 and the way forward to PER 2000 andbeyond.
The workshop was attended by an eight-member delegation from the Government ofEthiopia headed by the Vice-Minister for Finance and a donor Team comprisingrepresentatives of EC, ADB and WB.
The main thrust of the workshop was to take stock of the current status of implementationof the 1999 PER recommendations and to look ahead to the 2000 PER.
*- The Government reported that a number of inter-ministerial groups had been set up asagreed in Debre Zeit.
*: The Government confirmed its commitment to move to an MTEF.
*: The was broad agreement on the need to work closer together between donors andgovernment in order to get a better understanding of aid flows and more accuratedata.
*: The workshop confirmed three defining characteristics of the PER exercise inEthiopia:
* Regular annual exercise* Collaborative exercise* Transition from product to process (dissemination and implementation of good
practices)
* On the 2000 PER, it was broadly agreed that the aim should be to deepen thecollective understanding of the issues in public finance management and that the wayforward should be in moving from analysis of issues to problem solving and fromshifting the focus from the center to the regions.
* At the end of the two-day workshop, the PER Teams briefed representatives ofEuropean Union Members States on the process and main recommendations of theEthiopia PER. The main thrust of the PER 2000 was also presented at the workshop.

82 Annex 4
CONTENT OF PER 2000
SECTION A - Standard PER issues
1. Overview and progress to date on implementation of past PER recommendations2. Developments in Budgetary aggregates
SECTION B - Special focus issues
1. AID MANAGEMENT AND INTEGRATION OF AID FLOWS IN THEPLANNING/BUDGETING PROCESS
* Information on aid flows across projects, regions and time (MTEF)e Timing for information flows and appropriate institutional arrangements (GoE
meeting regularly with donors)- Modalities of support (project, program, budget support)* Modalities of flows (channels 1, 2, 3)* Incentive structure and review of the budget off-set system* Integration of all aid flows (including food aid)* Fungibility analysis and ways of addressing donor concerns
2. INFORMATION SYSTEM IN PUBLIC FINANCE MANAGEMENT(REGIONS/CENTRE/DONORS)
* Flows: - Centre to regions and sub-regional entities- Regions (and sub-regional) to centre- Donor reporting mechanisms
* Information requirements* Timing and format of information* Use of the information to improve financial management
3. INDICATORS OF DEVELOPMENT IMPACT OF PUBLIC EXPENDITURE
* Going beyond input focus to output and outcome indicators* Review of cross country experience and best practice* Efficacy, Effectiveness and Efficiency indicators across sectors* Pilot assessments (beginning the process, building on SIPs experience, and
refinement over time)
Annex 4 83
4. MODELLING AND FORECASTING SCENARIOS
* Short and medium-term poverty reduction and growth scenarios under variousassumptions, including enhanced debt relief.
* Fiscal Sustainability in a post-conflict scenario
All the above items will be approachedfrom a problem solving perspective, including theissue of capacity building
ACTION PLAN
In order to accomplish these objectives, the PER Team proposed the following steps:
* Follow-up on Recommendations (Committees decided in the Debre Zeit workshop)* Timing to feed into planning/budgeting cycle* Immediate action: November workshop on integration of aid* Timetable for PER 2000: first PER report by mid-2000* Workshop on item 3 with participation from GoE (centre and regions), donors,
experts* PER missions, background papers, inputs from various Committees* Donor participation in the PER process
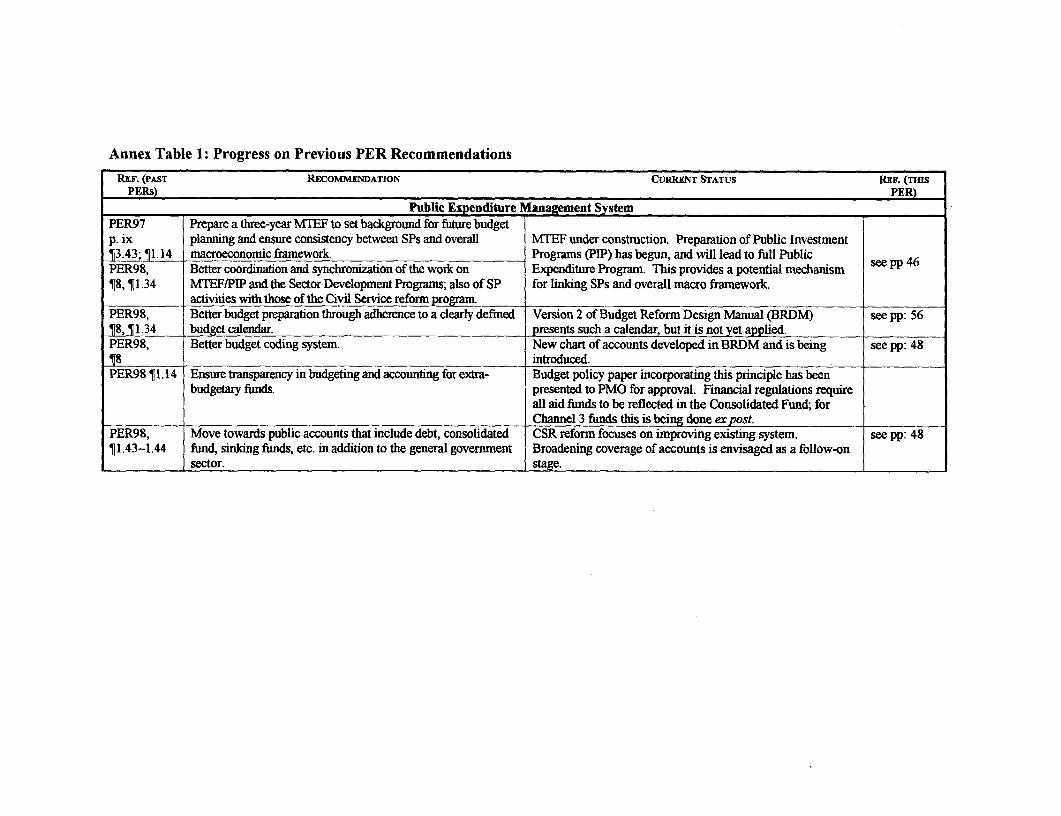
Annex Table 1: Progress on Previous PER Recommendations
REF. (PAST RECOMMEMDATION CURRENTSTATUS REF. (Tns
PERS) PER)
Public Expenditure Management System ___=_X_=PER97 Prepare a three-year MTEF to set background for future budgetp. ix planning and ensure consistency between SPs and overall MTEF under construction. Preparation of Public Investment13-43; 11.14 macroeconomic framework. Programs (PIP) has begun, and will lead to full PublicPER98, Better coordination and synchronization of the work on Expenditure Program. This provides a potential mechanism s¶8, ¶134 MTEF/PIP and the Sector Development Pfograms; also of SP for linking SPs and overall macro framework.
activities with those of the Civil Service reform program.PER98, Better budget preparation through adherence to a dearly defined Version 2 of Budget Reform Design Manual (BRDM) see pp: 5618,1¶1.34 budget calendar. presents such a calendar, but it is not yet applied.PER98, Better budget coding system. New chart of accounts developed in BRDM and is being see pp: 4818 introduced.PER98 11.14 Ensure transparency in budgeting and accounting for extra- Budget policy paper incorporating this principle has been
budgetary funds. presented to PMO for approval. Financial regulations requireall aid funds to be reflected in the Consolidated Fund; forChannel 3 funds this is being done ex post.
PER98, Move towards public accounts that include debt, consolidated CSR refonn focuses on improving existing system. see pp: 48¶1.43-1.44 fund, sinking funds, etc. in addition to the general govemrnent Broadening coverage of accounts is envisaged as a follow-on
sector. stage.
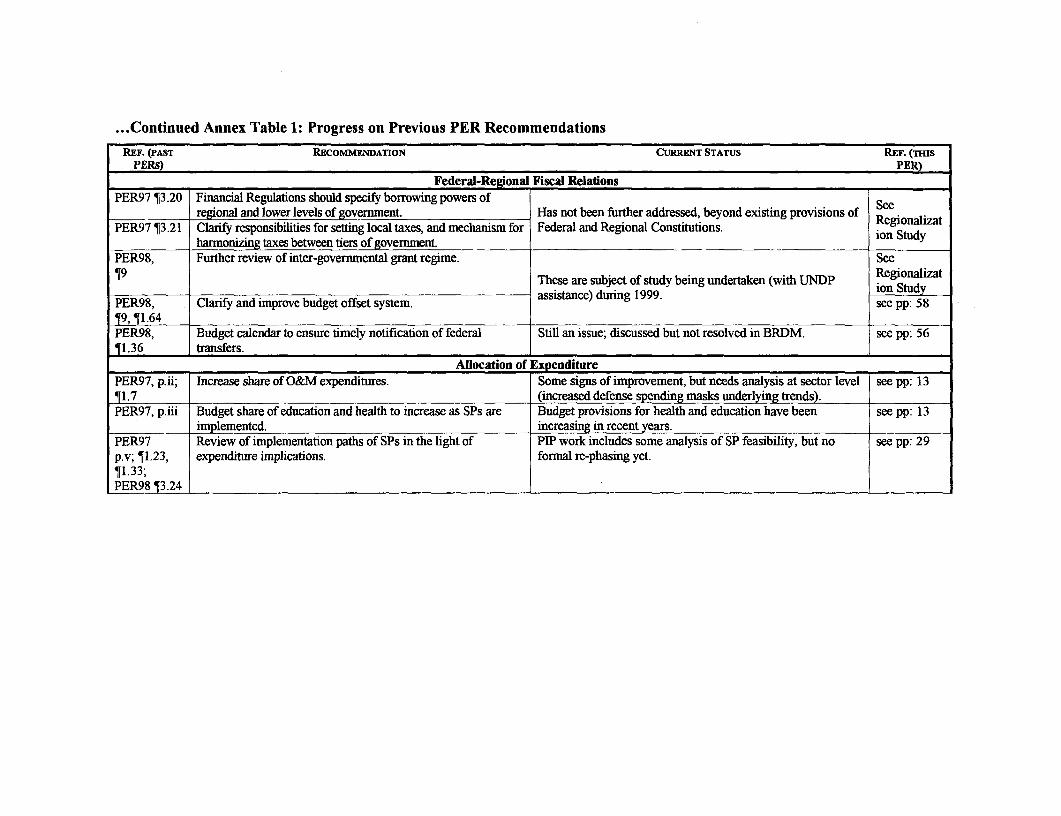
... Continued Annex Table 1: Progress on Previous PER Recommendations
REF. (PAST RECOMMENDATION CURRENT STATUS REF. (TinsPERS) -PER)
Federal-Regional Fiscal RelationsPER97 13.20 Financial Regulations should specify borrowing powers of S
regional and lower levels of government. Has not been further addressed, beyond existing provisions of SeePER97 ¶3.21 Clarify responsibilities for setting local taxes, and mechanism for Federal and Regional Constitutions. ion Study
hannonizing taxes between tiers of governmentPER98, Further review of inter-governmental grant regime. See¶9 These are subject of study being undertaken (with UNDP Regionalizat
assistance) during 1999. ion StudyPER98, Clarify and improve budget offset system. see pp: 58¶9, 11.64 _PER98, Budget calendar to ensure timely notification of federal Still an issue; discussed but not resolved in BRDM. see pp: 56¶1.36 transfers. I_I
___________ Allocation of Expenditure _
PER97, p.ii; Increase share of O&M expenditures. Some signs of improvement, but needs analysis at sector level see pp: 13_1.7 (increased defense spending masks underlying trends).
PER97, p.iii Budget share of education and health to increase as SPs are Budget provisions for health and education have been see pp: 13implemented. increasing in recent years.
PER97 Review of implementation paths of SPs in the light of PIP work includes some analysis of SP feasibility, but no see pp: 29p.v; ¶ 1.23, expenditure implications. formal re-phasing yet.11.33;PER98 13.24
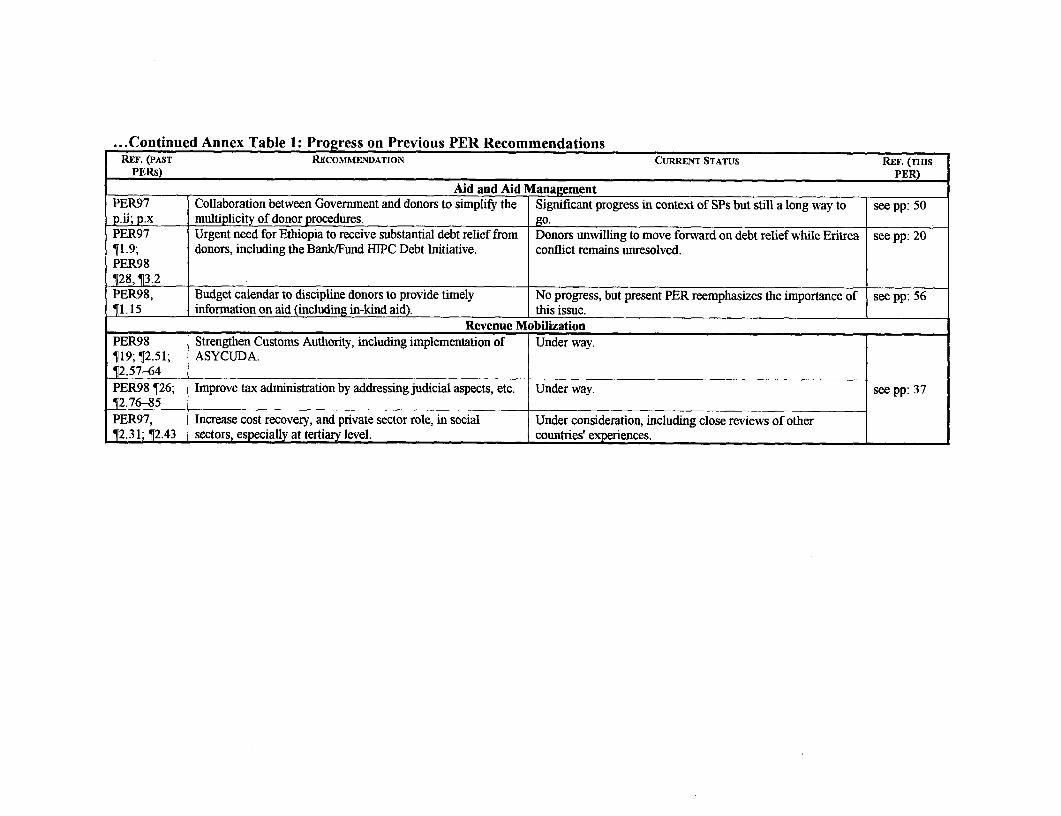
... Continued Annex Table 1: Progress on Previous PER RecommendationsREF. (PAST RECOMMENDATION CURRENT STATUS REF. (TMIS
PERS) PER)
Aid and Aid ]anagementPER97 Collaboration between Government and donors to simplify the Significant progress in context of SPs but still a long way to see pp: 50_p.ii- .X multiplicity of donor procedures. YO.PER97 Urgent need for Ethiopia to receive substantial debt relief from Donors unwilling to move forward on debt relief while Eritrea see pp: 20¶1.9; donors, including the Bank/Fund HIPC Debt Initiative. conflict remains unresolved.PER98¶28,¶T3.2PER98, Budget calendar to discipline donors to provide timely No progress, but present PER reemphasizes the importance of see pp: 56¶l.15 information on aid (including in-kind aid). this issue.
Revenue MobilizationPER98 Strengthen Customs Authority, including implementation of Under way.¶19; 12.51; ASYCUDA.T2.57-64 _PER98 ¶26; Improve tax administration by addressing judicial aspects, etc. Under way. see pp: 372.76-85
PER97, Increase cost recovery, and private sector role, in social Under consideration, including close reviews of otherI 2.31; T2.43 sectors, especially at tertiary level. countries' experiences.
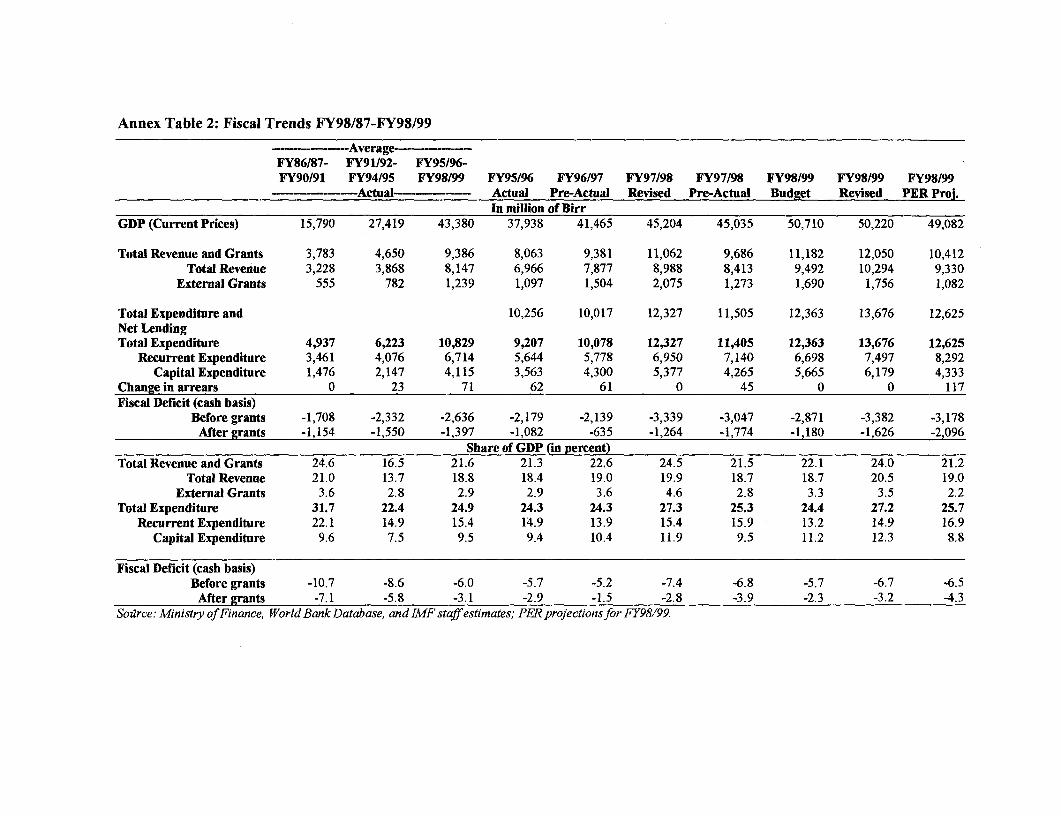
Annex Table 2: Fiscal Trends FY98/87-FY98199
-vrage---FY86/87- FY91/92- FY95/96-FY90/91 FY94/95 FY98/99 FY95/96 FY96/97 FY97/98 FY97/98 FY98199 FY98/99 FY98/99
------ Actual ---- Actual Pre-Actual Revised Pre-Actual Budget Revised PER Proj.In million of Birr
GDP (Current Prices) 15,790 27,419 43,380 37,938 41,465 45,204 45,035 50,710 50,220 49,082
Total Revenue and Grants 3,783 4,650 9,386 8,063 9,381 11,062 9,686 11,182 12,050 10,412Total Revenue 3,228 3,868 8,147 6,966 7,877 8,988 8,413 9,492 10,294 9,330
External Grants 555 782 1,239 1,097 1,504 2,075 1,273 1,690 1,756 1,082
Total Expenditure and 10,256 10,017 12,327 11,505 12,363 13,676 12,625Net LendingTotal Expenditure 4,937 6,223 10,829 9,207 10,078 12,327 11,405 12,363 13,676 12,625
Recurrent Expenditure 3,461 4,076 6,714 5,644 5,778 6,950 7,140 6,698 7,497 8,292Capital Expenditure 1,476 2,147 4,115 3,563 4,300 5,377 4,265 5,665 6,179 4,333
Change in arrears 0 23 71 62 61 0 45 0 0 117Fiscal Deficit (cash basis)
Before grants -1,708 -2,332 -2,636 -2,179 -2,139 -3,339 -3,047 -2,871 -3,382 -3,178After grants -1,154 -1,550 -1,397 -1,082 -635 -1,264 -1,774 -1,180 -1,626 -2,096
Share of GDP (in percent)Total Revenue and Grants 24.6 16.5 21.6 21.3 22.6 24.5 21.5 22.1 24.0 21.2
Total Revenue 21.0 13.7 18.8 18.4 19.0 19.9 18.7 18.7 20.5 19.0External Grants 3.6 2.8 2.9 2.9 3.6 4.6 2.8 3.3 3.5 2.2
Total Expenditure 31.7 22.4 24.9 24.3 24.3 27.3 25.3 24.4 27.2 25.7Recurrent Expenditure 22.1 14.9 15.4 14.9 13.9 15.4 15.9 13.2 14.9 16.9
Capital Expenditure 9.6 7.5 9.5 9.4 10.4 11.9 9.5 11.2 12.3 8.8
Fiscal Deficit (cash basis)Before grants -10.7 -8.6 -6.0 -5.7 -5.2 -7.4 -6.8 -5.7 -6.7 -6.5
After grants -7.1 -5.8 -3.1 -2.9 -1.5 -2.8 -3.9 -2.3 -3.2 -4.3Sozurce: Ministry of Finance, World Bank Database, and IMF staff estimates; PER projections for FY98/99.

Annex Table 3: Functional Classification of General Government Expenditures
-- Average--FY86/87- FY91/92- FY95/96-FY90/91 FY94195 FY98/99 FY95/96 FY96/97 FY97/98 FY97/98 FY98/99 FY98/99 FY98/99
-Actual- -- Actual Pre-Actual Revised Pre-Actual Budget Revised PER Proj.In million of Birr
General Administration 356 619 1,180 1,177 1,025 1,210 1,126 1,428 1,428 1,393Defense 1,518 709 1,627 762 787 2,070 2,090 983 1,783 2,871Economic Infrastructure 277 647 1,363 1,054 1,318 2,116 1,422 2,439 2,439 1,660
o/w Road Construction 135 438 1,059 797 905 1,544 1,176 1,951 1,951 1,359Economic Services & Dev. 1,206 1,434 2,129 2,138 2,453 2,278 2,056 2,229 2,229 1,871
o/w Agri. & Nat. Res. 605 844 1,372 1,158 1,293 1,448 1,442 1,837 1,883 1,595Social Services & Dev. 783 1,442 2,642 2,134 2,361 2,895 2,864 3,544 3,890 3,209
o1w Education 467 851 1,572 1,383 1,459 1,680 1,598 1,931 2,099 1,846Health 161 313 660 482 598 763 742 782 1,127 818
Other 795 1,372 1,886 1,941 2,134 1,757 1,847 1,739 1,908 1,621olw Interest & Charges 238 659 1,009 984 980 841 881 1,002 1,002 1,189
External Assistance 300 202 140 143 257 0 160 0 0 0Total Expenditure 4,936 6,223 10,828 9,206 10,078 12,327 11,405 12,362 13,676 12,624
Share of Total Expenditure (in percent)General Administration 7.3 9.8 11.0 12.8 10.2 9.8 9.9 11.6 10.4 11.0Defense 30.5 12.3 14.3 8.3 7.8 16.8 18.3 8.0 13.0 22.7Economic Infrastructure 5.6 9.6 12.5 11.4 13.1 17.2 12.5 19.7 17.8 13.1
o/w Road Construction 2.8 6.3 9.7 8.7 9.0 12.5 10.3 15.8 14.3 10.8Economic Services & Dev. 24.4 23.0 20.1 23.2 24.3 18.5 18.0 18.0 16.3 14.8
O/w Agri. & Nat. Res. 12.3 13.5 12.7 12.6 12.8 11.7 12.6 14.9 13.8 12.6Social Services & Dev. 16.0 22.8 24.3 23.2 23.4 23.5 25.1 28.7 28.4 25.4
o/w Education 9.5 13.6 14.5 15.0 14.5 13.6 14.0 15.6 15.3 14.6Health 3.3 5.0 6.0 5.2 5.9 6.2 6.5 6.3 8.2 6.5
Other 16.1 22.6 17.8 21.1 21.2 14.3 16.2 14.1 13.9 12.8o/w Interest & Charges 4.9 10.2 9.4 10.7 9.7 6.8 7.7 8.1 7.3 9.4
External Assistance 6.0 3.9 1.4 1.6 2.5 0.0 1.4 0.0 0.0 0.0Note: Covering general government expenditures.Source: Ministry of Finance, World Bank Database, and LMF staff estimates; PER projections for FY98/99.
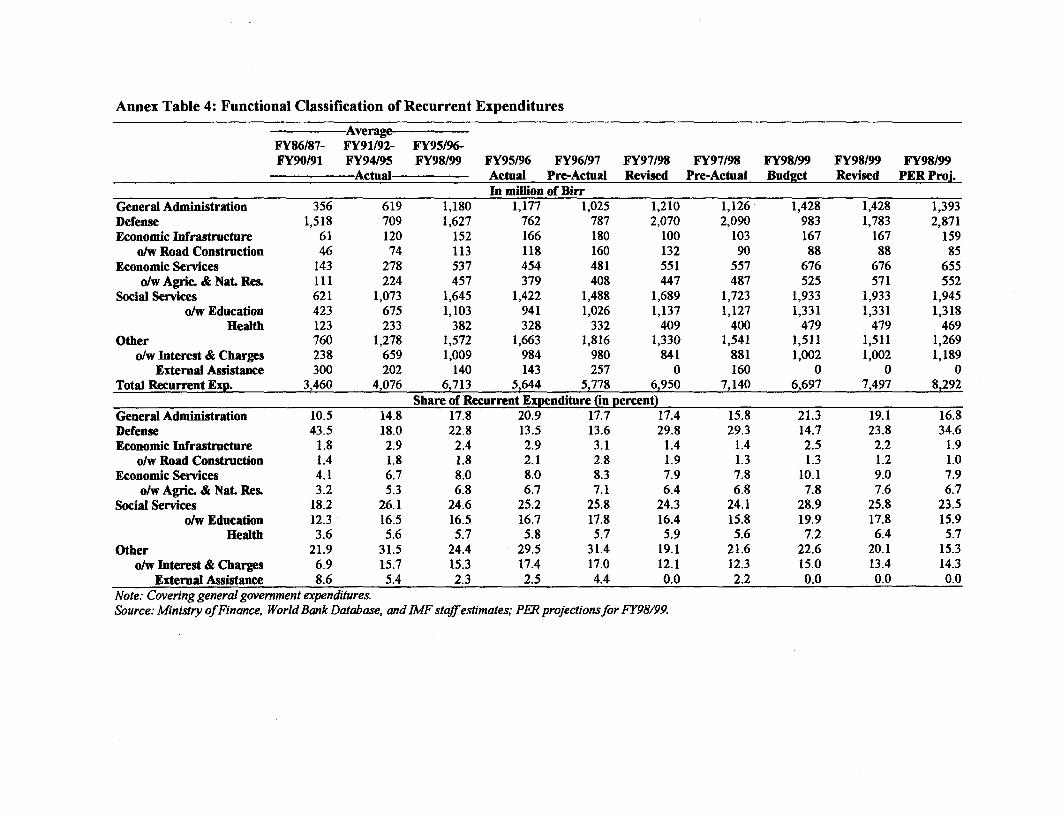
Annex Table 4: Functional Classification of Recurrent Expenditures
-- Average-FY86187- FY91/92- FY95/96-FY90/91 FY94/95 FY98/99 FY95/96 FY96/97 FY97/98 FY97/98 FY98/99 FY98199 FY98199
Actual Actual Pre-Actual Revised Pre-Actual Budget Revised PER Proj.In million of Birr
General Administration 356 619 1,180 1,177 1,025 1,210 1,126 1,428 1,428 1,393Defense 1,518 709 1,627 762 787 2,070 2,090 983 1,783 2,871Economic Infrastructure 61 120 152 166 180 100 103 167 167 159
ohw Road Construction 46 74 113 118 160 132 90 88 88 85Economic Services 143 278 537 454 481 551 557 676 676 655
o/w Agric. & Nat. Res. 111 224 457 379 408 447 487 525 571 552Social Services 621 1,073 1,645 1,422 1,488 1,689 1,723 1,933 1,933 1,945
o/w Education 423 675 1,103 941 1,026 1,137 1,127 1,331 1,331 1,318Health 123 233 382 328 332 409 400 479 479 469
Other 760 1,278 1,572 1,663 1,816 1,330 1,541 1,511 1,511 1,269oJw Interest & Charges 238 659 1,009 984 980 841 881 1,002 1,002 1,189
External Assistance 300 202 140 143 257 0 160 0 0 0Total Recurrent Exp. 3,460 4,076 6,713 5,644 5,778 6,950 7,140 6,697 7,497 8,292
Share of Recurrent Expenditure (in percent)General Administration 10.5 14.8 17.8 20.9 17.7 17.4 15.8 21.3 19.1 16.8Defense 43.5 18.0 22.8 13.5 13.6 29.8 29.3 14.7 23.8 34.6Economic Infrastructure 1.8 2.9 2.4 2.9 3.1 1.4 1.4 2.5 2.2 1.9
o/w Road Construction 1.4 1.8 1.8 2.1 2.8 1.9 1.3 1.3 1.2 1.0Economic Services 4.1 6.7 8.0 8.0 8.3 7.9 7.8 10.1 9.0 7.9
o/w Agric. & Nat. Res. 3.2 5.3 6.8 6.7 7.1 6.4 6.8 7.8 7.6 6.7Social Services 18.2 26.1 24.6 25.2 25.8 24.3 24.1 28.9 25.8 23.5
o/w Education 12.3 16.5 16.5 16.7 17.8 16.4 15.8 19.9 17.8 15.9Health 3.6 5.6 5.7 5.8 5.7 5.9 5.6 7.2 6.4 5.7
Other 21.9 31.5 24.4 29.5 31.4 19.1 21.6 22.6 20.1 15.3o/w Interest & Charges 6.9 15.7 15.3 17.4 17.0 12.1 12.3 15.0 13.4 14.3
External Assistance 8.6 5.4 2.3 2.5 4.4 0.0 2.2 0.0 0.0 0.0Note: Covering general government expendituresSource: Ministry of Finance, World Bank Database, and BvF staffestimates; PER projectionsfor FY98/99.
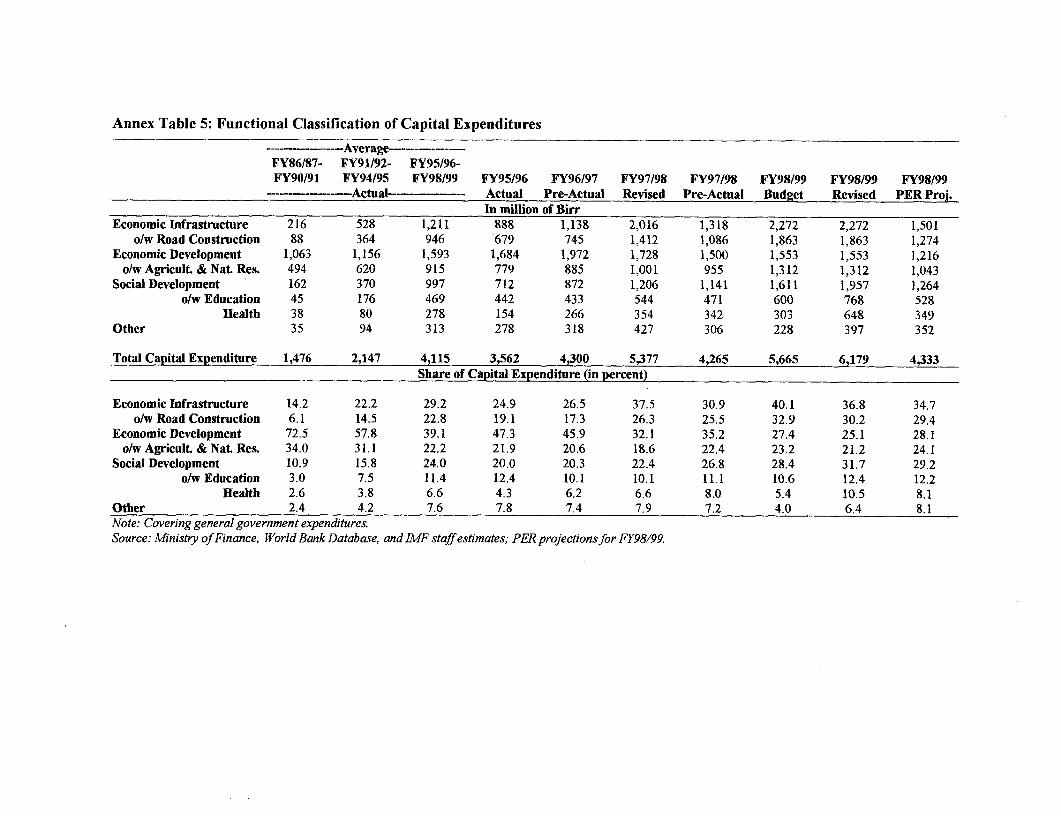
Annex Table 5: Functional Classification of Capital Expenditures
- -- ~~Average---------FY86/87- FY91/92- FY9S/96-FY90/91 FY94/95 FY98/99 FY95196 FY96197 FY97/98 FY97/98 FY98/99 FY98/99 FY98/99
---------------- Actual------------ Actual Pre-Actual Revised Pre-Actual Budget Revised PER Proj.In million of Birr
Economic Infrastructure 216 528 1,211 888 1,138 2,016 1,318 2,272 2,272 1,501o/w Road Construction 88 364 946 679 745 1,412 1,086 1,863 1,863 1,274
Economic Development 1,063 1,156 1,593 1,684 1,972 1,728 1,500 1,553 1,553 1,216o/wAgricult.&Nat.Res. 494 620 915 779 885 1,001 955 1,312 1,312 1,043
Social Development 162 370 997 712 872 1,206 1,141 1,611 1,957 1,264o/w Education 45 176 469 442 433 544 471 600 768 528
Health 38 80 278 154 266 354 342 303 648 349Other 35 94 313 278 318 427 306 228 397 352
Total Capital Expenditure 1,476 2,147 4,115 3,562 4,300 5,377 4,265 5,665 6,179 4,333Share of Capital Expenditure (in percent)
Economic Infrastructure 14.2 22.2 29.2 24.9 26.5 37.5 30.9 40.1 36.8 34.7o/w Road Construction 6.1 14.5 22.8 19.1 17.3 26.3 25.5 32.9 30.2 29.4
Economic Development 72.5 57.8 39.1 47.3 45.9 32.1 35.2 27.4 25.1 28.1o/wAgricult.&Nat.Res. 34.0 31.1 22.2 21.9 20.6 18.6 22.4 23.2 21.2 24.1
Social Development 10.9 15.8 24.0 20.0 20.3 22.4 26.8 28.4 31.7 29.2o/w Education 3.0 7.5 11.4 12.4 10.1 10.1 11.1 10.6 12.4 12.2
Health 2.6 3.8 6.6 4.3 6.2 6.6 8.0 5.4 10.5 8.1Other 2.4 4.2 7.6 7.8 7.4 7.9 7.2 4.0 6.4 8.1Note: Covering general government expenditures.Source: Ministry of Finance, World Bank Database, and IMF staff estimates; PER projections for FY98/99.
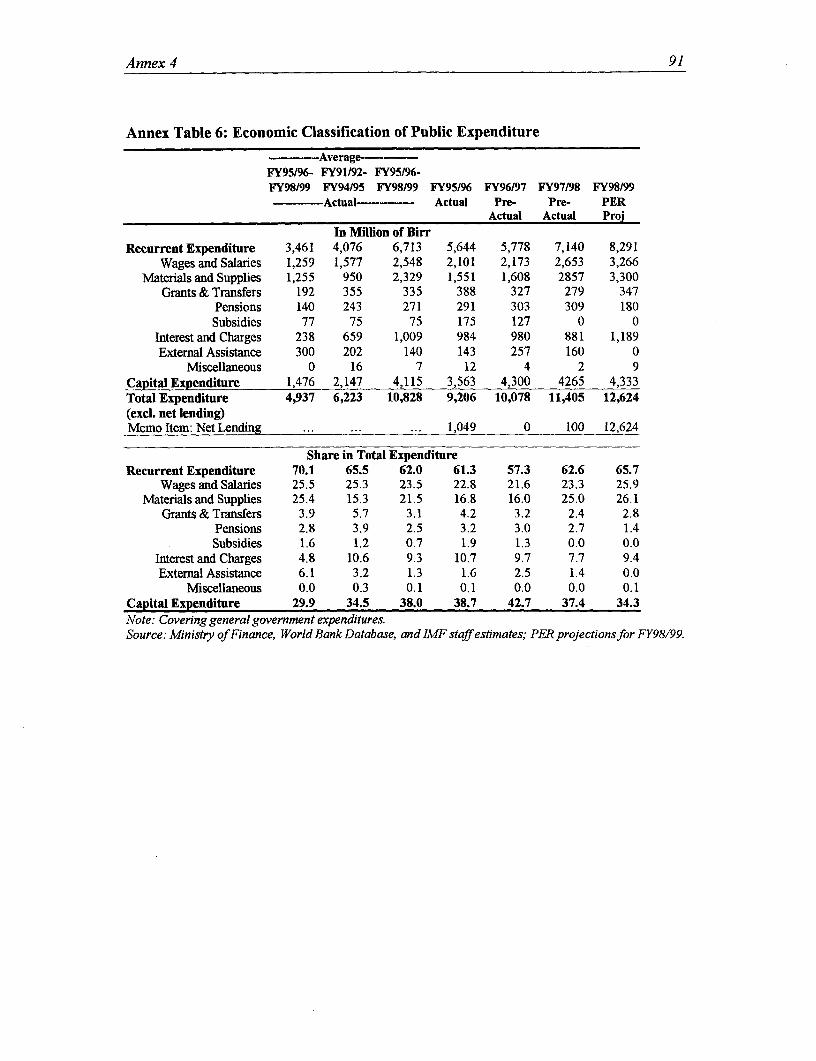
Annex 4 91
Annex Table 6: Economic Classification of Public Expenditure
--- Average----FY95/96- FY91/92- FY95196-FY98/99 FY94/95 FY98199 FY95/96 FY96/97 FY97/98 FY98/99
Actual----- Actual Pre- Pre- PERActual Actual Proj
In Million of BirrRecurrent Expenditure 3,461 4,076 6,713 5,644 5,778 7,140 8,291
Wages and Salaries 1,259 1,577 2,548 2,101 2,173 2,653 3,266Materials and Supplies 1,255 950 2,329 1,551 1,608 2857 3,300
Grants & Transfers 192 355 335 388 327 279 347Pensions 140 243 271 291 303 309 180Subsidies 77 75 75 175 127 0 0
Interest and Charges 238 659 1,009 984 980 881 1,189Extemal Assistance 300 202 140 143 257 160 0
Miscellaneous 0 16 7 12 4 2 9Capital Expenditure 1,476 2,147 4,115 3,563 4,300 4265 4,333Total Expenditure 4,937 6,223 10,828 9,206 10,078 11,405 12,624(exci. net lending)Memo Item: Net Lending ... ... ... 1,049 0 100 12,624
Share in Total ExpenditureRecurrent Expenditure 70.1 65.5 62.0 61.3 57.3 62.6 65.7
Wages and Salaries 25.5 25.3 23.5 22.8 21.6 23.3 25.9MaterialsandSupplies 25.4 15.3 21.5 16.8 16.0 25.0 26.1
Grants & Transfers 3.9 5.7 3.1 4.2 3.2 2.4 2.8Pensions 2.8 3.9 2.5 3.2 3.0 2.7 1.4Subsidies 1.6 1.2 0.7 1.9 1.3 0.0 0.0
Interest and Charges 4.8 10.6 9.3 10.7 9.7 7.7 9.4External Assistance 6.1 3.2 1.3 1.6 2.5 1.4 0.0
Miscellaneous 0.0 0.3 0,1 0.1 0.0 0.0 0.1Capital Expenditure 29.9 34.5 38.0 38.7 42.7 37.4 34.3Note: Covering general government expenditures.Source: Ministry of Finance, World Bank Database, and IMF staffestimates; PER projectionsfor FY98/99.
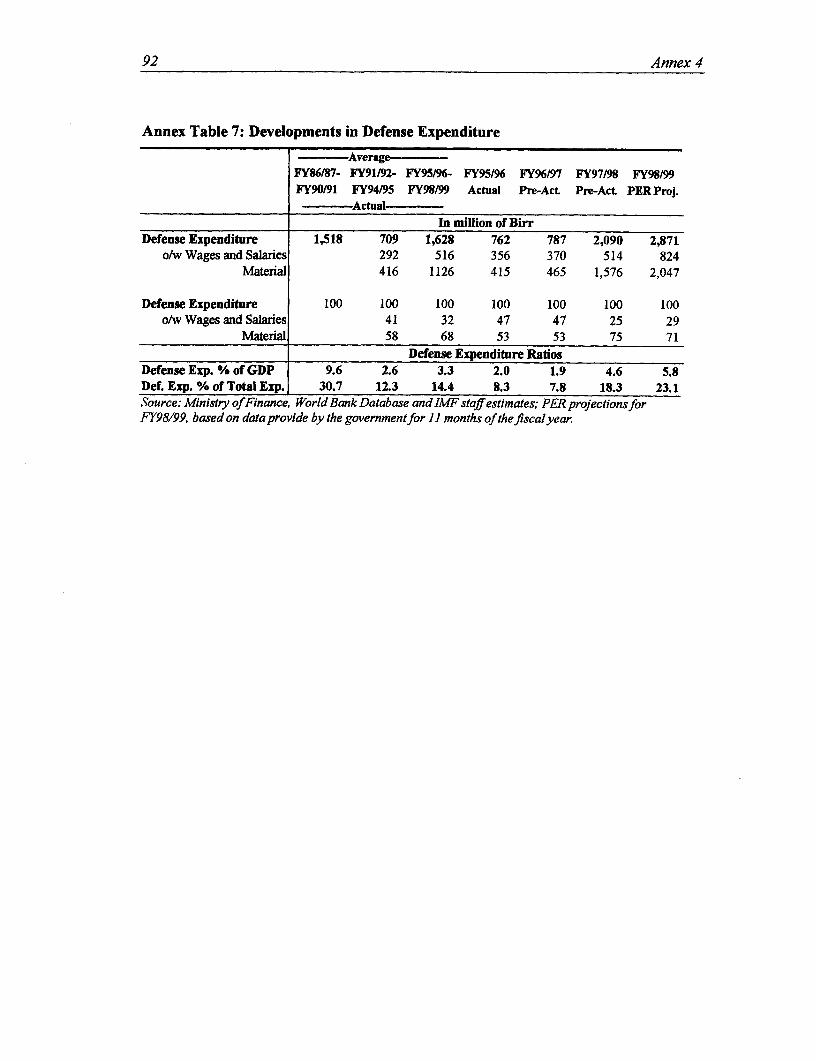
92 Annex 4
Annex Table 7: Developments in Defense Expenditure
-Average-FY86/87- FY91/92- FY95/96- FY95/96 FY96/97 FY97/98 FY98199FY90/91 FY94195 FY98/99 Actual Pre-Act Pre-Act PER Proj.
ActualIn million of Birr
Defense Expenditure 1,518 709 1,628 762 787 2,090 2,871o/w Wages and Salaries 292 516 356 370 514 824
Material 416 1126 415 465 1,576 2,047
Defense Expenditure 100 100 100 100 100 100 100o/w Wages and Salaries 41 32 47 47 25 29
Material 58 68 53 53 75 71Defense Expenditure Ratios
Defense Exp. % of GDP 9.6 2.6 3.3 2.0 1.9 4.6 5.8Def. Exp. % of Total Exp. 30.7 12.3 14.4 8.3 7.8 18.3 23.1Source: Ministry of Finance, World Bank Database and IMF staff estimates; PER projections forFY98/99, based on data provide by the government for II months of the fiscalyear.
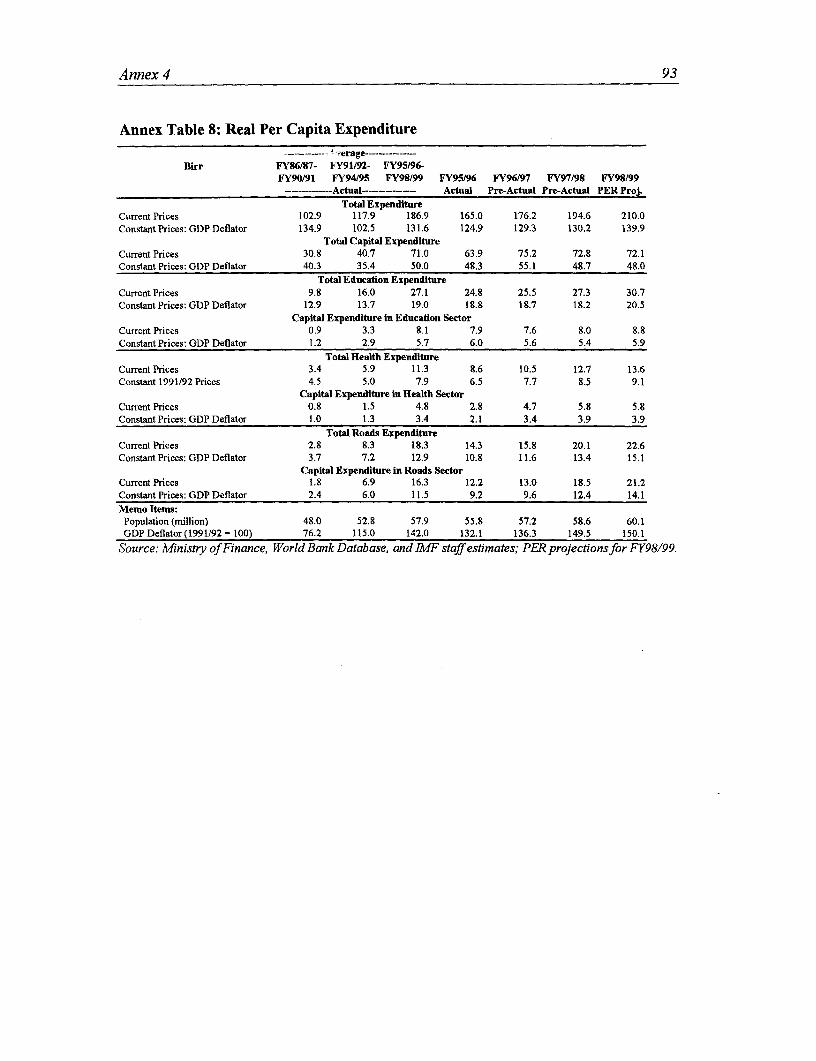
Annex 4 93
Annex Table 8: Real Per Capita Expenditure___ ~'verage-------------
Birr FY86/87- kY91/92- FY95/96-FY90/91 FY94195 FY98/99 FY95196 FY96/97 FY97/98 FY98/99
-Actual------------- Actual Pre-Actual Pre-Actual PER Proj.Total Expenditure
Current Prices 102.9 117.9 186.9 165.0 176.2 194.6 210.0Constant Prices: GDP Deflator 134.9 102.5 131.6 124.9 129.3 130.2 139.9
Total Capital ExpenditureCurrent Prices 30.8 40.7 71.0 63.9 75.2 72.8 72.1Constant Prices: GDP Deflator 40.3 35.4 50.0 48.3 55.1 48.7 48.0
Total Education ExpenditureCurrent Prices 9.8 16.0 27.1 24.8 25.5 27.3 30.7Constant Prices: GDP Deflator 12.9 13.7 19.0 18.8 18.7 18.2 20.5
Capital Expenditure in Education SectorCurrent Prices 0.9 3.3 8.1 7.9 7.6 8.0 8.8Constant Prices: GDP Deflator 1.2 2.9 5.7 6.0 5.6 5.4 5.9
Total Health ExpenditureCurrent Prices 3.4 5.9 11.3 8.6 10.5 12.7 13.6Constant 1991/92 Prices 4.5 5.0 7.9 6.5 7.7 8.5 9.1
Capital Expenditure in Health SectorCurrent Prices 0.8 1.5 4.8 2.8 4.7 5.8 5.8Constant Prices: GDP Deflator 1.0 1.3 3.4 2.1 3.4 3.9 3.9
Total Roads ExpenditureCurrent Prices 2.8 8.3 18.3 14.3 15.8 20.1 22.6ConstantPrices: GDP Deflator 3.7 7.2 12.9 10.8 11.6 13.4 15.1
Capital Expenditure in Roads SectorCurrent Prices 1.8 6.9 16.3 12.2 13.0 18.5 21.2Constant Prices: GDP Deflator 2.4 6.0 11.5 9.2 9.6 12.4 14.1Memo Items:Population (million) 48.0 52.8 57.9 55.8 57.2 58.6 60.1GDP Deflator (1991/92= 100) 76.2 115.0 142.0 132.1 136.3 149.5 150.1
Source: Ministry of Finance, World Bank Database, and IMF staff estimates; PFR projectionsfor FY98/99.

94 Annex 4
Annex Table 9: Financial Calendar
Cycle/part/stage CalendarEthiopian European
Planning Cycle/Stage
1. Multi-Year Planning Hamle 1 - Nehase 15 July 8 - August 21
2. Multi-Year Programming Meskerem 15 - Tahesas 30 September 25 - January 8
3. Annual Fiscal Plan Pagume 1 - Tahesas 30 September 6 - January 8
Budgeting Cycle/Part/Stage
A. Executive Preparation1. Budget Preparation Meskerem 21 Megabit 7 October 1 -March 15
2. Budget Call Tir 1 - Tir 30 January 9 - February 7
3. Preparation of theformula for regional Tir 30 - Megabit 22 January 9 - January 31Subsidy4. Request for the Budget Tir 30 - Megabit 22 February 7 - March 315. Notification of the Yekatit 8 - Yekatit 21 February 15 - February 28regional Subsidy Estimate6. Preparation of the Megabit 23 - Genbot 29 April 1 -June 6Recommended Budget7. Approval of the Genbot 30 - Sene 13 June 7 - June 20Recommended Budget
B. Legislative Adoption.8. Approval of the Formula Tie 24 - Yekatit 7 February 1 - February 14for the Iregional Subsidy9. Approval of the Sene 14 - Sene 30 June 21 - July 7Recommended Budget10. Appropriation of the Sene 14 - Sene 30 June 21 -July 7Approved Budget
C. Executive Implementation
1 1. Notification of the Hamle 1 - Hamle 8 July 8 -July 15Proclaimed Budget12. Operation of the Hamle 1 -Nehase4 July8-August 15Proclaimed Budget13. Implementation of the Hamle 9 - Hamle 30 July 16 -August 7Proclaimed Budget (next FY) (next FY)
D. Executive Audit/Monitoring