cereal consumption patterns in ethiopia: an analysis of the 2004-05 household income consumption and...
TRANSCRIPT
ETHIOPIAN DEVELOPMENT
RESEARCH INSTITUTE
Cereal Consumption Patterns in Ethiopia: An Analysis of the 2004-05 Household Income Consumption
and Expenditure (HICE) Data
Kibrom TafereZelekawork PaulosAlemayehu Seyoum TaffesseNigussie TeferaSeneshaw Tamiru
ESSP – II ConferenceOctober 22-24
We gratefully acknowledge CSA for providing the 2004/05 HICES data for this analysis
• Ethiopia’s agriculture and household food consumption patterns are complex
• No single staple dominates food consumption such as:
– Rice in East Asia
– Maize in Latin America and Eastern /Southern Africa
– Wheat in central Asia
– Cassava in central Africa
• In Ethiopia, four cereals (teff, wheat, maize and sorghum) and enset (in SNNPR) are major staples in various parts of the country
Introduction
INTERNATIONAL FOOD POLICY RESEARCH INSTITUTE – ETHIOPIA STRATEGY SUPPORT PROGRAM
Introduction
INTERNATIONAL FOOD POLICY RESEARCH INSTITUTE – ETHIOPIA STRATEGY SUPPORT PROGRAM
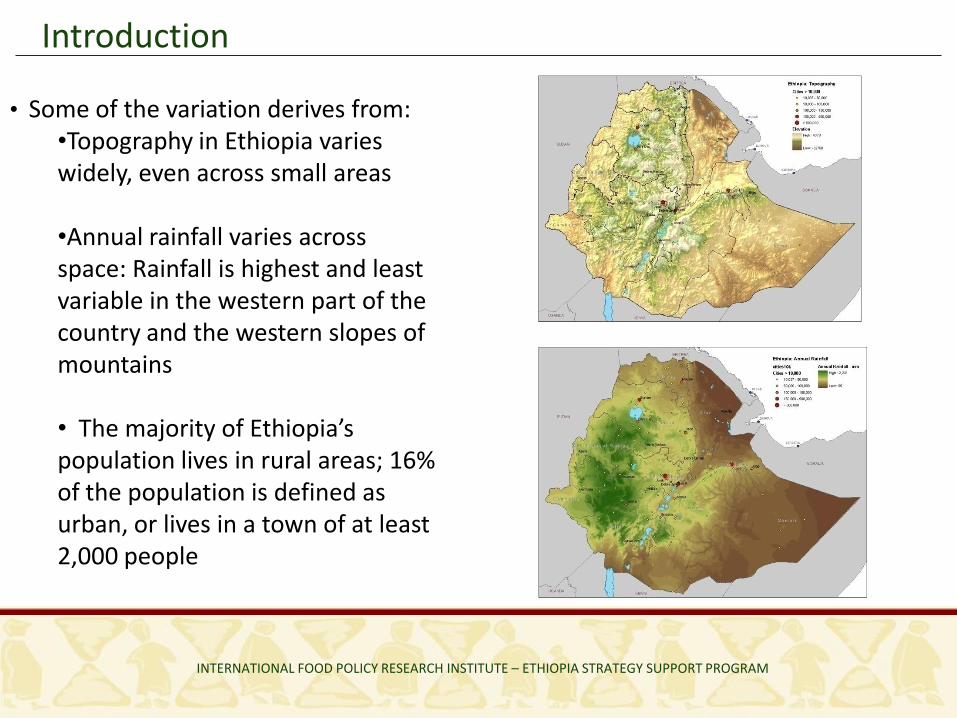
• Some of the variation derives from:•Topography in Ethiopia varies widely, even across small areas
•Annual rainfall varies across space: Rainfall is highest and least variable in the western part of the country and the western slopes of mountains
• The majority of Ethiopia’s population lives in rural areas; 16% of the population is defined as urban, or lives in a town of at least 2,000 people
Data: HICES 2004/05
INTERNATIONAL FOOD POLICY RESEARCH INSTITUTE – ETHIOPIA STRATEGY SUPPORT PROGRAM
• This analysis is based on the Central Statistical Agency’s (CSA) Household Income Consumption Expenditure (HICE) survey (2004/05) data.
• For this analysis, the country is divided into 3 major categories and 5 agro-ecological zones
• Rural• Major Urban Centers: Regional capitals and other 4 major centers• Other Urban Centers: All urban centers that are not classified as major urban centers
Definition of Urban Areas• All administrative capitals• Localities with Urban Dwellers’ Associations• All localities with a population of 1000 or more persons, and whose inhabitants are primarily engaged in non- agricultural activities.
Data: HICES 2004/05 (cont.)
INTERNATIONAL FOOD POLICY RESEARCH INSTITUTE – ETHIOPIA STRATEGY SUPPORT PROGRAM
Sampling procedures:• Rural and Major Urban Centers: 2 stage cluster sampling design• Other Urban Centers: 3 stage cluster sampling
• A total of 21,595 households were surveyed• 12,101 of households are in urban areas• 9,494 of households are in rural areas
Rural UrbanKgs. per capita Kgs. per capita
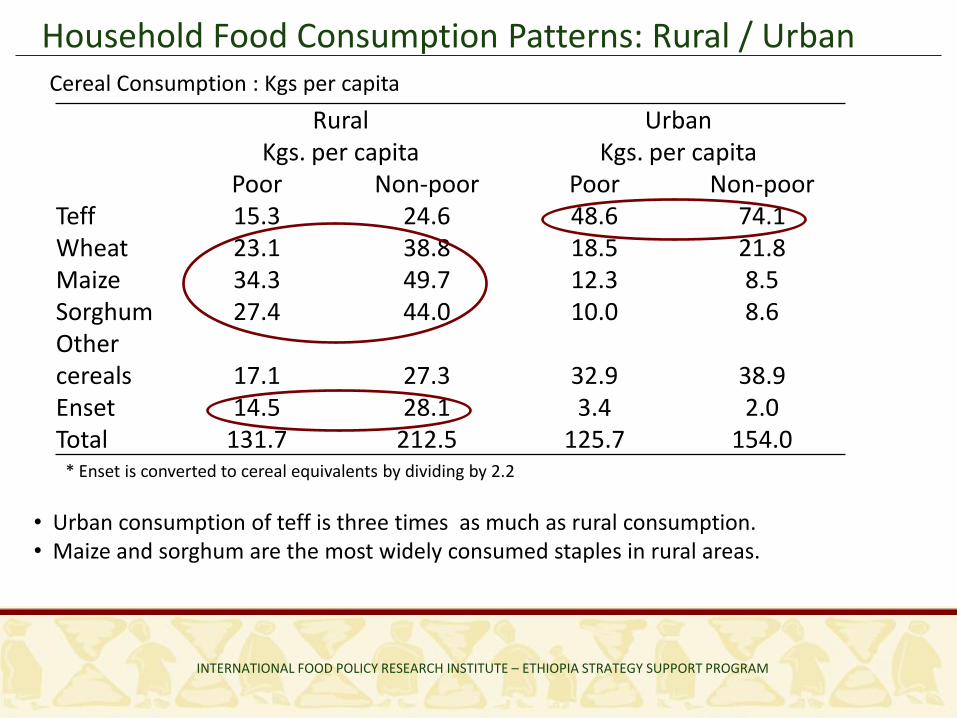
Poor Non-poor Poor Non-poorTeff 15.3 24.6 48.6 74.1Wheat 23.1 38.8 18.5 21.8Maize 34.3 49.7 12.3 8.5Sorghum 27.4 44.0 10.0 8.6Other cereals 17.1 27.3 32.9 38.9Enset 14.5 28.1 3.4 2.0Total 131.7 212.5 125.7 154.0
Household Food Consumption Patterns: Rural / Urban
INTERNATIONAL FOOD POLICY RESEARCH INSTITUTE – ETHIOPIA STRATEGY SUPPORT PROGRAM
Cereal Consumption : Kgs per capita
• Urban consumption of teff is three times as much as rural consumption. • Maize and sorghum are the most widely consumed staples in rural areas.
* Enset is converted to cereal equivalents by dividing by 2.2
Household Food Consumption Patterns
INTERNATIONAL FOOD POLICY RESEARCH INSTITUTE – ETHIOPIA STRATEGY SUPPORT PROGRAM
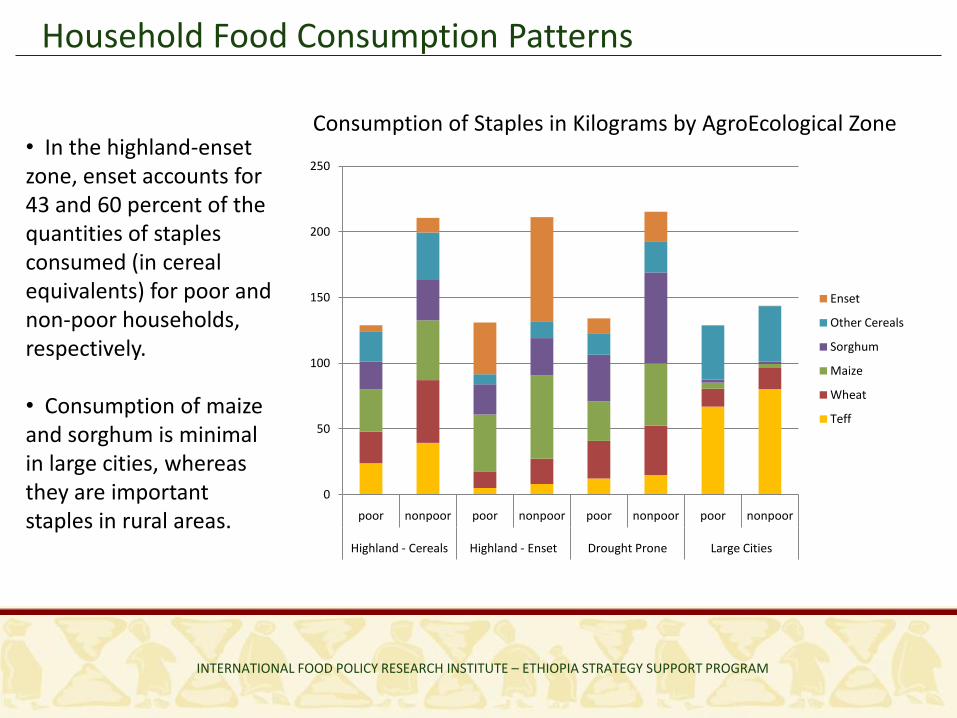
Consumption of Staples in Kilograms by AgroEcological Zone• In the highland-enset zone, enset accounts for 43 and 60 percent of the quantities of staples consumed (in cereal equivalents) for poor and non-poor households, respectively.
• Consumption of maize and sorghum is minimal in large cities, whereas they are important staples in rural areas.
0
50
100
150
200
250
poor nonpoor poor nonpoor poor nonpoor poor nonpoor
Highland - Cereals Highland - Enset Drought Prone Large Cities
Enset
Other Cereals
Sorghum
Maize
Wheat
Teff
Household Food Expenditure Patterns
INTERNATIONAL FOOD POLICY RESEARCH INSTITUTE – ETHIOPIA STRATEGY SUPPORT PROGRAM
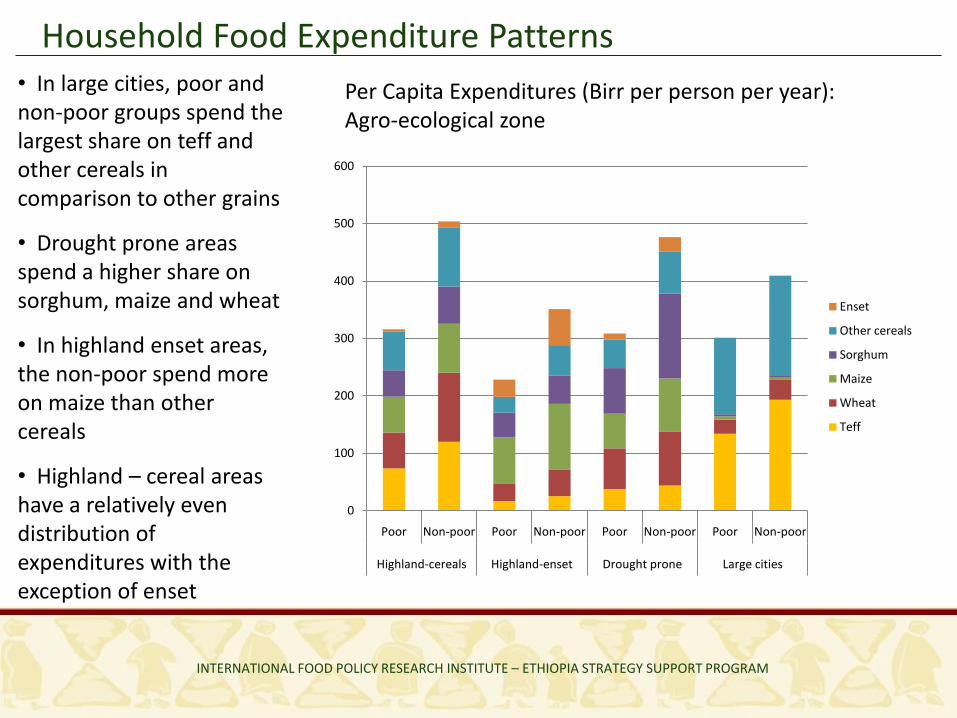
Per Capita Expenditures (Birr per person per year): Agro-ecological zone
• In large cities, poor and non-poor groups spend the largest share on teff and other cereals in comparison to other grains
• Drought prone areas spend a higher share on sorghum, maize and wheat
• In highland enset areas, the non-poor spend more on maize than other cereals
• Highland – cereal areas have a relatively even distribution of expenditures with the exception of enset
0
100
200
300
400
500
600
Poor Non-poor Poor Non-poor Poor Non-poor Poor Non-poor
Highland-cereals Highland-enset Drought prone Large cities
Enset
Other cereals
Sorghum
Maize
Wheat
Teff
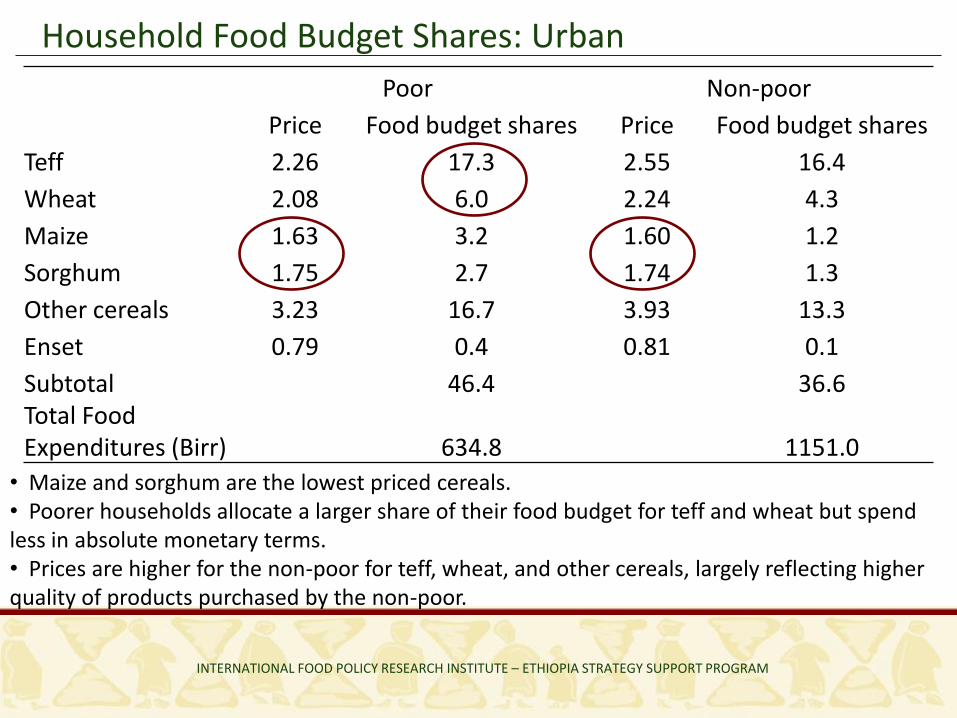
Household Food Budget Shares: Urban
INTERNATIONAL FOOD POLICY RESEARCH INSTITUTE – ETHIOPIA STRATEGY SUPPORT PROGRAM
Poor Non-poor
Price Food budget shares Price Food budget shares
Teff 2.26 17.3 2.55 16.4
Wheat 2.08 6.0 2.24 4.3
Maize 1.63 3.2 1.60 1.2
Sorghum 1.75 2.7 1.74 1.3
Other cereals 3.23 16.7 3.93 13.3
Enset 0.79 0.4 0.81 0.1
Subtotal 46.4 36.6Total Food Expenditures (Birr) 634.8 1151.0
• Maize and sorghum are the lowest priced cereals. • Poorer households allocate a larger share of their food budget for teff and wheat but spend less in absolute monetary terms.• Prices are higher for the non-poor for teff, wheat, and other cereals, largely reflecting higher quality of products purchased by the non-poor.
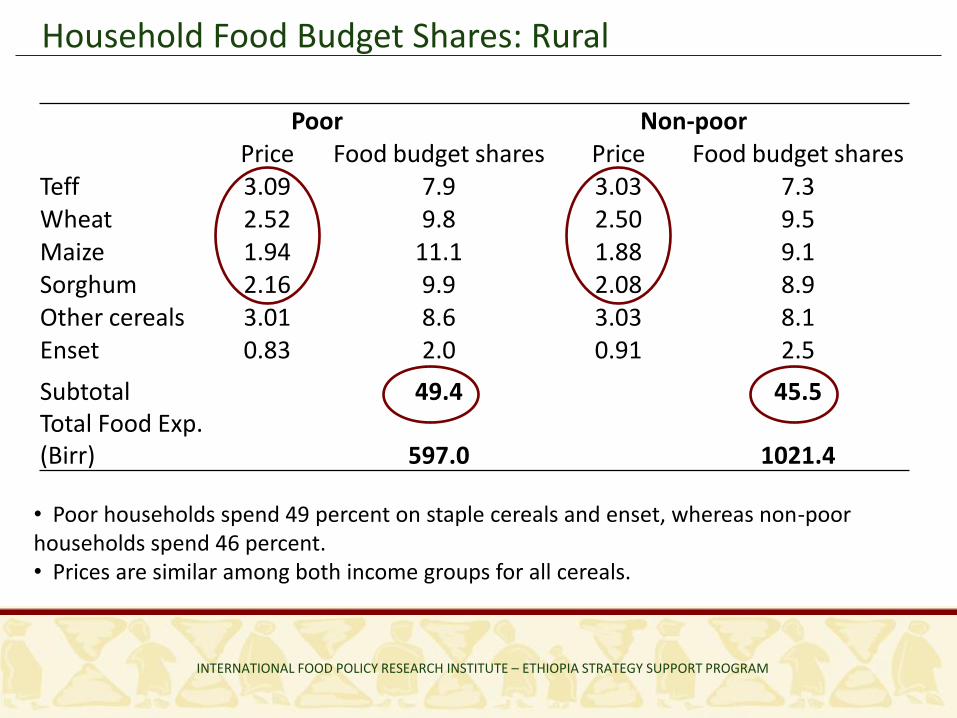
Household Food Budget Shares: Rural
INTERNATIONAL FOOD POLICY RESEARCH INSTITUTE – ETHIOPIA STRATEGY SUPPORT PROGRAM
Poor Non-poorPrice Food budget shares Price Food budget shares
Teff 3.09 7.9 3.03 7.3Wheat 2.52 9.8 2.50 9.5Maize 1.94 11.1 1.88 9.1Sorghum 2.16 9.9 2.08 8.9Other cereals 3.01 8.6 3.03 8.1Enset 0.83 2.0 0.91 2.5
Subtotal 49.4 45.5Total Food Exp. (Birr) 597.0 1021.4
• Poor households spend 49 percent on staple cereals and enset, whereas non-poor households spend 46 percent. • Prices are similar among both income groups for all cereals.
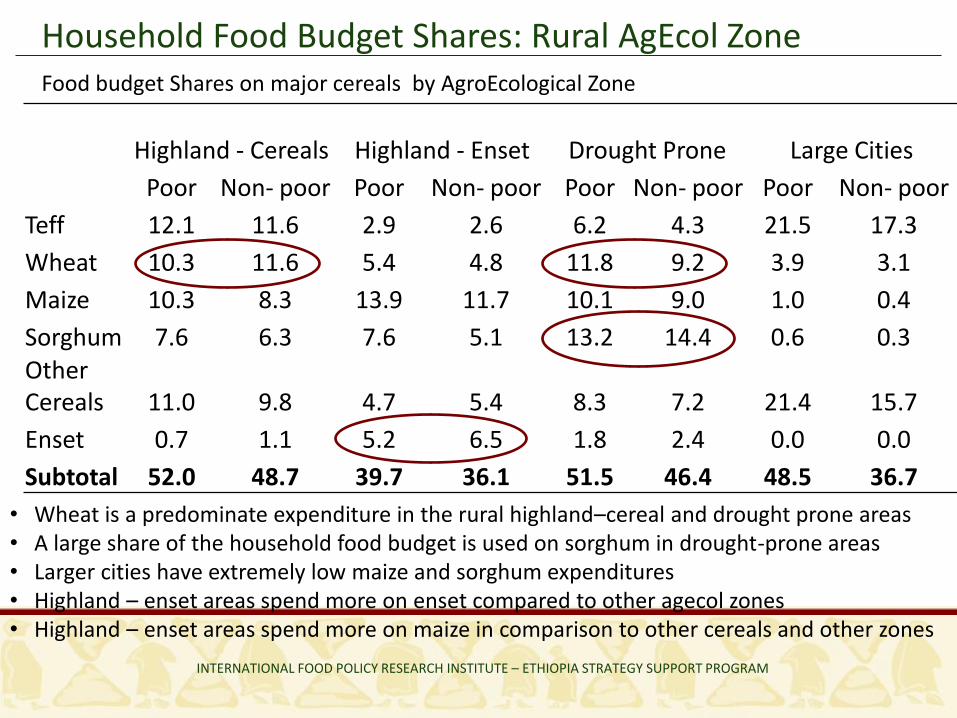
Household Food Budget Shares: Rural AgEcol Zone
INTERNATIONAL FOOD POLICY RESEARCH INSTITUTE – ETHIOPIA STRATEGY SUPPORT PROGRAM
Food budget Shares on major cereals by AgroEcological Zone
Highland - Cereals Highland - Enset Drought Prone Large Cities
Poor Non- poor Poor Non- poor Poor Non- poor Poor Non- poor
Teff 12.1 11.6 2.9 2.6 6.2 4.3 21.5 17.3
Wheat 10.3 11.6 5.4 4.8 11.8 9.2 3.9 3.1
Maize 10.3 8.3 13.9 11.7 10.1 9.0 1.0 0.4
Sorghum 7.6 6.3 7.6 5.1 13.2 14.4 0.6 0.3Other Cereals 11.0 9.8 4.7 5.4 8.3 7.2 21.4 15.7
Enset 0.7 1.1 5.2 6.5 1.8 2.4 0.0 0.0
Subtotal 52.0 48.7 39.7 36.1 51.5 46.4 48.5 36.7
• Wheat is a predominate expenditure in the rural highland–cereal and drought prone areas• A large share of the household food budget is used on sorghum in drought-prone areas• Larger cities have extremely low maize and sorghum expenditures• Highland – enset areas spend more on enset compared to other agecol zones• Highland – enset areas spend more on maize in comparison to other cereals and other zones
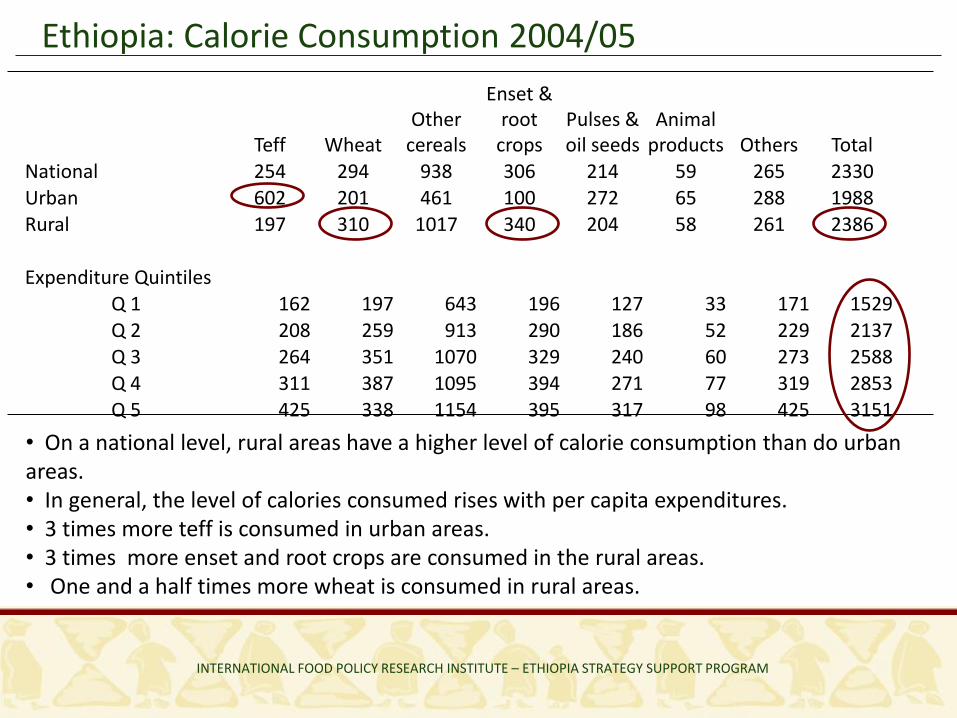
Teff Wheat Other
cereals
Enset & root
cropsPulses & oil seeds
Animal products Others Total
National 254 294 938 306 214 59 265 2330Urban 602 201 461 100 272 65 288 1988Rural 197 310 1017 340 204 58 261 2386
Expenditure QuintilesQ 1 162 197 643 196 127 33 171 1529Q 2 208 259 913 290 186 52 229 2137Q 3 264 351 1070 329 240 60 273 2588Q 4 311 387 1095 394 271 77 319 2853Q 5 425 338 1154 395 317 98 425 3151
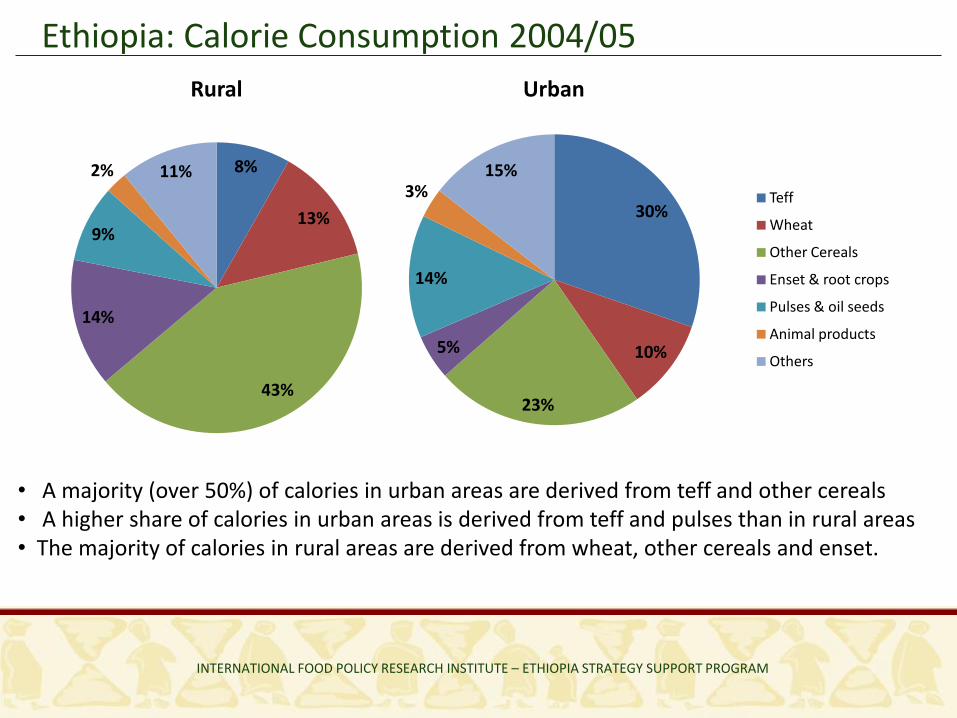
Ethiopia: Calorie Consumption 2004/05
INTERNATIONAL FOOD POLICY RESEARCH INSTITUTE – ETHIOPIA STRATEGY SUPPORT PROGRAM
• On a national level, rural areas have a higher level of calorie consumption than do urban areas.• In general, the level of calories consumed rises with per capita expenditures.• 3 times more teff is consumed in urban areas.• 3 times more enset and root crops are consumed in the rural areas.• One and a half times more wheat is consumed in rural areas.
Ethiopia: Calorie Consumption 2004/05
INTERNATIONAL FOOD POLICY RESEARCH INSTITUTE – ETHIOPIA STRATEGY SUPPORT PROGRAM
• A majority (over 50%) of calories in urban areas are derived from teff and other cereals• A higher share of calories in urban areas is derived from teff and pulses than in rural areas• The majority of calories in rural areas are derived from wheat, other cereals and enset.
30%
10%
23%
5%
14%
3%15%
Urban
Teff
Wheat
Other Cereals
Enset & root crops
Pulses & oil seeds
Animal products
Others
8%
13%
43%
14%
9%
2% 11%
Rural
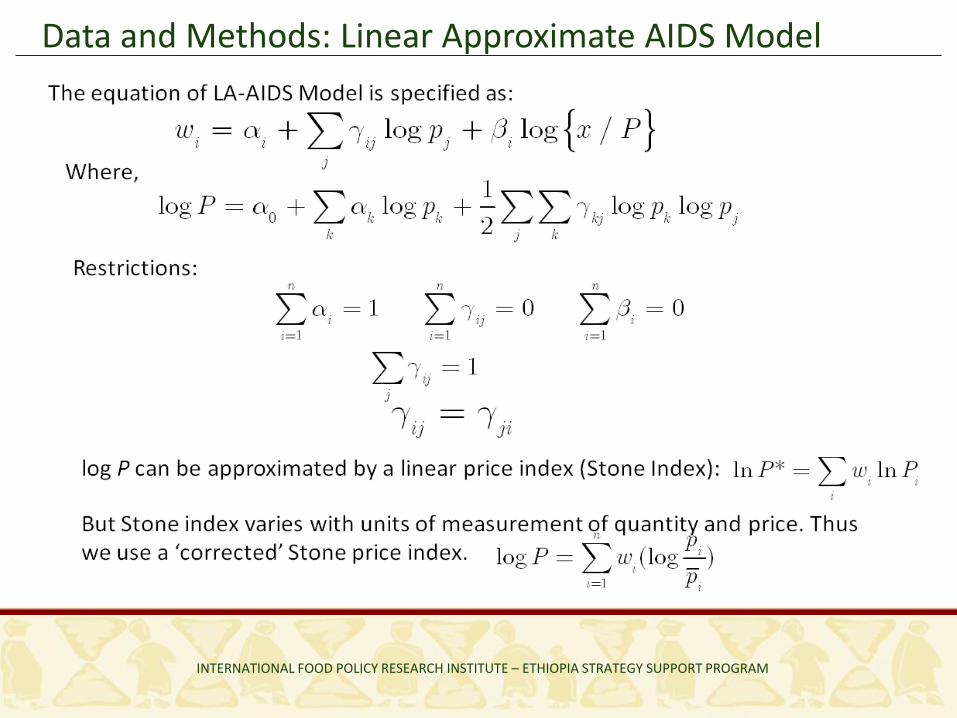
Data and Methods: Linear Approximate AIDS Model
INTERNATIONAL FOOD POLICY RESEARCH INSTITUTE – ETHIOPIA STRATEGY SUPPORT PROGRAM
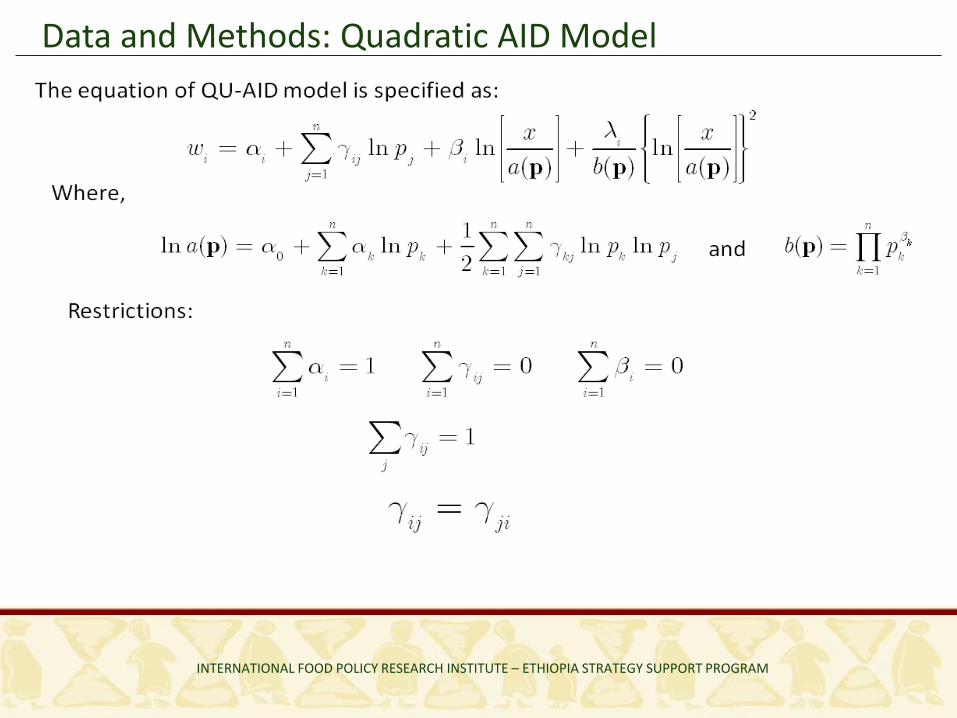
Data and Methods: Quadratic AID Model
INTERNATIONAL FOOD POLICY RESEARCH INSTITUTE – ETHIOPIA STRATEGY SUPPORT PROGRAM
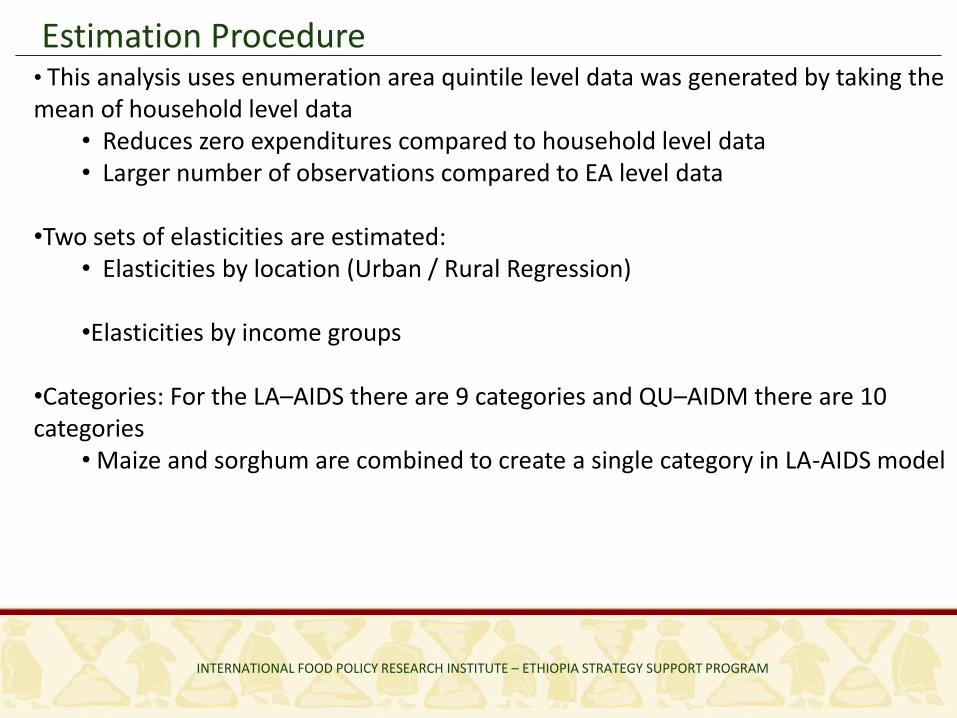
Estimation Procedure
INTERNATIONAL FOOD POLICY RESEARCH INSTITUTE – ETHIOPIA STRATEGY SUPPORT PROGRAM
• This analysis uses enumeration area quintile level data was generated by taking the mean of household level data
• Reduces zero expenditures compared to household level data• Larger number of observations compared to EA level data
•Two sets of elasticities are estimated:• Elasticities by location (Urban / Rural Regression)
•Elasticities by income groups
•Categories: For the LA–AIDS there are 9 categories and QU–AIDM there are 10 categories
• Maize and sorghum are combined to create a single category in LA-AIDS model
Estimation Procedure (cont.)
INTERNATIONAL FOOD POLICY RESEARCH INSTITUTE – ETHIOPIA STRATEGY SUPPORT PROGRAM
•Unit values are used to proxy price:•The use of unit values have certain drawbacks: (Deaton 1987, 1988, 1990 & 1997)
• Measurement error of quantities and values• Unit values carry quality differences that are masked
•Zero expenditures in the data arise from imperfect recall, permanent zero consumption and zero consumption during the survey period
• We partially adjust for these figures by aggregating the household level data at the EA quintile level
•Elasticity estimates for the richest 60 percent and the poorest 40 percent of households are calculated using the coefficients from the entire rural (urban) sample regression, evaluated at the mean budget shares of each group
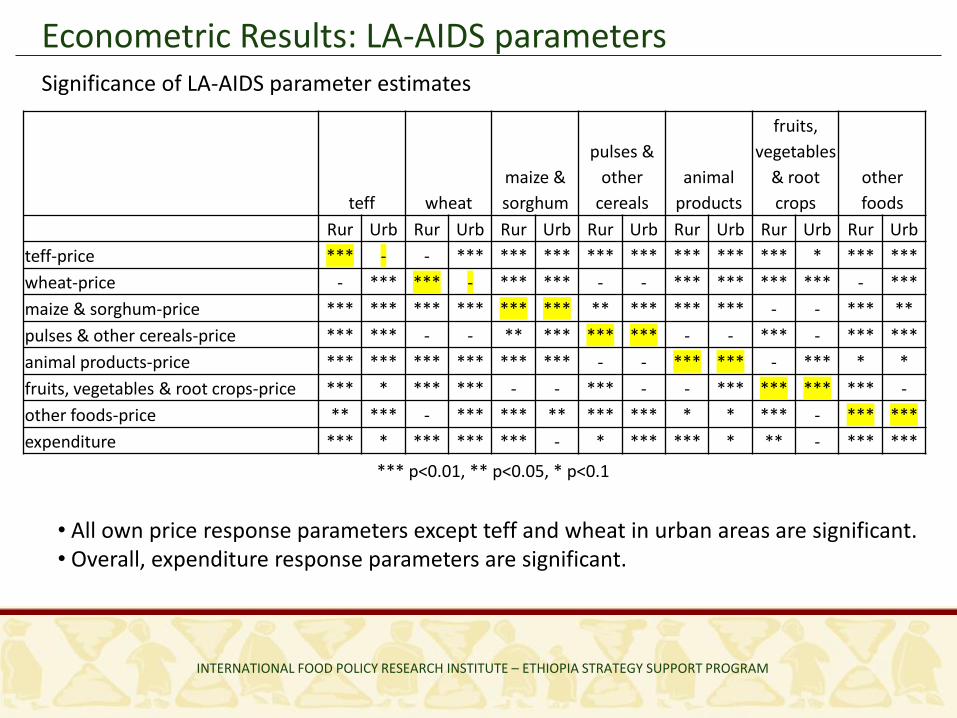
Econometric Results: LA-AIDS parameters
INTERNATIONAL FOOD POLICY RESEARCH INSTITUTE – ETHIOPIA STRATEGY SUPPORT PROGRAM
Significance of LA-AIDS parameter estimates
teff wheat
maize &
sorghum
pulses &
other
cereals
animal
products
fruits,
vegetables
& root
crops
other
foods
Rur Urb Rur Urb Rur Urb Rur Urb Rur Urb Rur Urb Rur Urb
teff-price *** - - *** *** *** *** *** *** *** *** * *** ***
wheat-price - *** *** - *** *** - - *** *** *** *** - ***
maize & sorghum-price *** *** *** *** *** *** ** *** *** *** - - *** **
pulses & other cereals-price *** *** - - ** *** *** *** - - *** - *** ***
animal products-price *** *** *** *** *** *** - - *** *** - *** * *
fruits, vegetables & root crops-price *** * *** *** - - *** - - *** *** *** *** -
other foods-price ** *** - *** *** ** *** *** * * *** - *** ***
expenditure *** * *** *** *** - * *** *** * ** - *** ***
*** p<0.01, ** p<0.05, * p<0.1
• All own price response parameters except teff and wheat in urban areas are significant.• Overall, expenditure response parameters are significant.
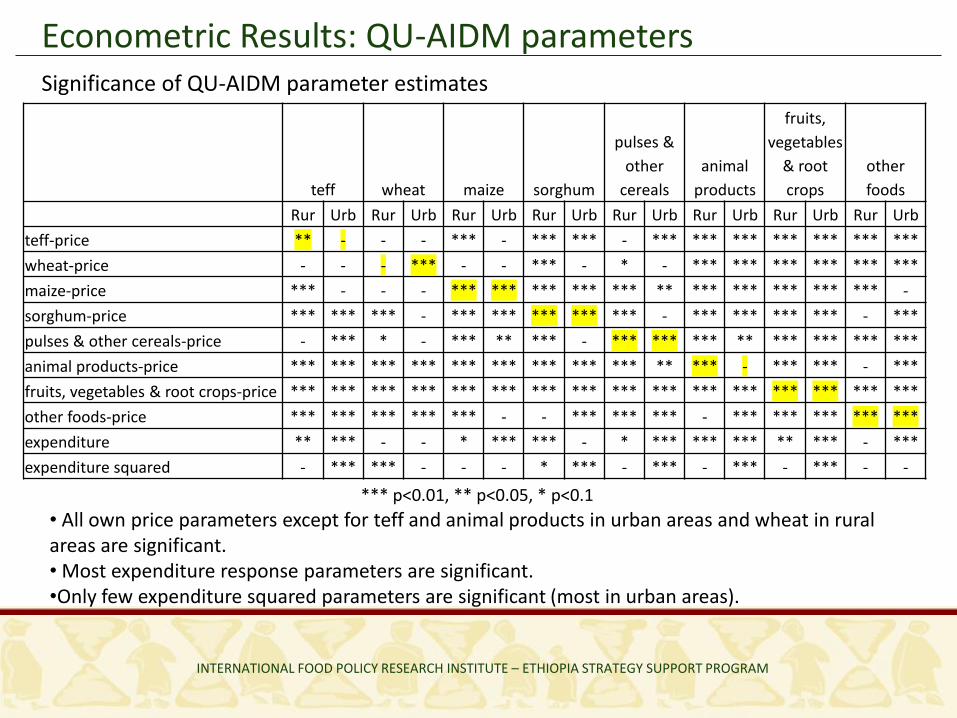
Econometric Results: QU-AIDM parameters
INTERNATIONAL FOOD POLICY RESEARCH INSTITUTE – ETHIOPIA STRATEGY SUPPORT PROGRAM
Significance of QU-AIDM parameter estimates
teff wheat maize sorghum
pulses &
other
cereals
animal
products
fruits,
vegetables
& root
crops
other
foods
Rur Urb Rur Urb Rur Urb Rur Urb Rur Urb Rur Urb Rur Urb Rur Urb
teff-price ** - - - *** - *** *** - *** *** *** *** *** *** ***
wheat-price - - - *** - - *** - * - *** *** *** *** *** ***
maize-price *** - - - *** *** *** *** *** ** *** *** *** *** *** -
sorghum-price *** *** *** - *** *** *** *** *** - *** *** *** *** - ***
pulses & other cereals-price - *** * - *** ** *** - *** *** *** ** *** *** *** ***
animal products-price *** *** *** *** *** *** *** *** *** ** *** - *** *** - ***
fruits, vegetables & root crops-price *** *** *** *** *** *** *** *** *** *** *** *** *** *** *** ***
other foods-price *** *** *** *** *** - - *** *** *** - *** *** *** *** ***
expenditure ** *** - - * *** *** - * *** *** *** ** *** - ***
expenditure squared - *** *** - - - * *** - *** - *** - *** - -
*** p<0.01, ** p<0.05, * p<0.1
• All own price parameters except for teff and animal products in urban areas and wheat in rural areas are significant.• Most expenditure response parameters are significant. •Only few expenditure squared parameters are significant (most in urban areas).
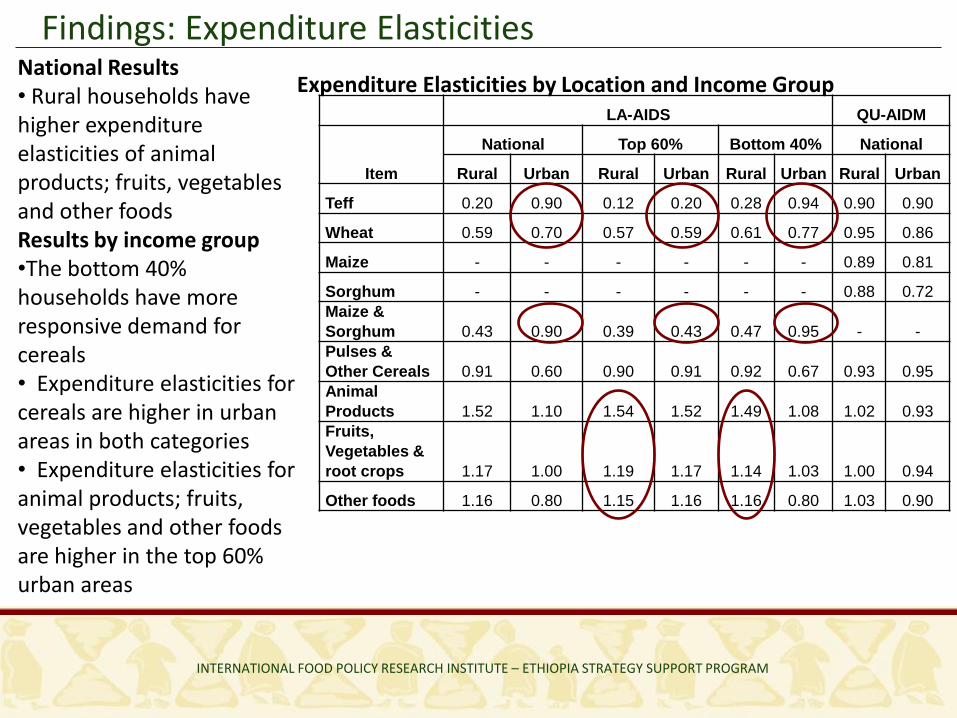
Findings: Expenditure Elasticities
INTERNATIONAL FOOD POLICY RESEARCH INSTITUTE – ETHIOPIA STRATEGY SUPPORT PROGRAM
LA-AIDS QU-AIDM
Item
National Top 60% Bottom 40% National
Rural Urban Rural Urban Rural Urban Rural Urban
Teff 0.20 0.90 0.12 0.20 0.28 0.94 0.90 0.90
Wheat 0.59 0.70 0.57 0.59 0.61 0.77 0.95 0.86
Maize - - - - - - 0.89 0.81
Sorghum - - - - - - 0.88 0.72
Maize &
Sorghum 0.43 0.90 0.39 0.43 0.47 0.95 - -
Pulses &
Other Cereals 0.91 0.60 0.90 0.91 0.92 0.67 0.93 0.95
Animal
Products 1.52 1.10 1.54 1.52 1.49 1.08 1.02 0.93
Fruits,
Vegetables &
root crops 1.17 1.00 1.19 1.17 1.14 1.03 1.00 0.94
Other foods 1.16 0.80 1.15 1.16 1.16 0.80 1.03 0.90
Expenditure Elasticities by Location and Income GroupNational Results• Rural households have higher expenditure elasticities of animal products; fruits, vegetables and other foodsResults by income group•The bottom 40% households have more responsive demand for cereals• Expenditure elasticities for cereals are higher in urban areas in both categories• Expenditure elasticities for animal products; fruits, vegetables and other foods are higher in the top 60% urban areas
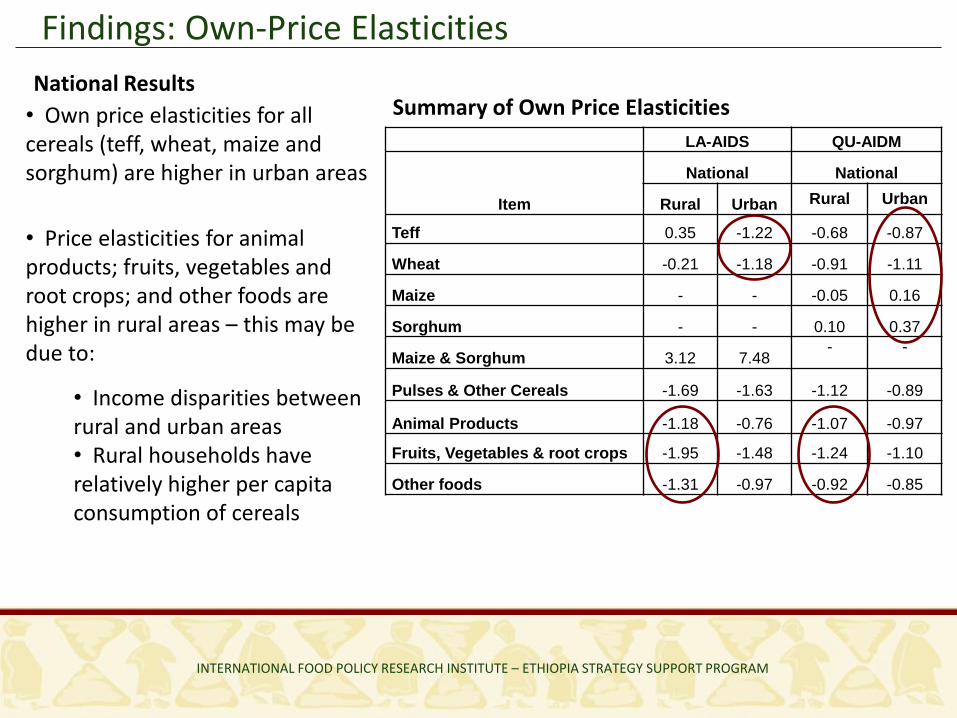
Findings: Own-Price Elasticities
INTERNATIONAL FOOD POLICY RESEARCH INSTITUTE – ETHIOPIA STRATEGY SUPPORT PROGRAM
LA-AIDS QU-AIDM
Item
National National
Rural Urban Rural Urban
Teff 0.35 -1.22 -0.68 -0.87
Wheat -0.21 -1.18 -0.91 -1.11
Maize - - -0.05 0.16
Sorghum - - 0.10 0.37
Maize & Sorghum 3.12 7.48- -
Pulses & Other Cereals -1.69 -1.63 -1.12 -0.89
Animal Products -1.18 -0.76 -1.07 -0.97
Fruits, Vegetables & root crops -1.95 -1.48 -1.24 -1.10
Other foods -1.31 -0.97 -0.92 -0.85
Summary of Own Price Elasticities• Own price elasticities for all cereals (teff, wheat, maize and sorghum) are higher in urban areas
• Price elasticities for animal products; fruits, vegetables and root crops; and other foods are higher in rural areas – this may be due to:
• Income disparities between rural and urban areas• Rural households have relatively higher per capita consumption of cereals
National Results
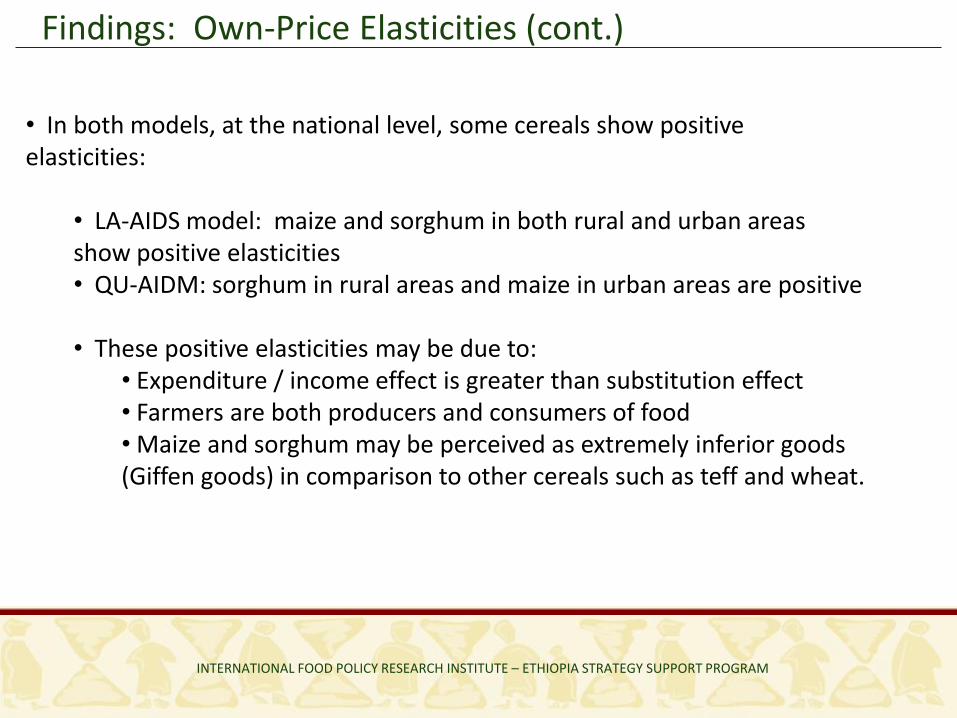
• In both models, at the national level, some cereals show positive elasticities:
• LA-AIDS model: maize and sorghum in both rural and urban areas show positive elasticities• QU-AIDM: sorghum in rural areas and maize in urban areas are positive
• These positive elasticities may be due to:• Expenditure / income effect is greater than substitution effect• Farmers are both producers and consumers of food• Maize and sorghum may be perceived as extremely inferior goods (Giffen goods) in comparison to other cereals such as teff and wheat.
Findings: Own-Price Elasticities (cont.)
INTERNATIONAL FOOD POLICY RESEARCH INSTITUTE – ETHIOPIA STRATEGY SUPPORT PROGRAM
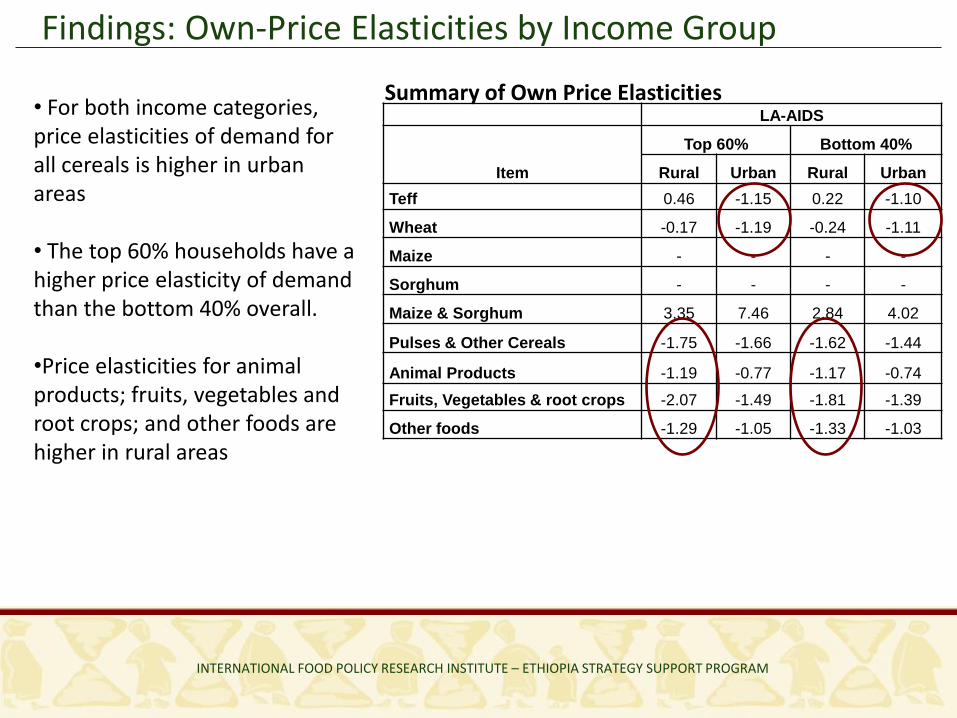
LA-AIDS
Item
Top 60% Bottom 40%
Rural Urban Rural Urban
Teff 0.46 -1.15 0.22 -1.10
Wheat -0.17 -1.19 -0.24 -1.11
Maize - - - -
Sorghum - - - -
Maize & Sorghum 3.35 7.46 2.84 4.02
Pulses & Other Cereals -1.75 -1.66 -1.62 -1.44
Animal Products -1.19 -0.77 -1.17 -0.74
Fruits, Vegetables & root crops -2.07 -1.49 -1.81 -1.39
Other foods -1.29 -1.05 -1.33 -1.03
Summary of Own Price Elasticities
Findings: Own-Price Elasticities by Income Group
INTERNATIONAL FOOD POLICY RESEARCH INSTITUTE – ETHIOPIA STRATEGY SUPPORT PROGRAM
• For both income categories, price elasticities of demand for all cereals is higher in urban areas
• The top 60% households have a higher price elasticity of demand than the bottom 40% overall.
•Price elasticities for animal products; fruits, vegetables and root crops; and other foods are higher in rural areas
INTERNATIONAL FOOD POLICY RESEARCH INSTITUTE – ETHIOPIA STRATEGY SUPPORT PROGRAM
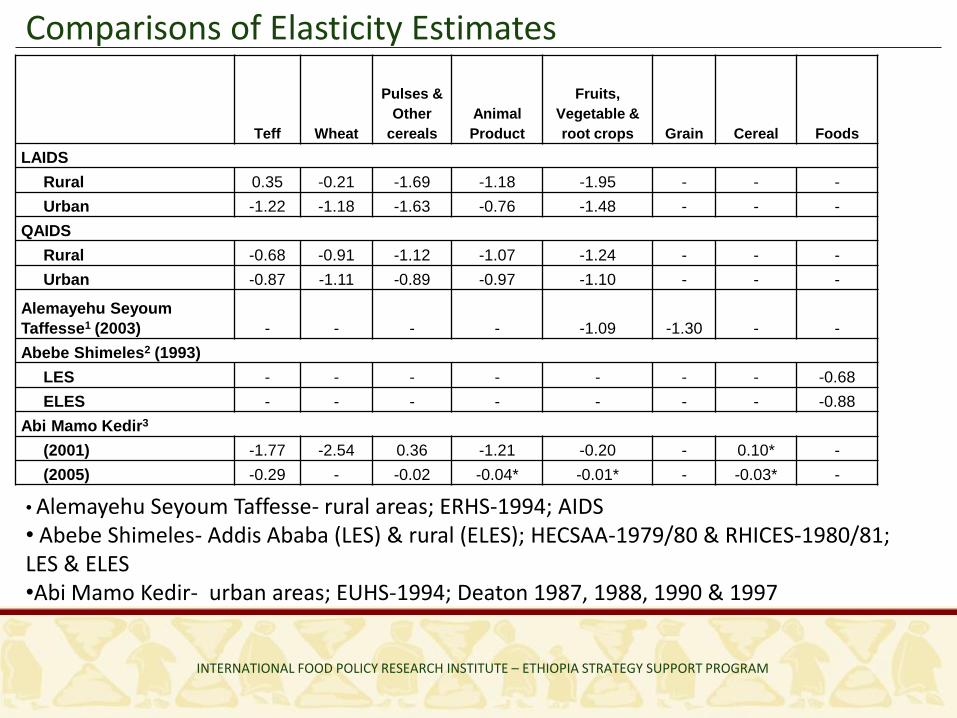
Teff Wheat
Pulses &
Other
cereals
Animal
Product
Fruits,
Vegetable &
root crops Grain Cereal Foods
LAIDS
Rural 0.35 -0.21 -1.69 -1.18 -1.95 - - -
Urban -1.22 -1.18 -1.63 -0.76 -1.48 - - -
QAIDS
Rural -0.68 -0.91 -1.12 -1.07 -1.24 - - -
Urban -0.87 -1.11 -0.89 -0.97 -1.10 - - -
Alemayehu Seyoum
Taffesse1 (2003) - - - - -1.09 -1.30 - -
Abebe Shimeles2 (1993)
LES - - - - - - - -0.68
ELES - - - - - - - -0.88
Abi Mamo Kedir3
(2001) -1.77 -2.54 0.36 -1.21 -0.20 - 0.10* -
(2005) -0.29 - -0.02 -0.04* -0.01* - -0.03* -
Comparisons of Elasticity Estimates
• Alemayehu Seyoum Taffesse- rural areas; ERHS-1994; AIDS• Abebe Shimeles- Addis Ababa (LES) & rural (ELES); HECSAA-1979/80 & RHICES-1980/81; LES & ELES•Abi Mamo Kedir- urban areas; EUHS-1994; Deaton 1987, 1988, 1990 & 1997
Conclusions
INTERNATIONAL FOOD POLICY RESEARCH INSTITUTE – ETHIOPIA STRATEGY SUPPORT PROGRAM
• There are substantial differences in staple food consumption across rural and urban, across agro-ecological zones (for rural households) and across income groups.
• Teff consumption (kgs per capita) is 3 times higher in urban than in rural areas.• Maize and sorghum account for 34 percent of calorie consumption in rural Ethiopia.• Enset accounts for 22 percent of calories in the highland enset-based agro-ecological zone.
• Expenditure elasticities of demand for staples are generally higher for the poor than for the non-poor: poor households tend to spend a higher percentage of additional incomes on food staples than do non-poor households.
• For most household groups in Ethiopia, own-price elasticities for cereals are large (-0.21 to -1.69) indicating substantial response to change in prices.
• Imposition of a uniform income tax would affect food consumption of urban households more than rural households
• Urban households have higher expenditure elasticities for staples
• The poorest 40% would be more affected than the richest 60% because they have higher budget shares for staples
• Although public wheat imports and food aid is designed to primarily benefit low and middle income households, the richer 60% of households also benefit substantially from reduced grain prices and would significantly increase their wheat consumption
• Their own-price elasticity of demand for wheat is high (-1.19 )• The wheat budget share is higher for the poor, however• Poor households also have price-elastic demand for wheat and increase their wheat consumption when market prices fall.
Conclusions (cont.)
INTERNATIONAL FOOD POLICY RESEARCH INSTITUTE – ETHIOPIA STRATEGY SUPPORT PROGRAM