report - grid strategies llc
TRANSCRIPT

REPORTDESIGNING THE 21ST CENTURY ELECTRICITY SYSTEM: HOW ELECTRICITY BUYERS CAN ACCELERATE CHANGE
March 2021
TABLE OF CONTENTS08
12
14
19
44
61
82
96
98
103
106
EXECUTIVE SUMMARY
CHAPTER 1: INTRODUCTION AND PURPOSE
CHAPTER 2: 20TH CENTURY INDUSTRY STRUCTURE WAS DESIGNED
FOR THE 20TH CENTURY PORTFOLIO
CHAPTER 3: 21ST CENTURY RESOURCE MIX CHARACTERISTICS REQUIRE
NEW OPERATIONS AND PLANNING APPROACHES
CHAPTER 4: A NEW SHORT-RUN OPERATIONS APPROACH FOR THE
21ST CENTURY PORTFOLIO
CHAPTER 5: 21ST CENTURY MARKET STRUCTURE AND RESOURCE
PROCUREMENT
CHAPTER 6: TRANSMISSION INVESTMENT FOR A CLEAN PORTFOLIO
CHAPTER 7: UNANSWERED QUESTIONS FOR FURTHER RESEARCH
APPENDIX A: THE NEW ECONOMICS OF CLEAN ENERGY
APPENDIX B: PHYSICAL CAPACITY REQUIREMENTS AND
RESPONSIBILITIES
BIBLIOGRAPHY

AUTHORS & ACKNOWLEDGMENTS
ABOUT THE REBA INSTITUTE
The REBA Institute, an affiliate of the Renewable Energy Buyers Alliance, serves as a center of excellence for transformational clean energy research, thought leadership and educational resources that identify barriers, best practices and solutions to today’s clean energy challenges.
To learn more about the REBA Institute, please visit: reba-institute.org.
KEY CONTRIBUTORS
Rob Gramlich, Grid Strategies LLCFor the REBA Institute
With valuable input from Bryn BakerJay CasparyJennie Chen Darija CosicPeter Freed Michael GogginMichael PanfilJulia SelkerJesse SchneiderAvi Zevin
03

LIST OF TABLESTABLE 1 - GROWTH IN CLEAN ELECTRICITY
TABLE 2 - FULLY COMPETITIVE MARKET STRUCTURE
TABLE 3 - HIGHER VOLTAGE LINES ALLOW FAR MORE POWER DELIVERY
TABLE 4 - ULTIMATE DECISION-MAKER FOR RESOURCE ADEQUACY FUNCTIONS
19.
66.
85.
104.
04
FIGURE 1 – PEAK LOAD AND BASE LOAD
FIGURE 2 - HYPOTHETICAL ECONOMIC DISPATCH SUPPLY CURVE FOR SUMMER 2021
FIGURE 3 - 2035 PORTFOLIO
FIGURE 4 - MODELS OF FUTURE ENERGY PORTFOLIOS
FIGURE 5 - MODELED OUTPUT BY RESOURCE FOR JUNE 2050 IN THE EASTERN
INTERCONNECTION
FIGURE 6 - DECLINING CAPACITY VALUE OF SOLAR ENERGY AS PENETRATION INCREASES
FIGURE 7 - WIND AND SOLAR CAPACITY VALUES VS. PENETRATION
FIGURE 8 - POWER TRANSFER BETWEEN THE EASTERN AND WESTERN INTERCONNECTIONS
IN A LOW AND HIGH RENEWABLE PENETRATION SCENARIO
FIGURE 9 - NREL RENEWABLE ENERGY FUTURES TRANSMISSION NEEDS
FIGURE 10 - NREL RENEWABLE ENERGY FUTURES TRANSMISSION MAP
FIGURE 11 - EIPC TRANSMISSION NEEDS FOR CARBON-CONSTRAINED SCENARIO
FIGURE 12 - INTER-REGIONAL TRANSFERS OF POWER FOR A DECARBONIZED GRID
FIGURE 13 - FLEXIBILITY SUPPLY CURVE
FIGURE 14 - 2050 INCREMENTAL COST OF GHG REDUCTION SCENARIOS WITH AND WITHOUT
FIRM, CARBON-FREE RESOURCE OPTIONS
FIGURE 15 - THE MANY BALANCING AREAS OF THE U.S.
FIGURE 16 - DISPATCHABLE DEMAND ON VARYING TIMESCALES
FIGURE 17 - HOW PROCUREMENT WORKS IN A FULLY COMPETITIVE POWER MARKET
FIGURE 18 - TRANSMISSION INFRASTRUCTURE ECONOMIES OF SCALE
FIGURE 19 - CURRENT TRANSMISSION PLANNING AUTHORITIES
FIGURE 20 - COSTS OF NEW RENEWABLES VS. EXISTING CONVENTIONAL SOURCES
FIGURE 21 – EUROPEAN CAPACITY APPROACHES
LIST OF FIGURES14.
15.
21.
22.
26.
27.
28.
31.
32.
33.
34.
35.
38.
41.
45.
53.
68.
84.
89.
98.
105.
0504

LIST OF ABBREVIATIONS
AC Alternating Current
BA Balancing Authority
BCA Benefit Cost Analysis
BPA Bonneville Power Administration
BTM Behind-the-Meter
CAISO California Independent System Operator
CCS Carbon Capture and Storage
CEC California Energy Commission
CEO Chief Executive Officer
CPUC California Public Utilities Commission
DC Direct Current
DER Distributed Energy Resources
DOE Department of Energy
EIPC Eastern Interconnection Planning Collaborative
ELCC Effective Load Carrying Capac-ity
EPRI Electric Power Research Insti-tute
EPSA Electric Power Supply Association
ERCOT Electric Reliability Council of Texas
ESIG Energy Systems Integration Group
GW Gigawatt
GWH Gigawatt-hours
HVDC High Voltage Direct Current
IEA International Energy Agency
IPP Independent Power Producer
IRM Installed Reserve Margin
IRP Integrated Resource Planning
ISO Independent System Operator
ISO-NE ISO New England
KV Kilovolts
LBNL Lawrence Berkeley National Laboratory
LCOE Levelized Cost of Energy
LED Light-Emitting Diode
LOLE Loss of Load Expectation
LOLP Loss of Load Probability
LSE Load Serving Entity
EUE Expected Unserved Energy
FERC Federal Energy Regulatory Commission
FFR Fast Frequency Response
GET Grid-Enhancing Technologies
GHG Greenhouse Gases
06
ORDC Operating Reserve Demand Curve
PBR Performance-Based Regulation
PJM PJM Interconnection
PMA Power Marketing Administration
POLR Provider of Last Resort
PPA Power Purchase Agreement
PFR Primary Frequency Response
PRM Planning Reserve Margin
PSC Public Service Commission
MIT Massachusetts Institute of Technology
MOPR Minimum Offer Price Rule
MVA Megavolt Amperes
MW Megawatt
MWH Megawatt-hours
NERC North American Electric Reliability Corporation
NESCOE New England States Committee on Electricity
NREL National Renewable Energy Laboratory
NYISO New York Independent System Operator
PUC Public Utility Commission
PURPA Public Utilities Regulatory Policies Act
PV Photovoltaic
R&D Research & Development
RA Resource Adequacy
REALM Renewable Energy and Load Management
REBA Renewable Energy Buyer's Alli-ance
REC Renewable Energy Credit
RPS Renewable Portfolio Standard
RTO Regional Transmission Organization
SCED Security-Constrained Economic Dispatch
SO System Operator
SPP Southwest Power Pool
TREC Time-stamped Renewable Energy Credit
TW Terawatt
TWH Terawatt-hours
USAID United States Agency for International Development
VER Variable Energy Resource
VOLL Value of Lost Load
0706

EXECUTIVE SUMMARYPower system operation and planning approaches were designed for the resource mix of the 20th century. The utility and regulatory structure we inherited was designed for baseload, intermediate, and peak load-serving conventional power plants. The resource mix of the 21st century looks very different from the past. Its characteristics in both the short-term day-to-day operations time frame and the long-term investment and planning time frame will require different methods and institutions.
Decarbonizing 90 percent of the power system can be accomplished reliably and affordably with today’s technologies if best practice operating and planning institutions and methods are put in place. How to decarbonize the last 10 percent of the power system at a low cost is less clear at the present time. Innovation and research and development (R&D) will be important to develop “clean firm” sources.
Given cost trends, it is almost certain that a majority of electricity production will be from wind and solar energy. Wind and solar plants have variable output, can only be dispatched when their resource is available, and tend to be located remotely from population centers requiring new approaches to grid planning and management.
The question for short-term operations is how to run a reliable power system with a majority of the energy coming from variable renewable energy. Wind and solar plants tend to produce at different times and places than system load. Studies and experiences from around the world show that power systems can be operated with high-penetrations of renewable energy by moving energy to where and when it is needed. Power can be moved across time with battery energy storage and controllable demand, and potentially with longer duration
08

storage in the future. Power can be moved across space with transmission infrastructure and large regional power markets. There is always renewable output somewhere and at some time of day in a large, interconnected grid. Studies and experiences show a significant role for storage, demand response, and transmission to move power to where and when it is needed. Each of these resources play a unique and complementary role in this 21st century electricity portfolio. Placing these changes into short-term operations will require changes to system operations policies and institutions.
A key question for the long-term planning and investment time frame in a system relying predominantly on wind and solar energy that has zero marginal costs is how investors can invest in markets with low power prices and still recoup enough revenue to justify the investments. This challenge exists
Large regional transmission organizations
(RTOs) with best practice market design,
including fast dispatch and locational
and value-based pricing along with
hedging and a circuit-breaker mechanism
to protect consumers.
Transmission planning and cost allocation to
expand regional and interregional capacity
based on appropriate recognition of the
future electricity portfolio and the resilience
value of transmission.
The 21st century electricity system will require certain changes to achieve climate targets and to benefit all users:
Well-functioning energy procurement structures,
on a voluntary or mandatory basis, to facilitate
long-term contracting, resource adequacy, and
lower financing costs for the large amount of new
generation needed.
R&D in two principal areas to bring the costs down
and improve the performance of (1) clean long-
duration storage sources and (2) high voltage direct
current (HVDC) converter stations.
Resource adequacy assessments and stress
testing of the integrated power, gas, water,
and other infrastructure systems.
both for carbon-free sources and the other sources needed to balance the system when renewable output is low. This conundrum can be solved with more and better long-term contracting for the various electricity products, including flexibility, energy at all times, and environmental attributes. Improving long-term contracting will require changes to planning and investment institutions and policies. States will need to assign clear responsibility for resource procurement and forward contracting. Some states may wish to ensure that retail customers, especially small customers, are planned for by some regulated entity so that they are not exposed to too much price or reliability risk. Other states may wish to provide choice options to some or all customer classes, enabling them to procure the type of power they choose. Those states will need to balance consumer choice with consumer protections and ensure fair allocation of costs between customer classes.
Reliability and generation performance standards
to ensure reliability and resilience.
0908

RELIABILITY, MARKETS, AND CLEAN ENERGYThreats to reliability from polar vortices, summer heat waves, and other events over the last decade highlight the important role electricity plays in ensuring public health and safety, and the interconnectedness of our water, fuel, electricity, and other infrastructure systems. Ensuring that power systems of the future meet high levels of reliability, resilience, affordability, and clean energy requires continuous long-term, whole-system planning. While market forces can benefit customers in certain sectors of the electric industry, the whole industry remains “affected with the public interest” in the words of the U.S. Supreme Court, and will continue to require public policy and regulations of various types to meet the ongoing needs of all electricity customers.
Reliability and resilience can be ensured for all electricity customers through full-system assessments of how each region can meet load in all reasonably foreseeable situations. Regulators can perform stress tests to evaluate threats that may be present in a given region, and what a reliable, resilient, and low emission portfolio may be for that region.
In order to ensure a sustainable power system that meets all objectives of innovation and public policy there needs to be a balance of market forces and regulation. Market forces are not sufficient, in the case of the electricity sector, to drive efficient outcomes and enable choice and innovation. Rf cpcdmpc, public policies will be needed to continue to ensure reliability and that other public policy objectives are met.
Those sectors that remain natural monopolies or public goods as defined in economics, such as transmission, distribution, and system operation, will generally require a single entity that is fully regulated to perform the function. Structurally competitive sectors, such as generation, may benefit from allowing many participants rather than one entity with a legally enforced franchise monopoly. Expanding competition in generation and accelerating clean energy development will need to be paired with careful reviews, expansion of reliability regulations, and system planning as recent reliability incidents have reminded us.
ELECTRICITY CUSTOMER FOCUSAs changes are made to electric industry operations and planning methods and institutions, certain aspects of these changes will have particular impacts on large electricity customers. Relative to most other stakeholder sectors, large customers are uniquely concerned with reliability, cost, and emissions. Many customers are approaching 100 percent carbon-free purchasing of the megawatt-hours (MWhs) of energy they consume. It is not always feasible nor efficient for each customer to match their individual load and clean energy purchasing by time and location. The full power system must work together to enable all electricity customers to receive clean, reliable, and low-cost energy.
Large electricity customers can and should be involved in electricity policy along with the other stakeholder groups at the table in state, regional, and federal policy forums. Customers have the ability to drive demand for zero-carbon electricity sources
10
through their procurement and goals, and can advocate for the market structure and design changes that enable a low-carbon, reliable, and cost-effective power system. They can focus on the features of particular importance to their sector as associated policies develop. Customers may also pursue direct investments in complementary sectors beyond renewable energy procurement.
Of the changes necessary to decarbonize the power system in a reliable and efficient way, the following features are of particular benefit to large electricity customers:
• New RTOs in regions where they do not yetexist. RTO governance reform so that theoverall voting reflects equal weight fromelectricity customers and sellers. Marketdesign that accommodates state policy andcustomer bilateral contracting rather thancounteracting them.
• Hedging and price circuit-breakermechanisms to protect consumers whileenabling accurate price signals on the marginfor flexible resources.
• Market design that includes non-discriminatory operations reliabilityservices definitions that allow clean energyand customer-owned resources theopportunity to provide these services on alevel playing field.
• Independent, market monitoring andmitigation to keep wholesale powerprices competitive and protect allelectricity customers.
• Market design that is open to andbetter integrates distributed andenergy-limited resources.
• Transmission planning and oversight bythe Federal Energy Regulatory Commission(FERC) that achieves appropriate gridexpansion while ensuring the benefitsexceed costs, grid-enhancing technologiesare appropriately deployed, and thereplacement of old assets is done in away that captures longer term andregional efficiencies.
• Utility and state reliance on full competitionin the generation sector rather thanproviding any advantages to utility-ownedgeneration in both the operations orplanning time frame.
• New approaches to resource adequacythat appropriately allocate risks betweenelectricity customers and sellers, and betterreflect customer preferences.
1110

CHAPTER 1: INTRODUCTION AND PURPOSE
The purpose of this report is to identify the most important changes needed for the U.S. electric power system to achieve aggressive emissions reductions targets reliably and efficiently, and to identify which changes most significantly impact large electricity customers. The report is intended to be used by policymakers and key energy markets stakeholders as a roadmap for reforming the power sector, and by large electricity customers specifically to focus their attention and resources on relevant areas of market design.
Electricity customers have materially changed the US electricity resource mix in recent years as companies have met corporate climate goals by purchasing renewable energy. Since 2013, corporations have contracted nearly 35 gigawatts (GW) of renewable energy projects through power purchase agreements (PPA), green power purchases, green tariffs, or privately-owned projects.1 Taking their goals one step further, recent announcements by electricity customers are indicate not only a focus on renewable energy procurement, but also on net-zero emissions goals to further reduce their carbon footprint.
Customer interests have been increasingly influential in working with utilities and other market participants to drive state and federal electricity policy changes that accelerate clean energy deployment. It is natural for the interests of electricity customers to shape an industry through demand signals, yet in
a heavily regulated industry like electricity, change has to occur in regulatory policies as well. Customers are well-positioned to influence policy because they create jobs and drive economic development that is beneficial for all states. Many electricity customers themselves, even those who previously paid little attention to electricity, have built teams of energy procurement specialists and work with utilities, grid operators, regulators, and other policymakers around the country to navigate the electric industry and its regulatory labyrinth. The customer voice in policy proceedings carries extra weight since state and federal economic regulatory policies are based on consumer protection statutes.
1 REBA Institute, “REBA Deal Tracker.”
12 13
2 Brattle Group and REBA Institute, “Renewable Energy Policy Pathways Report.” 3 See, e.g., Edison Energy, “Renewable Energy Impact v. Additionality: How and Why PPAs Matter.”4 Brattle Group and REBA Institute, “Renewable Energy Policy Pathways Report.”
The large electricity customer perspective is unique in the regulatory area because they care as much as any stakeholder about reliable service and cost, and about the environmental attributes of energy procurement. At the end of the day customers must run their offices, data centers, stores, warehouses, and factories with reliable energy and remain cost-competitive in global markets. This combination of priorities adds a unique dimension to past electricity stakeholders and interest groups.
Electricity customers have an interest in the whole electricity portfolio. Customers have focused in recent years on their own service and have made great strides in changing their own procurement approach in recent years.2 However, separating individual purchases from the rest of the electricity system is not possible since customers and the power grids that serve them are a tightly integrated system. Electricity customers with environmental objectives have gone to great lengths to ensure their energy procurement creates incremental clean energy that displaces carbon-emitting generation.3
As more electricity customers meet aggressive renewable energy goals through their own strategies, they are turning to look at the whole electricity supply mix to make sure it supports their environmental, reliability, and cost objectives long term. Customers are increasingly focused on ways in which they can engage on and design utility tariffs and policies that increase access to clean energy for all customers. Where individual procurement is not a workable pathway this group may engage in the broader effort to decarbonize the system as a means to realize their renewable energy commitments.
Electricity customers have a significant interest in the wholesale market even though they are
traditionally retail end-users because of existing operations in many states, and an understanding of how wholesale market dynamics affect the quality and price of retail service. While some have commercial building roofs amenable to on-site solar photovoltaics (PV), nearly all electricity customers pursue lower-cost, utility-scale projects. They observe obstacles with integrating renewable energy in today’s wholesale power systems, and recognize integration of the whole portfolio must be managed strategically to incorporate as much renewable energy as they want to procure. Further, large electricity customers are asking the question of how to maximize their impact on decarbonizing the system, whether through procurement of renewables or in other ways.
This report builds on the REBA Institute Renewable Energy Policy Pathways Report,4 which provides a roadmap to assist large electricity customers in meeting their renewable energy purchasing objectives. The report concludes that an accommodating bulk power system is a pre-condition to electricity customers achieving their ambitious energy goals. This report attempts to paint the rest of the picture beyond retail access to renewable energy, describing what is necessary for the broader bulk power system to support a roadmap for clean, reliable, and efficient for all customers.
This report begins by describing the current state of the electricity portfolio and today’s rules and procedures that were developed to manage the resource mix of the past. It then surveys research on the reliable, efficient, and low-carbon resource mix of the future and evaluates and recommends operations, investment structures, and policies to support a clean energy driven resource mix. The report concludes by identifying unanswered questions and areas for further inquiry.
01312 13

CHAPTER 2: 20TH CENTURY INDUSTRY STRUCTURE WAS DESIGNED FOR THE 20TH CENTURY PORTFOLIO
Beginning early in the 20th century, electric power systems around the world followed a common pattern of operation and planning. Policies and procedures were designed to reliably and efficiently manage the portfolio of resources that were available at the time, which were predominantly composed of coal, nuclear, oil, hydropower, and natural gas resources.
Each utility owned a fleet of these plants to serve their territory, and utilities developed policies and procedures for two time frames: operations for hour-to-hour and day-to-day dispatching of the fleet to serve demand (termed “load”) as it cycled up and down each day, and planning for investing in future plants to meet future load growth.
20TH CENTURY OPERATIONS WERE DESIGNED FOR THE 20TH CENTURY FLEET OF RESOURCESCoal, nuclear, oil, and natural gas plants have certain operational characteristics that led to a particular way of operating the system each hour and day. These plants were typically discrete, large, and inflexible, while load followed a reasonably predictable diurnal pattern – low at night and high during the day. A certain amount of load was present both day and night, called “base load,” while additional load would turn on during the day for manufacturing operations, offices, summer air conditioning, and appliance use, called “peak load” as shown in Figure 1 below.
5 Sinovoltaics, "Base Load and Peak Load."
FIGURE 1PEAK LOAD AND BASE LOAD
LOA
D IN
KW
OR
MW
TIME IN HOURS
PEAK LOAD
BASE LOAD
14

6 U.S. Energy Information Administration, “Today in Energy: Dispatch Curve.”
CHAPTER 2:20TH CENTURY INDUSTRYSTRUCTURE WAS DESIGNEDFOR THE 20TH CENTURY PORTFOLIO
The daily cycling between base and peak load led to the operations approach of cycling some units on and off, while leaving other units running all the time. Some units, such as nuclear and low-cost coal units, tended to run all day every day and serve base load. All other units were dispatched in sequential order of lower to higher operating cost to serve peak load, with the most expensive to run units utilized least of all. Dispatching controllable units in economic merit-order to meet predictable load, called economic dispatch, became standard practice for operating power systems around the world.
To respect transmission limits, termed security constraints, out of merit dispatch would be required every time a lack of transmission
system capacity prevented the least cost generator in a system from serving load. To handle security constraints, standard software and systems protocols were developed to implement security-constrained economic dispatch (SCED), a computational method of minimizing variable operating costs needed to reliably serve load across the entire system, subject to transmission capacity constraints. A SCED optimization could be performed by the utility multiple times a day to meet changing load and flow patterns. Traditional economic dispatch is shown in the form of a supply curve in Figure 2 below with increasing load on the horizontal axis and increasing cost on the vertical axis:
FIGURE 2HYPOTHETICAL ECONOMIC DISPATCH SUPPLY CURVE FOR SUMMER 20216
1514

7 Ramteen, O’Neill, and Oren, “Economic Consequences of Alternative Solution for Centralized Unit Commitment In-Ahead Electricity Markets.8 Kahn, The Economics of Regulation: Institutional Issues.
The traditional fleet also had significant operational constraints and limitations for operators to work around. Most units needed multiple hours or even days of lead time to become operational and incurred additional operating costs for each start up. Operators would address these costs through a separate “unit commitment” optimization, typically a day or two ahead of the operating hour. From a mathematical standpoint, these costs led to much more complicated optimization problems, as there was no smoothly increasing supply curve as the simplified Figure 2 suggests.7 These limitations of traditional generators also added costs to the system. Generators needed to be paid enough to cover costs in order to justify starting them up.
20TH CENTURY RESOURCE PLANNING WAS DESIGNED FOR THE 20TH CENTURY PORTFOLIOIn addition to their operations, utilities around the world developed a typical approach to long-term planning to meet long-term demand growth. Transmission, distribution, and conventional generation plants exhibited significant economies of scale, meaning the cost-per-megawatt (MW) was lower for very large plants than for small units. It did not make sense to have two sets of lines running down every street. Economies of scale lead to the economic phenomenon known as “natural monopoly” where high fixed costs create barriers to entry, even if variable costs are low. Through most of the industry’s history, electric utilities fit into the conventional economic framework as natural monopolies, as described
by one of the leading economists in the field of industrial organization: “as long as the tendency prevails for unit costs to decline with an increasing volume of business, because of economies of scale internal to the firm, it is more efficient, other things being equal, to have one supplier than several.”8
On the demand side of the industry, long-term electricity load tended to grow predictably multiple percentage points every year. To keep up with expanding load growth, it made sense to invest every few years in discrete, large generators that met system needs and integrated well into the existing portfolio.
A common utility business model was developed to fit these traditional supply and demand characteristics. The structure emerged early in the 20th century, developed by Thomas Edison’s personal secretary, Samuel Insull. Insull established the first electric utilities with a regulatory compact that allowed these companies an exclusive monopoly franchise to own and expand their generation, transmission, and distribution capacity, in return for committing to provide minimum levels of service at regulated rates. The monopoly structure allowed the company to take advantage of the large economies of scale. To achieve the coordination required between generation, transmission, and distribution, the utilities were vertically integrated, with a single entity owning all three sectors. Oversight was performed by either an economic regulator for investor-owned utilities, a municipality for municipally owned
16
9 For standard ratemaking practices, see Bonbright, Danielsen, and Kamerschen, Principles of Public Utility Rates, 291.10 See Panfil, “From Attleboro to EPSA.”11 See Kahn, The Economics of Regulation: Institutional Issues, and Yergin and Stanislav, The Commanding Heights: The Battle for the World Economy.12 Joskow and Schmalensee, Markets for Power.13 Borenstein and Bushnell, The US Electric Industry 20 Years After Restructuring.
systems, or a cooperative board for consumer-owned systems. This oversight entity would pre-approve investments and authorize cost recovery from retail end-users. Ratemaking followed a standard practice which applied to other regulated industries such as airlines, rail, and telecommunications.9 Each generation investment was large and discrete, such that each one was a major public policy decision, with local jobs and tax base implications.
Utility planning and regulation took place over siloed vertical monopolies, with relatively small connections among utility territories and thus among U.S. states. Federal regulation was non-existent until the Supreme Court ruled that states could not regulate inter-state sales, leading Congress to pass the Federal Power Act in 1935 to fill this gap.10 For most of the 20th century, federal electricity regulation played only a minor role relative to state and local regulation.
INDUSTRY STRUCTURE BEGAN MAJOR CHANGE AT THE END OF THE 20TH CENTURY
Towards the end of the 20th century, a wave of de-regulation took place in the U.S. and abroad covering formerly state-owned or regulated monopoly-owned industries such as railroads, airlines, telecommunications, and trucking.11 As economists began noticing the declining economies of scale in the generation sector of the industry,12 the electric power sector came under the de-regulation pressures as well. The seeds of third-party, non-utility generation
were sown as part of federal efforts to reduce reliance on foreign oil following the energy crises of the 1970s. Enactment of the 1978 Public Utilities Regulatory Policies Act (PURPA) required utilities to buy the output from independent suppliers if their resources could provide service at less than the utility’s avoided cost. PURPA created a new independent power producer (IPP) industry. The Energy Policy Act of 1992 furthered its growth by easing the regulations on IPPs selling wholesale power. As technologies advanced, the economies of scale in generation continued to decline, which allowed more widespread investment by smaller IPPs and smaller generation projects. Right at the turn of the century there was a large investment in IPP generation, as the share of generation owned by IPPs rose from 1.6 percent in 1997 to 25 percent in 2002.13
The operations and planning and the associated regulatory structure we have inherited from the 20th century were designed to fit the particular resource mix in use then. As we explore in the next chapter, the characteristics of the 21st century resource mix are different in both the operational and long-term investment time horizons. Changes will need to be made in how to operate and invest with the 21st century portfolio.
1716

20th century industry structure was designed for the 20th century portfolio
18

CHAPTER 3: 21ST CENTURY RESOURCE MIX CHARACTERISTICS REQUIRE NEW OPERATIONS AND PLANNING APPROACHESCOST TRENDS HAVE CHANGED THE OUTLOOK FOR ELECTRICITY RESOURCESAcross the energy system there have been a handful of game-changing technologies that have reached the cost and maturity level to be ready for wide deployment. Together, they provide reason to believe that significant decarbonization of power, transportation, and building energy use can be achieved. Power generated by new wind and solar plants is now competitive with that of new and existing fossil fueled plants.14 LED light bulbs use 75 percent less energy than incandescent bulbs, reducing aggregate consumption materially. Electric heat pumps can reduce energy use by 50 percent, be powered by increasingly clean electricity, and now function in cold climates, promising to displace natural gas and fuel oil for most home and building heating.15 Lithium-ion batteries
can now power cars, trucks, and portable electronics for sufficiently long periods of time to meet customer driving demands, and the same technology is being used for balancing in electric power systems.
Current trends suggest these technologies are growing, and a significant and rapid evolution of the resource mix is already underway. In the power sector, renewable sources are growing steadily every year while older, less efficient, and higher emitting generating units retire. From 2009-2019, wind and solar power grew from 1.9 percent of the electricity generated in the U.S. to 8.8 percent. Over the same period, coal generation fell from 44 percent to 23 percent of total U.S. generation.16 Table 1 shows that from 2009 to 2019, aggregate capacity for wind, solar, and battery storage has increased by 184 GW.
TABLE 1GROWTH IN CLEAN ELECTRICITY17
Resource 2009 capacity 2019 capacity
Wind 35 GW 108 GW
Solar 1 GW 75 GW
Battery Storage 0.059 GW 1.6 GW
14 Lazard, “Levelized Cost of Energy and Levelized Cost of Storage – 2020.” 15 U.S. Department of Energy, “Heat Pump Systems.”16 U.S. Energy Information Administration, “Electric Power Annual 2009,” U.S. Energy Information Administration, “What Is U.S. Electricity Generation by Energy Source?”17 BloombergNEF and the Business Council for Sustainable Energy, “2020 Sustainable Energy in America Factbook,” and U.S. Energy Information Administration, “Battery Storage in the United: An Update on Market,” 9.
1918
U.S. coal capacity, on the other hand, is expected to fall by 29 GW as uneconomic plants retire and customer and state preferences, and environmental regulations impact its future prospects.18
Nuclear capacity is estimated to decrease by 10.5 GW over the next five years, as more plant retirements are expected relative to new construction.19 In the future, new nuclear technologies could reverse the nuclear decline. Most existing units are expected to stay
on-line since their going-forward costs are likely justified by moderate valuation of their carbon-free attributes20 and states, which often value the jobs they provide, have shown the willingness to support them with public policy. Meanwhile, geothermal and hydroelectric capacity, including pumped hydropower storage remain steady21 with opportunities to grow as clean and dispatchable resources, but with more limitations on available sites than wind and solar. Appendix A describes the cost and viability of electricity resources.
18 Bloomberg NEF and the Business Council for Sustainable Energy, “2020 Sustainable Energy in America Factbook,” 21.19 U.S. Energy Information Administration, “Today in Energy: Three Mile Island Is the Latest Nuclear Power Plant to An-nounce Retirement Plans.”20 “There are potentially significant savings from retaining the region’s most economically competitive nuclear plants.” See Hull et al., “Least Cost Carbon Reduction Policies in PJM,” 10.21 BloombergNEF and the Business Council for Sustainable Energy, “2020 Sustainable Energy in America Factbook,” 23.
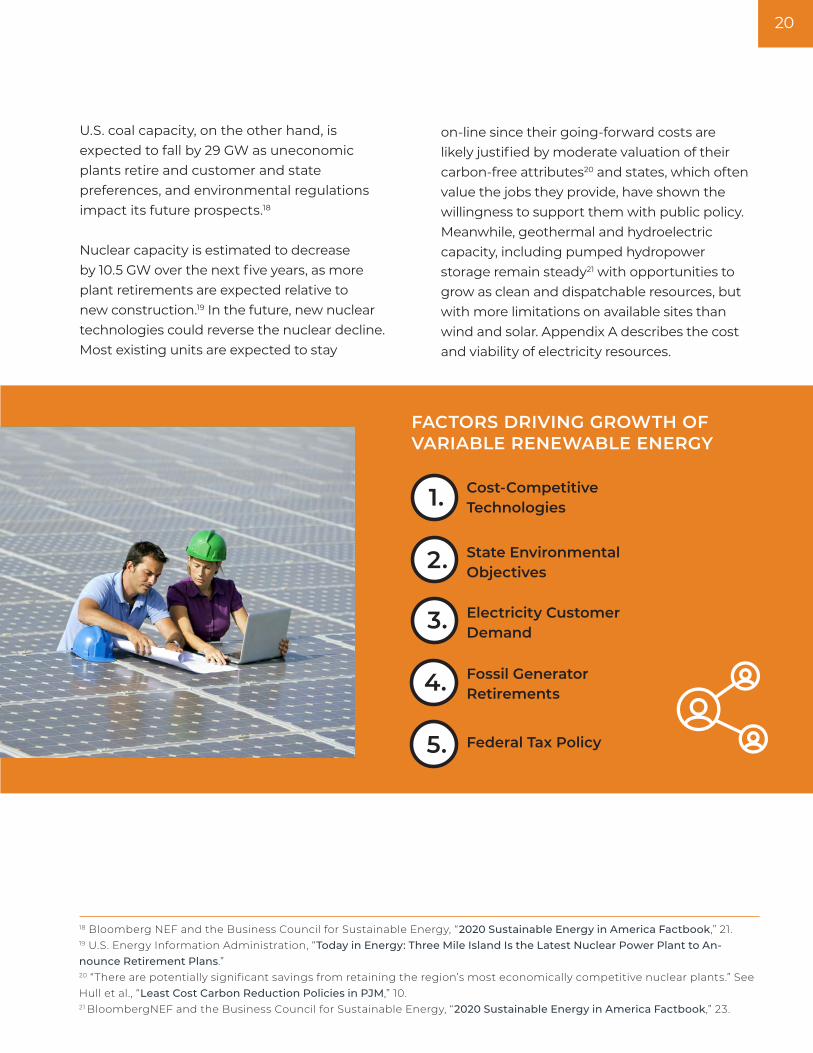
FACTORS DRIVING GROWTH OF VARIABLE RENEWABLE ENERGY
Cost-Competitive Technologies
State Environmental Objectives
Electricity Customer Demand
Fossil Generator Retirements
Federal Tax Policy
1.
3.
2.
4.
5.
20

CERTAIN COMPONENTS OF THE 21ST CENTURY PORTFOLIO ARE WIDELY AGREED-UPONGiven cost and technology trends described in Appendix A, it is almost inevitable that power systems around the world will increasingly rely on wind and solar energy for a majority of their energy. No other commercially available sources offer large amounts of new low-cost carbon free electricity. All regions of the U.S. and most other countries have ample wind and solar resource availability to support rapid growth.
Future resource portfolio analyses are being studied by many utilities, states, national laboratories, and academic institutions, with results largely consistent across studies. A typical portfolio is shown in Figure 3 from a 2020 report by GridLab and the University of California, and UC Berkeley, with wind and solar making up approximately two-thirds of the energy production in a largely carbon-free supply mix.
FIGURE 32035 PORTFOLIO22
Wind onshore 43.3%
Wind offvshore
Wind onshore
Utility PV
Other
Nuclear
Hydro
Gas CCGT
Dist PV
Wind offshore 2.0%Utility PV 22.9%
Other 1.5%
Nuclear 13.1%
Hydro 5.5%
Gas CCGT 10.1%Dist PV 2.1%
Coal 0.0%
Battery -1.6%
US TOTAL SHARE IN 2035
22 Phadke et al., “2035 The Report: Plummeting Solar, Wind, and Battery Costs Can Accelerate Our Clean Electricity Future.”
2120

A 2020 Princeton University-led modeling effort found "that wind and solar power have dominant roles in all pathways," while there was competition between hydropower, nuclear, and fossil with Carbon Capture and Storage (CCS) for the rest of the portfolio.23 Figure 4 below from the Princeton study shows wind and solar making up the majority of most portfolios with the low renewable
scenario, labelled E+ RE-, still achieving 48 percent of energy production.
There is little dispute about the quantity or cost of wind and solar energy. The main question for system planners and modelers is how a power system can provide reliable service at all times, given the variable nature of wind and solar output. We turn to that question next.
FIGURE 4MODELS OF FUTURE ENERGY PORTFOLIOS
23 Larson et al., “Net Zero America,” 88.
22

AN ELECTRICITY RESOURCE MIX REQUIRES ITS ELEMENTS TO FIT TOGETHER TO MAKE A BALANCED WHOLENo individual energy source is inherently reliable or unreliable since reliability is a system concept and no power system uses only one source. Rather, certain portfolios can be reliable if operated and planned properly. In this section we address how a clean energy portfolio with wind and solar making up a majority of the energy can work. The next chapter will cover system operations requirements in more detail.
The low-cost clean energy resources discussed above only work if they are part of reliable power system operation. Wind and solar energy output fluctuates with weather. A number of power systems around the world have pioneered new ways of operating to take these characteristics into account, and there is now a rich body of modeling and operating practice showing that systems with high penetrations of renewable energy can maintain reliable service.24
To meet load in all hours there are certain system requirements unique to electricity. Electric demand must equal supply at every moment of every day. If load and generation are not kept in balance, system voltage and frequency deviate, damaging equipment attached to the electric system and potentially leading to a cascading outage. Such an imbalance can happen in a matter of seconds, as various blackouts over the years have demonstrated.25 Although short-duration energy storage is being widely deployed, its total capacity is still capable only
of serving a small fraction of total demand at any given moment. As there are not yet widely deployable, low-cost, longer-duration storage technologies, the need for sufficient generating resources to meet demand at all times will persist. Additionally, to support the stability of system frequency, reserves are needed to rapidly fill in gaps when generation or load changes. Finally, power systems also require voltage support as discussed below.
This section explains how a portfolio of clean energy resources, working together, can meet load all hours of every year and meet other frequency and voltage support requirements.
VARIABILITY OF RENEWABLE RESOURCES IS A KEY FEATURE TO ADDRESS IN SYSTEM OPERATIONSEach individual resource type presents certain operational capabilities and constraints. For example, renewables provide variable output within a range of uncertain forecasts; storage provides fast and precise dispatchability with a limit to duration of supply; standard existing nuclear plants in the U.S. provide steady output with little flexibility to cycle; and so forth.
The power system has always used a portfolio of generation technologies because few resources economically offer all three of the primary services necessary for reliability: energy, firm (or “dispatchable”) energy, and flexibility. Traditionally, the responsibility for those services were divided between two basic types of generation, as discussed in Chapter 1, flexible peaking capacity resources with a low capital cost and a high cost of energy, and inflexible “baseload” units with a low cost of energy.
24 See International Energy Agency, “Introduction to System Integration of Renewables,” Lew et al., “Secrets of Successful Integration,” and Mai et al., “Renewable Electricity Futures Study: Executive Summary.”25 North American Electric Reliability Corporation, “1996 System Disturbances.”
2322
The future clean resource mix will expand and adjust the portfolio of generation resources. As described in the studies cited above, zero marginal cost renewable resources will provide most of the energy. Dispatchable resources like energy storage will provide capacity and flexibility, but will not add to net energy production.
The variable output of wind, solar, and run-of-river hydropower generation, which can only be dispatched up to the real-time strength of wind speed, solar irradiance, or water flow, is the most well-understood new operational characteristic of a clean electric system. For wind and solar, output for a given resource type will correlate across geographies and as a result present covariate risks; for example, solar resources across a wide region may suffer reduced output simultaneously from a large storm with significant cloud coverage.26
For system operators whose job it is to match supply and demand at every moment, the challenge is that the timing and level of renewable generation output often does not match the timing and level of demand, requiring them to dispatch other energy sources that can change output or “ramp” up or down. The “duck curve” of the California system, which results from high deployments of solar power coming offline as the sun sets, now features a regular
net load (i.e., load minus renewable energy) change of more than 15 GW (or 30 percent of peak demand) over the 3 hours leading into nighttime.27 Grids such as South Australia’s are beginning to experience “minimum generation events” where the daytime production from distributed solar power is leading to the need to “shed generation” that cannot be backed down past a minimum operational level to maintain system stability.28
While both wind and solar facility output vary across days, season, and years,29 the characteristics of that variable output differ by technology. In addition to sub-hourly variability caused by cloud cover,30 solar power production changes predictably across seasons due to the change in daylight availability over the course of the year, with the magnitude of change between winter and summer output more pronounced at higher latitudes.31 Additionally, the beginning and ending of daily production moves east-to-west across a given region. Wind power generally has lower sub-hourly variability and higher inter-annual variability,32 which is due to the stronger effect of regional climactic variance on wind resources compared to solar. Additionally, whereas the sun comes up every day, wind output can fluctuate over long periods and presents the possibility of a multi-day lack of significant production.33
26 See for example Thomas Hoff and Perez, “PV Power Output Variability: Calculation of Correlation Coefficients Using Satellite Insolation Data.”27 CAISO, “Draft Flexible Capacity Needs Assessment for 2020.”28 Australian Energy Market Operator, “Minimum Operational Demand Thresholds in South Australia.”29 Kumler et al., “Inter-Annual Variability of Wind and Solar Electricity Generation and Capacity Values in Texas.” 30 Mills et al., “Understanding Variability and Uncertainty of Photovoltaics for Integration with the Electric Power System.”31 Jacobson and Jadhav, “World Estimates of PV Optimal Tilt Angles and Ratios of Sunlight Incident upon Tilted and Tracked PV Panels Relative to Horizontal Panels.” 32 Wan, “Long-Term Wind Power Variability.”33 See Morison, “Britain Has Gone Nine Days Without Wind Power.”
24

as renewable sources. Electrification of other sectors of the economy will change load levels and load shapes, while also potentially adding a large amount of flexibility. Electrification of building and water heating loads, particularly in cold-weather regions, will likely increase winter peak demands significantly above shoulder seasons and cause some regions to switch from summer- to winter-peaking systems.35 Electrification of transportation may create more frequent and steeper peaks in demand, both on the system overall and within specific locations, depending on the extent to which the charging of electric vehicles is coordinated or responsive to price signals.36
The predictability of the local variations in wind and solar generation allows system operators to integrate these characteristics into their operations and planning. The system operators’ challenges and opportunities are explored in Chapter 4. The rest of this chapter looks more closely at renewable generation profiles and describes other technical considerations for a low-carbon electricity system.
In addition to this divergence between timing of demand and renewables supply, a future portfolio with significant bulk-scale wind and solar resources will diverge in terms of location of supply and demand. Wind and solar resources are location-constrained to regions with the highest quality resources and where sufficient land is available to realize economies of scale. Technological advances, such as increases in wind hub height and blade length and solar conversion efficiencies, may unlock geographies for deployment that are not economical today. However, the sheer magnitude of needed deployments is likely to dominate this effect and produce a system that relies significantly on geographic movement of energy to ensure it is delivered to the location of demand. Technology also cannot overcome the fundamental physical fact that wind and solar plants in good resource areas are at least twice as productive as those in lower-quality resource areas.34
System variability may increase at certain times and places from demand side as well
34 American Wind Energy Association, “Grid Vision: The Electric Highway to a 21st Century Economy,” 33.35 Vibrant Clean Energy, “Minnesota’s Smarter Grid: Pathways Toward a Clean, Reliable and Affordable Transportation and Energy System.”36 Bedir et al., “California Plug-In Electric Vehicle Infrastructure Projections: 2017-2025.”
2524

emits 95 percent less carbon than today. The red areas show solar output each day while the green area shows wind output relative to the black line which is total load. Wind and solar tend to complement each other by producing at different times. The orange area shows short-duration batteries filling in gaps and helping to meet evening air conditioning load for a few hours after the sun goes down. The light blue on top shows curtailed output when there is excess supply, which is part of a least cost portfolio even though it is wasted energy. The gray area shows how the existing gas fleet can be used as a dispatchable source of stand-by power to fill remaining gaps. With low-cost renewables that often do not produce at the time and location of load, curtailment is likely to be more prevalent. It is clear from observing power system operations and such models that each resource plays a distinct role and only together can they meet load at all times.
A MAJORITY RENEWABLE PORTFOLIO CAN MEET LOAD IN ALL HOURS A useful metaphor for describing the power system is that of an orchestra where each resource serves as an instrument section and the grid operator serves as a conductor. While some specialization has always existed with certain units meeting baseload and other units cycling to meet peak load, the future portfolio has more unique roles and responsibilities. This has implications for how the orchestra of the grid is assembled (planned) and conducted (operated).
One can visualize how a clean energy portfolio meets load by looking at plots of hour-by-hour dispatch of a reliable low carbon power system. Figure 5 shows output by each resource as modeled in for a summer month in 2050 for the Eastern Interconnection with a portfolio that is over 80 percent renewable energy and
FIGURE 5MODELED OUTPUT BY RESOURCE FOR JUNE 2050 IN THE EASTERN INTERCONNECTION37
24 Clack et al., “Consumer, Employment, and Environmental Benefits of Electricity Transmission Expansion in the Eastern U.S.” See also resources here: Future Power Markets Forum, “Reliable, Efficient, and Low-Carbon Resource Portfolios,” and Slusarewucz and Cohan, “Assessing Solar and Wind Complementarity in Texas,” Sepulveda et al., “The Role of Firm Low-Carbon Electricity Resources in Deep Decarbonization of Power Generation,” Energy and Environmental Economics, Inc, “Study of Policies to Decarbonize Electric Sector in the Northwest I Public Generating Pool, 2017 – Present,” and Berghout, van dan Broek, and Worrell, “Synergies Between Renewable Energy and Energy Efficiency.”
26
will be needed. At higher solar penetrations, the time of greatest energy scarcity becomes the early evening after the sun sets and customer demands remain high. Using the orchestra metaphor above, a certain number of cellos are needed, but so are other strings, as well as brass, woodwinds, and percussion.
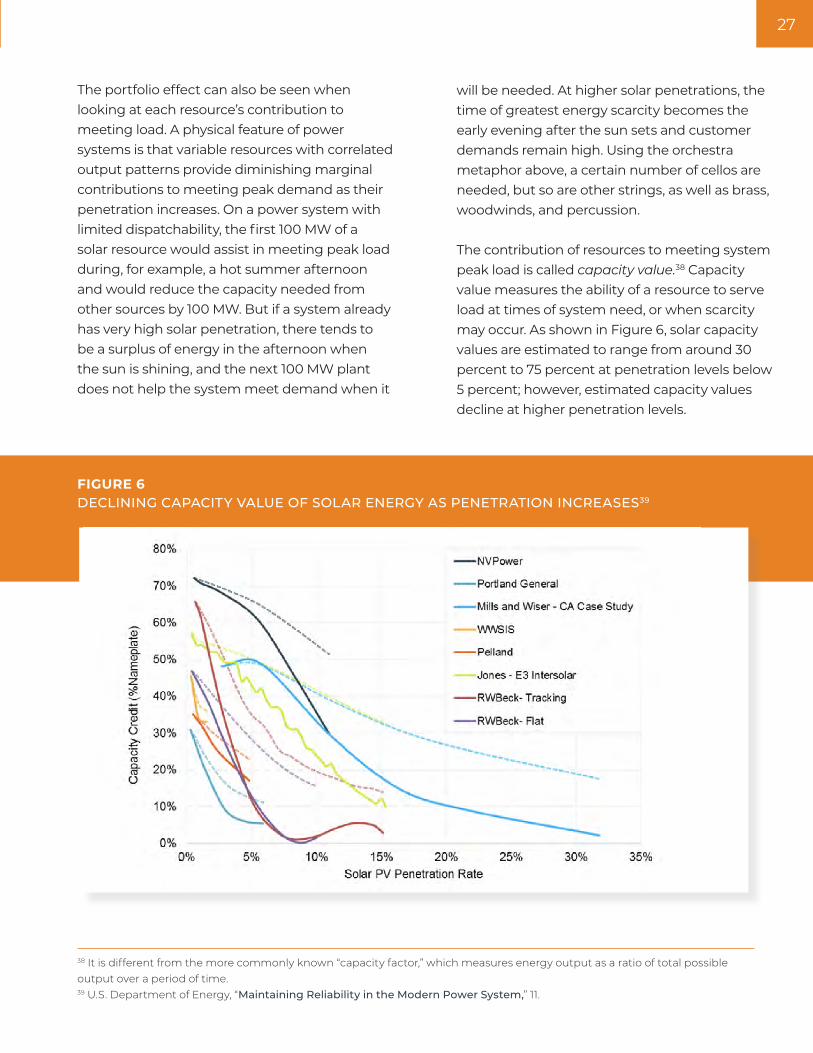
The contribution of resources to meeting system peak load is called capacity value.38 Capacity value measures the ability of a resource to serve load at times of system need, or when scarcity may occur. As shown in Figure 6, solar capacity values are estimated to range from around 30 percent to 75 percent at penetration levels below 5 percent; however, estimated capacity values decline at higher penetration levels.
The portfolio effect can also be seen when looking at each resource’s contribution to meeting load. A physical feature of power systems is that variable resources with correlated output patterns provide diminishing marginal contributions to meeting peak demand as their penetration increases. On a power system with limited dispatchability, the first 100 MW of a solar resource would assist in meeting peak load during, for example, a hot summer afternoon and would reduce the capacity needed from other sources by 100 MW. But if a system already has very high solar penetration, there tends to be a surplus of energy in the afternoon when the sun is shining, and the next 100 MW plant does not help the system meet demand when it
FIGURE 6DECLINING CAPACITY VALUE OF SOLAR ENERGY AS PENETRATION INCREASES39
38 It is different from the more commonly known “capacity factor,” which measures energy output as a ratio of total possible output over a period of time.39 U.S. Department of Energy, “Maintaining Reliability in the Modern Power System,” 11.
2726
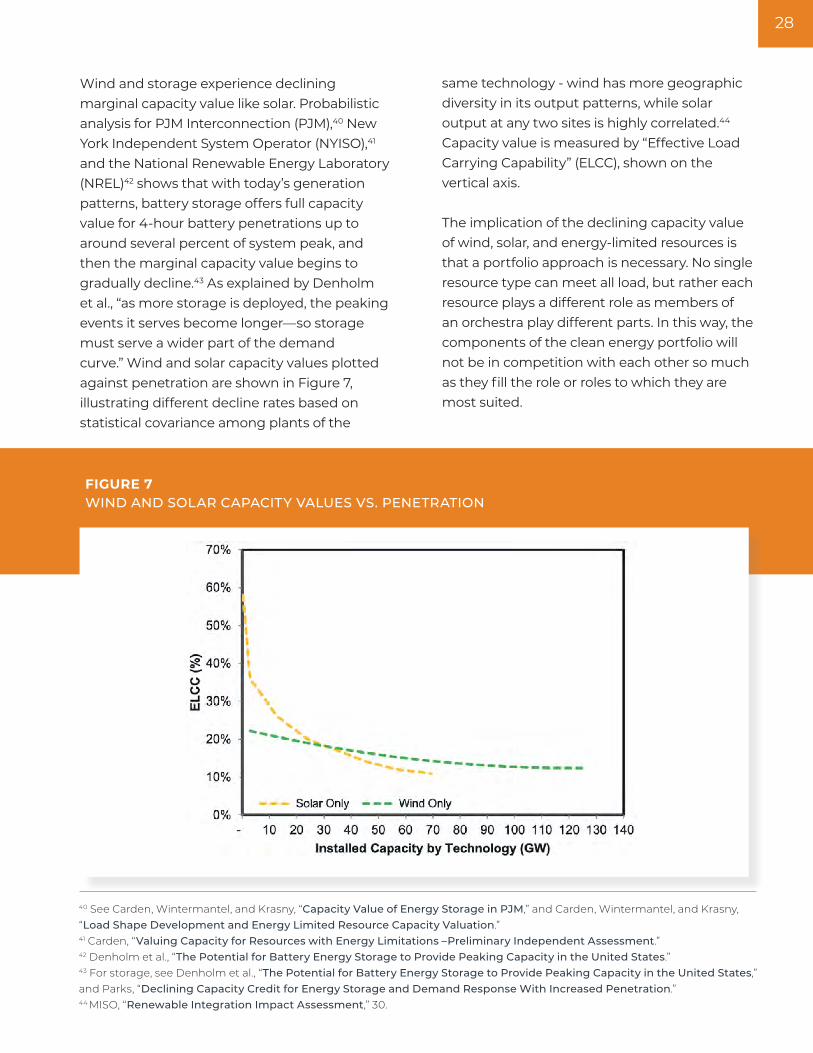
same technology - wind has more geographic diversity in its output patterns, while solar output at any two sites is highly correlated.44 Capacity value is measured by “Effective Load Carrying Capability” (ELCC), shown on the vertical axis.
The implication of the declining capacity value of wind, solar, and energy-limited resources is that a portfolio approach is necessary. No single resource type can meet all load, but rather each resource plays a different role as members of an orchestra play different parts. In this way, the components of the clean energy portfolio will not be in competition with each other so much as they fill the role or roles to which they are most suited.
Wind and storage experience declining marginal capacity value like solar. Probabilistic analysis for PJM Interconnection (PJM),40 New York Independent System Operator (NYISO),41 and the National Renewable Energy Laboratory (NREL)42 shows that with today’s generation patterns, battery storage offers full capacity value for 4-hour battery penetrations up to around several percent of system peak, and then the marginal capacity value begins to gradually decline.43 As explained by Denholm et al., “as more storage is deployed, the peaking events it serves become longer—so storage must serve a wider part of the demand curve.” Wind and solar capacity values plotted against penetration are shown in Figure 7, illustrating different decline rates based on statistical covariance among plants of the
FIGURE 7WIND AND SOLAR CAPACITY VALUES VS. PENETRATION
40 See Carden, Wintermantel, and Krasny, “Capacity Value of Energy Storage in PJM,” and Carden, Wintermantel, and Krasny, “Load Shape Development and Energy Limited Resource Capacity Valuation.” 41 Carden, “Valuing Capacity for Resources with Energy Limitations –Preliminary Independent Assessment.” 42 Denholm et al., “The Potential for Battery Energy Storage to Provide Peaking Capacity in the United States.”43 For storage, see Denholm et al., “The Potential for Battery Energy Storage to Provide Peaking Capacity in the United States,” and Parks, “Declining Capacity Credit for Energy Storage and Demand Response With Increased Penetration.”44 MISO, “Renewable Integration Impact Assessment,” 30.
28

Wind, solar, and storage increase the capacity value of each other, so that their combined capacity value is greater than the sum of their parts. Because wind and solar output tend to occur at different times (i.e., in most regions wind produces more power at night and less power during the summer, the opposite of solar), incremental solar offers more capacity value on a power system with a high wind penetration, and vice versa. To some extent, certain resources fit together particularly well. The National Renewable Energy Laboratory (NREL) found that on a power system with 10 percent of its energy provided by solar, the capacity value of short-duration battery energy storage declines half as fast as on a power system with no solar.45 This occurs because solar helps meet peak load during the late afternoon, shortening the duration of the peak net load period to a few hours in the early evening and allowing limited duration batteries to better meet the peak.
A recent report found that roughly the same penetration levels of wind, solar, and storage were deployed under varying low-carbon scenarios as they each played unique roles meeting load at different times and places, regardless of their relative costs.46 The same report, along with many others, also found a unique need and role for transmission and the spatial movement of power, to which we turn next.
45 Denholm et al., “The Potential for Battery Energy Storage to Provide Peaking Capacity in the United States.”46 See Clack et al., “Consumer, Employment, and Environmental Benefits of Electricity Transmission Expansion in the Eastern U.S,” sections 6 and 8.
2928

larger geographies allow renewable energy to make up a greater share of the supply needed for overall system reliability.
The need to move power between regions was shown on a macro level in the NREL Interconnections Seam study, which allowed power to be transferred between the Eastern and Western Interconnections under three different transmission expansion scenarios. As shown in Figure 8, the study found that approximately 20 GW more energy, or twice as much, would be transferred between the Eastern and Western interconnections on a day-to-day basis in a high variable generation future compared to a low variable generation base case. The study found a need for 40,000-60,000 GW-miles of Alternating Current (AC) and up to 63,000 GW-miles of Direct Current (DC) transmission for one scenario. Transmission is measured in GW-miles, which is delivering one GW for one mile. The U.S. has approximately 150,000 GW-miles in operation today, so the need is about a two-thirds increase in transmission capacity to produce 74 percent of the energy from carbon-free sources. Importantly, the power moves back and forth, as shown below, demonstrating the optionality provided by transmission. Positive flow indicates net export from east to west, and negative flow indicates net imports to the east from the west, recorded in Eastern Standard Time.
SPATIAL MOVEMENT OF POWER WILL BE NEEDEDFor wind and solar energy to make large contributions to meeting load at all times, studies and operational experience indicate that large amounts of power must move across and between states and regions. Two physical phenomena are at work: (1) high quality, low-cost renewable resources are often located in areas remote from load, and the (2) variability and covariation of renewable output means that aggregating projects across a region creates a steadier aggregate supply than can be achieved at any given location.
A portfolio of wind and solar resources operated together produces output less variable and uncertain than that of any single resource, as it has greatly reduced exposure to localized weather events.47 The covariate risk of renewable output being unavailable is reduced by aggregations across larger geographies and multiple resource types.48 Weather events have limited geographic breadth, causing more distant wind or solar resources to have less correlated output. The correlation of output between two neighboring wind plants is close to 100 percent, while plants in the Midwest 400 miles away are only 20-35 percent correlated.49 Every region will have somewhat different correlation coefficients, but this dynamic shows up in experiences and models around the world. As a result, aggregations of resources across
47 Hoff and Perez, “PV Power Output Variability: Calculation of Correlation Coefficients Using Satellite Insolation Data.”48 As a recent study in Nature Climate Change concluded “the average variability of weather decreases as size increases; if wind or solar power are not available in a small area, they are more likely to be available somewhere in a larger area.” The study notes that “paradoxically, the variability of the weather can provide the answer to its perceived problems.” See MacDonald et al., “Future Cost-Competitive Electricity Systems and Their Impact on US CO2 Emissions.” See also Shaner, Matthew R., et al., “Geophysical Constraints on the Reliability of Solar and Wind Power in the United States,” 914. Additionally, a database of studies on complementarity among renewables can be found in Jurasz et al., “A Review on the Complementarity of Renewable Energy Sources.”49 Van Horn, Pfeifenberger, and Ruiz, “The Value of Diversifying Uncertain Renewable Generation through the Transmission System,” 10, and Osborn, “Lessons Learned in Wind Generation.”
30

The Princeton University Net Zero America study described above found “high voltage transmission capacity expands ~60 percent by 2030 and triples through 2050 to connect wind and solar facilities to demand; total capital invested in transmission is $360 billion through 2030 and $2.4 trillion by 2050.”53
Similarly, the aforementioned study finds necessary inter-state transfers of power to increase from 90 GW in 2018 to 760 GW in 2050 under either a high wind or high solar case.51 The report concludes, “regardless of future trends in carbon emissions or wind and solar costs, large amounts of new high-capacity transmission will be required.”52 More than 140,000 GW-miles of transmission were added in the scenarios, approximately doubling the delivery capacity of the current grid, with wind and solar providing over 70 percent of generation.
FIGURE 8Power transfer between the eastern and western interconnections in a low and high renewable penetration scenario50
50 Bloom et al., “The Value of Increased HVDC Capacity Between Eastern and Western U.S. Grids: The Interconnections Seam Study,” 7.51 Unpublished data from authors. Note that these numbers reflect transfers across multiple states and in some cases power moves across many states. 52 Clack et al., “Consumer, Employment, and Environmental Benefits of Electricity Transmission Expansion in the Eastern U.S,” 20.53 Larson et al., “Net Zero America,” 77.
3130

maintain reliability. The pool of flexible resources, like generators and responsive load, increases as the size of the balancing authorities (BAs) is increased. Balancing should be conducted over the largest geographic area possible, either through consolidating smaller BAs or through coordinated operations.”55
Consistent with the Eastern Interconnect study discussed above, the NREL-led Renewable Energy Futures study, found a need for 200,000 GW-miles of transmission to meet a national 80 percent renewable energy goal. Figure 9 shows this transmission need as it relates to renewable energy penetration.
A North American Electric Reliability Corporation (NERC) task force similarly found that “The benefits of larger balancing areas with fewer transmission constraints can be substantial. Resolving transmission constraints is critical because larger balancing areas lose many of the benefits associated with size if constraints are in play.”54 It also explained, “Variability and uncertainty can be reduced through aggregation. Larger aggregations of wind and solar generation are proportionately less variable. Forecast accuracy is also improved for larger wind and solar aggregations. Net variability is reduced when variable energy resources (VERs) are aggregated with load, and it is net variability that must be balanced to
FIGURE 9NREL renewable energy futures transmission needs56
54 North American Electric Reliability Corporation, “Integration of Variable Generation Task Force,” 46.55 North American Electric Reliability Corporation, “Integration of Variable Generation Task Force,” 56.56 Mai et al., “Renewable Electricity Futures Study: Executive Summary,” 27.
32
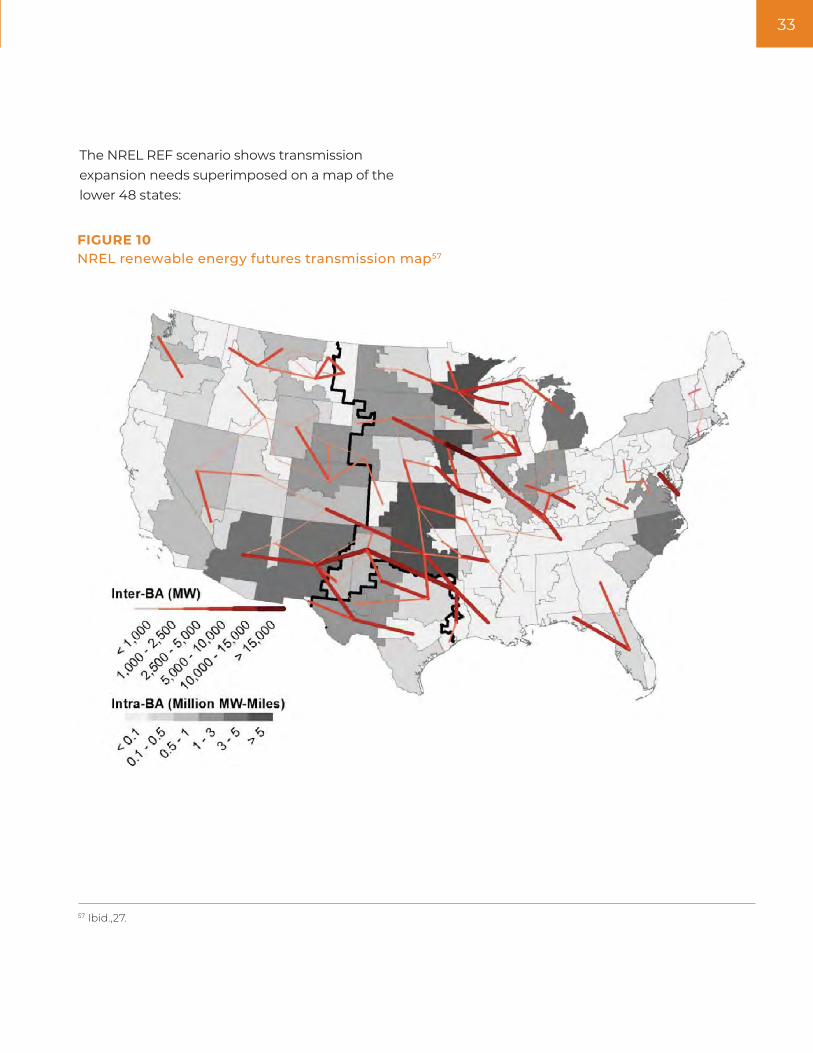
The NREL REF scenario shows transmission expansion needs superimposed on a map of the lower 48 states:
FIGURE 10NREL renewable energy futures transmission map57
57 Ibid.,27.
3332

Renewable Portfolio Standards (RPS), between 2015 and 2030. The expansion, however, is expected to introduce annual operating cost savings corresponding to $52.6 billion and $9.7 billion, respectively, for each scenario.58 This shows that the transmission needed for renewable energy integration and power balance also pays for itself by accessing low-cost generation and enabling more efficient power system operations. The EIPC carbon constrained scenario found the need for transmission in the areas shown in Figure 11.
The Eastern Interconnection Planning Collaborative (EIPC), funded by the U.S. Department of Energy, also found the need for transmission expansion in the Eastern interconnection. The report found that scenarios with a carbon constraint and renewable portfolio standard are expected to require up to $115 and $80 billion worth of transmission expansion respectively because more transmission needed for the national carbon constraint than the regionally implemented
FIGURE 11EIPC transmission needs for carbon-constrained scenario59
58 See Eastern Interconnection Planning Collaborative, “Phase 2 Report: Interregional Transmission Development and Analysis for Three Stakeholder Selected Scenarios and Gas-Electric System Interface Study,” 5-6, and Eastern Interconnection Planning Collaborative, “Phase 2 Report: Interregional Transmission Development and Analysis for Three Stakeholder Selected Scenarios and Gas-Electric System Interface Study,” CR-16.59 Eastern Interconnection Planning Collaborative, “Phase 2 Report: Interregional Transmission Development and Analysis for Three Stakeholder Selected Scenarios and Gas-Electric System Interface Study,” CR-10.
34
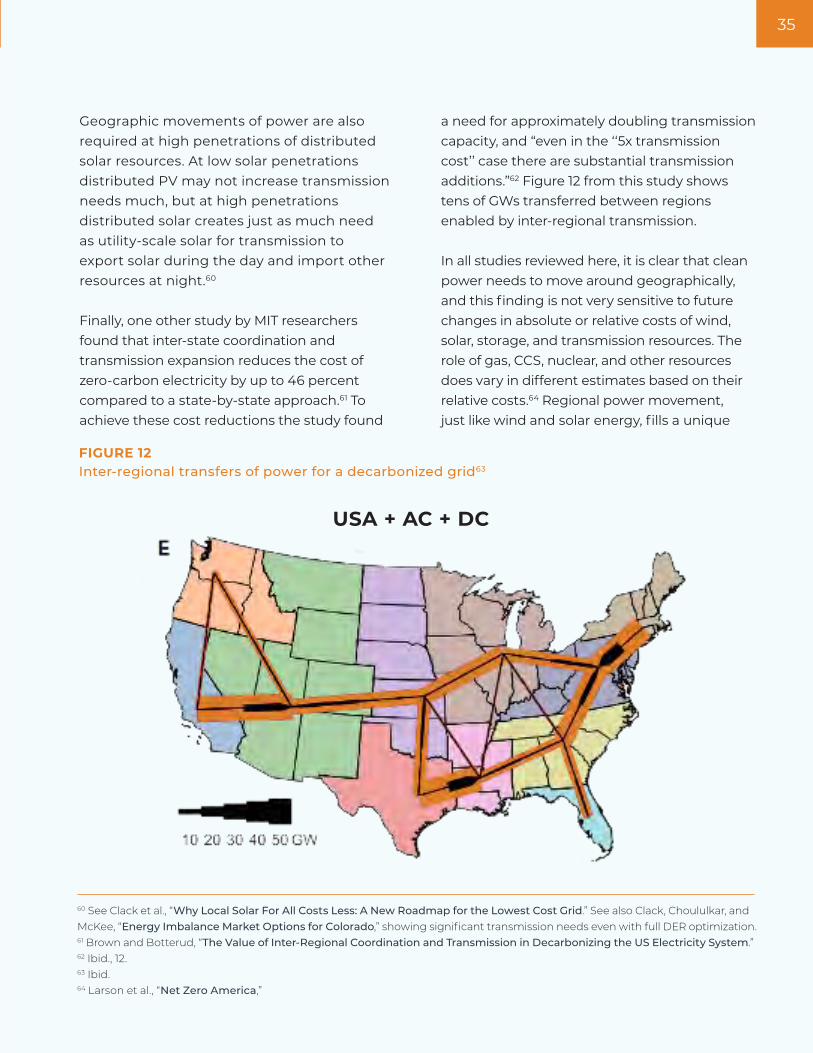
a need for approximately doubling transmission capacity, and “even in the ‘‘5x transmission cost’’ case there are substantial transmission additions.”62 Figure 12 from this study shows tens of GWs transferred between regions enabled by inter-regional transmission.
In all studies reviewed here, it is clear that clean power needs to move around geographically, and this finding is not very sensitive to future changes in absolute or relative costs of wind, solar, storage, and transmission resources. The role of gas, CCS, nuclear, and other resources does vary in different estimates based on their relative costs.64 Regional power movement, just like wind and solar energy, fills a unique
Geographic movements of power are also required at high penetrations of distributed solar resources. At low solar penetrations distributed PV may not increase transmission needs much, but at high penetrations distributed solar creates just as much need as utility-scale solar for transmission to export solar during the day and import other resources at night.60
Finally, one other study by MIT researchers found that inter-state coordination and transmission expansion reduces the cost of zero-carbon electricity by up to 46 percent compared to a state-by-state approach.61 To achieve these cost reductions the study found
FIGURE 12Inter-regional transfers of power for a decarbonized grid63
60 See Clack et al., “Why Local Solar For All Costs Less: A New Roadmap for the Lowest Cost Grid.” See also Clack, Choululkar, and McKee, “Energy Imbalance Market Options for Colorado,” showing significant transmission needs even with full DER optimization.61 Brown and Botterud, “The Value of Inter-Regional Coordination and Transmission in Decarbonizing the US Electricity System.”62 Ibid., 12.63 Ibid. 64 Larson et al., “Net Zero America,”
USA + AC + DC
3534

Cost of transmission was incorporated into these system models. Fox-Penner notes that “transmission lines, while unsightly, are inexpensive compared to all types of generators and storage, and themselves have economies of scale.”68 A study by Lawrence Berkeley National Laboratory (LBNL) scientists found transmission for a high renewable portfolio costs between $1/MWh and $10/MWh,69 which equals around one-fifth of the cost of generation.
role in the clean energy portfolio. Energy storage helps balance supply and demand locally and can increase the utilization rates of transmission lines by absorbing wind or solar generation that would have been curtailed and releasing it when the transmission is no longer congested. However, energy storage itself is unable to move power from region to region.65
Transmission is needed regardless of how much future energy is provided by distributed energy resources (DERs). In a recent analysis of the benefits of incorporating large amounts of DERs, the detailed modeling study found that almost the same amount of transmission was needed with or without a large amount of DERs.66
Importantly, increasing transmission capacity is cheaper than the equivalent expansion in supply resources to meet system reliability. A thorough survey of research on power system needs for decarbonization by Peter Fox-Penner in his book Power after Carbon, concluded, “These modeling efforts consistently find that adding large amounts of big wind and solar projects in areas where these resources are best, and building more transmission to reach them, beats the cost of adding only local power and storage without grid expansion.”67
65 See Clack et al., “Consumer, Employment, and Environmental Benefits of Electricity Transmission Expansion in the Eastern U.S,” 23, Vibrant Clean Energy, “Minnesota’s Smarter Grid: Pathways Toward a Clean, Reliable and Affordable Transportation and Energy System,” and Clack, “Modernizing Minnesota’s Grid: An Economic Analysis of Energy Storage Opportunities MISO-Wide Electricity Co-Optimized Planning Scenarios.”66 Clack et al., “Why Local Solar For All Costs Less: A New Roadmap for the Lowest Cost Grid,” 53.67 Fox-Penner, Power After Carbon, 60.68 Ibid., 61.69 Gorman, Mills, and Wiser, “Improving Estimates of Transmission Capital Costs for Utility-Scale Wind and Solar Projects to Inform Renewable Energy Policy.”
36

Flexibility sources exist on a supply curve of various options with different costs. Figure 13 shows lower cost options on the lower left and higher cost options on the upper right. To achieve very high penetrations of renewable energy, most or all of these options will likely be needed.
TIME-SHIFTING AND FLEXIBILITY WILL BE NEEDEDAlong with moving power spatially across regions, future power systems will require fast-responding resources to handle sudden imbalances. With more variable resources on the system that are not perfectly predictable, it will be necessary to shift consumption and production over time with storage and other flexible resources. At certain times, wind and solar energy will supply most or all of demand. At other times, other resources will be needed. These balancing resources will be needed in multiple time scales, from milliseconds to minutes to hours, days, seasons, and even years to address variability in each time frame.
The NREL 80 percent Renewable Energy Futures study found that load could be met at all times if more sources of flexibility were engaged:
70 Mai et al., “Renewable Electricity Futures Study: Executive Summary,” iii.
“The central conclusion of the analysis is that renewable electricity generation from technologies that are commercially available today, in combination with a more flexible electric system, is more than adequate to supply 80 percent of total U.S. electricity generation in 2050 while meeting electricity demand on an hourly basis in every region of the United States…RE Futures finds that increased electric system flexibility, needed to enable electricity supply-demand balance with high levels of renewable generation, can come from a portfolio of supply- and demand-side options, including flexible conventional generation, grid storage, new transmission, more responsive loads, and changes in power system operations.”70
3736

FIGURE 13Flexibility supply curve71
71 Pérez-Arriaga et al., “Adapting Market Design to High Shares of Variable Renewable Energy.”
38
Hydropower will also likely shift from producing MWh to serving as a source of capacity and flexibility, which will be more valued in a high renewable energy portfolio. Northern European power systems, for example, have shifted to send excess renewable power to Scandinavia, where hydropower plants are dispatched down and store energy in their reservoirs, and then later release that energy at times of low renewable output. Hydro-based systems in East Africa are adding dispatchability capabilities to help balance systems as wind and solar increase. Canada has significant reservoirs of hydro in British Columbia, Manitoba, and Quebec that could be used as part of a more integrated North American power systems to help with balancing, especially since it is a rare source of low-cost long-duration storage.76 Some new opportunities exist to develop pumped storage to provide shorter-term flexibility.
Another way to smooth out excesses and shortages is to produce hydrogen with surplus renewable output during those time periods.77 As noted earlier, excess renewable electricity can be used to create a range of hydrogen-based fuels, which can help with seasonal imbalances, taking advantage of surplus renewable energy in the spring and fall when there isn’t much demand for heating or cooling. Hydrogen-based fuels could also be burned in retrofitted natural gas plants to provide a clean firm source to support resource adequacy.
Many resources including natural gas, hydro, and others would likely shift to operate more as flexible balancing resources than energy sources in a high renewable energy portfolio.72 With high levels renewable energy levels on a system, energy will be plentiful but flexibility and capacity will be more in demand and valuable. One recent study by Energy and Environmental Economics (E3) for the Electric Power Supply Association (EPSA) found
“One overarching trend across all scenarios is that flexible thermal resources such as gas plants, tend to decrease as a share of energy supply over time while maintaining their share of system capacity. In effect, [the model] shows gas generation increasingly displaced by renewables over time but maintains gas capacity to ensure reliability requirements are met and thermal generation can ramp up to serve periods of low renewable energy supply.”73
Another study for the Pacific Northwest found that new gas plants were needed but would only operate at 3 percent capacity factor.74 The GridLab/UC Berkeley 2035 report found “Of the 360 GW of natural gas dispatch in 2035 under the 90% lean case, 70 GW has a capacity factor below 1%.”75 A challenge for electricity policy makers is to assign the costs of these rarely-used resources, as we will discuss in Chapter 5.
72 See Bradbury, “Implications of Intermittency,” And Pöyry, “The Challenges of Intermittency in North West European Power Markets: The Impacts When Wind and Solar Development Reach Their Target.”73 Hull et al., “Least Cost Carbon Reduction Policies in PJM,” 29.74 Ming et al., “Resource Adequacy in the Pacific Northwest,” 43.75 Phadke et al., “2035 The Report: Plummeting Solar, Wind, and Battery Costs Can Accelerate Our Clean Electricity Future,” 19.76 See National Renewable Energy Laboratory, “North American Renewable Integration Study.”77 Wartsila Energy, “Path to 100% Renewables for California.”
3938

of inverter-based resources and the retirement of synchronous generators in certain areas can harm grid strength, especially where transmission capacity is limited. These situations can occur in remote renewable resource areas and is thus particularly relevant for planning a reliable, efficient, and low carbon system. Grid-forming inverter technology could be developed in the future to support grid strength.80 Transmission investments can help strengthen grids, but without any other such solution, minimum levels of synchronous generation may be needed in these areas to support voltage. This will likely continue to be mostly addressed by transmission planning and the interconnection process which drives the decision to build transmission, tune generator controls, or, in the future, use wind, solar, and storage resources with grid-forming converters; However, these processes can include some operational aspects like paying a synchronous condenser for its real power consumption while operating.
VOLTAGE NEEDS TO BE MAINTAINEDReactive power and voltage support are also needed to maintain the stable and efficient flow of power on the transmission system.78 Renewable and storage resources can provide this service, including when they are not otherwise supplying real power - solar plants can provide this service at night by running grid power through their inverters to provide reactive power. However, reactive power does not travel well on the grid. Therefore, renewable and storage resources may need to be distributed geographically to efficiently meet the need everywhere or else be complemented by other voltage and reactive power sources.
In addition to meeting load and providing inertia, grid strength is another reliability requirement.79 Grid strength is a measure of the voltage support of a system provided by synchronous generators and synchronous condensers. Unlike frequency, the location of voltage support matters as certain parts of the grid can be weaker than others, requiring additional voltage support. High penetration
78 Federal Energy Regulatory Commission, Order No. 827, 155 FERC ¶ 61,277.79 North American Reliability Corporation, “Integrating Inverter-Based Resources into Low Short Circuit Strength Systems.”80 GridLab and ESIG, “10 Things You Should Know about Grid-Forming Inverters.”
40

resources do not provide true instantaneous inertia, their primary frequency response is so fast (e.g., a few milliseconds response) that it offsets some of the need for inertia. Because conventional generators provide frequency response and inertia at near-zero cost, there is no market for these services today; rather, conventional generators are supposed to provide frequency response (though many do not) to comply with the grid code. Eventually power systems can be designed to operate with very low or zero inertia;83 in the interim, some regions are implementing minimum inertia requirements as a constraint in system unit commitment and dispatch.
LOSS OF INERTIA AND FREQUENCY SUPPORT NEEDS TO BE MANAGEDFrequency response is an increase in generation used to stabilize power system frequency in the seconds and minutes following the unexpected loss of a large generator.81 Today, this is mostly provided by conventional generators temporarily increasing their output, with the rotational inertia of all operating conventional generators and many motor loads slowing the decline in frequency until those generators have enough time to respond. Storage, and in some cases wind and solar resources, can provide frequency response much more quickly than conventional generators.82 While storage, wind, and solar
FIGURE 142050 incremental cost of GHG reduction scenarios with and without firm, carbon-free resource options84
81 See North American Electric Reliability Corporation, “Fast Frequency Response Concepts and Bulk Power System Reliability Needs,” and Electric Power Research Institute, “Ancillary Services in the United States: Technical Requirements, Market Designs and Price Trends.” 82 For solar energy’s ability to provide frequency support, see Energy and Environmental Economics, “Investigating the Economic Value of Flexible Solar Power Plant Operation.”83 Denholm et al., “Inertia and the Power Grid: A Guide Without the Spin,” 33.84 Hull et al., “Least Cost Carbon Reduction Policies in PJM,” 53.
4140

Unless systems have high levels of hydropower, there tends to be an inflection point in cost around 80 or 90 percent decarbonization. Figure 14 shows a typical increasing slope as carbon reductions approach 100 percent if there is no carbon-free firm resource available.
The known and commercially available resources that can provide long-duration output when wind and solar are not available are natural gas and nuclear fleets, as long as they stay on-line. While natural gas plants emit carbon, their total emissions can be reduced significantly from today’s levels even without carbon capture by dispatching only rarely in those times where wind, solar, energy storage, and demand response cannot deliver. To reach zero carbon, these natural gas units would need to be replaced by some alternative carbon-free firm resource. This resource type has been called a clean firm source.85 There are a number of options including fossil units with carbon capture and storage, geothermal, flexible nuclear, and power-to-gas hydrogen. Another option for North America would be to utilize the very large existing hydro reservoirs in Canada, which could balance U.S. regions if there were a high-capacity macro grid to connect it. Bringing the costs down for clean firm sources should be a focus of public and private sector R&D.
A sensible power sector decarbonization strategy therefore is to do what is known now to build the known clean energy portfolio that can achieve 90 percent emissions reduction while working to invent and improve clean firm sources for the last 10 percent.
THERE IS TIME TO FIGURE OUT THE LAST 10 PERCENT Many studies, including those referenced in this report, reach 90 percent decarbonization and 80 percent renewable energy without significant technical or economic barriers. However, the last 10 percent of decarbonization cannot be achieved on many systems at low cost with known and commercially available technology.
85 Sepulveda, Jenkins, de Sisternes, and Lester, The Role of Firm Low-Carbon Electricity Resources in Deep Decarbonization of Power Generation.
42
Likely the lowest cost carbon-free sourcein most areas
Also very low cost carbon-free energy, andtends to operate at times when solar does not
Low-cost source of fast ramping and balancing,helps optimize (raise utilization) of transmission
Low-cost source of ramping and balancing
The only way to physically move power spatially
For times of day, season, and year with high netload. Likely the existing gas fleet for the nextdecade, and could be a clean long durationstorage source in the future
• Solar energy
• Wind energy, both on and offshore
• Short-duration battery energystorage
• Demand response
• Transmission
• Firming resources
A GRID OPERATOR WILL NEED TO ASSEMBLE THE ORCHESTRA OF RESOURCESMany power systems are reaching penetration levels grid managers once believed were never possible. One grid operator CEO stated in testimony to the U.S. House Energy and Commerce Committee: “It was assumed a decade ago, when wind comprised less than one percent of SPP’s (Southwest Power Pool’s) generation mix, that an ISO (Independent System Operator)/RTO (Regional Transmission Organization) could never serve more than 20 to 30 percent of its load reliably with a variable resource like wind. Today, it’s the second most-prevalent fuel source in the SPP region, making up over 25 percent of our energy generated this year, behind only coal, and serves continually more and more of our load without any undesirable impacts to reliability.”86 He described how operating the system as a portfolio with sufficient ability to move the power around the region as the keys to this success: “Successful integration of wind and other renewable and variable energy resources is dependent on enabling transmission infrastructure, consolidated BAs [balancing authorities], and effective market processes. Such high levels of wind and other variable energy resources could not be reliably dispatched without sufficient transmission to move energy from where it’s generated to where it’s needed.”87 Electricity policy and economic structures must be based on how a future power system would physically work with most energy coming from wind and solar.
Just as an orchestra can only play nice music when well-conducted, the power system requires a conductor. The power system conductor is a grid operator. We turn to the grid operator and how they manage a system with high renewable penetration system next.
SUMMARY OF MANAGING THE 21ST CENTURY PORTFOLIOThe foregoing survey of research on portfolios shows a reasonably consistent set of resources that fit together to form a low-cost, reliable, and low emission portfolio. Together they can achieve around 90 percent decarbonization of the power sector with known commercially available technology, leaving a need for R&D on the last 10 percent. The likely portfolio includes:
86 Brown, Powering America: A Review of the Operation and Effectiveness of the Nation’s Wholesale Electricity Markets.87 Ibid.
Large electricity customers can consider expanding their business activity beyond renewable energy procurement into these complementary sectors, which are all needed and likely to grow in the future.
4342

Short-term electric system operations will need to adapt to ensure the future clean energy portfolio is reliable and efficient. The future portfolio of clean energy resources will possess different operational characteristics than the supply mix we have inherited, as described in Chapter 4. This chapter describes necessary system operations to integrate all the pieces into a working whole on an hour-to-hour and day-to-day basis; in other words, how the orchestra of a clean energy portfolio can be conducted.
OPERATE AS A LARGER REGIONAL SYSTEM As previously discussed, large spatial movement of power across and among regions will be needed both to access high quality resource areas and achieve a steady aggregate supply of energy. Spatial movement of power will require infrastructure as described in Chapter 6, and also large regional balancing areas.
Even before renewable energy entered power systems, one of the main changes to industry structure was to create large Regional Transmission Organizations (RTOs) that could
CHAPTER 4: A NEW SHORT-RUN OPERATIONS APPROACH FOR THE 21ST CENTURY PORTFOLIO
efficiently dispatch hundreds of generators across large areas and capture the benefits of load diversity. Assessments of the impacts of RTO/ISOs on costs to load show significant net benefits from joint dispatch and reduced transmission charges across large areas, relative to the earlier more balkanized system of siloed utilities independently dispatching and each system charging for fixed transmission costs for transferring power across.88 These studies find that seamless free flow of energy across a large region, without the need to physically schedule or pay capacity charges across each utility system, enables more efficient system dispatch.
The movement to RTOs has consolidated from hundreds of separate “balancing areas” to a smaller number of larger areas that can efficiently pool generation and load. Further consolidation of BAs is still needed in the Western and Southeastern U.S., where there are a far greater number of small BAs than elsewhere in the country (see Figure 15) and subsequently significant inefficiencies for moving clean energy across them.89
88 Cicala, “Imperfect Markets versus Imperfect Regulation in U.S. Electricity Generation,” Brown and Botterud, “The Value of Inter-Regional Coordination and Transmission in Decarbonizing the US Electricity System,” and Potomac Economics, “OMS-RSC Seams Study: Market-to-Market Coordination.” See also Midcontinent Independent System Operator, “MISO Value Proposition,” and PJM, “PJM Value Proposition.” 89 See Paulos, “A Regional Power Market for the West: Risks and Benefits.” See also Gimon et al., “Economic and Clean Energy Benefits of Establishing a Southeast U.S. Competitive Wholesale Electricity Market,” and Cicala, “Imperfect Markets versus Imperfect Regulation in U.S. Electricity Generation.”
44
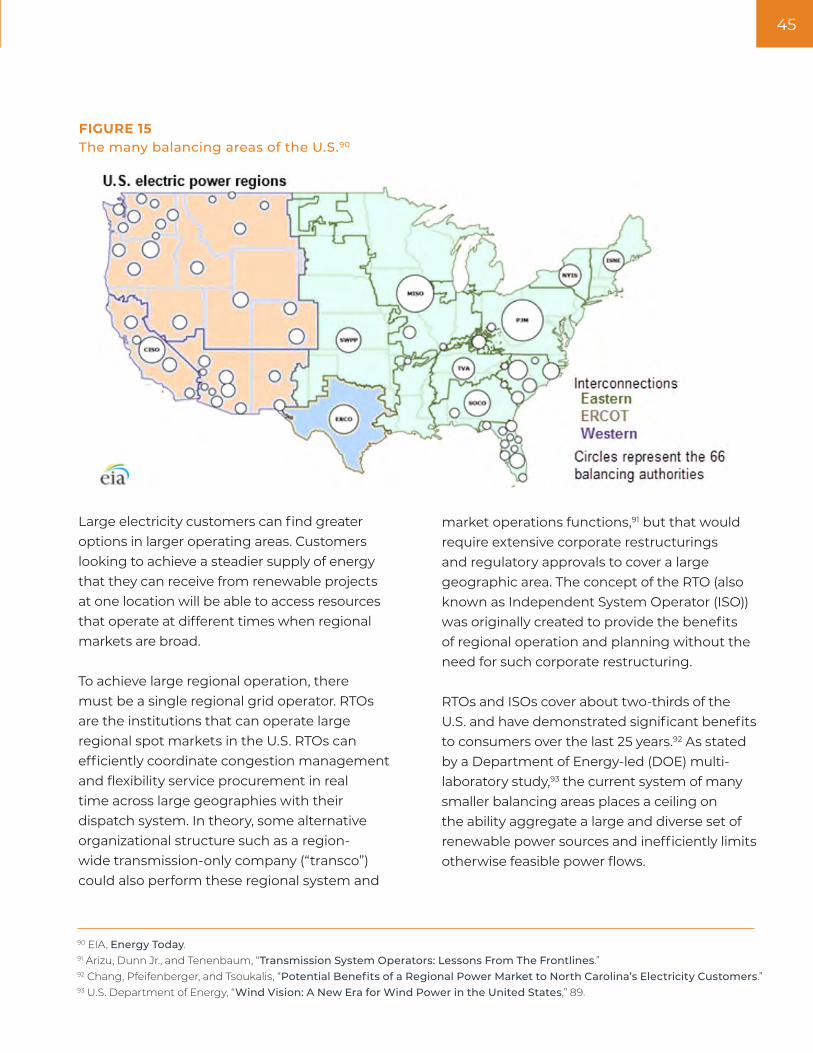
market operations functions,91 but that would require extensive corporate restructurings and regulatory approvals to cover a large geographic area. The concept of the RTO (also known as Independent System Operator (ISO)) was originally created to provide the benefits of regional operation and planning without the need for such corporate restructuring.
RTOs and ISOs cover about two-thirds of the U.S. and have demonstrated significant benefits to consumers over the last 25 years.92 As stated by a Department of Energy-led (DOE) multi-laboratory study,93 the current system of many smaller balancing areas places a ceiling on the ability aggregate a large and diverse set of renewable power sources and inefficiently limits otherwise feasible power flows.
Large electricity customers can find greater options in larger operating areas. Customers looking to achieve a steadier supply of energy that they can receive from renewable projects at one location will be able to access resources that operate at different times when regional markets are broad.
To achieve large regional operation, there must be a single regional grid operator. RTOs are the institutions that can operate large regional spot markets in the U.S. RTOs can efficiently coordinate congestion management and flexibility service procurement in real time across large geographies with their dispatch system. In theory, some alternative organizational structure such as a region-wide transmission-only company (“transco”) could also perform these regional system and
FIGURE 15The many balancing areas of the U.S.90
90 EIA, Energy Today.91 Arizu, Dunn Jr., and Tenenbaum, “Transmission System Operators: Lessons From The Frontlines.”92 Chang, Pfeifenberger, and Tsoukalis, “Potential Benefits of a Regional Power Market to North Carolina’s Electricity Customers.”93 U.S. Department of Energy, “Wind Vision: A New Era for Wind Power in the United States,” 89.
4544

In some of these RTOs, uneconomic “self-scheduling” of old units still frequently occurs, where a utility can choose to keep dispatching certain generators for their financial viability even if they are not economic.97 Full competitive market participation by all resources should be encouraged by state and federal policy makers.
UTILIZE HOURLY ENERGY PRODUCTS AND PRICES TO MEET LOAD IN ALL HOURSPower production and consumption need to always be in balance. Technically electric energy in each hour has always been a distinct “product,” because limited storage means energy produced in one hour cannot be substituted for energy in a different hour. The general RTO market design developed two decades ago does provide for hourly prices to vary based on hourly supply and demand. That system will generally work well in the future since it is flexible and allows prices to change as scarcity occurs at different times.
Price patterns will likely look very different with the future portfolio. Prices used to tend to be high in the afternoon, particularly in summer-peaking systems on summer days. But in the future there will likely be very high solar output in the afternoon, leading to lower hourly prices. The scarcity period is already shifting to evenings in California and Texas, after solar output drops. Hourly markets will need to address the scarcity periods that can occur at unexpected times of the season and year due to the interaction of weather and load, and the periods that last three or more days where shortages occur, often in the winter with high electric heating load, limited solar energy, and occasional periods of little wind.
Where RTOs do not exist, there is inefficient physical scheduling of transmission and capacity-based transmission service reservations, hindering the free flow of electricity across utility systems. To move power across multiple transmission systems, a transmission customer must pay multiple rates, known as “pancaked rates.” FERC has attempted to eliminate pancaked rates for over 20 years saying, “the elimination of rate pancaking for large regions is a central goal of the Commission's RTO policy, and has been a feature of all five ISOs the Commission had approved.”94 RTOs eliminate inefficient physical transmission scheduling and pancaked rates.95 While energy imbalance markets can reduce rate pancaking,96 they do not have the full coordinated dispatch and commitment provided by RTOs. Any remaining seams between RTOs should be operated in a close coordinated fashion such that efficient exchanges are not artificially discouraged or prevented.
ALLOW COMPETITION AMONG ALL RESOURCES IN SPOT MARKETSEach region currently has many generation types owned by many entities including utilities and independent power producers. Low-cost decarbonization can be best achieved if all of these resources participate in active competition on a day-to-day basis. The “economic dispatch” from traditional utility operations was modified to “bid-based” dispatch as electricity markets were introduced beginning 25 years ago in the Northeast, Texas, and California. Now bid-based, RTO-operated spot markets also exist in MISO and SPP and serve about two-thirds of the nation’s electricity demand. For low-cost decarbonization, such spot markets will be needed in the other one-third of the country, including the interior West, Northwest, and Southeast.
94 Federal Energy Regulatory Commission, Order No. 2000, 89 FERC ¶ 61,285.95 Intra-RTO rate pancaking is barred by FERC Order No. 2000. See Federal Energy Regulatory Commission, Order No. 2000, 89 FERC ¶ 61,285.96 Federal Energy Regulatory Commission, Order Conditionally Accepting Proposed Tariff Revisions to Implement Energy Imbalance Market, 147 FERC ¶ 61,231, Par 156.97 Daniel, “The Coal Bailout Nobody Is Talking About.”
46

consumer willingness to pay should be reflected by actual consumer demand-side bids. Unless and until actual demand side bidding begins, administrative proxies for demand bids can be used, called “value of lost load.”99 Scarcity pricing based on the value of lost load will attract flexible resources where and when they are needed while minimizing their under- or over-procurement. Technically, the mechanics take place as an adder to the energy price based on an Operating Reserves Demand Curve (ORDC) up to an administratively set overall maximum.
In addition to scarcity-based pricing, removing offer floors will support a clearer signal of the value of avoiding generator curtailment during periods of oversupply. Negative prices do happen for legitimate reasons in markets, and sometimes are needed to efficiently determine which units should curtail. This form of value-based pricing can incent the charging of grid energy storage and/or ramping up customers’ electric vehicle charging and other discretionary loads.
Accurate value-based energy prices will also serve the important function of encouraging long-term hedging and flexible resource procurement, as discussed in the next chapter on procurement.100
Large and small electricity customers will need the ability to hedge against high prices in the future power system. In a well-functioning market, almost no one actually pays a scarcity-based price who doesn’t intentionally plan on occasionally doing so and is fully informed about the risks. The price can be thought of as a speeding ticket for those who choose
EMPLOY VALUE-BASED PRICING TO ATTRACT AND RETAIN FLEXIBLE RESOURCESPrice signals that compensate supply during periods of scarcity on daily operational time scales are needed to ensure adequate supply of flexible resources.98 Moment-to-moment and hour-to-hour, flexible resources such as battery energy storage and many forms of demand response will need price signals to consume and produce at precisely the right time to meet system needs. Wholesale energy prices are presently based on the marginal cost of generation, which corresponds with fuel costs and generator availability. Since renewable resources, storage, and demand response generate power without fuel inputs, and therefore have a marginal cost of zero, relying on fuel cost to set prices will fail to attract flexible resources or imports from neighboring regions when the power is needed. The basis of wholesale energy prices will need to shift to the scarcity value of power to efficiently signal demand for flexibility from these resources.
Scarcity-based pricing is consistent with economic theory and compatible with the incentives of all resources including the new energy-limited energy storage resources. Resources that do not use fuel inputs and thus have zero marginal cost of supply are likely to run at or near maximal output regularly. As overall demand reaches a maximum supply constraint at any given time, standard economics teaches that prices are set by consumers’ willingness to pay rather than suppliers’ willingness to offer (i.e., intersection of the demand curve with the vertical supply curve). In future power system operations, that
98 FTI Consulting, “Resource Adequacy Mechanisms in the National Electricity Market.”99 See Sullivan, Schellenberg, and Blundell, “Updated Value of Service Reliability Estimates for Electric Utility Customers in the United States.” See also a review of Value of Lost Load (VOLL) levels and derivation methods in London Economics International, “Estimating the Value of Lost Load,” and in Kuckshinrichs and Schröder, “Value of Lost Load.”100 Pérez-Arriaga et al., “Adapting Market Design to High Shares of Variable Renewable Energy.”
4746

follow changes in net load, avoiding more costly ancillary services like frequency regulation and ramping services as well as reducing the use of short-run curtailment.103
NON-DISCRIMINATORY OPERATIONAL RELIABILITY SERVICES FOR SYSTEM BALANCINGReliable operation of the clean energy fleet will rely on a set of technology-neutral flexibility services. Maintaining electric system stability requires supply to equal demand at all moments, even when generator outages occur suddenly or forecasts of load or renewable output deviate significantly from actual operations. NERC has identified a set of short-term essential reliability services, which fall into the categories of frequency response, ramping and balancing, and support and are104 necessary for maintaining grid stability in sub-seconds to hours timeframes. These include traditional frequency regulation and synchronous and non-synchronous reserves though the nomenclature and exact definitions vary by region and have been changing over time.
For a supply mix consisting primarily of inverter-based wind, solar, and storage resources, “flexible reserves” may need to become a more explicit and well-defined set of products to allow system operators to achieve system balancing in different time scales,105 from sub-second to seconds to minutes to hours to days or even
to take the risk. Consumer protection and benefit will depend on well-functioning economic hedging, either performed by the customer itself or by a regulated entity on their behalf, as determined and regulated by states, as discussed in Chapter 5. In addition, a “circuit breaker” is likely needed to protect consumers and avoid financial disruption in case the system reaches an excessive number of hours at elevated prices. Australia has a circuit breaker system in place which could be a model.101
IMPLEMENT FAST SCHEDULING AND DISPATCH TO ENABLE FLEXIBILITYAnother critical element needed for system operations to reliably handle a clean energy portfolio will be aligning price signals with the physical system via higher frequency real-time scheduling and dispatch. A system with high shares of renewables will more likely experience short-run supply fluctuations of significant magnitude, which may result from forecasting errors. Increasing the granularity of system operations—i.e., dispatch intervals of less than five minutes, with scheduling lead times of less than 10 minutes—102 will better match those fluctuations. By reducing the possibility of significant deviations between supply and demand in a given operating period, fast scheduling and dispatch can reduce uncertainty in net load. Doing so will allow higher reliance on market dispatch governed by price signals to
101 AEMO, Operation of the administered price provisions in the National Electricity Market, p. 4, July 2019. See also WattClarity, Cumulative Price, and the Cumulative Price Threshold.102 Order 825 required all RTOs/ISOs to align dispatch and settlement intervals to ensure scarcity pricing can be effectively triggered. Real-time energy and operating reserves must use a five-minute interval, such that scarcity pricing may be triggered in any five-minute interval. Additionally, all markets use a 10-minute scheduling lead time for spinning reserves. See Federal Energy Regulatory Commission, Order No. 825, 155 FERC ¶ 61,276.103 Moving to shorter duration intervals has reduced reliance on reserves, such as was experienced in BPA’s shift to 10-min scheduling intervals, and reduced curtailments, such as was experienced in ERCOT’s shift to 5-min dispatch intervals—see Bird, Cochran, and Wang, “Wind and Solar Energy Curtailment.” See also Milligan et al., “Examination of Potential Benefits of an Energy Imbalance Market in the Western Interconnection,” and U.S. Department of Energy, “Wind Vision: A New Era for Wind Power in the United States,” Ch. 2.104 North American Electric Reliability Corporation, “Essential Reliability Services Whitepaper on Sufficiency Guidelines.”105 Electric Power Research Institute, “Ancillary Services in the United States: Technical Requirements, Market Designs and Price Trends.”
48

storage resources will have less inertia from conventional generation units, which have traditionally provided a slow-moving stabilizing response to deviations in grid frequency caused by sudden tripping of generators or loads. Fast frequency response—within fractions of a second—can replace the need for slower-response primary frequency response service, which typically occurs in sub-minute timescale while reducing the overall frequency response service needed.110 Additionally, primary frequency response lacks appropriate service definitions for resources like storage, which do not have the minimum generation constraints or headroom requirements of fueled generators. Since storage, demand response, and renewables will provide fast frequency response but face a greater duty cycle for doing so, frequency response should be procured via market mechanisms as one of the short-run flexibility services.111
To attract the flexibility to balance against system variability, flexibility will need to be financially rewarded. The flexible resources of the clean energy portfolio will be both faster-responding and more precise than conventional generation. Efficiently utilizing flexible resources may require the introduction of pay-for-performance measures to reward fast and accurate response, such as FERC’s requirements for frequency regulation compensation in Order 755.112
seasons ahead of real time. For the system to operate reliably, the services will need to be defined based on engineering needs as they evolve over time on each particular system, and then procured by any resource capable of providing them.106 A large set of research has been devoted to the need for flexible resources in clean energy systems and ways to attract and retain flexibility in power markets,107 most of which can be provided by wind, solar, and storage themselves.108
The definitions of what triggers the use of each flexibility reserve product will evolve to reflect future needs. For example, “duck curve” situations will start occurring in regions beyond California as solar energy grows, regularly presenting steep increases in net load at the end of the day when solar output declines. Current “spinning” and “non-spinning” reserves not only have names that are based on conventional generator characteristics, but they are usually designed to be triggered by a forced outage of a conventional generator or transmission line, not for rapid changes in renewable generation output and the resultant ramps across seconds to hours. It may be economic to adapt existing contingency reserves for abrupt wind or solar shortfalls.109
Similarly, the future system will need to attract frequency support. A system consisting primarily of inverter-based wind, solar, and
106 Orvis and Aggarwal, “A Roadmap for Finding Flexibility in Wholesale Markets: Best Practices for Market Design and Operations in a High Renewables Future,” ix.107 See, for example, Orvis and Aggarwal, “A Roadmap for Finding Flexibility in Wholesale Markets: Best Practices for Market Design and Operations in a High Renewables Future,” Glazer et al., “The Future of Centrally Organized Wholesale Markets,” Nolan et al., “Synergies between Wind and Solar Generation and Demand Response,” Mays, “Missing Incentives for Flexibility in Wholesale Electricity Markets,” and Linvill et al., “Flexibility for the 21st Century Power System.”108 Milligan, “Sources of Grid Reliability Services.” 109 GE Energy, “Western Wind and Solar Integration Study: Executive Summary.”110 See Newell et al., “Cost-Benefit Analysis of ERCOT’s Future Ancillary Services (FAS) Proposal,” 111 ERCOT’s Responsive Reserve Market procures Fast Frequency Response service in two separate tranches, in addition to Primary Frequency Response service—see ERCOT, “NPRR863.”Also see, Ela et al., “Market Designs for the Primary Frequency Response Ancillary Service—Part I: Motivation and Design.”112 Federal Energy Regulatory Commission, Order No. 755, 137 FERC ¶ 61,064.
4948

efficient dispatch outcomes that indicate the relative value and opportunity cost for a resource to provide energy versus flexibility services. Any given resource might be better suited to providing a flexibility service as opposed to energy at a given time so there needs to be a way to efficiently “sort” resources into their appropriate product. Real-time co-optimization of the energy markets with those services is the best way to do that, using the offers and operational constraint information provided by potential suppliers.116 Market rules will enable resources to switch between providing energy and flexibility services sub-hourly, enabling more efficient use of fast-responding renewable and storage resources capable of providing various services.117
Non-discriminatory service definitions and eligibility will facilitate entry of new technologies and innovations in the future. Over the period of system decarbonization, new technologies will almost certainly develop, both within resource types and in new resource types. Non-discriminatory service definitions provide an opportunity for new technologies to compete on a level playing field.
Some operational reliability services are conducive to competitive procurement while others are characterized by local monopoly supply and thus better suited to cost-based regulation and service requirements. Reactive
To attract the flexibility to balance against system variability, current accommodations for inflexibility will also need to be removed. System operations can remove accommodations for the costs imposed by inflexible resources, such as fossil units with limitations on start-up times and ramp rates. Current short-term reliability service requirements that accommodate inflexibility, such as the 10-30 minutes of lead time for contingency reserves and the many seconds of lead time of primary frequency response, should be removed. Complemented by fast scheduling and dispatch, removal of such accommodations will ensure flexibility services are defined in a performance-based and technology-neutral manner.
Technology-neutral operational reliability services will also have the benefit of enabling wind and solar resources to provide them, since they can be dispatched down quickly113 or, when curtailed, can be dispatched up quickly.114 While the opportunity cost of curtailing zero marginal cost renewable output typically makes this source of flexibility uneconomic today, this capability will increasingly be utilized as wind and solar penetrations grow, curtailment levels increase, and fewer flexible conventional generators are available.115
Energy markets and reliability services markets that are co-optimized will result in more
113 Goggin et al., “Customer Focused and Clean: Power Markets for the Future.”114 Ela et al., “Active Power Controls from Wind Power: Bridging the Gaps,” and Loutan et al., “Demonstration of Essential Reliability Services by a 300-MW Solar Photovoltaic Power Plant.”115 Energy and Environmental Economics, “Investigating the Economic Value of Flexible Solar Power Plant Operation.”116 Reedy, “Simulation of Real-Time Co-Optimization of Energy and Ancillary Services for Operating Year 2017.”117 Goggin et al., “Customer Focused and Clean: Power Markets for the Future.”
50
INTEGRATE DERS, INCLUDING DISPATCHABLE DEMAND, TO INCREASE EFFICIENCYSystem operations will incorporate Distributed Energy Resources (DERs). FERC Order 2222 established pathways for DER aggregations greater than 100 kW in size to participate directly in wholesale markets, which followed from FERC Order 841 establishing the same for individual distributed energy storage systems and from FERC Order 719 enabling demand response resource participation. Operational infrastructure should allow DERs to contribute to system supply and reliability, with an appropriate level of visibility for system operators.120 Such a framework would maximize efficient operations by relying on storage, hybrid resources, and DER aggregations to self-optimize to meet performance obligations and respond to price signals, in addition to relying on direct control by system operators under certain circumstances.
DER integration should be feasible without increasing computational complexity beyond available computing power. Computing power may become less of a constraint with continuing hardware and software improvements as market designs evolve to reduce geographic or temporal complexity,121 and as systems rely less on inflexible resources with significant start-up costs or lead times that require complicated optimization algorithms.122
power and voltage control is a physical service that does not travel long distances. It is needed in narrow geographic markets and can be provided often only by a generator at that location. FERC and RTOs have standard formulas for reactive power compensation, though like all services there are disputes about what is fair compensation. Recently, FERC acted to require reactive power provision by all newly interconnecting non-synchronous generators (including wind, storage, and batteries).118
Distinct engineering needs should define the services. Different types of resources that can provide the same reliability service should be grouped together and compete to provide the service to the customer, as in traditional economic product definition.119 In the case of operational reliability services, the grid operator is essentially acting as the customer, representing their desire for reliability.
Large electricity customers will have greater options for clean energy procurement if reliability services are procured on a technology-neutral basis. When a customer contracts with a new renewable resource, for example, that resource may be able to sell for a lower energy price if it is also able to earn money in reliability services markets. And for renewables and storage resources overall, they can enter markets to a greater extent if they are given equal opportunities with fossil resources in reliability services markets.
118 Federal Energy Regulatory Commission, Order No. 827, 155 FERC ¶ 61,277.119 A relevant market in anti-trust law is “composed of products that have reasonable interchangeability for the purposes for which they are produced.” See United States v. E. I. du Pont de Nemours & Co., 351 U.S. 377.120 “Development of an operational infrastructure that provides visibility and control (direct or indirect) of distributed resources such as DR and PEVs,” See North American Electric Reliability Corporation, “Integration of Variable Generation Task Force: Summary and Recommendations of 12 Tasks,” xv.121 Campos do Prado et al., “The Next-Generation Retail Electricity Market in the Context of Distributed Energy Resources: Vision and Integrating Framework,” and Cornejo and Sioshansi, “Rethinking Restructured Electricity Market Design: Lessons Learned and Future Needs.”122 A review of the literature on computational complexity of optimization of commitment of inflexible units can be found in Sheble and Fahd, “Unit Commitment Literature Synopsis.”
5150

dispatchable demand built into FERC Order 719 and Order 2222 will need to be removed.
A large set of loads that are dispatchable as a regular part of market operations, and not simply as emergency resources, will significantly reduce requirements to procure firm capacity and flexibility to ensure resource adequacy.127 Dispatchable loads will be available on a variety of timescales and may be designed to include load consumption and bi-directional products, in addition to traditional demand reduction.128 This will become particularly important as transportation and other sectors of the economy electrify and present a new set of loads that can be utilized flexibly and in concert with renewable generation. Existing and newly electrified demand resources will be price-responsive, either directly to prices in wholesale markets or indirectly via retail rate structures that proxy for real-time price signals.129 Not only does this provide significant value to the power system by reducing peak demand and shifting consumption to periods with lower energy cost,130 but also it aligns demand with renewable energy production and reduces the need for curtailment, since real-time energy costs are lowest when zero marginal cost wind and solar resources are abundant.131 As a result, dispatchable demand will also help sustain a higher value for renewable output at higher shares of overall generation.132
DER integration will necessarily be complemented via coordination with distribution system operators and retail authorities, to whom it falls to update interconnection and other features of local system operation to facilitate DER support of the bulk power system. Indeed, the interface between bulk system operators and distribution system operators will fundamentally structure the extent to which DERs enhance or constrain overall system operation.123 Real-time pricing or some version of time-of-use pricing that provides more incentives for consumers to shift consumption would likely have a large impact on the amount of firm supply needed.124 A number of other performance approaches are being developed for use by state retail service regulators to encourage responsiveness of demand to system needs.125
As noted above, with DER growth system operations will increasingly call on dispatchable demand instead of supply, ideally with scarcity price signals communicated directly to loads. A system with high shares of variable renewable energy generation, where weather may limit dispatchability, will rely increasingly on the dispatchability of demand.126 The incorporation of all DERs more generally will have the added benefit of enabling more operational use of load flexibility, whether for individual customers or for aggregations of customers. To that end, the barriers to market participation of
123 Kristov, De Martini, and Taft, “A Tale of Two Visions: Designing a Decentralized Transactive Electric System,” and Kristov, “Modernizing Transmission-Distribution Interface Coordination for a High-DER Future.”124 Faruqui and Bourbonnais, “The Tariffs of Tomorrow: Innovations in Rate Designs.”125 Gold et al., “Performance Incentive Mechanisms for Strategic Demand Reduction.”126 Milligan and Kirby, “Utilizing Load Response for Wind and Solar Integration and Power System Reliability,” and Cochran et al. “Flexibility in 21st Century Power Systems.” 127 See Alstone et al., “Final Report on Phase 2 Results: 2025 California Demand Response Potential Study,” Hale, Stoll, and Mai, “Capturing the Impact of Storage and Other Flexible Technologies on Electric System Planning,” and Hurley, Peterson, and Whited, “Demand Response as a Power System Resource: Program Designs, Performance, and Lessons Learned in the United States.” 128 See California Public Utilities Commission’s Working Group on Load Shift, “Final Report of the California Public Utilities Commission’s Working Group on Load Shift.”129 Badtke-Berkow et al., “A Primer On Time-Variant Electricity Pricing.”130 Borenstein, “The Long-Run Efficiency of Real-Time Electricity Pricing.” 131 Mills and Wiser, “Strategies for Mitigating the Reduction in Economic Value of Variable Generation with Increasing Penetration Levels.”132 Goldenburg, Dyson, and Masters, “Demand Flexibility: The Key to Enabling a Low-Cost, Low-Carbon Grid.”
52

balance, as they do all day every day. Wind and solar forecasting are relatively new fields of science and engineering that have advanced dramatically and still can be both improved and better integrated into system operations. Importantly, there are knowable conditions when forecasts can be less accurate than normal times, such as the exact timing of a weather front moving across a system. When a lot of resources are impacted by the same condition, such as gas plant de-rates in a heat wave, or wind output in a front, that is when the overall impact on system balance can be a concern. Operators should incorporate probability distributions to a greater extent, and not rely so much on the deterministic point estimate of load or renewable output.
Large electricity customers will have greater options for clean energy procurement if their own loads and onsite DERs are able to bid. The dual use of such resources for meeting facility functions, moreover, can lower the overall price of service provision and provides a hedge on the value of future clean energy output.
ADDRESS UNCERTAINTY THROUGH FORECASTING, UNIT COMMITMENT, AND FORWARD PROCUREMENT
Variability itself is less of a challenge for operators than uncertainty of output. When operators know what is going to happen, as long as they have enough flexible resources responding to their dispatch signal, they can ramp the fleet up or down to keep it in
FIGURE 16Dispatchable Demand on Varying Timescales133
133 Alstone et al., “Final Report on Phase 2 Results: 2025 California Demand Response Potential Study.”
5352

between days and months ahead of real-time to set flexibility reserve levels for procurement.
Probabilistic unit commitment processes can better accommodate renewable forecast uncertainty and minimize the cost, emissions, and inflexibility introduced by over-committing long lead-time resources.136 DER aggregations should either be exempted from unit commitment if small in size or else have probabilistic commitment for the entire aggregation, rather than commitment parameters for each unit, which will reduce computational complexity without compromising visibility or control.137
Large electricity customers may receive direct benefit from better access for DERs. Their own demand may be flexible and can serve as a resource that can be sold to reduce their overall cost of energy services for customers. Even if their load does not participate, the active involvement of customer’ demand and other distributed resources can lower overall electricity costs and increase reliability in a power system.
In the hours and days ahead of real time operations, operators may need more assurance of physical unit availability and market participants may need more information about system needs to give them time to respond.134 The commitment of generating units on a day-to-day basis will need to consider the uncertainty of wind and solar resources, and to a lesser extent the energy limits of resources like storage and demand response. Electricity spot markets have generally included both day-ahead and real-time time frames, to manage risks and uncertainties. This is called a multi-settlement system where resources financially and physically lock in ahead of time, then re-settle deviations from the first settlement in real time. There may be benefit to additional settlement periods such as days ahead of time, or multiple settlements within the operating day. The choice of settlement time frames should consider whether there are sufficient resources that can respond in minutes, hours, or days rather than just the traditional day ahead decision making built into operating systems based on the characteristics of fossil units.
As penetrations of storage and demand response increase, the market price of flexibility services in many time intervals is likely to be low, punctuated by periods of very high prices when these services are needed and their supply is scarce. Therefore, short-run forward procurement may be required to ensure sufficient flexibility services days or weeks ahead of real time to provide assurance of supply.135 This in turn may require forecasts of
134 Midcontinent Independent System Operator, “Exploration of a Forward Market Mechanism.”135 Hogan and Gottstein, “What Lies ‘Beyond Capacity Markets’? Delivering Least-Cost Reliability Under the New Resource Paradigm.”136 Ela, “Advanced Unit Commitment With High Penetrations of Variable Generation.” See also Ela et al., “Advanced Unit Commitment Strategies for the U.S. Eastern Interconnection.”137 For example, NYISO will not apply commitment parameters to DER aggregations; see Lavillotti, “DER Energy Market Design: Part 1.” FERC Order No. 2222 specifies that larger, multi-nodal DER aggregations may use distribution factors rather than individual unit supply, which EPRI explained in its comments—see Electric Power Research Institute, Post-Technical Conference Comments on participation of distributed energy resource (DER) aggregations in Regional Transmission Organization and Independent System Operator Markets–Comments on Panels 1, 6, and 7.
54
ENABLE BROADER PARTICIPATION THROUGH HIERARCHICAL CONTROLSystem operators will need to rely less on direct dispatch control and more on price signals and probabilistic estimation of load and generation. DER owners will have private considerations on their willingness to produce, which only they can optimize. Electric vehicles interact with the electric grid as a means to support transportation demands that are sometimes insensitive to system conditions,139 and behind-the-meter solar and storage systems may face local constraints or be used by customers for their own resilience instead of contributing to the larger grid as a resource.140 System operator visibility into DERs, both individually and in aggregations, is likely to be limited or, at best, uneven. Energy storage operators will maintain the option to self-manage state of charge for availability, with near-instant response times, reducing the usefulness of unit commitment, particularly with effective scarcity price formation.
Whether due to computational complexity or regulatory constraints to requirements placed on market participants, there will need to be much more reliance on self-optimization by market participants. Self-optimization requires performance-based product definitions with effective price formation and disincentives for deviation or non-performance to ensure market discipline.141 In this future, market participants should have the option to choose
OPTIMIZE ENERGY-LIMITED RESOURCES IN MARKET DESIGNIn order to integrate the significant amounts of energy storage and demand response needed to manage the mismatch between the timing of output and consumption at intervals of minutes and hours, power systems will need to optimize the output from energy-limited resources. With energy-limited resources such as batteries, resource availability in subsequent time intervals changes based on dispatch decisions in the current interval. Optimizing energy limited resource output is a constraint into system operations that is generally not yet taken into account. As energy-limited resources become large sources of flexibility, power system planners must increasingly account for chronological dispatch patterns, bridging the traditional siloes between power system planning and operations.138
Large electricity customers may own or contract for energy-limited resources, as many are pursuing now with battery energy storage. They may wish to optimize their own resource, making their own judgments about when to charge and discharge based on their own consumption and market prices. While self-optimization should remain a right of asset owners, customers may also prefer to voluntarily allow the central spot market operator to optimize the units, in which case this RTO capability will need to be developed in software upgrades that can better incorporate state of charge information.
138 Models using representative days instead of hourly chronological will miss longer duration storage value. For example, see Childs et al., “Long Duration Energy Storage for California’s Clean, Reliable Grid.”139 Bedir et al., “California Plug-In Electric Vehicle Infrastructure Projections: 2017-2025.”140 For general barriers to grid support from behind-the-meter solar and storage systems, see for example Murtishaw, “Barriers to Maximizing the Value of Behind-the-Meter Distributed Energy Resources.” Resilience operations may also lead to BTM storage systems defaulting to maintain high state of charge during grid emergencies, such as reported by Ed Burgess at Burgess, Ed. Twitter.141 Gramlich, Goggin, and Burwen, “Enabling Versatility: Allowing Hybrid Resources to Deliver Their Full Value to Customers,” and Ahlstrom et al., “Hybrid Power Plants –Flexible Resources to Simplify Markets and Support Grid Operations.”
5554

incentives for direct control. At the same time, RTOs presently predict load-to-base decisions about procurement and operations to maintain reliability, even without any control and limited visibility; future grid operators will need to do this on the supply side as well, via more accurate and precise forecasting of renewables output.
between accepting direct control by the grid operator or self-optimization, each of which will present different costs and benefits. Market participants can then optimize among a fuller set of operational choices in response to price signals, improving price formation and market efficiency, while still giving the RTO the option to pursue reliability assurances via different
56

and complex variable costs;143 doing so will result in over-mitigation of such resources’ energy bids and defeat effective procurement of flexibility. For resources like owners of energy storage that are deemed to have market power, optimal market bidding behavior will be based on a forecast of prices for various services in future periods. As such, the basis of bid mitigation will need to shift to quantifying opportunity costs, developing methods to bound the uncertainty inherent in forecasting future prices.144
Ultimately, the best method to mitigate market power is likely to be much greater competition. The incorporation of demand and other DERs into wholesale markets can reduce the market power of larger resources due to transmission constraints or other geographically localized phenomena. Regulators should also prevent consolidation of generation ownership, and support transmission expansion to geographically broaden markets and increase competition.
Large electricity customers can protect themselves to some extent by hedging in advance to lock in supply commitments so that they do not have to pay high prices in real time. But when a supplier is a pivotal resource in a transmission-constrained area, there is little customers can do on their own, so it is a matter for public policy.
MONITOR AND MITIGATE MARKET POWER TO PROTECT CONSUMERS WITHOUT DISTORTING EFFICIENT BEHAVIORElectricity markets typically have market monitors and behavioral rules in place to protect against the exercise of generation market power. Unless and until there is a large amount of price-responsive demand and large regional markets with robust transmission infrastructure, the structural conditions are likely to occasionally exist for “pivotal suppliers” to be able to bid any level and be chosen in the dispatch. This sets prices for all load, unless some rules are in place to prevent that outcome.142 Typically market power mitigation rules apply to the bids of individual generators, depending on the company and unit structural position at different times.
In the future, as energy-limited resources enter power markets, market power mitigation will need to shift to an opportunity-cost basis to ensure wholesale prices are just and reasonable. Flexible, energy-limited resources are likely to serve as the marginal clearing unit for system balancing in the future clean energy portfolio. However, the traditional approach of limiting bid inflation applied to fossil-fueled generators that may exercise market power—namely, by quantifying their variable costs—does not apply well to energy-limited resources that have low
142 Wolak, “Measuring Unilateral Market Power in Wholesale Electricity Markets: The California Market, 1998-2000,” and Gramlich, “The Role of Regulation in Addressing Generation Market Power.”143 For example, the cycling of batteries causes degradation over time, reducing overall charging capability and eventually requiring cell replacement. While not directly incurred during operations as fuel consumption might, such cycling costs could be considered a variable cost component when making economic decisions with storage.144 For example, see the discussion of Default Energy Bids for storage in Carr et al., “Energy Storage and Distributed Energy Resources Phase 4: Final Proposal.”
5756

energy terms, as megawatt-hours of energy produced by eligible resources. Eligibility for what is “renewable” is defined by states (for compliance RECs) or by consumers and certification entities (for voluntary RECs).148 Geographic eligibility is often based on being produced in the RTO or deliverable to the RTO of a given state or consumer.149
It will be important for low-cost decarbonization to synchronize CEACs and electricity markets. Such synchronization was not so important in the past when RPS requirements were in the range of 5 to 20 percent of total energy. Then, the product could simply be based on a MWh of renewable energy from anywhere in the same region of a given state, produce at any time of day or year. As CES’ grow to 35, 50, or 75 percent or more of energy, the CEAC definitions and prices will have a significant influence on the time and locations of development and operation that are encouraged by the programs, which will impact cost and reliability. Significant work is underway to have time-stamped RECs (TRECs).150
CEAC definitions can also impact environmental quality. For example, RECs to serve Eastern PJM states are now coming from as far away as North Dakota, due to the large resource base and low cost.151 Four states plus Washington, D.C. in PJM all procured less than 50 percent of their RECs from in-state resources through 2017.152 Remote resources can physically serve load and displace dirty local resources if there
SEEK COMPATIBILITY BETWEEN ENVIRONMENTAL ATTRIBUTES AND SYSTEM OPERATION
The emissions characteristics of different resources are valued by customers separately from the energy they provide to power homes and businesses. Providing multiple products and services from a given resource is not a new economic idea; for example, coal plants sell coal ash and biomass plants sell waste management services to earn revenues outside of the electricity system. But environmental attributes are becoming a bigger part of the overall electricity system value stream, and there are interactions in both directions between environmental attributes and power system operation that can affect the total costs to electricity customers.
Environmental attributes have mostly been bought and sold in the form of Renewable Energy Credits (REC) to date.145 RECs may be purchased by customers acting on their own (i.e., voluntary RECs) and load-serving entities may purchase “compliance RECs” to satisfy their obligations under state Renewable Portfolio Standards (RPS). Thirty states plus Washington, D.C. have a mandatory RPS in place.146 Increasingly these states and federal policy makers are considering “Clean Energy Standards” (CES) with “Clean Energy Attribute Credits” (CEACs)147 which would allow participation of more carbon-free sources such as fossil units with carbon capture. RECs and CEACs are measured in
145 See Brattle Group and REBA Institute, “Renewable Energy Policy Pathways Report.”146 Database of State Incentives for Renewables & Efficiency, “Renewable & Clean Energy Standards.”147 Spees et al., “How States, Cities, and Customers Can Harness Competitive Markets to Meet Ambitious Carbon Goals Through a Forward Market for Clean Energy Attributes.”148 RPS types are described well in LBNL’s annual surveys, see Barbose, “U.S. Renewables Portfolio Standards.”149 Ibid.150 Thoubboron, “New Jersey TRECs.”151 Porter, Hoyt, and Widiss, “Final Report Concerning the Maryland Renewable Portfolio Standard as Required by Chapter 393 of the Acts of the Maryland General Assembly of 2017,” Figure 2-69.152 Ibid., Figure ES-11.
58

MOPR can raise costs to consumers by billions of dollars per year in a single region.156 A better framework for electricity market design is to fully compensate resources for whatever energy or reliability services they provide, regardless of what other products they sell or incentives they receive.
PROMOTE RTO GOVERNANCE REFORMS TO INCLUDE EQUAL CONSUMER PARTICIPATIONRTO governance was originally designed for RTOs whose functions involved transmission service, spot market operation, and transmission planning. As RTOs have become more involved in resource procurement such as mandatory capacity markets (discussed in Chapter 5), and given their impact on the determinations of scarcity pricing and market power mitigation, it is important for their governance to reflect a balance between buyer and seller interest. This is particularly important if FERC chooses to continue deferring to RTO stakeholder judgment. Relying on industry groups such as standards making bodies to decide on operational details such as the time of bid submissions can be beneficial, but it is a matter of public policy when deciding how much procurement should take place for reliability, or what is an allowable bid from a generator with market power. RTO governance will likely need reform to neutrally administer their responsibilities.157
are no transmission constraints, but not otherwise. In a study of Maryland moving from a 25 percent to 50 percent RPS, the Maryland Department of Natural Resources found “CO2 emissions from electric power plants located in Maryland are relatively unchanged because coal and natural gas plants in Maryland continue to generate power for sale into PJM’s wholesale markets…NOx and SO2 emissions from in-state generation are also relatively unchanged, for the same reasons.”153 CEACs with physical delivery requirements may allow more emissions to be displaced rather than having all clean sources amass in certain areas while other areas preserve their existing generation mix.
By the same token, electricity markets should fully respect environmental attribute products. States and consumers tend to have preferences for certain environmental attributes or location over others. States can be expected to make value judgments in the future about which resources to count. The framework of buckets used in California, with more demand resulting in higher prices for higher-valued resources may become a common way for states to differentiate and spur desired resource development.154 Similarly, individual electricity customers—commercial, industrial, and residential--can make their own choices about specific products, and they may differentiate environmental attributes into buckets. The FERC and ISO/RTO minimum offer price rule (MOPR) is a glaring example of electricity market rules interfering with state policy, undermining the value states intended to provide to desired resources.155
153 Ibid., Figure 2-26.154 California Public Utilities Commission, “33% RPS Procurement Rules.” 155 Kathryne Cleary, “What the Minimum Offer Price Rule (MOPR) Means for Clean Energy in PJM,” Patel, “The Significance of FERC’s Recent PJM MOPR Order Explained,” Goggin and Gramlich, “A Moving Target: An Update on the Consumer Impacts of FERC Interference with State Policies in the PJM Region.”156 Goggin and Gramlich, “A Moving Target: An Update on the Consumer Impacts of FERC Interference with State Policies in the PJM Region.”157 See Konschnik, “RTOGov: Exploring Links Between Market Decision-Making Processes and Outcomes.”
5958

• Utilizing of fast scheduling and dispatch to enable system flexibility
• Implementing of scarcity-based pricing to attract and retain flexible resources, while supporting long-term contracting and hedging so that consumers that plan in advance do not pay these prices, and a circuit-breaker mechanism to avoid excessive impact on consumers
• Monitoring of the market and mitigation to prevent the exercise of market power while allowing the energy-limited resources to bid their legitimate opportunity costs
• Establishing of a set of non-discriminatory operations reliability services to ensure reliability
• Enabling and supporting bilateral contracting
• Integrating of DERs, with emphasis on dispatchable demand, to increase system efficiency
• Undertaking forecasting, unit commitment, and multi-settlement systems to better incorporate near- and medium-term uncertainty
• Optimizing energy-limited resources
• Hierarchical control to allow market participants to self-optimize
• Compatible environmental attribute and electricity market products
RTO market design should incorporate best practices as described above, including:
PROMOTE MARKETS THAT ENABLE AND SUPPORT BILATERAL TRANSACTIONSIn many industries, spot markets and longer-term bilateral transactions co-exist and serve as mutually complementary. Typically most trading of volume and money occurs in bilateral transactions. These can be either financial contracts tied to spot market prices, or physical forward contracts. Having access to these contracts is important for the health of any industry, and electricity is no exception. Electricity customers have many long-term contracts in place and will likely continue arranging such deals to serve their evolving needs, as discussed in Chapter 5. Spot markets should enable and support such contracts. Interventions such as FERC’s Minimum Offer Price Rule that make bilateral clean energy purchases more expensive should be avoided.
SUMMARY OF OPERATIONS RECOMMENDATIONS • FERC should consider making RTOs
mandatory or revoking market advantages to utilities that are have not voluntarily joined RTOs. Moving large amounts of power within and across regions will require large RTOs in all regions.
• Generators should all compete in hour-to-hour and day-to-day markets.
• Large electricity customers should seek appropriately balanced RTO governance given the impacts on RTO policy decisions on market outcomes. FERC should undertake review and reform of RTO governance.
60
attempt at electricity markets, that was a major contributor to the Western energy crisis of 2000-2001.158
Well-functioning procurement will be critical to achieve the massive amount of generation investment needed. By one estimate we will need 1,100 GW by 2035, or 70 GW per year of new renewables and storage.159 Well-functioning procurement is particularly important and challenging for the 21st century electricity portfolio because a majority of the energy is likely to come from zero marginal wind and solar resources. High penetration of zero marginal cost resources will tend to reduce spot energy prices and the revenues sellers earn from energy sales in many hours of the year.160 The standard response to low spot prices for any seller of any commodity is
Electric industry institutions were built around the operations and planning processes that made sense for the 20th century fleet of resources, as described in Chapter 2. The 21st century fleet and how its characteristics differ from the 20th century fleet was described in Chapter 3. Short-term operation of the 21st century fleet, or the conducting of the orchestra, was discussed in Chapter 4. In this chapter we turn to long-term resource procurement--how to assemble members of the orchestra and make sure every part can be played.
The importance of the resource procurement was already a key structural concern of electricity policymakers before the clean energy transition. It was often not thought through during electricity restructuring. When California discouraged long-term contracting in its initial
CHAPTER 5: 21ST CENTURY MARKET STRUCTURE AND RESOURCE PROCUREMENT
158 See Congressional Budget Office, “Causes and Lessons of the California Electricity Crisis,” 22: “Had the utilities been able to enter into long-term contracts that guaranteed their future cost or supply of electricity, such arrangements would have helped diminish the shortage of power-generating capacity—and thus reduced the upward pressures on prices. Such long-term guarantees would have encouraged independent generators to build new capacity and would have improved the utilities’ financial position, so generators might not have charged higher prices as compensation for the risk of nonpayment by the utilities.” See also Ausubel and Cramton, “Using Forward Markets to Improve Electricity Market Design,” 197. “The California electricity crisis of 2000-2001 illustrates all too well the problems that can arise when one relies excessively on the spot market. Key conditions of the crisis were insufficient forward contracting and tight supply. During this prolonged period of tight supply, the unhedged demanders were exposed to sustained high spot prices. Suppliers, also positioned without forward contracts, had strong incentives to exercise market power further exacerbating the high prices. The load serving entities, despite initially being well capitalized, ultimately teetered toward bankruptcy and the market collapsed.”159 Phadke et al., “2035 The Report: Plummeting Solar, Wind, and Battery Costs Can Accelerate Our Clean Electricity Future.”160 Milligan et al., “Wholesale Electricity Market Design with Increasing Levels of Renewable Generation: Revenue Sufficiency and Long-Term Reliability.” See also Seel, Mills, and Wiser, “Impacts of High Variable Renewable Energy Futures on Wholesale Electricity Prices, and on Electric-Sector Decision Making.”
6160

reliability and resilience will be essential. Increasingly, our critical infrastructure is inter-dependent between gas, water, and systems needed to keep people warm and safe. The Texas outages of February 2021 illustrate how such systems can fail. The investigations of this incident are only beginning at the time of this writing and all aspects of it will need to be reviewed. But some lessons appear to be clear from stressed system conditions in California in August 2020, Texas in February 2021, and Polar Vortex and other severe weather events over the last decade.
1. System planners need to incorporate future weather patterns which may be very different from the past. There are atmospheric science reasons to believe that Polar Vortices, widespread heat waves, hurricanes, and other severe weather events will be more frequent and severe than in the past. Current approaches to planning use past weather and load. Neither California162 nor Texas163 planning assessments included the weather scenarios that actually occurred.
2. “Stress testing” should be performed in each region to consider their particular threats, the interaction of power, gas, water, and other critical infrastructure, and evaluate full system’s resilience. Early indications in Texas suggest that power was cut off to gas facilities, worsening gas shortages, that worsened power shortages. Such cross-sector interactions require full system planning and coordination in the future.
to lock in long-term contracts in advance. But such contracts require a counterparty able and willing to sign them. Who that customer should be is not obvious, likely varies by state and region, and is the subject of significant discussion and debate.161
This chapter discusses roles and responsibilities of the 21st century electric system, how procurement responsibility may be allocated, and concludes with actions that policymakers and regulators should take to build effective market structures.
Roles and responsibilities in markets is called “market structure,” which is distinct from market design, and resides in the economic field of industrial organization. Large electricity customers would benefit to the extent an efficient market structure could be put in place in the electric industry. Even if an ideal structure is not something states have the political will to put in place, we start with the theoretically most efficient market structure as a useful framework and reference point to evaluate how to make other approaches work for customers.
RESILIENCE, RELIABILITY, AND MARKET STRUCTUREMarket structure must be placed into a broader context about electricity in modern life. Electric power is needed for public health and safety, and will continue to be “affected with the public interest,” in the words of the US Supreme Court. Regardless of market structure, ensuring
161 See generally Aggarwal et al., “Wholesale Electricity Market Design for Rapid Decarbonization,” Joskow, “Challenges for Wholesale Electricity Markets with Intermittent Renewable Generation at Scale,” World Resources Institute, “Electricity Market Design,” Gramlich and Lacey, “Who’s the Buyer? Retail Electric Market Structure Reforms in Support of Resource Adequacy and Clean Energy Deployment,” and New England States Committee on Electricity, “New England States’ Vision for a Clean, Affordable, and Reliable 21st Century Regional Electric Grid.” 162 California ISO, CPUC, CEC Root Cause Analysis: Mid-August 2020 Extreme Heat Wave, p. 40163 Load was well above ERCOT worst case estimates and generation was well below worst case estimates. https://www.woodmac.com/news/editorial/breaking-down-the-texas-winter-blackouts/
62

and storage plants is often 100-500 megawatts. Even where large projects are possible in remote rural areas, this scale is very small relative to the geographic market of generation which can span many states and be well over 100 gigawatts, or 1000 times the size of the efficient generator size. Thus, the sector has been structurally competitive for some time and is becoming much more so. And yet, a majority of generation is still owned by utilities rather than independent power producers.165
A well-known market failure with regulated monopoly ownership is known as the Averch-Johnson effect in economics.166 Regulated monopolies rewarded through standard cost-plus regulation will tend to inefficiently over-capitalize because they earn their money on the regulated returns of capital investments. It is a problem to be managed when the only or best structure is a regulated monopoly. It is a key reason to rely on competition for sectors that are structurally competitive.
The structural competitiveness of the electricity generation sector is evidenced by successful competitive solicitations for new generation all over the world in recent years.167 Competitive solicitation has been advocated by electric consumer interests for decades.168 Relying on competition increases the discipline on investments and operation relative to
3. Winterization standards that were considered and rejected in Texas after its 2011 cold snap should be seriously considered as mandatory reliability rules, implemented at either the state or federal level. Early indications suggest that many facilities suffered from freezing, while it is clear that gas, wind, nuclear, solar, and coal plants are all capable of performing in very cold climates.
These regulations and policies on electricity generation are likely needed, and are compatible with the regulated market vision espoused here. In fact, such assessments and regulations would be equally needed in any kind of economic structure, ranging from fully regulated to fully competitive.
RELY ON COMPETITION IN GENERATION The supply side of the market has been steadily moving toward a competitive market structure without economies of scale, or natural monopoly characteristics. Economists in the 1980s deemed the generation sector to be structurally competitive based on the smaller efficient scale of generating units and no longer subject to natural monopoly characteristics.164 That finding was the basis for many states restructuring, the Energy Policy Act of 1992 encouraging competition, and FERC pursuing open access transmission to allow competition in the generation sector. The scale of wind, solar,
164 Joskow and Schmalensee, Markets for Power.165 43 percent of sales were from independent power producers in 2019, 57 percent from utilities. See IPP data here: U.S. Energy Information Administration, “Table 3.3.B. Net Generation from Renewable Sources: Independent Power Producers, 2009 - 2019,” utility data here: U.S. Energy Information Administration, “Table 3.2.A. Net Generation by Energy Source: Electric Utilities, 2009 - 2019,” and total data here: U.S. Energy Information Administration, “Table 3.1.A. Net Generation by Energy Source: Total (All Sectors), 2009 - 2019.”166 See Averch and Johnson, “Behavior of the Firm Under Regulatory Constraint.”167 See Wilson et al., “Making the Most of the Power Plant Market: Best Practices for All-Source Electric Generation Procurement,” Duke Energy, “Competitive Process Yields Carolinas’ Biggest One-Day Collection of Solar Projects Ever; Significant Savings for Duke Energy Customers,” International Renewable Energy Agency and Clean Energy Ministerial, “Renewable Energy Auctions: A Guide to Design,” and USAID, “Tanzania: Competitive Procurement.”168 Electricity Consumers Resource Council, “Profiles on Electricity Issues: Competitive Bidding.”
6362

RECOGNIZE THE MONOPOLY TRANSMISSION AND DISTRIBUTION SEGMENTSTransmission and distribution remain natural monopoly sectors. As with other physical networks, having two competing sets of electric wires running down a street is highly inefficient. There are very large economies of scale, as well as public goods and network externalities that exist in transmission and distribution. While there is and will remain a role for independent transmission in some areas, the basic ownership for most of the transmission and distribution asset base is likely to remain in regulated private or public monopoly ownership for the foreseeable future.
Regulation of transmission and distribution can either follow traditional cost-of-service regulation or utilize performance-based regulation (PBR).170 PBR requires objective performance metrics and significant regulatory policy oversight to assess performance, both of which would are significant challenges.171 Regulation can allow for limited competition where non-wires alternatives may substitute for the services needed.
In addition to regulation of natural monopoly transmission and distribution rates and services, there is a need for regulation of the vertical market power of a monopoly wires company from using its position to gain
monopoly-provided services. Utilities tend to want to own generation but states will likely lose some consumer savings given the incentives of utilities to add to their rate base unnecessarily.169
Electricity customers would benefit by relying on competition for the electric generation sector. Competitive processes should be used both for investment and day to day operation. In many states where utilities still own generation, ending that practice may be politically impossible, but there are ways to increase the amount of competitive procurement.
Efficient retirement is just as important as efficient market entry in a competitive generation market. Customers may benefit from certain older resources staying online, based on energy or reactive power needs at a given location, system balancing, or low-carbon energy production, while other resources may provide little of any of these valuable services. Efficient market pricing for each separate service encourages valuable resources to stay online and less valuable resources to retire, benefitting customers. Technology-neutral service definitions rather than technology-specific procurement allows for competition between sources.
169 This is the well-established Averch-Johnson effect in utility regulation. See Averch and Johnson, “Behavior of the Firm Under Regulatory Constraint.”170 Joskow, “Lessons Learned from Electricity Market Liberalization,” 16 171 Littell et al., “Next-Generation Performance-Based Regulation.”
64
172 Phrase coined by then-Assistant Attorney General William Baxter. Joskow and Noll, “The Bell Doctrine: Applications in Telecommunications, Electricity, and Other Network Industries.” “...regulated monopolies have the incentive and opportunity to monopolize related markets in which their monopolized service is an input.”173 Kiesling, “Electricity Restructuring and the Failure to Quarantine the Monopoly.”174 Morey and Kirsch, “Retail Choice in Electricity: What Have We Learned in 20 Years?”175 Gramlich and Lacey, “Who’s the Buyer? Retail Electric Market Structure Reforms in Support of Resource Adequacy and Clean Energy Deployment,” and Desrosiers, “Competitive Electricity Retailing: Why Restructuring Must Go On.”176 There are 29,000 customers of “Griddy” out of 29 million residents in the state of Texas. https://www.nytimes.com/2021/02/20/us/texas-storm-electric-bills.html
advantage in the competitive generation sector. The phrase quarantine the monopoly aptly describes the objective of preventing utilities from expanding into competitive sectors or using their advantage to benefit affiliates.172 Restructuring utilities to operate only in the monopoly sectors and not allowing them to use their monopoly position to benefit their involvement in upstream or downstream sectors can benefit consumers in an industry, including electricity.173 Whether policymakers have the appetite to push for structural changes to limit franchise monopoly benefits to only monopoly sectors is another question. FERC open access transmission rules, and putting RTOs in charge of operation, also helps address vertical market power.
CONSIDER COMPETITIVE RETAIL SERVICEProcuring a service, providing for its delivery, and selling to end-use customers is something that can be done competitively. It is performed in competitive markets for end-users in heating and cooling, plumbing, pest control, landscaping, cable TV, internet, and any number of other services. Retail electricity service can be a distinct service from distribution line ownership. It is difficult to make an economic policy argument for monopoly provision of retail electricity service. Competition in this sector, just like generation, can lead to more innovation in the services offered. However, there have been mixed experiences with retail competition in the 20 states that have tried it and the 14 states that
still have it.174 And as an essential service where trust in the provider is critical, there is often little political support for moving away from granting regulated utilities a monopoly on retail service.
While there are known and fixable flaws with retail market design in the 13 states outside of Texas that would arguably make it function well,175 it is a state policy decision and there does not appear to be a major push for retail competition expansion in many states at this time. There have not been many changes in state policy on this function in the last decade.
Retail competition in electricity likely requires a great deal of state regulatory oversight. Electricity is a risky business where shortages and very high prices can occur suddenly after years of low marginal cost-based prices. Many small residential customers are likely not aware of that risk when the sign up for suppliers, and many retail suppliers may themselves not be capable of preparing for such circumstances. Initial reports from the Texas cold snap of 2021 suggest that many retail suppliers will need to declare bankruptcy because they were not hedged against the high prices that occurred. It is not clear that the 0.1% of customers in Texas that pro-actively chose to use a supplier with a fully variable rate were aware of what risks they were taking on.176 State policy makers will need to consider whether to allow certain customer classes to take on such risks in the future.
6564

This textbook model follows the general best practices from electricity restructuring around the world over the last few decades. It is certainly not a free market, given the important role of regulation in all sectors and the full regulation of a single entity in key sectors. As articulated by Dr. Paul Joskow: “The most successful reform programs have followed the “textbook model” … reasonably closely: privatization of state-owned enterprises, vertical and horizontal restructuring to facilitate competition and mitigate potential self-dealing and cross-subsidization problems, PBR regulation applied to the regulated
RELY ON COMPETITION WHERE APPROPRIATEIf one is to follow the standard wisdom of industrial organization, there would be a market structure as follows:
TABLE 2TEXTBOOK MARKET STRUCTURE
Segment Structure
Transmission Regulated monopoly utility
Distribution Regulated monopoly utility
Generation Competitive (no utility ownership allowed)
Grid operation, spot market operation Regulated regional monopoly
Retail Service Competitive or hybrid based on customer type
transmission and distribution segments, good wholesale market designs that facilitate efficient competition among existing generators, competitive entry of new generators, and retail competition, at least for industrial customers.”177
In this competitive structure, the grid operator plays an important but limited role, like an air traffic controller of the system. It operates a spot market because of the need for real-time coordination of flows and congestion management each hour and day. But beyond a day ahead of time, the grid operator plays no role in the power market, leaving hedging and forward contracting to other entities as explained below.
177 Joskow, “Lessons Learned from Electricity Market Liberalization.”
66

Generators that enter fully competitive markets tend to pre-sell their power under long-term contracts, or Power Purchase Agreements (PPAs) for their energy output. Energy developers can secure lower cost financing if provided certainty through long-term PPAs with a credit-worthy counterparty willing to sign such agreements. Thus, from a project financing standpoint, fully competitive markets operate like the other industry structures; the International Energy Agency (IEA) reports that globally, 95 percent of generation is under some form of long-term contract or regulatory regime.179
Sellers can also sell their environmental attributes on a forward basis to help finance plants. Even though RPS requirements may be year-to-year, private entities will transact longer term, such that generation developers may lock in environmental attribute sales years into the future.180 If the public policies or the consumer demand are stable, there tend to be multiple entities that will take positions on future environmental attribute contracts, and report prices and trading in these markets.181 Liquidity (volume of trading) for multiple years ahead is increasing in the PJM region, for example, where the attributes trade independently of the central energy and capacity markets.182
COMPETITIVE PROCUREMENT IN A FULLY COMPETITIVE STRUCTURE CAN ACHIEVE LOW, LONG RUN PRICESAn under-appreciated component of the textbook competitive market structures such as ERCOT and Australia is the active long-term trading of power bilaterally among market participants. Observers often wonder how assets with 30 or 40 year lives can be financed on a merchant basis just by selling on an hour-to-hour basis. The answer is that they are not. As explained by Ausubel and Cramton,
178 Ausubel and Cramton, “Using Forward Markets to Improve Electricity Market Design.”179 International Energy Agency, “World Energy Investment 2019,” 134 & 136.180 Porter, Hoyt, and Widiss, “Final Report Concerning the Maryland Renewable Portfolio Standard as Required by Chapter 393 of the Acts of the Maryland General Assembly of 2017,” 3-110.181 Ibid., 1-110. See also Intercontinental Exchange, “PJM Tri Qualified Renewable Energy Certificate Class I Future.”182 Author personal communication with Goldman Sachs and sPower staff, December 2020.
Forward markets, both medium term and long term, complement the spot market for wholesale electricity. The forward markets reduce risk, mitigate market power, and coordinate new investment. In the medium term, a forward energy market lets suppliers and demanders lock in energy prices and quantities for one to three years. In the long term, a forward reliability market assures adequate resources are available when they are needed most. The forward markets reduce risk for both sides of the market, since they reduce the quantity of energy that trades at the more volatile spot price.178
6766

supply to serve the load they committed to serve. Between load-serving entities (LSEs) and generators is often an entity called an “intermediary,” which is a marketer or trader that takes financial positions in markets, often signing a PPA with a generator and then selling to LSEs. The generator can secure low cost debt financing from lenders when they have a PPA. That arrangement proves useful for competitive retailers who may not know from month to month or year to year how much load they must serve. The intermediary, however, knows how much load exists, and can be confident that whoever serves the load will need power.
Procurement in the textbook competitive model is entirely voluntary. It is performed by end-users themselves or the competitive retail suppliers who take on obligations to serve load. When they sign up end-use customers, they will then turn to power sellers and procure energy on their customers’ behalf. Depending on how green the product chosen by their customer is, they may also procure environmental attributes. The procurement function in the fully competitive model is illustrated in Figure 17 below. In the Texas version, procurement is fully voluntary. In the Australia variant, there is some light-handed oversight by regulators to make sure retailers have lined up enough physical
FIGURE 17HOW PROCUREMENT WORKS IN A FULLY COMPETITIVE POWER MARKET
Lender
Future $Upfront $Texas style: voluntary contracting, no reserve margin or mandatory obligation
Austalia style: Flexible oversight to ensure load responsibility is covered
Physical or financial long-term contracts
Generator
End-Use Customers
LSEsIntermediary
68

ahead of time, and very little power is actually traded in the spot market.183 Attracting the right amount of investment hinges on accurate spot prices, as stated by the ERCOT market monitor, "Although most suppliers are likely to receive the bulk of their revenues through bilateral contracts, the spot prices produced in the real-time energy market should drive bilateral energy prices over time.”184
There is no physical reserve margin or mandatory capacity requirement in the textbook competitive model. The actual reserve margin can be calculated, but it is an output of the market not an input. In 2019 when reserve margins were low and the weather was hot in ERCOT, scarcity conditions led to higher prices. As stated by the market monitor, “The increases in the frequency of sustained shortages is consistent with the declining reserve margin in recent years. This existence of operating shortages is not a concern. In an energy-only market, shortages play a key role in delivering the net revenues an investor needs to recover its investment. Such shortages will tend to be clustered in years with unusually high load or poor generator availability.”185 The 2019 reserve margin was 8.6 percent in 2019 and, likely based on high spot prices in 2019 and 2020, is projected to grow to 19.7 percent in 2022.186 A study of the economically optimum reserve margin for ERCOT indicates that it is around 9 percent,187 so it could be that the market is
Large electricity customers benefit from the flexibility of forward energy contracting. Unlike the real-time spot market where all power must be pooled and follow the exact same rules to ensure reliable coordination of the physical system, the longer-term contracting market can enable wide latitude for customers and sellers to transact as they choose. They can choose the contract term, types of products, the price, quantity, location, transmission responsibility, and many other factors. Each customer may have a different preference for all of those terms. Voluntary bilateral contracting enables that flexibility. Some customers may even wish to not hedge at all and take the risks of the spot market.
In the fully competitive model, wholesale market design plays a key role for short-term re-balancing of market participants’ portfolios and encourages long-term procurement. The ERCOT and Australia markets have scarcity-based pricing such that when power is scarce, prices rise, as described in Chapter 4. The threat of paying high prices encourages competitive retail providers to procure power well in advance while locking in reasonable prices. In this way the central short-term spot market and the private long-term bilateral market complement and depend on each other. Very few people actually pay the high scarcity prices when they occur, because if everyone has done their job, power and prices were locked in well
183 87 percent of ERCOT load was hedged in 2018. See Potomac Economics, “2019 State of the Market Report for the ERCOT Electricity Markets,” 36.184 Ibid., 69.185 Ibid., 72.186 Ibid., 76.187 Newell et al., “Estimation of the Market Equilibrium and Economically Optimal Reserve Margins for the ERCOT Region: 2018 Update.”
6968

high wind penetration relative to solar, or vice versa, prices will tend to attract the other source. In the last couple years, ERCOT has experienced high wind and solar growth but little storage. As a result, market prices are signaling storage to enter, with high scarcity-based prices when the sun goes down and air conditioning is still running. According to the ERCOT market monitor, “battery energy storage would have been highly profitable in 2019.”189
For procurement to work in the textbook market structure, just like in any regulated model, the entity responsible for procurement must be credit-worthy, meaning financially sound enough to commit to multiple years of payments. Creditworthiness in the case of voluntary procurement by competitive retail suppliers is a matter of state regulatory policy. The Public Utility Commission (PUC) of Texas for example has much tighter creditworthiness requirements than any other states with retail access.190 Given the inability of many retail providers to pay their bills after the cold snap, it is clear that many of the retail providers were not sufficiently capitalized to handle the risks in electricity markets. Higher creditworthiness requirements are likely in order. Many states may also wish to undertake planning for certain customer classes such that there is an insurance policy protecting them against risks they are not equipped to address.
Contracts for procurement in the fully competitive model can be either physical or financial. A financial contract might be a contract-for-difference with a target payment to
actually achieving the optimum level, and was not too low in 2019. While everything about the Texas structure will undergo scrutiny after the outages in February 2021, there is little evidence that even if it had twice the reserve margin that the outcome would have been any different. There was plenty of generation, it just either failed to operate or lacked gas supply, which points more toward grid planning and weatherization.188
The textbook competitive model can assemble the right “members of the orchestra,” to achieve system balancing in all hours. Market prices serve as the guide to whether more or less of a given resource would be valued. For example, if very high levels of wind, solar, or battery energy storage enter a market, the prices for those sources will tend to fall at the times those resources can produce. If one of them reaches more of a saturation point before the others based on the region’s resource mix or other factors, that signal will be sent. If there is very
188 Wood MacKenzie, “Breaking Down the Texas Winter Blackouts: What Went Wrong.” 189 Potomac Economics, “2019 State of the Market Report for the ERCOT Electricity Markets,” 75.190 Public Utility Commission of Texas, Public Utility Regulatory Act. § 25.107, and Gramlich and Lacey, “Who’s the Buyer? Retail Electric Market Structure Reforms in Support of Resource Adequacy and Clean Energy Deployment.”
70

keys to success are the existence of scarcity pricing and functional forward contracting.192 One of these analyses, focused on Australia concluded, “results suggest that existing energy-only market mechanisms have the potential to operate effectively in a 100 percent renewables scenario, but success will rely upon two critical factors. Firstly, an increase in the Market Price Cap is likely to be required... Secondly, a liquid and well-functioning derivative contracts market will be required to allow generators and retailers to hedge increased market risks successfully.”193
PROCUREMENT RESPONSIBILITY NEEDS TO BE CLEARLY ASSIGNEDThere are many alternative ways that power
procurement can be assigned. The role is very
important given the problems that can occur if the
system winds up short on power. The competitive
model, as described above, relies on voluntary
procurement by retail providers, and they are
given the job of procuring power for the load they
serve. Responsibility could lie with utilities, end-use
customers that willingly take on the risk, government
entities, community aggregators, or other entities.
Whoever has the responsibility must be fully aware
of the risks they are taking on. In the split jurisdiction
area of the country outside of Texas, Hawaii, and
Alaska, it is a state choice how they wish to organize
their electric industry structure, but FERC will need
to know that someone is responsible for power
procurement for all customers. FERC could consider
a certification program to make sure there is some
entity that is capable of procuring sufficient power.
the supplier that adjusts based on whether the strike price is above or below the ultimate spot price. The load-serving entity’s consumption is settled in the physical spot market, so they have an incentive to line up power that matches the time and location of their consumption. Procurement in the fully competitive model is for either unbundled products, which can be traded in separate contracts, or bundled contracts. An end-use consumer may be served by energy, environmental attributes, and reliability services by different companies using different resources. If there were very high clean energy requirements, a generator might receive a large part of its revenue in a pre-arranged long-term environmental attribute sale and a lesser amount in forward energy and reliability services sales. The value in each of the services is determined by supply and demand for each service.
The textbook market structure has promise for working well with a decarbonized portfolio. Key features include large regional operation, fast dispatch, non-discriminatory engineering-based competitive procurement of reliability services, lack of subjective product definitions by incumbent stakeholders, scarcity-based pricing, free-flow of electricity within a region, competition fostering innovation in the generation and retail sectors, and the existence of long-term contracts to finance new generation.191 Three separate analyses of the application of the competitive model to a decarbonized portfolio found that the
191 Hogan, “Electricity Market Design and the Green Agenda.”192 Riesz, Gilmore, and MacGill, “Assessing the Viability of Energy-Only Markets With 100% Renewables,” Gramlich and Hogan, “Wholesale Electricity Market Design for Rapid Decarbonization: A Decentralized Markets Approach,” and Gimon, “Let’s Get Organized! Long-Term Market Design for a High Penetration Grid.”193 Riesz, Gilmore, and MacGill, “Assessing the Viability of Energy-Only Markets With 100% Renewables.”
7170
other standards a condition of obtaining such a license.198 In those 13 states Provider of Last Resort (POLR) rules also undermine competitive retailers who do procure on a long-term basis.199 These states have a choice – either fix these retail market flaws, or find another way to ensure prudent procurement.
In total, 49 out of 50 states have some form of physical reserve margin or capacity requirement. Whether it should or should not exist, large electricity customers must make it work. We turn to other models and how they can be made to procure the resources needed for reliable and efficient, decarbonized power systems.
CERTAIN ALTERNATIVES TO THE TEXTBOOK COMPETITIVE MODEL CAN ALSO WORK FOR CUSTOMERSMany states have chosen not to pursue the textbook competitive model for various reasons. In some cases, consumer advocates have questioned the benefits and promised savings.194 Utilities in a number of states have sponsored research critical of retail choice.195 Other states where there is a split between federal (FERC) and state jurisdiction may not be able to harmonize wholesale and retail markets as Texas has been able to do.196 Consumer advocates and utilities tend to be aligned in a coalition against full retail choice. There are also political difficulties in implementing full scarcity pricing, creditworthiness and other associated features that are needed in some regions, making the textbook competitive wholesale-retail design a challenge to put in place.197
Outside of Texas, the other 13 states with retail competition would need to fix their retail designs for procurement responsibility to work on a voluntary basis. These other states likely have authority to create well-equipped electricity customers and assign them responsibility for firm energy and other product procurement but thus far have not chosen to use do that. State commissions have the power to license competitive retailers and they could make creditworthiness and
194 See, eg, Dance, “More Utility Competition Was Supposed to Drive Down Prices, but Many Marylanders Are Paying More for Energy.”195 Quilici et al., “Retail Competition in Electricity: What Have We Learned in 20 Years?”196 Tierney, “Wholesale Power Market Design in a Future Low-Carbon Electric System: A Proposal for Consideration.”197 Ibid.198 See, for example, The General Court of the Commonwealth of Massachusetts, Massachusetts General Law, Ch. 164 § 1F. 199 Gramlich and Lacey, “Who’s the Buyer? Retail Electric Market Structure Reforms in Support of Resource Adequacy and Clean Energy Deployment.”
72

own generation in these procurements, including through utility affiliates. Customers will also want to ensure such processes are overseen by a sufficiently independent state utility regulator with technical capacity to mitigate information asymmetries and enforce competitive solicitation requirements. Energy procurement can also take place for clean energy and environmental attributes by utilities that have green tariffs. These purchases are driven not by a mandate but by the amount of customer demand that signs up to be served by clean energy.203
MANDATORY PROCUREMENT OF FIRM ENERGY CAN WORK FOR CUSTOMERS
For those states and RTOs not willing to rely fully on voluntary contracting and wholesale market prices, another option is a requirement to procure firm energy in advance. As described by Ausubel and Cramton, “The need for regulated forward markets in electricity comes largely from market failures on the demand side. Consumer demand response is limited; consumers have limited exposure to spot prices and have no ability to express preferences for reliability. As a result, in most markets, regulators establish the quantity of resources needed.”204 These demand side flaws can be more of a problem in the U.S. outside of Texas where wholesale and retail markets are not harmonized by a common regulator.
UTILITY CLEAN ENERGY PROCUREMENT CAN WORK FOR CUSTOMERSUtilities plan for serving load in much of the country, even for many utilities in RTOs. Integrated Resource Planning (IRP) is performed by utilities in 32 states in order to determine energy and capacity needs, usually on a 3-4 year cycle. In recent years there have been many IRPs where a portfolio of wind + solar + storage + regional trading has been evaluated against options of keeping old fossil plants online or putting new gas generation in utility rate base.200
Large electricity customers can benefit from well-designed IRPs that evaluate the reliability of a clean energy portfolio, even if they do not get to make their own choices. It is essentially a monopsony, or single buyer model, where procurement is performed by a monopoly utility and regulated by state public utility regulators. There are a set of best practices that can be used to take advantage of generation competition and clean energy options, as explained by Wilson, Lehr, and O’Boyle.201 A state can provide an open forum for stakeholders to revise planning assumptions in the planning model, use competitive solicitation for whatever new resource needs are called for, and make sure needs are defined on a technology neutral basis.202 It will be important for electricity customers to make sure that utilities do not favor their
200 Cooke, Twitchell, and O’Neil, “Energy Storage in Integrated Resource Plans.”201 See Wilson, O’Boyle, and Lehr, “Monopsony Behavior in the Power Generation Market,” and Wilson et al., “Making the Most of the Power Plant Market: Best Practices for All-Source Electric Generation Procurement.”202 Lehr, “Utility Monopsony Regulation: What’s Behind Low-Cost Wind and Solar Bids in Colorado?”203 World Resources Institute, “Utility Green Tariffs.”204 Ausubel and Cramton, “Using Forward Markets to Improve Electricity Market Design,” 196.
7372

accountability than a pure “capacity” market. Forward firm energy requirements would be an improvement over the mandatory capacity markets that have been used in the U.S. Northeast. Firm energy can prevent some of the flaws of capacity markets, including defining the product as a physically backed call option on energy, advance forward contracting, and performance incentives tied to spot market operation.207 There have been efforts to improve on capacity markets by harmonizing them more closely with energy markets and real-time physical market performance. Capacity or firm energy as a call option with clearing based on spot prices is a popular notion.208 ISO/RTOs could also administer a voluntary market for such call options.209
The entity responsible for mandatory forward-firm energy contracting could be load-serving entities, states, or state-overseen processes similar to the New Jersey Base Generation Service auction.210 In states with retail competition, the state could choose whether to assign the responsibility to competitive retailers or to utilities on the retailers’ behalf.
The policy requirement for forward firm energy contracting could be set by either an RTO under FERC jurisdiction, or a state. Jurisdiction in this area is somewhat murky. States have jurisdiction over both retail service and most aspects
Physical procurement requirements have been justified in electricity markets since the beginning of restructuring based on the “public good” nature of electricity supply.205 The result was a variety of capacity requirements and responsibilities, which are described in Appendix B. Some form of capacity payment has been incorporated into electricity markets in England and Wales Pool, the Single Electricity Market on the island of Ireland, Spain, Argentina, Italy, South Korea, and Chile.206
The product definition of firm energy is different from capacity and is intended to make sure this product includes more assurance than real-time energy, but with more performance
205 Stoft, Power System Economics: Designing Markets for Electricity. A public good is one that is non-rival (use by one entity does not reduce its use by another) and non-excludable (no entity can prevent another from using it). Public goods are one of the classic forms of “market failure” (along with externalities and natural monopoly) because their existence creates a free-rider problem where market participants on their own will under-procure the needed resource, in this case capacity.206 Pöyry, “Balancing Resource Options: An Alternative Capacity Mechanism.”207 Ausubel and Cramton, “Using Forward Markets to Improve Electricity Market Design,” 199.208 Pöyry, “Balancing Resource Options: An Alternative Capacity Mechanism,” 9-10.209 Ibid.210 New Jersey Statewide Basic Generation Service Electricity Supply Auction, “BGS Auction.”
74

211 Connecticut Department Of Public Utility Control v. Federal Energy Regulatory Commission.212 NERC as the Electric Reliability Organization is only required to conduct “periodic assessments of the reliability and adequacy of the bulk-power system in North America.” The Federal Power Act does not authorize the ERO (NERC) or FERC to “order the construction of additional generation or transmission capacity or to set and enforce compliance with standards for adequacy or safety of electric facilities or services.” See Federal Power Act, 16 U.S. Code § 824o.213 ReliabilityFirst Corporation, “Petition of the North American Electric Reliability Corporation and ReliabilityFirst Corporation for Approval of Proposed Regional Reliability Standard BAL-502-RF-03.”214 Porter, Hoyt, and Widiss, “Final Report Concerning the Maryland Renewable Portfolio Standard as Required by Chapter 393 of the Acts of the Maryland General Assembly of 2017,” ES-32.215 Joskow, “Hybrid Electricity Markets to Support Deep Decarbonization Goals.”
not enable long-term contracting to reduce financing costs, at least 11 states with RPS’ also put in place long-term contracting requirements for renewable energy.214 The contracting can be bundled energy and RECs, or RECs alone. Generation developers are able to sell firm energy or capacity to one entity, energy to another, and environmental attributes to a third entity. What matters for energy development is that each service is valued and there are electricity customers able and willing to commit to long-term purchases.
The entity responsible for long-term environmental attribute procurement can be the utility on behalf of all load, or competitive retailers for the load they serve.
In a review of U.S. power markets, Dr. Paul Joskow of MIT noted a key development, "State mandated procurement of hydro, wind, solar, and storage pursuant to long-term contracts in “restructured” market areas: Maine, Massachusetts, Connecticut, New York (and NYC), New Jersey, Maryland, DC, …California, Nevada.”215 Dr. Joskow noted this dynamic of mandated procurement as a reality both in the U.S. and in many other countries, not necessarily as a positive development.
of generation. FERC’s authority to mandate capacity purchases and capacity markets has been upheld by various courts211 despite any clear language in the Federal Power Act related to mandatory capacity requirements. Contrary to a common misunderstanding, NERC has no authority to set a resource adequacy standard or a reserve margin, but can only assess resource adequacy.212 FERC has approved a reserve margin in a tariff filing but whether or not FERC can really enforce that requirement has not been tested in court.213
Whether forward contracting is voluntary or mandatory, some entity needs to have clear accountability for the function to ensure resource adequacy. Some customer classes may be able to handle this responsibility and may have the “financial resilience” and wherewithal to assume the risks inherent in power systems. Other customers may need to be treated more like drivers with mandatory auto insurance requirements because they may not be able to handle the risks. States will need to make these choices that involve policy preferences about how much choice to allow. MANDATORY PROCUREMENT OF ENVIRONMENTAL ATTRIBUTES CAN WORK FOR CUSTOMERS
Many states with RPS have addressed the question of generator financing in their state policies. Recognizing that RECs are typically defined on a year-to-year basis which does
7574

PITFALLS WITH MANDATORY PROCUREMENT SHOULD BE AVOIDEDFor large electricity customers to achieve the efficient, reliable, and low carbon grid they desire, a few cautions on mandatory procurement should be kept in mind. First and foremost, mandates should avoid the full shifting of risk back from investors to consumers. Placing risk on investors was the main benefit of restructured electricity markets because generators are very costly and bad generation investments that must be paid by consumers are the primary reason restructuring began.216 The nuclear plant fiascos in South Carolina217 and Georgia218 are a reminder of the harm that bad investments and stranded costs can cause when risks are placed on consumers and not on investors.
Another pitfall to avoid is to make sure electricity customers actually get what they paid for. Performance has been a problem with suppliers of capacity in Northeast capacity markets and California resource adequacy. According to ISO-New England, gas generators that commit to provide capacity do not necessarily have firm pipeline supply contracts, and dual fuel units with onsite oil storage may not have sufficient fuel to last for more than a week, especially when there are competing uses of that fuel and weather-related forced outages that can disrupt supply from multiple generation sources.219
216 See Hartman, “Traditionally Regulated vs. Competitive Wholesale Markets,” and Cleary and Palmer, “US Electricity Markets 101.”217 Greenblatt, “South Carolina Spent $9 Billion on Nuclear Reactors That Will Never Run. Now What?”218 Associated Press, “Costs of Nuclear Expansion at Georgia Power Plant Spiking.”219 Van Welie, Testimony of Gordon Van Welie President & Chief Executive Officer, ISO New England Before the US Senate Committee on Energy & Natural Resources.
76

220 PJM, “PJM Cold Snap Performance Dec. 28, 2017 to Jan. 7, 2018.”221 CAISO, CPUC, and CEC, “Preliminary Root Cause Analysis: Mid-August 2020 Heat Storm,” 21.222 FTI Consulting, “Resource Adequacy Mechanisms in the National Electricity Market,” 8.223 Performance penalties in capacity markets are based on capacity prices, not spot energy prices. PJM Manual 18 p. 203.224 Gramlich and Goggin, “Too Much of the Wrong Thing: The Need for Capacity Market Replacement or Reform.”225 Gramlich and Goggin, “Too Much of the Wrong Thing: The Need for Capacity Market Replacement or Reform,” 7.226 Patton, “Resilience and Emerging Issues in Wholesale Electricity Markets,” 4.227 While true VOLL varies by individual customer, economists have estimated it in various ways. The UK set a VOLL in their market design at 5,000 pounds or about $7,500/MWh. The market monitor for ISO-NE, NYISO, and MISO estimates it to be $4,000 to $25,000. See Patton, “Resilience and Emerging Issues in Wholesale Electricity Markets.” A London Economics study for ERCOT indicates VOLL in the neighborhood of $4,000 to $7,000/MWh for commercial and industrial customers: Frayer, Keane, and Ng, “Estimating the Value of Lost Load.”228 Mays, Morton, and O’Neill, “Asymmetric Risk and Fuel Neutrality in Electricity Capacity Markets.”
subjective stakeholder discussions and voting processes. A long list of design elements have been modified by stakeholders and approved by FERC that have led to very large excess reserve margins in some regions.224
Based on various design features, actual reserve margins that result from these subjective physical assessments has led to Northeast capacity markets that charge consumers for $1.4 billion worth of excess capacity.225 Design is subject to the imposition of subjective features such as the Minimum Offer Price Rule. Current reserve margins are often equivalent to a value of lost load of $200,000 to $300,000/MWh226, which is 10 to 50 times the estimates of actual consumer valuation.227 It does not benefit customers to pay for extreme generation supply reliability when a dollar spent on local reliability would improve their reliability far more. Governance approaches must incorporate consumer interests to reflect appropriate valuation and definition of physical requirements.
Physical requirements can also lead to biases, intended or not. A group of economists showed how the incentive structure of capacity markets favored units with lower capital costs and higher operating costs than the cost profile of renewable sources.228
PJM reported high coal plant failure rates in 2014 and 2018 cold weather episodes.220 Gas unit performance was poor during the recent California load shedding events.221
Capacity markets, and the resource adequacy programs they serve, have had a fundamental problem that they are designed to achieve "adequate resources" to meet peak load, and they were not designed originally with performance in mind,222 or the challenge of meeting the net load conditions of the future portfolio. While Northeast capacity markets have been evolving towards more performance incentives, this incentive is not as strong in capacity markets as it is in energy-only markets.223
If policymakers choose to continue or impose physical requirements, as is the case in 49 states, the physical metrics will need to evolve to fit the 21st century portfolio. The experience of capacity markets suggests there will be extensive debate over these requirements in state, RTO, FERC, and court proceedings.
Physical requirements imposed on electricity customers raises the question of whether the governance process of deciding those physical requirements adequately represents customer interests. Capacity market design is a product of
7776
if calculated on an hourly rather than daily basis.”232 One change may be to shift toward “energy adequacy” and away from “capacity adequacy.” The former evaluates needs in all hours, while the latter is focused only on points in time.233 Alternative metrics should also include the magnitude of lost load as well as frequency, so Expected Unserved Energy (EUE) over a given time period is a promising replacement.234 By modeling each hour of the year based on probability distributions of wind, solar, and load, one can assess each hour’s EUE, then add it up across a year or multiple years. Policymakers can then compare such an estimate with an acceptable target EUE such as the traditional standard one day in 10 years, which is based on an arbitrary threshold and is interpreted to mean different amounts of load loss by different system planners.
Physical requirements should also be performed on a wide regional basis. A large part of the quantified economic savings from RTO benefit-cost studies is due to the lower reserve margin that is enabled by regional operation and sharing of capacity reserves.235 If reserves are shared then each utility needs less backup because statistically their shortfalls will tend to occur at different times so each generator can back up multiple systems, not just one.
Physical requirements also need to identify the actual services that are needed. As Bethany Frew from the NREL observed, “with an evolving grid and a dynamic market landscape, the questions and tools we use also need to change. Our questions should shift from ‘how many MWs do we need?’ to ‘what resources do we need to provide the full set of required system services under a wide range of possible futures?”229
A quantifiable physical determination of how much firm energy will be needed in a decarbonized system is elusive. As the NERC Integrating Variable Generation Task Force concluded “planning reserve margin, calculated as a percentage of system peak, will become less meaningful with large penetrations of [variable generation].”230 Traditionally calculated reserve margins do not work well for the future resource mix because peak load is not the concern; what matters are the shortages that may result from the overlap of high load and low wind and solar output.231 As a group of NREL researchers concluded, “system metrics such as LOLE [loss of load expectation] for system needs and ELCC [effective load carrying capability] for individual contributions may provide a better estimate for meeting long-term reliability needs, especially
229 Frew, “Beyond Capacity Adequacy.”230 North American Electric Reliability Corporation, “Integration of Variable Generation Task Force: Summary and Recommendations of 12 Tasks,” 21.231 North American Electric Reliability Corporation, “Integration of Variable Generation Task Force: Summary and Recommendations of 12 Tasks,” 21. See also Ibanez and Milligan, “Comparing Resource Adequacy Metrics.”232 Milligan et al., “Wholesale Electricity Market Design with Increasing Levels of Renewable Generation: Revenue Sufficiency and Long-Term Reliability,” 30.233 FTI Consulting, “Resource Adequacy Mechanisms in the National Electricity Market,” 18.234 “Hourly EUE values should be reported for every month or year (i.e., 24 data points), as this is the only metric which considers magnitude of loss of load events.” See North American Electric Reliability Corporation, “Probabilistic Adequacy and Measures.”235 See MISO, “Value Proposition” and PJM, “PJM Value Proposition.”
78

236 Rocha-Garrido, “Public 1st Draft ELCC Results and the Process to Provide Preliminary ELCC Results.”237 Astrapé Consulting, “Dispatch Effects on Storage ELCC in PJM.”238 North American Electric Reliability Corporation, “Reliability Guideline: Fuel Assurance and Fuel-Related Reliability Risk for the Bulk Power System.”239 NERC Integration of Variable Generation Task Force (IVGTF) states, “The fundamental calculations of LOLP, LOLE, and ELCC are not new, nor are they unique to variable generation. The reliability-based approach to calculating resource adequacy is a robust method that allows for the explicit estimate of the shortfall of generation to cover load. The traditional use of LOLE is to determine the required installed capacity, based on expected capacity during peak periods, and ELCC measures an individual generator’s contribution to overall resource adequacy.” See North American Electric Reliability Corporation, “Methods to Model and Calculate Capacity Contributions of Variable Generation for Resource Adequacy Planning,” 9.
For example, in PJM, whether storage is dispatched before or after demand response leads to a 47 percent236 ELCC with one method and 97 percent with another.237 These interactions make assigning clear credit to any one resource difficult. Retirements and additions of different resources can affect a resource’s ELCC, which can thus conflict with efforts to undertake long-term contracting, particularly if capacity payments are a significant contribution to unit revenues. As gas generation has grown to make up a larger share of firm energy, planners have increasingly become concerned about the impact of correlated gas plant outages due to fuel supply interruptions, weather-driven generator outages, or pipeline outages.238 Traditionally, planners assumed that all generator forced outages were statistically independent events, with no correlation between any two plants’ outages. Events like the 2014 Polar Vortex and the 2020 California load-shedding events have demonstrated this assumption is no longer valid. If ELCC is used for one set of resources, non-discriminatory access requirements would dictate that it be used for the others because other resources such as gas units can all be affected by common factors such as weather, just like renewables. ELCC was developed for non-renewable resources originally so it can apply equally well.239
How much each resource counts for firm energy will also need to evolve, when physical requirements are used. Capacity value is the metric of contribution to system capacity, as described in Chapter 2. Until recently, rough rules of thumb were used for wind and solar capacity value. Effective load carrying capability” (ELCC) a probabilistic assessment of a resource’s contribution to system reliability, is becoming popular with RTOs. ELCC accounts for whether each resource’s contribution is correlated with others, such as the sun shining everywhere or the wind blowing at the same time. Use of ELCC would tend to encourage diversity of technologies and project locations to improve total reliability value. However, there are some challenges when using ELCC for markets: A resource’s contribution is a function of what makes up the rest of the portfolio. As noted above, some resources such as wind, solar, and short-duration batteries are complementary such that more of one increases the capacity contribution of the other, while putting more of the same resource at the same location reduces ELCC. On the other hand, resources with similar output profiles reduce the other’s capacity value.
7978

240 See Future Power Markets Forum, “Central Procurement Structures for Energy, Capacity, and Environmental Products.”241 See New England states discussions: NESCOE, “New England States’ Vision for a Clean, Affordable, and Reliable 21st Century Regional Electric Grid.”242 As noted earlier, capacity markets disfavor resources with the cost profiles of renewable sources. See Mays, Morton, and O’Neill, “Asymmetric Risk and Fuel Neutrality in Electricity Capacity Markets.”243 California Public Utilities Commission, “Resource Adequacy Compliance Materials.”
COORDINATED CENTRAL ELECTRICITY AND ENVIRONMENTAL ATTRIBUTE PROCUREMENT SHOULD BE A STATE CHOICE, WITH PROS AND CONS THAT SHOULD BE CONSIDEREDA number of analysts believe the products of the clean energy portfolio should be centrally procured. In this way, there can be co-optimization and evaluation of the tradeoffs between firm energy, reliability services, and environmental attributes.240 There are many ways to co-optimize each of the services because all resources provide different amounts of each service, and there are portfolio interactions that can be used to consumers’ benefit. At a minimum, tight coordination will be needed among procurement of the different products in order to co-optimize them. Whether that happens through separate unbundled product procurement or central procurement, it will benefit electricity customers to make sure this coordination and balancing occurs.
States could establish long-term procurements on their own or together with their neighbors. Multiple states could join to develop joint procurements.241 A central procurement would require agreement from each participating state on the products to be procured. States also may be cautious about turning over jurisdiction of environmental attributes to FERC, which could happen in a regional central procurement of bundled products.
LONG-TERM PROCUREMENT OF OPERATIONAL RELIABILITY SERVICES SHOULD BE CONSIDEREDIn many markets, there is mandated long-term contracting for capacity through RTO capacity markets and renewable energy state requirements, but reliability services are only compensated in hourly markets. In principle, market participants could enter this void and provide hedging services to suppliers and load, as they do in Texas for energy. But there should not be a policy bias against flexible resources by having policy mandates for long-term contracting for products that fossil resources sell (capacity)242 but flexible resources do not.
Long-term purchases of flexibility services are uncommon at present. The California PUC requires utilities to procure flexibility, in addition to firm energy.243 Several states have energy storage deployment targets, which provide stable long-term demand signals for storage resources that can provide flexibility.
80
SUMMARY OF MARKET STRUCTURE AND PROCUREMENT FOR A CLEAN PORTFOLIOState and federal policy makers should encourage an efficient market structure in which the structurally competitive sectors are open to competition and the natural monopoly sectors remain regulated. The generation sector is structurally competitive and relying on competition with appropriate regulations on reliability and market power would benefit customers. Monopoly transmission and distribution owners should be prevented from gaining advantage in competitive sectors.
An effective procurement function should be a particular focus of policy makers. One approach is the textbook competitive structure where end-users or competitive retail suppliers voluntarily procure power for the load they serve. Retail competition can work with appropriate regulation to make sure sufficient procurement takes place by credit-worthy entities.
Where states opt not to put in place well-functioning retail competition, alternative procurement structures will be needed. RTOs or states may require long-term forward procurement of firm energy to ensure load can be served at all times. Defining the physical requirement will be a challenge and will need to use new metrics rather than past resource adequacy approaches. States may require long-term contracts for environmental attributes to help finance generation.
Any long-term procurement requirements should avoid shifting too much risk to consumers, avoid excessive purchase requirements, and ensure actual performance not just “steel in the ground.”
FERC should work with restructured states to re-evaluate resource adequacy approaches. In addition to eliminating broad application of MOPR, FERC and states should work together on resource adequacy approaches that support electricity customer purchases and state policies while maintaining reliability.
8180

Doubling or tripling the delivery capacity of the U.S. electric grid, as decarbonization studies show is needed, will be a massive undertaking. Chapter 2 described how a clean energy portfolio can work, and surveyed the research on how much transmission is needed to enable large movements of power spatially across and between regions. Even without considering the variable and remote nature of renewable energy, the increasing severity and frequency of extreme weather events that can affect generation and load justifies a focus on inter-regional transmission connections as a resilience measure. Transmission investment must be addressed through different approaches than the approaches to generation investment described in Chapter 5 because transmission largely remains a natural monopoly and fully regulated segment of the industry. This chapter describes how transmission investment can be fostered.
CHAPTER 6: TRANSMISSION INVESTMENT FOR A CLEAN PORTFOLIO
82
limit, then the costs assigned to individual generators balloon. For example, historically in MISO, interconnecting wind projects have incurred interconnection costs of $0.85 per megawatt hour (MWh) or $66 per kilowatt (kW) but recently, newly proposed wind projects now face interconnection costs that are nearly five times higher, at $4.05/MWh or $317/kW.247 This is about 23 percent of the capital cost of building a wind project. The most recent 2019 system impact study for solar projects in MISO South estimated upgrade costs to total $307/kW, with upgrade costs for individual interconnection requests as high as $677/kW.248 This direct assignment, also called “participant funding,” of interconnection costs leads generators to drop out of queues, and creates a self-reinforcing cycle of queue changes, delays, and logjams.249
• There is very little large scale regional orinter-regional transmission being planned.244
• Instead, many billions of dollars are beingspent by utilities in their local systems.245
Such investments have a presumptionof prudence and a clear pathway forutility cost recovery, and many of theseinvestments could be avoided or mademore efficient if part of a coordinatedregional plan.
• Generator interconnection queues areoverwhelmed with hundreds of gigawattsof projects,246 which are being assignedcosts of shared network upgrade costs on aproject-by-project or cluster-by-cluster basis,without consideration of the efficiencies ofplanning for future needs in likely renewableresource areas. Typically, new generationin a resource area will reach a transmission
244 Coalition of MISO Transmission Customers, Industrial Energy Consumers of America, and LS Power Midcontinent, LLC, Section 206 Complaint and Request for Fast Track Processing, 31-32; PJM, ”Project Statistics,” 6; La Nickell, “Transmission Investment in SPP,” 5; CAISO, “Transmission Planning for a Reliable, Economic and Open Grid,” years 2012-2021 available under “Transmission planning and studies” section of webpage; CAISO, “2011-2012 Transmission Plan.”; Casey, “Briefing on 2010 Transmission Plan.”; and ISO-NE, “Transmission.”245 Pfeifenberger et al., “Cost Savings Offered by Competition in Electric Transmission: Experience to Date and the Potential for Additional Customer Value,” 4: “Significant investments have been made, but relatively little has been built to meet the broader regional and interregional economic and public policy needs envisioned when FERC issued Order No. 1000. Instead, most of these transmission investments addressed reliability and local needs.” “...about one-half of the approximately $70 billion of aggregate transmission investments by FERC-jurisdictional transmission owners in ISO/RTO regions [was] approved outside the regional planning processes or with limited ISO/RTO stakeholder engagement,” 6-7.246 At the end of 2019, 734 gigawatts of proposed generation were waiting in interconnection queues nationwide. Wiser et al., “Wind Energy Technology Data Update: 2020 Edition,” 18. See also underlying data in the "2020 Wind Energy Technology Data Update" accompanying the slide deck.247 Gorman, Mills, and Wiser, “Improving Estimates of Transmission Capital Costs for Utility-Scale Wind and Solar Projects to Inform Renewable Energy Policy,” 10.248 MISO, “Final MISO DPP 2019 Cycle 1 South Area Study Phase I Report,” 8-15.249 Caspary et al., “Disconnected: The Need for a New Generator Interconnection Policy.”
THE CURRENT APPROACH IS INEFFICIENT
The current industry and regulatory structure described in Chapter 2 was not designed for large movements of power between utilities, states, or regions. There are approximately 500 transmission owners in the country whose investment cost recovery mechanisms were set up to recover costs on their local systems, not large regional investments. If changes are not made, we will continue following a very inefficient approach to transmission. Presently:
8382
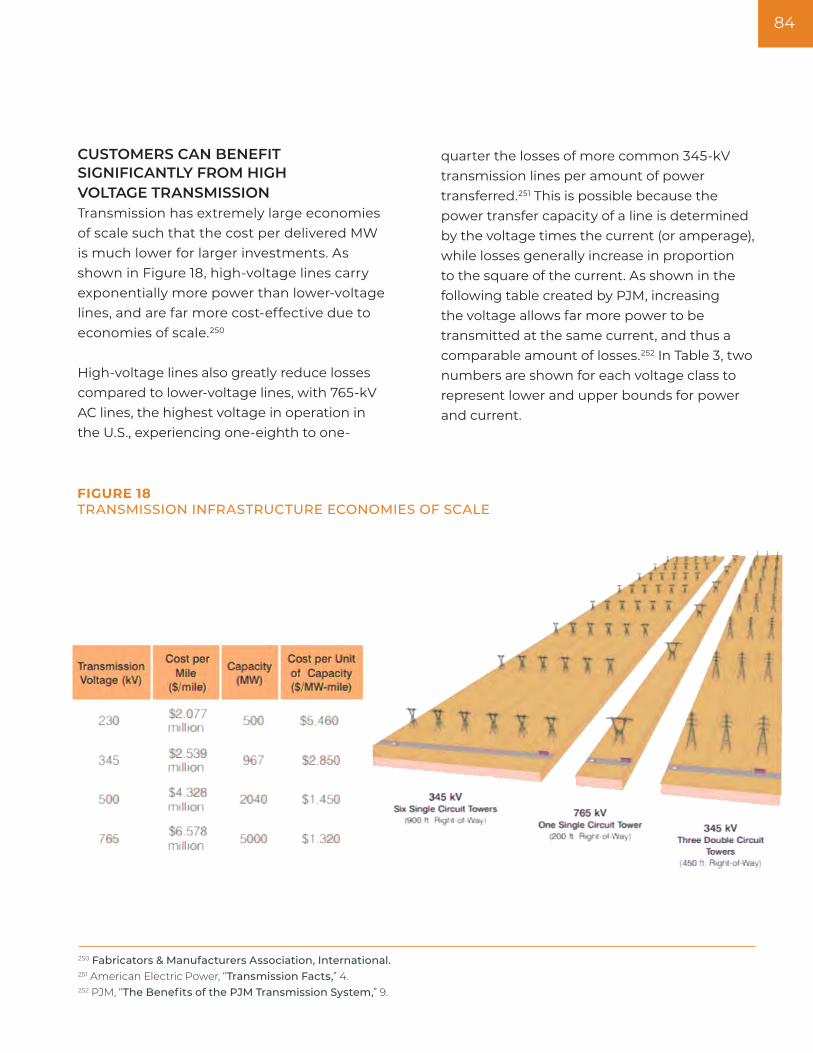
quarter the losses of more common 345-kV transmission lines per amount of power transferred.251 This is possible because the power transfer capacity of a line is determined by the voltage times the current (or amperage), while losses generally increase in proportion to the square of the current. As shown in the following table created by PJM, increasing the voltage allows far more power to be transmitted at the same current, and thus a comparable amount of losses.252 In Table 3, two numbers are shown for each voltage class to represent lower and upper bounds for power and current.
CUSTOMERS CAN BENEFIT SIGNIFICANTLY FROM HIGH VOLTAGE TRANSMISSIONTransmission has extremely large economies of scale such that the cost per delivered MW is much lower for larger investments. As shown in Figure 18, high-voltage lines carry exponentially more power than lower-voltage lines, and are far more cost-effective due to economies of scale.250
High-voltage lines also greatly reduce losses compared to lower-voltage lines, with 765-kV AC lines, the highest voltage in operation in the U.S., experiencing one-eighth to one-
FIGURE 18TRANSMISSION INFRASTRUCTURE ECONOMIES OF SCALE
250 Fabricators & Manufacturers Association, International.251 American Electric Power, “Transmission Facts,” 4.252 PJM, “The Benefits of the PJM Transmission System,” 9.
84

must be held in reserve to prevent an overload in case one of the lines failed. As an example, NV Energy in Nevada is planning to add two new 525-kV transmission lines to supplement the existing 525-kV line connecting the northern and southern portions of the state. The single existing line can only be used at a fraction of its potential capacity because of reliability concerns that would result if the line were to be taken offline by a contingency event.253 However, because 525-kV substations were already built at both ends of the existing transmission line, only one additional 525-kV substation is required to add the two new lines. Thus, the initial line reduces the cost of the additional lines and increases their benefits, demonstrating large economies of scale. In turn, the addition of the two new lines and the additional substation opens up multiple opportunities to build new high-voltage lines to connect to neighboring power systems.254
Networks like the power grid feature non-arithmetic economies of scale. Initial investments reduce the cost and increase the benefits of subsequent investments, yielding positive externalities that are difficult to quantify. For example, once a region’s power system has overcome the initial cost hurdle of adding substations and power lines that operate at a higher voltage, the cost of connecting additional lines to those substations is reduced because a significant share of the needed substation equipment already exists.
Similarly, moving from two to three parallel transmission lines increases the amount of transmission capacity that can be safely used by 100 percent for only a 50 percent increase in transmission costs; with only two lines, their total utilization would be limited to the capacity of a single line because the other line’s capacity
TABLE 3HIGHER VOLTAGE LINES ALLOW FAR MORE POWER DELIVERY
253 NV Energy, “Greenlink Nevada,” 13-19.254 Ibid., at 22-26
Voltage Glass Power (MVA) Current (AMPS)
765 kV4,000 3,079
5,400 4,157
500 kV2,500 2,887
3,500 4,041
345 kV1,000 1,673
2,000 3,347
230 kV420 1,054
1,250 3,138
8584

The net result of the current transmission investment framework is that electricity customers are likely paying too much for some kinds of transmission and missing opportunities to achieve lower delivered costs that would be available with pro-actively planned transmission at more efficient scales. Transmission has extremely large economies of scale such that the cost per delivered MW is much lower for larger investments. Continuing the incremental approach to transmission is penny-wise and pound-foolish.
A number of studies quantify the customers benefit from larger-scale transmission. A study of the Eastern Interconnect showed the customer benefit of accessing low-cost renewables even after paying for large scale transmission can cut consumers electric bills by $100 billion and decrease the average electric bill rate by more than one-third, from over 9 cents/kWh today to around 6 cents/kWh by 2050, saving a typical household more than $300 per year.255 As noted in Chapter 3, a study
by MIT found that inter-state coordination and transmission expansion reduces the cost of zero-carbon electricity by up to 46 percent compared to a state-by-state approach.256
Transmission benefits system resilience, as it is there when anything happens to inherently unpredictable levels of generation and load. As ERCOT and the Texas public utility commission explained in comments to FERC, “One of the most critical elements of system resilience is ensuring that the transmission system is planned in such a way as to ensure continued operations following an unexpected outage of one or more generators or transmission elements.”257 Similarly, the New York grid operator noted that “These interconnections support and bolster reliability and resilience by creating a larger and more diverse resource pool available to meet needs and address unexpected and/or disruptive events throughout an interconnected region.”258 As noted by Dr. Frank Wolak of Stanford University:
255 Clack et al., “Consumer, Employment, and Environmental Benefits of Electricity Transmission Expansion in the Eastern U.S.”256 Brown and Botterud, “The Value of Inter-Regional Coordination and Transmission in Decarbonizing the US Electricity System.”257 ERCOT and PUCT Comments to FERC, March 2018, Docket AD18-7.258 NYISO Comments to FERC, March 2018, Docket AD18-7. 259 Wolak, “Managing Unilateral Market Power in Electricity,” 8.
Expansion of the transmission network typically increases the number of independent wholesale electricity suppliers that are able to compete to supply electricity at locations in the transmission network served by the upgrade. With the exception of the U.S., most countries re‐structured at a time when they had significant excess transmission capacity, so the issue of how to expand the transmission network to serve the best interests of wholesale market participants has not yet become significant. In the U.S., determining how to expand the transmission network to serve the needs of wholesale market participants has been a major stumbling block to realizing the expected benefits of electricity industry re‐structuring.259
86

TRANSMISSION INDUSTRY STRUCTURE REQUIRES A REGULATORY, NON-MARKET APPROACHTransmission is optimally structured as a regulated monopoly because of its economies of scale, network externalities, and public goods characteristics. These market failures make the sector ill-suited to competition. Traditional public utility regulatory approaches apply to transmission. While there have been attempts in many regulated industries to use more performance-based regulation, the basic approach of planned and regulated investments, regulatory cost allocation and recovery with cost-of-service regulation will generally apply. Regulated network investments is compatible with the competitive generation sector. As one of the leading architects of energy markets, Dr. William Hogan of Harvard University explained, “if there were no economies of scale and scope for transmission investment, electricity markets could follow the same competitive model for transmission where beneficiaries determine and pay for their own investments. Given the large economies of scale and scope, transmission is a natural monopoly and investment requires a central coordinator.”260
260 Hogan, “Transmission Investment Beneficiaries and Cost Allocation: New Zealand Electricity Authority Proposal,” 1.261 Joskow and Schmalensee, Markets for Power.262 Joskow, Comments of Professor Paul L. Joskow, v.
There are numerous reasons why we should not expect the market to produce transmission enhancements that meet reasonable economic and reliability goals. Indeed, proceeding under the assumption that, at the present time, the market will provide needed transmission network enhancements is the road to ruin. There is abundant evidence that market forces are drawing tens of thousands of megawatts of new generating capacity into the system. There is no evidence that market forces are drawing significant quantities of entrepreneurial investments in new transmission capacity. While third parties should be given the opportunity to propose market-based private initiatives to expand transmission capacity, incumbent transmission owners, in the context of a sound RTO/ISO planning process, must be relied upon to play a central role in expanding the transmission system.262
If instead one were to rely on voluntary investment by unregulated market participants on a voluntary basis (as in a competitive market), there would likely be under-supply of the infrastructure as Dr. Hogan’s paper explains. That is the expected result with both natural monopolies and public goods market failures. Regulation is required to create the expanded capacity. Similarly Dr. Paul Joskow, the economist who promoted generation competition with his 1983 book Markets for Power, stated:261
8786
PLANNING IS NEEDED TO EXPAND INFRASTRUCTUREEnabling large transfers of power between and across regions requires regional and interregional planning. The value of transmission comes not only from regular use but the ability to assist each area in their unique times of need. Every line affects the value of every other line since electricity follows a path of least resistance and moves on parallel paths. Ideally, transmission planning would cover full interconnections and even optimize planning between the interconnections. Figure 19 shows U.S. Planning Authorities which cover only parts of regions.
Planning also needs to be pro-active to anticipate the resource mix 10 years into the future in order for transmission to be ready in time and to meet customer and policymakers’ objectives. Presently, there is little attention in any region to the long-term system needs.
Planners need to have sufficient authority to actually make plans. Currently, the planning authorities above tend to mostly roll up what is reported from utilities in their region. While that process can serve to identify any inconsistencies, it does not capture the efficiencies of a true regional plan.
Theoretically, the best way to enable the large regional and inter-regional transmission capacity investments would be to have a national regulator of all transmission with standard public utility regulatory powers. In a standard regulatory approach, the regulator can compel a planning process and investments deemed to be needed, allocate the costs across all beneficiaries which might include the entire interconnection, and set reasonable rates.
The U.S. does not currently have a regulator that has clearly been given such powers, or used the powers that exist in federal law. As Dr. Joskow recently observed, “Barriers to expanding the needed inter-regional and internetwork transmission capacity are being addressed either too slowly or not at all.”263 Only tepid encouragements from FERC for planning authorities to coordinate on inter-regional planning have been instituted thus far.
An effective market and regulatory structure to achieve efficient investment in transmission requires removal of three types of barriers, sometimes referred to as the 3 P’s: planning, permitting, and paying (cost allocation). We take each in turn.
263 Joskow, “Transmission Capacity Expansion Is Needed to Decarbonize the Electricity Sector Efficiently.”
88

between the large regional and inter-regional planning needed for a reliable decarbonized grid and where the industry currently stands. New regulations will be required to fill this gap in planning. Legislation directing FERC to undertake these changes would provide support for FERC action that could come in handy in court proceedings if and when it is challenged. There have been bills in both the U.S. Senate and House in recent years directing FERC to review and under-take a process to improve inter-regional planning.269 Such legislation would clarify and strengthen FERC’s ability to undertake the type of planning required.
FERC has attempted to regionalize transmission and move away from the siloed utility-by-utility approach. The Commission issued a 1993 Regional Transmission Group Policy Statement,265 Order No. 888 in 1996 encouraging ISOs with a transmission planning function,266 Order No. 2000 in 1999 encouraging RTOs with transmission planning as one of the key functions, Order No. 890 in 2007 providing specific planning guidance,267 and Order No. 1000 in 2011 providing more planning requirements.268
Despite these attempts by FERC to regionalize electric infrastructure, there is a wide gap
FIGURE 19CURRENT TRANSMISSION PLANNING AUTHORITIES264
264 Federal Energy Regulatory Commission, “Order No. 1000 Transmission Planning Regions.”265 Federal Energy Regulatory Commission, “Policy Statement Regarding Regional Transmission Groups; Policy Statement.”266 Federal Energy Regulatory Commission, Order No. 888, 75 FERC ¶ 61,080.267 Federal Energy Regulatory Commission, Order No. 890, 118 FERC ¶ 61,119.268 Federal Energy Regulatory Commission, Order No. 1000, 136 FERC ¶ 61,051.269 See Heinrich, S.3109 - Interregional Transmission Planning Improvement Act of 2019 and Section 212 of Haaland, H.R.5511 - Interregional Transmission Planning Improvement Act of 2019. See also House appropriations language: “The Committee recognizes the importance of interregional transmission planning to the effective deployment of renewable energy sources and encourages FERC to undertake a review to evaluate the effectiveness of its existing interregional transmission coordination requirements and consider specific improvements to those requirements that would better promote the identification and development of more efficient and cost-effective transmission facilities and cost allocation methodologies that reflect the multiple benefits provided by interregional transmission facilities.” See Kaptur, Energy and Water Development and Related Appropriations Bill, 2021.
8988

In order to co-optimize generation and transmission planning, the simple first step is for planners to incorporate state and utility resource goals into their plans. Today, that is generally not done, resulting in a flood of generation projects into interconnection queues, where they require shared network upgrades to be efficiently connected, yet the interconnection process only incrementally builds what is needed for the generator or cluster of generators, not what may be known to be needed to meet these utility and state resource plans.
To ensure electricity customers benefit from transmission expansion planning, FERC and RTOs should make much more and better use of benefit-cost analysis. Many lines and plans will likely show net benefits, but not all. As Dr. Hogan explains, the appropriate methodology for transmission planning is Benefit-Cost Analysis (BCA): “A forward-looking cost-benefit analysis provides the gold standard for ensuring that transmission investments are efficient.”272 He continues to explain BCA as the only reasonable option for efficient grid planning:
Peter Fox-Penner recently made one of his main recommendations in his book Power After Carbon, “National governments (notably in the United States) should provide national-level leadership and establish stakeholder mediation processes that enable new or expanded transmission projects emerging from these planning processes to be permitted, funded, and built without substantial delays.”270
A study comparing proactive planning to reactive planning found significant benefits to proactive planning because it is able to co-optimize generation and transmission:
Transmission planning has traditionally followed a generation first or reactive logic, in which network reinforcements are planned to accommodate assumed generation build-outs. The emergence of renewables has revealed deficiencies in this approach, in that it ignores the interdependence of transmission and generation investments. For instance, grid investments can provide access to higher quality renewables and thus affect plant siting. Disregarding this complementarity increases costs. In theory, this can be corrected by proactive transmission planning, which anticipates how generation investment responds by co-optimizing transmission and generation investments… We estimate cost savings from co-optimization compared to both reactive planning and an approach that iterates between generation and transmission investment optimization. These savings turn out to be comparable in magnitude to the amount of incremental transmission investment.271
270 Fox-Penner, Power After Carbon, 284. Also personal communication with the author regarding the importance of this recommendation relative to others in the book.271 Spyrou et al., “What Are the Benefits of Co-Optimizing Transmission and Generation Investment? Eastern Interconnection Case Study.”272 Hogan, “Transmission Investment Beneficiaries and Cost Allocation: New Zealand Electricity Authority Proposal,” 1.273 Ibid., 5.
There is no other way of determining whether a grid investment is efficient. Whatever the purpose of the grid investment, it will only be efficient if the benefits it provides – for example, in terms of lower energy production costs or increased reliability – exceed the cost of the investment. No investment should proceed without being subject to a cost-benefit assessment which quantifies all benefits and costs.273
90
“These transmission facilities typically must span hundreds of miles, carry price tags of hundreds of millions of dollars, and most significantly, cross many boundaries of a balkanized regulatory framework that emerged almost a century ago for local monopolies organized around central power plants serving retail markets. This institutional structure is fundamentally unsuited to the task of planning and building modern, efficient, regional and interregional transmission.”275
PERMITTING ACTION AT THE FEDERAL LEVEL IS NEEDEDWhile there is a federal permitting regime for natural gas pipelines, no such regime exists for electric transmission. It will be very difficult if not impossible to build a nationwide network of transmission with a state- and locality-based permitting regime.276 The most obvious solution is to provide the same regime for electric transmission as applies to gas pipelines, though that will likely be politically difficult.
Three statutory provisions from the Energy Policy Act of 2005 could be utilized more by executive agencies.277 Section 1221 allows DOE to designate National Interest Electric Transmission Corridors over private land and gives permitting authority within these corridors to FERC. Section 1222 enables Power Marketing Administrations to partner with private developers to plan and develop transmission in the footprints of the PMAs. Section 368 provides for DOE coordination of transmission corridors over public lands.
In addition to regional planning authorities’ planning work under the direction of FERC, the U.S. Department of Energy could help with the development of large scale inter-regional planning. Transmission planning requires both extensive engineering analysis and stakeholder engagement. Both of those require significant resources and project management capabilities which DOE possesses.
The institutional structure of planning authorities should be reviewed to ensure they have the authorities and geographic scope to allow large scale regional and inter-regional transmission to be built. The institutions could be the same organizations as the operator of the markets but don’t necessarily need to be. The functions of the transmission planning side of RTOs and the market operations side are sufficiently distinct enough that they could be performed by different entities. One of the main benefits of RTOs is that they provide a regional tariff through which to recover the costs of transmission expansion. Some organization with a regional tariff will likely be necessary.
These reforms are significant and will require federal leadership. As one review of transmission concluded, “The primary barriers to building new high-voltage lines and optimizing the grid aren’t so much technical or economic but rather bureaucratic. Inefficient institutions and insufficient policies are the key factors preventing the U.S. from accessing its rich resources of clean energy.”274 It continued,
274 Jimison and White, “Transmission Policy: Planning for and Investing in Wires,” 5.275 Ibid., 7.276 A vivid illustration of the flaws of such a system are described Gold, Superpower: One Man’s Quest to Transform American Energy.277 A thorough description of these authorities and how they can be utilized going forward can be found in Zevin et al., “Building a New Grid Without New Legislation: A Path to Revitalizing Federal Transmission Authorities.”
9190
also results in a free rider problem in which the stakeholders that would have to pay for a certain type of line refuse to plan it in hope that another stakeholder group will pay for it. In particular, many regions are increasingly failing to plan for needed transmission and instead relying on interconnecting generators to pay for most of the grid upgrades, even though those upgrades provide economic and reliability benefits to all electricity customers. Public goods are typically funded by taxpayers through government programs such as the budgets for the Department of Defense or Transportation. There is close to zero funding for energy infrastructure in the DOE's budget. Instead, electricity infrastructure is funded through utility rates. However the scope of utility regulation is currently misaligned - each utility is tasked with serving its local area and keeping up its local utility system of transmission and distribution, but not to address large regional and inter-regional needs.
There have been some recent successful models of sharing costs for regional transmission in a way that enabled the infrastructure to be financed and built.278 ERCOT Competitive Renewable Energy Zones, MISO Multi-Value Projects, and SPP Priority Projects each connected more than 10 GW of renewable energy and improved regional reliability and resilience. Federal leadership at FERC and DOE will be needed to pursue more such planning and cost allocation initiatives.
PAYING (COST ALLOCATION) SHOULD CONSIDER THE BROAD BENEFITS OF TRANSMISSIONCost allocation is the primary barrier to ensuring sufficient transmission is built. While utilities have ways of recovering costs in rates of investments in distribution systems and lower voltage local transmission, there is not a currently functioning means of recovering costs of large scale regional and inter-regional transmission, even though there is plenty of available private capital. Given the broad national benefits of power system resilience and decarbonization to public health, security, and welfare, Congress should consider federal funding of a macro grid. The inter-state highway system with 90 percent federal funding and 10 percent local funding might be a model.
Transmission is not only a natural monopoly but a public good, like national defense or the road system, where everyone benefits but it is in no individual’s interest to pay. This “free rider” problem drives many of the failures to plan transmission, as regions refuse to plan inter-regional transmission if they believe they will have to pay for it but another region will benefit from it. Even within regions, transmission planning is often siloed into transmission projects to address reliability, economic, or generator interconnection needs because each type of project has a different cost allocation. This inhibits planners from being able to identify transmission projects that optimally address all of those needs, and
278 Trabish, “3 Transmission Projects That Illustrate the Importance in Modernizing the Grid.”
92

279 Tsuchida and Gramlich, “Improving Transmission Operation with Advanced Technologies: A Review of Deployment Experience and Analysis of Incentives.”
of RTOs.279 FERC recently coined a new term for these technologies in its Notice of Proposed Rulemaking on transmission incentives: Grid-Enhancing Technologies (GETs). Whether to deploy GETs is a decision under the control of transmission owners, not planners. GETs could be incorporated more into transmission planning, but there are limitations on how they fit into planning or how FERC could require their use. Incentives are the more viable pathway to bring GETs into wide deployment. FERC can address incentives (remove the disincentive) through its incentives policy implementing EPAct Section 219b3, a provision specifically tailored to these technologies and which FERC has never specifically implemented.
Additionally, FERC should provide transmission customers the ability to request the increased service that would be available with GET deployment. This could apply in both the interconnection and transmission service context.
MERCHANT TRANSMISSION WILL PLAY A ROLEThere are many gaps in the current system of regulated transmission creating opportunities for merchant developers to finance the transmission on their own without any regulated rate base to fund the lines. The model has worked in limited instances, where the developer can secure voluntary capacity commitments by market participants. The opportunities should remain open for merchant development. It is not likely to meet close to the efficient needs for the reasons described by economists above.
DISINCENTIVES FOR GRID-ENHANCING TECHNOLOGIES SHOULD BE REMOVEDAlong with investment in transmission lines and large physical assets, there are a set of new technologies that can increase delivery over existing lines. Very often these technologies can reduce costly congestion by 30 percent or more. The benefits of such technologies on a regional or national scale are on the order of the benefits
9392

MORE OVERSIGHT OF TRANSMISSION IS NEEDED TO BUILD CUSTOMER CONFIDENCEIt is only in recent years that many transmission assets have moved into federal jurisdiction, and out of state PUC jurisdiction. There has never been a full adjustment to this new reality. FERC’s authority does not contain many of the standard regulatory tools of a public utility regulator. FERC has tended in the past to engage in resolving disputes rather than actively regulating to ensure investments are just and reasonable. And there are gaps in oversight over transmission investment.
The current FERC rules and incentives lead utilities to invest largely in local upgrades on their own system. There has been significant concern on the part of wholesale customers that some of these investments are not valuable and there is too little oversight. Cost recovery flows through formula rates and informational filings at FERC rather than standard public utility practice of pre-approving investments. This relatively easy path for local investments stands in stark contrast with the challenges of regional planning and the competitive bidding requirements that discourage utilities from being interested in making the large regional and inter-regional investments that are needed.
FERC could consider creating a new staff office for transmission oversight. Such an office would house transmission planning experts who can help the Commission ensure that investments are prudent and planning practices are sound.
CERTAIN INCENTIVES CAN HELPFederal incentives could be extremely helpful to advance large-scale transmission that is in the national interest. Any dollar of federal support is one less dollar that needs to be the subject of contested cost allocation processes. A refundable investment tax credit for transmission, for example, could be very helpful.
In contrast to tax credits, incentives for transmission expansion in transmission rates from FERC should be discouraged, because those “incentives” are paid by customers and make cost allocation harder, not easier. Here we distinguish between rate incentives for grid expansion (as long as utilities can recover the costs with a reasonable return, no further incentives are needed) from rate incentives for operations. The latter help to counter-act the current disincentive to deploying such technologies and approaches.
94

8. DOE and FERC should utilize the federal permitting authorities that exist.
9. Merchant transmission should be encouraged where gaps exist in regulated transmission planning but should not be relied upon where it is possible to utilize a regulated planning and cost allocated approach.
10. FERC and state regulators should encourage deployment of Grid-Enhancing Technologies with incentives and as part of required open access transmission service.
11. FERC should exercise greater oversight over local transmission investments that may not benefit customers, to counter-act utility incentives to add to rate base. A new staff office for transmission planning and oversight could help perform this role and support transmission planning best practices.
12. Congress should pass an investment tax credit for large-scale regional and inter-regional transmission.
13. DOE should pursue R&D on HVDC converters, to bring down the costs of long-distance power delivery. Solid state power substation converters could bring down the cost of long-distance transmission and enable more pick-up and drop-off stations for HVDC lines.280
1. Federal leadership should be provided on national transmission development at the Presidential, Secretarial, and FERC levels.
2. FERC should issue a comprehensive transmission planning rule to require forward-looking, pro-active, multi-benefit planning. It should consider multi-regional planning institutions as a way to develop reliable and efficient inter-regional plans.
3. FERC should continue and expand reliance on broad, beneficiary pays cost allocation, and ensure that grid planners consider all of the many benefits of transmission when allocating costs.
4. Congress should direct FERC to improve transmission planning, to clarify and strengthen its authority, and protect any FERC action from legal challenge.
5. Congress should consider federal funding of inter-regional connections and a macro grid. This support could take the form of tax credits, loans, and grants.
6. DOE should support large inter-regional planning analysis and stakeholder engagement.
7. FERC should require more and better use of benefit-cost analysis to ensure consumers benefit from transmission and to achieve the efficient scale of grid expansion.
RECOMMENDATIONS ON TRANSMISSION POLICY
280 U.S. Department of Energy Office of Electricity, “Solid State Power Substation Technology Roadmap” and U.S. Department of Energy Office of Electricity, “Transformer Resilience and Advanced Components Program: Vision and Framework.” U.S. Department of Energy, “Quadrennial Technology Review: An Assessment of Energy Technologies and Research Opportunities,” 77.
9594
2. Who should be responsible for resource adequacy and resource procurement generally in a way that fits with each state’s preferences and institutions? Generally this issue is up to individual states, yet most states have limited capacity to assess how the whole system fits together. How will this work in a split federal-state jurisdiction framework? States will need to assign responsibility as they choose, while FERC may need to act to ensure or certify that there is some accountable entity in each case that is able to support resource adequacy and procure power at all times needed.
3. How will very large-scale transmission be financed and paid for? Despite all of the recommendations for FERC and Congress, the nation does not have a regulatory structure in place for this need. Beginning in the New Deal era, rural areas were electrified and large amounts of remote renewable resources were developed and delivered to customers by federal agencies and what later became today’s Power Marketing Administrations. Should the nation set up a new PMA for macro grid development? Should a regulator be given authority to compel its creation by regulated private transmission utilities? Should Congress fund a macro grid as an opportunity for promoting jobs, clean energy, and resilience? Perhaps we should face up to the full challenge rather than nibble around the edges of this problem.
Reforming transmission and wholesale power markets is a very complicated exercise. Just as technologies are disrupting the sector, new approaches and innovations are being suggested and tried every day all around the world as power systems face very similar challenges. Post-mortem assessments of the recent Texas outages need to be performed and reviewed. We should not pretend to know all the answers at this time. The inquiry in this paper led to a number of recommendations summarized in the each chapter. These are not the end of the story. There are important questions for further analysis, including: 1. What is a low-cost reliable generation
portfolio for each region? Detailed modeling is now possible to understand wind and solar output by location at every hour, which will help determine what other resources are needed including transmission, storage, and firm energy sources. Having a consensus view on each region’s portfolio will also help determine product procurement and compensation. Such an evaluation should include a stress test for reliability that takes account of possible weather events in the future that may look different from the past, and interactions between the gas, power, water, and other critical infrastructure.
CHAPTER 7: UNANSWERED QUESTIONS FOR FURTHER RESEARCH
96

4. How exactly should each reliability servicebe defined in each region? We providea number of recommendations here. Thesystem will evolve and new needs will arise.The exact product design, computing powerconsiderations, incorporating advancedstatistics and monitoring, and many otherfactors will influence how centralized spotmarkets will operate.
5. How can power systems be operated notthrough direct control, but with prices,monitoring, estimation, and statistics? Gridoperators will need to develop tools to beassured of system balancing when they donot have their fingers on the buttons of allthe resources.
6. How do we operate power systems withless inertia? How much of this challengecan be solved with new technologiessuch as grid-forming inverters? Inverter-based resource penetration along with theretirement of synchronous resources raisesthe possibility that at certain times theamount of inertia may be too low. Markets orregulations may be needed to address thesesituations, along with innovative operationalpractices.
7. How do we make assessments of resourceavailability or scarcity? DOE, RTOs, and/or other entities can help study whetherpower systems are running short on short-term reliability services, longer-term firmbalancing resources, or other products.
8. What level of computational resources willbe necessary for grid operations and howshould systems be designed? Researchinto the architecture of system operationsand market operations software is needed.
9796

These cost reductions create extremely favorable economics: new renewable energy development is not only competitive with new conventional sources, it is narrowly cost-competitive with existing fossil and nuclear generation. The chart in Figure 20 from Lazard’s 2020 study of the Levelized Cost of Energy (LCOE) shows all-in costs of renewable energy on the left side with costs in the same range as marginal operating costs of conventional sources.284
Wind, solar, and battery storage growth is driven by both an increase in consumer and policy-driven demand, and dramatic cost declines over the past decade. Through manufacturing at scale and technology advancement, solar PV has seen the largest drops in cost, falling over 90 percent over the last 10 years.281 The cost of wind energy has fallen by over 70 percent over the same period, driven by manufacturing at scale and ever-increasing turbine size.282 Battery storage saw a 61 percent decrease in total installed costs in just three years between 2015 and 2017, and costs continue to fall.283
APPENDIX A:THE NEW ECONOMICS OF CLEAN ENERGY
FIGURE 20COSTS OF NEW RENEWABLES VS. EXISTING CONVENTIONAL SOURCES
281 Lazard, “Levelized Cost of Energy and Levelized Cost of Storage – 2020.”282 Ibid.283 U.S. Energy Information Administration, “Battery Storage in the United: An Update on Market,” 18.284 Lazard, “Levelized Cost of Energy and Levelized Cost of Storage – 2020.”
98
a far more favorable permitting framework for pipelines relative to electric transmission, gas relies on pipeline construction which is being challenged by grassroots organizations and various regulatory agencies. Still, natural gas plants have been constructed in all regions of the U.S. and many utilities and IPPs are proposing more, by one estimate reaching $100 billion for 235 new plants.290 The role of natural gas, whether it grows, or whether the plants merely stay online to provide power system balancing services, is a key question for utilities, states, and grid operators.
The trends above are similar all over the world, changing the global electricity resource mix.291 Solar and wind turbines have similarly low costs and nuclear and coal plants have similarly high costs on all continents, with only moderate variation based on each country’s resource base. Few countries have comparable cheap natural gas availability to the U.S. and Southeast Asia continues to build new coal generators,292 while Europe proceeds even faster with renewable energy, becoming a leader in emerging technologies such as offshore wind.293 Development of renewables and storage around the world will likely contribute to the self-reinforcing cycle of cost reductions through deployment experience and economies of scale in manufacturing.
Operating coal plants are either reaching the end of their design lives or struggling to recover their going-forward variable and operations and maintenance costs in competitive electricity markets.285 New coal plants, even with lower emissions of conventional pollutants, carry significant risk of expensive carbon regulations for investors. Carbon Capture Utilization and Storage holds some promise but as of yet appears cost-prohibitive and not yet proven. Petra Nova, the flagship carbon-capture retrofit on a Houston-area coal plant, was shut down after just over three years of operation due to poor economics.286
Natural gas commodity prices have fallen over the last decade and gas plant efficiencies have improved, making natural gas very competitive throughout the U.S. Hydraulic fracturing, both for oil and gas, has led to natural gas being more of a low-risk manufacturing process than an uncertain prospecting exercise, enabling lower cost financing of drilling operations.287 Natural gas has displaced a large amount of coal generation, which is responsible for a significant amount of carbon reductions.288 There is potential for carbon capture from natural gas plants. Going forward, gas is challenged by methane leakage in drilling and transportation, since methane is a potent greenhouse gas which reduces its overall greenhouse gas benefit, potentially significantly.289 And despite
285 BloombergNEF and the Business Council for Sustainable Energy, “2020 Sustainable Energy in America Factbook,” 21286 Wamsted and Schlissel, “Petra Nova Mothballing-Mortem: Closure of Texas Capture Plant Is a Warning.”287 U.S. Energy Information Administration, “Trends in U.S. Oil and Natural Gas Upstream Costs.”288 Jackson et al., “The Environmental Costs and Benefits of Fracking.”289 Ibid.290 Gillis and O’Boyle, “Opinion | When Will Electricity Companies Finally Quit Natural Gas?”291 International Renewable Energy Agency, Renewable Power Generation Costs in 2019.292 Cornot-Gandolphe, “The Role of Coal in Southeast’s Power Sector and Implications for Global and Regional Coal Trade.”293 International Energy Agency, “European Union 2020 – Energy Policy Review.”
9998

LCOE had fallen to an estimated $78/MWh.297 Recent offshore wind PPAs in the U.S. have been signed at prices as low as $65/MWh.298
The U.S. East Coast, particularly between Virginia and Massachusetts, is very conducive to offshore wind due to shallow waters and high wind speeds that reach over 10 meters/second.299 Offshore wind also can sell at higher value times than other wind and solar energy sources. California and Maine also offer deep-water options where floating turbines may be viable. These costs are in a range that enable coastal states that wish to secure local jobs and economic development to promote offshore wind without much incremental cost on their ratepayers, particularly where load is high, power prices are high, and opportunities for large-scale, land-based wind development is limited, as is the case in the Northeast and California.
BATTERY STORAGELithium-ion batteries have quickly become a mainstream bulk power source, driven by cost reductions of 90 percent over the last decade.300 Batteries provide a wide set of electricity system services, including energy, capacity, load-shifting, transmission, and ancillary services. Lower costs from use of such batteries in consumer products from smart phones to electric vehicles contributes to continued manufacturing efficiencies that will likely bring down costs for bulk power system batteries. BNEF projects Lithium-ion battery costs falling in half by 2030.301
WIND AND SOLARMost wind, solar, and storage development is utility scale, with capacity measured in megawatts, since there are significant economies of scale for each technology. Wind energy scale is largely driven by the need to use larger turbines to reach better winds at higher hub heights, while PV and storage scales are driven by manufacturing and labor costs. Utility-scale solar is between one-third and one-tenth the cost of roof-top solar, in levelized-cost analysis.294
Still, distributed PV and storage are growing and will likely continue grow as the cost of both have fallen as well. Distributed energy resources are popular with many consumers and sometimes benefit from favorable retail rate designs many states want to provide. Rooftop PV is particularly popular, and there are many viable roofs that do not yet have solar. However, the approximately 18 GWs of capacity available on roofs is very small relative to energy demand so its role will be much smaller than utility scale PV.295
OFFSHORE WINDOffshore wind costs have fallen dramatically in recent years. Between 2016 and 2018, the U.S. Department of Energy found the LCOE trend-line from a sample of global offshore wind studies to decrease from approximately $150/MWh to $120/MWh.296 By 2019, Bloomberg New Energy Finance (BNEF) estimated that global offshore wind
294 Lazard, “Levelized Cost of Energy and Levelized Cost of Storage – 2020.” 295 Solar Energy Industries Association, “Solar Industry Research Data.”296 Musial et al., “2018 Offshore Wind Technologies Market Report.”297 Morehouse, “Global Offshore Wind Prices Drop 32%.”298 Beiter et al., “The Vineyard Wind Purchase Agreement: Insights for Estimating Costs of U.S. Offshore Wind Projects.”299 Roberts, “Wind Resources of the United States.”300 Baker, “Electric Cars Closing In on Gas Guzzlers as Battery Costs Plunge - Bloomberg.”301 Ibid.
100
DEMAND, DEMAND RESPONSE AND OTHER EMERGING RESOURCESSignificant changes to electricity demand have emerged in recent years. Electric vehicles are growing rapidly with cheaper batteries capable of powering longer-range vehicles, and growing consumer acceptance. Electric heat pumps for building and water heating are increasingly cost competitive, creating opportunities to heat buildings even in colder climates. These trends will likely significantly increase demand for electricity significantly.
In its medium electrification case, which projects buildings and transportation electrification using only technology price forecasts and other factors without incorporating public policy, the NREL projects that transportation electrification will create nearly terawatt-hours (TWh) of new demand in 2050, around a 25 percent increase from today’s electricity demand, with building electrification more than making up for load reductions in the building sector caused by energy efficiency.302
Demand side resources are likely to become a much more active part of the electricity portfolio, and no longer function as a passive exogenous variable. When power system scarcity occurs, there are often customers willing to reduce their electricity consumption for a payment or a credit on their electricity bill that is lower cost than adding new generation capacity. Many specific uses of electricity can be shifted or reduced without harming customers’ experience. For example, residential water heaters can be warmed up at different times and the water can stay hot for many
hours. Buildings and homes can be cooled at different times while keeping air temperatures comfortable. This load flexibility or demand response can itself be considered a supply source. A study in Australia not only found significant opportunities for commercial and industrial sites to deliver load flexibility with additional infrastructure, but that there are significant existing opportunities for demand response by shifting the usage of boilers and refrigerators. The study found that if markets open to demand participation and offer price-responsive tariffs, the economics will be favorable for businesses to participate.303 Similarly, analysis of the ERCOT market found that demand response of 1,500 MW to 3,100 MW helped meet peak loads of around 75,000 MW and that integrating more demand response would serve a critical role in meeting load as the resource mix evolves.304
In addition to the known and fairly predictable trends described above, there are likely to be certain unforeseen changes. Additional new technologies will likely enter to disrupt the power sector further. For example, there is a particular need for long duration storage technology given multi-day, seasonal and even annual variability in wind and solar output. Producing green hydrogen via electrolysis powered by excess wind and solar generation can be converted into a range of liquid, gaseous, and solid fuels that can be more easily stored and transported. Electrolysis costs could fall with standardization of plant design. Investors, companies, and governments are shifting significant resources to green hydrogen, with more than 70 GW of projects under development globally, costing $250 billion by 2040.305
302 Mai et al., “Electrification Futures Study: Scenarios of Electric Technology Adoption and Power Consumption for the United States,” 60.303 Institute for Sustainable Futures and Australian Alliance for Sustainable Energy and University of Technology, Sydney, “REALM for Industry.”304 Silverstein, “Resource Adequacy in Texas: Unleashing Demand-Side Resources in the ERCOT Market,” 23.305 Paul and Obayashi, “Explainer: Why Green Hydrogen Is Finally Getting Its Day in the Sun.”
101100

102
Elaborate systems of assigning physical capacity requirements and enforcing the requirements on various entities are different in almost every region of the U.S. This appendix serves to illustrate some of that nuance. The same physical and economic issues are at work in all power systems around the world, so we show some of the European approaches as well.
U.S. APPROACHESThe allocation of resource adequacy functions varies widely across the country. Generally, the function is performed by ISOs in PJM, NY, and New England, under FERC jurisdiction, and by the states elsewhere. But there are variations. FERC has approved a wide range of structures and has resisted requests from some stakeholders to standardize and impose approaches from one region onto another. There is no NERC standard requiring enforceable resource adequacy levels or a reserve margin, only to assess resource adequacy.306 The key functions include:
1. Determination of requirements. Typically, this is an Installed Reserve Margin (IRM) that is set region-wide based on a Loss of Load Expectation (LOLE) analysis. The IRM tends to be in the range of 12-18 percent of generation capacity (MW) above peak load. Regions with more renewables are beginning to add flexibility (MW per minute change in output) requirements as well.
2. Enforcement of requirements on load. Load-Serving Entities (LSEs) are typically assigned a share of the regional IRM, subject to oversight and penalty.
3. Enforcement of requirements on generation. Generators or demand side resources that are counted towards an entity’s capacity obligation are typically required to offer the capacity and deliver when needed (“must-offer” requirements), subject to penalties.
4. Operating a market. Supply and demand are stacked into central auctions, which some regions have and some do not. Some are voluntary residual auctions, some are mandatory for all load.
5. Determination of resource credit towards meeting requirement. Generators and load sources that are used to meet obligations are given credit typically based on their historical performance, such that forced outage rates, for example, reduce the capacity value a unit is able to sell. Capacity credit for storage and variable renewables is subject to debate currently, as well as capacity value for conventional generation that may be subject to “common mode failures.” “Capacity value” (contribution to serving peak load) is not the same as “capacity factor” (annual average output as a percentage of maximum potential output).
APPENDIX B:PHYSICAL CAPACITY REQUIREMENTS AND RESPONSIBILITIES
306 NERC is only required to conduct “periodic assessments of the reliability and adequacy of the bulk-power system in North America,” Federal Power Act, 16 U.S. Code § 824o.
103102

Table 4 lists the roles for each of the seven U.S. ISO/RTOs. In many cases, there are overlapping roles for both states and the ISO/RTO. Local authorities oversee municipal and cooperative utilities. While there are often overlapping
roles, ultimately one entity is the final decision-maker. Table 4 lists the final decision-maker between government entities or the system operator (SO).
307 While MISO sets an Installed Reserve Margin based on LOLE, it can be over-ridden by a state and MISO will adopt it. MISO, “Business Practices Manual: Resource Adequacy,” 24.308 For non-CPUC regulated entities, CAISO accepts the IRM of local regulatory authorities. CAISO, “California Independent System Operator Corporation Fifth Replacement FERC Electric Tariff (Open Access Transmission Tariff),” 958-959.309 Not applicable because ERCOT does not have a reserve margin requirement. ERCOT does set a target PRM of 13.75%, but it is not a requirement. ERCOT, “Report on the Capacity, Demand and Reserves (CDR) in the ERCOT Region, 2019-2028,” 8.310 State of New York Public Service Commission, Order Adopting Installed Reserve Margin for the New York Control Area for the 2018-2019 Capability Year, CASE 07-E-0088, 6. NYISO, “Manual 4: Installed Capacity Manual.”311 NESCOE votes on the ISO-developed reserve margin. It is not clear what happens in the case of a conflict.312 California Public Utilities Commission, “2019 Filing Guide for System, Local and Flexible Resource Adequacy (RA) Compliance Filings.,” 33 313 Florio, “Sharing Power Among the Pacific States.” 314 Load Serving Entities (LSEs) can meet capacity requirements through self-supply or resources procured through bilateral contracts. Bushnell, Flagg, and Mansur, “Capacity Markets at a Crossroads,” 25.315 Load Serving Entities (LSEs) can meet capacity requirements through self-supply or resources procured through bilateral contracts. Ibid.316 Limited exemption from PJM auction under Fixed Resource Requirement. See PJM, “Reliability Assurance Agreement.”317 Bilateral transactions are allowed, see New York ISO, “Installed Capacity Manual,”157.318 The ISO defers to the CPUC and other LRAs to determine Qualifying Capacity (QC) values for all resources interconnected to the ISO system.” See CAISO, “Resource Adequacy Enhancements.”
TABLE 4ULTIMATE DECISION-MAKER FOR RESOURCE ADEQUACY FUNCTIONS(System Operator (SO) under FERC jurisdiction vs state and local entities)
MISO CAISO SPP ERCOT PJM NYISO ISO-NE
Set reqmt State&local307 SO and local308 State&local n/a309 SO State310 SO311
Enforce on load State&local State
&local312 State&local n/a SO SO SO
Enforce on gens State and SO SO313 State&local n/a SO SO SO
Central auction Yes none314 none315 none Yes316 Yes317 Yes
Resource credit State&local State
&local318 State&local n/a SO SO SO
Backstop procurem’t n/a SO n/a n/a n/a n/a n/a
104
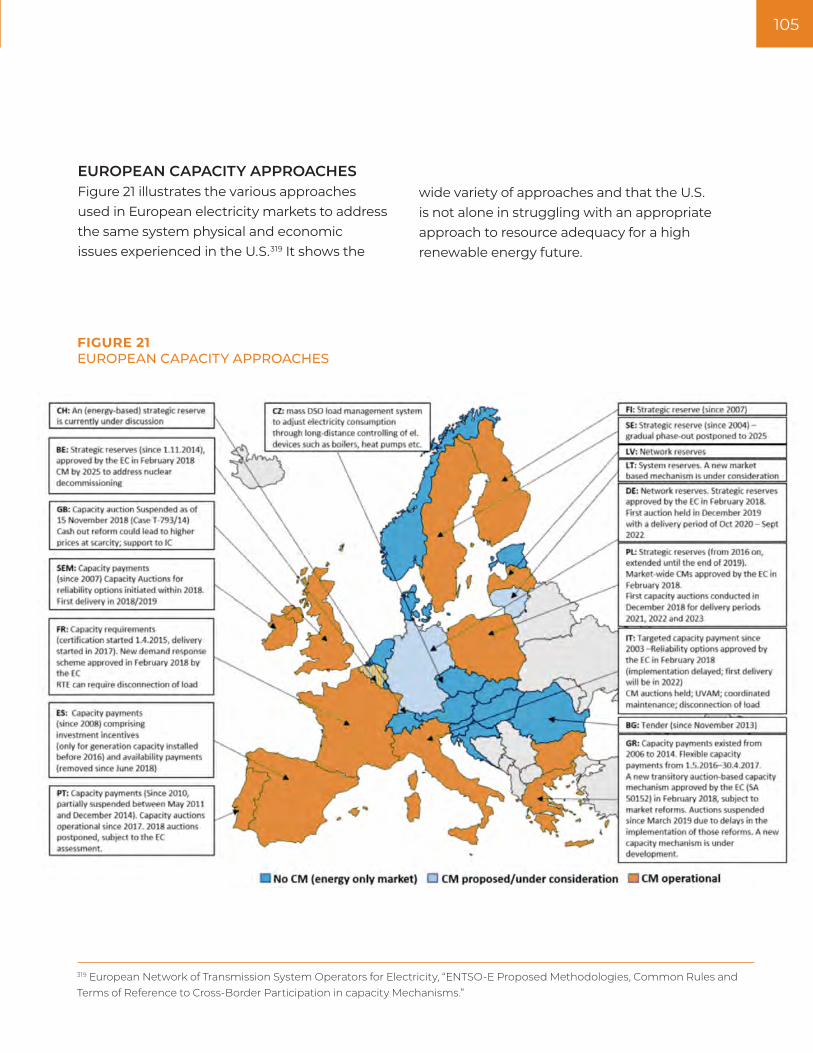
EUROPEAN CAPACITY APPROACHESFigure 21 illustrates the various approaches used in European electricity markets to address the same system physical and economic issues experienced in the U.S.319 It shows the
319 European Network of Transmission System Operators for Electricity, “ENTSO-E Proposed Methodologies, Common Rules and Terms of Reference to Cross-Border Participation in capacity Mechanisms.”
FIGURE 21EUROPEAN CAPACITY APPROACHES
wide variety of approaches and that the U.S. is not alone in struggling with an appropriate approach to resource adequacy for a high renewable energy future.
105104

Aggarwal, Sonia, Steven Corneli, Eric Gimon,
Rob Gramlich, Mike Hogan, Robbie Orvis, and
Brendan Pierpont. “Wholesale Electricity Market
Design for Rapid Decarbonization,” June 2019.
https://energyinnovation.org/wp-content/
uploads/2019/06/Wholesale-Electricity-Market-
Design-For-Rapid-Decarbonization.pdf.
Ahlstrom, Mark, Andrew Gelston, Jeffery Plew, and
Lorenzo Kristov. “Hybrid Power Plants –Flexible
Resources to Simplify Markets and Support Grid
Operations.” Working Draft, October 21, 2019. https://
www.esig.energy/wp-content/uploads/2019/10/
Hybrid-Power-Plants.pdf.
Alstone, Peter, Jennifer Potter, Mary Piette, Peter
Schwartz, Michael Berger, Laurel Dunn, Sarah
Smith, et al. “Final Report on Phase 2 Results: 2025
California Demand Response Potential Study.” LBNL,
March 1, 2017. https://www.cpuc.ca.gov/WorkArea/
DownloadAsset.aspx?id=6442452698.
American Electric Power. “Transmission Facts.”
Accessed January 11, 2021. https://web.ecs.baylor.
edu/faculty/grady/_13_EE392J_2_Spring11_AEP_
Transmission_Facts.pdf.
American Wind Energy Association. “Grid Vision:
The Electric Highway to a 21st Century Economy,”
May 2019. https://www.awea.org/Awea/media/
Resources/Publications%20and%20Reports/
White%20Papers/Grid-Vision-The-Electric-
Highway-to-a-21st-Century-Economy.pdf.
Arizu, Beatriz, William H. Dunn Jr., and Bernard
Tenenbaum. “Transmission System Operators:
Lessons From The Frontlines.” Energy & Mining
Sector Board Discussion. The World Bank,
June 2020. http://documents1.worldbank.
org/curated/en/622701468781814067/
pdf/280870Transmission0systems0EMS0no-04.pdf.
Associated Press. “Costs of Nuclear Expansion at
Georgia Power Plant Spiking,” August 1, 2020.
Astrapé Consulting. “Dispatch Effects on Storage
ELCC in PJM.” Presented at the PJM Capacity
Capability Senior Task Force, July 16, 2020. https://
www.pjm.com/-/media/committees-groups/task-
forces/ccstf/2020/20200716-workshop/20200716-
item-03-dispatch-effects-on-elcc.ashx.
Australian Energy Market Operator. “Minimum
Operational Demand Thresholds in South Australia,”
May 2020. https://www.aemo.com.au/-/media/
Files/Electricity/NEM/Planning_and_Forecasting/
SA_Advisory/2020/Minimum-Operational-Demand-
Thresholds-in-South-Australia-Review.
Ausubel, Lawrence, and Peter Cramton. “Using
Forward Markets to Improve Electricity Market
Design.” Utilities Policy 18 (May 26, 2010): 195–200.
http://www.cramton.umd.edu/papers2005-2009/
ausubel-cramton-forward-markets-in-electricity.pdf.
Averch, Harvey, and Leland Johnson. “Behavior of the
Firm Under Regulatory Constraint.” The American
Economic Review 52, no. 5 (December 1962): 1052–69.
https://www.jstor.org/stable/1812181?seq=1.
BIBLIOGRAPHY
106

Badtke-Berkow, Mina, Michael Centore, Kristina
Mohlin, and Beia Spiller. “A Primer on Time-Variant
Electricity Pricing.” Environmental Defense Fund,
2015. https://www.edf.org/sites/default/files/a_
primer_on_time-variant_pricing.pdf.
Baker, David. “Electric Cars Closing In on Gas Guzzlers
as Battery Costs Plunge - Bloomberg.” Bloomberg
Green, December 16, 2020. https://www.bloomberg.
com/news/articles/2020-12-16/electric-cars-closing-
in-on-gas-guzzlers-as-battery-costs-plunge.
Barbose, Galen. “U.S. Renewables Portfolio
Standards.” Lawrence Berkeley National Laboratory
and the U.S. Department of Energy, July 2019. https://
eta-publications.lbl.gov/sites/default/files/rps_
annual_status_update-2019_edition.pdf.
Bedir, Abdulkadir, Noel Crisotomo, Jennifer Allen,
Eric Wood, and Clément Rames. “California Plug-In
Electric Vehicle Infrastructure Projections: 2017-2025.”
Staff Report. California Energy Commission, March 16,
2018. https://efiling.energy.ca.gov/URLRedirectPage.
aspx?TN=TN222986_20180316T143039_Staff_
Report__California_PlugIn_Electric_Vehicle_
Infrastructure.pdf.
Beiter, Philipp, Paul Spitsen, Walter Musial, and Eric
Lantz. “The Vineyard Wind Purchase Agreement:
Insights for Estimating Costs of U.S. Offshore Wind
Projects.” Golden, CO: National Renewable Energy
Laboratory, February 2019. https://www.nrel.gov/
docs/fy19osti/72981.pdf.
Berghout, Niels, Machtekd van dan Broek, and Ernst
Worrell. “Synergies Between Renewable Energy and
Energy Efficiency.” Working Paper. International
Renewable Energy Agency, August 2017. https://
www.irena.org/-/media/Files/IRENA/Agency/
Publication/2017/Aug/IRENA_REmap_Synergies_
REEE_2017.pdf.
Billimoria, Farhad, and Rahmatallah Poudineh.
“Decarbonized Market Design: An Insurance
Overlay on Energy-Only Electricity Markets.” Oxford
Institute for Energy Studies, October 2018. https://
www.oxfordenergy.org/wpcms/wp-content/
uploads/2018/10/Decarbonized-Market-Design-
An-Insurance-Overlay-on-Energy-Only-Electricity-
Markets-EL-30.pdf.
Bird, Lori, Jaquelin Cochran, and Xi Wang. “Wind and
Solar Energy Curtailment: Experience and Practices
in the United States.” National Renewable Energy
Lab. (NREL), Golden, CO (United States), March 1, 2014.
https://doi.org/https://doi.org/10.2172/1126842.
Bloom, Aaron, Josh Novacheck, Greg Brinkman,
James McCalley, Armando Figueroa-Acevedo, Ali
Jahanbani-Arakani, Hussam Nosair, et al. “The Value
of Increased HVDC Capacity Between Eastern and
Western U.S. Grids: The Interconnections Seam
Study.” Preprint. Golden, CO: NREL, October 2020.
https://www.nrel.gov/docs/fy21osti/76850.pdf.
BloombergNEF and the Business Council for
Sustainable Energy. “2020 Sustainable Energy in
America Factbook.” Business Council for Sustainable
Energy, February 13, 2020. https://bcse.org/factbook/.
Bonbright, James, Albert Danielsen, and David
Kamerschen. Principles of Public Utility Rates. 2nd ed.
Arlington, VA: Public Utilities Reports Inc., 1988.
107106
Borenstein, Severin. “The Long-Run Efficiency of
Real-Time Electricity Pricing.” The Energy Journal,
no. 3 (2005): 93–116. http://faculty.haas.berkeley.edu/
borenste/download/EnJo05RTPsim.pdf.
Borenstein, Severin, and James Bushnell.
“The US Electricity Industry After 20 Years of
Restructuring.” Annual Review of Economics 7, no.
1 (2015): 437–63. https://doi.org/10.1146/annurev-
economics-080614-115630.
Botkin, Shelly. “About the Operating Reserve
Demand Curve and Wholesale Electric Prices.”
Electric Reliability Council of Texas, May 2014. https://
hepg.hks.harvard.edu/files/hepg/files/ordcupdate-
final.pdf.
Bradbury, Simon. “Implications of Intermittency.”
In IEEE, 1–8, 2009. https://ieeexplore.ieee.org/
document/5371165.
Brattle Group and REBA Institute. “Renewable
Energy Policy Pathways Report.” REBA Institute,
Brattle Group, n.d. https://reba-institute.org/
research/#:~:text=The%20Renewable%20
Energy%20Policy%20Pathways,energy%20
procurement%20across%20the%20U.S.
Brown, Nick. Powering America: A Review of
the Operation and Effectiveness of the Nation’s
Wholesale Electricity Markets. Accessed January
6, 2021. https://energycommerce.house.gov/
sites/democrats.energycommerce.house.gov/
files/documents/Testimony-Brown-EP-Hrg-on-
Powering-America-A-Review-of-the-Operation-
and-Effective.pdf.
Brown, Patrick R., and Audun Botterud. “The Value
of Inter-Regional Coordination and Transmission
in Decarbonizing the US Electricity System.”
Joule, December 11, 2020. https://doi.org/10.1016/j.
joule.2020.11.013.
Burgess, Ed. Twitter. Accessed January 7, 2021. https://
twitter.com/eburgess/status/1295119915121221636.
Bushnell, James, Michaela Flagg, and Erin Mansur.
“Capacity Markets at a Crossroads.” Berkeley,
California: Energy Institute at Haas, April 2017.
https://hepg.hks.harvard.edu/files/hepg/files/
wp278updated.pdf.
CAISO. “2011-2012 Transmission Plan,” March 14, 2012.
http://www.caiso.com/Documents/Decision_2011-
12TransmissionPlan-Plan-MAR2012.pdf.
———. “California Independent System Operator
Corporation Fifth Replacement FERC Electric Tariff
(Open Access Transmission Tariff),” November
15, 2018. http://www.caiso.com/Documents/
ConformedTariff-asof-Nov15-2018.pdf.
———. “Draft Flexible Capacity Needs Assessment
for 2020,” April 4, 2019. https://www.caiso.com/
———. “Initiative: Flexible Ramping Product
Refinements,” November 21, 2019. https://
stakeholdercenter.caiso.com/StakeholderInitiatives/
Flexible-ramping-product-refinements.
———. “Resource Adequacy Enhancements.”
Issue Paper, October 22, 2018. http://
www.caiso.com/Documents/IssuePaper-
ResourceAdequacyEnhancements.pdf.
108
———. “Transmission Planning for a Reliable,
Economic and Open Grid.” Accessed January 8,
2021. http://www.caiso.com/planning/Pages/
TransmissionPlanning/Default.aspx.
CAISO, CPUC, and CEC. “Preliminary Root Cause
Analysis: Mid-August 2020 Heat Storm,” October
6, 2020. http://www.caiso.com/Documents/
Preliminary-Root-Cause-Analysis-Rotating-
Outages-August-2020.pdf.
California Public Utilities Commission. “33% RPS
Procurement Rules.” California Public Utilities
Commission. Accessed January 8, 2021. https://www.
cpuc.ca.gov/rps_procurement_rules_33/.
———. “2019 Filing Guide for System, Local and
Flexible Resource Adequacy (RA) Compliance
Filings.” California Public Utilities Commission,
October 2018. http://www.cpuc.ca.gov/WorkArea/
DownloadAsset.aspx?id=6442459140.
———. “Resource Adequacy Compliance Materials.”
Accessed January 8, 2021. https://www.cpuc.ca.gov/
General.aspx?id=6311.
California Public Utilities Commission’s Working
Group on Load Shift. “Final Report of the California
Public Utilities Commission’s Working Group on Load
Shift,” January 31, 2019. https://gridworks.org/wp-
content/uploads/2019/01/LoadShiftWorkingGroup_
report_final.pdf.
Campos do Prado, Josue, Wei Qiao, Liyan Qu, and
Julio Agüerro. “The Next-Generation Retail Electricity
Market in the Context of Distributed Energy
Resources: Vision and Integrating Framework.”
Energies 12, no. 3 (February 3, 2019): 491. https://doi.
org/10.3390/en12030491.
Carden, Kevin. “Valuing Capacity for Resources
with Energy Limitations –Preliminary Independent
Assessment.” January 8, 2019. https://www.nyiso.
com/documents/20142/4358080/Astrape%20
presentation%208Jan2019.pdf/2b747067-531e-
e869-a287-ff58730e2ec4.
Carden, Kevin, Nick Wintermantel, and Alex
Krasny. “Capacity Value of Energy Storage in PJM.”
Astrapé Consulting, July 2019. www.astrape.
com/?ddownload=9124, http://www.astrape.
com/?ddownload=9121.
———. “Load Shape Development and Energy
Limited Resource Capacity Valuation.” Astrapé
Consulting, March 18, 2019. www.astrape.
com/?ddownload=9121.
Carr, Lauren, Gabe Murtaugh, Jill Powers, and Bridget
Sparks. “Energy Storage and Distributed Energy
Resources Phase 4: Final Proposal.” Final Proposal.
CAISO, August 21, 2020. http://www.caiso.com/
InitiativeDocuments/FinalProposal-EnergyStorage-
DistributedEnergyResourcesPhase4.pdf.
Casey, Keith. “Briefing on 2010 Transmission Plan.”
Presented at the Board Governors Meeting, March 25,
2010. https://caiso.com/Documents/100325Briefing
on2010TransmissionPlan-Presentation.pdf.
Caspary, Jay, Michael Goggin, Rob Gramlich, and
Jesse Schneider. “Disconnected: The Need for a New
Generator Interconnection Policy.” Grid Strategies
LLC, 2021. https://gridstrategiesllc.com/articles-2/.
Chang, Judy, Johannes Pfeifenberger, and John
Tsoukalis. “Potential Benefits of a Regional Power
Market to North Carolina’s Electricity Customers.”
Brattle Group, April 2019. https://brattlefiles.blob.
core.windows.net/files/16092_nc_wholesale_
power_market_whitepaper_april_2019_final.pdf.
109108
Childs, Erin, Maria Roumpani, Sergio Dueñas,
Pedro Sanchez, Jennifer Gorman, Melanie
Davidson, and Lily Backer. “Long Duration Energy
Storage for California’s Clean, Reliable Grid.”
Strategen, 2020. https://static1.squarespace.com/
static/5b96538250a54f9cd7751faa/t/5fcf9815caa95
a391e73d053/1607440419530/LDES_CA_12.08.2020.
pdf.
Cicala, Steve. “Imperfect Markets versus Imperfect
Regulation in U.S. Electricity Generation.” National
Bureau of Economic Research, January 16, 2017.
https://doi.org/10.3386/w23053.
Clack, Christopher. “Modernizing Minnesota’s Grid: An
Economic Analysis of Energy Storage Opportunities
MISO-Wide Electricity Co-Optimized Planning
Scenarios.” July 11, 2017. http://energytransition.umn.
edu/wp-content/uploads/2017/07/EDITED-VCE-
Slides-7.11.17.pdf.
Clack, Christopher, Aditya Choukulkar, Brianna Coté,
and Sarah McKee. “Why Local Solar For All Costs
Less: A New Roadmap for the Lowest Cost Grid.”
Vibrant Clean Energy, December 1, 2020. https://
www.vibrantcleanenergy.com/wp-content/
uploads/2020/12/WhyDERs_TR_Final.pdf.
Clack, Christopher, Aditya Choululkar, and Sarah
McKee. “Energy Imbalance Market Options for
Colorado.” Vibrant Clean Energy, October 22, 2020.
https://www.vibrantcleanenergy.com/wp-content/
uploads/2020/10/CO-EIM-Options-Report.pdf.
Clack, Christopher, Michael Goggin, Aditya
Choukulkar, and Sarah McKee. “Consumer,
Employment, and Environmental Benefits of
Electricity Transmission Expansion in the Eastern
U.S.,” October 2020. https://cleanenergygrid.org/wp-
content/uploads/2020/10/Consumer-Employment-
and-Environmental-Benefits-of-Transmission-
Expansion-in-the-Eastern-U.S..pdf.
Clark, Tony. “Everything Old Is New Again: Why Big
Tech Is Wrong About Utility Restructuring.” Utility
Dive, November 17, 2020. https://www.utilitydive.
com/news/everything-old-is-new-again-why-big-
tech-is-wrong-about-utility-restructur/589169/.
Cleary, Kathryne, and Karen Palmer. “US Electricity
Markets 101.” Explainer. Resources for the Future,
March 3, 2020. https://media.rff.org/documents/
US_Electricity_Markets_101.pdf.
———. “US Electricity Markets 101,” March 3, 2020.
Coalition of MISO Transmission Customers, Industrial
Energy Consumers of America, and LS Power
Midcontinent, LLC. Section 206 Complaint and
Request for Fast Track Processing, No. EL20 (January
21, 2020).
Cochran, J, M Miller, O Zinaman, M Milligan, D Arent, B
Palmintier, M O’Malley, et al. “Flexibility in 21st Century
Power Systems.” Technical Report. Golden, CO: NREL,
May 1, 2014. https://www.osti.gov/biblio/1130630.
Congressional Budget Office. “Causes and Lessons
of the California Electricity Crisis.” Congress of the
United States, September 2001. https://www.cbo.
gov/sites/default/files/107th-congress-2001-2002/
reports/californiaenergy.pdf.
Cooke, A, J Twitchell, and R O’Neil. “Energy Storage in
Integrated Resource Plans.” PNNL, April 2019. https://
epe.pnnl.gov/pdfs/Energy_Storage_in_Integrated_
Resource_Plans_PNNL-28627.pdf.
Cornejo, Antonio, and Ramteen Sioshansi.
“Rethinking Restructured Electricity Market Design:
Lessons Learned and Future Needs.” Electrical Power
and Energy Systems 98 (June 2018): 520–30. https://
doi.org/10.1016/j.ijepes.2017.12.014.
110
Corneli, Steven, Eric Gimon, and Brendan Pierpont.
“Wholesale Electricity Market Design for Rapid
Decarbonization: Long-Term Markets, Working
With Short-Term Energy Markets,” June 2019.
https://energyinnovation.org/wp-content/
uploads/2019/06/Wholesale-Electricity-Market-
Design-For-Rapid-Decarbonization-Long-Term-
Markets-Working-WIth-Short-Term-Energy-
Markets.pdf.
Cornot-Gandolphe, Sylvie. “The Role of Coal in
Southeast’s Power Sector and Implications for
Global and Regional Coal Trade.” The Oxford
Institute for Energy Studies, December 2016. https://
www.oxfordenergy.org/wpcms/wp-content/
uploads/2016/12/The-role-of-coal-in-Southeast-Asias-
power-sector-CL-4.pdf.
Dance, Scott. “More Utility Competition Was
Supposed to Drive Down Prices, but Many
Marylanders Are Paying More for Energy.” Baltimore
Sun. Accessed January 11, 2021. https://www.
baltimoresun.com/business/bs-md-energy-
deregulation-20181205-story.html.
Daniel, Joseph. “The Coal Bailout Nobody Is Talking
About.” Union of Concerned Scientists, September
24, 2018. https://blog.ucsusa.org/joseph-daniel/the-
coal-bailout-nobody-is-talking-about.
Database of State Incentives for Renewables
& Efficiency. “Renewable & Clean Energy
Standards.” Database of State Incentives for
Renewables & Efficiency, September 2020. https://
s3.amazonaws.com/ncsolarcen-prod/wp-content/
uploads/2020/09/RPS-CES-Sept2020.pdf.
Denholm, Paul, Trieu Mai, Rick Wallace Kenyon, Ben
Kroposki, and Mark O’Malley. “Inertia and the Power
Grid: A Guide Without the Spin.” Golden, CO: National
Renewable Energy Laboratory, May 2020. https://
www.nrel.gov/docs/fy20osti/73856.pdf.
Denholm, Paul, Jacob Nunemaker, Pieter Gagnon,
and Wesley Cole. “The Potential for Battery Energy
Storage to Provide Peaking Capacity in the United
States.” Technical Report. Golden, CO: NREL, June
2019. https://www.nrel.gov/docs/fy19osti/74184.pdf.
Desrosiers, Erik. “Competitive Electricity Retailing:
Why Restructuring Must Go On.” Utility Dive,
July 11, 2017. https://www.utilitydive.com/news/
competitive-electricity-retailing-why-restructuring-
must-go-on/446830/.
Duke Energy. “Competitive Process Yields Carolinas’
Biggest One-Day Collection of Solar Projects Ever;
Significant Savings for Duke Energy Customers,” April
17, 2019. https://news.duke-energy.com/releases/
competitive-process-yields-carolinas-biggest-one-
day-collection-of-solar-projects-ever-significant-
savings-for-duke-energy-customers.
Eastern Interconnection Planning Collaborative.
“Phase 2 Report: Interregional Transmission
Development and Analysis for Three Stakeholder
Selected Scenarios and Gas-Electric System
Interface Study.” DOE Award Project, July
2, 2015. https://static1.squarespace.com/
static/5b1032e545776e01e7058845/t/5cb3737ce5e5
f08d01401d8a/1555264382925/01+Phase+II.pdf.
———. “Phase 2 Report: Interregional Transmission
Development and Analysis for Three Stakeholder
Selected Scenarios and Gas-Electric System
Interface Study.” Volume 2 Sections 1-7, July
2, 2015. https://static1.squarespace.com/
static/5b1032e545776e01e7058845/t/5cb37389c830
257d563c0034/1555264398511/02+Phase+II.pdf.
Ela, E, M Milligan, P Meibom, R Barth, and A Tuphy.
“Advanced Unit Commitment Strategies for the
U.S. Eastern Interconnection.” Conference Paper.
NREL, October 2010. https://www.nrel.gov/docs/
fy11osti/49106.pdf.
111110

Ela, Erik. “Advanced Unit Commitment With
High Penetrations of Variable Generation.” FERC
Conference on Unit Commitment Software, June 3,
2010. https://cms.ferc.gov/sites/default/files/2020-
05/20100530130334-Ela%2C%2520NREL.pdf.
Ela, Erik, Vahan Gevorgian, Aidan Tuphy, Brendan
Kirby, Michael Milligan, and Mark O’Malley. “Market
Designs for the Primary Frequency Response
Ancillary Service—Part I: Motivation and Design.”
IEEE Transactions on Power Systems 29, no. 1
(June 20, 2013): 421–31. https://doi.org/10.1109/
TPWRS.2013.2264942.
Ela, J, V Gevorgian, P Fleming, Y Zhang, M Singh, E
Muljadi, A Scholbrook, et al. “Active Power Controls
From Wind Power: Bridging the Gaps.” Technical
Report. Golden, CO: NREL, January 2014. https://
www.nrel.gov/docs/fy14osti/60574.pdf.
Electric Power Research Institute. “Ancillary Services
in the United States: Technical Requirements,
Market Designs and Price Trends.” Technical
Update, June 2019. https://www.epri.com/research/
products/000000003002015670.
———. Post-Technical Conference Comments on
participation of distributed energy resource (DER)
aggregations in Regional Transmission Organization
and Independent System Operator Markets–
Comments on Panels 1, 6, and 7, No. RM18-9– 000
(June 29, 2018).
Electricity Consumers Resource Council. “Profiles
on Electricity Issues: Competitive Bidding.” Position
Paper, April 1, 1990. https://elcon.org/profiles-
electricity-issues-competitive-bidding-electricity-
consumers-resource-council-no-13/.
Energy and Environmental Economics. “Investigating
the Economic Value of Flexible Solar Power Plant
Operation,” October 2018. https://www.ethree.com/
wp-content/uploads/2018/10/Investigating-the-
Economic-Value-of-Flexible-Solar-Power-Plant-
Operation.pdf.
Energy and Environmental Economics, Inc. “Study
of Policies to Decarbonize Electric Sector in the
Northwest I Public Generating Pool, 2017 – Present.”
Accessed January 5, 2021. https://www.ethree.
com/projects/study-policies-decarbonize-electric-
sector-northwest-public-generating-pool-2017-
present/.
ERCOT. “Report on the Capacity, Demand
and Reserves (CDR) in the ERCOT Region,
2019-2028,” December 4, 2018. http://www.
ercot.com/content/wcm/lists/143977/
CapacityDemandandReservesReport-Dec2018.pdf.
ERCOT Future Ancillary Service Team. “Primary
Frequency Response (PFR)/Fast Frequency
Response(FFR) Assessment.” Presented at the
ERCOT FAST Workshop, March 28, 2014. http://
www.ercot.com/content/meetings/fast/
keydocs/2014/0328/PFR_FFR%20Assessment_
FASTworkshop_03282014.pdf.
ERCOT Staff. “Future Ancillary Service Team (FAST)
and Technical Advisory Committee (TAC) Workshop
#2.” August 25, 2014. www.ercot.com/content/
meetings/fast/keydocs/2014/0825/FAST-TAC%20
8-25-14%20Workshop.ppt.
112
European Network of Transmission System
Operators for Electricity. “ENTSO-E Proposed
Methodologies, Common Rules and Terms
of Reference to Cross-Border Participation in
capacity Mechanisms.” European Network of
Transmission System Operators for Electricity,
January 2020. https://consultations.entsoe.
eu/markets/proposal-for-cross-border-
participation-in-capacit/supporting_documents/
ENTSOE%20Explanatory%20document%20
related%20to%20the%20proposal%20for%20
crossborder%20participation%20in%20
capacity%20mechanisms%20%20for%20public%20
consultation.pdf.
Fabricators & Manufacturers Association,
International, n.d. http://image.sustainablemfr.
com/a/sage-supplier-wind-power-transmission-
provides-manufacturing-opportunities-cost-
voltage-wind-powerjpg.jpg.
Faruqui, Ahmad, and Cecile Bourbonnais. “The Tariffs
of Tomorrow: Innovations in Rate Designs.” IEEE
Power and Energy Magazine 18, no. 3 (June 2020):
18–25. https://doi.org/10.1109/MPE.2020.2972136.
Federal Energy Regulatory Commission. Frequency
Regulation Compensation in the Organized
Wholesale Power Markets, No. RM11-7– 000 and
AD10-11– 000 (October 20, 2011).
———. Order Conditionally Accepting Proposed Tariff
Revisions to Implement Energy Imbalance Market,
No. ER14-1386 (June 19, 2014).
———. “Order No. 1000 Transmission Planning
Regions.” Accessed January 8, 2021. https://www.
ferc.gov/sites/default/files/industries/electric/indus-
act/trans-plan/trans-plan-map.pdf.
———. “Policy Statement Regarding Regional
Transmission Groups; Policy Statement.” Federal
Register 58, no. 149 (August 5, 1993): 41626–33. https://
s3.amazonaws.com/archives.federalregister.gov/
issue_slice/1993/8/5/41621-41634.pdf#page=6.
———. Preventing Undue Discrimination and
Preference in Transmission Service, No. RM05-17– 000
and RM05-25– 000 (February 16, 2007).
———. Promoting Wholesale Competition Through
Open Access Non-discriminatory Transmission
Services by Public Utilities; Recovery of Stranded
Costs by Public Utilities and Transmitting Utilities, No.
RM95-8– 000 (April 24, 1996).
———. Reactive Power Requirements for Non-
Synchronous Generation, No. RM16-1– 000 (June 16,
2016).
———. Regional Transmission Organizations, No.
RM99-2– 000 (December 20, 1999).
———. Transmission Planning and Cost Allocation by
Transmission Owning and Operating Public Utilities,
No. RM10-23– 000 (July 21, 2011).
———. Settlement Intervals and Shortage Pricing
in Markets Operated by Regional Transmission
Organizations and Independent System Operators,
No. RM15-24 (June 16, 2016).
Florio, Mike. “Sharing Power Among the Pacific
States.” Gridworks, January 2018. https://gridworks.
org/wp-content/uploads/2018/01/Gridworks_
ResourceAdequacy_online.pdf.
Fox-Penner, Peter. Power After Carbon. Harvard
University Press, 2020. https://www.hup.harvard.
edu/catalog.php?isbn=9780674241077.
113112

Frayer, Julia, Sheila Keane, and Jimmy Ng.
“Estimating the Value of Lost Load.” London
Economics International LLC, June 17, 2013. https://
docplayer.net/20890232-Estimating-the-value-of-
lost-load.html.
Frew, Bethany. “Beyond Capacity Adequacy,”
September 5, 2018. https://www.esig.energy/
beyond-capacity-adequacy/.
FTI Consulting. “Resource Adequacy Mechanisms in
the National Electricity Market,” July 16, 2020. https://
www.fticonsulting.com/~/media/Files/emea--files/
insights/reports/2020/sept/resource-adequacy-
mechanisms-national-electricity-market.pdf.
Future Power Markets Forum. “Central Procurement
Structures for Energy, Capacity, and Environmental
Products.” Accessed January 11, 2021. https://
powermarkets.org/topics/central-procurement/.
———. “Reliable, Efficient, and Low-Carbon Resource
Portfolios.” Accessed January 5, 2021. https://
powermarkets.org/topics/resource-portfolios/.
GE Energy. “Western Wind and Solar Integration
Study: Executive Summary.” Subcontract Report, May
2010. https://www.nrel.gov/docs/fy10osti/47781.pdf.
Gillis, Justin, and Michael O’Boyle. “Opinion | When
Will Electricity Companies Finally Quit Natural
Gas?” The New York Times, November 12, 2020, sec.
Opinion. https://www.nytimes.com/2020/11/12/
opinion/solar-wind-natural-gas-climate-change.
html.
Gimon, Eric. “Let’s Get Organized! Long-Term
Market Design for a High Penetration Grid.” Energy
Innovation, LLC, December 2020. https://files.wri.
org/s3fs-public/gimon-lets-get-organized-long-
term-market-design-for-a-high-penetration-grid.
pdf?X4nQ7AI.bUNpEsP9KlGgk5ttAD2MiUeU.
Gimon, Eric, Mike O’Boyle, Taylor McNair, Christopher
Clack, Aditya Choukulkar, Brianna Cote, and Sarah
McKee. “Economic and Clean Energy Benefits
of Establishing a Southeast U.S. Competitive
Wholesale Electricity Market.” Energy Innovation,
August 2020. https://energyinnovation.org/
publication/economic-and-clean-energy-benefits-
of-establishing-a-southeast-u-s-competitive-
wholesale-electricity-market/.
Glazer, Craig, Jay Morrison, Paul Breakman, Alison
Clements, Lisa Schwartz, and Robert Mork. “The
Future of Centrally Organized Wholesale Markets.”
Lawrence Berkeley National Lab, March 2017. https://
gmlc.doe.gov/sites/default/files/resources/7%20
feur%20lbnl-1007226.pdf.
Goggin, Michael, and Rob Gramlich. “A Moving
Target: An Update on the Consumer Impacts of FERC
Interference with State Policies in the PJM Region,”
May 2020. https://gridprogress.files.wordpress.
com/2020/05/a-moving-target-paper.pdf.
Goggin, Michael, Rob Gramlich, Steven Shparber,
and Alison Silverstein. “Customer Focused and Clean:
Power Markets for the Future.” Wind Solar Alliance,
November 2018. https://windsolaralliance.org/wp-
content/uploads/2018/11/WSA_Market_Reform_
report_online.pdf.
Gold, Rachel, Amanda Myers, Michael O’Boyle, and
Grace Relf. “Performance Incentive Mechanisms
for Strategic Demand Reduction,” February 2020.
https://energyinnovation.org/wp-content/
uploads/2020/02/Performance-Incentive-
Mechanisms-for-Strategic-Demand-Reduction.pdf.
Gold, Russell. Superpower: One Man’s Quest to
Transform American Energy. Simon & Schuster,
2020. https://www.simonandschuster.com/books/
Superpower/Russell-Gold/9781501163593.
114
Goldenburg, Cara, Mark Dyson, and Harry Masters.
“Demand Flexibility: The Key to Enabling a Low-
Cost, Low-Carbon Grid.” Insight Brief. Rocky
Mountain Institute, February 2018. https://rmi.
org/wp-content/uploads/2018/02/Insight_Brief_
Demand_Flexibility_2018.pdf.
Gorman, Will, Andrew Mills, and Ryan Wiser.
“Improving Estimates of Transmission Capital
Costs for Utility-Scale Wind and Solar Projects to
Inform Renewable Energy Policy.” Energy Policy
135 (December 2019). https://doi.org/10.1016/j.
enpol.2019.110994.
Gramlich, Rob, and Michael Goggin. “Too Much
of the Wrong Thing: The Need for Capacity
Market Replacement or Reform.” Grid Strategies
LLC, November 2019. https://gridprogress.files.
wordpress.com/2019/11/too-much-of-the-wrong-
thing-the-need-for-capacity-market-replacement-
or-reform.pdf.
Gramlich, Rob, Michael Goggin, and Jason Burwen.
“Enabling Versatility: Allowing Hybrid Resources to
Deliver Their Full Value to Customers.” Grid Strategies
LLC and Energy Storage Association, September 2019.
https://gridprogress.files.wordpress.com/2019/09/
enabling-versatility-allowing-hybrid-resources-to-
deliver-their-full-value-to-customers.pdf.
Gramlich, Rob, and Michael Hogan. “Wholesale
Electricity Market Design for Rapid Decarbonization:
A Decentralized Markets Approach,” June 2019.
https://gridprogress.files.wordpress.com/2019/06/
wholesale-electricity-market-design-for-rapid-
decarbonization-a-decentralized-markets-
approach.pdf.
Gramlich, Rob, and Frank Lacey. “Who’s the Buyer?
Retail Electric Market Structure Reforms in Support of
Resource Adequacy and Clean Energy Deployment,”
March 2020. https://gridprogress.files.wordpress.
com/2020/03/whos-the-buyer.pdf.
Gramlich, Robert. “The Role of Regulation
in Addressing Generation Market Power.”
Environmental & Energy & Law & Policy Journal 1,
no. 1 (March 31, 2006). https://gridprogress.files.
wordpress.com/2019/07/the-role-of-energy-
regulation-in-addressing-generation-market-
power.pdf.
Greenblatt, Alan. “South Carolina Spent $9 Billion
on Nuclear Reactors That Will Never Run. Now
What?” Governing the Future of States and Localities,
January 2018. https://www.governing.com/archive/
gov-south-carolina-nuclear-reactors.html.
GridLab, and ESIG. “10 Things You Should Know
about Grid-Forming Inverters.” GridLab. Accessed
January 6, 2021. https://gridlab.org/wp-content/
uploads/2020/04/GridLabESIG_10-things-about-
GFM-Inverters.pdf.
Grubb, Michael, and David Newbery. “UK Electricity
Market Reform and the Energy Transition: Emerging
Lessons.” Cambridge Working Paper in Economics.
University of Cambridge Energy Policy Research
Group, April 13, 2018. https://www.eprg.group.cam.
ac.uk/wp-content/uploads/2018/06/1817-Text.pdf.
Haaland, Debra. H.R.5511 - Interregional Transmission
Planning Improvement Act of 2019, Pub. L. No.
H.R.5511, § 212 (2019). https://www.congress.gov/
bill/116th-congress/house-bill/5511/.
115114
Hale, Elaine, Brady Stoll, and Trieu Mai. “Capturing the
Impact of Storage and Other Flexible Technologies
on Electric System Planning.” Technical Report.
Golden, CO: NREL, May 2016. https://www.nrel.gov/
docs/fy16osti/65726.pdf.
Hartman, Devin. “Enhancing Market Signals
for Electric Resource Adequacy.” Policy
Study. R Street Institute, December 2017.
http://2o9ub0417chl2lg6m43em6psi2i.wpengine.
netdna-cdn.com/wp-content/uploads/2017/12/
Final-123.pdf.
———. “Traditionally Regulated vs. Competitive
Wholesale Markets.” R Street Institute, August
18, 2016. https://www.rstreet.org/2016/08/18/
traditionally-regulated-vs-competitive-wholesale-
markets/.
Heinrich, Martin. S.3109 - Interregional Transmission
Planning Improvement Act of 2019, Pub. L. No.
S.3109. Accessed January 8, 2021. https://www.
congress.gov/bill/116th-congress/senate-bill/3109/
all-info?r=1&s=1.
Hoff, Thomas, and Richard Perez. “PV Power
Output Variability: Calculation of Correlation
Coefficients Using Satellite Insolation Data,”
February 2012. https://www.cleanpower.
com/wp-content/uploads/2012/02/072_
PVPowerOutputVariabilityCoefficients.pdf.
Hogan, Michael, and Meg Gottstein. “What Lies
‘Beyond Capacity Markets’? Delivering Least-Cost
Reliability Under the New Resource Paradigm.”
“Straw Man” Proposal. RAP, August 14, 2012. https://
www.raponline.org/wp-content/uploads/2016/05/
rap-hogan-whatliesbeyondcapacitymarkets-2012-
aug-14.pdf.
Hogan, William. “Electricity Market Design
and the Green Agenda.” Presented at the 41st
IAEE International Conference, Groningen, the
Netherlands, June 12, 2018. http://iaee2018.com/wp-
content/uploads/2018/09/P2Hogan2018ppt.pdf.
———. “Transmission Investment Beneficiaries and
Cost Allocation: New Zealand Electricity Authority
Proposal.” Harvard University, February 1, 2020.
https://scholar.harvard.edu/files/whogan/files/
hogan_ea_report_020120.pdf.
Hull, Sanderson, Arne Olson, Charlie Duff, Mengyao
Yuan, Patrick O’Neill, and Joe Hooker. “Least Cost
Carbon Reduction Policies in PJM.” Energy and
Environmental Economics, October 28, 2020. https://
epsa.org/wp-content/uploads/2020/10/E3-Least_
Cost_Carbon_Reduction_Policies_in_PJM-FINAL.
pdf.
Hurley, Doug, Paul Peterson, and Melissa
Whited. “Demand Response as a Power System
Resource: Program Designs, Performance, and
Lessons Learned in the United States.” Synapse
Energy Economics, Inc., May 2013. https://
www.synapse-energy.com/sites/default/files/
SynapseReport.2013-03.RAP_.US-Demand-
Response.12-080.pdf.
Ibanez, Eduardo, and Michael Milligan. “Comparing
Resource Adequacy Metrics.” Conference Paper.
Golden, CO, September 2014. https://www.nrel.gov/
docs/fy14osti/62847.pdf.
Institute for Sustainable Futures, Australian
Alliance for Sustainable Energy and University of
Technology, Sydney. “REALM for Industry.” Institute
for Sustainable Futures and Australian Alliance for
Sustainable Energy and University of Technology,
Sydney. Accessed January 7, 2020. https://arena.gov.
au/assets/2018/10/REALM-Industry-Report_public_
FINAL.pdf.
116
Intercontinental Exchange. “PJM Tri Qualified
Renewable Energy Certificate Class I Future.”
Accessed January 11, 2021. https://www.theice.com/
products/65898904/PJM-Tri-Qualified-Renewable-
Energy-Certificate-Class-I-Future.
International Energy Agency. “European Union 2020
– Energy Policy Review.” International Energy Agency,
June 2020. https://www.iea.org/reports/european-
union-2020.
———. “Introduction to System Integration of
Renewables.” IEA. Accessed January 8, 2021. https://
www.iea.org/reports/introduction-to-system-
integration-of-renewables.
———. “World Energy Investment 2019,” May 14,
2019. https://webstore.iea.org/world-energy-
investment-2019.
International Renewable Energy Agency. Renewable
Power Generation Costs in 2019. International
Renewable Energy Agency, 2020. /publications/2020/
Jun/Renewable-Power-Costs-in-2019.
International Renewable Energy Agency, and Clean
Energy Ministerial. “Renewable Energy Auctions:
A Guide to Design,” 2015. https://www.irena.org/-/
media/Files/IRENA/Agency/Publication/2015/Jun/
IRENA_Renewable_Energy_Auctions_A_Guide_to_
Design_2015.pdf.
ISO-NE. “Transmission.” Accessed January 8,
2021. https://www.iso-ne.com/about/key-stats/
transmission/.
Jackson, Robert B., Avner Vengosh, J. William
Carey, Richard J. Davies, Thomas H. Darrah,
Francis O’Sullivan, and Gabrielle Pétron. “The
Environmental Costs and Benefits of Fracking.”
Annual Review of Environment and Resources 39,
no. 1 (2014): 327–62. https://doi.org/10.1146/annurev-
environ-031113-144051.
Jacobson, Mark Z., and Vijaysinh Jadhav. “World
Estimates of PV Optimal Tilt Angles and Ratios
of Sunlight Incident upon Tilted and Tracked PV
Panels Relative to Horizontal Panels.” Solar Energy
169 (July 15, 2018): 55–66. https://doi.org/10.1016/j.
solener.2018.04.030.
Jimison, John, and Bill White. “Transmission Policy:
Planning for and Investing in Wires,” September
2019. https://americaspowerplan.com/wp-content/
uploads/2013/09/APP-TRANSMISSION-PAPER.pdf.
Joskow, Paul. Comments of Professor Paul L. Joskow,
No. RM99-2 (August 16, 1999).
———. “Hybrid Electricity Markets to
Support Deep Decarbonization Goals.”
December 16, 2020. https://files.wri.org/
s3fs-public/joskow_rff_presentation-12-16.
pdf?cheKLe66OWrgB1cPtOZxCjxYXVEmzUoK.
———. “Transmission Capacity Expansion Is Needed
to Decarbonize the Electricity Sector Efficiently.”
Joule 4, no. 1 (January 15, 2020): 1–3. https://doi.
org/10.1016/j.joule.2019.10.011.
Joskow, Paul L. “Challenges for Wholesale Electricity
Markets with Intermittent Renewable Generation
at Scale: The US Experience.” Oxford Review of
Economic Policy 35, no. 2 (April 23, 2019): 291–331.
https://doi.org/10.1093/oxrep/grz001.
117116

Joskow, Paul L. “Lessons Learned from Electricity
Market Liberalization.” The Energy Journal Volume 29,
no. Special Issue #2 (2008): 9–42. https://ideas.repec.
org/a/aen/journl/dn-se-a03.html.
Joskow, Paul, and Roger Noll. “The Bell Doctrine:
Applications in Telecommunications, Electricity,
and Other Network Industries.” Stanford Law
Review 51, no. 5 (May 1999): 1249–1325. https://doi.
org/10.2307/1229409.
Joskow, Paul, and Richard Schmalensee. Markets for
Power. Cambridge, MA: The MIT Press, 1983. https://
mitpress.mit.edu/books/markets-power.
Jurasz, J., F. A. Canales, A. Kies, M. Guezgouz, and
A. Beluco. “A Review on the Complementarity of
Renewable Energy Sources: Concept, Metrics,
Application and Future Research Directions.” Solar
Energy 195 (January 1, 2020): 703–24. https://doi.
org/10.1016/j.solener.2019.11.087.
Kahn, Alfred. The Economics of Regulation:
Institutional Issues. Vol. 2. 2 vols. MIT Press, 1988.
https://mitpress.mit.edu/books/economics-
regulation.
Kaptur, Marcy. Energy and Water Development and
Related Appropriations Bill, 2021 (2020). https://www.
congress.gov/congressional-report/116th-congress/
house-report/449/1?overview=closed.
Kiesling, Lynne. “Electricity Restructuring and the
Failure to Quarantine the Monopoly,” August 11,
2011. https://knowledgeproblem.com/2011/08/11/
electricity-restructuring-and-the-failure-to-
quarantine-the-monopoly/.
Konschnik, Kate. “RTOGov: Exploring Links Between
Market Decision-Making Processes and Outcomes.”
Primer. Duke Nicholas Institute for Environmental
Policy Solutions, September 2019. https://
nicholasinstitute.duke.edu/sites/default/files/
publications/RTOGov_Exploring_Links_Final.pdf.
Kristov, Lorenzo. “Modernizing Transmission-
Distribution Interface Coordination for a High-DER
Future.” Energy Advisory Committee Meeting,
March 28, 2017. https://www.energy.gov/sites/prod/
files/2017/04/f34/2_T-D%20Interface%20Panel%20
-%20Lorenzo%20Kristov%2C%20CAISO.pdf.
Kristov, Lorenzo, Paul De Martini, and Jeffery Taft.
“A Tale of Two Visions: Designing a Decentralized
Transactive Electric System.” IEEE Power and Energy
Magazine 14, no. 3 (June 2016): 63–69. https://doi.
org/10.1109/MPE.2016.2524964.
Kuckshinrichs, Wilhelm, and Thomas Schröder.
“Value of Lost Load: An Efficient Economic Indicator
for Power Supply Security? A Literature Review.”
Frontiers in Energy Research 3 (December 24, 2015).
https://doi.org/10.3389/fenrg.2015.00055.
Kumler, Andrew, Ignacio Carreño, Michael Craig,
Bri-Mathias Hodge, Wesley Cole, and Carlo
Brancucci. “Inter-Annual Variability of Wind and Solar
Electricity Generation and Capacity Values in Texas.”
Environmental Research Letter 14, no. 4 (April 16,
2019). https://doi.org/10.1088/1748-9326/aaf935.
Larson, Eric, Chris Greig, Jesse Jenkins, Erin
Mayfield, Andrew Pascale, Chuan Zhang, Joshua
Drossman, et al. “Net Zero America.” Interim Report.
Princeton University, December 16, 2020. https://
environmenthalfcentury.princeton.edu/sites/g/files/
toruqf331/files/2020-12/Princeton_NZA_Interim_
Report_15_Dec_2020_FINAL.pdf.
118

Lavillotti, Michael. “DER Energy Market Design:
Part 1.” February 4, 2019. https://www.nyiso.com/
documents/20142/4815989/DER+Overall+Energy+M
arket+Design+Review+-+Part+I.pdf.
Lazard. “Levelized Cost of Energy and Levelized Cost
of Storage – 2020.” Lazard. Accessed January 7, 2021.
http://www.lazard.com/perspective/levelized-cost-
of-energy-and-levelized-cost-of-storage-2020/.
Lehr, Roy. “Utility Monopsony Regulation:
What’s Behind Low-Cost Wind and Solar Bids in
Colorado?” Issue Brief, December 2019. https://
energyinnovation.org/wp-content/uploads/2019/11/
Monopsony-Brief_December-2019.pdf.
Level10 Energy. “A Better Way to a PPA.” Accessed
January 8, 2021. https://leveltenenergy.com/.
Lew, D., D. Bartlett, A. Groom, P. Jorgensen, J.
O’Sullivan, R. Quint, B. Rew, B. Rockwell, S. Sharma,
and D. Stenclik. “Secrets of Successful Integration:
Operating Experience With High Levels of Variable,
Inverter-Based Generation.” IEEE Power and Energy
Magazine 17, no. 6 (November 2019): 24–34. https://
doi.org/10.1109/MPE.2019.2930855.
Linvill, Carl, Jim Lazar, David Littell, Jessica Shipley,
and David Farnsworth. “Flexibility for the 21st
Century Power System.” Regulatory Assistance
Project, October 2019. https://www.raponline.org/
knowledge-center/flexibility-for-the-21st-century-
power-system/.
Littell, David, Camille Kadoch, Ranjit Bharvirkar, Max
Dupuy, Brenda Hausauer, Carl Linvill, Janine Migden-
Ostrander, et al. “Next-Generation Performance-
Based Regulation: Volume 1 (Introduction—Global
Lessons for Success).” Regulatory Assistance Project.
Accessed January 11, 2021. http://www.raponline.org/
knowledge-center/next-generation-performance-
based-regulation-volume-1-introduction-global-
lessons-for-success/.
Loutan, Clyde, Peter Klauer, Sirajul Chowdhury,
Stephen Hall, Mahesh Morjaria, Vladamir Chadliev,
Nick Milam, Milan Christopher, and Vahan Gevorgian.
“Demonstration of Essential Reliability Services by a
300-MW Solar Photovoltaic Power Plant.” Technical
Report. Golden, CO: NREL, March 2017. https://www.
nrel.gov/docs/fy17osti/67799.pdf.
MacDonald, Alexander, Christopher Clack, Anneliese
Alexander, Adam Dunbar, James Wilczak, and Yuanfu
Xie. “Future Cost-Competitive Electricity Systems and
Their Impact on US CO2 Emissions.” Nature Climate
Change 6 (January 25, 2016): 526–31. https://www.
nature.com/articles/nclimate2921#citeas.
Mai, Trieu, Paige Jadun, Jeffrey Logan, Colin
McMillan, Matteo Muratori, Daniel Steinberg, and
Laura Vimmerstedt. “Electrification Futures Study:
Scenarios of Electric Technology Adoption and Power
Consumption for the United States.” Golden, CO, June
2018. https://www.nrel.gov/docs/fy18osti/71500.pdf.
Mai, Trieu, Debra Sandor, Ryan Wiser, and Thomas
Schneider. “Renewable Electricity Futures Study:
Executive Summary.” Golden, CO: NREL, December
2012. https://www.nrel.gov/docs/fy13osti/52409-
ES.pdf.
Martin, Richard. “Overpowered: PJM Market Rules
Drive an Era of Oversupply,” December 3, 2019.
https://www.spglobal.com/marketintelligence/en/
news-insights/latest-news-headlines/54111666.
Massachusetts Attorney General’s Office. “Wholesale
Electric Market Design for a Low/No-Carbon Future:
Report on the October 2019 Symposium & Proposed
Next Steps,” March 2020. https://www.mass.gov/
doc/wholesale-electric-market-design-for-a-lowno-
carbon-future/download.
119118

Mays, Jacob. “Missing Incentives for Flexibility in
Wholesale Electricity Markets.” SSRN Scholarly Paper.
Rochester, NY: Social Science Research Network,
June 10, 2020. https://doi.org/10.2139/ssrn.3623962.
Mays, Jacob, David Morton, and Richard O’Neill.
“Asymmetric Risk and Fuel Neutrality in Electricity
Capacity Markets.” Nature Energy 4 (October 8, 2019):
948–956. https://doi.org/10.1038/s41560-019-0476-1.
McCabe, Ann, David Svanda, and Betty Kane.
“Making Markets Work for PJM States: State
Engagement Possibilities with PJM,” October 2019.
https://opsi.us/wp-content/uploads/2019/10/
Making-Markets-Work-for-PJM-States-10-14-19-1.
pdf.
Midcontinent Independent System Operator.
“Exploration of a Forward Market Mechanism (FMM),”
December 10, 2020. https://www.misoenergy.
org/stakeholder-engagement/issue-tracking/
exploration-of-a-forward-market-mechanism-
fmm/.
———. “MISO Value Proposition.” misoenergy.org.
Accessed January 7, 2021. https://www.misoenergy.
org/about/miso-strategy-and-value-proposition/
miso-value-proposition/.
Milligan, M., K. Clark, K. Lynn, and Venkat
Banunarayanan. “Examination of Potential
Benefits of an Energy Imbalance Market in the
Western Interconnection,” 2013. https://doi.
org/10.2172/1071943.
Milligan, Michael. “Sources of Grid Reliability Services.”
The Electricity Journal 31, no. 9 (November 1, 2018): 1–7.
https://doi.org/10.1016/j.tej.2018.10.002.
Milligan, Michael, Bethany Frew, Aaron Bloom, Erik
Ela, Audun Botterud, Aaron Townsend, and Todd
Levin. “Wholesale Electricity Market Design with
Increasing Levels of Renewable Generation: Revenue
Sufficiency and Long-Term Reliability.” The Electricity
Journal 29, no. 2 (March 22, 2016): 26–28. https://doi.
org/10.1016/j.tej.2016.02.005.
Milligan, Michael, and Brendan Kirby. “Utilizing Load
Response for Wind and Solar Integration and Power
System Reliability.” Conference Paper. NREL, July
2010. https://www.nrel.gov/docs/fy10osti/48247.pdf.
Mills, Andrew, Mark Ahlstrom, Michael Brower,
Abraham Ellis, Ray George, Tom Hoff, Benjamin
Kroposki, et al. “Understanding Variability and
Uncertainty of Photovoltaics for Integration with the
Electric Power System.” Technical Report. Berkeley,
CA: LBNL, December 2009. https://eta-publications.
lbl.gov/sites/default/files/lbnl-2855e.pdf.
Mills, Andrew, and Ryan Wiser. “Strategies for
Mitigating the Reduction in Economic Value of
Variable Generation with Increasing Penetration
Levels.” LBNL, March 2014. https://eta-publications.
lbl.gov/sites/default/files/lbnl-6590e.pdf.
Ming, Zach, Arne Olson, Huai Jiang, Manohar
Mogadali, and Nick Schlag. “Resource Adequacy in
the Pacific Northwest.” Energy and Environmental
Economics, March 2019. https://www.ethree.com/
wp-content/uploads/2019/03/E3_Resource_
Adequacy_in_the_Pacific-Northwest_March_2019.
pdf.
MISO. “Business Practices Manual: Resource
Adequacy,” December 15, 2020. https://cdn.
misoenergy.org//BPM%20011%20-%20Resource%20
Adequacy110405.zip.
120
———. “Final MISO DPP 2019 Cycle 1 South Area
Study Phase I Report,” July 16, 2020. https://cdn.
misoenergy.org/GI-DPP-2019-Cycle1-South-Ph1_
System_Impact_Study_Final_PUBLIC464836.zip.
———. “Ramp Capability Product Development
IR048.” December 20, 2018. Accessed January 7,
2021. https://www.misoenergy.org/stakeholder-
engagement/issue-tracking/ramp-capability-
product-development/.
———. “Renewable Integration Impact
Assessment.” June 5, 2018. https://cdn.misoenergy.
org/20180618%20RIIA%20Workshop430630.pdf.
———. “Value Proposition.” Accessed January 8, 2021.
https://www.misoenergy.org/about/miso-strategy-
and-value-proposition/miso-value-proposition/.
Morehouse, Catherine. “Global Offshore Wind
Prices Drop 32%: BloombergNEF.” Utility Dive,
October 24, 2019. https://www.utilitydive.com/
news/global-offshore-wind-prices-drop-32-
bloombergnef/565719/.
Morey, Mathew, and Laurence Kirsch. “Retail Choice
in Electricity: What Have We Learned in 20 Years?”
Christensen Associated Energy Consulting, February
11, 2016. https://hepg.hks.harvard.edu/files/hepg/
files/retail_choice_in_electricity_for_emrf_final.pdf.
Morison, Rachel. “Britain Has Gone Nine Days
Without Wind Power.” Bloomberg, June 7, 2018.
https://www.bloomberg.com/news/articles/2018-
06-07/u-k-wind-drought-heads-into-9th-day-with-
no-relief-for-weeks.
Murtishaw, Scott. “Barriers to Maximizing the
Value of Behind-the-Meter Distributed Energy
Resources.” California Solar & Storage Association,
January 2019. https://static1.squarespace.com/
static/54c1a3f9e4b04884b35cfef6/t/5c509f774ae2
3756e03f6161/1548787577591/CALSSA+Whitepaper+
on+DER+Barriers-Jan2019.pdf.
Musial, Walter, Philipp Beiter, Paul Spitsen, Jake
Nunemaker, and Vahan Gevorgian. “2018 Offshore
Wind Technologies Market Report.” U.S. Department
of Energy, August 2019. https://www.energy.gov/
sites/prod/files/2019/09/f66/2018%20Offshore%20
Wind%20Technologies%20Market%20Report.pdf.
National Renewable Energy Laboratory. “North
American Renewable Integration Study.” NREL.
Accessed January 8, 2021. https://www.nrel.gov/
analysis/naris.html.
New England States Committee on Electricity. “New
England States’ Vision for a Clean, Affordable, and
Reliable 21st Century Regional Electric Grid.” New
England States Committee on Electricity, October
26, 2020. http://nescoe.com/resource-center/vision-
stmt-oct2020/.
New Jersey Statewide Basic Generation Service
Electricity Supply Auction. “BGS Auction.” Accessed
January 11, 2021. http://www.bgs-auction.com/.
New York ISO. “Installed Capacity Manual.” New
York ISO, June 2020. https://www.nyiso.com/
documents/20142/2923301/icap_mnl.pdf/234db95c-
9a91-66fe-7306-2900ef905338.
121120

Newell, Samuel, Rebecca Carroll, Ariel Kaluzhny,
Kathleen Spees, Kevin Carden, Nick Wintermantel,
and Alex Krasny. “Estimation of the Market
Equilibrium and Economically Optimal Reserve
Margins for the ERCOT Region: 2018 Update.” The
Brattle Group, December 20, 2018. http://www.
ercot.com/content/wcm/lists/167026/2018_12_20_
ERCOT_MERM_Report_Final.pdf.
Newell, Samuel, Rebecca Carroll, Pablo Ruiz, and Will
Gorman. “Cost-Benefit Analysis of ERCOT’s Future
Ancillary Services (FAS) Proposal.” The Brattle Group,
December 21, 2015. https://brattlefiles.blob.core.
windows.net/system/news/pdfs/000/000/982/
original/cost-benefit_analysis_of_ercot’s_future_
ancillary_services_(fas)_proposal.pdf?1450901946.
Nickell, Lanny. “Transmission Investment in SPP.” July
15, 2019. https://www.spp.org/documents/60253/
spc%20additional%20material%2020190715.pdf.
Nolan, Sheila, Daniel Burke, Hassan Qazi, Damian
Flynn, Mark O’Malley, Juha Kiviluoma, Brendan Kirby,
Marissa Hummon, and Michael Milligan. “Synergies
between Wind and Solar Generation and Demand
Response.” In 13th International Workshop on Large-
Scale Integration of Wind Power into Power Systems
as Well as on Transmission Networks for Offshore
Wind Power Plants. Berlin, Germany, 2014. https://doi.
org/10.13140/2.1.5075.5843.
North American Electric Reliability Corporation.
“1996 System Disturbances.” Princeton, NJ: NERC,
August 2002. https://www.nerc.com/pa/rrm/
ea/System%20Disturbance%20Reports%20
DL/1996SystemDisturbance.pdf.
———. “Essential Reliability Services Whitepaper
on Sufficiency Guidelines.” North American Electric
Reliability Corporation, December 2016. https://www.
nerc.com/comm/Other/essntlrlbltysrvcstskfrcDL/
ERSWG_Sufficiency_Guideline_Report.pdf.
———. “Fast Frequency Response Concepts and Bulk
Power System Reliability Needs,” March 2020. https://
www.nerc.com/comm/PC/InverterBased%20
Resource%20Performance%20Task%20Force%20
IRPT/Fast_Frequency_Response_Concepts_and_
BPS_Reliability_Needs_White_Paper.pdf.
———. “Integration of Variable Generation Task
Force: Summary and Recommendations of 12 Tasks,”
June 2015. https://www.nerc.com/comm/PC/
Integration%20of%20Variable%20Generation%20
Task%20Force%20I1/IVGTF%20Summary%20
and%20Recommendation%20Report_Final.pdf.
———. “Methods to Model and Calculate Capacity
Contributions of Variable Generation for Resource
Adequacy Planning,” March 2011. https://www.nerc.
com/comm/PC/Integration%20of%20Variable%20
Generation%20Task%20Force%20I1/IVGTF1-2.pdf.
———. “Probabilistic Adequacy and Measures.”
Technical Reference Report, July 2018. https://
www.nerc.com/comm/PC/Probabilistic%20
Assessment%20Working%20Group%20PAWG%20
%20Relat/Probabilistic%20Adequacy%20and%20
Measures%20Report.pdf.
———. “Reliability Guideline: Fuel Assurance and
Fuel-Related Reliability Risk for the Bulk Power
System.” North American Electric Reliability
Corporation, March 2020. https://www.nerc.com/
comm/PC_Reliability_Guidelines_DL/Fuel_
Assurance_and_Fuel-Related_Reliability_Risk_
Analysis_for_the_Bulk_Power_System.pdf.
122

North American Electric Reliability Corporation,
and ReliabilityFirst Corporation. “Petition of the
North American Electric Reliability Corporation
and ReliabilityFirst Corporation for Approval of
Proposed Regional Reliability Standard BAL-502-
RF-03,” October 16, 2017. https://www.nerc.com/
FilingsOrders/us/FERCOrdersRules/Delegated%20
Letter%20Order%20Approving%20BAL-502-RF-03.
pdf#search=BAL-502-RF-03.
North American Reliability Corporation. “Integrating
Inverter-Based Resources into Low Short Circuit
Strength Systems,” December 2017. https://www.
nerc.com/comm/PC_Reliability_Guidelines_DL/
Item_4a._Integrating%20_Inverter-Based_
Resources_into_Low_Short_Circuit_Strength_
Systems_-_2017-11-08-FINAL.pdf.
NV Energy. “Greenlink Nevada,” October 2020. http://
clearinghouse.nv.gov/public/Notice/2021/E2021-
098.pdf.
NYISO. “Manual 4: Installed Capacity
Manual,” June 2020. https://www.nyiso.com/
documents/20142/2923301/icap_mnl.pdf/234db95c-
9a91-66fe-7306-2900ef905338.
Orvis, Robbie, and Sonia Aggarwal. “A Roadmap
for Finding Flexibility in Wholesale Markets: Best
Practices for Market Design and Operations in a
High Renewables Future,” October 2017. https://
energyinnovation.org/wp-content/uploads/2017/10/
A-Roadmap-For-Finding-Flexibility-In-Wholesale-
Power-Markets_FINAL.pdf.
Osborne, Dale. “Lessons Learned in Wind
Generation.” Midcontinent Independent System
Operator, 2013. https://www.cce.umn.edu/
documents/cpe-conferences/mipsycon-
papers/2013/lessonslearnedinwindgeneration.pdf.
Panfil, Michael. “From Attleboro to EPSA: The Pace of
Change and Evolving Jurisdictional Frameworks in
the Electricity Sector.” UCLA Journal of Environmental
Law and Policy 38, no. 1 (2020). https://escholarship.
org/uc/item/7k9512pg.
Parks, Keith. “Declining Capacity Credit for Energy
Storage and Demand Response With Increased
Penetration.” IEEE Transactions on Power Systems
34, no. 6 (November 2019): 4542–46. https://doi.
org/10.1109/TPWRS.2019.2915805.
Patel, Sonal. “The Significance of FERC’s Recent PJM
MOPR Order Explained.” Power, December 26, 2019.
https://www.powermag.com/the-significance-of-
fercs-recent-pjm-mopr-order-explained/.
Patton, David. “Resilience and Emerging Issues in
Wholesale Electricity Markets.” Presented at the
2018 Energy Conference, June 4, 2018. https://www.
eia.gov/conference/2018/pdf/presentations/david_
patton.pdf.
Paul, Sonali, and Yuka Obayashi. “Explainer: Why
Green Hydrogen Is Finally Getting Its Day in the Sun.”
Reuters, December 10, 2020. https://www.reuters.
com/article/us-energy-hydrogen-idUSKBN28K3DA.
Paulos, Bentham. “A Regional Power Market for the
West: Risks and Benefits.” Next10.org, July 17, 2018.
https://www.next10.org/publications/regional-grid.
Pérez-Arriaga, Ignacio, Tomás Gómez, Carlos Batlle,
Pablo Rodilla, Rafael Cossent, Ignacio Herrero, Inés
Usera, Paolo Mastropietro, and Salvatore Vinci.
“Adapting Market Design to High Shares of Variable
Renewable Energy.” International Renewable Energy
Agency, May 2017. https://www.irena.org/-/media/
Files/IRENA/Agency/Publication/2017/May/IRENA_
Adapting_Market_Design_VRE_2017.pdf.
123122
Pfeifenberger, Johannes, Judy Chang, Akarsh
Sheilendranath, J Hagerty, Simon Levin, and Wren
Jiang. “Cost Savings Offered by Competition in
Electric Transmission: Experience to Date and
the Potential for Additional Customer Value.”
The Brattle Group, April 2019. https://brattlefiles.
blob.core.windows.net/files/15987_brattle_
competitive_transmission_report_final_with_data_
tables_04-09-2019.pdf.
Phadke, Amol, Umed Paliwal, Nikit Abhyankar,
Taylor McNair, Ben Paulos, David Wooley, and
Ric O’Connell. “2035 The Report: Plummeting
Solar, Wind, and Battery Costs Can Accelerate
Our Clean Electricity Future.” Goldman School of
Public Policy, University of California Berkeley, June
2020. http://www.2035report.com/wp-content/
uploads/2020/06/2035-Report.pdf.
PJM. “PJM Cold Snap Performance Dec. 28, 2017 to
Jan. 7, 2018,” February 26, 2018. https://www.pjm.
com/-/media/library/reports-notices/weather-
related/20180226-january-2018-cold-weather-
event-report.ashx?la=en.
———. “PJM Value Proposition,” 2019. https://www.
pjm.com/about-pjm/~/media/about-pjm/pjm-value-
proposition.ashx.
———. “Project Statistics.” Presented at the
Transmission Expansion Advisory Committee,
January 10, 2019. https://www.pjm.com/-/
media/committees-groups/committees/
teac/20190110/20190110-project-statistics-2018.ashx.
———. “Reliability Assurance Agreement.” Accessed
January 11, 2021. https://agreements.pjm.com/
raa/4177.
———. “The Benefits of the PJM Transmission
System,” April 16, 2019. https://pjm.com/-/media/
library/reports-notices/special-reports/2019/
the-benefits-of-the-pjm-transmission-system.
ashx?la=en.
Porter, Kevin, Matthew Hoyt, and Rebecca Widiss.
“Final Report Concerning the Maryland Renewable
Portfolio Standard as Required by Chapter 393
of the Acts of the Maryland General Assembly of
2017.” Maryland Department of Natural Resources,
December 2019. https://dnr.maryland.gov/pprp/
Documents/FinalRPSReportDecember2019.pdf.
Potomac Economics. “2019 State of the Market
Report for the ERCOT Electricity Markets,” May
2020. https://www.potomaceconomics.com/
wp-content/uploads/2020/06/2019-State-of-the-
Market-Report.pdf.
———. “OMS-RSC Seams Study: Market-to-Market
Coordination.” Potomac Economics, May 2020.
https://www.potomaceconomics.com/wp-content/
uploads/2020/06/Seams-Study_MISO-IMM_M2M-
Evaluation_Final.pdf.
Pöyry. “Balancing Resource Options: An Alternative
Capacity Mechanism,” November 4, 2011. https://
afry.com/sites/default/files/2020-08/balancing-
resource-options.pdf.
———. “The Challenges of Intermittency in North
West European Power Markets: The Impacts When
Wind and Solar Development Reach Their Target,”
March 2011. https://www.yumpu.com/en/document/
read/25456803/the-challenges-of-intermittency-in-
north-west-poyrycouk.
124

Public Utility Commission of Texas. Public Utility
Regulatory Act, § 25.107 § (2018). https://www.
puc.texas.gov/agency/rulesnlaws/subrules/
electric/25.107/25.107.pdf.
Quilici, Lisa, Danielle Powers, Gregg Therrien,
Benjamin Davis, and Olivia Prieto. “Retail Competition
in Electricity: What Have We Learned in 20 Years?”
Concentric Advisors, July 23, 2019. https://ceadvisors.
com/wp-content/uploads/2019/07/AEPG-FINAL-
report.pdf.
REBA Institute. “REBA Deal Tracker.” Accessed
January 4, 2021. https://rebuyers.org/deal-tracker/.
Reedy, Stephen. “Simulation of Real-Time Co-
Optimization of Energy and Ancillary Services for
Operating Year 2017.” Potomac Economics, June 29,
2018. http://www.ercot.com/content/wcm/landing_
pages/187109/IMM_Simulation_of_Real-Time_Co-
optimization_for_2017.pdf.
Riesz, Jenny, Joel Gilmore, and Iain MacGill.
“Assessing the Viability of Energy-Only Markets
With 100% Renewables.” Economics of Energy &
Environmental Policy 5, no. 1 (March 2016): 105–30.
https://www.jstor.org/stable/26189401?seq=1.
Roberts, Billy. “Wind Resources of the United States.”
National Renewable Energy Laboratory, September
18, 2017. https://www.nrel.gov/gis/assets/images/
wtk-100m-2017-01.jpg.
Rocha-Garrido, Patricio. “Public 1st Draft ELCC
Results and the Process to Provide Preliminary ELCC
Results.” Presented at the PJM Capacity Capability
Senior Task Force, July 10, 2020. https://www.pjm.
com/-/media/committees-groups/task-forces/
ccstf/2020/20200710/20200710-item-05-first-draft-
prelim-ELCC-results.ashx.
Seel, Joachim, Andrew Mills, and Ryan Wiser.
“Impacts of High Variable Renewable Energy
Futures on Wholesale Electricity Prices, and on
Electric-Sector Decision Making.” LBNL, May 2018.
https://eta-publications.lbl.gov/sites/default/files/
report_pdf_0.pdf.
Sepulveda, Nestor, Jesse Jenkins, Fernando Sisternes,
and Richard Lester. “The Role of Firm Low-Carbon
Electricity Resources in Deep Decarbonization of
Power Generation.” Joule 2, no. 11 (November 21, 2018):
2403–20. https://www.sciencedirect.com/science/
article/pii/S2542435118303866.
Shaner, Matthew R., Steven J. Davis, Nathan S. Lewis,
and Ken Caldeira. “Geophysical Constraints on the
Reliability of Solar and Wind Power in the United
States (Vol 11, Pg 914, 2018).” Energy & Environmental
Science 11, no. 4 (April 1, 2018): 997–997. https://doi.
org/10.1039/c8ee90019a.
Sheble, G, and G Fahd. “Unit Commitment
Literature Synopsis.” IEEE Transactions on Power
Systems 9, no. 1 (February 1994): 128–35. https://doi.
org/10.1109/59.317549.
Silverstein, Alison. “Resource Adequacy in Texas:
Unleashing Demand-Side Resources in the ERCOT
Market.” Environmental Defense Fund, May 2020.
https://www.edf.org/sites/default/files/documents/
EDF-ERCOT-Report.pdf.
Sioshansi, R., R. O’Neill, and S.S. Oren. “Economic
Consequences of Alternative Solution Methods
for Centralized Unit Commitment in Day-Ahead
Electricity Markets.” IEEE Transactions on Power
Systems 23, no. 2 (2008): 344–52. https://doi.
org/10.1109/TPWRS.2008.919246.
125124
Slusarewucz, Joanna, and Daniel Cohan. “Assessing
Solar and Wind Complementarity in Texas.”
Renewables: Wind, Water, and Solar 5, no. 7
(November 16, 2018). https://doi.org/https://doi.
org/10.1186/s40807-018-0054-3.
Solar Energy Industries Association. “Solar Industry
Research Data.” Solar Energy Industries Association.
Accessed January 7, 2021. https://www.seia.org/
solar-industry-research-data.
Spees, Kathleen, Samuel Newell, Walter Graf, and
Emily Shorin. “How States, Cities, and Customers Can
Harness Competitive Markets to Meet Ambitious
Carbon Goals Through a Forward Market for Clean
Energy Attributes.” The Brattle Group, September
2019. https://brattlefiles.blob.core.windows.net/
files/17063_how_states_cities_and_customers_
can_harness_competitive_markets_to_meet_
ambitious_carbon_goals_-_through_a_forward_
market_for_clean_energy_attributes.pdf.
Spyrou, Evangelia, Jonathan Ho, Benjamin Hobbs,
Randell Johnson, and James McCalley. “What Are
the Benefits of Co-Optimizing Transmission and
Generation Investment? Eastern Interconnection
Case Study.” IEEE Transactions on Power Systems
32, no. 6 (November 2017): 4265–77. https://doi.
org/10.1109/TPWRS.2017.2660249.
State of New York Public Service Commission. Order
Adopting Installed Reserve Margin for the New York
Control Area for the 2018-2019 Capability Year (March
6, 2018).
Stoft, Steven. Power System Economics:
Designing Markets for Electricity. Wiley-IEEE
Press, 2002. https://www.wiley.com/en-gb/
Power+System+Economics%3A+Designing
+Markets+for+Electricity-p-9780471150404.
Sullivan, Michael, Josh Schellenberg, and Marshall
Blundell. “Updated Value of Service Reliability
Estimates for Electric Utility Customers in the United
States.” Lawrence Berkeley National Lab. (LBNL),
Berkeley, CA (United States), January 1, 2015. https://
doi.org/https://doi.org/10.2172/1172643.
The General Court of the Commonwealth of
Massachusetts. Massachusetts General Law, Ch. 164
§ 1F. Accessed January 8, 2021. https://malegislature.
gov/Laws/GeneralLaws/PartI/TitleXXII/Chapter164/
Section1F.
The Natural Resources Defense Council, Sustainable
FERC Project, Sierra Club, and Vote Solar. Comments
of Natural Resources Defense Council, Sustainable
FERC Project, Sierra Club, and Vote Solar to Materials
Related to the July 10, 2020 Technical Conference, No.
19- E- 0530. Accessed January 8, 2021.
The United States Department of Justice. “Justice
Department Statement on Entergy Corp.’s
Transmission System Commitments and Acquisition
of KGen Power Corp.’s Plants in Arkansas and
Mississippi,” November 14, 2012. https://www.justice.
gov/opa/pr/justice-department-statement-entergy-
corp-s-transmission-system-commitments-and-
acquisition.
Thoubboron, Kerry. “New Jersey TRECs: What You
Need To Know | EnergySage.” Energy Sage (blog),
December 23, 2019. https://news.energysage.com/
nj-trecs-solar-incentive/.
Tierney, Susan. “Resource Adequacy and Wholesale
Market Structure for a Future Low-Carbon Power
System in California.” Analysis Group, July 10, 2018.
https://www.analysisgroup.com/globalassets/
content/insights/publishing/tierney_california_
resource_adequacy_and_wholesale_market_
design.pdf.
126

———. “Wholesale Power Market Design in a
Future Low-Carbon Electric System: A Proposal
for Consideration.” Analysis Group, November
28, 2020. https://files.wri.org/s3fs-public/
tierney-white-paper-on-wholesale-market-
design-12-15-2020-final-to-wri-rff.pdf?KmZ4_
HCRyF4ZtCCmu3EFjbpx4R9Xxpa0.
Trabish, Herman. “3 Transmission Projects That
Illustrate the Importance in Modernizing the Grid.”
Utility Dive, June 24, 2016. https://www.utilitydive.
com/news/3-transmission-projects-that-illustrate-
the-importance-in-modernizing-the-g/420333/.
Tsuchida, Bruce, and Rob Gramlich. “Improving
Transmission Operation with Advanced Technologies:
A Review of Deployment Experience and Analysis of
Incentives,” June 24, 2019. https://watttransmission.
files.wordpress.com/2019/06/brattle-grid-
strategies-paper-improvingtransmissionoperation
withadvancedtechnologies.pdf.
United States Environmental Protection Agency.
“Community Choice Aggregation.” Accessed
January 8, 2021. https://www.epa.gov/greenpower/
community-choice-aggregation.
U.S. Department of Energy. “Heat Pump Systems.”
Energy.gov. Accessed January 5, 2021. https://www.
energy.gov/energysaver/heat-and-cool/heat-
pump-systems.
———. “Maintaining Reliability in the Modern Power
System,” December 2016. https://www.energy.
gov/sites/prod/files/2017/01/f34/Maintaining%20
Reliability%20in%20the%20Modern%20Power%20
System.pdf.
———. “Quadrennial Technology Review: An
Assessment of Energy Technologies and Research
Opportunities,” September 2015. https://www.
energy.gov/sites/prod/files/2017/03/f34/
quadrennial-technology-review-2015_1.pdf.
———. “Wind Vision: A New Era for Wind Power in
the United States.” U.S. Department of Energy, March
2015. https://www.energy.gov/sites/prod/files/
WindVision_Report_final.pdf.
U.S. Department of Energy Office of Electricity.
“Solid State Power Substation Technology
Roadmap,” June 2020. https://www.energy.gov/
sites/prod/files/2020/07/f76/2020%20Solid%20
State%20Power%20Substation%20Technology%20
Roadmap.pdf.
———. “Transformer Resilience and Advanced
Components Program: Vision and Framework,”
June 2020. https://www.energy.gov/sites/prod/
files/2020/06/f75/TRAC%20Program%20Vision%20
and%20Framework.pdf.
U.S. Energy Information Administration. “Battery
Storage in the United: An Update on Market.” U.S.
Department of Energy, July 2020. https://www.eia.
gov/analysis/studies/electricity/batterystorage/pdf/
battery_storage.pdf.
———. “Electric Power Annual 2009.” Electric Power
Annual. Washington, D.C.: U.S. Department of Energy,
January 2011. https://www.nrc.gov/docs/ML1104/
ML110410547.pdf.
———. “Table 3.1.A. Net Generation by Energy Source:
Total (All Sectors), 2009 - 2019.” Accessed January 8,
2021. https://www.eia.gov/electricity/annual/html/
epa_03_01_a.html.
127126

———. “Table 3.2.A. Net Generation by Energy Source:
Electric Utilities, 2009 - 2019.” Accessed January 8,
2021. https://www.eia.gov/electricity/annual/html/
epa_03_02_a.html.
———. “Table 3.3.B. Net Generation from Renewable
Sources: Independent Power Producers, 2009 - 2019.”
Accessed January 8, 2021. https://www.eia.gov/
electricity/annual/html/epa_03_03_b.html.
———. “Today in Energy: Dispatch Curve.” U.S. Energy
Information Administration, August 17, 2012. https://
www.eia.gov/todayinenergy/images/2012.08.17/
DispatchCurve.png.
———. “Today in Energy: Three Mile Island Is the
Latest Nuclear Power Plant to Announce Retirement
Plans.” U.S. Energy Information Administration, June
13, 2017. https://www.eia.gov/todayinenergy/detail.
php?id=31612.
———. “Trends in U.S. Oil and Natural Gas Upstream
Costs.” Washington, D.C.: U.S. Department of Energy,
March 2016. https://www.eia.gov/analysis/studies/
drilling/pdf/upstream.pdf.
———. “What Is U.S. Electricity Generation by
Energy Source?” Frequently Asked Questions (FAQs).
Accessed January 7, 2021. https://www.eia.gov/tools/
faqs/faq.php.
USAID. “Tanzania: Competitive Procurement,”
December 30, 2020. https://www.usaid.gov/energy/
auctions/tanzania-competitive-procurement-
workshop.
Van Horn, Kai, Johannes Pfeifenberger, and
Pablo Ruiz. “The Value of Diversifying Uncertain
Renewable Generation through the Transmission
System,” September 2020. https://open.bu.edu/
handle/2144/41451.
Van Welie, Gordon. Testimony of Gordon Van Welie
President & Chief Executive Officer, ISO New England
Before the US Senate Committee on Energy &
Natural Resources (2018). https://www.energy.
senate.gov/services/files/6C8F4042-347A-4A43-
901D-943C058D5B70%29.
Vibrant Clean Energy. “Minnesota’s Smarter Grid:
Pathways Toward a Clean, Reliable and Affordable
Transportation and Energy System,” July 31, 2018.
https://www.vibrantcleanenergy.com/wp-content/
uploads/2018/07/Minnesotas-SmarterGrid_
FullReport.pdf.
Wamsted, Dennis, and David Schlissel. “Petra Nova
Mothballing-Mortem: Closure of Texas Capture Plant
Is a Warning.” Institute for Energy Economics and
Financial Analysis, August 2020. https://ieefa.org/wp-
content/uploads/2020/08/Petra-Nova-Mothballing-
Post-Mortem_August-2020.pdf.
Wan, Y. “Long-Term Wind Power Variability.” Technical
Report. NREL, January 2012. https://www.nrel.gov/
docs/fy12osti/53637.pdf.
Wartsila Energy. “Path to 100% Renewables for
California.” Path to 100%, October 2020. https://
www.pathto100.org/wp-content/uploads/2020/03/
California-WP-170320.pdf.
2019-2020 Electric Resource Portfolios to Inform
Integrated Resource Plans and Transmission
Planning, California Public Utilities Commission
(California Public Utilities Commission 2020).
Connecticut Department Of Public Utility Control v.
Federal Energy Regulatory Commission, No. 07–1375
(United States Court of Appeals for the District of
Columbia Circuit June 23, 2009).
128

Federal Energy Regulatory Commission v. Electric
Power Supply Association, No. 14–840 (Supreme
Court of the United States January 25, 2016).
Federal Power Act, 16 U.S. Code § 824o §. Accessed
January 11, 2021. https://www.law.cornell.edu/
uscode/text/16/824o.
Edison Energy Renewables Team. “Renewable
Energy Impact v. Additionality: How and Why
PPAs Matter,” February 6, 2018. https://www.
edisonenergy.com/blog/renewable-energy-impact-
v-additionality-ppas-matter/.
United States v. E. I. du Pont de Nemours & Co. (n.d.).
Wilson, John, Mike O’Boyle, and Ron Lehr.
“Monopsony Behavior in the Power Generation
Market.” The Electricity Journal 33, no. 7 (September
2020). https://doi.org/10.1016/j.tej.2020.106804.
Wilson, John, Mike O’Boyle, Ron Lehr, and Mark
Detsky. “Making the Most of the Power Plant Market:
Best Practices for All-Source Electric Generation
Procurement,” April 2020. https://energyinnovation.
org/wp-content/uploads/2020/04/All-Source-
Utility-Electricity-Generation-Procurement-Best-
Practices.pdf.
Wiser, Ryan, Mark Bolinger, Ben Hoen, Dev Millstein,
Joe Rand, Galen Barbose, Darghouth Naï, et al.
“Wind Energy Technology Data Update: 2020
Edition.” August 2020. https://emp.lbl.gov/sites/
default/files/2020_wind_energy_technology_data_
update.pdf.
Wolak, Frank. “Managing Unilateral Market Power
in Electricity.” Working Paper, 2005. https://web.
stanford.edu/group/fwolak/cgi-bin/sites/default/
files/files/Managing%20Unilateral%20Market%20
Power%20in%20Electricity_Wolak.pdf.
———. “Measuring Unilateral Market Power in
Wholesale Electricity Markets: The California
Market, 1998-2000.” American Economic
Review 93, no. 2 (May 2003): 425–30. https://doi.
org/10.1257/000282803321947461.
World Resources Institute. “Utility Green Tariffs.”
Accessed January 8, 2021. https://www.wri.org/
our-work/project/clean-energy/utility-green-
tariffs#:~:text=A%20green%20tariff%20is%20
a,their%20electricity%20from%20renewable%20
resources.
Yergin, Daniel, and Joseph Stanislav. The
Commanding Heights: The Battle for the World
Economy. New York, NY: Simon & Schuster, 1998.
Zevin, Avi, Sam Walsh, Justin Gundlach, and Isabel
Carey. “Building a New Grid Without New Legislation:
A Path to Revitalizing Federal Transmission
Authorities.” Columbia University, December 2020.
https://www.energypolicy.columbia.edu/sites/
default/files/file-uploads/GridAuthority_CGEP_
Report_121120-2.pdf.
Zummo, Paul. “America’s Electricity Generation
Capacity - 2020 Update.” American Public Power
Association, March 2020. https://www.publicpower.
org/system/files/documents/Americas-Electricity-
Generation-Capacity-2020.pdf.
www.Griddy.com. Accessed January 11, 2021. https://
www.griddy.com/.
129128

w w w.reba-institute.org
AddressREBA Institute1425 K St. NW, Suite 1110, Washington, DC 20005
Phone1. 833. 303. REBA
Email / [email protected]