report card: lithuania - world obesity federation
TRANSCRIPT

Report cardLithuania
1
Contents Page
Obesity prevalence 2
Trend: % Adults living with obesity, 1997-2007 4
Trend: % Adults living with overweight or obesity, 1997-2007 5
Trend: % Adults living with obesity, 2000-2019 6
Trend: % Adults living with overweight or obesity, 2000-2019 8
Trend: % Adults living with obesity, selected countries, 1976-2019 10
Overweight/obesity by age and education 12
Overweight/obesity by education 15
Overweight/obesity by age 19
Overweight/obesity by region 21
Overweight/obesity by age and region 23
Overweight/obesity by age and socio-economic group 25
Overweight/obesity by socio-economic group 28
Overweight/obesity by age and limited activity 33
Insufficient physical activity 36
Sugar consumption 42
Estimated per capita sugar sweetened beverages intake 43
Prevalence of at least daily carbonated soft drink consumption 44
Prevalence of confectionery consumption 45
Prevalence of sweet/savoury snack consumption 46
Estimated per capita fruit intake 47
Prevalence of less than daily fruit consumption 48
Prevalence of less than daily vegetable consumption 49
Estimated per-capita processed meat intake 50
Estimated per capita whole grains intake 51
Mental health - depression disorders 52
Mental health - anxiety disorders 53
Oesophageal cancer 54
Breast cancer 56
Colorectal cancer 57
Pancreatic cancer 59
Gallbladder cancer 61
Kidney cancer 63
Cancer of the uterus 65
Raised blood pressure 66
Raised cholesterol 69
Raised fasting blood glucose 72
Diabetes prevalence 74

Obesity prevalence
Adults, 2019
Adults Men Women0
10
20
30
40
50
60
Obesity Overweight
%
Survey type: Self-reported
Age: 18+
Area covered: National
References: Eurostat 2019. Data available at
https://appsso.eurostat.ec.europa.eu/nui/show.do?dataset=hlth_ehis_bm1i&lang=en (last accessed 09.08.21)
Unless otherwise noted, overweight refers to a BMI between 25kg and 29.9kg/m², obesity refers to a BMI greater than 30kg/m².
2

Children, 2019-2020
Children Boys Girls0
5
10
15
20
25
Obesity Overweight
%
Survey type: Measured
Age: 7-17
Sample size: 295,086
Area covered: National
References: LR sveikatos apsaugos ministro (2020). VAIku SVEIKATA 2019. Available at:
https://hi.lt/uploads/pdf/leidiniai/Statistikos/Vaiku_sveikata/Vaik%C5%B3%20sveikata%202019.pdf. Last accessed
18.05.21.
Cutoffs: Other
3

% Adults living with obesity, 1997-2007
1998 2000 2002 2004 20060
2
4
6
8
10
12
14
16
18
Obesity, Men Obesity, Women
% o
besi
ty
Survey type: Measured
References: 1997: Pomerleau J, Pudule I, Grinberga D, Kadziauskiene K, Abaravicius A, Bartkeviciute R, Vaask S, Robertson A,
McKee M. Patterns of body weight in the Baltic Republics. Public Health Nutrition. 2000;3:3-10
2002, 2007: Barzda A, Bartkevičiūtė R, Stukas R, Šatkutė R, Abaravičius JA. Lietuvos
gyventojų kūno masės indekso pokyčiai 1997-2007 metais. Sveikatos mokslai 2009;3:2406-
2410. (no English translation)
Unless otherwise noted, overweight refers to a BMI between 25kg and 29.9kg/m², obesity refers to a BMI greater than 30kg/m².
Different methodologies may have been used to collect this data and so data from different surveys may not be strictly comparable. Please
check with original data sources for methodologies used.
4

% Adults living with overweight or obesity, 1997-2007
1998 2000 2002 2004 20060
10
20
30
40
50
60
Overweight or obesity, Men Overweight or obesity, Women
% o
verw
eigh
t or o
besi
ty
Survey type: Measured
References: 1997: Pomerleau J, Pudule I, Grinberga D, Kadziauskiene K, Abaravicius A, Bartkeviciute R, Vaask S, Robertson A,
McKee M. Patterns of body weight in the Baltic Republics. Public Health Nutrition. 2000;3:3-10
2002, 2007: Barzda A, Bartkevičiūtė R, Stukas R, Šatkutė R, Abaravičius JA. Lietuvos
gyventojų kūno masės indekso pokyčiai 1997-2007 metais. Sveikatos mokslai 2009;3:2406-
2410. (no English translation)
Unless otherwise noted, overweight refers to a BMI between 25kg and 29.9kg/m², obesity refers to a BMI greater than 30kg/m².
Different methodologies may have been used to collect this data and so data from different surveys may not be strictly comparable. Please
check with original data sources for methodologies used.
5

% Adults living with obesity, 2000-2019
Men
2000 2005 2010 2015 20200
2
4
6
8
10
12
14
16
18
Obesity
Survey type: Self-reported
References: For full details of references visit https://data.worldobesity.org/
Different methodologies may have been used to collect this data and so data from different surveys may not be strictly comparable. Please
check with original data sources for methodologies used.
6

Women
2000 2005 2010 2015 20200
5
10
15
20
Obesity
Survey type: Self-reported
References: For full details of references visit https://data.worldobesity.org/
Different methodologies may have been used to collect this data and so data from different surveys may not be strictly comparable. Please
check with original data sources for methodologies used.
7

% Adults living with overweight or obesity, 2000-2019
Men
2000 2005 2010 2015 20200
10
20
30
40
50
60
Overweight or obesity
Survey type: Self-reported
References: For full details of references visit https://data.worldobesity.org/
Different methodologies may have been used to collect this data and so data from different surveys may not be strictly comparable. Please
check with original data sources for methodologies used.
8

Women
2000 2005 2010 2015 20200
10
20
30
40
50
Overweight or obesity
Survey type: Self-reported
References: For full details of references visit https://data.worldobesity.org/
Different methodologies may have been used to collect this data and so data from different surveys may not be strictly comparable. Please
check with original data sources for methodologies used.
9

% Adults living with obesity, selected countries, 1976-2019
Men
1975 1980 1985 1990 1995 2000 2005 2010 2015 20200
5
10
15
20
25
Obesity, England Obesity, Finland Obesity, Ireland Obesity, Lithuania Obesity, NetherlandsObesity, Poland Obesity, Spain Obesity, Sweden
% A
dults
livi
ng w
ith o
besi
ty
References: For full details of references visit
https://data.worldobesity.org/
Different methodologies may have been used to collect this data and so data from different surveys may not be strictly comparable. Please
check with original data sources for methodologies used.
10

Women
1975 1980 1985 1990 1995 2000 2005 2010 2015 20200
5
10
15
20
25
30
Obesity, England Obesity, Finland Obesity, Ireland Obesity, Lithuania Obesity, NetherlandsObesity, Poland Obesity, Spain Obesity, Sweden
% A
dults
livi
ng w
ith o
besi
ty
References: For full details of references visit
https://data.worldobesity.org/
Different methodologies may have been used to collect this data and so data from different surveys may not be strictly comparable. Please
check with original data sources for methodologies used.
11
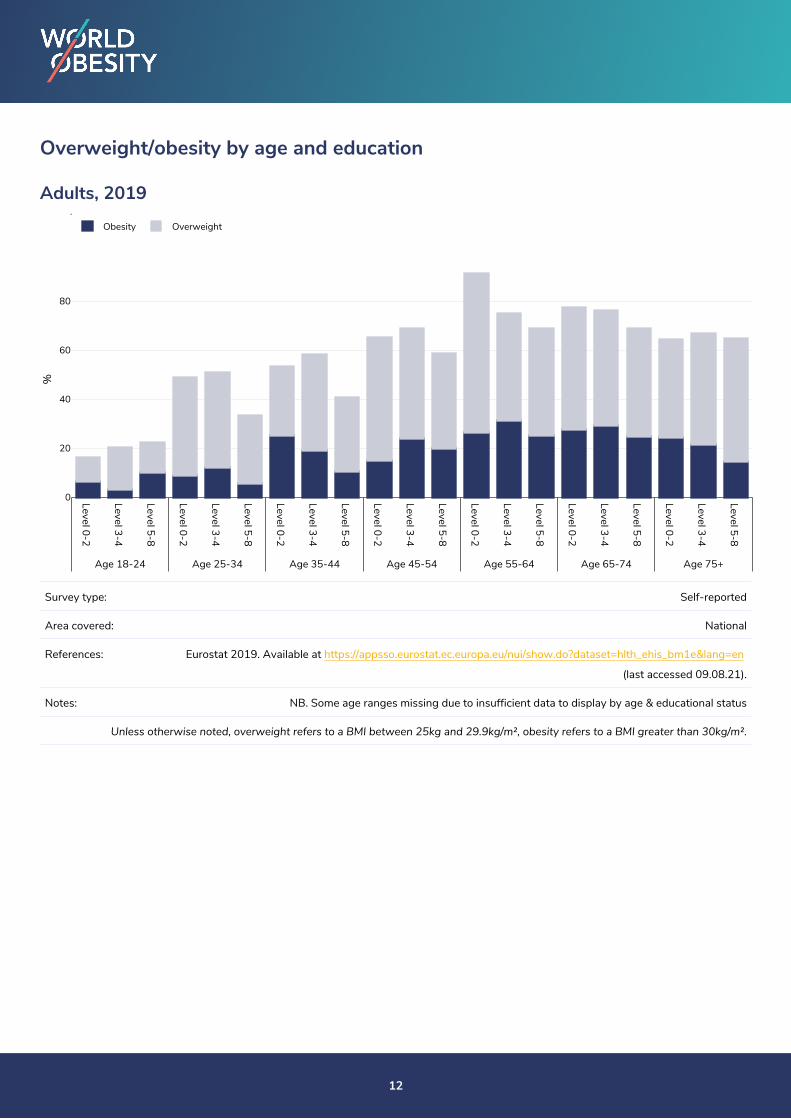
Overweight/obesity by age and education
Adults, 2019
Level 0-2
Level 3-4
Level 5-8
Level 0-2
Level 3-4
Level 5-8
Level 0-2
Level 3-4
Level 5-8
Level 0-2
Level 3-4
Level 5-8
Level 0-2
Level 3-4
Level 5-8
Level 0-2
Level 3-4
Level 5-8
Level 0-2
Level 3-4
Level 5-8
Age 18-24 Age 25-34 Age 35-44 Age 45-54 Age 55-64 Age 65-74 Age 75+
0
20
40
60
80
Obesity Overweight
%
Survey type: Self-reported
Area covered: National
References: Eurostat 2019. Available at https://appsso.eurostat.ec.europa.eu/nui/show.do?dataset=hlth_ehis_bm1e&lang=en
(last accessed 09.08.21).
Notes: NB. Some age ranges missing due to insufficient data to display by age & educational status
Unless otherwise noted, overweight refers to a BMI between 25kg and 29.9kg/m², obesity refers to a BMI greater than 30kg/m².
12

Men, 2019
Level 0-2 Level 3-4 Level 5-8 Level 0-2 Level 3-4 Level 5-8 Level 0-2 Level 3-4 Level 5-8 Level 0-2 Level 3-4 Level 5-8Age 18-24 Age 25-34 Age 35-44 Age 75+
0
10
20
30
40
50
60
70
Obesity Overweight
%
Survey type: Self-reported
Area covered: National
References: Eurostat 2019. Available at https://appsso.eurostat.ec.europa.eu/nui/show.do?dataset=hlth_ehis_bm1e&lang=en
(last accessed 09.08.21).
Notes: NB. Some age ranges missing due to insufficient data to display by age & educational status
Unless otherwise noted, overweight refers to a BMI between 25kg and 29.9kg/m², obesity refers to a BMI greater than 30kg/m².
13

Women, 2019
Level 0-2 Level 3-4 Level 5-8 Level 0-2 Level 3-4 Level 5-8 Level 0-2 Level 3-4 Level 5-8 Level 0-2 Level 3-4 Level 5-8Age 18-24 Age 35-44 Age 65-74 Age 75+
0
10
20
30
40
50
60
70
80
Obesity Overweight
%
Survey type: Self-reported
Area covered: National
References: Eurostat 2019. Available at https://appsso.eurostat.ec.europa.eu/nui/show.do?dataset=hlth_ehis_bm1e&lang=en
(last accessed 09.08.21).
Notes: NB. Some age ranges missing due to insufficient data to display by age & educational status
Unless otherwise noted, overweight refers to a BMI between 25kg and 29.9kg/m², obesity refers to a BMI greater than 30kg/m².
14
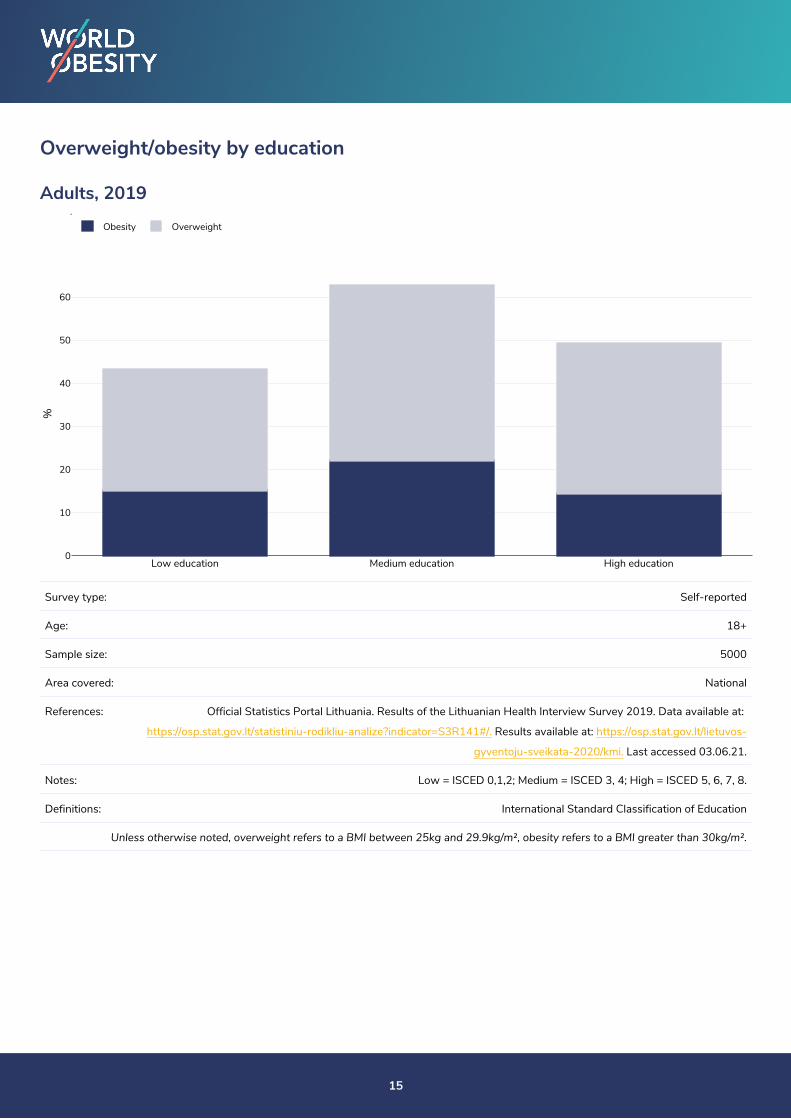
Overweight/obesity by education
Adults, 2019
Low education Medium education High education0
10
20
30
40
50
60
Obesity Overweight
%
Survey type: Self-reported
Age: 18+
Sample size: 5000
Area covered: National
References: Official Statistics Portal Lithuania. Results of the Lithuanian Health Interview Survey 2019. Data available at:
https://osp.stat.gov.lt/statistiniu-rodikliu-analize?indicator=S3R141#/. Results available at: https://osp.stat.gov.lt/lietuvos-
gyventoju-sveikata-2020/kmi. Last accessed 03.06.21.
Notes: Low = ISCED 0,1,2; Medium = ISCED 3, 4; High = ISCED 5, 6, 7, 8.
Definitions: International Standard Classification of Education
Unless otherwise noted, overweight refers to a BMI between 25kg and 29.9kg/m², obesity refers to a BMI greater than 30kg/m².
15

Men, 2019
Low education Medium education High education0
10
20
30
40
50
60
Obesity Overweight
%
Survey type: Self-reported
Age: 18+
Sample size: 5000
Area covered: National
References: Official Statistics Portal Lithuania. Results of the Lithuanian Health Interview Survey 2019. Data available at:
https://osp.stat.gov.lt/statistiniu-rodikliu-analize?indicator=S3R141#/. Results available at: https://osp.stat.gov.lt/lietuvos-
gyventoju-sveikata-2020/kmi. Last accessed 03.06.21.
Notes: Low = ISCED 0,1,2; Medium = ISCED 3, 4; High = ISCED 5, 6, 7, 8.
Definitions: International Standard Classification of Education
Unless otherwise noted, overweight refers to a BMI between 25kg and 29.9kg/m², obesity refers to a BMI greater than 30kg/m².
16

Women, 2019
Low education Medium education High education0
10
20
30
40
50
60
Obesity Overweight
%
Survey type: Self-reported
Age: 18+
Sample size: 5000
Area covered: National
References: Official Statistics Portal Lithuania. Results of the Lithuanian Health Interview Survey 2019. Data available at:
https://osp.stat.gov.lt/statistiniu-rodikliu-analize?indicator=S3R141#/. Results available at: https://osp.stat.gov.lt/lietuvos-
gyventoju-sveikata-2020/kmi. Last accessed 03.06.21.
Notes: Low = ISCED 0,1,2; Medium = ISCED 3, 4; High = ISCED 5, 6, 7, 8.
Definitions: International Standard Classification of Education
Unless otherwise noted, overweight refers to a BMI between 25kg and 29.9kg/m², obesity refers to a BMI greater than 30kg/m².
17
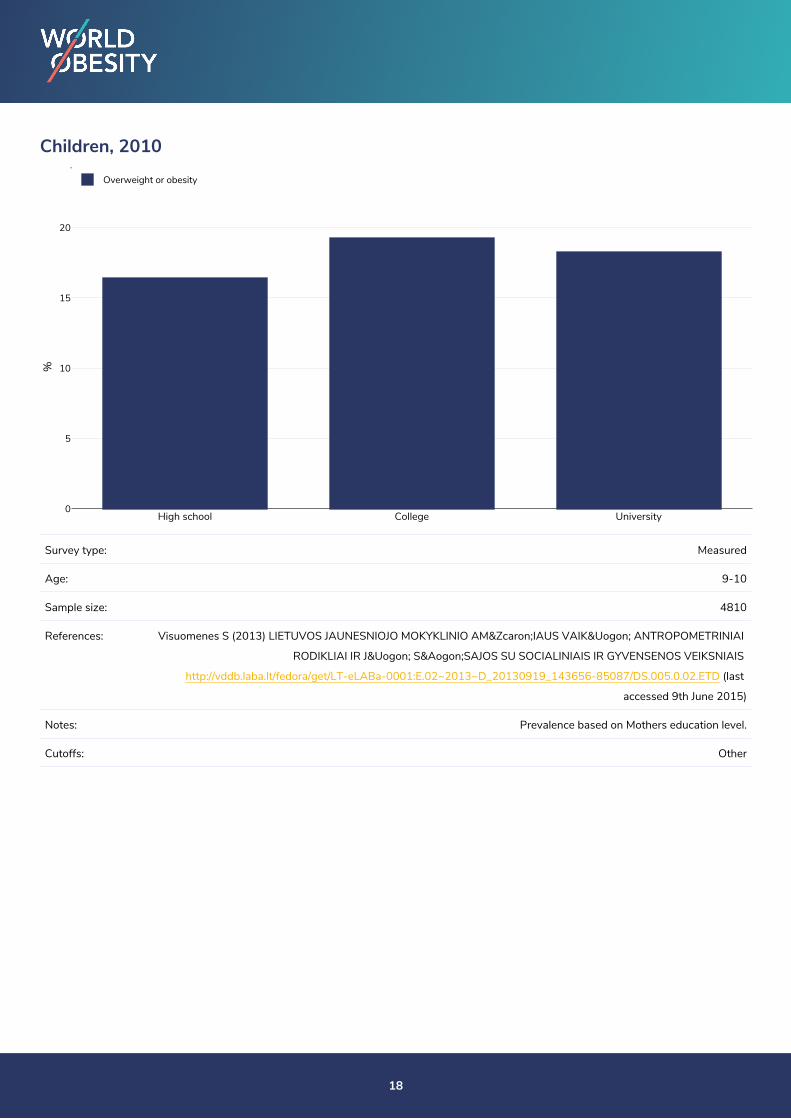
Children, 2010
High school College University0
5
10
15
20
Overweight or obesity
%
Survey type: Measured
Age: 9-10
Sample size: 4810
References: Visuomenes S (2013) LIETUVOS JAUNESNIOJO MOKYKLINIO AMŽIAUS VAIKŲ ANTROPOMETRINIAI
RODIKLIAI IR JŲ SĄSAJOS SU SOCIALINIAIS IR GYVENSENOS VEIKSNIAIS
http://vddb.laba.lt/fedora/get/LT-eLABa-0001:E.02~2013~D_20130919_143656-85087/DS.005.0.02.ETD (last
accessed 9th June 2015)
Notes: Prevalence based on Mothers education level.
Cutoffs: Other
18

Overweight/obesity by age
Adults, 2019
Adults
Men
Wom
en
Adults
Men
Wom
en
Adults
Men
Wom
en
Adults
Men
Wom
en
Adults
Men
Wom
en
Adults
Men
Wom
en
Adults
Men
Wom
en
Age 18-24 Age 25-34 Age 35-44 Age 45-54 Age 55-64 Age 65-74 Age 75+
0
10
20
30
40
50
60
70
Obesity Overweight
%
Survey type: Self-reported
Area covered: National
References: Eurostat 2019. Available at https://appsso.eurostat.ec.europa.eu/nui/show.do?dataset=hlth_ehis_bm1i&lang=en
(last accessed 09.08.21).
Unless otherwise noted, overweight refers to a BMI between 25kg and 29.9kg/m², obesity refers to a BMI greater than 30kg/m².
19

Children, 2016
Boys Girls Boys GirlsAge 7-10 Age 11-17
0
5
10
15
20
Obesity Overweight
%
Survey type: Measured
Sample size: 262,167
Area covered: National
References: LR sveikatos apsaugos ministro (2016). VAIku SVEIKATA. Available:
http://www.hi.lt/uploads/pdf/leidiniai/Statistikos/Vaiku%20sveikata%202016.pdf. [Last accessed 27 september
2018].
Notes: Children with no obesity data (n = 24697) were subtracted from the sample total prior to calculating the obesity
prevalence from this report.
Cutoffs: Other
20

Overweight/obesity by region
Adults, 2019
Rural Urban Urban and rural0
10
20
30
40
50
60
Obesity Overweight
%
Survey type: Self-reported
Age: 18+
Sample size: 5000
Area covered: National
References: Official Statistics Portal Lithuania. Results of the Lithuanian Health Interview Survey 2019. Data available at:
https://osp.stat.gov.lt/statistiniu-rodikliu-analize?indicator=S3R141#/. Results available at: https://osp.stat.gov.lt/lietuvos-
gyventoju-sveikata-2020/kmi. Last accessed 03.06.21.
Unless otherwise noted, overweight refers to a BMI between 25kg and 29.9kg/m², obesity refers to a BMI greater than 30kg/m².
21
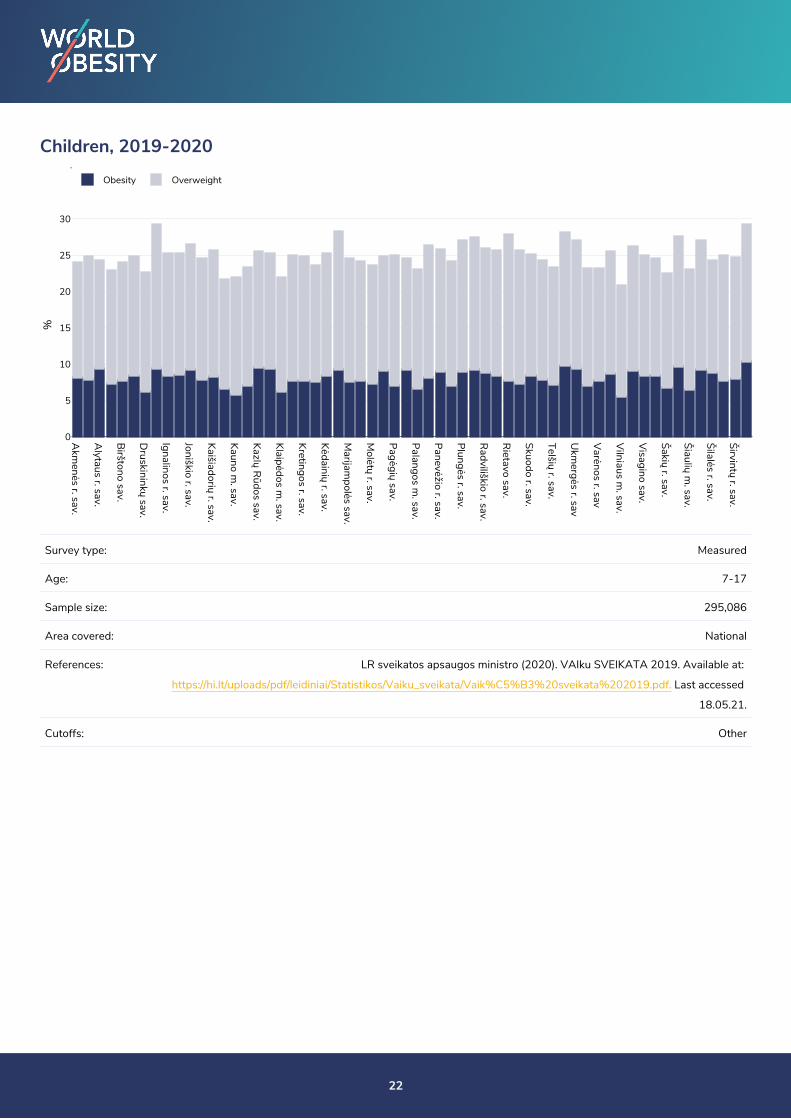
Children, 2019-2020
Akm
enės r. sav.
Alytaus r. sav.
Birštono sav.
Druskininkų sav.
Ignalinos r. sav.
Joniškio r. sav.
Kaišiadorių r. sav.
Kauno m. sav.
Kazlų Rūdos sav.
Klaipėdos m. sav.
Kretingos r. sav.
Kėdainių r. sav.
Marijam
polės sav.
Molėtų r. sav.
Pagėgių sav.
Palangos m. sav.
Panevėžio r. sav.
Plungės r. sav.
Radviliškio r. sav.
Rietavo sav.
Skuodo r. sav.
Telšių r. sav.
Ukm
ergės r. sav
Varėnos r. sav
Vilniaus m
. sav.
Visagino sav.
Šakių r. sav.
Šiaulių m. sav.
Šilalės r. sav.
Širvintų r. sav.
0
5
10
15
20
25
30
Obesity Overweight
%
Survey type: Measured
Age: 7-17
Sample size: 295,086
Area covered: National
References: LR sveikatos apsaugos ministro (2020). VAIku SVEIKATA 2019. Available at:
https://hi.lt/uploads/pdf/leidiniai/Statistikos/Vaiku_sveikata/Vaik%C5%B3%20sveikata%202019.pdf. Last accessed
18.05.21.
Cutoffs: Other
22

Overweight/obesity by age and region
Men, 2014
Total
Cities
Rural areas
Total
Cities
Rural areas
Towns and suburbs
Cities
Rural areas
Towns and suburbs
Cities
Rural areas
Cities
Rural areas
Towns and suburbs
Cities
Rural areas
Towns and suburbs
Cities
Rural areas
Towns and suburbs
Cities
Rural areas
Towns and suburbs
Cities
Rural areas
Age 35-44 Age 45-64 Age 18+ Age 18-24 Age 25-34 Age 45-54 Age 55-64 Age 65-74 Age 75+
0
20
40
60
80
Obesity Overweight
%
Survey type: Self-reported
Area covered: National
References: Eurostat http://appsso.eurostat.ec.europa.eu/nui/show.do?dataset=hlth_ehis_bm1u&lang=en (last accessed
25.08.20)
Unless otherwise noted, overweight refers to a BMI between 25kg and 29.9kg/m², obesity refers to a BMI greater than 30kg/m².
23

Women, 2014
Total
Cities
Rural areas
Towns and suburbs
Cities
Rural areas
Towns and suburbs
Cities
Rural areas
Towns and suburbs
Cities
Rural areas
Towns and suburbs
Cities
Rural areas
Towns and suburbs
Cities
Rural areas
Towns and suburbs
Cities
Rural areas
Towns and suburbs
Cities
Rural areas
Towns and suburbs
Cities
Rural areas
Towns and suburbs
Age 25-34 Age 18+ Age 35-44 Age 45-54 Age 45-64 Age 55-64 Age 65-74 Age 75+ Age 18-24
0
20
40
60
80
Obesity Overweight
%
Survey type: Self-reported
Area covered: National
References: Eurostat http://appsso.eurostat.ec.europa.eu/nui/show.do?dataset=hlth_ehis_bm1u&lang=en (last accessed
25.08.20)
Unless otherwise noted, overweight refers to a BMI between 25kg and 29.9kg/m², obesity refers to a BMI greater than 30kg/m².
24

Overweight/obesity by age and socio-economic group
Adults, 2019
1st income quintile
2nd income quintile
3rd income quintile
4th income quintile
5th income quintile
1st income quintile
2nd income quintile
3rd income quintile
4th income quintile
5th income quintile
1st income quintile
2nd income quintile
3rd income quintile
4th income quintile
5th income quintile
1st income quintile
2nd income quintile
3rd income quintile
4th income quintile
5th income quintile
Age 18-24 Age 25-34 Age 45-54 Age 55-64
0
20
40
60
80
Obesity Overweight
%
Survey type: Self-reported
Area covered: National
References: Eurostat 2019. Available at https://appsso.eurostat.ec.europa.eu/nui/show.do?dataset=hlth_ehis_bm1i&lang=en
(last accessed 09.08.21).
Notes: NB. Some age ranges missing due to insufficient data to display by age & income quintile
Unless otherwise noted, overweight refers to a BMI between 25kg and 29.9kg/m², obesity refers to a BMI greater than 30kg/m².
25

Women, 2019
1st income quintile
2nd income quintile
3rd income quintile
4th income quintile
5th income quintile
1st income quintile
2nd income quintile
3rd income quintile
4th income quintile
5th income quintile
1st income quintile
2nd income quintile
3rd income quintile
4th income quintile
5th income quintile
Age 18-24 Age 45-54 Age 55-64
0
20
40
60
80
Obesity Overweight
%
Survey type: Self-reported
Area covered: National
References: Eurostat 2019. Available at https://appsso.eurostat.ec.europa.eu/nui/show.do?dataset=hlth_ehis_bm1i&lang=en
(last accessed 09.08.21).
Notes: NB. Some age ranges missing due to insufficient data to display by age & income quintile
Unless otherwise noted, overweight refers to a BMI between 25kg and 29.9kg/m², obesity refers to a BMI greater than 30kg/m².
26

Men, 2019
1st income quintile
2nd income quintile
3rd income quintile
4th income quintile
5th income quintile
1st income quintile
2nd income quintile
3rd income quintile
4th income quintile
5th income quintile
Age 45-54 Age 55-64
0
20
40
60
80
Obesity Overweight
%
Survey type: Self-reported
Area covered: National
References: Eurostat 2019. Available at https://appsso.eurostat.ec.europa.eu/nui/show.do?dataset=hlth_ehis_bm1i&lang=en
(last accessed 09.08.21).
Notes: NB. Some age ranges missing due to insufficient data to display by age & income quintile
Unless otherwise noted, overweight refers to a BMI between 25kg and 29.9kg/m², obesity refers to a BMI greater than 30kg/m².
27
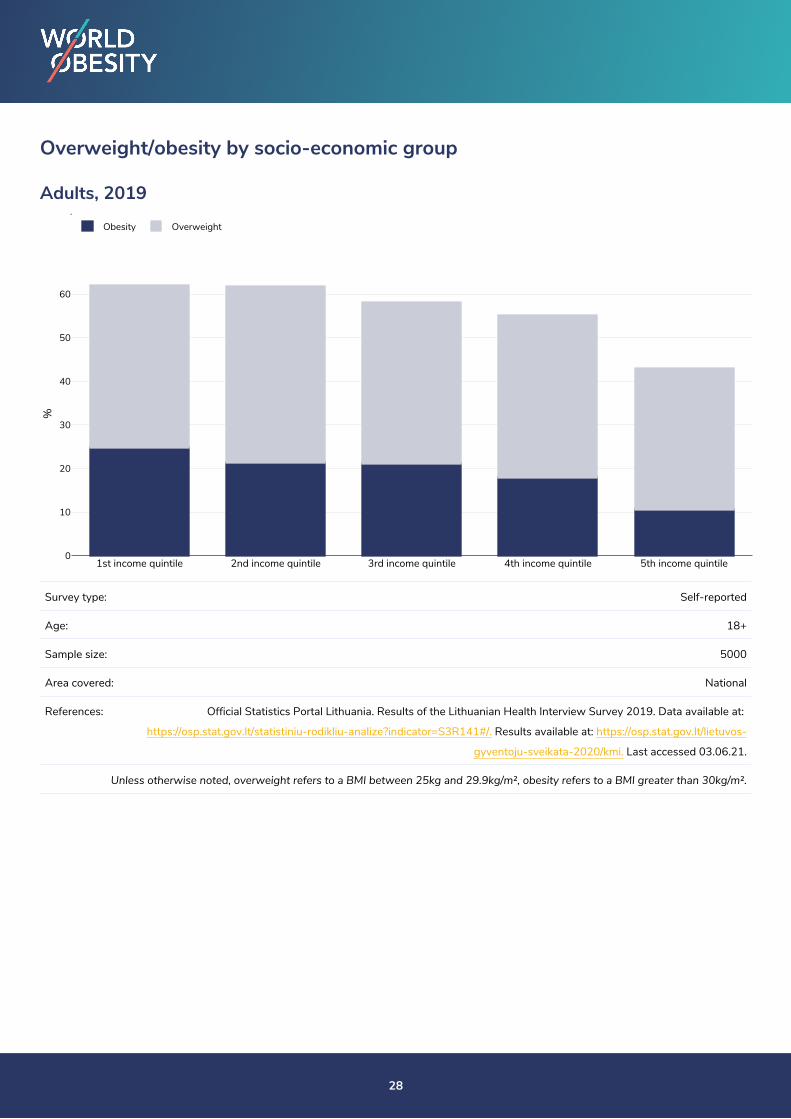
Overweight/obesity by socio-economic group
Adults, 2019
1st income quintile 2nd income quintile 3rd income quintile 4th income quintile 5th income quintile0
10
20
30
40
50
60
Obesity Overweight
%
Survey type: Self-reported
Age: 18+
Sample size: 5000
Area covered: National
References: Official Statistics Portal Lithuania. Results of the Lithuanian Health Interview Survey 2019. Data available at:
https://osp.stat.gov.lt/statistiniu-rodikliu-analize?indicator=S3R141#/. Results available at: https://osp.stat.gov.lt/lietuvos-
gyventoju-sveikata-2020/kmi. Last accessed 03.06.21.
Unless otherwise noted, overweight refers to a BMI between 25kg and 29.9kg/m², obesity refers to a BMI greater than 30kg/m².
28

Men, 2019
1st income quintile 2nd income quintile 3rd income quintile 4th income quintile 5th income quintile0
10
20
30
40
50
60
Obesity Overweight
%
Survey type: Self-reported
Age: 18+
Sample size: 5000
Area covered: National
References: Official Statistics Portal Lithuania. Results of the Lithuanian Health Interview Survey 2019. Data available at:
https://osp.stat.gov.lt/statistiniu-rodikliu-analize?indicator=S3R141#/. Results available at: https://osp.stat.gov.lt/lietuvos-
gyventoju-sveikata-2020/kmi. Last accessed 03.06.21.
Unless otherwise noted, overweight refers to a BMI between 25kg and 29.9kg/m², obesity refers to a BMI greater than 30kg/m².
29

Women, 2019
1st income quintile 2nd income quintile 3rd income quintile 4th income quintile 5th income quintile0
10
20
30
40
50
60
Obesity Overweight
%
Survey type: Self-reported
Age: 18+
Sample size: 5000
Area covered: National
References: Official Statistics Portal Lithuania. Results of the Lithuanian Health Interview Survey 2019. Data available at:
https://osp.stat.gov.lt/statistiniu-rodikliu-analize?indicator=S3R141#/. Results available at: https://osp.stat.gov.lt/lietuvos-
gyventoju-sveikata-2020/kmi. Last accessed 03.06.21.
Unless otherwise noted, overweight refers to a BMI between 25kg and 29.9kg/m², obesity refers to a BMI greater than 30kg/m².
30

Boys, 2017-2018
High FAS Low FAS0
5
10
15
20
25
Overweight or obesity
%
Survey type: Self-reported
Age: 11-15
Sample size: 3781
Area covered: National
References: World Health Organization (2020). Spotlight on adolescent health and well-being - Findings from the 2017/2018 Health
Behaviour in School-aged Children (HBSC) survey in Europe and Canada. Available at:
https://apps.who.int/iris/bitstream/handle/10665/332091/9789289055000-eng.pdf. Last accessed: 20.05.21.
Notes: HBSC Family Affluence Scale (FAS) - "HBSC uses an alternative measure, the Family Affluence Scale, which asks young
people about material assets such as family cars, number of foreign holidays, computers, bathrooms and dishwashers in
the household, holidays and having a bedroom to oneself. The scale, which enables users to add up how many of these
assets a young person has in their home compared with other adolescents in their country/region, has been shown to
provide a valid indicator of relative affluence."
Definitions: HBSC Family Affluence Scale (FAS)
Cutoffs: WHO
31

Girls, 2017-2018
High FAS Low FAS0
2
4
6
8
10
12
14
16
18
Overweight or obesity
%
Survey type: Self-reported
Age: 11-15
Sample size: 3781
Area covered: National
References: World Health Organization (2020). Spotlight on adolescent health and well-being - Findings from the 2017/2018 Health
Behaviour in School-aged Children (HBSC) survey in Europe and Canada. Available at:
https://apps.who.int/iris/bitstream/handle/10665/332091/9789289055000-eng.pdf. Last accessed: 20.05.21.
Notes: HBSC Family Affluence Scale (FAS) - "HBSC uses an alternative measure, the Family Affluence Scale, which asks young
people about material assets such as family cars, number of foreign holidays, computers, bathrooms and dishwashers in
the household, holidays and having a bedroom to oneself. The scale, which enables users to add up how many of these
assets a young person has in their home compared with other adolescents in their country/region, has been shown to
provide a valid indicator of relative affluence."
Definitions: HBSC Family Affluence Scale (FAS)
Cutoffs: WHO
32

Overweight/obesity by age and limited activity
Adults, 2014
No Lim
ited Activity
Limited A
ctivity Moderate
No Lim
ited Activity
Limited A
ctivity Moderate
No Lim
ited Activity
Limited A
ctivity Moderate
Limited A
ctivity Severe
No Lim
ited Activity
Limited A
ctivity Moderate
Limited A
ctivity Severe
No Lim
ited Activity
Limited A
ctivity Moderate
Limited A
ctivity Severe
Age 25-34 Age 35-44 Age 45-54 Age 55-64 Age 65-74
0
20
40
60
80
Obesity Overweight
%
Survey type: Self-reported
Area covered: National
References: Eurostat 2014 available at https://appsso.eurostat.ec.europa.eu/nui/submitViewTableAction.do (last accessed
06.10.21)
Unless otherwise noted, overweight refers to a BMI between 25kg and 29.9kg/m², obesity refers to a BMI greater than 30kg/m².
33

Men, 2014
No Lim
ited Activity
No Lim
ited Activity
Limited A
ctivity Moderate
No Lim
ited Activity
Limited A
ctivity Moderate
No Lim
ited Activity
Limited A
ctivity Moderate
Limited A
ctivity Severe
No Lim
ited Activity
Limited A
ctivity Moderate
Limited A
ctivity Severe
Age 25-34 Age 35-44 Age 45-54 Age 55-64 Age 65-74
0
20
40
60
80
Obesity Overweight
%
Survey type: Self-reported
Area covered: National
References: Eurostat 2014 available at https://appsso.eurostat.ec.europa.eu/nui/submitViewTableAction.do (last accessed
06.10.21)
Unless otherwise noted, overweight refers to a BMI between 25kg and 29.9kg/m², obesity refers to a BMI greater than 30kg/m².
34

Women, 2014
No Lim
ited Activity
Limited A
ctivity Moderate
No Lim
ited Activity
Limited A
ctivity Moderate
No Lim
ited Activity
Limited A
ctivity Moderate
Limited A
ctivity Severe
No Lim
ited Activity
Limited A
ctivity Moderate
Limited A
ctivity Severe
No Lim
ited Activity
Limited A
ctivity Moderate
Limited A
ctivity Severe
Age 25-34 Age 35-44 Age 45-54 Age 55-64 Age 65-74
0
20
40
60
80
Obesity Overweight
%
Survey type: Self-reported
Area covered: National
References: Eurostat 2014 available at https://appsso.eurostat.ec.europa.eu/nui/submitViewTableAction.do (last accessed
06.10.21)
Unless otherwise noted, overweight refers to a BMI between 25kg and 29.9kg/m², obesity refers to a BMI greater than 30kg/m².
35

Insufficient physical activity
Adults, 2016
Finland
Sweden
Lithuania
Spain
Netherlands
Luxembourg
Denm
ark
France
Latvia
Austria
Croatia
Czechia
Estonia
Slovenia
Poland
Ireland
Slovakia
Rom
ania
Belgium
United Kingdom
Greece
Hungary
Bulgaria
Italy
Malta
Germ
any
Portugal
Cyprus
0
5
10
15
20
25
30
35
40
45
% in
suffi
cien
t phy
sica
l act
ivity
References: Guthold R, Stevens GA, Riley LM, Bull FC. Worldwide trends in insufficient physical activity from 2001 to 2016: a pooled
analysis of 358 population-based surveys with 1.9 million participants. Lancet 2018 http://dx.doi.org/10.1016/S2214-
109X(18)30357-7
36

Men, 2016
Finland
Sweden
Spain
Lithuania
France
Netherlands
Latvia
Denm
ark
Croatia
Austria
Luxembourg
Slovenia
Czechia
Ireland
Estonia
Belgium
Slovakia
Poland
United Kingdom
Rom
ania
Hungary
Greece
Bulgaria
Italy
Malta
Portugal
Cyprus
Germ
any
0
5
10
15
20
25
30
35
40
% in
suffi
cien
t phy
sica
l act
ivity
References: Guthold R, Stevens GA, Riley LM, Bull FC. Worldwide trends in insufficient physical activity from 2001 to 2016: a pooled
analysis of 358 population-based surveys with 1.9 million participants. Lancet 2018 http://dx.doi.org/10.1016/S2214-
109X(18)30357-7
37

Women, 2016
Finland
Sweden
Netherlands
Lithuania
Luxembourg
Spain
Denm
ark
Latvia
Poland
Austria
Czechia
France
Estonia
Croatia
Slovenia
Ireland
Rom
ania
Slovakia
United Kingdom
Belgium
Greece
Bulgaria
Hungary
Germ
any
Italy
Malta
Portugal
Cyprus
0
10
20
30
40
50
% in
suffi
cien
t phy
sica
l act
ivity
References: Guthold R, Stevens GA, Riley LM, Bull FC. Worldwide trends in insufficient physical activity from 2001 to 2016: a pooled
analysis of 358 population-based surveys with 1.9 million participants. Lancet 2018 http://dx.doi.org/10.1016/S2214-
109X(18)30357-7
38
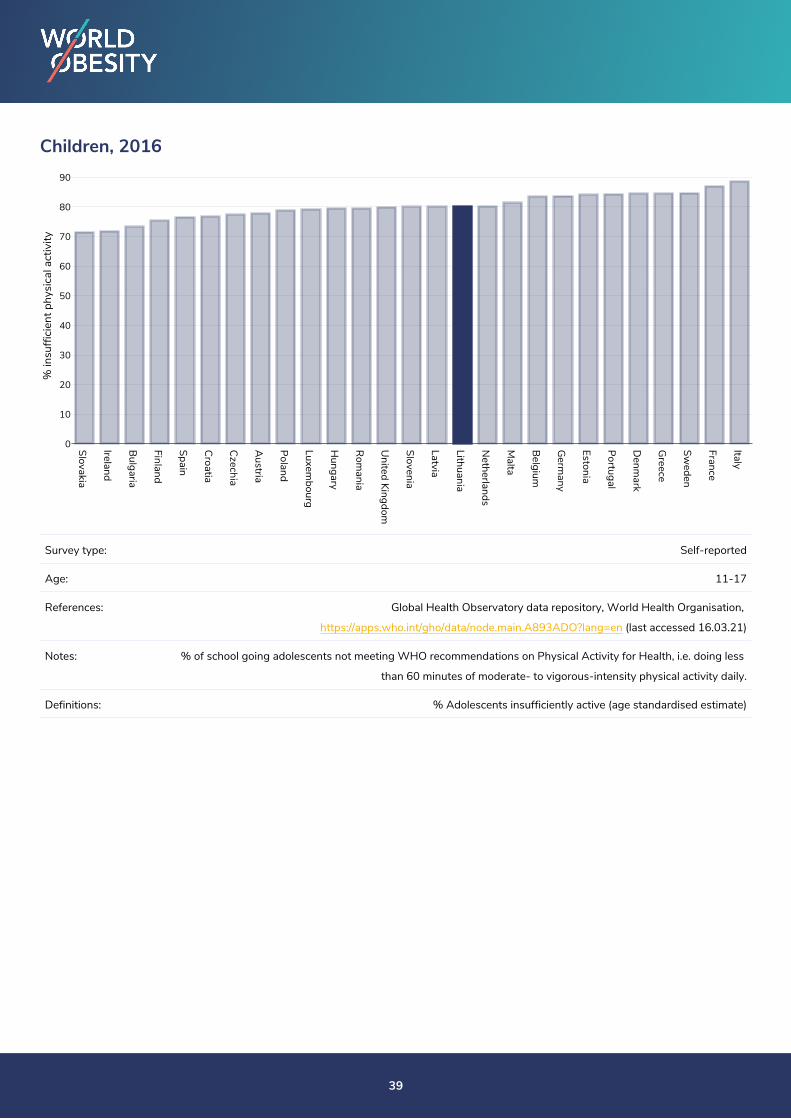
Children, 2016
Slovakia
Ireland
Bulgaria
Finland
Spain
Croatia
Czechia
Austria
Poland
Luxembourg
Hungary
Rom
ania
United Kingdom
Slovenia
Latvia
Lithuania
Netherlands
Malta
Belgium
Germ
any
Estonia
Portugal
Denm
ark
Greece
Sweden
France
Italy
0
10
20
30
40
50
60
70
80
90
% in
suffi
cien
t phy
sica
l act
ivity
Survey type: Self-reported
Age: 11-17
References: Global Health Observatory data repository, World Health Organisation,
https://apps.who.int/gho/data/node.main.A893ADO?lang=en (last accessed 16.03.21)
Notes: % of school going adolescents not meeting WHO recommendations on Physical Activity for Health, i.e. doing less
than 60 minutes of moderate- to vigorous-intensity physical activity daily.
Definitions: % Adolescents insufficiently active (age standardised estimate)
39

Boys, 2016
Ireland
Slovakia
Bulgaria
Finland
Spain
Croatia
Austria
Rom
ania
Czechia
Luxembourg
Hungary
Poland
United Kingdom
Slovenia
Lithuania
Latvia
Netherlands
Malta
Portugal
Belgium
Germ
any
Greece
Estonia
Denm
ark
Sweden
France
Italy
0
10
20
30
40
50
60
70
80
90
% in
suffi
cien
t phy
sica
l act
ivity
Survey type: Self-reported
Age: 11-17
References: Global Health Observatory data repository, World Health Organisation,
https://apps.who.int/gho/data/node.main.A893ADO?lang=en (last accessed 16.03.21)
Notes: % of school going adolescents not meeting WHO recommendations on Physical Activity for Health, i.e. doing less
than 60 minutes of moderate- to vigorous-intensity physical activity daily.
Definitions: % Adolescents insufficiently active (age standardised estimate)
40
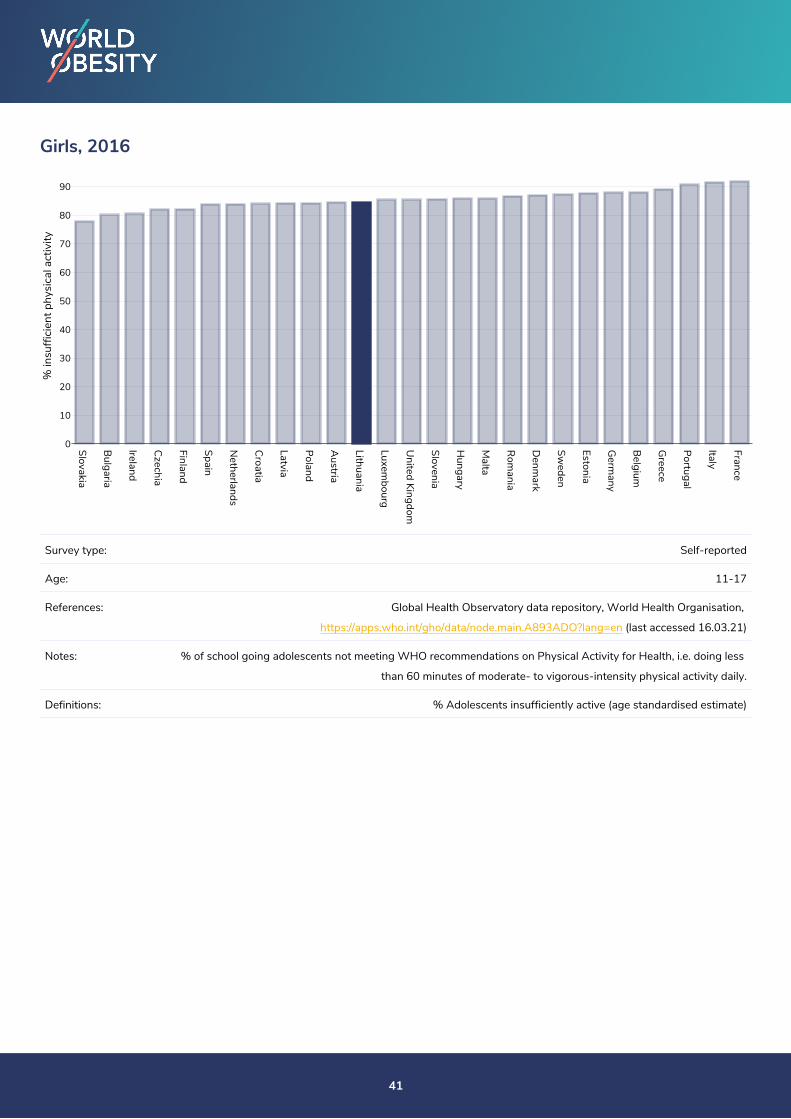
Girls, 2016
Slovakia
Bulgaria
Ireland
Czechia
Finland
Spain
Netherlands
Croatia
Latvia
Poland
Austria
Lithuania
Luxembourg
United Kingdom
Slovenia
Hungary
Malta
Rom
ania
Denm
ark
Sweden
Estonia
Germ
any
Belgium
Greece
Portugal
Italy
France
0
10
20
30
40
50
60
70
80
90
% in
suffi
cien
t phy
sica
l act
ivity
Survey type: Self-reported
Age: 11-17
References: Global Health Observatory data repository, World Health Organisation,
https://apps.who.int/gho/data/node.main.A893ADO?lang=en (last accessed 16.03.21)
Notes: % of school going adolescents not meeting WHO recommendations on Physical Activity for Health, i.e. doing less
than 60 minutes of moderate- to vigorous-intensity physical activity daily.
Definitions: % Adolescents insufficiently active (age standardised estimate)
41

Sugar consumption
Adults, 2016
FinlandNetherlands
Germany
Denmark
SwedenSpain
Portugal
FranceAustria
United Kingdom
IrelandBelgium
ItalyRomania
SloveniaCzechia
BulgariaPoland
SlovakiaGreece
CroatiaHungary
EstoniaLithuania
Latvia
0
2
4
6
8
10
Num
ber o
f por
tions
References: Source: Euromonitor International
Definitions: Sugar consumption (Number of 500g sugar portions/person/month)
42

Estimated per capita sugar sweetened beverages intake
Adults, 2016
LatviaLithuania
SloveniaEstonia
FinlandSweden
GreeceRomania
Denmark
CroatiaUnited Kingdom
Netherlands
IrelandSlovakia
Portugal
CzechiaPoland
BulgariaHungary
AustriaFrance
ItalySpain
BelgiumGermany
0
10
20
30
40
50
60
70
Num
ber o
f por
tions
References: Source: Euromonitor International
43

Prevalence of at least daily carbonated soft drink consumption
Children, 2014
FinlandEstonia
SwedenDenmark
GreeceLatvia
SloveniaLithuania
IrelandItaly
CzechiaUnited Kingdom
AustriaPortugal
SpainGermany
PolandCroatia
SlovakiaRomania
FranceHungary
BulgariaLuxembourg
Netherlands
Malta0
5
10
15
20
25
30
35
40
%
Survey type: Measured
References: World Health Organization. (2017). Adolescent obesity and related behaviours: Trends and inequalities in the who
european region, 2002-2014: observations from the Health Behavior in School-aged Children (HBSC) WHO collaborative
cross-national study (J. Inchley, D. Currie, J. Jewel, J. Breda, & V. Barnekow, Eds.). World Health Organization. Sourced from
Food Systems Dashboard http://www.foodsystemsdashboard.org
Notes: 15-year-old adolescents
Definitions: Prevalence of at least daily carbonated soft drink consumption (% of at least daily carbonated soft drink consumption)
44

Prevalence of confectionery consumption
Adults, 2016
Romania
Portugal
GreeceItaly
BulgariaHungary
SpainCroatia
PolandLithuania
LatviaCzechia
SloveniaFrance
SlovakiaBelgium
EstoniaDenmark
Netherlands
SwedenFinland
United Kingdom
AustriaIreland
Germany
0
5
10
15
20
Num
ber o
f por
tions
References: Source: Euromonitor International
Definitions: Prevalence of confectionery consumption (Number of 50g confectionery portions/person/month)
45

Prevalence of sweet/savoury snack consumption
Adults, 2016
BulgariaLatvia
Lithuania
Portugal
Hungary
ItalyEstonia
GreeceRomania
SloveniaPoland
CroatiaCzechia
FranceGermany
AustriaDenmark
SlovakiaBelgium
FinlandSweden
Netherlands
SpainUnited Kingdom
Ireland
0
5
10
15
20
Num
ber o
f por
tions
References: Source: Euromonitor International
Definitions: Prevalence of sweet/savoury snack consumption (Number of 35g sweet/savoury snack portions/person/month)
46

Estimated per capita fruit intake
Adults, 2017
Bulgaria
Latvia
Poland
Slovakia
Hungary
Czechia
Lithuania
Rom
ania
Estonia
Germ
any
Belgium
Finland
United Kingdom
Cyprus
Malta
France
Croatia
Portugal
Sweden
Netherlands
Spain
Slovenia
Ireland
Austria
Denm
ark
Italy
Greece
Luxembourg
0
50
100
150
200
g/da
y
Survey type: Measured
Age: 25+
References: Global Burden of Disease, the Institute for Health Metrics and Evaluation http://ghdx.healthdata.org/
Definitions: Estimated per-capita fruit intake (g/day)
47

Prevalence of less than daily fruit consumption
Children, 2014
Finland
Latvia
Sweden
Estonia
Lithuania
Greece
Poland
Netherlands
Hungary
Slovakia
Spain
France
Croatia
Bulgaria
Czechia
Italy
Malta
Germ
any
United Kingdom
Rom
ania
Luxembourg
Slovenia
Portugal
Ireland
Denm
ark
Austria
0
10
20
30
40
Age 12-17 Age 15
% <
dai
ly c
onsu
mpt
ion
Survey type: Measured
References: Global School-based Student Health Surveys. Beal et al (2019). Global Patterns of Adolescent Fruit, Vegetable,
Carbonated Soft Drink, and Fast-food consumption: A meta-analysis of global school-based student health surveys. Food
and Nutrition Bulletin. https://doi.org/10.1177/0379572119848287. Sourced from Food Systems Dashboard
http://www.foodsystemsdashboard.org/food-system
Definitions: Prevalence of less-than-daily fruit consumption (% less-than-daily fruit consumption)
48

Prevalence of less than daily vegetable consumption
Children, 2014
Spain
Estonia
Germ
any
Latvia
Italy
Slovakia
Slovenia
Czechia
Finland
Portugal
Croatia
Poland
Austria
Malta
Hungary
Lithuania
Greece
Luxembourg
Rom
ania
Sweden
France
Bulgaria
United Kingdom
Denm
ark
Ireland
Netherlands
0
10
20
30
40
% <
dai
ly c
onsu
mpt
ion
Survey type: Measured
Age: 12-17
References: Beal et al. (2019). Global Patterns of Adolescent Fruit, Vegetable, Carbonated Soft Drink, and Fast-food consumption: A
meta-analysis of global school-based student health surveys. Food and Nutrition Bulletin.
https://doi.org/10.1177/0379572119848287 sourced from Food Systems Dashboard
http://www.foodsystemsdashboard.org/food-system
Definitions: Prevalence of less-than-daily vegetable consumption (% less-than-daily vegetable consumption)
49

Estimated per-capita processed meat intake
Adults, 2017
Croatia
Portugal
Greece
Poland
Cyprus
Hungary
Rom
ania
Austria
Czechia
Bulgaria
Slovakia
Slovenia
Ireland
Malta
Finland
Spain
Belgium
France
Italy
Denm
ark
Netherlands
Estonia
Luxembourg
Latvia
Germ
any
Lithuania
United Kingdom
Sweden
0
5
10
15
20
g/da
y
Survey type: Measured
Age: 25+
References: Global Burden of Disease, the Institute for Health Metrics and Evaluation http://ghdx.healthdata.org/
Definitions: Estimated per-capita processed meat intake (g per day)
50

Estimated per capita whole grains intake
Adults, 2017
Italy
Malta
Greece
France
Cyprus
Denm
ark
Latvia
Bulgaria
United Kingdom
Hungary
Portugal
Slovakia
Sweden
Belgium
Croatia
Poland
Finland
Lithuania
Spain
Netherlands
Estonia
Rom
ania
Luxembourg
Slovenia
Germ
any
Austria
Czechia
Ireland
0
5
10
15
20
25
30
35
40
45
g/da
y
Survey type: Measured
Age: 25+
References: Global Burden of Disease, the Institute for Health Metrics and Evaluation http://ghdx.healthdata.org/
Definitions: Estimated per-capita whole grains intake (g/day)
51

Mental health - depression disorders
Adults, 2015
United Kingdom
Netherlands
Belgium
France
Ireland
Latvia
Sweden
Denm
ark
Luxembourg
Rom
ania
Austria
Croatia
Cyprus
Hungary
Italy
Malta
Poland
Slovakia
Slovenia
Bulgaria
Czechia
Germ
any
Spain
Finland
Lithuania
Greece
Portugal
Estonia
0
1
2
3
4
5
6
% o
f pop
ulat
ion
References: Prevalence data from Global Burden of Disease study 2015 (http://ghdx.healthdata.org) published in: Depression and
Other Common Mental Disorders: Global Health Estimates. Geneva:World Health Organization; 2017. Licence: CC BY-
NC-SA 3.0 IGO.
Definitions: % of population with depression disorders
52

Mental health - anxiety disorders
Adults, 2015
Estonia
Finland
Latvia
Lithuania
Rom
ania
Croatia
Czechia
Slovenia
Hungary
Poland
Slovakia
Bulgaria
Spain
United Kingdom
Belgium
Sweden
Austria
Denm
ark
Greece
Luxembourg
Malta
Portugal
Italy
Cyprus
Germ
any
France
Ireland
Netherlands
0
1
2
3
4
5
6
% o
f pop
ulat
ion
References: Prevalence data from Global Burden of Disease study 2015 (http://ghdx.healthdata.org) published in: Depression and
Other Common Mental Disorders: Global Health Estimates. Geneva:World Health Organization; 2017. Licence: CC BY-
NC-SA 3.0 IGO.
Definitions: % of population with anxiety disorders
53

Oesophageal cancer
Men, 2018
Cyprus
Greece
Italy
Bulgaria
Malta
Finland
Rom
ania
Sweden
Spain
Croatia
Poland
Austria
Slovenia
Estonia
Luxembourg
Czechia
France
Germ
any
Portugal
Belgium
Ireland
Slovakia
Hungary
Denm
ark
Latvia
Lithuania
United Kingdom
Netherlands
0
2
4
6
8
10
12
14
16
18
Inci
denc
e pe
r 100
,000
Age: 20+
References: Global Cancer Observatory, Cancer incidence rates http://gco.iarc.fr/ (last accessed 30th June 2020)
Definitions: Estimated age-standardized incidence rates (World) in 2018, oesophagus, adults ages 20+. ASR (World) per
100,000
54

Women, 2018
Greece
Portugal
Bulgaria
Rom
ania
Italy
Latvia
Malta
Cyprus
Estonia
Slovakia
Spain
Lithuania
Croatia
Poland
Slovenia
Austria
Sweden
Finland
Hungary
Czechia
Luxembourg
France
Germ
any
Belgium
Denm
ark
Netherlands
Ireland
United Kingdom
0
1
2
3
4
5
6
Inci
denc
e pe
r 100
,000
Age: 20+
References: Global Cancer Observatory, Cancer incidence rates http://gco.iarc.fr/ (last accessed 30th June 2020)
Definitions: Estimated age-standardized incidence rates (World) in 2018, oesophagus, adults ages 20+. ASR (World) per
100,000
55

Breast cancer
Women, 2018
Rom
ania
Poland
Bulgaria
Slovakia
Lithuania
Estonia
Latvia
Slovenia
Croatia
Greece
Czechia
Portugal
Austria
Spain
Cyprus
Germ
any
Hungary
Malta
Denm
ark
Finland
Sweden
Ireland
Italy
United Kingdom
France
Netherlands
Luxembourg
Belgium
0
50
100
150
Inci
denc
e pe
r 100
,000
Age: 20+
References: Global Cancer Observatory, Cancer incidence rates http://gco.iarc.fr/ (last accessed 30th June 2020)
Definitions: Estimated age-standardized incidence rates (World) in 2018, breast, females, ages 20+. ASR (World) per
100,000
56

Colorectal cancer
Men, 2018
Austria
Finland
Sweden
Germ
any
Luxembourg
Greece
Cyprus
Estonia
Lithuania
Malta
Italy
Rom
ania
France
United Kingdom
Bulgaria
Poland
Ireland
Czechia
Latvia
Belgium
Netherlands
Spain
Denm
ark
Croatia
Portugal
Slovenia
Slovakia
Hungary
0
20
40
60
80
100
120
Inci
denc
e pe
r 100
,000
Age: 20+
References: Global Cancer Observatory, Cancer incidence rates http://gco.iarc.fr/ (last accessed 30th June 2020)
Definitions: Estimated age-standardized incidence rates (World) in 2018, colorectum, adults, ages 20+. ASR (World) per
100,000
57

Women, 2018
Cyprus
Austria
Rom
ania
Bulgaria
Greece
Finland
Germ
any
Lithuania
Poland
Malta
Spain
Sweden
Italy
Czechia
France
Croatia
Luxembourg
Slovenia
Estonia
Ireland
United Kingdom
Latvia
Belgium
Portugal
Netherlands
Slovakia
Denm
ark
Hungary
0
10
20
30
40
50
60
Inci
denc
e pe
r 100
,000
Age: 20+
References: Global Cancer Observatory, Cancer incidence rates http://gco.iarc.fr/ (last accessed 30th June 2020)
Definitions: Estimated age-standardized incidence rates (World) in 2018, colorectum, adults, ages 20+. ASR (World) per
100,000
58

Pancreatic cancer
Men, 2018
Ireland
Netherlands
Cyprus
Portugal
United Kingdom
Spain
Denm
ark
Italy
Sweden
Poland
Finland
Luxembourg
Germ
any
Greece
Austria
Rom
ania
Belgium
Malta
Lithuania
Slovenia
Croatia
France
Czechia
Bulgaria
Slovakia
Hungary
Estonia
Latvia
0
5
10
15
20
25
Inci
denc
e pe
r 100
,000
Age: 20+
References: Global Cancer Observatory, Cancer incidence rates http://gco.iarc.fr/ (last accessed 30th June 2020)
Definitions: Estimated age-standardized incidence rates (World) in 2018, pancreas, adults, ages 20+. ASR (World) per
100,000
59

Women, 2018
Portugal
Cyprus
Spain
Greece
Ireland
Poland
Rom
ania
Bulgaria
Estonia
Lithuania
Croatia
United Kingdom
Italy
Luxembourg
Netherlands
Slovenia
Latvia
Malta
Sweden
Denm
ark
Finland
France
Czechia
Germ
any
Slovakia
Austria
Belgium
Hungary
0
2
4
6
8
10
12
14
16
Inci
denc
e pe
r 100
,000
Age: 20+
References: Global Cancer Observatory, Cancer incidence rates http://gco.iarc.fr/ (last accessed 30th June 2020)
Definitions: Estimated age-standardized incidence rates (World) in 2018, pancreas, adults, ages 20+. ASR (World) per
100,000
60

Gallbladder cancer
Men, 2018
Malta
Latvia
Luxembourg
Bulgaria
Portugal
Finland
Lithuania
Cyprus
Denm
ark
Belgium
United Kingdom
Rom
ania
France
Sweden
Austria
Ireland
Germ
any
Greece
Estonia
Netherlands
Italy
Poland
Spain
Croatia
Czechia
Hungary
Slovenia
Slovakia
0
1
2
3
4
5
6
Inci
denc
e pe
r 100
,000
Age: 20+
References: Global Cancer Observatory, Cancer incidence rates http://gco.iarc.fr/ (last accessed 30th June 2020)
Definitions: Estimated age-standardized incidence rates (World) in 2018, gallbladder, adults, ages 20+. ASR (World) per
100,000
61
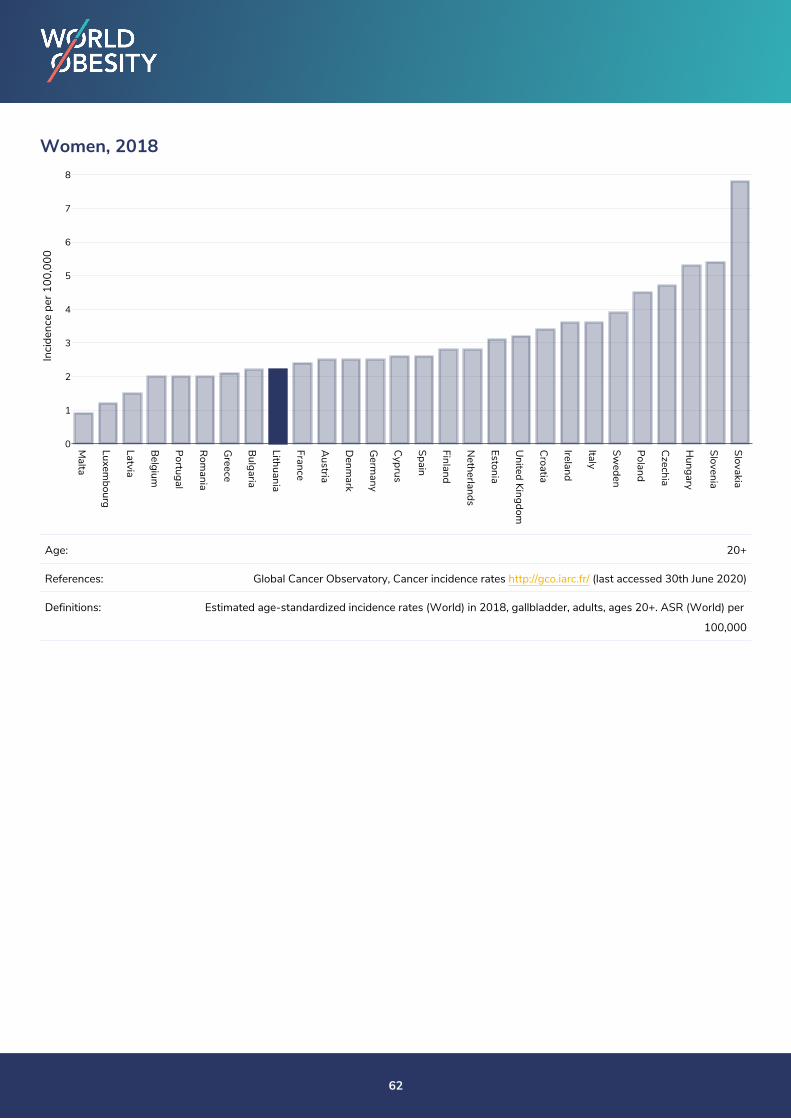
Women, 2018
Malta
Luxembourg
Latvia
Belgium
Portugal
Rom
ania
Greece
Bulgaria
Lithuania
France
Austria
Denm
ark
Germ
any
Cyprus
Spain
Finland
Netherlands
Estonia
United Kingdom
Croatia
Ireland
Italy
Sweden
Poland
Czechia
Hungary
Slovenia
Slovakia
0
1
2
3
4
5
6
7
8
Inci
denc
e pe
r 100
,000
Age: 20+
References: Global Cancer Observatory, Cancer incidence rates http://gco.iarc.fr/ (last accessed 30th June 2020)
Definitions: Estimated age-standardized incidence rates (World) in 2018, gallbladder, adults, ages 20+. ASR (World) per
100,000
62

Kidney cancer
Men, 2018
Cyprus
Rom
ania
Portugal
Sweden
Luxembourg
Austria
Bulgaria
Finland
Netherlands
Malta
Poland
Germ
any
Belgium
Italy
Denm
ark
Spain
United Kingdom
Greece
Ireland
Slovenia
Croatia
Hungary
France
Slovakia
Latvia
Lithuania
Czechia
Estonia
0
5
10
15
20
25
30
35
Inci
denc
e pe
r 100
,000
Age: 20+
References: Global Cancer Observatory, Cancer incidence rates http://gco.iarc.fr/ (last accessed 30th June 2020)
Definitions: Estimated age-standardized incidence rates (World) in 2018, kidney, adults, ages 20+. ASR (World) per 100,000
63

Women, 2018
Cyprus
Bulgaria
Portugal
Rom
ania
Greece
Spain
Sweden
Netherlands
Austria
Germ
any
Luxembourg
Slovenia
Denm
ark
Italy
Finland
Poland
Malta
Belgium
Ireland
Croatia
United Kingdom
France
Hungary
Slovakia
Czechia
Estonia
Lithuania
Latvia
0
2
4
6
8
10
12
14
16
18
Inci
denc
e pe
r 100
,000
Age: 20+
References: Global Cancer Observatory, Cancer incidence rates http://gco.iarc.fr/ (last accessed 30th June 2020)
Definitions: Estimated age-standardized incidence rates (World) in 2018, kidney, adults, ages 20+. ASR (World) per 100,000
64

Cancer of the uterus
Women, 2018
Malta
Finland
Spain
Austria
Luxembourg
Cyprus
Netherlands
France
Italy
Slovenia
Germ
any
Belgium
Croatia
Greece
United Kingdom
Portugal
Sweden
Poland
Czechia
Denm
ark
Ireland
Slovakia
Hungary
Lithuania
Rom
ania
Bulgaria
Estonia
Latvia
0
5
10
15
20
25
30
35
40
Inci
denc
e pe
r 100
,000
Age: 20+
References: Global Cancer Observatory, Cancer incidence rates http://gco.iarc.fr/ (last accessed 30th June 2020)
Definitions: Estimated age-standardized incidence rates (World) in 2018, cervix uteri, females, ages 20+. ASR (World) per
100,000
65

Raised blood pressure
Adults, 2015
United Kingdom
Belgium
Netherlands
Greece
Spain
Sweden
Finland
Malta
Ireland
Cyprus
Germ
any
Denm
ark
Austria
Italy
Luxembourg
France
Portugal
Estonia
Czechia
Bulgaria
Slovakia
Poland
Lithuania
Latvia
Hungary
Rom
ania
Slovenia
Croatia
0
5
10
15
20
25
30
% ra
ised
blo
od p
ress
ure
References: Global Health Observatory data repository, World Health Organisation,
http://apps.who.int/gho/data/node.main.A875?lang=en
Definitions: Age Standardised estimated % Raised blood pressure 2015 (SBP>=140 OR DBP>=90).
66

Men, 2015
United Kingdom
Belgium
Greece
Ireland
Netherlands
Spain
Cyprus
Finland
Sweden
Germ
any
Malta
Austria
Italy
Denm
ark
France
Luxembourg
Portugal
Bulgaria
Estonia
Slovakia
Czechia
Poland
Rom
ania
Slovenia
Hungary
Lithuania
Latvia
Croatia
0
5
10
15
20
25
30
35
40
% ra
ised
blo
od p
ress
ure
References: Global Health Observatory data repository, World Health Organisation,
http://apps.who.int/gho/data/node.main.A875?lang=en
Definitions: Age Standardised estimated % Raised blood pressure 2015 (SBP>=140 OR DBP>=90).
67

Women, 2015
United Kingdom
Belgium
Malta
Netherlands
Sweden
Finland
Spain
Denm
ark
Greece
Cyprus
Germ
any
Luxembourg
France
Ireland
Austria
Italy
Portugal
Estonia
Czechia
Slovakia
Latvia
Bulgaria
Poland
Lithuania
Hungary
Slovenia
Rom
ania
Croatia
0
5
10
15
20
25
% ra
ised
blo
od p
ress
ure
References: Global Health Observatory data repository, World Health Organisation,
http://apps.who.int/gho/data/node.main.A875?lang=en
Definitions: Age Standardised estimated % Raised blood pressure 2015 (SBP>=140 OR DBP>=90).
68

Raised cholesterol
Adults, 2008
Rom
ania
Greece
Croatia
Bulgaria
Sweden
Slovakia
Czechia
Lithuania
Hungary
Latvia
Portugal
Spain
Slovenia
Estonia
Cyprus
Poland
Finland
Malta
Austria
Netherlands
France
Italy
Belgium
Ireland
United Kingdom
Denm
ark
Germ
any
Luxembourg
0
10
20
30
40
50
60
70
% ra
ised
cho
lest
erol
References: Global Health Observatory data repository, World Health Organisation,
http://apps.who.int/gho/data/node.main.A885
Definitions: % Raised total cholesterol (>= 5.0 mmol/L) (age-standardized estimate).
69
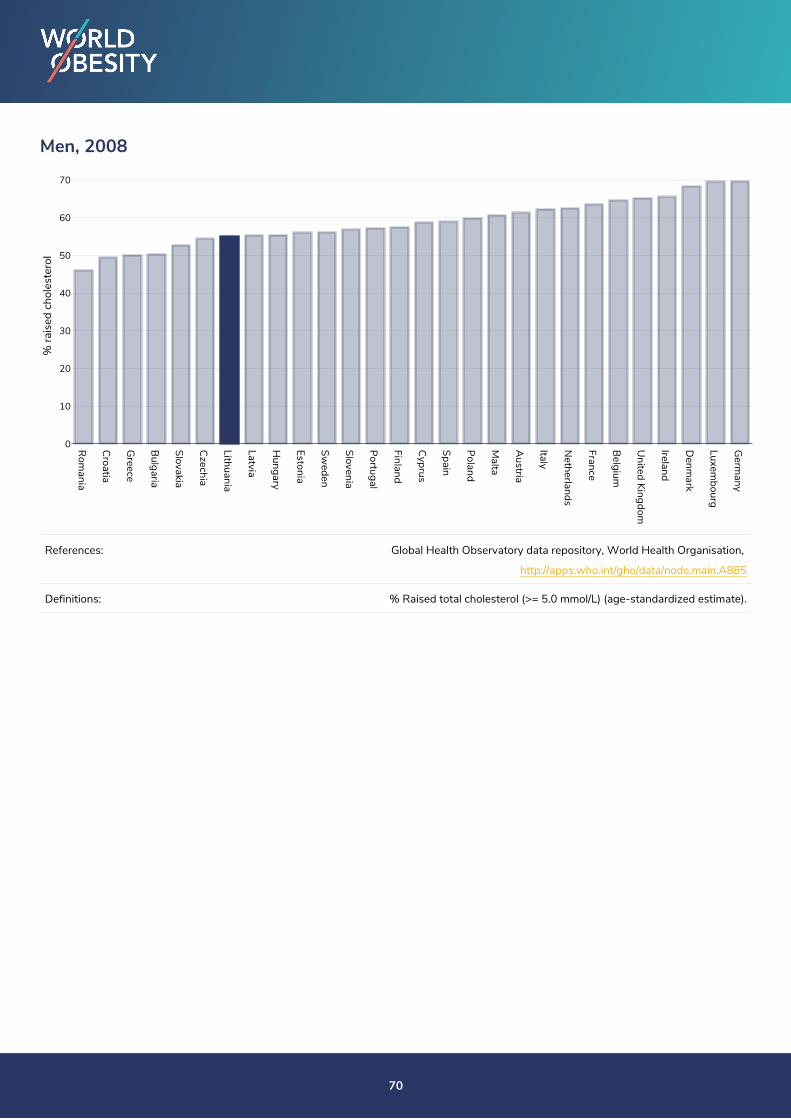
Men, 2008
Rom
ania
Croatia
Greece
Bulgaria
Slovakia
Czechia
Lithuania
Latvia
Hungary
Estonia
Sweden
Slovenia
Portugal
Finland
Cyprus
Spain
Poland
Malta
Austria
Italy
Netherlands
France
Belgium
United Kingdom
Ireland
Denm
ark
Luxembourg
Germ
any
0
10
20
30
40
50
60
70
% ra
ised
cho
lest
erol
References: Global Health Observatory data repository, World Health Organisation,
http://apps.who.int/gho/data/node.main.A885
Definitions: % Raised total cholesterol (>= 5.0 mmol/L) (age-standardized estimate).
70

Women, 2008
Rom
ania
Greece
Sweden
Bulgaria
Croatia
Slovakia
Czechia
Spain
Poland
Hungary
Lithuania
Portugal
Latvia
Slovenia
Cyprus
Estonia
Malta
Austria
Netherlands
Finland
Ireland
Belgium
France
United Kingdom
Germ
any
Italy
Denm
ark
Luxembourg
0
10
20
30
40
50
60
% ra
ised
cho
lest
erol
References: Global Health Observatory data repository, World Health Organisation,
http://apps.who.int/gho/data/node.main.A885
Definitions: % Raised total cholesterol (>= 5.0 mmol/L) (age-standardized estimate).
71

Raised fasting blood glucose
Men, 2014
Austria
Denm
ark
Belgium
Netherlands
Germ
any
Luxembourg
Sweden
Finland
France
Italy
United Kingdom
Ireland
Portugal
Cyprus
Spain
Greece
Croatia
Slovakia
Malta
Rom
ania
Estonia
Czechia
Latvia
Hungary
Bulgaria
Poland
Slovenia
Lithuania
0
1
2
3
4
5
6
7
% ra
ised
fast
ing
bloo
d gl
ucos
e
References: Global Health Observatory data repository, World Health Organisation,
http://apps.who.int/gho/data/node.main.A869?lang=en
Definitions: Age Standardised % raised fasting blood glucose (>= 7.0 mmol/L or on medication).
72

Women, 2014
Netherlands
Austria
Denm
ark
Belgium
Sweden
Germ
any
Finland
United Kingdom
Luxembourg
Italy
Greece
Ireland
Rom
ania
Slovenia
France
Estonia
Latvia
Slovakia
Cyprus
Bulgaria
Croatia
Czechia
Poland
Portugal
Spain
Hungary
Lithuania
Malta
0
1
2
3
4
5
6
7
8
9
% ra
ised
fast
ing
bloo
d gl
ucos
e
References: Global Health Observatory data repository, World Health Organisation,
http://apps.who.int/gho/data/node.main.A869?lang=en
Definitions: Age Standardised % raised fasting blood glucose (>= 7.0 mmol/L or on medication).
73

Diabetes prevalence
Adults, 2019
Ireland
Lithuania
United Kingdom
Estonia
Belgium
Greece
France
Sweden
Italy
Latvia
Luxembourg
Croatia
Netherlands
Finland
Slovenia
Bulgaria
Poland
Slovakia
Austria
Rom
ania
Hungary
Spain
Czechia
Denm
ark
Malta
Cyprus
Portugal
Germ
any
0
2
4
6
8
10
% d
iabe
tes
prev
alen
ce
Age: 20-79
References: Reproduced with kind permission International Diabetes Federation. IDF Diabetes Atlas, 9th edn. Brussels,Belgium:
2019. Available at: https://www.diabetesatlas.org
Definitions: Diabetes age-adjusted comparative prevalence (%).
PDF created on November 9, 2021
74