report by the secretariat - world trade organization - … · web viewin addition, initiatives by...
TRANSCRIPT
India WT/TPR/S/182Page 99
IV. TRADE POLICIES BY SECTOR
(1) INTRODUCTION
1. During the past five years, India's real GDP growth has averaged nearly 7% annually. Growth has been driven largely by the services sector, which accounted for almost 54% of GDP in 2005/06, up from 50% in 2000/01; wholesale and retail trade, hotels, transport, and communications were the leading subsectors. Manufacturing has grown less rapidly, although sufficient to maintain its share of GDP relatively stable at between 15% and 16%. By contrast, growth in agriculture has been very sluggish, and its share of GDP declined from around 24% to 19% during the period. Notwithstanding India's impressive overall growth rate, lack of infrastructure, particularly in transport and electricity, constitutes a major obstacle to maintaining its current growth rate, let alone achieving substantially higher growth rates that the Government is aiming for.
165. Agriculture is characterized by low labour productivity, which is about one-sixth of the level in the other sectors of the economy, with obvious implications for living standards and poverty in rural areas. The reasons for this low productivity include fragmented landholdings, a low level of mechanization and much of the cropped area dependent on rainfall for irrigation, which has made output in the sector rather variable; crop yields have also been declining, in part due to poor seed quality and overuse of land and inputs. The sector also remains subject to considerable government intervention, notably in the form of price support and input subsidies, which have become a fiscal burden, and restrictive marketing practices. Public investment in infrastructure and research has been inadequate and crowded out by spending on subsidies and, while private investment has grown in recent years, it has not been sufficient. Some efforts have been made in the period under review, especially to reduce marketing restrictions, although the government continues to monitor trade in certain sensitive commodities closely to ensure stable domestic supply and prices. With demand for essential commodities, such as cereals, declining in favour of vegetables, milk and meat, a major reorientation is required in the Government's agricultural policy, which until now has encouraged the production of cereals. However, food security remains a priority area of concern for the Government in view of the size of the population and skewed distribution of production.
166. Manufacturing growth has been rapid, at an average of almost 7% since 2000/01, in part due to continued structural change and a relaxation in industrial licensing and FDI restrictions. Its contribution to exports of goods has declined, however, from 76.5% to 69.8% of the total, while its share of total merchandise imports increased from 42.9% to 48.4% during 2000/01-2005/06. In part to meet its goal of reaching ASEAN level tariffs for non-agricultural goods, India has continued to reduce its applied MFN tariffs. As a result, the overall applied MFN tariff for manufactured goods (ISIC) fell from 32.5% in 2001/02 to 14.9% (16.8% including AVEs) in 2006/07. Despite this, tariff peaks remain, especially in automobiles, where the average tariff is 33.6%, and imports of second-hand motor vehicles over three-years old are subject to import licensing restrictions. The textiles and clothing sector remains protected by relatively high tariff barriers, a large percentage of which are non ad valorem (inclusion of ad valorem equivalents raises the average tariff for the sector to 22.5%). While exports of textiles and clothing have increased, partly due to a removal of quotas under the Agreement on Textiles and Clothing (ATC), the share of textiles and clothing exports in total merchandise exports has declined, probably due to increased competition in the global market. However, India's share in the global market for textiles and clothing has increased from 3% in 2001 to 3.7% in 2006. Information technology, which is relatively free of domestic and trade restraints, has continued to be a major contributor to India's economic growth. The sector also receives additional assistance through tax holidays provided by the software and hardware technology parks as well as the special economic zones and through priority sector lending (for software).

WT/TPR/S/182 Trade Policy ReviewPage 100
167. The services sector grew by 9.8% in 2005/06 and continues to be the key driver of economic growth; between 2002/03 and 2006/07, it contributed 68.6% of the overall average growth in GDP. Greater progress has been made in reforming services than in other parts of the economy. In banking, measures have been adopted to raise foreign investment limits and to align prudential requirements with international practice. Foreign banks have been permitted to establish wholly owned subsidiaries since 2005. Although banking and insurance continue to be dominated by state-owned companies, measures have been adopted to encourage competition from the private sector. Efforts are also being made to improve governance of banks and to prepare the sector for implementation of the Basel II capital adequacy framework, although this has been postponed. While the performance of the banking sector has improved in general, with the ratio of non-performing loans (NPLs) continuing to fall, NPLs remain high in rural banks and rural cooperatives. The performance of rural cooperatives is especially problematic as they are closely involved in extending credit to the rural sector. The Securities and Exchange Board of India (SEBI), the regulator of India's securities market, is making efforts to create a well functioning capital market. The securities exchanges are to be corporatized and all listed companies must meet corporate governance requirements specified in the listing agreement by January 2006.
168. A continued obstacle to maintaining growth is the lack of infrastructure. In some areas, notably telecommunications, much progress has been made with a significant increase in penetration, especially of mobile telephony. The result has been a corresponding decline in tariffs of domestic and international long-distance calls. In transportation, efforts are ongoing to improve rail and road transport. Although railways is one of the two sectors remaining exclusively in the public sector, private-sector participation is being encouraged in some areas, especially for the carriage of freight and the development of infrastructure through public-private partnerships (PPPs). PPPs are also being used to develop India's national highway network under an ambitious plan to upgrade the current network as well as build 1,000 kilometres of new expressways. In air transport services, greater private competition has resulted in a significant decline in prices and an increase in the number of passengers travelling to, from, and within India. Restrictions on FDI have been relaxed to 49% of total equity (100% for non-resident Indians), although foreign airlines may not invest in the sector. Less progress has been made in maritime transport where efforts to attract both private domestic and foreign investment have not been successful. Port services, on the other hand, have been improved, in part by augmenting capacity through private-public partnerships. However, electricity continues to be a major problem, with little progress being made on reducing transmission and distribution losses and addressing the considerable difficulties faced by the public sector electricity providers.
(2) AGRICULTURE
(i) Overview
169. The contribution of agriculture and allied activities to India's GDP has been declining, from almost 24% in 2000/01 to 18% in 2005/06 (Table I.2). In contrast, it accounts for almost 60% of employment, suggesting that labour productivity is about one-sixth that of the non-agricultural sector and raising concerns about poverty and living standards in the rural areas. 1 The key crops are rice, wheat, sugarcane, cotton and oilseeds. As the world's largest producer and consumer of tea, India has been making efforts to improve the productivity of its tea plantations. Horticultural crops, as well as fisheries and animal husbandry, which are estimated by the authorities to account for around 54% of the output of the sector, are expected to grow rapidly. India was the world's biggest dairy producer and second largest producer of fruit and vegetables in 2003/04, and the Tenth Five Year Plan has
1 Official employment figures, which are based on employment in the formal sector, show that agriculture employs around 5% of the total workforce. However, estimates including informal employment, show that the figure is closer to 60% (see for example, Chadha and Sharma, 2005, pp. 23-101).

India WT/TPR/S/182Page 101
aimed for horticultural growth of 8-9% per year. Demand for horticultural products is likely to be enhanced further with the opening of the retail sector to foreign investment in 2006. India's production of milk has also increased substantially, with around 91 million tonnes produced in 2004/05. A closely linked and rapidly growing activity is food processing, which, until recently, received inadequate attention.2 However, it is estimated that the food processing industry is generating around 250,000 new jobs a year3, although it is hampered by infrastructural constraints.
170. Despite increasing in value from US$6.4 billion in 2000/01 to almost US$10.8 billion in 2005/06, exports of agricultural products as a share of total merchandise exports declined from 14.1% in 2000/01 to 10.4% in 2005/06 (Table AI.3). The value of the main export, rice, increased from US$653 million to US$1.4 billion during the period. India's imports of agricultural products continue to be minimal and fell from 7.6% of total merchandise imports in 2000/01 to 4.9% in 2005/06; the largest share is accounted for by edible vegetable oil.
171. As a result of important gains in productivity in the 1960s and 1970s, mainly due to the introduction of high-yield wheat and rice varieties as well as investment in irrigation, India became self-sufficient in the production of cereals. However, since the 1980s, there has been a slowdown in growth in production and labour productivity in Indian agriculture.4 The slowdown is mainly attributed to declining public-sector investment and, while private investment in agriculture has increased in recent years, it has been mainly in niche areas such as food processing. Since 2003/04, the share of public-sector investment in agriculture has been increasing whereas private sector investment has shown a decline.5 With only around 40% of the cropped area irrigated, output remains highly dependent on rainfall and therefore varies considerably from year to year. In addition, land ownership ceiling laws as well as succession patterns have resulted in increased fragmentation of land holdings, preventing the development of scale economies and mechanization.6 Tenancy laws do not give well-defined rights to tenant farmers, who make up a significant share of agricultural producers, and therefore they lack the incentive to develop the land. Other factors of low productivity include regulation of agricultural markets and the movement of major crops, which has dissuaded the private sector in general from investing in the sector, and relatively low levels of research and development.
172. Since 2002/03, agriculture has grown at an average of less than 2%, although growth was rather erratic in part due to a drought in 2002/03. There has also been a significant change in consumption patterns: per capita cereal consumption has declined while consumption of milk, eggs, horticultural products, and meat has increased. Within cereals the pattern has been a move away from coarse grains towards consumption of rice and wheat. The pattern is evident in both urban and rural areas. In recent years, these changing patterns of consumption, accompanied by growth in production of cereals, have resulted in a surplus of grain production, and growing costs associated with maintaining stocks of wheat and rice and providing certain essential foods to the poor at low prices. The diversification of demand suggests a need for greater investment in crops other than cereals and livestock and in infrastructure to support more downstream activities, such as food processing. In this
2 Food processing now forms part of the priority sector, for which commercial banks are required to set aside part of their lending. Other incentives include zero excise duty on processed fruit and vegetables and tax holiday and other concessions (Ministry of Food Processing, 2005).
3 Business India, 10 September 2006.4 Average growth in crop yields for example declined from 2.77% per year in the 1980s to 1.72% in the
1990s (Chadha and Sharma, 2005, pp. 23-101).5 Total investment in agriculture increased from Rs 381.8 billion in 2000/01 to Rs 431.2 billion in
2004/05. The share of private investment was around 82% until 2003/04; then declined to around 71% of the total (Ministry of Finance, 2006).
6 Landholdings on average are around 1.06 hectares (in 2002/03), well below the ceilings set by state laws.

WT/TPR/S/182 Trade Policy ReviewPage 102
regard, the distinct bias in agriculture price support policies in favour of food grains in the past probably distorted cropping patterns and would need to be rectified.7
173. The Government's policy of providing key inputs at subsidized prices has also resulted in a growing subsidy bill to the detriment of public investment in infrastructure and research and development. Subsidized inputs such as fertilizer, water, and power have also, in some cases, led to overuse and problems of water-logging and salinity, as well as degradation of natural resources.8
There seems to be very little change to the basic policy of supporting producers by subsidizing inputs through direct subsidies, and output through minimum support prices, although in recent years more emphasis has been placed on infrastructure investment.
174. Stagnation in the sector has been recognized, most recently in the approach paper to the 11th Five Year Plan, which suggests that in addition to efforts to increase productivity on farms through better resource use, there is a need for diversification to higher-value-added output including horticulture and floriculture, also because of changing demand patterns. Greater emphasis is also placed on the fisheries and livestock subsectors. India's National Agricultural Policy, announced in 2000, aims to improve the post-harvest and marketing infrastructure so as to reduce the losses in agricultural output (estimated at 30-40% especially for horticultural products) that result from poor storage and processing facilities. Other plans to address the infrastructural problem include the Bharat Nirman programme, which has identified seven areas of rural infrastructure to be addressed by 2009.9
175. While addressing the problems of agriculture may be politically difficult, some effort is being made to improve processing and marketing. Since 2002, foreign direct investment has been permitted in tea plantations and, since 2006, in horticulture, animal husbandry, and food processing and retailing (Chapter II), and some nine items in the agricultural and allied industries are currently reserved for production by the small-scale sector.10 In addition, linkages between farmers and processors, for example, through contract farming, have been increasing in certain parts of the country. In its 2004/05 Budget, the Government announced a National Horticulture Mission, which aims to increase output to 300 million tonnes by 2011/2012 and to enhance exports of these products. Investment in a tea fund is also expected to be used for re-plantation of tea gardens in the country. Increasing support from the private sector is also being sought to help set up agricultural markets, marketing infrastructure, grading certification, and quality inspection. The Central Government has also circulated a model law to allow for direct marketing and contract farming arrangements for adoption by the states (see (d) below).
7 Ministry of Finance (2006).8 The Planning Commission's approach paper to the 11 th Five Year Plan, for example, notes that
semi-critical, critical, and over-exploited areas of groundwater use are increasing and already cover 29% of the blocks in the country.
9 The programme aims to create 10 million hectares of additional irrigation capacity; to connect all 66,802 habitations in the rural areas with a population above 1,000 with all weather roads; to construct 6 million houses for the rural poor; to provide potable water to 55,067 habitations and to address habitations where water quality is not good; to provide electricity to all un-electrified villages (some 125,000) and to connect 23 million households below the poverty line; and to connect the remaining 66,822 villages with a public telephone.
10 These are: pickles and chutneys; bread; pastry; hard boiled sugar candy; rapeseed, mustard, sesame, and groundnut oils (except solvent extracted and except for agri and growers cooperatives for the first three oils); and ground and processed spices, except for spice oil and oleo resin spices (SIDO online information. Viewed at: http://www.smallindustryindia.com/publications/reserveditems/List%20of%20reserved%20Items.pdf [11 December 2006].

India WT/TPR/S/182Page 103
(ii) Agricultural policies
(a) General framework
176. Agricultural policy in India is guided by a number of goals: food self-sufficiency, ensuring remunerative prices to farmers, and stable prices for consumers. To meet these goals an array of measures are in place, including direct subsidies, price controls, and minimum prices for certain crops, input subsidies, as well as restrictions on the movement of goods (domestic and international) to ensure stable domestic supply and prices.
177. Agricultural policy is formulated and implemented at the central level by the Ministry of Agriculture, with the Five Year Plan providing broad guidelines on policy and the allocation of funds. Under the Constitution, agriculture is a state subject, but important decisions like those relating to research and development, facilitating infrastructure and investment, credit and trade, are taken by the Central Government. Some model laws formulated at the central level can be adapted by the state governments according to their needs. The Commission for Agricultural Costs and Prices (CACP) was set up in 1965 to advise the Government on setting minimum support prices (MSPs) for different commodities (currently 25 essential commodities) and the mechanisms for implementing the MSPs. In addition to the Ministry of Agriculture and the CACP, a number of public sector agencies are responsible for implementing agricultural and food policies. The most important of these, the Food Corporation of India (FCI) was set up in 1964 to implement the food policy, including procuring and maintaining buffer stocks of food grains and for distributing food grains through the public distribution system (PDS) and various welfare schemes for poverty alleviation (see below). It is supported by the Central Warehousing Corporation set up in 1965. The FCI purchases foodgrains at procurement prices set by the Government and sells them at the Central Issue Price (CIP) also fixed by the Government. To the extent that the CIP does not include the cost to the FCI of purchasing, storage, and transportation, the Central Government subsidizes the FCI. The cost of the subsidy had risen to Rs 233 billion in 2004-05.11 The FCI and the National Agricultural Cooperative and Marketing Federation of India (NAFED), set up in 1958, also implement the Government's price support scheme (see below). Procurement of other crops, such as cotton and jute are also carried out by state-owned companies: the Cotton Corporation of India (CCI), and the Jute Corporation of India (JCI).
178. The first National Agricultural Policy, announced in July 2000, aims, inter alia, to raise annual growth in agriculture over the next two decades to over 4%, based on an efficient use of resources while conserving India's soil, water, and biodiversity, and equity across regions. The goals include: improving growth to over 4% in a sustainable manner; improving food and nutritional security; creating a favourable environment for increasing capital formation in agriculture; external and domestic market reforms; improving electrification and irrigation facilities; improving the marketing infrastructure as well as facilities for preservation, storage and transportation to reduce post harvest losses; providing an insurance policy for farmers to cover the whole growing season; and a continuous review of pricing and trade mechanisms to improve the economic environment in agriculture and the balance between rural and urban incomes. These objectives are being pursued through programmes like Bharat Nirman, the National Horticultural Mission, initiatives to improve agricultural credit, micro irrigation, and agriculture market reforms.
(b) Import policy
179. Although protection from imports of agricultural products has declined, India continues to use trade policy to support its overall goals of food self-sufficiency and price stability. Thus, tariffs, the
11 Food Corporation of India online information. Viewed at: http://fciweb.nic.in/capital_structure/capital_structure.htm [6 December 2006].

WT/TPR/S/182 Trade Policy ReviewPage 104
main instrument of trade policy, continue to be adjusted from time to time to ensure sufficient domestic supply of key products. An example is the exemption (zero duty) granted for imports of wheat in 2006 to replenish local grain stocks mainly for the public distribution system; the standard tariff rate is currently 50%. Import licences also seem to be issued to support this policy; for example, recently, imports of wheat, normally restricted to state trading, were also permitted by private importers.12 India has also recently notified import quotas under its bilateral agreement with Sri Lanka on certain products where no quota previously existed; and export restrictions are also issued from time to time to ensure sufficient domestic supply (see below).
Tariffs
180. The simple average applied MFN tariff for agriculture (WTO definition) increased slightly from 40.7% in 2001/02 to 40.8%, compared with a simple average bound rate of 117.2% (Table III.1). Tariffs on agricultural products are all ad valorem except for two lines (shelled and non-shelled almonds), unchanged from the previous Review. Applied tariff rates range from 0% to 182% (effective rates range from 0 to 150%). The highest rates are in HS Chapters 22 (beverages, spirits and vinegar); 21 (miscellaneous edible preparations); 9 (coffee and tea); 15 (animal or vegetable fats); and 10 (cereals) (Chart IV.1). Some of these rates, notably for cereals, are currently at their bound rates. However, for the majority of tariffs, there remains a considerable gap between the applied and bound rates, ranging from 10% to 300%. This has enabled the Government to raise its standard rate of tariff on some agricultural products (Table AIII.1). India also uses "reference prices" to calculate customs duty applicable on imports of, inter alia, palm oil (crude and RBD), palmolein oil (crude and RBD), and crude soybean oil. Under Section 14(2) of the Customs Act, reference prices can be fixed by the authority "if satisfied that it is necessary or expedient to do so"; customs duty on these imports are calculated on the basis of the reference prices rather than the price quoted by the importer.13
181. Preferential access to agriculture is provided under India's free-trade agreements. India's offer under these agreements ranges from 8.4% of its agricultural tariff lines (WTO definition of agriculture) for members of the Asia-Pacific Trade Agreement (APTA) to 92.5% under the free-trade agreement with Sri Lanka. The tariff concessions under most of these agreements are not very significant: the average agricultural tariff ranges from 37.2% for SAFTA to 40.6% for APTA (the MFN average is 40.8%); however, for Sri Lanka, the average is 7.6% while for least developed country members of the SAFTA (Bangladesh, Bhutan, Maldives, and Nepal), the agricultural tariff is 30.0% (Table III.2).
182. India maintains bound tariff rate quotas on milk powder, maize, sunflower seed and safflower oil, and rape, colza or mustard oil (14 tariff lines at the HS 8-digit level); the policy remains unchanged from the previous Review, although it seems that with the exception of sunflower seed and safflower oil, quotas are generally not issued because, according to the authorities, there is no demand from importers (Chapter III(2)(v)). Tariff rate quotas are also maintained on imports of tea under the free-trade agreement with Sri Lanka (Chapter II). Moreover, India has recently notified import quotas on vegetable fats (vanaspati, including bakery shortening and margarine), pepper, and desiccated coconut from Sri Lanka. Vanaspati imports will be limited to 250,000 tonnes per year, and imports of pepper to 2,500 tonnes per year; imports of desiccated coconut will be restricted to 500 tonnes per year at a concessional duty rate of 30%.14 The quotas on vanaspati, pepper, and desiccated coconut
12 Directorate General of Foreign Trade, Notification No. 16 (RE-2006)/2004-2009, 29 June 2006. Viewed at: http://dgftcom.nic.in/exim/2000/not/not06/not1606.htm [11 December 2006].
13 According to the authorities the prices are aligned with international prices and are revised frequently to avoid any discrepancy with international prices.
14 Directorate General of Foreign Trade, Public Notice No. 17 (RE-2006)/2004-09, 2 June 2006 and Public Notice No. 69 (RE-2006)/2004-09, 21 November 2006.

India WT/TPR/S/182Page 105
are not in the original bilateral agreement and appear to be the result of an agreement signed on 14 November 2006; a copy of this was not available.
0
20
40
60
80
100
120
140
01 02 03 04 05 06 07 08 09 10 11 12 13 14 15 16 17 18 19 20 21 22 23 24
Per cent
HS ChapterHS Chapter
01020304 0506070809101112131415161718192021222324
Description
Live animalsMeat and edible meat offalsFish and crustaceans, molluscs and other aquatic invertebratesDairy produce; birds eggs; natural honey; edible products of animal origin n.e.s.Products of animal origin, n.e.s.Live trees and other plants; bulbs, roots and the like; cut flowers and ornamental foliageEdible vegetables and certain roots and tubersEdible fruit and nuts; peel of citrus fruits or melonsCoffee, tea, mate and spicesCerealsProducts of the milling industry; malt; starches; wheat glutenOil seeds and oleaginous fruits; miscellaneous grains, seeds and fruit; straw and fodderLacs; gums, resins and other vegetable saps and extractsVegetable plaiting materials; vegetable products n.e.s.Animal or vegetable fats and oils and their cleavage products; prepared edible fats; animals or vegetable waxesPreparations of meat, or fish or of crustaceans, molluscs or other aquatic invertebratesSugars and sugar confectioneryCocoa and cocoa preparationsPreparations of cereals, flour, starch or milk; pastrycooks' productsPreparations of vegetables, fruit, nuts or other parts of plantsMiscellaneous edible preparationsBeverages, spirits and vinegarResidues and waste from the food industries; prepared animal fodderTobacco and manufactured tobacco substitutes
Chart IV.1Standard rates on agricultural products, 2001/02 and 2006/07
Average standard rateHS01-24 (2001/02)
41.7%
Average standard rateHS01-24 (2006/07)
42.7%
Source : WTO Secretariat calculations, based on data provided by the Indian authorities.
Note: The 2001/02 tariff is based on 6-digit HS96 nomenclature consisting of 704 lines (HS01-24); the 2006/07 tariff is based on 8-digit HS02 nomenclature, consisting of 1,466 lines (HS01-24). Excluding two specific rates for both years.
2001/02
2006/07

WT/TPR/S/182 Trade Policy ReviewPage 106
Import prohibitions and restrictions
183. Imports of tallow, fat and oils of animal origin, animal rennet, wild animals and their parts, beef and its products, natural sponges, fish wastes, domestic and wild birds, and poultry from countries reporting outbreaks of avian influenza, are prohibited for reasons of public health and safety and on moral/religious grounds. Import restrictions currently cover 7.7% of agricultural tariff lines. In addition, state trading continues to be used for imports of cereals (wheat, rice, maize, rye, oats, and coarse grains), and copra and crude coconut oil; however, data on imports of these products by state-trading agencies are not collected by the authorities. The Government also monitors imports of a number of agricultural products considered to be sensitive, including milk products, fruit and nuts, coffee, tea, spices, cereals, and edible oils. The authorities maintain that the only measure that can be taken in case of a surge in imports of these products is an increase in the applied rates of customs duties within their respective bound rates.
(c) Export policy
Overview
184. While the vast majority of agricultural exports are unrestricted, exports of some items regarded as essential and sensitive are closely monitored and subject to ad hoc restrictions as the need arises (see below). As a producer of a wide variety of agricultural products, India is also keen to expand its exports, especially of horticultural products. Sector-specific policies are in place for these products to improve output and productivity, including through increased investment in research and development. In its 2002-07 Foreign Trade Policy, India took additional steps to boost exports of agricultural products. Agri-export zones were established to encourage exports of certain products. The zones receive assistance from central and state governments to improve efficiencies in supply chains of the identified product; assistance may be in the form of extension of services and inputs from the Ministry of Agriculture, R&D support from the Agriculture Universities, or the setting up of cold storage facilities through assistance from the National Horticultural Board. There are currently 60 agri-export zones sanctioned by the Central Government and monitored by the Agricultural and Processed Food Products Export Development Authority (APEDA). However, of the total investment of Rs 17.18 billion envisaged over 2002-07, just under half has been realized, and only around 43% of expected exports have actually taken place from the zones.15 The Vishesh Krishi Upaj Yojana (special agricultural products scheme), which was introduced in 2004, promotes exports of fruit, vegetables, flowers, minor forest produce, dairy, poultry, and their value-added products.16 The incentive is an import duty credit equivalent to 5% of the f.o.b. value of exports in the previous year beginning 1 April 2004 (1 April 2005 for dairy, poultry, and related processed goods), although the Government reserves the right to remove any of the products from this scheme.17 According to data provided by the authorities, exports from the 60 zones were valued at around Rs 21.5 billion during April 2005-March 2006.18 No separate data are available on exports from the Vishesh Krishi Upaj Yojana.
15 APEDA (2006), Ref No. APEDA/CM/15/2005-06, 30 June 2006.16 The full list of products is in the Foreign Trade Procedures, Appendix 37A. Viewed at:
http://dgft.delhi.nic.in/ [11 December 2006]. 17 The duty credit is permitted only at a rate of 3.5% of the f.o.b. value of exports in the previous year if
the exporter has used any benefits under the duty/exemption/remission schemes. Units in special economic zones will not be eligible for the duty credit.
18 It was stressed during the course of this Review that exports from the agri-export zones were already taking place before the zones were set up.

India WT/TPR/S/182Page 107
Export restrictions
185. Over the years India has gradually removed prohibitions, licensing, and other restrictions on exports. However, as with its import policy, India also takes into consideration the domestic supply of items crucial for its food security. Thus, notifications are made from time to time to restrict exports or lift export restrictions in order to maintain domestic supplies and stability in domestic prices. For example, in 2006, exports of pulses and sugar (except sugar subject to a tariff rate quota in the United States and the EC) were prohibited, to maintain domestic supplies of these products in order to keep the price at a "reasonable level".19 The export of sheep meat, and goat meat on the bone has also been prohibited since 21 August 2006. Most recently, India has banned exports of wheat, apparently to contain the rise in domestic prices.20
186. India prohibits exports of certain agricultural products for health, environmental, and religious reasons (Chapter III(3)(v)). Export licensing is in place for live animals and some animal products, seeds, seaweed and other algae, residues and waste from food industries, as well as pure races of silk worm and silkworm seeds. There has been no major change in the policy on state trading, which includes onion, and gum karaya (Chapter III(3)(ix)). However, export cesses maintained for several products, including coffee, spices, tobacco and other agricultural commodities, were removed in 2006 (Chapter III(3)(iii)).
(d) Internal policies
Overview
187. Internal policies have been driven largely by food nutrition and livelihood security considerations. The Agriculture Produce Market Committee (APMC) Acts, which are enacted by states, restrict private investment in various commodities; the list of notified commodities varies from State to State. Recognizing the need for reform in this area, the Central Government formulated a Model Act in September 2003, the State Agricultural Produce (Development and Regulation ) Marketing Act, in consultation with state governments as well as trade and industry. The Act aims to, inter alia, develop competitive agricultural produce markets in the private and cooperative sectors and promote private investment in the development of marketing infrastructure.21 Some 12 states and union territories have amended their APMC Acts, and 5 have partially amended their Acts. The Essential Commodities Act, 1955 and the various Orders issued thereunder give the Government broad powers to keep prices "at reasonable levels", and to restrict the storage and movement of goods across state borders, although the Act has been amended substantially to reduce some of these restrictions.
188. India's internal measures to support agriculture include direct subsidies for inputs and indirect assistance through price support. Some direct support is also provided in the form of grants for infrastructure and research although this has declined considerably. As India does not have reduction commitments under the WTO Agreement on Agriculture aggregate measure of support (AMS), it is required to restrict its agricultural support to within the de minimus level of 10% during the base period (1986-88). India last notified its AMS commitments and its export subsidies to the WTO in March 2002 for the period 1996/97-2000/01.22 According to the authorities, the notification is to be updated as soon as more recent data are collected.
19 DGFT notifications 15 (RE-2006)/2004-2009, 27 June 2006, and 18 (RE-2006)/2004-2009, 4 July 2006. Viewed at: http://dgft.delhi.nic.in/ [7 December 2006].
20 Financial Times, 15 February 2007.21 Ministry of Finance (2004).22 WTO documents G/AG/N/IND/2, 11 June 2002; and G/AG/N/IND/3, 1 March 2002.

WT/TPR/S/182 Trade Policy ReviewPage 108
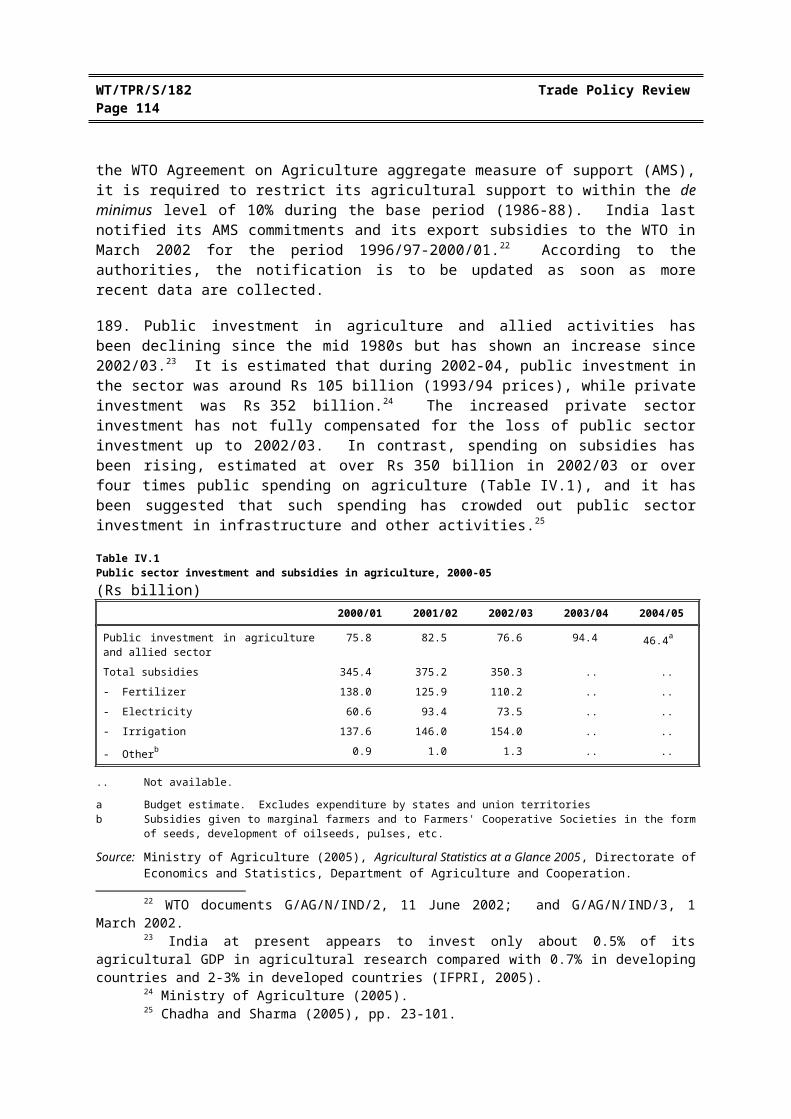
189. Public investment in agriculture and allied activities has been declining since the mid 1980s but has shown an increase since 2002/03.23 It is estimated that during 2002-04, public investment in the sector was around Rs 105 billion (1993/94 prices), while private investment was Rs 352 billion.24
The increased private sector investment has not fully compensated for the loss of public sector investment up to 2002/03. In contrast, spending on subsidies has been rising, estimated at over Rs 350 billion in 2002/03 or over four times public spending on agriculture (Table IV.1), and it has been suggested that such spending has crowded out public sector investment in infrastructure and other activities.25
Table IV.1Public sector investment and subsidies in agriculture, 2000-05(Rs billion)
2000/01 2001/02 2002/03 2003/04 2004/05
Public investment in agriculture and allied sector 75.8 82.5 76.6 94.4 46.4a
Total subsidies 345.4 375.2 350.3 .. ..
- Fertilizer 138.0 125.9 110.2 .. ..
- Electricity 60.6 93.4 73.5 .. ..
- Irrigation 137.6 146.0 154.0 .. ..
- Otherb 0.9 1.0 1.3 .. ..
.. Not available.
a Budget estimate. Excludes expenditure by states and union territoriesb Subsidies given to marginal farmers and to Farmers' Cooperative Societies in the form of seeds, development of oilseeds,
pulses, etc.
Source: Ministry of Agriculture (2005), Agricultural Statistics at a Glance 2005, Directorate of Economics and Statistics, Department of Agriculture and Cooperation.
Support for agricultural crops
190. In addition to direct subsidies, India has various mechanisms to safeguard the interests of its farmers from rapid market fluctuations, and to provide stable prices to consumers. India's price policy for agriculture is aimed at ensuring a remunerative and stable price environment in order to increase production and productivity, "with a view to evolving a balanced and integrated price structure in the perspective of the overall needs of the economy and with due regard to the interests of the producers and the consumers, particularly in the background of inherently unstable character of the market place for agriculture produce, which often inflict undue losses on the growers, even when they adopt the best available technology package and produce efficiently".26 Under the Price Support Scheme (PSS), minimum support prices (MSPs) are issued for major field crops.27 MSPs are announced by the Government following the recommendations of the Commission for Agricultural Costs and Prices (CACP).28 Intervention takes place when prices of the relevant commodities fall below the MSP,
23 India at present appears to invest only about 0.5% of its agricultural GDP in agricultural research compared with 0.7% in developing countries and 2-3% in developed countries (IFPRI, 2005).
24 Ministry of Agriculture (2005).25 Chadha and Sharma (2005), pp. 23-101.26 CACP online information. Viewed at: http://dacnet.nic.in/cacp/.27 These are: paddy, maize, coarse cereals, pulses (arhar, moong, urad, gram, and masur), cotton,
groundnuts, sesamum, niger seed, wheat, barley, rapeseed/mustard, safflower, sunflower seed, soy bean, toria, copra, jute, sugarcane, and tobacco (Department of Agriculture and Cooperation online information. Viewed at: http://agricoop.nic.in/farmprices/MSP-E.pdf [6 December 2006]).
28 The CACP takes into account a number of factors when calculating MSPs, including cost of cultivation/production, trends of input use, procurement and distribution, input/output price parity, trends in domestic and international prices, demand and supply, inter-crop price parity", effect on industrial cost structure

India WT/TPR/S/182Page 109
resulting in procurement at the MSP by the Food Corporation of India (FCI) for cereals, the National Agricultural Cooperative and Marketing Federation of India (NAFED) for pulses and oilseeds, the Cotton Corporation of India and NAFED for cotton, and the Jute Corporation of India for jute. MSPs have been raised in recent years and recommendation for MSPs appear to have been relatively higher for rice and wheat than for other crops.29
191. For products not covered by the MSPs, but for which the price may decline significantly as a result of a bumper crop and a glut in the market, the Government undertakes "market intervention" on specific request from the states, at a mutually agreed price. Under the Market Intervention Scheme (MIS), when the price of a particular commodity falls below the cost of production, the procuring agencies buy at the fixed Market Intervention Price (MIP) during a fixed period or until the price of the commodity stabilizes and exceeds the MIP, whichever is earlier. The MIP or mutually agreed price is based on the cost of production, which in turn is finalized following detailed discussions between the officials of the concerned governments. The losses incurred by such procurement are shared equally by state and central governments. Horticultural and other agricultural commodities that are perishable and are not covered under the PSS are procured under the MIS. Such market intervention, which is carried out by NAFED and agencies designated by the state governments concerned, has, since 2002, involved procurement of products such as onions, potatoes, apples, eggs, oil palm, seeds, oranges, garlic, pineapple, spices, and grapes. The loss incurred is shared by the central and state governments on a 50:50 basis (75:25 in case of north eastern states) and restricted to 25% of procurement cost or actual loss, whichever is less. Actual losses under the MIS were Rs 429 million in 2002/03 and Rs 56 million in 2005/06.
192. Under the existing policy on procurement of foodgrains, the Central Government grants price support to paddy (rice), coarse grains, and wheat through the Food Corporation of India (FCI) and state government agencies. The agencies open procurement centres in all Districts producing marketable foodgrain surpluses in the marketing seasons, and buy foodgrains at the MSP announced for the season. The farmer has the option to sell to the government agencies, or in the open market. According to the authorities, in this way the procurement policy ensures that farmers receive remunerative prices for their produce and enables the Central Government to procure foodgrains for distribution under the targeted public distribution system (TPDS), and other welfare schemes. It also enables the building up of buffer stocks of foodgrains with the FCI, to ensure food security. The TPDS (originally PDS) was set up to ensure distribution to consumers of essential commodities: currently wheat, rice, coarse grains, sugar (only for families below the poverty line, some states in the north-east, and in hilly areas and some island territories), and kerosene. It is operated under the joint responsibility of the central and state governments; the Central Government is responsible for procurement, storage, transportation, and allocation of stocks, while the state governments are responsible for identification of beneficiaries, issue of ration cards, and distribution of food grains to them through 486,000 "fair price shops" set up for this purpose. Grains and other items destined for the TPDS are purchased by the FCI at MSPs and sold to state governments at a Central Issue Price (CIP) determined by the Government.
193. As a result of criticism of the PDS, the targeted system was introduced in 1997 to better serve the poorer segments of the population. There are currently three categories of consumers within the TPDS: families estimated to be above the poverty line (APL), families below the poverty line (BPL), and a category introduced within the BPL in 2000 called the antyodaya anna yojana (AAY). Beneficiaries in the APL and BPL categories, currently 115.2 million and 65.2 million, respectively, are identified by state governments on the basis of caloric requirements laid down by the Planning
and general prices, cost of living, and the "terms of trade" between agricultural and non-agricultural sector. 29 It is suggested that, as a result production of wheat and rice rose substantially in the 1980s and 1990s
(Virmani and Rajeev, 2002).

WT/TPR/S/182 Trade Policy ReviewPage 110
Commission and are currently allocated around 50% of their estimated daily grain requirements through the TPDS.30 The AAY category, which makes up some 38% of the BPL category, has some 25 million families identified by the states and includes the unemployed, casual labourers, marginal farmers and rural artisans, widows, orphans, etc.31 The CIPs under the TPDS are fixed by the Government and involve a subsidy, particularly for the BPL and AAY consumers.32 The food subsidy budgetary allocation for 2006/07 is Rs 239.86 billion, or 4.3% of total government expenditure.33
Procurement of rice and sugar are subject to "levies", which are fixed shares of output that must be sold to the Central Government at fixed prices for the TPDS. The sugar market, which is slowly being liberalized, is currently subject to a levy of 10% (15% at the time of the last Review). Although the remaining sugar can be sold on the open market, it is also subject to monthly sales quotas determined by the Government in order to ensure price stability.34 As a sign of further intervention, the Government amended the Essential Commodities Act in June 2003 to require all trade in sugar to take place under the direction of the Government35; exports of sugar are also currently prohibited. Rice procured by the Government through a statutory levy on rice millers and rice dealers is fixed by states in consultation with the Central Government and varies from State to State; it currently ranges from 10% to 75% of paddy procured by rice millers/dealers.36
194. In addition to the TPDS, other welfare measures have been introduced to increase access to food, especially for children, through the mid-day meal scheme, the annapurna scheme for the elderly, food for work programmes (sampoorna gramin rozgar yojana (SGRY)) and the National Food for Work Programme (NFWP). The SGRY, announced on 15 August 2001, is a universal programme and offers 5 million tonnes of foodgrain free of charge to be distributed by states and union territories. The NFWP, launched on 13 October 2004, is designed to provide 100 days of employment at the minimum wage for at least one able-bodied person from each household in the country. According to the authorities, the tribal areas would mainly benefit from the latter scheme. The Government also provides an emergency feeding programme, and there is a Village Grain Bank Scheme to ensure supply of grains to food-scarce villages or areas as notified by state governments. Between 1996/97 and 2006/07, the Government sanctioned the establishment of 13,219 such grain banks in different states.
30 This is estimated at 35 kg (raised from 25 kg in 2002) of foodgrains per household per month.31 Department of Food and Public Distribution online information. Viewed at: http://fcamin.nic.in/
dfpd/EventDetails.asp?EventId=29&Section=PDS&ParentID=0&Parent=1&check=0 [6 December 2006].32 They are currently 67% of the economic cost to the FCI for APL families, 41% for BPL families, and
22% for AAY families for rice. In respect of wheat, they are 50% of the economic cost to the FCI for APL families, 34% for BPL families, and 16% for AAY families; losses incurred by the FCI are covered by the Central Government through a subsidy.
33 The cost was around 2.5% of government expenditure in the early 1990s (Virmani and Rajeev, 2002).
34 The monthly quotas (release mechanism) were to be discontinued by the Government by 31 March 2003; however, following appeals by sugar producers, it was decided to continue issuing the quotas up to September 2005 and to review the situation in February 2005. A Committee set up in March 2004 to suggest ways to revitalize the sugar industry recommended that the release mechanism be discontinued by the end of 2005. However, as at 28 February 2006, the recommendation did not appear to have been accepted by the Government (Department of Food and Public Distribution Notification No. 1-2/2006, dated 28 February 2006 requires producers to sell and dispatch monthly quotas of sugar according to the monthly release order. Viewed at: http://www.fcamin.nic.in/dfpd/EventDetails.asp?EventId=867&Section=Sugar%20and%20Edible%20Oil&ParentID=867&child_continue=1&child_check=0 [8 December 2006].
35 Department of Food and Public Distribution online information. Viewed at: http://www.fcamin.nic.in/dfpd/EventListing.asp?ID_PK=100&Section=Sugar%20and%20Edible%20Oil&ParentID=0 [8 December 2006].
36 Department of Food and Public Distribution online information. Viewed at: http://www.fcamin.nic.in/dfpd/EventListing.asp?Section=Levy%20and%20Control%20Orders&id_pk=14&ParentID=0 [8 December 2006].

India WT/TPR/S/182Page 111
195. In the late 1990s, relatively high MSPs, especially for rice and wheat37, compared with market prices, and the changing composition of demand for agricultural products, led to the build-up of huge public stocks of grain (64.7 million tonnes in 2002, almost three times the buffer stock requirements and significantly in excess of the 10 million suggested by the Expenditure Reforms Commission), requiring the FCI to release major stocks both domestically and for export, especially during 2002/03 and 2003/04.38 In 2005, stocks fell below buffer stock requirements, requiring imports, especially of wheat. The cost of maintaining buffer stocks, and thus the overall food subsidy, rose substantially, to Rs 241.8 billion by 2006/07; there is also concern that the quality of food stocks and storage facilities are not good. Efforts are being made to decentralize procurement to the states (some 11 states have adopted the scheme), although questions remain about financing of operations, reimbursement of expenses, and release of subsidy by the Central Government.39 There is also concern that because the FCI's costs are covered by the Central Government, it has little incentive to improve efficiency, while the targeting of the TPDS could be improved significantly. Efforts are also being made to improve the operational efficiency of the FCI; according to the authorities, these resulted in savings of Rs 1.83 billion up to August 2006.40
196. To respond to some of these concerns, in 2000, the Government constituted a High Level Committee to formulate a long-term grain policy. The Committee's report, presented in 2002, suggested, inter alia, that: MSP's should be fixed on the basis of costs of production in more efficient regions; all rice levies should be discontinued; state levies should not be more than 4% of the MSPs; decentralized procurement must be made attractive to the Central Government; the efficiency of the FCI should be improved; and the Government should introduce a major food-based employment programme. The Committee also suggested that there should be an immediate shift to the unified TPDS, with Central prices being based on acquisition cost at a single CIP across the country, because the TPDS undermined the viability of the Fair Price Shops and resulted in leakages. In line with these recommendations, the Government made moderate increases in MSPs up to 2005/06 and the decentralized procurement scheme more viable by defraying incidental costs, such as storage and interest charges for state agencies. The Government has also implemented the SGRY and the NFWP and is making efforts to improve the efficiency of the FCI. Where state levies are high the Central Government has requested the state governments to reduce them. The Government rejected the recommendation on the universal PDS since it was felt that this would result in the TPDS losing its focus on meeting the needs of the poor.
Input subsidies
197. The three main inputs receiving subsidies are fertilizers, electric power, and water for irrigation. In addition, subsidies are provided for seeds and pesticides, including through price control orders issued from time to time. Spending on fertilizer subsidies increased from Rs 138 billion in 2000/01 to Rs 182.99 billion in 2005/06 and, with input prices high, it is expected that the cost will rise substantially in 2006/07.41 To make fertilizers available to farmers at affordable prices and to encourage their use, the Government controls the price at which fertilizers are sold to farmers. As this price is lower than the cost of production, the difference is paid to fertilizer manufacturers as compensation. Currently, urea is subject to price controls under the Fertilizer (Control) Order, 1985,
37 It appears that MSPs for paddy rice and wheat have been fixed at levels higher than recommended by the CACP in recent years (Virmani and Rajeev, 2002). Additional states charges and levies inflate prices further.
38 Ministry of Finance (2005).39 Ministry of Finance (2006b).40 The efficiency measures include: improved financial management, network optimization, renting out
of excess storage capacity, reuse of gunny bags, reduction of procurement and establishment costs, outsourcing of non-critical activities, and reduction of labour costs.
41 Ministry of Finance (2006b).

WT/TPR/S/182 Trade Policy ReviewPage 112
although ad hoc price controls are also applied to phosphatic and potassic fertilizers through a "Concession scheme for decontrolled phosphatic and potassic fertilizers".42 The new pricing scheme (NPS), also known as the group pricing scheme, has been implemented in two stages (April 2003 and April 2004).43 Under the NPS, a flat rate of subsidy is determined for a group of manufacturers. The groups of manufacturers are divided according to production methods and age of manufacturing plants. The new scheme also provides incentives for producers to increase efficiency.44 An additional freight subsidy is paid for transportation costs incurred by the manufacturer. Importers of urea are also paid a subsidy to make up for the difference between the price of imports and retail prices. There has been no change in the retail price of fertilizers since 28 February 2002.45
198. The subsidy provided by the state governments in the form of low or zero tariffs for electricity used in agriculture amounted to Rs 73.5 billion in 2002/03 (Table IV.1).46 Electricity is a concurrent subject under the Constitution of India. The Electricity Act, 2003 provides that a state government may decide to give subsidy to a category of consumers in the tariff determined by the State Electricity Regulatory Commission. The law also requires the state government to provide such a subsidy from its own budget to the concerned power utility. The power subsidy for the agriculture sector is also used for irrigation through tube wells, and surface water use is subsidized at rates below cost. The total subsidy for water for irrigation grew from Rs 137.6 billion in 2000/01 to Rs 154 billion in 2002/03. Additional subsidies are provided for infrastructure, including the expansion of the irrigation canal network and its upkeep, and the expansion of drip and sprinkler systems, which use less water.
199. Indirect subsidies for the agriculture sector are provided in a number of ways, including facilitating access to credit and insurance policies. This includes access to credit under the priority sector lending requirement for commercial banks (at least 18% of their total lending needs to be to the agriculture sector). It appears, however, that commercial banks have consistently failed to meet this target, and have been permitted to deposit up to 1.5% of the shortfall in net bank credit to agriculture with the Rural Infrastructure Development Fund (RIDF) since it was set up in 1995/96. The RIDF was established to assist states in investing in rural infrastructure and is administered by the National Bank for Agriculture and Rural Development (NABARD). The interest rates for banks depositing their shortfalls with the RIDF until 2001/02 were 0.5% less than the rates of interest charged on RIDF
42 Phosphatic and potassic fertilizers were decontrolled in 1994. However, their prices increased significantly, resulting in a decline in their use and subsequent overuse of urea forcing the Government to announce maximum retail prices for these fertilizers as well (Department of Fertilizers, online information. Viewed at: http://fert.nic.in/fertilizersubsidy/background.asp [7 December 2006]).
43 The NPS replaced the Retention Price Cum Subsidy (RPS) scheme, which was the difference between the retail price and the retention price (defined as the cost of production plus a 12% post-tax return on net capital assets).
44 These are: (i) the urea units had been given preset energy consumption norms, effective 1 April 2004. If the units achieve a better energy efficiency, then they are allowed to retain the benefits thereof; (ii) the urea units are encouraged to produce more than 100% of reassessed capacity for which the net gain sharing formula on sale of additional production between the Government and the units is in the ratio of 65:35; and (iii) the units that use naphtha, FO/LSHS as feed stock for urea are encouraged to convert to cheaper, cleaner, and more efficient feed stock, i.e. gas/LNG under NPS.
45 Ministry of Finance (2006b), Chapter 8.46 The Integrated Energy Policy report by an Expert Committee notes that, although less than 48% of
billed energy is sold to industrial and commercial consumers, this segment yields over 70% of actual revenue collected by the state utilities. Moreover, the cross-subsidization has resulted in industries finding it cheaper to set up their own generating plants rather than pay the high rates charged by state electricity distributors (Planning Commission, 2006b, Chapter X).
India WT/TPR/S/182Page 113
loans to state governments. However, the rates are now based on the prevailing bank rate with the interest rate inversely proportional to the amount of the shortfall in credit to the agriculture sector.47
200. The goal of the Tenth Five Year Plan (2002-07) was a substantial increase in credit to agriculture, to Rs 7,367 billion, up from Rs 2,299 billion under the Ninth Five Year Plan. However, there has been a considerable shortfall, prompting the Government to announce a new credit policy in June 2004, which aimed to increase credit by requiring each rural and semi-urban branch of a commercial bank to take up on average at least two to three new investment projects in certain areas identified by the Government.48 As a result, agricultural credit increased from Rs 869.8 billion in 2003/04 to Rs 1,253 billion in 2004/05; almost 84% of the target of Rs 1,410 billion for 2005/06 had been met by end 2006.49 An Advisory Committee was also constituted by the Reserve Bank of India on the flow of credit to agriculture from the banking system. Several of the recommendations by the Committee were implemented by the RBI in May 2004.50 Other forms of credit include the Kisan Credit Card scheme with a withdrawal limit based on the farmers' operational landholding. The Government is also implementing a National Agricultural Insurance Scheme (NAIS) covering all the major crops, initially with a 50% subsidy on the premium for small and marginal farmers to be phased out over a period of five years. At present, a 10% subsidy on the premium is available to small and marginal farmers. The subsidy is shared equally between state and central governments. However, it seems that only around 14% of farmers on average are currently covered by any crop insurance, which does not cover price fluctuations. In addition, farmers do not, in general, have any insurance cover against other risks such as accidents and illness.51 Agricultural income is exempt from income tax; agricultural products are subject to a 4% VAT, and states may also levy a state tax on agricultural holdings.
201. However, it appears that small and marginal farmers face considerable difficulty in access to credit and their share in total credit to the agricultural sector is falling.52 Moreover, while the share of total credit that seems to be non-institutional (i.e. moneylenders who tend to charge high rates of interest), while declining, remains significant and is likely to be especially high for marginal farmers. Indebtedness and poor harvests appear also to be the major causes for the recent cases of suicides among small and marginal farmers. To assist small-scale farmers, in its most recent Budget, the Government has announced a 7% limit on interest rates charged for loans of up to Rs 300,000. It was also announced in the Budget that a Committee on Financial Inclusion would be appointed to examine the reasons for exclusion of marginal farmers from access to credit and to suggest solutions. The Committee on Financial Inclusion, set up in June 2006, will study the pattern of exclusion, identify the barriers confronted by vulnerable groups, and suggest suitable measures and a monitoring mechanism.
47 For example, if the bank had a shortfall of less than 2 percentage points of its net credit, the interest rate would be the prevailing bank rate, but if its shortfall was between 2 and 4.99 percentage points, the interest rate would be the prevailing bank rate minus 1% (NABARD online information. Viewed at: http://www.nabard.org/roles/ridf/genesis.htm [5 December 2006]).
48 These are: plantations and horticulture, fisheries, organic farming, agri-processing, livestock, micro-irrigation, sprinkler irrigation, watershed management, village pond development, and others (Ministry of Finance, 2005).
49 Ministry of Finance (2006b).50 RBI (2004a). The recommendations that have been accepted include a waiver on collateral
requirements loans of up to Rs 50,000 for crops, and Rs 500,000 for loans for agri-business and "agri-clinics".51 Planning Commission (2006a).52 Mohan (2004).
WT/TPR/S/182 Trade Policy ReviewPage 114
(3) ENERGY
202. Bottlenecks in the energy sector, arising from inadequate and inefficient infrastructure, tend to increase transaction costs and prevent the economy from realizing its full potential, regardless of progress in other areas. Recognizing this, the Government has been making efforts to reduce infrastructure bottlenecks, by encouraging private participation.
(i) Oil and gas
203. The Indian oil and gas industry can be broadly divided into three subsectors: exploration and production; refining; and marketing. All three subsectors are dominated by public sector companies. In exploration and production, the two national oil companies (NOCs) accounted for 78% and 9.4% of total oil production in 2004/05, while private companies and joint ventures accounted for 12.6%.53 Of the 19 refineries, one is privately owned, and accounts for 26% of total refining capacity. 54 In addition, foreign investment is restricted to 26% of total investment in public sector refineries.
204. India is facing increased demand for petroleum products. The Expert Committee on Integrated Energy Policy in the Planning Commission estimated that in order to sustain 8% growth of GDP up to 2031/32, India needs, at least, to increase its primary energy supply three to four fold.55 If taking 2003/04 as the base year, India's commercial energy supply would need to grow by 5.2-6.1% per annum, and its total primary energy supply would need to grow by 4.3-5.1% annually.56
205. The increased demand requires further reform in the sector. To encourage investment, measures have been adopted to promote private participation. Thus, no activity in the sector is reserved exclusively for public entities; apart from refining undertaken by public sector units, up to 100% foreign investment is allowed in all activities, including exploration, production, and marketing. Five private companies have been granted marketing rights for the transportation fuel, in addition to the four public oil marketing companies.57 In refining, the authorities expected that private enterprises could account for 29% of the total refining capacity in 2006/07.
206. Measures have been taken to encourage exploration and production of oil and gas. Under the New Exploration Licensing Policy (NELP) announced in 1997, 100% foreign investment was allowed in all types of exploration, with no minimum expenditure commitment. Various incentives have also been provided, such as income tax holidays for seven years from the start of commercial production, and tax deduction of capital expenditure on exploration and drilling operations, including customs tariff exemption on imports for petroleum operations. The authorities believe the NELP provides a level playing field to private sector companies, by giving them the same fiscal and contractual terms as public companies. Since the NELP began, in 1999, production sharing contracts (PSCs) have been signed for 110 blocks, and 30 discoveries have been made by private companies (including joint ventures).
53 Ministry of Petroleum and Natural Gas (2006). The two NOCs are the Oil and Natural Gas Corporation Ltd (ONGC), and the Oil India Ltd (OIL).
54 The Economic Survey 2006-2007, issued on 27 February 2007, states that India currently has 17 public sector refineries and 2 private refineries.
55 Planning Commission (2005).56 IBEF (2006c).57 The four public oil marketing companies are the Indian Oil Corporation Ltd (IOC), the Hindustan
Petroleum Corporation Ltd (HPC), the Bhatat Petroleum Corporation Ltd (BPC), and the Indo Burma Petroleum Ltd (IBP) (subsidiary of IOC).

India WT/TPR/S/182Page 115
207. Despite being a net exporter of petroleum products, India imports around 70% of consumption.58 Nonetheless, high international prices have not been fully passed through to the domestic market; inaccurate price signals may affect the development of oil and gas sector. The Indian Government used to set fuel prices under an administered pricing mechanism (APM). Although the APM was eliminated in April 2002, complete pass-through of international prices does not take place. Although after April 2002 the oil marketing companies (OMCs) were allowed to adjust prices based on import parity, after consulting the Ministry of Petroleum and Natural Gas, this system was suspended at the end of 2003, when oil prices started to climb.59 In August 2004, the Government approved a system under which OMCs could adjust gasoline and diesel prices within a 10% price band of a three-month average of import parity prices; however, this system has never been applied.
208. According to the authorities, complete pass-through of international oil prices, which rose sharply in 2006, could cause severe difficulties for transportation, and have serious inflationary implications. Accordingly, a Committee was established to look into various aspects of pricing and taxation of petroleum products. The Committee issued its report in February 2006. Following its recommendations, in June 2006 the Government commenced a trade-parity-based pricing mechanism, comprising 80% of import price parity and 20% of export price parity. 60 Nevertheless, prices of kerosene and liquid petroleum gas (LPG) remain subject to government control (Chapter III(4)(iii)). Applied MFN tariffs on petrol and diesel have been reduced several times during the review period; the most recent reduction, from 10% to 7.5% in June 2006, was to mitigate the effects of international price rises on domestic prices.61 The Government also continues to monitor the prices of kerosene, LPG, motor spirit and diesel; according to the authorities, price monitoring is in the interest of the weaker sections of society.
209. Natural gas supplied by existing pre-NELP oil and gas fields and distributed to certain key sectors, such as electricity and fertilizers, is allocated at administered prices. Gas supplied by suppliers other than the two national oil companies (the ONGC and the OIL) is sold at the market price.
210. Kerosene prices in India remain among the lowest in the world primarily due to subsidies provided by the Government.62 In addition, it was estimated that the cost of subsidies to petroleum increased from 0.5% of GDP in 2003/04, to 0.7% of GDP in 2004/0563, because of the increase in international prices. Although these subsidies have shielded some poor households from the impact of higher oil prices, there are substantial leakages. For example, it was estimated that kerosene consumed by households below the poverty line under the TPDS accounted for less than 38% of all kerosene consumption, and almost 49% of kerosene distributed through the TPDS was diverted for non-household use or for sale on the black market.64 The authorities do not consider that there are substantial leakages, and state that research conducted by the National Council of Applied Economics Research (NCAER) shows that at least 62% of PDS kerosene reached the targeted beneficiaries in 2004.65
58 Planning Commission (2005). "Currently, the refining capacity in the country is more than the domestic requirements, making India a net exporter of petroleum products", p. 11.
59 IMF (2006b).60 Ministry of Petroleum and Natural Gas (2006).61 Ministry of Finance (2007b), p. 145.62 IMF (2006b).63 IMF (2006b).64 IMF (2006b).65 The authorities indicate that the measures taken or intended to reduce leakages include introducing a
marker system, and advising the NOCs to install global positioning systems on all the tank trucks carrying petrol/diesel to retail outlets by March 2007.

WT/TPR/S/182 Trade Policy ReviewPage 116
211. Under the Petroleum and Natural Gas Regulatory Board Act 2006, passed on 31 March 200666, a Regulatory Board is to be set up to regulate the refining and marketing of petrol, petroleum products, and natural gas, but not exploration and production of crude oil and natural gas. The Act also provides for a legal framework for the downstream gas sector, including the development of natural gas pipelines, as well as local gas distribution networks. The authorities state that a committee is working on identifying suitable members of the Board.
(i) Electricity
(a) Overview
212. The electricity industry has undergone major changes over the last decade. Under the Indian Constitution, electricity is regulated by both the central and state governments. At the central level, the Ministry of Power is responsible for administration of the Electricity Act 2003, issues related to the Central Electricity Regulatory Commission (CERC), and rural electricity schemes. The CERC is responsible for regulating the tariff of generating companies owned or controlled by the Central Government and those that operate in more than one state; it is also in charge of inter-state transmission. The State Electricity Regulatory Commissions (SERCs) administer electricity firms (generation, transmission, and retail) operating in a single state.
213. It is estimated that in order to support 7% GDP growth per annum, growth of electricity supply needs to be over 10% annually.67 Generation capacity in particular, which is currently 127,673 MW, must double every ten years for the next three decades. Accordingly, structural reforms are urgently needed to increase generation, transmission, and distribution capacity, to improve efficiency and reduce losses.
(b) Structural reform
214. Previously, there was a state electricity board (SEB) in every state; these were government-owned integrated utilities, and generating companies could not choose their customers unless approved by the Government on a case-by-case basis. The SEBs have been running at a loss since the late 1980s and, against this backdrop, the electricity industry has been facing challenges such as: inadequate generation; accumulated losses in the generation, transmission, and distribution of electricity; unsustainable cross-subsidies; low access to electricity, particularly in rural areas; and a lack of investment in infrastructure. Accordingly, electricity supply continues to lag behind demand; 43% of the total population and 56% of the rural population does not have access to electricity.
215. Realizing the need for reform, a number of states began unbundling the SEBs, and as a result, the number of players in each segment of the industry has increased. In particular, there are 21 companies engaging in electricity trading, 18 of which are privately owned. Out of 74 generation companies, 9 are controlled by the Central Government, 25 by state governments; the remainder are privately owned. State governments, however, continue to play a major role in the transmission and distribution of electricity. Out of 13 transmission companies, 11 are controlled by state governments and one by the Central Government, while 31 of the 48 distribution companies are controlled by state governments and one by the Centre.
216. However, for the SEBs, the cost of producing and transmitting electricity remains much higher than the sales price, and cross-subsidies for agriculture and households, by charging high
66 The Petroleum and Natural Gas Regulatory Board Act 2006. Viewed at: http://indiacode.nic.in/fullact1.asp?tfnm=200619.
67 IBEF (2006d).

India WT/TPR/S/182Page 117
prices to commercial and industrial consumers, have led to negative rates of return. Between 2005/06 and 2006/07, the rate of return of the SEBs deteriorated from -24.8% to -27.4%.68 Also, as SEBs dominate the transmission and distribution of electricity, their financial difficulties indicate that they have not been able to pay fully for the purchase of electricity generated by private power producers. Hence, although 100% foreign investment has been permitted in electricity generation, transmission, and distribution, the amount attracted is low. Furthermore, the SEBs' losses, and the consequent low foreign and private investment have contributed to the lack of investment in infrastructure. These infrastructure bottlenecks, in turn, have constrained not only the growth of the sector, but also the development of the economy.
217. Transmission and distribution (T&D) losses also remain high, with many states reporting losses of over 40% in recent years.69 These losses are mainly attributed to inadequate investment in infrastructure, lack of a distribution network in rural areas, low metering efficiency, and theft. Accordingly, in March 2003, the Government initiated the Accelerated Power Development and Reforms Programme (APDRP) for transmission and distribution, to reduce the aggregate technical and commercial (AT&C) losses. Initially, the target was to reduce AT&C losses from 60% to 15% in about five years, but it was found later that the baseline 60% was not correct and the 15% target was too ambitious. Accordingly, a Taskforce set up by the Ministry of Power suggested a graded reduction in AT&C losses. Utilities with AT&C losses: above 40% should reduce them by 4% per year; between 30-40% by 3% per year; between 20-30% by 2% per year; and those with less than 20% losses should reduce them by 1% per year.70 So far, AT&C losses have fallen from an average of 39% in 2001/02 to 33.5% in 2005/06.
218. Under the Electricity Act 2003, which entered into force in 2003: generation (other than large hydro generation) was delicensed; open access and electricity trading were allowed in the transmission and distribution of electricity; distribution was also delicensed in "notified" rural areas 71; and unbundling of the SEBs was promoted. In particular, under the Act, consumers with a load of more than 1 MW are allowed open access to transmission and distribution by January 2009. In addition, the Appellate Tribunal for Electricity became operational from 21 July 2005, and started hearing appeals against decisions of the electricity regulatory commissions. Although the implementation of the Act has not been even at the state level, and three states have recently reintroduced free access to electricity for farmers, the authorities consider that most of the states have taken significant steps in the direction of deregulation.
219. The Electricity Act required the Central Government to formulate the National Electricity Policy, in consultation with the Central Electricity Authority (CEA)72 (a statutory agency under the Ministry of Power), and state governments. The Policy, issued in 2005, aimed to realize full access to electricity by 2009, and increase supply to meet demand by 2012. An important component of the
68 Ministry of Finance (2007b), p.180.69 Ministry of Power online information. Viewed at: http://powermin.nic.in/JSP_SERVLETS/
internal.jsp [30 November 2006].70 ? Ministry of Power (2006).
71 Electricity Act, Part IV Licensing, Article 14: "Provided also that where a person intends to generate and distribute electricity in a rural area to be notified by the State Government, such person shall not require any licence for such generation and distribution of electricity".
72 The CEA was first set up in 1951 as a part-time body, and became a full-time agency in 1975. Under the Electricity Act 2003, the CEA's functions include providing advice to the Central Government on issues relating to the national electricity policy; specifying the technical standards and safety requirements for electrical plants and electric lines; specifying the grid standards for operation and maintenance of transmission lines; and conditions for installation of meters for transmission and supply of electricity (CEA online information. Viewed at: http://cea.nic.in/about_us/functions_cea.html [13 December 2006]).

WT/TPR/S/182 Trade Policy ReviewPage 118
policy is to promote open access in transmission, which would enable electricity from surplus regions to be supplied to deficit regions.
220. The Rural Electricity Infrastructure and Households Electrification (Rajiv Gandhi Grameen Vidyutikaran Yojna (RGGVY)) scheme was introduced in April 2005, to provide full access to electricity, particularly in rural areas, by 2009. The Rural Electrification Corporation (REC) is in charge of implementing the scheme. A capital subsidy of 90% is provided for the provision of rural electricity distribution infrastructure, including the Rural Electricity Distribution Backbone (REDB), the Village Electrification Infrastructure (VEI), and the Decentralized Distributed Generation (DDG) and Supply. A 100% subsidy is provided for electricity consumed by households below the poverty line. As at December 2006, 27 states had signed memoranda of agreement (MoAs), agreeing to implement the RGGVY. Under this scheme, 9,819 villages obtained access to electricity in 2005/06 (in addition to the 26,543 villages between 1996/97 and 2004/05).
221. To increase private participation in the sector, 100% foreign equity participation has been allowed since 1991 in all segments of the industry. Subsequently, FDI in generation, transmission, and distribution was brought under the automatic approval route. Since 2005, 100% FDI has also been permitted in the trading of electricity. Certain fiscal benefits, in the form of duty concessions and tax holidays, have also been provided.73 In addition, all electricity projects have a 100% income tax exemption for ten consecutive years, within 15 years of commencement or from undertaking a substantial renovation or modernization of existing transmission lines. The authorities state that as a consequence of the restructuring efforts, investor confidence has been improving. About 40,000 MW of new generation capacity is under construction with investments of more than Rs 1,600 billion. The Government's Ultra Mega Power Project has also been developed with investment through public-private partnership.74
(c) Subsidies and pricing
222. Government subsidies, including cross-subsidies to the electricity sector, appear to have reached unsustainable levels. In 2006/07, direct transfers from state governments to the SEBs reached Rs 138.7 billion, in addition to an "uncovered subsidy" of Rs 212.01 billion.75 Recognizing that cross-subsidies hide inefficiencies and losses in operations, the National Electricity Policy recognizing the urgency of reducing subsidies. However, the policy stipulates that consumers below the poverty line and consuming electricity below a specified level may receive cross-subsidies in the form of tariff reductions, which should be at least 50% of the overall average cost of supply. According to the authorities, as the complete elimination of cross-subsidies would not be feasible in the near future, there is a proposal to amend the Electricity Act by deleting the phrase "elimination of cross subsidies". Thus, cross-subsidies would be reduced rather than eliminated.76 The authorities state that consumption by agricultural consumers increased by 5.8% in 2004/05, with revenue increasing by 8.5%. During the same period, industrial consumption increased by 11.5% with revenue increasing by 9.99%. This, according to the authorities, indicates the beginning of reduction in cross-subsidies.
73 For example, under the Mega Power Policy, large generation projects can obtain capital import-duty concessions, and/or the waiver of local levies to reduce costs. All inter-state projects with a capacity of 1,000 MW and above for thermal, and 500 MW and above for hydro projects, are treated as mega power projects.
74 According to the authorities, two projects, each with 4,000 MW generation capacity, have been awarded through tariff-based competitive bidding. It seems the U.K. based Globeleq is the major consortium partner in one of the recently awarded 4,000 MW ultra mega power projects in Madhya Pradesh.
75 Ministry of Finance (2007b), p. 180. 76 The proposed amendment also includes provisions relating to control of theft of electricity, as well as
providing electricity universally to urban and rural areas.

India WT/TPR/S/182Page 119
223. To promote competition, competitive bidding guidelines, issued on 19 January 2005, provide for the determination of tariffs for purchasing electricity by distribution companies; the electricity regulatory commissions are required to adopt tariffs determined through the bidding process. Currently, the tariff is determined on the basis of the capital cost and the performance of a project. Public sector utilities have been given a five-year transition period to move from the cost-performance based tariff to a competitive bidding based tariff.77 Exceptions include the one-time expansion of existing projects, i.e., existing generation projects can expand 50% of their current capacity within the present tariff regulation regime, or where a state-controlled company is identified as the developer of the project.78
(4) MANUFACTURING
224. Manufacturing has been growing rapidly since the previous Review (Table I.2) of India, due partly to structural reform. The share of manufacturing in GDP increased from 15.6% in 2000/01 to 16% in 2005/06 (Table I.2). Its share in total merchandise exports fell from 76.5% in 2000/01 to 69.8% in 2005/06, while the share in imports rose from 42.9% to 48.4% (Chart I.1).
225. There has been a decline in industrial licensing and FDI restrictions. Border protection for manufacturing also fell significantly, as the average MFN rate in manufacturing (ISIC) fell from 32.5% in 2001/02 to 14.9% in 2006/07 (Chart III.3).79 However, the reduced average tends to conceal some high tariff rates, such as on new and second-hand automobiles, which are at 60% and 100%, respectively.
(i) Textiles and clothing
(a) Introduction
226. Employing around 35 million people, textiles and clothing (T&C) remains the largest manufacturing industry in India in terms of employment.80 It accounted for 4% of GDP and 14% of industrial production in 2004/05.81 The authorities indicate that the T&C sector accounted for 8.62% of total employment, and labour productivity in T&C appears to be lower than in the remainder of the manufacturing industry.82
227. The textiles and clothing industry is regulated by the Ministry of Textiles, and comprises the "organized" mill sector, with relatively sophisticated technology and integrated composite spinning, weaving, and processing mills, and the "decentralized" sector. The "decentralized" sector, the largest part of the T&C industry, is composed of powerloom units (accounting for 62% of total clothing production), and handloom units (which operate with low levels of technology).83
77 The authorities indicate that, once the tariff is determined through competitive bidding, no further regulatory scrutiny is envisaged. This, as stated by the authorities, also reduces regulatory uncertainty.
78 Ministry of Finance (2006b), Chapter 9.79 The average MFN rate in manufacturing, excluding AVEs, is 15.1% for 2006/07, or 17.0% including
AVEs.80 Ministry of Textiles (2006). The T&C sector is also the second largest provider of employment after
agriculture. 81 Ministry of Textiles (2006).82 According to figures provided by the Department of Heavy Industry, labour productivity, if measured
in terms of gross value added per employee, is 1.48 for weaving and spinning, and 1.61 for other textiles manufacturing, lower than that for machinery (3.31), iron and steel (7.45), and automobiles (10.6).
83 USITC (2001): "The handloom industry is an integral part of rural life in India. Although it has high production cost and low productivity, it is known for its unique products, which have helped it develop a niche in global markets."

WT/TPR/S/182 Trade Policy ReviewPage 120
(b) Reform measures and assistance
228. Textiles and clothing products used to be subject to small-scale industries (SSI) reservations, and consequently a foreign equity restriction of 24%. The reservation, however, prevented firms from benefiting from economies of scale. The Government has gradually "de-reserved" textiles and clothing products from the SSI list over the past few years, and 100% foreign ownership is now allowed in the industry.
229. In addition to the SSI reservation, which constrained the competitiveness of India's T&C exports, other factors affecting the industry's competitiveness include low value added, lack of diversification in terms of export destinations (65.4% of India's T&C exports were directed towards the United States and the EC in 2005, up from 58.7% in 200484), little inward FDI85, and poor infrastructure.86 In particular, according to the RBI, transaction costs were higher in T&C than in India's other leading export sectors in 2003.87
230. Measures have been introduced to increase productivity, by, for example, restructuring certain subsectors (e.g. mills). Although private firms, which are supposed to be more efficient, accounted for 92% of yarn production and 94% of fabric production in the mill sector, the "organized" mill sector has apparently accumulated large debts.88 The Government announced a package to restructure mills to alleviate the debts. Facilitated by the National Textile Corporation (NTC), 65 mills have been shut down under the Industrial Disputes (ID) Act.89 It appears that the Ministry of Textiles also provides "letters of comfort",90 which seem to be government guarantees to facilitate mills to obtain loans from banks. Moreover, Rs 500 million has already been invested to improve existing machinery, and Rs 4 billion has been used as adjustment assistance to reduce labour surplus.
231. The T&C industry has been receiving assistance in various forms, and for different purposes. The Handloom Reservation Order stipulates that 11 textile products must be manufactured by the handloom industry, and the Hank Yarn Obligation Order requires that all yarn producers process 40% (50% before January 2003) of their deliveries in hank form to ensure adequate supply for the handloom industry at "reasonable" prices.91 Furthermore, the Cotton Corporation of India (CCI), a state-owned enterprise established in 1970, engages in price support operations whenever the price of cotton falls to the government-set minimum support price (MSP). The loss incurred through price support operations is reimbursed to the CCI by the Government. More recently, assistance has been
84 UNSD Comtrade database.85 Between 1991 and 2004, FDI in the sector was US$35 million (1% of total cumulative FDI flows
into India during the period) (Tewari, 2005).86 Ananthakrishnan and Jain-Chandra (2005).87 RBI (2004b). According to the authorities, international trade is determined by market forces, and
there has not been any bureaucratic control regulating the T&C sector in India.88 The authorities state that, according to studies conducted by the South India Textile Research
Association (SITRA) in July 2002, banks and other financial institutions had almost Rs. 600 billion of non-performing assets accumulated in the textiles sector. Accordingly, a package based on external commercial borrowings (ECBs) was announced to reduce debts. Under the package, rupee-term loans could be converted into foreign currency loans, to bring down the interest rates. However, the authorities state that the scheme could not commence, but did not provide reasons.
89 The NTC had 119 mills under its management, of which, 52 are to be restructured, 65 were shut down, and two transferred to a state government. The estimated cost of the restructuring is Rs 39 billion, which is to be financed by selling the land and assets of the closed mills. Employees of these mills were offered voluntary retirement, which, according to the authorities, had been accepted by 53,656 employees.
90 Ministry of Textiles (2005), p. 7. According to the authorities, the Ministry of Textiles does not provide any "letters of comfort" to the financial institutions or banks to provide loans or credit to the textile sector.
91 Ministry of Textiles online information. Viewed at: http://texmin.nic.in/annualrep/ar00_c05.htm.
India WT/TPR/S/182Page 121
provided to improve technology; the Technology Upgradation Fund Scheme (TUFS) was launched in 1999, and extended to 31 March 2007, to upgrade technology in existing plants and equipment, and to promote investment in new plants and equipment. Funds are provided in the form of reimbursement to interest on loans.92 Under the Tenth Five Year Plan (2002-2007), the Government allocated Rs 12.7 billion to TUFS.93
(c) Border measures
232. During the period under review, tariffs on textile machinery and equipment have been reduced; currently, there are 387 textile machinery items with a basic customs duty of 5%. In addition, imports of second-hand machinery have been permitted since April 2003. The authorities also indicate that India is keeping a large number of T&C items in positive lists under various RTA negotiations, where preferential tariff concessions are given or duty-free imports are allowed.
233. Nonetheless, the textiles and clothing industry remains protected by relatively high tariff barriers, a large percentage of which are non-ad valorem.94 Excluding AVEs, the current average tariff for the sector is 12.3%; however, inclusion of AVEs raises the average tariff up to 22.5% . Consequently, imports (mainly textiles) accounted for only 1.3% of total merchandise imports in 2005/06 (1.2% in 2000/01) (Table AI.2).95 Preferential tariffs also apply to textiles and clothing products under certain regional and bilateral preferential trade agreements (Table III.2). In addition, tariff rate quotas apply for imports from Sri Lanka: 6 million pieces of clothing may be imported duty free, if manufactured in Sri Lanka using fabric sourced from India; and a 75% tariff rebate is applicable to a further 2 million pieces.
234. Although the T&C industry's share of total merchandise exports fell from 27% in 2000/01 to 17.1% in 2005/06, it remains one of India's largest exporters (Table AI.3). Despite this downward trend, India's share of the global T&C market increased from 3% in 2001 to 3.7% in 2006.
235. The New Textile Policy 2000, issued in November 2000, was aimed at further increasing India's T&C exports to US$50 billion by 2010 (from US$12 billion in 2000/01). In addition, the discontinuation of the Agreement on Textiles and Clothing in 2005 was expected to increase India's T&C exports: exports of T&C products increased by 29.6% in 2005/06.96 However, exports continue to be constrained by aging machinery, inadequate infrastructure (such as power and ports), and rigid labour laws.97
236. Measures to increase exports include the Advance Authorization Scheme (AAS) (previously advance licensing scheme), and the Duty Exemption Pass Book scheme (DEPS) (Chapter III(3)(vii)). Around 300 T&C products have been identified under the AAS. Recently, to facilitate economies of scale, the Government has been trying to promote industrial and textile clusters. For example, it
92 Benefits under the scheme include: 5% interest reimbursement on rupee term loans; 5% exchange fluctuations on foreign currency loans; 15% or 20% credit-linked capital subsidy; 5% interest reimbursement plus 10% capital subsidy for specified processing machinery.
93 Ministry of Textiles (2006). 94 In the 2006/07 tariff, around 34.1% of lines for the textiles, wearing apparel, and leather industries
(ISIC) are non-ad valorem. According to the authorities, there are no import restrictions. The non-ad valorem duties on T&C products are alternate duties, and are levied as ad valorem or specific duty, whichever is higher, with a view to discouraging very cheap products of dubious quality from non-market economies.
95 According to the authorities, the low share of textiles imports to total imports is not due to high tariff barriers; rather, it is because of large increases in non-textile imports, including raw materials, crude oil, and machinery items.
96 UNSD, Comtrade database.97 Ministry of Finance (2007b), p.140.

WT/TPR/S/182 Trade Policy ReviewPage 122
commenced the Integrated Textile Parks Scheme in 2005: by combining the Apparel Park for Exports Scheme, and the Textile Centre Infrastructure Scheme98, the integrated textile parks aim to provide infrastructure facilities to the textile industry.99 Exports are also promoted by helping firms to participate in international trade fairs and exhibitions.
(ii) Steel
237. Deregulation of the steel industry commenced in the early 1990s, when 100% foreign investment was allowed, restrictions on import or export of steel were reduced, and price regulations were discontinued. Partly as a result of the deregulation, and partly due to India's endowments of iron ore and non-coking coal, crude steel output rose by nearly 6% annually, and exports by 15% annually, between 1995 and 2005; global crude steel output growth was 4% annually during the same period. In 2005, India produced 38 million tonnes of steel, becoming the eighth largest steel producer in the world.
238. The industry is regulated by the Ministry of Steel, and comprises "main producers", "other major producers", and "secondary producers". The "main producers" are: the Steel Authority of India (SAIL) and Rashtriya Ispat Nigam Ltd (RINL), both state-owned enterprises, and Tata Steel Limited, a private company. The "main" and "other major" producers are those that have integrated steel-making facilities with production capacity over 0.5 million tonnes per year, and utilize iron ore and coal or gas for producing steel. The "secondary" producers, comprise firms with lower production capacity, including around 120 sponge iron producers, 650 mini-furnaces, and about 1,200 re-rollers.100
239. Labour productivity in crude steel production varies in terms of output per person; in general, productivity in companies established in the 1990s (mainly private enterprises) is much higher than in those established earlier (mainly public sector enterprises).101 In addition, nearly 6% of India's crude steel is produced using outdated open hearth processes (compared to 0.3% in the EC).
240. To promote the industry's competitiveness and improve efficiency and productivity, the National Steel Policy, issued in 2005 is aimed at increasing steel output to 110 million tonnes per annum by 2019/20 (from 38 million tonnes in 2004/05).102 By 2019/20, exports are envisaged to reach 26 million tonnes (based on double-digit growth until 2019/20), from around 4 million tonnes in 2004/05; thus, steel exports would account for 23.6% of total production, up from 11% in 2004/05. However, according to the latest demand and supply projection, production is likely to be 15-20% higher than the 110 million tonnes envisaged in the NSP, suggesting that exports would constitute a smaller share of total production than the estimated 23.6%.
98 Under the Apparel Park for Exports Scheme (launched in 2002), the Government approved setting up 11 apparel manufacturing centres around the country directed towards exporting. Under the Textile Centre Infrastructure Scheme (also launched in 2002), the Government was to develop infrastructure facilities at major textile production centres in India.
99 The Government seeks to implement the economic cluster model, to take advantage of the economies of scale on both demand and supply side. In this regard, the Government announced in the 2006/07 Budget that the cluster development approach would continue and would be extended to a further 100 clusters.
100 Ministry of Steel (2005). The authorities indicate that, by the end of 2006, there were 218 sponge iron producers, 787 electric induction and arc furnaces, and 1,361 re-rollers.
101 For example, in 2005/06, the labour productivity in Essar Steel and Jindal Steel, both privately owned, was 1,079 tonnes and 617 tonnes, per person per year, respectively, much higher than in SAIL (150 tonnes per person per year), and RINL (282 tonnes per person per year). TISCO, although privately owned, is the oldest steel producer in India and has labour productivity of 277 tonnes per person per year.
102 Ministry of Steel (2005).

India WT/TPR/S/182Page 123
241. The Government intends to help firms to increase output by, inter alia, removing procedural and policy bottlenecks in the availability of inputs, such as iron ore and coal, promoting investment in R&D103, and providing export credit.104 Also, given the slow progress of multilateral trade negotiations, the Government intends to focus on regional-trade agreements to increase market access for steel exports.105 In addition, the Government is committed to conducting reviews to remove infrastructural and institutional bottlenecks, so as to reduce transaction costs.106 Furthermore, the Government would encourage strategic alliances with buy-back arrangements. Steel exports may benefit from the Advance Authorization Scheme (AAS), and the Duty Entitlement Pass Book scheme (DEPS) (Chapter III(3)(vii)).107 According to the authorities, the production goal specified in the National Steel Policy is expected to facilitate the development of downstream industries that use steel as inputs, such as infrastructure construction, manufacture of transport equipment, machinery, and consumer durables.108
242. During the period under review, MFN tariffs for iron and steel imports have been reduced significantly, from an average 33.8% in 2001/02, to 7.1% in 2006/07 (ISIC 3710). As a result, trade in iron and steel has been growing fast, with import growth at an average annual rate of 55%, and export growth at 47%, between 2001/02 and 2005/06.109 Import restrictions, however, remain to discourage imports of low-priced "seconds" and "defective" materials including through floor prices.110 Imports of seconds or defects, which are allowed only through three designated ports (Mumbai, Calcutta, and Chennai), are also similar to mandatory pre-inspection certificates (by a "reputed" international agency). The tariff on these imports, at 20%, is much higher than the average tariff for steel products.111
103 According to the authorities, a tax rebate of 125% of the total expenditure incurred on R&D is allowed.
104 Ministry of Steel (2005). According to the authorities, the measures specified in the NSP are aimed at removing the constraints that are beyond the control of individual steel producers and that impede efficient growth of the steel industry. These include lack of infrastructure, scarcity and high cost of capital resources, as well as other rigidities that prevent steel producers' access to different inputs.
105 Ministry of Steel (2005). India is the largest steel producer in South Asia. According to the authorities, compared with its nearby countries in Asia, the Middle East, and Africa, India has considerable comparative advantage in terms of availability of raw materials, a large pool of skilled manpower, as well as technological capability. RTAs with these countries can provide better market access for India.
106 The NSP emphasizes the need to expand infrastructure for roads, railways, ports, and power by, inter alia, promoting investments through business models such as PPP (Public Private Partnership), better coordination among various agencies supplying infrastructure and services to the steel producers, and improving logistics.
107 The authorities state that these schemes are more relevant when the tariff rates are high. However, in the last decade the tariff rates on steel have been reduced significantly.
108 The authorities indicate that the production goal becomes particularly important as domestic consumption of steel has been increasing at double-digit rates in the last two financial years, and for the past 15 years the Indian steel industry has been driven principally by the growth in domestic markets, instead of being export driven.
109 UNSD Comtrade database.110 Floor prices are applied to hot-rolled coils and sheets, cold-rolled coils and sheets, tinplate waste and
waste/tinplate misprints, and electrical sheets (CRNO) and plates.111 Ministry of Steel online information. Viewed at: http://steel.nic.in/policy.htm [29 November 2006].
According to the authorities, the import restrictions are actions permitted under the WTO Agreement, and are applicable only to the imports of "low-priced" "seconds" and defective materials, which are products not sold in the developed western country markets. The authorities state that these imports pose potential threats to the health and safety of users in India.

WT/TPR/S/182 Trade Policy ReviewPage 124
243. Furthermore, the Government has a scheme to distribute iron and steel produced by the main producers (SAIL, RINL, and TISCO) to small-scale industries112, and to other Government departments (up to 30% of the total allocation). The distribution is through the Small Scale Industries Corporations (SSICs) at the state level, or the National Small Industries Corporation (NSIC). 113 To ensure that SSIs obtain these raw materials at "reasonable" prices, the Government provides nominal handling charges of around Rs 500 per tonne to the SSICs to cover their handling, transportation, and stockyard maintenance charges.114 The distribution scheme, however, may reduce enterprises' incentive to achieve economies of scale, and hence adversely affect the competitiveness of the industry. The National Steel Policy, stated that the distribution system would remain.
(iii) Automobiles
244. Following structural reform measures in the 1990s, the new Auto Policy was announced in March 2002 by the Department of Heavy Industry, under which 100% foreign ownership was allowed and minimum investment conditions were discontinued. Partly as a result of these measures, the automotive industry has been developing fast; total output increased by 17% in 2004/05, and exports of automobiles increased even faster, by 31.3%.115 The industry accounts for 5% of GDP and employs, directly and indirectly, around 13.1 million people. The authorities state that in terms of gross value added per employee, labour productivity in the automotive industry was 10.6 in 2003/04, much higher than in iron and steel (7.45), machinery (3.31), or structural metal products (2.3). Currently, there are 13 manufacturers of passenger vehicles, 9 manufacturers of commercial vehicles, and 17 manufacturers of two/three wheelers.
245. There are around 500 automotive component firms in the organized sector and some 10,000 firms in the unorganized sector. The industry has been growing at around 20% annually since 2000. Total value added reached US$10 billion in 2005, and is envisaged to grow to US$40 billion in 2014.116 In May 2006, all auto components (around 35 items) were removed from the SSI reservation list, giving a further boost to the sector's development.
246. Part of the objective of the new Auto Policy is for India to become a global source of auto components and an international hub for the manufacture of small passenger cars. The authorities indicate that, between 2000/01 and 2005/06, exports of automobiles as a proportion of total production increased from 3.5% to 8.9%. Exports of auto components increased from US$578 million in 2001/02 to US$2.1 billion in 2005/06. Export growth, particularly of automobiles, will be affected by India's regional trade agreements. In particular, under the agreement with Thailand, India eliminated tariffs on some auto components from September 2006.117
247. Despite deregulation, the automotive industry is still protected by relatively high import duties and non-tariff restrictions. Although the average applied MFN tariff for motor vehicles (ISIC 3843) fell from 44.2% in 2001/02, to 33.6% in 2006/07, it remains considerably higher than the
112 SSIs are industries with total investment of Rs 10 million or less.113 Ministry of Steel online information. Viewed at: http://steel.nic.in/distribution.htm
[29 November 2006].114 According to the authorities, the nominal handling charges do not affect the supply price to the SSI
units, as the price of raw materials supplied is determined by the producer.115 Other reasons for the rapid development of the automotive industry are the increased demand
resulting from the burgeoning economy and the emerging middle class, and the relatively easier access to consumer finance.
116 IBEF online information. Viewed at: http://www.ibef.org/industry/autocomponents.aspx [12 December 2006].
117 According to the authorities, apart from the agreement with Thailand, India has signed no other RTAs that include automobiles and auto components.

India WT/TPR/S/182Page 125
average for manufacturing (15.1% in 2006/07). The average applied MFN tariff for motor vehicles (HS 8703) fell slightly from 105% in 2001, to 100% in 2006.118 Given such high tariffs, it is likely that much of the FDI in the industry is for "tariff jumping" purposes. Although there are no licensing requirements for imports of new vehicles, licences need to be obtained for imports of automobiles more than three-years old, once safety and environmental requirements are met. In addition to a tariff of 100%, imports of used vehicles may enter only through Mumbai port.
(iv) Information technology (IT)
248. Information technology (IT) has been one of the fastest growing industries in the economy. The industry comprises software development, IT enabled services (ITES), business process outsourcing (BPO), and hardware manufacture. IT services and software account for more than 60% of the industry's total value added.
249. Deregulation of the industry includes reducing import barriers, relaxing foreign investment restrictions, and encouraging private sector participation. For example, tariffs on specified capital goods and IT hardware were eliminated in 1997. As India is a member of the Information Technology Agreement (ITA), since 1 March 2005, tariffs have been eliminated on all the specified 217 tariff lines. The peak rate for other electronics products is 12.5%. Although the excise duty on computers is 12.5%, exemptions are in place for microprocessors for computers, hard disc drives, floppy disc drives, CD ROM, DVD drives, USB flash memory and combo drives, as well as parts, components, and accessories of mobile handsets including cellular phones. In addition, FDI of up to 100% through the automatic route is permitted in electronics and information technology hardware manufacturing, software development, and ITES sector, except business-to-consumer (B2C) e-commerce.
250. The Government has adopted various measures to facilitate further development of the IT industry. Software technology parks (STPs) and electronic hardware technology parks (EHTPs) are single-window operations providing export services and incubation infrastructure to small and medium-sized enterprises (SMEs), to promote exports of IT products and services. The incentives to the firms operating under the STP and EHTP schemes include: duty-free access to imports of capital goods, raw materials, components and other related inputs; 100% exemption from excise tax on the purchase of domestic goods; and 100% exemption from payment of income tax on export profits up to 2009/10.119 Both schemes are implemented by the Software Technology Parks of India (STPI), a not-for-profit organization under the Department of Information Technology. The authorities indicate that STPI has set up 47 centres all over the country, and there are currently over 5,000 firms exporting under the STP scheme and over 70 firms under the EHTP scheme. The share of exports through STPs to total exports of IT software and services, including ITES and BPO, went up from 81% in 2001/02, to 98% in 2005/06. Special Economic Zones (SEZs) are also being promoted as export manufacturing centres. Tax incentives provided in SEZs include duty drawbacks and tax holidays. To encourage exports, the Export Promotion Capital Goods scheme (EPCG) allows for a tariff of 5% on imports of capital goods, provided certain export performance requirements can be met (Table AIII.4). In addition, the software industry benefits from priority sector lending (section (5)(iii)(a)).
118 According to the authorities, tariffs on automotive products were also reduced significantly except on CBUs of cars and two-wheelers. From 2001/02 to 2006/07, the average applied MFN tariff for motor vehicles (Chapter 87 apart from 8703 and 8711) fell from 40% to 12.5%. The MFN tariff for new cars and two-wheelers is 60%, and the tariff for used vehicles is 100%, both of which are unbound. In addition, major international manufacturers are setting up manufacturing facilities to access the large and growing domestic market.
119 Software Technology Parks of India online information. Viewed at: http://www.stpp.soft.net/ehtpscheme.html.
WT/TPR/S/182 Trade Policy ReviewPage 126
251. As a consequence of these measures, together with India's comparative advantage in the IT industry (India has a large pool of skilled labour earning relatively low wages), foreign investment has been growing rapidly in the IT sector, accounting for 25.1% of total FDI in 2005/06, up from 17.2% in 2003/04. The Indian software and ITES industry has grown at an annual rate of 28% during the last five years, and the industry's contribution to GDP grew from 1.2% in 1999/00 to 4.8% in 2005/06. The BPO sector grew by 48% in 2004/05, and was estimated to grow by 37% in 2005/06. Currently, India accounts for 65% of the global offshore market for IT services, and 46% of the global share of BPO industries.120 The IT industry is also one of the largest export sectors in the economy, accounting for 25% of India’s total exports (of goods and services) in 2005/06.
252. Further development of the IT industry in India may be constrained by lack of infrastructure. In addition, according to Nasscom studies, only 25% of technology graduates and 10-15% of general graduates are suitable for employment in the IT and BPO industries. Accordingly, reforms are required to improve infrastructure, including IT facilities, as well as power, roads, and airports, and to increase the supply of skilled labour. In this regard, the Indian Government set up a Task Force on Human Resource Development for the IT sector, whose main objective was to prepare a long-term strategy to increase the number of trained IT professionals. In addition, initiatives by the All India Council of Technical Education (AICTE) include industry-institute interactions through collaboration with industry associations, and revision of curriculum to ensure quality and industry relevance. The initiatives taken by the University Grants Commission (UGC) include establishing digital repository of research and training material, information communication and computer education, teaching innovations and career-oriented education programmes. Indian Institutes of Information Technology (IIITs) have also been set up by the Central and state governments together with the private sector to provide qualified IT professionals to the industry.121
(5) SERVICES
(i) Overview
253. The services sector is the key driver of economic growth; between 2002/03 and 2006/07, it contributed 68.6% of the overall average growth in GDP.122 Greater progress has been made in reforming services than in other sectors of the economy. Trade, hotels, transport, and communication services grew at double digit rates for the three consecutive years (from 2003/04 to 2005/06). As a result of the continuing growth, services share of GDP increased from 50.5% in 2000/01 to 54.1% in 2005/06 (Table I.2). During the same period, exports of services increased by 27.4%, mainly due to increased software services exports; imports of services increased by 24.2% (Table I.1). The services trade surplus increased to US$23.9 billion in 2005/06, from US$15.4 billion in 2004/05 (Table AI.1).
(ii) Commitments under the General Agreement on Trade in Services
254. India's Schedule of Specific Commitments under the GATS has remained unchanged since 2002. Its commitments cover business services, communication services, construction and related engineering services, financial services, health related and social services, tourism and travel related services. MFN exemptions were scheduled for: communication services (audiovisual and telecommunication services); recreational services; and transport services. In the Doha Round, India has submitted both initial and revised offers.123 In its revised offer, India has included commitments
120 NASSCOM (2005).121 Integrated townships have also been set up with particular focus on ITES and BPO industries, with a
view to further improving infrastructure facilities, such as communication, power, roads, and airports.122 Ministry of Finance (2007b), p.1.

India WT/TPR/S/182Page 127
in a number of new sectors or subsectors124, and improvements to existing commitments in a number of sectors.125 The revised offer also contains improvements to its mode 4 initial offer with respect to the sectoral coverage of contractual service suppliers and independent professionals.
(iii) Financial services
255. Although financial services, particularly banking and insurance, continue to be dominated by state-owned companies, measures have been adopted to encourage competition from the private sector. For example, restrictions on foreign banks have been relaxed. Efforts have also been made to improve corporate governance in financial services. For example, the RBI introduced prudential requirements to align the banking sector with international practices, although implementation was postponed. Also, all stock exchanges must be corporatized, and from January 2006, all listed companies are required to adopt the corporate governance requirements specified in the listing agreement.
(a) Banking
Introduction
256. As at 31 March 2006, there were 89 scheduled commercial banks (excluding regional rural banks (RRBs)), 1,864 urban cooperative banks (UCBs), 8 development finance institutions (DFIs), 13,049 non-banking financial companies (NBFCs), and 17 primary dealers (PDs).126 All these are supervised by the Reserve Bank of India (RBI), through the Board for Financial Supervision. There are also 102 RRBs supervised by the National Bank for Agriculture and Rural Development (NABARD).127
257. India's banking sector continues to be dominated by public sector banks (PSBs), which account for approximately 72% of the sector's total assets.128 As at end March 2006, of the 89 scheduled commercial banks, there were 28 public sector banks, 28 private banks, 29 foreign banks, and 4 local area banks. All commercial banks (domestic and foreign) are still required to allocate a certain percentage of net lending (40% for domestic banks and 32% for foreign banks) to priority sectors (including agriculture and small-scale industries).129 These requirements, however,
123 WTO documents TN/S/O/IND, 12 January 2004; TN/S/O/IND/Rev.1, 24 August 2005; and TN/S/O/IND/Rev.1/Corr.1, 2 September 2005.
124 New commitments include, inter alia, air transport services; architectural, integrated engineering and urban planning and landscape services; construction and related engineering services; distribution services; educational services; environmental services; life insurance services and services auxiliary to insurance; recreational, cultural and sporting services; tourism services; and veterinary services.
125 Improvements to existing commitments include asset management services and other non-banking financial services; banking services; computer and related services; construction and related engineering services; engineering services; research and development services; basic telecommunications and value-added telecommunications services.
126 RBI (2006b).127 RBI (2006e).
128 ? On 31 March 2006, public sector banks accounted for 72.3% of total assets of the scheduled commercial banks, down from 75.3% a year earlier (RBI, 2006f).
129 Priority sectors include agriculture, small-scale industries, and other activities/borrowers such as retail trade, and software industry. Domestic banks are required to allocate 40% of their net bank credit to priority sectors. Of the 40%, 18% is to agriculture, 10% to weaker sections, and the rest to small-scale industries. Within the part to agriculture, the Government announced a farm credit policy in June 2004, which, apart from eased terms and condition on existing and future loans, envisaged a 30% annual increase in credit to the agriculture sector, so that total lending to agriculture would be doubled by 2007. For foreign banks, 32% of net lending must be to priority sectors (at least 10% for small-scale industries, and 12% for exports).

WT/TPR/S/182 Trade Policy ReviewPage 128
tend to restrict banks' performance and may lead to problems in recovering assets. According to the authorities, the priority sector lending requirements would not lead to difficulties in asset recovering, as lending is on commercial terms; moreover, the level of non-performing assets (NPAs) in priority sector lending has declined in recent years.
258. Against the backdrop of fast economic growth, bank credit has also been growing fast. For example, bank credit increased by 31% in 2005/06; in contrast, total deposits of the scheduled commercial banks grew by 18%. The rapid credit growth may be a sign of financial deepening. 130
Although the ratio of private sector credit to GDP grew from 33% at end-March 2002 to 48% at end-March 2006, and the NPL ratio fell from 7.2% at end-March 2004 to 5% at end-March 2005, the rapid expansion of credit also raises questions about credit quality, and subsequently affects banks' capital adequacy ratios (CAR).131 The minimum CAR requirement for banks regulated by the RBI is 9%. At end-March 2006, the average CAR for commercial banks was 12.4%, down from 12.8% in March 2005. In addition, the most recent decline in the NPL ratio may be partly due to credit growth (and subsequently new loans to the market). As deterioration of loan quality typically occurs with a 1-2 year lag, the NPL ratio may increase in the future.132 Furthermore, as banks hold more than 30% of their deposits in government securities (much higher than the required 25%), the RBI encouraged banks to build investment fluctuation reserves (IFR) to reduce risks due to over-dependence on government securities.133
259. The difference between deposit and lending rates indicates the level of competition in the sector. A reduction in deposit rates in 2002/03 increased the interest spread, although since 2003/04, the spread has fallen as deposit rates increased (Table IV.2). Lending rates, on the other hand, have been quite stable.
Table IV.2Deposit rates and lending rates, 2000-07(Per cent per annum)
Year Deposit rates Lending rates
2000/01 8.50-9.00 11.00-12.002001/02 7.50-8.50 11.00-12.002002/03 4.25-6.00 10.75-11.502003/04 4.00-5.25 10.25-11.002004/05 5.25-5.50 10.25-10.752005/06 6.00-6.50 10.25-10.75
2006/07a 7.00-7.50 11.00-11.50
a. Data for 2006/07 provided by the authorities, as at 22 December 2006.
130 The authorities state that the rapid credit growth represents increased banking penetration. According to the authorities, credit growth has been broad-based, including priority sectors, retail segment, particularly residential mortgages, and commercial real estate.
131 According to the authorities, the sharp rise in credit growth has been accompanied by a significant improvement in asset quality. The gross NPAs of SCBs declined by Rs.73.1 billion in 2005/06, after a decline of Rs 65.6 billion in 2004/05, and the ratio of gross NPAs to gross advances fell to 3.3% at end-March 2006 from 5.2% at end-March 2005.
132 According to the authorities, despite the rapid expansion of credit, if banks are able to generate resources internally and access capital from the market commensurate with the increase in bank credit, the CAR may not decline.133 ? The authorities indicate that, commercial banks' holdings of government and other approved securities declined from 38.2% at end-March 2005 to 31.3% at end-March 2006. As suggested by the Basel Committee on Banking Supervision (BCBS), in January 2002 banks were advised to build investment fluctuation reserves (IFRs) within five years, so that a minimum of 5% of their investments should be in the categories of "available for sale (AFS)" and "held for trading (HFT)".

India WT/TPR/S/182Page 129
Source: RBI (2006), Handbook of Statistics on Indian Economy, Table 74: Structure of Interest Rates, Columns 3 and 8. Viewed at: http://rbidocs.rbi.org.in/rdocs/Publications/PDFs/72704.pdf [8 December 2006].
Structural reforms
260. Structural reforms have been continued to increase the competitiveness of the banking sector and reduce risks (including risks associated with rapid credit growth). The RBI has been introducing prudential requirements to align the banking sector with international practices. In particular, banks are required to implement the Basel II capital adequacy framework initially by March 2007. However, this requirement was postponed to 31 March 2008 for foreign banks operating in India and Indian banks operating abroad, and encouraged by 31 March 2009 for all other scheduled commercial banks. The RBI has adopted measures to facilitate capacity building of banks by training supervisors, monitoring bank risk management, and improving bank information disclosure. The RBI also plans to extend the pilot project on risk-based supervision, which currently applies to 23 banks.
261. In February 2005, the RBI formulated the Roadmap for Presence of Foreign Banks in India and the Guidelines on Ownership and Governance in Private Banks. The Guidelines cover minimum capital requirements, provisions on ownership structure, procedures for acquisition and transfer of shares, and conditions for senior officials and large shareholders.134 Private-sector banks must maintain minimum capital, initially of Rs 2 billion, to be increased to Rs 3 billion in three years, while net worth must be Rs 3 billion at all times.135 To ensure diversified ownership, no entity can own or control more than 10% of the paid-up capital of a private sector bank.136 In addition, currently the voting rights of any individual, irrespective of their shareholding, are capped at 10%. It seems a Bill to amend the Banking Regulation Act will abolish this restriction. Currently in Parliament, the amendment also includes provisions for prior approval by the RBI for acquisition of 5% or more of shares or voting rights in a bank.
262. Measures have also been adopted to gradually lift restrictions on foreign banks, while certain limits on foreign competition will remain until 2009. For example, although in 2003/04 the aggregate foreign investment limit was increased from 49% to 74% in domestic private banks identified by the RBI for restructuring, the RBI has not laid down any criteria for identifying weak private-sector banks in need of restructuring, nor has it identified any bank for restructuring. In addition, the 49% limit remains for other private-sector banks until 2009.137 Furthermore, under India's GATS commitments, foreign banks were allowed to access the Indian market only through branches (i.e wholly owned subsidiaries or joint ventures were not allowed).138 The Roadmap issued by the RBI in February 2005 divided foreign participation in the banking sector into two phases. In the first phase, foreign banks are allowed to establish wholly owned subsidiaries (WOS), in addition to branches. The authorities indicate that, at present all 29 foreign banks in India are branches; so far, no foreign bank has set up a wholly owned subsidiary in India. In the second phase, to commence in April 2009, foreign banks may be permitted to enter into mergers and acquisitions with any private bank in India, subject to the overall investment limit of 74%.
134 The authorities indicate that ownership and governance of banks specified in the Banking Regulation Act 1949 are supplemented by regulatory prescription issued by the RBI from time to time.135 ? Ministry of Finance (2006b), pp. 56-57.136 ? Exceptions are allowed for the consolidation or restructuring of weak banks; RBI approval is required.
137 Individual foreign institutional investment (FII) is restricted to 10%, and the aggregate limit for all FIIs is capped at 24%; this limit, however, can be raised to 49% once approved by the board and the shareholders. Investment by non-resident Indians (NRIs) is limited to 5%, and aggregate NRI investment is limited to 10%; the limit can be raised to 24% upon approval by the shareholders.
138 Restrictions were also imposed on the number of banking licences (12 per year both for new entrants and existing banks), and on the value of the banking system's assets in the hands of foreign banks (15% of total assets).

WT/TPR/S/182 Trade Policy ReviewPage 130
263. Banks operating in India (including public-sector banks, privately owned banks, and foreign-invested banks) authorized to deal with foreign exchange, are eligible to set up offshore banking units (OBUs) in special economic zones (SEZs). Each of the eligible banks is allowed to establish only one OBU per SEZ, essentially for wholesale banking operations. As a start-up contribution, the parent bank should provide a minimum of US$10 million to its OBU. OBUs are exempt from maintaining the cash reserve ratio (CRR); statutory liquidity ratio (SLR) exemption may be considered for a specified period on request from individual banks.139 OBUs are expected to provide loans at international rates to companies located in SEZs; nonetheless, OBUs in SEZs are not allowed to accept or solicit deposits or investments from Indian residents, or open accounts for them.
264. Other measures to promote the competitiveness of the banking sector include the RBI's efforts to improve corporate governance, in transparency, offsite surveillance, and prompt corrective action. A consultative group of directors of banks and financial institutions was established in November 2001. The group's report submitted to the RBI in April 2002, provided various recommendations on corporate governance issues.140 So far, accounting standards have been brought into line with international practices; however, further efforts are needed to align information disclosure.
265. Regional rural banks (RRBs) and rural cooperative banks (RCBs) have performed poorly in recent years, with high NPL ratios. The performance of RCBs is especially problematic as they are closely involved in extending credit to the rural sector. The authorities indicate that, on the whole, RCB profits were marginal in 2004/05, while the majority were loss making; hence, reforms are required to improve their competitiveness. The Task Force on Revival of Rural Cooperative Credit Institutions submitted a revival package in February 2005; the Government, in consultation with state governments, has approved the revival package. The package includes measures to, inter alia, provide financial assistance, introduce legal and institutional reforms, and improve the quality of management. So far, it has been accepted by 11 states and one union territory141; eight states have already signed MoUs with the Central Government.142 The implementation of the revival package is monitored by the National Implementing and Monitoring Committee (NIMC), established by the Central Government in April 2006.
266. RRB mergers have been encouraged: according to the authorities, the number of RRBs declined to 102 in October 2006, from 196 in March 2005. The ratios of gross and net NPLs of RRBs fell from 8.5% to 7.3% and from 5.1% to 4%, respectively, between 2004/05 and 2005/06. The Reserve Bank also set up a "Task Force on Empowering Boards of Regional Rural Banks for Improving Their Operational Efficiency" in September 2006.
(b) Insurance
Overview
267. The Insurance Regulatory and Development Authority (IRDA), established in 2000, is the insurance sector regulator. Its functions include supervising the development of the sector, granting
139 For all banks (except OBUs), the CRR is 5% and the SLR is 25%.140 These recommendations include criteria for appointing bank directors, maintaining independent
directors for checks and balances, clarifying the roles of boards, including on issues related to risk exposure and NPL ratio, and tightening risk management. The criteria for appointing bank directors were included in a circular issued by the RBI in June 2004.
141 The 11 states are Andhra Pradesh, Gujarat, Madhya Pradesh, Maharashtra, Orissa, Punjab, Rajasthan, Sikkim, Tamil Nadu, UP, and Uttaranchal; the union territory is Dadra and Nagar Haveli.
142 These are Andhra Pradesh, Gujarat, Madhya Pradesh, Maharashtra, Orissa, Rajasthan, UP, and Uttaranchal.

India WT/TPR/S/182Page 131
licences to insurance intermediaries, and specifying the percentage of insurance business to be undertaken in rural areas and the social sector.143
268. Structural reforms include reducing government interference in the state-owned Life Insurance Corporation (LIC), and General Insurance Corporation (GIC), both of which have dominant positions in the industry.144 Competition from private domestic and foreign enterprises has also been promoted. Currently, there are 16 life insurance companies (15 private and 1 public), 15 general insurance companies (9 private and 6 public), and one reinsurance company. Increased competition has resulted in rapid growth in the industry; between 2001/02 and 2005/06, the average annual growth rate of total life insurance premiums was 27.8%, and the corresponding figure for general insurance was 16.5%. The market share of private insurers increased from 12.6% in 2003/04 to 26.5% in 2005/06 for life insurers, and from 14.5% to 26.3% for general insurers.
269. The insurance industry continues to be dominated by SOEs. The market shares of LIC and GIC, in life and general insurance, although lower than in 2003/04 (87.4% and 85.5%, respectively), were still 73.5% and 73.7%, respectively, in 2005/06. Competition in the industry is constrained by the relatively high entry barriers: the minimum capital required to set up an insurance company is Rs 1 billion, and that for a reinsurance company is Rs 2 billion. Foreign investment is restricted to 26% of total investment; an amendment to increase the restriction to 49% is under consideration by the Government. Restrictions also remain with regard to raising funds from NRIs, where only cash injections from shareholders are permitted.
270. All insurance companies are required to maintain a solvency margin at a ratio of 1.5 (ratio of actual to the required solvency margin).145 In 2004/05, 11 life insurance firms complied with the requirement (including the LIC); in general insurance, two public-sector firms, and one private-sector firm, did not comply.146
Further reform
271. The Tariff Advisory Committee under the IRDA determines premiums for fire, motor vehicle, engineering, and workmen's compensation insurance; the insurance companies set premiums for all other general insurance categories. The authorities consider that the current tariff regime is inconsistent with increasing competition; hence, the Government notified plans to replace the system with a risk-based rating system by 2007. Controls on tariff rates were to be removed on 1 January 2007; and from 31 March 2008, terms and conditions can be negotiated between companies and their clients.
272. In 2005, the penetration rate as a percentage of GDP was low, at 2.53% for life insurance and 0.62% for general insurance. Penetration in rural areas is particularly low; thus, in 2003, the Government set up a working group on micro-insurance to increase the penetration of insurance in rural areas, by, for example, allowing cross-selling of insurance products between life and general insurance companies. Other measures to increase rural insurance coverage include a National Agriculture Insurance Scheme (NAIS), operated by the Agriculture Insurance Company of India.
143 The "social sector" includes the "unorganized" sector, informal sector, economically vulnerable or backward classes, and other categories of persons both in rural and urban areas.
144 The Government has signed "statements of intent" (SOIs) with companies, containing quantitative and qualitative parameters, with which the performance of these companies would be monitored.
145 IRDA (2005). The solvency margin required for life insurers is Rs 500 million and a sum based on a formula given in the IRDA (Assets, Liabilities and Solvency Margin of Insurers) Regulations 2000. The required solvency margin for general insurers is the highest of: Rs 500 million (Rs 1 billion for reinsurers); 20% of net premium income; or 30% net incurred claims.
146 IRDA (2005).

WT/TPR/S/182 Trade Policy ReviewPage 132
Subsidized by the Government, the NAIS requires insurance companies to provide a certain percentage of their business to rural and socially backward sections of society.147
273. Increased penetration is also pursued in health insurance, which covers only 1% of the population. Currently, the health insurance industry is dominated by charitable institutions and government agencies, which provide insurance services free of charge, as well as family-run businesses. To increase the coverage of health insurance, the IRDA launched a Universal Health Insurance Scheme (UHIS), with subsidies provided by the Government. The UHIS was modified in July 2004, and was restricted to families below the poverty line (BPL).148 A health insurance working group was also established to examine the promotion and development of health insurance. Furthermore, a committee established under the IRDA made several recommendations on issues related to, inter alia, minimum capital requirements, risk-based price setting, and restrictions on foreign investment.149
(c) Securities
274. Since the Securities and Exchange Board of India (SEBI) was established in 1992, the securities sector has been developing fast, due largely to a series of structural reform measures. 150
Currently, there are 22 "recognized" stock exchanges in India, all regulated by the SEBI under the Securities Contract (Regulation) Act 1956, and the SEBI Act 1992.151 The two largest are the National Stock Exchange (NSE), and the Bombay/Mumbai Stock Exchange (BSE), both listing essentially the same stocks. As at 31 October 2006, there were 1,125 and 4,790 companies listed in the NSE and the BSE, respectively. 152
275. Foreign investment is allowed, either in the form of foreign institutional investment (FII), or their sub-accounts153. FIIs are permitted to invest in all types of securities, but are generally restricted to a maximum of 24% of a company's paid-up capital; this restriction can be increased to the sectoral limit.154 Furthermore, FII investment is limited to US$2 billion in government securities, US$1.5 billion in corporate securities155, and US$9 billion for external commercial borrowings.156
147 The requirement is based on the IRDA Obligations of Insurers to Rural Social Sector Regulation 2002. The authorities state that the regulation is currently under review.
148 Under the revised UHIS, Rs 200 per year is provided for an individual, Rs 300 for a family of five, and Rs 400 for a family of seven. By end-November 2006, public-sector companies had issued 46,464 policies, covering 63,935 families and 201,090 individuals.
149 The Committee recommendation to reduce the capital requirement for exclusive health insurers to Rs 0.50 billion is under consideration by the Government.
150 For example, the Depositories Act 1996 came into force to increase trading efficiency and improve transparency. To diversify products, and enable market participants to manage risks better, the Securities Contract (Regulation) Act 1956 was amended to allow for derivative trading, which commenced in 2000, and is limited to the NSE and the BSE.
151 It seems that some stock exchanges in India are not recognized by the SEBI. 152 The authorities indicate that, as at October 2006, the value of shares traded on the NSE and BSE was
US$343.33 billion and US$56.5 billion, respectively.153 Sub-accounts are those opened by FIIs operating in India for other foreign companies, foreign
individuals, or foreign institutions.154 The sectoral limit is the aggregate amount of foreign investment (including FDI and FII) permitted
in a particular sector, as specified in India's foreign investment policy.155 These limits were increased from US$1.75 billion and US$500 million, respectively, in April 2006. 156 The RBI announced increases in the limit for FII investment in Government Securities to
US$2.6 billion by 31 December 2006, and to US$3.2 billion by 31 March 2007. Further, in July 2006, the RBI allowed banks to increase capital funds to meet the BASEL II requirements by issuing certain financial instruments, such as "innovative perpetual debt instruments" and "debt capital instruments".

India WT/TPR/S/182Page 133
Accordingly, the number of FIIs registered with SEBI increased from 685 in 2004/05, to 882 in 2005/06, and to 1,030 by mid-January 2007.157
276. The Securities Law (Amendment) Act 2004 was enacted to increase the sector's efficiency, Under the Act, all stock exchanges must be corporatized; hence, the ownership and management will be separated from the trading rights of the members of a recognized stock exchange, and the stock exchanges will change from not-for-profit entities to profit-driven corporations. In addition, 51% of the equity of the corporatized stock exchange should be owned by the public (other than shareholders having trading rights), within 12 months of publication of the corporatization scheme. The authorities state that the corporatization of stock exchanges will ensure greater accountability and improve transparency, apart from addressing the issue of conflict of interest.
277. In addition, from January 2006, all listed companies are required to adopt the corporate governance requirements specified in the listing agreement; all new listings must meet these requirements at the time of listing.158 Furthermore, the Government announced in the Budget 2004/05 the intention to establish a separate trading platform for small and medium-sized enterprises (SMEs). In this regard, the BSE has set up IndoNext, under the present BSE Online Trading (BOLT) System, to help SMEs to raise capital. Tax incentives have also been provided since 2004/05: from 2004 taxes were removed on long-term capital gains, and reduced to 10% on short-term capital gains. In the 2005/06 Budget, a one-time exemption from stamp duty was granted to facilitate the corporatization of stock exchanges. The securities transaction tax (0.15%) remains in place.
(iv) Telecommunications
(a) Introduction
278. Since the previous Review of India, the regulatory framework for telecommunications services has changed little. The telecom industry is administered under the Indian Telegraph Act 1885, the Indian Wireless Telegraphy Act 1933, and the Telecom Regulatory Authority of India Act 1997. The Telecom Regulatory Authority of India (TRAI), established in 1997, continues to be the regulator; its objectives are, inter alia, to regulate telecommunications services, protect the interests of service providers and consumers, and ensure the development of the telecom sector. The Department of Telecommunications (DOT) is responsible for policy formulation and issuing licences for telecom services.159 The DOT also administers the two public-sector companies, the Bharat Sanchar Nigam Limited (BSNL), and the Mahanagar Telephone Nigam Limited (MTNL).160 In addition, dispute settlement is the responsibility of the Telecom Disputes Settlement and Appellate
157 According to the IBEF, by 17 January 2007, the number of FIIs registered with SEBI increased to 1,030. Viewed at: http://www.ibef.org/economy/foreigninvestors.aspx [22 February 2007].
158 Companies are required to file a quarterly compliance report with the stock exchanges, which in turn have to submit a consolidated report to SEBI within 60 days from the end of each quarter. For the quarter ending June 2006, in the NSE, 1,001 out of 1,085 companies required (around 92%) submitted the report. In the BSE, 2,546 out of 4,127 companies required (around 62%), submitted the report.
159 India is divided into 23 telecom service areas (consisting of 19 circle service areas and four metro service areas). Licences are issued for a specific service area; however, an operator can apply for a licence in more than one service area as long as it fulfils all the eligibility requirements set by the DOT. The eligibility requirements include restrictions on foreign investment, and that the majority of directors on the Board must be resident Indian citizens (DOT online information. Viewed at: http://www.dotindia.com).
160 In October 2000 when the Department of Telecom Services (DTS) and the Department of Telecom Operations (DTO) were corporatized, the business of providing telecom services was transferred to BSNL, a newly established company under the Company's Act 1956. The MTNL is majority government owned (56.25% of total equity), and provides basic landline, mobile, long distance, and trunk call services in Mumbai and Delhi.

WT/TPR/S/182 Trade Policy ReviewPage 134
Tribunal (TDSAT).161 Since 2001, TDSAT has dealt with 1,491 cases; as at 22 December 2006, 1,156 had been settled and the remainder were pending. Most disputes handled by the TDSAT involve non-payment/withholding of duties, or different interpretations of regulations.
279. The telecom industry has grown rapidly since 2002: the number of subscribers (for fixed line and cellular phone) increased from 44.97 million in March 2002 to 183.5 million in November 2006; the average annual growth rate was 35%. The driver of growth has changed from fixed line to mobile telephony, which grew from 13 million subscribers in 2003 to 143.1 million in 2006. Private service providers have also increased significantly, accounting for 64.1% of total phones in November 2006, up from 15.1% in March 2002. The private service providers have concentrated on providing mobile phone services, as fixed line telephony services remain dominated by the public sector providers, although their market share fell from 98.6% in 2001/02 to 92.6% in November 2006.
(b) Structural reforms
280. To simplify the licence regime, a Unified Access Service (UAS) licence regime for fixed line and cellular services was introduced in November 2003.162 The UAS regime allows an operator to provide any or all types of services permitted in the licence; thus, operators are no longer required to have separate licences for each type of service provided. Furthermore, in April 2004, licence fees were reduced by 2%; current fees range from 6% to 10% of adjusted gross revenue (AGR) for UASs in the designated service area.
281. Restrictions to foreign investment have been relaxed since 2000, when 100% foreign ownership was allowed for internet service providers (ISPs) without gateways, infrastructure providers providing dark fibre, and electronic and voice mail services; companies providing these services must, nonetheless, divest 26% of equity in favour of the Indian public in five years, if they are listed outside India. From 2001, 74% foreign ownership was permitted for ISP with gateways, radio paging, and end-to-end bandwidth services.163 In November 2005, foreign investment equity restrictions were increased from 49% to 74% in certain areas, such as fixed line, cellular, unified access services, national and international long-distance calls services.164
282. At the sub-sectoral level, unrestricted entry was permitted for national long-distance (NLD) calls in August 2000, with no limit on the number of service providers. Currently, there are two publicly owned and 14 private NLD operators. The NLD licence is issued for 20 years, and can be extended once for ten years. From 2006, entry requirements have been reduced for NLD operators; entry fees were reduced from Rs 1 billion to Rs 25 million, and licence fees from 15% to 6% of AGR. In addition, the mandatory roll-out obligations for NLD licences were removed on 14 December 2005.165
161 TRAI was formed under the Telecom Regulatory Authority of India Act 1997, amended in 2000. The amendment provided for the establishment of TDSAT, which deals with disputes between licensors and licensees, service providers, and between service providers and consumers, with regard to any TRAI order or decision. TDSAT has both appellate and original jurisdiction.
162 The TRAI issued guidelines on the UAS, effective on 11 November 2003. UAS operators are free to provide, within their area of operation, services covering collection, carriage, transmission, and delivery of voice and/or non-voice messages over the licensee's network. DOT online information. Viewed at: http://www.dot.gov.in/basic/basicindex.htm.
163 Foreign investment in these services is also subject to licensing and security requirements notified by the Department of Telecommunications.
164 FDI up to 49% may take place through the automatic route. Proposals need to be approved by the Foreign Investment Promotion Board if foreign investment is over 49% (Department of Industrial Policy and Promotion, 2006b).

India WT/TPR/S/182Page 135
283. Deregulation of international long-distance (ILD) calls has continued since the privatization of the Videsh Sanchar Nigam Limited (VSNL) in February 2002.166 Licences for ILD services are issued initially for 20 years, with an automatic extension for five years. Like the NLD sector, there is no limit on the number of service providers. There are nine private and one public ILD service providers; private operators account for more than 90% of market share. In January 2006, a new ILD licence agreement reduced entry fees from Rs 250 million to Rs 25 million, and licence fees from 15% to 6% of AGR. Furthermore, there are no mandatory roll-out obligations for ILD service licensees except to have at least one switch in India.167
284. The broadband policy announced by the DOT on 14 October 2004 allows service providers to access mutually agreed commercial arrangements, so as to use the available copper-loop for the expansion of broadband services. The authorities expect that there will be 20 million subscribers to broadband services, along with 40 million internet subscribers, by 2010.168
(c) Tariff policies
285. In September 2002, the requirement for cellular service providers to obtain approval from the TRAI on tariff changes was removed. Currently, TRAI regulates tariffs for services where markets are not competitive; according to the authorities, these are rural fixed line telephone calls, national roaming in mobile phone calls, and leased circuits. Tariffs for all other telecom services have been liberalized. Increased competition as a result of deregulation, together with tariff rationalization measures, have resulted in significant tariff reductions: the peak national long distance tariff (above 1,000 km) fell from US$0.67 per minute in 2000 to US$0.02 per minute in 2006, the international long-distance tariff for the United States fell from US$1.36 to US$0.16 per minute, and the mobile phone tariff for local calls fell from US$0.36 to US$0.009-0.04 per minute.
286. In 2006, the public sector operators, BSNL and MTNL launched a "One India" plan; from 1 March 2006, customers pay Rs 1 per minute for domestic long-distance calls (their fixed line and cellular).169 Also from 1 March 2006, the authorities decided to change the access deficit charge (ADC) regime.170 The ADC charges were recovered by: a per minute charge on incoming and outgoing international calls; and a 1.5% revenue share on the adjusted gross revenue (AGR) of all telecom service providers, apart from revenue generated from the rural subscribers. According to the authorities, the ADC is to be replaced by the USO regime (see below).
165 DOT online information, "ILD and NLD Licences Simplified". Viewed at: http://www.dot.gov.in/ild/ILDNLD10NOV05.doc.
166 The Government used to be the majority shareholder (53% of equity) of the VSNL until February 2002, when it sold 25% stake to the TATA group. VSNL employees hold 2% of shares, and the Government currently holds a 26% stake.
167 DOT online information, "ILD and NLD Licences Simplified". Viewed at: http://www.dot.gov.in/ild/ILDNLD10NOV05.doc. Under the previous mandatory roll-out obligations, within three years of obtaining a licence, an ILD operator had to set up four international gateways/switches in each part of the country (north, south, east and west), and be able to connect calls to an international destination via regional hubs in, for example, North America, Europe, and Middle East.
168 By the end of September 2006, there were 8 million subscribers, including 2 million broadband subscribers.
169 Ministry of Finance (2006b), p. 185.170 The ADC had been an amount paid by telecom service providers at the callers end, to telecom
service providers at the receivers end on cellular to fixed line calls, and domestic long-distance calls. The ADC was charged to subsidize the cost incurred by service providers in providing services in rural areas and for local facilities.

WT/TPR/S/182 Trade Policy ReviewPage 136
(d) Reform in rural areas
287. From March 2002 to November 2006, telephone density in India increased from 4.3% to 16.3%. However, density was much higher in urban areas (51.5%) than in rural areas (1.85%). In order to improve telephone access in rural areas, a universal service obligation (USO) commenced in April 2002.171 Supported by a levy of 5% of the AGR of all telecom service providers (except value added service providers like Internet, voice mail, e-mail services), the USO fund is distributed through a bidding process to, inter alia, village public telephones (VPTs) and rural community phones (RCPs). The Government has set a target of one phone per three rural households by 2007 (about 50 million rural connections), and one phone per two rural households by 2010 (about 80 million rural connections). In addition, the Government intends to subsidize the construction of 7,871 infrastructure sites for the provision of mobile phone services in rural and remote areas. So far, 90% of villages in India have VPTs.
(v) Transport
(a) Road and rail transport
Road transport
288. Nearly 65% of freight and 85% of passenger traffic is carried by road in India. National highways (NHs) form the economic backbone of the network; those connecting all the major cities and state capitals constitute around 2% of the total road network172, but carry nearly 40% of the total road traffic. Under the Indian Constitution, national highways are maintained by the Central Government; they form the main long-distance highways in the country. The varied climatic, demographic, and traffic situation prevents uniformity of national highways: they six-laned in some parts, to even "non-metalled" stretches in remote areas; many NHs are being upgraded/refurbished.
289. The policy focusing on improving road connectivity across the country has brought about significant investment in road development. The scale and quality of highways are considered to be critical for sustaining India's growth momentum. Road maintenance and upkeep are underfunded; however, this is being addressed in the Tenth Five Year Plan (2002-2007), which assigned high priority to the seven-phase National Highway Development Programme (NHDP) being implemented by the National Highways Authority of India (NHAI).173 The Government realizes the importance of the road network and its maintenance, which is evidenced by the increase in the budgetary allocation for NHDP. The NHDP envisages investment of Rs 2,200 billion (US$50 billion) on concessions/contracts to be awarded by 2012. NHDP sub-projects under phases III-VII are to be funded on a build, operate, and transfer (BOT) basis, where private investment is to be recovered through tolls. The private component in phase II has also been increased. The Government has already approved projects for upgrading approximately 11,000 km of roads and highways as well as the construction of 1,000 km of new expressways, under phases III, V and VI of the NHDP, at an estimate cost of Rs 800 billion.174 The entire NHDP is scheduled to be completed by December 2015.
290. The National Highways (Amendment) Bill, 1995, provides for private investment in the building and maintenance of these arteries. The Government carries out and bears the cost of all preparatory work including the project feasibility study, land acquisition, environmental clearance,
171 The Universal Service Support Policy came into effect on 1 April 2002.172 Out of a total of about 66,590 km, 32% are single lane/intermediate lane, 56% are two-laned, and the
rest are four lanes or more.173 For more information on road policy matters, see NHAI online information. Viewed at:
http://www.nhai.org/index.asp.174 Ministry of Finance (2006b).

India WT/TPR/S/182Page 137
etc.175 Rights of way (ROW) are then made available to concessionaires free of all encumbrances. Projects are assigned on a BOT basis, and real estate development can be made an integral part of these projects to enhance their financial viability. The Government retains ownership of the land for highway construction and roadside facilities. The NHAI may provide capital grants of up to 40% of the cost of the project to enhance viability, on a case to case basis. A 100% income tax exemption is given for any consecutive ten-year period out of 20 years of operation, (including the construction period). Duty-free imports are permitted for specified, modern high capacity equipment for highway construction. The concession may be granted for up to 30 years; the road is then transferred back to the NHAI by the concessionaire.
291. Up to 100% FDI has been permitted in roads since 1997. The NHAI can participate with up to 30% of the total equity in BOT projects.176
292. International competitive bidding is used for projects financed by international lending agencies and for larger projects for which sufficient numbers of domestic consultants/contractors/consortium are not available. Local (national) bidding is used for projects financed by the NHAI. At present there are 46 foreign contractors from 27 countries working on 85 different projects sanctioned by the NHAI. National treatment is provided to foreign investors; however, for registration purposes, proof of residence is needed.
293. The Government plans to replace the Carriers Act 1865 with the Carriage by Road Bill 2005. The new Bill would require all freight booking companies to be registered and have a record of the movement and type of cargo, and to declare taxed and untaxed cargo. Furthermore, under the provisions of the Bill transport/booking companies would be liable for the safe delivery of goods based on their invoice value.
Railway transport
294. India's rail network, one of the largest and busiest in the world, is considered as the lifeline of its transport infrastructure. According to the authorities, during 2005 Indian Railways (IR) transported approximately 6 billion passengers and 667 million tonnes of freight. Most of the freight is loaded and unloaded at IR's dedicated freight sidings. Utilization of different segments of the network is uneven; the trunk routes connecting the four metropolitan cities of Delhi, Kolkata, Chennai, and Mumbai account for 16% of the total network, but are responsible for more than 50% of the traffic.
295. Rail transport is reserved for the state and is a state-owned monopoly. However private participation and foreign investment is permitted in many non-core areas and activities, including hospitality (tourism and catering), construction and management of freight terminals, and freight operations. Furthermore, public-private partnerships (PPPs) are being encouraged in infrastructure construction projects.
296. IR is one of the world's largest employers, with more than 1.4 million employees. It is controlled by the Central Government via the Ministry of Railways. A seven-member Railway Board, reporting to the Union Minister for Railways, is responsible for policy formulation and overall control of the railways. Significant changes to the railway network have taken place, such as strengthening and modernizing through doubling, multiplication, electrification, and new line
175 In the Budget for 2007/08, the Government has increased allocations for the preparatory fund for road projects.
176 National Highway Authority of India. Viewed at: http://www.nhai.org/page10.htm.

WT/TPR/S/182 Trade Policy ReviewPage 138
extensions. However, a sizeable area of the country remains inaccessible by rail, which offer immense opportunities for rail infrastructure and terminal development.177
297. IR manufactures its own rolling stock and heavy engineering components.178 This is largely for historical reasons, mainly related to import substitution of expensive technology-intensive products. According to the authorities, the import content in the production of rolling stock is under 4%. Several other public entities under the administrative control of the IR ensure railway and railway-related operations.179
298. IR significantly improved its performance during 2004/05-2005/06; freight and passenger traffic grew by 9.4% and 7.4%, respectively – much higher than the historical rate of 4% and 2% over the 13 preceding years. IR earns around 67% of its revenue and most of its surplus from the freight sector, and uses this surplus to cross-subsidize the loss-making passenger segment.180 According to the authorities, in 2003/04, subsidies for passenger services, operation of uneconomic branch lines, essential commodities carried below cost, and new lines opened for traffic were estimated to be Rs 57.38 billion (US$1.25 billion). However, competition from trucks and low-cost airlines, which offer cheaper rates, has led to a decrease in rail tariff in real terms. Other IR problems include its high accident rate (although the authorities indicate that this has improved), overcrowding, and ticketless travel, as well as antiquated communication, safety, and signalling equipment.
299. A 2001 report (the Mohan report) by an expert group appointed by the Ministry of Railways argued for radical structural change. The report stressed that the railways should be run on commercial lines and that subsidies should be transparent; IR should start divesting "non-core" activities, such as catering and manufacturing, and should reduce staff numbers; the Railway Board should shed its conflicting responsibilities as regulator and policymaker, and should start producing intelligible accounts. Other recommendations were that IR should establish standard commercial criteria for its investments and should stop using its freight customers to subsidize passenger fares.181
300. A reform strategy to recapture the predominant position of railways in the transport sector has been built around generating capacity by improving the existing infrastructure and assets. On the
177 Financial Times, 24 April 2006, "Railways: The shift from socialism has 'passed us by'". Viewed at: http://www.ft.com/cms/s/6fd78b5e-d149-11da-a38b-0000779e2340,dwp_uuid=894d591e-d9c4-11da-b7de-0000779e2340.html [20 November 2006].
178 The seven state-owned IR manufacturing plants are managed directly by the Ministry of Railways, and their general managers report to the Railway Board. The production units are: Diesel Locomotive Works (Varanasi); Chittaranjan Locomotive Works (Chittaranjan); Diesel-Loco Modernisation Works (Patiala); Integral Coach Factory (Chennai); Rail Coach Factory (Kapurthala); Wheel & Axle Plant (Bangalore); and, Rail Spring Karkhana (Gwalior). Since 2000, some locomotives have been produced in collaboration with General Motors, USA.
179 They include the Central Organisation for Railway Electrification (CORE), the Centre for Railway Information Systems and a number of public-sector undertakings such as: the Indian Railways Catering and Tourism Corporation; Konkan Railway Corporation; Indian Railway Finance Corporation; Mumbai Rail Vikas Corporation; Railtel Corporation of India – Telecommunication Networks; RITES Ltd. – Consulting Division of Indian Railways; IRCON International Ltd. – Construction Division; and Rail Vikas Nigam Limited.
180 Most of IR's freight earnings come from carrying bulk goods such as coal, cement, food grains, and iron ore; an estimated 90% of freight comes from nine items benefiting from freight concessions. Some types of freight, for example, fruit, vegetables, and salt are subsidized.
181 According to the railways' own figures: moving one passenger one kilometre made a loss of Rs 0.15 (US$0.003) in 2006; and shifting a tonne of freight one kilometre made a profit of Rs 0.16. Passenger trains account for nearly two thirds of railway services, but produce just one third of revenue. According to a rough calculation by the World Bank, freight tariffs could be reduced by more than 40% if the social burdens (non-recovery of costs from passenger service) were paid directly by the user or the Government.

India WT/TPR/S/182Page 139
supply side, an increase in axle load from 20.3 to 22.9 tonnes as well as reduction in turn-around time from seven to five days have generated the necessary incremental freight-loading capacity.182
Similarly, increasing popular passenger trains by using the spare stocks of coaches and mopping up the slack has led to increased carrying capacity per train. These operational innovations have led to lower unit costs of operation in the face of rising input costs. On the demand side, a dynamic and market-driven tariff policy linked to seasonality and price elasticity has been put in place. Across-the-board increases in freight rates have been replaced by selective changes in response to market forces; however, the general trend has been a reduction of tariff in real terms. 183 This transformation has delivered efficiency gains, operating margins, and healthy financial surpluses.184 It is envisaged that by 2012, IR is likely to handle about 70% more traffic.
301. To accelerate the expansion of infrastructure for growth, public-private partnerships (PPPs) have been given a larger role in attaining strategic goals, such as increasing private capital in areas where PPPs can improve efficiency and to control costs.185 IR is looking seriously at all options to remove and prevent any bottlenecks to growth. The gap between the increasing need for rolling stock and the combined capacity of state-owned production units is to be bridged by increasing capacity through a new public-private manufacturing unit.
302. Under a PPP scheme introduced in 2006/07, the operator will run freight trains in a non-discriminatory manner, and IR will collect haulage charges. Furthermore, the operator will be free to set tariffs. The introduction of this scheme ended the monopoly enjoyed by the IR-owned Container Corporation of India (CCI) in the movement of containers. Nevertheless, CCI shifted 20 million tonnes last year, accounting for approximately one third of total international container traffic in India, which is growing at an annual rate of approximately 15%.
(b) Maritime transport
Shipping
303. Around 95% of India's trade in goods is seaborne; 13.7% was on Indian-flag vessels in 2004/05, down from 22.4% in 2001/02. Thus, although India's total trade has grown rapidly during the review period, its maritime transportation has grown at a much slower pace.186 This could be attributed to increased competition from foreign-flag vessels and reduced competitiveness of Indian-flag vessels.187
182 Speeding up the turn-around times is claimed to have added some 24% to freight revenue. 183 The Ministry of Railways has been rationalizing its tariff structure since 2002/03. The objective of
the tariff revision is to reduce existing cross-subsidies and to ensure a more transparent and cost-based rating regime.
184 The generation of revenues by railways was at Rs 136.12 billion (roughly US$3 billion) in 2005/06, up from Rs 23.50 billion (slightly more than US$0.5 billion) in 2000/01.
185 The following projects and/or areas are being implemented: construction of a new dedicated freight corridor; world class railway stations, passenger amenities and commercial utilization of land; operation of container trains and construction of private sidings, inland container depots and rail-side warehouses; the wagon investment scheme; port connectivity works and other infrastructure projects; and parcel services.
186 From 1990/91 to 2005/06, the Indian fleet's total gross tonnage grew at around 1.8% per annum, compared with average trade growth of about 14% (KPMG, 2006). The authorities state that, the number of vessels increased from 560 in 2002 to 739 in 2006, and the growth in tonnage was -9.41% in 2003, 12.4% in 2004, 15.4% in 2005, and 5.64% in 2006.
187 The average age of Indian ships is 16.5 years, compared to the world average of 12.2 years (KPMG, 2006).

WT/TPR/S/182 Trade Policy ReviewPage 140
304. India currently has 774 commercial vessels, with a gross tonnage of 8.4 million tonnes; the three largest companies own more than 60% of gross tonnage.188 The maritime sector contributes around 0.3% to GDP. It is regulated under the Merchant Shipping Act 1958, by the Department of Shipping in the Ministry of Shipping, Road Transport and Highways, which is responsible for the Government's interests in the sector, such as the major ports and the Shipping Corporation of India. 189
Maritime transportation is administered by the Directorate General of Shipping (DGS), under the Department of Shipping. The DGS is also in charge of the registration and safety-related issues of ships.190
305. Competitiveness in India's maritime transport has been affected by infrastructure bottlenecks, together with certain measures adopted by the Government. For example, carriage of government cargo remains reserved first for the Shipping Corporation of India (SCI), then for vessels chartered by the SCI. Accordingly, the Government issued a Draft Policy for the Maritime Sector in February 2005, aimed at improving cost-effective movement of cargo, promoting transparency in the decision-making process, and increasing the efficiency of operations in infrastructure. The policy is to guide maritime transportation to 2025, and is financed through a cess levied for ten years, at Rs 0.05 per kg of foreign-bound cargo passing through Indian ports, and Rs 0.02 per kg for coastal and low value cargo.191
306. Reform measures have been adopted to increase the competitiveness of maritime transportation services. For example, 100% foreign investment is allowed in the shipping sector, including for coastal shipping (Table AII.3).192 Cabotage is reserved for Indian-flag vessels, but foreign-flag vessels are permitted to carry coastal cargo when no Indian-flag vessel is available.193
Moreover, the Government introduced a tonnage tax in 2004/05, with a view to encouraging investment. Instead of the corporate tax, companies may choose to pay the tonnage tax, which is levied on the registered tonnage of a company assuming a certain income from that tonnage. 194 The Government considers the introduction of the tonnage tax contributed to the increase in gross tonnage from 6.94 million tonnes on 1 April 2004, to 8.41 million tonnes on 31 December 2006.195
188 The market shares of the three largest shipping companies are: around 33% for Shipping Corporation India, 22% for Great Eastern Shipping Co., and 11% for Essar Shipping Co.
189 The Ministry of Shipping is responsible for administering maritime transport (including shipping, ports, and related industries), ship building and ship repair, shipping arrangements for the Government and its entities, formulating policy for privatization and infrastructure arrangements, and shipping-related environmental issues. The Shipping Corporation of India is India's largest shipping company, with more than 80 ships and around one third of the gross tonnage of the sector. The Corporation also manages ships belonging to other Government agencies; currently, 52 ships are managed this way.
190 Under the Merchant Shipping Act 1958 and related rules, for a ship to be registered as an Indian-flag vessel, it must be owned by a citizen, or a company, or body established by or under any Central or State Act, with its principal place of business in India, or a cooperative society registered under any law effective in India.
191 Department of Shipping online information. Viewed at: http://shipping.gov.in/writereaddata/linkimages/Draft%20Maritime%20Policy%20_Modified_1939436815.pdf [4 December 2006].
192 However, it seems there has not been any FDI in coastal shipping.193 DGS online information. Viewed at: http://www.dgshipping.com/dgship/final/tcsrep/
Chapter_2_2.htm.194 For details of tonnage tax, see Income Tax Department online information.
Viewed at: http://www.taxmann.com/TaxmannDit/Displaypage/dpage1.aspx?md=2&typ=cn&yr=2006&chp=3570 [8 December 2006].
195 According to the authorities, other reform measures include: simplifying the procedure for purchasing and registering new ships; abolishing the technical clearance requirement for acquiring second-hand vessels (below 25 years of age); and increasing the depreciation rate of vessels from 20% to 25%.
India WT/TPR/S/182Page 141
307. In its GATS schedule India has listed an MFN exemption on cargo sharing (apart from with its bilateral partners: Bulgaria, Pakistan, and the UAE), and cargo reservations under the UN Code of Conduct for Liner Conferences.196
Ports
308. There are 12 "major" ports and 187 "non-major" ports in India; the major ports account for around 75% of total cargo handled. Cargo handled between 1999/00 and 2005/06 increased from 271.9 million tonnes to 423.4 million tonnes for major ports, and from 63.4 million tonnes to 151 million tonnes for other ports.
309. Ports in India are regulated under the Indian Ports Act 1908, which provides guidelines for shipping safety, conservation of ports, and other issues such as charges, penalties, and other services. Eleven of the major ports are managed by Port Trusts, under the Major Port Trust Act 1963, while Ennore Port Limited is the first corporatized major port under the Companies Act. Major ports are administered by the Ministry of Shipping, Road Transport and Highways. In 1997, a Tariff Authority of Major Ports (TAMP) was established to regulate tariffs for all major ports197; non-major ports are administered by respective state governments.
310. Problems in the ports subsector include over-regulation, lack of investment in infrastructure, and the consequent customs clearance delays.198 The Government has introduced a number of policy initiatives to deregulate and to encourage public-private participation in ports. Foreign investment restrictions have been relaxed; there is no approval requirement for up to 51% foreign investment in projects providing supporting services to water transport; automatic approval is granted for proposals with up to 100% foreign equity in construction and maintenance of ports and harbours; and the private sector is invited to participate in open tenders on a build-operate-transfer (BOT) basis. In addition, a "landlord" port model, which separates port ownership from port operations, has been adopted for Ennore Port Limited. Furthermore, the National Maritime Development Programme (NMDP), formulated by the Department of Shipping, envisages investment of over US$13.3 billion to increase the capacity of ports and to promote their competitiveness. As a result, port efficiency has been improved, as the average turnaround time fell from 5.1 days in 1999/00, to 3.5 days in 2005/06.199
(c) Air transport
Introduction
311. Air transport, like other transport services, is important for growth and development. First, efficient air transport services are a key intermediate input to trade in both goods and services sectors (such as tourism).200 Second, air transport services can be traded as a service in their own right. A
196 In its revised offer, India has offered to remove the MFN exemption on cargo reservations. 197 The TAMP fixes tariffs for major ports, but has no jurisdiction over non-major ports (KPMG, 2006). 198 Problems of the ports subsector also include overstaffing, which tends to reduce labour productivity.
Labour employed on vessels, and those working on shore, are subject to different management systems. The Dock Labour Boards are in charge of workers on board, and the port trusts are in charge of workers on shore. The authorities state that, apart from three major ports, the system has been integrated in all major ports. The Government has also initiated measures to rationalize the staffing levels at these ports.
199 However, this is still much longer than the ten-hour average turnaround time in Hong Kong, China, (Ministry of Finance 2007b, p. 194).
200 The contribution of air transport to trade in goods is not limited to the movement of air cargo per se. The transport of natural persons (i.e. business persons) is itself an important input to trade in both goods and other services, as well as to foreign investment in diverse industries.
WT/TPR/S/182 Trade Policy ReviewPage 142
2005 study highlighted the importance of an efficient, effective, and reliable air transport sector, especially in developing countries, in promoting development and facilitating realization of the gains from trade.201
312. Air transport services have blossomed since the termination of the state monopoly over scheduled air transport services in 1994 and subsequent reforms to the domestic regulatory environment. Currently, domestic passengers are served by 13 scheduled domestic operators in addition to 51 companies that provide charter services. New entry and greater flexibility in providing services has benefited consumers through lower fares and substantially expanded services.202
313. Indian air transport services nonetheless face a major challenge in responding to sustained growth in the demand for passenger and cargo transport services (domestic and international) as a result of India's continuing high growth. The demand for air transport services is income-elastic. In an expanding developing country market, it typically increases at as much as twice the rate of GDP. In this context, a failure to provide the level of service demanded at competitive fare-levels can act as a brake on overall growth and development.203
314. Important steps have already been taken to stimulate service expansion and competition in domestic and international air transport services, notably through significant liberalization of entry and pricing in domestic passenger and cargo transport services, and a relatively open environment for international service providers. Nonetheless, further change is needed. First, the scope for continuing (and even more) rapid development of air transport services, as will be needed, is constrained by inadequate infrastructure, notably airports.204 Second, although foreign investment in domestic air services has been substantially liberalized, investment by foreign carriers is prohibited. This represents a barrier to investment flows. Third, a more sweeping approach to international liberalization may be needed.205 Competition in the sector would benefit from the application of effective competition rules, notably with respect to possible mergers.
Implications of projected demand growth in the coming years
315. Air transport in India faces a major challenge in expanding its services to meet the expected increase in demand generated by the country's rapid economic growth over the past decade and projected to continue in the coming years. There are indications that, already, the rate of expansion may not be optimal. In 2005, the International Air Travel Association (IATA) forecast an average rate of growth in international passenger service of 8.4% annually until 2009. When domestic services are factored in, the expected average annual growth rate for the same period is 12%.206 While high by comparison with growth in mature markets, this rate is substantially lower than what would be implied by India's actual and expected annual growth in GDP.207 This lends credence to the concern that lower than optimal expansion in air transport services could become a brake on overall growth in India.
201 WTO (2005), pp. 213-264.202 Ministry of Civil Aviation (2006); and Chattopadhyay (2006). See, for related background,
Mukherjee and Sachdeva (2003).203 See Bisignani (2005).
204 ? Mukherjee and Sachdeva (2003). See also Bisignani (2005). But note that this challenge is being addressed by various initiatives, discussed below.
205 Bisignani (2005). See also WTO (2005).206 According to official estimates provided by India, the rate of growth may be even higher. The
official projected growth for the period 2006-2015 is 20% growth from 2006-07, 15% growth 2008-10 and thereafter 7.2% till 2015 in domestic sectors. In the international sector, the growth rate has been estimated as 11.6% from 2006-08 and 7.2% thereafter till 2015.
207 Bisignani (2005).

India WT/TPR/S/182Page 143
316. International experience suggests that the main factors preventing an adequate supply-side response to demand growth are typically: regulatory restrictions on entry and/or pricing that deter the entry/expansion of new and existing carriers; and limitations on the availability of infrastructure (especially take-off/landing slots and related services), which have the same effects. Another factor can be the nature of arrangements governing international competition in transnational routes, i.e. whether they represent a genuine commitment to "open skies" or are more in the nature of market-sharing arrangements governed by regulations that limit competition. 208 The application of formal competition rules (i.e. anti-trust legislation) may also be a factor.
Liberalization of the domestic regulatory framework
317. Indications are that India has effectively addressed the first type of potential impediment to competition and growth in service capacity. Since the 1990s, regulatory restrictions on entry and pricing in domestic air transport services (both passenger and cargo services) have been progressively removed. The Directorate-General of Civil Aviation has explicitly adopted a philosophy of facilitating entry by responsible carriers. Regulatory approval of new entrants is now based on criteria such as mechanical fitness, safety, and financial responsibility. This has facilitated significant new entry, including by low-cost carriers providing domestic services.209 Similar liberalization has taken place with respect to pricing: in 2004, the Government abolished the requirement for domestic and international carriers to file their tariffs with the Government.
318. Evidence suggests that these changes have facilitated entry and strengthened competition: in the past three years, seven airlines have entered the Indian aviation market, of which five are low cost carriers.210
319. There are two potentially significant caveats to this positive overall assessment. Although foreign investment by individuals has now been substantially liberalized (up to 49% foreign equity participation is permitted in the domestic sector and up to 100% in the case of non-resident Indians), foreign airlines are not allowed to invest in the domestic sector.211 This constitutes a barrier both to foreign investment and to the technology transfer that it can bring.
320. In addition, domestic air services in India have been subject to an elaborate system of cross-subsidization: carriers providing services in high-value routes linking India's major commercial centres (Category I) have had to provide, as a social obligation, minimum levels of service on routes to the north-eastern regions (Category II) and other low-volume routes (Category III). This has affected the efficiency of services, since aircraft suitable for one set of routes were not necessarily optimal for the others.212 The policy has nonetheless been considered necessary for regional development, in particular the development of backward regions of the country.
Challenges in air transport infrastructure
321. Infrastructure facilities at airport terminals are provided principally by the Airports Authority of India, under the Ministry of Civil Aviation. The availability of take-off and landing slots and other
208 WTO (2005). In addition to the availability of infrastructure services, the quality of such services is an important consideration.
209 Ministry of Civil Aviation (2006).210 Kingfisher (2005) and Paramount Airways (2005); the low cost carriers are: Air Deccan (2003);
Spice Jet (2005); Go Air (2005); Indigo (2006); and Indus Airways (2006).211 For airports in Greenfield areas, FDI up to 100% is allowed.212 See Mukherjee and Sachdeva (2003), pp. 43-44.
WT/TPR/S/182 Trade Policy ReviewPage 144
infrastructure is a critical factor in overall air transport capacity and there is wide acknowledgement that this is a critical problem for the future of air transport in India.213
322. The Ministry of Civil Aviation and other relevant authorities are aware of these challenges. 214
Efforts are under way to upgrade airports and related infrastructure, such as baggage handling services. The Government is modernizing airports through joint ventures and private participation: at least 35 airports will be covered in addition to Delhi and Mumbai, and Greenfield airports in Bangalore and Hyderabad. Nonetheless, upgrading India's airports and related infrastructure will be a major challenge: past efforts have apparently faltered due to a lack of resolve and follow-through.215
International liberalization and bilateral air service agreements
323. India has signed bilateral aviation transportation agreements with approximately 100 countries. This reflects an explicit commitment to the principles of "open skies" beginning in the winter season of 1999-00. The agreements have been a major factor in enhancing the frequency and quality of passenger services to and from India (Table AIV.1).
324. In India, as in other countries, a policy of open skies does not imply that the market is completely open and competitive. Landing rights are often awarded to the designated carriers of each partner on a reciprocal basis, with limited or no scope for competition from third-country carriers. Cabotage rights are not provided. Nonetheless, India has adopted a progressively more liberal stance toward the designation of multiple carriers and the granting of new points of call to foreign airlines.216
A question for the future is whether India (and other countries) might be better served by broader regional or multilateral liberalization in the sector.217
Mergers and competition in the sector
325. There is currently, the possibility of one or more major mergers among the existing air carriers in India. The Government is thought to favour a merger between Air India and Indian Airlines, the two national (state-owned) carriers. It is considered that this may lead to scale economies and other efficiencies in services provision (i.e. more efficient coverage of routes, etc.). However, much evidence suggests that the benefits of mergers in the airline sector (e.g. cost savings and efficiencies) are often less extensive than anticipated.218 Mergers can also result in a reduction of competition and the choices available to consumers. This highlights the need for effective application of national competition rules (i.e. the new Competition Act, 2002) in this sector.
213 In late 2005, the Director-General of IATA made the following observation on the state of India's airports and related infrastructure: "Without massive change, infrastructure will not be able to handle growth. Airports in Delhi, Mumbai, Chennai, Kolkata, and Bangalore are not adequate. Among them, Mumbai is the worst: service levels are not acceptable; delays are common and future growth cannot be accommodated" (Bisignani, 2005).
214 Ministry of Civil Aviation (2006), Chapter 7; see also Chattopadhyay (2006).215 Mukherjee and Sachdeva conclude that "Overall, the government's airport privatization policy [has
been] marked by indecisiveness, inconsistency and lack of transparency" (Mukherjee and Sachdeva, 2003, p. 45).
216 Ministry of Civil Aviation (2006); and Chattopadhyay (2006).217 WTO (2005).218 WTO (2005), and references cited therein.

India WT/TPR/S/182Page 145
(vi) Professional services
(a) Engineering services219
163. The performance of India's engineering subsector is linked to that of industries, power utilities, and petroleum refining, and has been driven by growth in key end-user industries, as well as a preference by global manufacturing companies as an outsourcing destination.220 It employs over 4 million skilled and semiskilled workers (directly and indirectly), and accounts for over 7% of total (formal) employment; this share is increasing.
326. Indian engineering goods and services are gaining acceptance in overseas markets; engineering exports, 40% of which are generated by SMEs, crossed the US$10 billion mark in 2003/04 and are expected to be worth US$23 billion in 2006/07. Engineering companies have a huge potential for exports and outsourcing; according to the National Association of Software and Service Companies (NASSCOM), engineering services outsourced to India have a market potential of US$7-12 billion.221 Furthermore, the authorities envisage that the rapid development of Engineering Process Outsourcing (EPO) services from India will have a far-reaching impact on the domestic engineering industry.222
327. The industry comprises multinational companies, joint ventures, large domestic players, regional players in the organized sector, and a large number of small players in the unorganized sector. Public-sector enterprises play an important role in heavy engineering with 34 companies.
328. Fiscal and other investment incentives have had a positive impact on the engineering subsector and helped it to become competitive. Engineering services are a significant input in various activities that are open to foreign investment, such as infrastructure projects for power, roads, ports, mining sector (except coal), and construction and development projects. India's GATS commitments for market access in this subsector indicate that commercial presence must be through incorporation, with a foreign equity ceiling of 51%.
329. There is currently no legislation governing engineering but such legislation is being drafted. Regulation is under the ambit of legislation that governs the other industrial sectors. Since 1955, the Engineering Export Promotion Council (EEPC), under the sponsorship of the Department of Commerce, has promoted exports of engineering goods, projects, and services. The EEPC also operates the Indian Engineering Centre, which sends product-specific delegations abroad, participates in specialized trade fairs including engineering exhibitions, and hosts product-specific seminars and conferences. Since 1984, the Project Exports Promotion Council of India (PEPC) has undertaken export promotion initiatives, to support Indian engineering contractors and consultants to set up
219 Engineering services (e.g. planning, design, natural resources, civil, building engineering) are found, inter alia, under UN Common Coding System item 512000 and Central Product Classification (CPC) 8672. This section, which is intended to focus on engineering services only, is largely based on o nline information by: IBEF (2006a); Engineering Export Promotion Council (2005); and Ministry of Commerce and Industry (2006a).
220 Around 36% of total FDI is directed towards the engineering industry. Recently, the authorities permitted 100% FDI in construction and development projects. India has opened up infrastructure projects for power, roads, ports, the mining industry, and pharmaceuticals to private-sector participation and FDI.
221 The five main countries where major services are being outsourced are Canada, India, Ireland, the Philippines, and the Russian Federation. While Canada and Ireland are on the high-cost side, the Philippines, the Russian Federation, and India are the low-cost end.
222 Engineering Export Promotion Council Press release, 10 August 2006. Viewed at: http://www.eepcindia.org/pressrelease/PR-100806.pdf [28 November 2006].

WT/TPR/S/182 Trade Policy ReviewPage 146
overseas projects in, inter alia, civil construction projects, and related process and engineering consultancy.
(b) Legal services223
330. India has the world's second largest legal profession, with more than a million lawyers. Indian commercial law practice is estimated at approximately Rs 6-6.5 billion a year (US$135.5-146.8 million). Service providers to the domestic market are individual lawyers, and small or family-based firms.
331. According to a recent report, increasing levels of interest in offshore-outsourcing of legal services to India have been aided by steady growth in demand for legal services worldwide; access to its relatively low wage but high skilled human resources; time-zone advantage, enabling round-the-clock, seven-days-a-week operations; and English language expertise. Law firms are the largest service buyers from the Indian legal offshoring industry, contributing about 49% of the total US$61.6 million revenue; others are corporations and legal publishers.224 The market potential for legal services outsourceable from the United States alone is estimated at US$3-4 billion.225 Offshore legal services providers include in-house legal departments of large multinationals that have moved some parts of their in-house legal departments to their India-based units, and units of large multinational law firms. Indian lawyers wishing to expand into the international market face competitive challenges from existing global players, principally internationally focussed legal practices operating from the United States, Canada, the United Kingdom, France, Germany, and Spain.
332. The Advocates Act, 1961 and the Bar Council of India Rules, 1975 regulate the legal services sector.226 The sectoral legislation is administered by the Ministry of Law and Justice. The legal profession is regulated by the Bar Council of India (BCI) (the final regulating body), and state bar councils. The bar councils set the standards for legal qualifications, validate foreign degrees, and set standards for professional conduct and etiquette. They also admit advocates on their rolls (thus allowing them to appear in court).
333. FDI is not permitted in the legal services sector. Foreign law firms are not permitted to open offices in India and are prohibited from giving any legal advice that could constitute practicing of Indian law. India has not undertaken any specific GATS commitment in legal services. However, discussion on liberalization has been initiated via a Department of Commerce consultation paper as well as in different bilateral fora such as the India-UK Joint Economic and Trade Committee (JETCO), the Joint India Australia Consultative Committee on Legal Services (JAICCOLS), and the India-U.S. Legal Services Working Group.
223 Legal services refer to legal advisory and representation services, legal or juridical procedures, and the drawing up of legal instruments or documentation. They correspond to the United Nations Central Product Classification (CPC) 861 at the three-digit level. This section is largely based on online information by Ministry of Commerce (2006d); and Bar Council of India online information. Viewed at: http://barcouncilofindia.nic.in/disk1/functions.htm [20 November 2006].
224 The Hindu, "Legal services offshoring may earn $600 m revenue by 2010", 1 January 2006. Viewed at: http://www.hinduonnet.com/thehindu/thscrip/print.pl?file=2006010102100500.htm&date=2006/01/01/&prd=bl& [20 November 2006].
225 The Hindu, "Playing on a new court", 12 September 2005. Viewed at: http://www.hinduonnet.com/thehindu/thscrip/print.pl?file=2005091200020100.htm&date=2005/09/12/&prd=ew& [20 November 2006].
226 Advocates Act 1961. Viewed at: http://barcouncilofindia.nic.in/disk1/196125.pdf [27 November 2006].

India WT/TPR/S/182Page 147
334. Legal services can be provided only by natural persons who are citizens of India, and who are on the advocates roll in the state where the service is being provided. The service provider can either be a sole proprietorship or a partnership firm consisting of persons similarly qualified to practice law. To be eligible for enrolment as an advocate, a candidate has to be a citizen of India or a country that allows Indian nationals to practice on a reciprocal basis; hold a degree in law from an institution/university recognized by the BCI; and be at least 21 years of age.
335. Further development of the legal profession is restricted by the current regulatory system, which hinders Indian firms from competing effectively against foreign firms in several ways. For example: law firms may only practice through partnerships and the number of partners may not exceed 20.227 In addition, as the sector is defined as a profession rather than an industry by the Bar Council, there are other restrictions: advertising or listing in a legal directory is not permitted, nor is providing multidisciplinary services; and law firms do not have access to finance in the same way as industrial concerns.
336. There is a strong sentiment amongst various members of the profession that permitting even limited access to foreign law firms would lessen opportunities for domestic lawyers; in this respect the BCI has expressed its concerns on various occasions. Given this resistance, the Department of Commerce has published a discussion paper on the state of play in various countries and their expectations from India with regard to liberalization of legal services.228 The stated purpose of this document is "to increase awareness on the main issues, challenges, and, most important, opportunities relevant to the legal services sector".
(c) Healthcare and medical services229
337. According to the authorities, healthcare services in India contribute around 5% of GDP. In addition, the authorities indicate that public spending on health is currently around 1.25% of GDP, up from 0.9% in 1999. The Government plans to increase public spending progressively (by central as well as state governments) on health to 2-3% of GDP by 2012 with a focus on primary healthcare. Public spending is not utilized effectively and access to healthcare services is not uniform due to, inter alia, inefficiencies of the public health system, and poor maintenance of public health infrastructure.
338. Despite India's impressive public health infrastructure, only about 25% of healthcare services are provided by the public health sector, the rest are provided by the private sector. Private-sector participation in health care has been growing significantly over the past few years; it comprises corporations and large hospital groups as well as individuals setting up private practice. Medical services on offer vary from the complex and sophisticated to basic primary healthcare; the latter are provided principally by the Government. Over 70% of medical practitioners are based in urban centres, while approximately 70% of the population live in rural areas. Curative services largely favour the rich over the poor. Only one tenth of the population is covered by any form of health insurance.230 It is estimated that health-related expenditure is one of the causes for rural indebtedness,
227 The Companies (Amendment) Bill 2003 proposes that the limit on the number of partners be raised to 50.
228 Ministry of Commerce (2006d).229 Health and medical services are wide-ranging and found, inter alia, under UN Common Coding
System item 936000 and Central Product Classification (CPC) 9312 and 9312. This section is largely based on online information by: IBEF (2006b); Healthcare Market Review (2003); and Ministry of Health and Family Welfare (2006).
230 According to some estimates, only 3% of India's population is covered under some form of voluntary health insurance (Watson Wyatt online information. Viewed at: http://www.watsonwyatt.com/Europe/pubs/healthcare/render2.asp?ID=11384 [13 March 2007].

WT/TPR/S/182 Trade Policy ReviewPage 148
and out-of-pocket expenditure on hospital care causes almost 25% of hospitalized Indians to fall below the poverty line.
339. The sector has vast potential on account of India's large population, its burgeoning middle class, and medical tourism, which has gained momentum over the past few years. In 2004, 180,000 foreign patients sought treatment in India, a growth rate of 25% over the previous year; the medical tourism industry is worth US$333 million, and is expected to be worth US$2 billion by 2012.231 This trend is underpinned by India's low-cost advantage and the emergence of new high-quality healthcare service providers, as well as long waits for treatment in certain developed countries, lack of adequate medical facilities in developing countries, and agreements signed by health insurance companies with hospitals and hotels in India.232 Many hospitals in India have created specialized international patient departments and offer special packages for patients from abroad, including visa facilitation, and excursions and board and lodging for people accompanying the patient.
340. The National Health Policy 2002 encourages foreign patients via the introduction of paid treatment packages. Treatment of foreigners paid in foreign exchange is treated as exports and thus eligible for all tax incentives extended to export earnings. Indian hospitals are seeking accreditation from international organizations so as to be on an equal footing with hospitals abroad.233 The Government, in collaboration with the Confederation of Indian Industry (CII), is working on accreditation of hospitals; the CII is also formulating minimum quality standards for hospitals. It plans to set up a National Accreditation Board of Hospitals and Healthcare Providers, which is to issue accreditation to public and private hospitals. Furthermore, the Government is planning a Clinical Establishment Act, which would ensure the quality of healthcare provided. Other policy aims include increasing the use of public health facilities from the present 20% to 75% by 2010. This is to be achieved, inter alia, through injecting more funds, allowing and training nurses and paramedics to perform basic public health functions, increasing the prevalence of doctors in rural areas, and encouraging the use of non-traditional medical techniques in rural and remote areas.
341. As indicated earlier, spending on health has not been a priority for successive governments, and they have subsidized the private sector by, inter alia, allowing tax and tariff exemptions for imported drugs and high-tech medical equipment, and selling land at lower-than-market prices as long as a quarter of patients are treated free of charge, a condition that is rarely met. The Government undertook to institutionalize a public-private partnerships (PPP) mechanism in healthcare, from the district level up.234 It is in the process of developing guidelines for PPPs.
342. Allowing 100% ownership for FDI, subject to approval by the Foreign Investment Promotion Board has assisted in opening up the Indian healthcare market to international investors. Indian private-sector operators have been setting up hospitals as joint ventures in collaboration with foreign investors (e.g. from Singapore and Malaysia). So far India has not undertaken any GATS commitments in medical and dental services. Foreign doctors and nurses are not allowed to practice in India except for charitable purposes. Indian doctors trained abroad can practice in India after seeking necessary registration from the regulatory body concerned. There appear to be no plans to lift these restrictions. The authorities believe that, despite a lack of doctors in rural areas, there is no shortage of qualified medical professionals.
231 The bulk of patients come from the United States, the United Kingdom, south and west Asia, and Africa. Tanzania and Mauritius have signed agreements with hospitals in India whereby treatment of their citizens is paid for by their respective governments.
232 These companies are BUPA from the United Kingdom, and Blue Cross Blue Shield from the United States.
233 The accrediting agencies are the Joint Commission International, and the Joint Commission of Accreditation of Hospital Organisations.
234 The health policy of 1983 stressed the need to encourage private initiatives in health services.

India WT/TPR/S/182Page 149
343. The Medical Council of India (MCI), an autonomous body under the Ministry of Health and Family Welfare, is entrusted with establishing uniform standards of higher qualifications in medicine and recognition of medical qualifications in India and abroad.235 In 2005, under a Medical Council of India (Amendment) Bill, the Government proposed to change the composition of the MCI and bring in more of its own appointees, reducing elected members to a minority.236 The Government claimed this would increase the MCI's accountability. It is not clear what progress has been made in this area.
235 Medical Council of India online information. Viewed at: http://www.mciindia.org/index.htm [30 November 2006].
236 India Together online information. Viewed at: http://www.indiatogether.org/2006/mar/law-imcamend.htm [30 November 2006].
WT/TPR/S/182 Trade Policy ReviewPage 150
REFERENCES
ADB/OECD (undated), Thematic review on public procurement: Country information on India. Viewed at: http://www.oecd.org/dataoecd/51/7/ 36759785.pdf.
Aggarwal, Aradhna (2004), Export processing zones in India: Analysis of the Export Performance, Indian Council for Research on International Economic Relations, November, New Delhi.
Aggarwal, Aradhna (2005), Performance of Export Processing Zones: A Comparative Analysis of India, Sri Lanka and Bangladesh, Indian Council for Research on International Economic Relations, February, New Delhi.
Aggarwal, R.P. (undated), "e-Procurement in GoAP". Slide presentation for the National Seminar on Government Procurement New Delhi, 11-12 May 2006. Viewed at: http://www.unctadindia.org/ displaymore.asp?Gr=&chkey=&subitemkey=771&itemid=378&subchnm=Past&subchkey=56&chname=Events.
Ananthakrishnan, Prasad and Sonali Jain-Chandra (2005), "The Impact on India of Trade Liberalization in the Textiles and Clothing Sector", IMF Working Paper WP/05/214, November, Washington, D.C.
Anderson Robert D. and Jenny Frédéric (2004), "Competition Policy, Economic Development and the Possible Role of a Multilateral Framework on Competition Policy: Insights from the WTO Working Group on Trade and Competition Policy", in Erlinda Medalla, (ed.), Competition Policy in East Asia, Routledge/Curzon, Chapter 4.
Anderson, Robert D. (2006), "Meeting the challenges of good governance: the complementary roles of trade liberalization and competition rules in addressing anti-competitive barriers and practices in national procurement markets". Paper prepared for an International Conference on Public Procurement: Global Revolution III, Session on Combating Collusion in Public Procurement University of Nottingham, 19-20 June.
Bhattacharjea, Aditya (2006), "Amending India's Competition Act," Economic and Political Weekly, 14 October.
Bisignani, Giovanni (2005), Aviation in India: Great Opportunities and Great Challenges, 18 October, New Delhi.
Bureau of Indian Standards (2005), Annual Report, 2004-05, New Delhi.
Chadha, R. and P. Sharma (2005), "Liberalizing Indian Agriculture", Margin, Vol. 37, No. 3, April-June, pp. 23-101.
Chakravarthy, S. (2005), "India", in Douglas H. Brooks and Simon J. Evenett, (eds), Competition Policy and Development in Asia, New York: Asian Development Bank and Palgrave MacMillan.
Chattopadhyay P.K. (2006), Air Transport – Changing Scenario in India (November update), New Delhi.
Department of Commerce (2006), Annual Report 2005/06. Viewed at: http://commerce.nic.in/ annual2005-06/englishhtml/cover.htm.

India WT/TPR/S/182Page 151
Department of Industrial Policy and Promotion (2002), Report on Reforming Investment Approval and Implementation Procedures. Viewed at: http://dipp.nic.in/implrepo/implrepo1.pdf.
Department of Industrial Policy and Promotion (2005), Investing in India: Foreign Direct Investment Policy and Procedures, November. Viewed at: http://dipp.nic.in/manual/fdi_manual_11_2006.pdf.
Department of Industrial Policy and Promotion (2006a), Foreign Direct Investment Policy, April. Viewed at: http://dipp.nic.in/publications/fdi_policy_2006.pdf.
Department of Industrial Policy and Promotion (2006b), Foreign Direct Investment Policy and Procedures. Viewed at: http://www.dipp.nic.in/manual/fdi_manual_11_2006.pdf [21 February 2007].
Dhall, Vinod (2005), Competition Advocacy Seminar for Industry: Keynote address, New Delhi, 16 April 2005. Viewed at: http://www.competition-commission-india.nic.in/advocacy/Key_note_ address_by_Member_CCI_industry.pdf.
Dhall, Vinod (ed.) (2007), Competition Law Today: Concepts, Issues and the Law in Practice, Oxford University Press, New Delhi.
Dutz, Mark A. (2002), "Competition policy issues in developing and transition markets". Presentation at the OECD Global Forum on Competition, Paris, 14-15 February.
Engineering Export Promotion Council (2005), Strategy Paper For Growth of Engineering Exports 2005-06 to 2009-10, A.F. Ferguson & Co., Management Consultancy Division. Viewed at: http://www.eepcindia.org/exe-summary-startegy-paper.pdf [16 November 2006].
Government of India (2002a), Report on Reforming Investment Approval and Implementation Procedures, Part II, New Delhi.
Government of India (2002b), Report of the Taskforce on Indirect Tax, 24 December, New Delhi.
Government of India (2004a), Central Government Subsidies in India, Ministry of Finance, Department of Economic Affairs, December, New Delhi.
Government of India (2004b), National Common Minimum Programme, May. Viewed at: http://pmindia.nic.in/cmp.pdf [7 July 2006].
Gupta, M.P. (2006), "New Procurement Policy of Government of India: State Government Policies and Tasks Ahead". Slide presentation for the National Seminar on Government Procurement, New Delhi, 11-12 May. Viewed at: http://www.unctadindia.org/displaymore.asp?Gr=&chkey=& subitemkey=771&itemid=378&subchnm =Past&subchkey=56&chname=Events.
Healthcare Market Review (2003), Healthcare in India. Viewed at: http://www.watsonwyatt.com/ europe/pubs/healthcare/render2.asp?ID=11384 [20 November 2006].
Hoda, Anwarul and Suchi Bansal (2006), Transparency in government procurement. WTO research series, No. 6. Indian Council for Research on International Economic Relations, APEDA Ref No. APEDA/CM/15/2005-06, 30 June, New Delhi.
IBEF (2006a), Engineering. Viewed at: http://ibef.org/download/Engineering_sectoral.pdf.
WT/TPR/S/182 Trade Policy ReviewPage 152
IBEF (2006b), Healthcare, prepared by Ernst & Young for IBEF. Viewed at: http://ibef.org/download/Healthcare_sectoral.pdf.
IBEF (2006c), Oil and Gas. Viewed at: http://ibef.org/download/OilandGas_sectoral.pdf.
IBEF (2006d), Power. Viewed at: http://ibef.org/download/Power_sectoral.pdf.
IFPRI (2005), Indian Agriculture and Rural Development: Strategic Issues and Reform Options. Viewed at: http://www.ifpri.org/pubs/ib/ib35.pdf.
IIPA (2006), 2006 Special 301–India, February. Viewed at: http://www.iipa.com/rbc/2006/2006SPEC301INDIA.pdf, [22 November 2006].
IMF (2005a), India – Selected Issues, Country Report No. 05/87. Viewed at: http://www.imf.org/external/pubs/ft/scr/2005/cr0587.pdf.
IMF (2005b), Public Investment and Fiscal Policy—Summaries of the Pilot Country Studies, 1 April. Viewed at: http://www.imf.org/external/np/pp/eng/2005/040105b.htm.
IMF (2006a), India: 2005 Article IV Consultation - Staff Report; Staff Statement; Public Information Notice on the Executive Board Discussion, Country Report No. 06/55, February, Washington D.C.
IMF (2006b), India – Selected Issues, Country Report No. 06/56. Viewed at: http://www.imf.org/external/pubs/ft/scr/2006/cr0656.pdf [8 February 2006].
Investment Commission (2006), Investment Strategy for India: Investment Commission Report, February. Viewed at: http://finmin.nic.in/downloads/reports/Investment%20Commission%20 Report.pdf [12 February 2007].
IRDA (2005), Annual Report 2004/05, New Delhi.
KPMG (2006), Indian Maritime Landscape – A Background Note, Prepared by the KPMG for the Indian Maritime Summit 2006. Viewed at: http://www.in.kpmg.com/pdf/Shipping_Report.pdf.
Makhija, Anil. K. (2006), "Privatization in India", Economic and Political Weekly, 20 May.
Ministry of Agriculture (2005), Agricultural Statistics at a Glance 2005, Directorate of Economics and Statistics, Department of Agriculture and Cooperation, New Delhi.
Ministry of Civil Aviation (2006), A Revolution in the Making: Annual Report 2005-06, New Delhi.
Ministry of Commerce and Industry (2004), Opportunities and Policy Challenges for Investment in India: Background Paper, OECD India Investment Roundtable, Department of Industrial Policy and Promotion, 19 October, New Delhi.
Ministry of Commerce and Industry (2006a), Export Promotion of Consultancy and Management Services from India, Consultancy Development Centre, March. Viewed at: http://commerce. nic.in/export-promotion-Summary.pdf [28 November 2006].
Ministry of Commerce and Industry (2006b), Foreign Trade Policy 2004-2009, Handbook of Procedures, Vol. 1, Chapter II, April, New Delhi.

India WT/TPR/S/182Page 153
Ministry of Commerce and Industry (2006c), Foreign Trade Policy: 1 September 2004-31 March 2009. Viewed at: http http://dgft.delhi.nic.in.
Ministry of Commerce and Industry (2006d), Trade in Legal Services: A consultation paper on legal services under GATS, Trade Policy Division. Viewed at: http://commerce.nic.in/ wto_sub/services/consultation-paper-legal-services-GATS.pdf [20 November 2006].
Ministry of Finance (2003), Report of the Task Force on Implementation of the Fiscal Responsibility and Budget Management Act. Viewed at: http://finmin.nic.in/downloads/reports/frbm/2.pdf [13 October 2006].
Ministry of Finance (2004), Economic Survey 2003-04. Viewed at: http://indiabudget.nic.in/es2003- 04/esmain.htm.
Ministry of Finance (2005a), Budget 2005/06, New Delhi.
Ministry of Finance (2005b), Economic Survey 2004-05. Viewed at: http://indiabudget.nic.in/es2004-05/esmain.htm.
Ministry of Finance (2006), Economic Survey 2005-06. Viewed at: http://indiabudget.nic.in/es2005-06/esmain.htm.
Ministry of Finance (2007a), Budget 2007/08: Revenue Foregone under the Control Tax System , New Delhi.
Ministry of Finance (2007b), Economic Survey 2006-07. Viewed at: http://indiabudget.nic.in/es2006-07/esmain.htm.
Ministry of Finance (undated), Disinvestment Manual, Department of Disinvestment. Viewed at: http://www.divest.nic.in/manual03/chap3.htm [6 July 2006].
Ministry of Food Processing (2005), Annual Report 2004-05, New Delhi.
Ministry of Health and Family Welfare (2006), Annual Report 2005-06. Viewed at: http://mohfw.nic.in/Annual0506/INTRODUCTION%20final.pdf [30 November 2006].
Ministry of Petroleum and Natural Gas (2006), Report of the Committee on Pricing and Taxation of Petroleum Products, February. Viewed at: http://petroleum.nic.in/Report1.pdf.
Ministry of Power (2006), Report on restructuring of APDRP, October, New Delhi.
Ministry of Steel (2005), National Steel Policy 2005. Viewed at: http://steel.nic.in/nspolicy2005.pdf [29 November 2006].
Ministry of Textiles (2005), Annual Report 2004-05. Viewed at: http://texmin.nic.in/annualrep/ AR04-05-01.pdf.
Ministry of Textiles (2006), Annual Report 2005-06. Viewed at: http://texmin.nic.in/annualrep/ ar06_con.htm.
Mohan, R. (2004), "Agricultural Credit in India: Status, Issues and Future Agenda", Reserve Bank of India Bulletin, November.

WT/TPR/S/182 Trade Policy ReviewPage 154
Mukherjee Arpita and Sachdeva Ruchika (2003), "Maritime and Air Transport Services: India's Approach to Privatization," Transport and Communications Bulletin for Asia and the Pacific, No. 73.
Mukhopadhyay, S. (2006), "Which way for indirect taxes", Economic and Political Weekly, April.
Nagaraj, R. (2006), "Public Sector Performance since 1950–A Fresh Look", Economic and Political Weekly, June, pp. 2551-2557.
NASSCOM (2005), NASSCOM-McKinsey Study. Viewed at: http://www.nasscom.in/upload/10142/Mckinsey_study_2005_Executive_summary.pdf [14 December 2006].
National Institute of Public Finance and Policy (2003), Budgetary Subsidies in India: Subsidizing Social and Economic Services, March, New Delhi.
OECD (2001), The Size of Government Procurement Markets, Paris.
Planning Commission (2001), Report of the Advisory Group on Tax Policy and Tax Administration for the Tenth Plan, May. Viewed at: http://planningcommission.nic.in/aboutus/committee/wrkgrp/ tptarpt.pdf [6 October 2006].
Planning Commission (2002), Tenth Five-Year Plan, Chapter 3, New Delhi.
Planning Commission (2005), Draft Report of the Expert Committee on Integrated Energy Policy, December. Viewed at: http://planningcommission.nic.in/reports/genrep/intengpol.pdf.
Planning Commission (2006a), Approach Paper to the 11th Five Year Plan, November, New Delhi.
Planning Commission (2006b), Integrated Energy Policy: Report of the Expert Committee, Chapter X, August, New Delhi.
Planning Commission (undated), Mid-Term Appraisal of the Tenth Five Year Plan, pp 393-394, New Delhi.
Poirson, H. (2006), "The Tax System in India: Could Reform Spur Growth?", IMF Working Paper WP/06/93, April, Washington, D.C.
Rao, M.G. (2005), "Tax System Reform in India: Achievements and Challenges Ahead". International Symposium on Tax Policy and Reform in Asian Countries, 1-2 July 2005, Tokyo.
RBI (2004a), Report of the Advisory Committee on Flow of Credit to Agriculture and Related Activities from the Banking System: Part A—Recommendations which have been accepted and communicated to banks for compliance, Mumbai.
RBI (2004b), Report on Currency and Finance 2002-03, January, Mumbai. Viewed at: http://rbidocs. rbi.org.in/rdocs/PublicationReport/Pdfs/51000.pdf.
RBI (2005), Annual Report 2004/05, Part I: The Economy, Review and Prospects. Viewed at: http://www.rbi.org.in/scripts/AnnualReportPublications.aspx [4 July 2006].
RBI (2006a), Annual Policy Statement for the Year 2006-07, Mumbai.

India WT/TPR/S/182Page 155
RBI (2006b), Annual Report 2005/06. Viewed at: http://www.rbi.org.in/scripts/AnnualReport Publications.aspx.
RBI (2006c), First Quarter Review of Annual Monetary Policy for the Year 2006-07, Statement by Dr Y. V. Reddy, Governor, July, Mumbai.
RBI (2006d), Macroeconomic and Monetary Developments: "Monetary and Liquidity Conditions", July, Mumbai.
RBI (2006e), Midterm Review of Annual Policy 2006-07, 31 October, Mumbai.
RBI (2006f), Report on Trend and Progress of Banking in India, 2005-06. Viewed at: http://rbidocs. rbi.org.in/rdocs/Publications/PDFs/73830.pdf.
Reddy, Y.V. (2005), "Corporate Governance in Banks in India". Seminar on Corporate Governance for Bank Directors, 16 December, Mumbai. Viewed at: http://rbidocs.rbi.org.in/rbiadmin/Scripts/ SpeechesPrintView.html [16 November 2005].
Srivastava, Vivek (2003), "India's Accession to the Government Procurement Agreement: Identifying Costs and Benefits," in Aaditya Mato and Robert M. Stern, India and the WTO, World Bank and Oxford University Press, Chapter 10, pp. 235-267.
Taneja, Nisha (2006), "India Pakistan Trade", ICRIER Working Paper No. 182. Viewed at: http://www.icrier.org/pdf/WP182.pdf [2 March 2007].
Tewari, M. (2005), "Post-MFA Adjustments in India's Textile and Apparel Industry: Emerging Issues and Trends", ICRIER report, July. Viewed at: http://www.icrier.org/pdf/wp167.pdf.
Tokarick, S. (2006), "Does Import Protection Discourage Exports", IMF Working Paper WP/06/20, January, Washington, D.C.
Transparency International (2005a), Corruption Perceptions Index. Viewed at: http://www. transparency.org/policy_research/surveys_indices/cpi/2005 [6 October 2006].
Transparency International (2005b), India Corruption Study, 2005. Viewed at: http://www. tiindia.in/data/files/India%20Corruption%20Study-2005.pdf [6 October 2006].
UNCTAD (2005), Generalized System of Preferences: List of Beneficiaries. Viewed at: http://www. unctad.org/en/docs/itcdtsbmisc62rev1_en.pdf.
UNCTAD (2006), Strategies and Preparedness for Trade and Globalisation in India. National Seminar on Government Procurement, New Delhi, 11-12 May. UNCTAD, Ministry of Commerce-Government of India and DFID Project. Viewed at: http://www.unctadindia.org/displaymore. asp?Gr=&chkey=&subitemkey=771&itemid=378&subchnm=Past&subchkey=56&chname=Events.
USITC (2001), "India's Textiles and Apparel Industry: Growth Potential and Trade and Investment Opportunities", Staff Research Study 27, Washington D.C.
Virmani, A. and P.V. Rajeev (2002), "Excess Food Stocks, PDS and Procurement Policy", Planning Commission Working Paper, No. 5/2002, May, New Delhi.

WT/TPR/S/182 Trade Policy ReviewPage 156
World Bank (2004), India, Report on Observance of Standards and Codes (ROSC)–Accounting and Auditing, 20 December, Washington D.C.
World Bank (2006), Millennium Development Goals. Viewed at: http://ddp-ext.worldbank.org/ext/ ddpreports/ViewSharedReport?REPORT_ID=1336&REQUEST_TYPE=VIEWADVANCED.
WTO (2002), Trade Policy Review: India, Geneva.
WTO (2005), "International Trade in Air Transport: Recent Developments and Policy Issues", World Trade Report, Geneva.