renewable energy investment: canada
TRANSCRIPT
Renewable energy investment: Canada | 1
Renewable energy investment: CanadaNovember 2013 │Issue 4
2 | Renewable energy investment: Canada
In this issueThe future of renewable energy in Canada 2
Trends and transactions
Procurement 5
Onshore wind 6
Solar PV 6
Geothermal 7
Bioenergy 7
Marine 7
Energy storage 7
US State Attractiveness Indices 8
Canada in the new RECAI 9
Global renewable energy country attractiveness indices 10
Canadian-listed cleantech and renewable energy stocks 11
Renewable energy investment: Canada | 1
Issue highlights
Feature articleMany renewable energy technologies are at a crossroads, having become established and yet facing an unclear future. Our feature article explores 10 concepts that industry and government can develop together to support sustainable renewable energy growth while managing rate payer impact.
Trends of the futureContinuing the forward-looking theme, in this issue we discuss the many procurement changes and developments underway across many Canadian renewable energy markets and how transactions are being driven through this period.
How Canada compares to the worldEY’s global renewable energy team recently updated the methodology for the Global Renewable Energy Country Attractiveness Indices. See how Canada now ranks among its peers.
Providing investment stabilityOur ongoing monitoring of cleantech and renewable energy stocks, energy commodities and key equity benchmarks shows that Canadian cleantech and renewable energy stocks remain in positive territory while providing investors with some sought-after stability, while energy commodity costs have converged following capacity increases in transportation infrastructure.
2 | Renewable energy investment: Canada
The future of renewable energy in CanadaMark Porter and Steve Lewis, EY Renewable Energy Advisory
The bridge is outThe renewable energy sector in Canada is at an important juncture, where different policies have created a patchwork quilt of markets across the country.
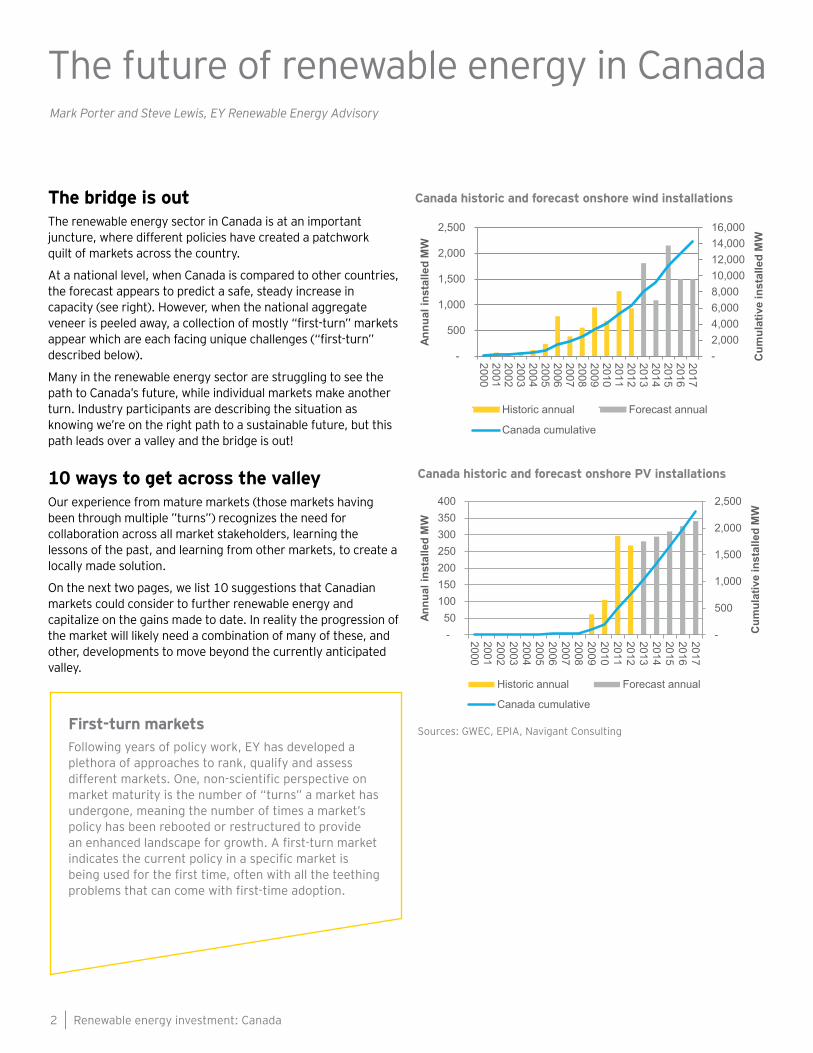
At a national level, when Canada is compared to other countries, the forecast appears to predict a safe, steady increase in capacity (see right). However, when the national aggregate veneer is peeled away, a collection of mostly “first-turn” markets appear which are each facing unique challenges (“first-turn” described below).
Many in the renewable energy sector are struggling to see the path to Canada’s future, while individual markets make another turn. Industry participants are describing the situation as knowing we’re on the right path to a sustainable future, but this path leads over a valley and the bridge is out!
10 ways to get across the valleyOur experience from mature markets (those markets having been through multiple ”turns”) recognizes the need for collaboration across all market stakeholders, learning the lessons of the past, and learning from other markets, to create a locally made solution.
On the next two pages, we list 10 suggestions that Canadian markets could consider to further renewable energy and capitalize on the gains made to date. In reality the progression of the market will likely need a combination of many of these, and other, developments to move beyond the currently anticipated valley.
First-turn marketsFollowing years of policy work, EY has developed a plethora of approaches to rank, qualify and assess different markets. One, non-scientific perspective on market maturity is the number of “turns” a market has undergone, meaning the number of times a market’s policy has been rebooted or restructured to provide an enhanced landscape for growth. A first-turn market indicates the current policy in a specific market is being used for the first time, often with all the teething problems that can come with first-time adoption.
Canada historic and forecast onshore wind installations
Canada historic and forecast onshore PV installations
Sources: GWEC, EPIA, Navigant Consulting
-
500
1,000
1,500
2,000
2,500
- 50
100 150 200 250 300 350 400
200020012002200320042005200620072008200920102011201220132014201520162017
Cum
ulat
ive
inst
alle
d M
W
Annu
al in
stal
led
MW
Historic annual Forecast annual
Canada cumulative
- 2,000 4,000 6,000 8,000 10,000 12,000 14,000 16,000
-
500
1,000
1,500
2,000
2,500
200020012002200320042005200620072008200920102011201220132014201520162017
Cum
ulat
ive
inst
alle
d M
W
Annu
al in
stal
led
MW
Historic annual Forecast annual
Canada cumulative
Renewable energy investment: Canada | 3
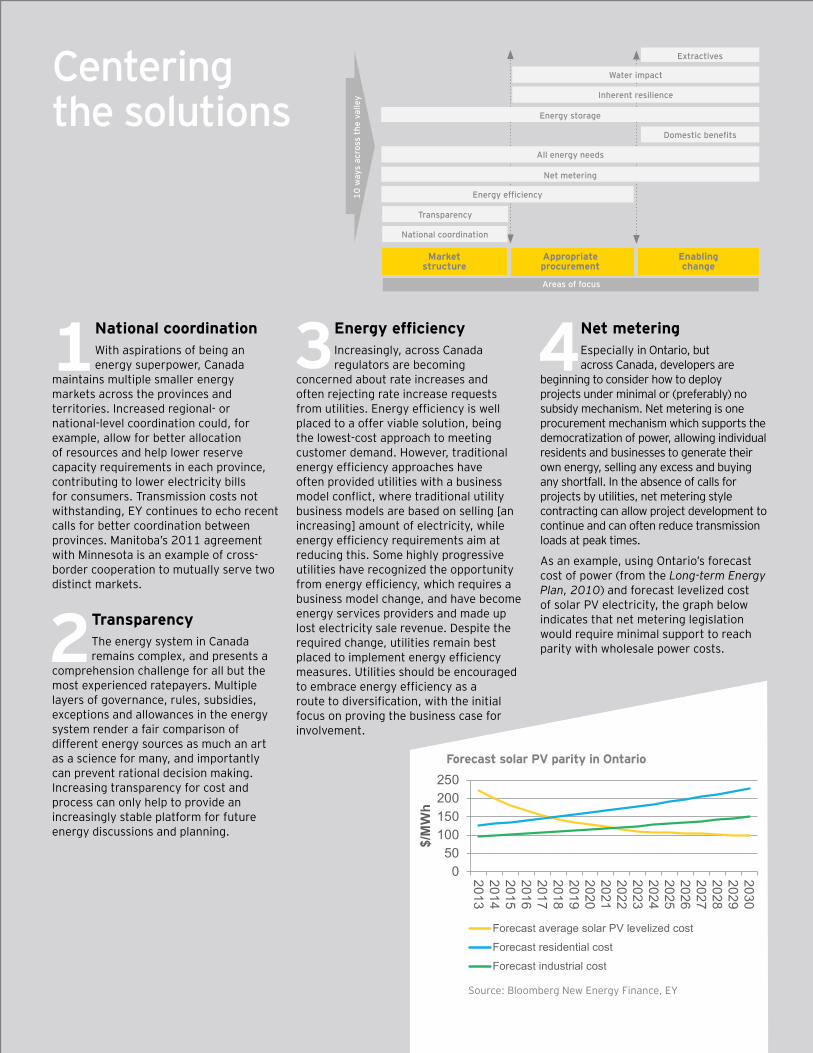
1National coordinationWith aspirations of being an energy superpower, Canada
maintains multiple smaller energy markets across the provinces and territories. Increased regional- or national-level coordination could, for example, allow for better allocation of resources and help lower reserve capacity requirements in each province, contributing to lower electricity bills for consumers. Transmission costs not withstanding, EY continues to echo recent calls for better coordination between provinces. Manitoba’s 2011 agreement with Minnesota is an example of cross-border cooperation to mutually serve two distinct markets.
2 TransparencyThe energy system in Canada remains complex, and presents a
comprehension challenge for all but the most experienced ratepayers. Multiple layers of governance, rules, subsidies, exceptions and allowances in the energy system render a fair comparison of different energy sources as much an art as a science for many, and importantly can prevent rational decision making. Increasing transparency for cost and process can only help to provide an increasingly stable platform for future energy discussions and planning.
3Energy efficiencyIncreasingly, across Canada regulators are becoming
concerned about rate increases and often rejecting rate increase requests from utilities. Energy efficiency is well placed to a offer viable solution, being the lowest-cost approach to meeting customer demand. However, traditional energy efficiency approaches have often provided utilities with a business model conflict, where traditional utility business models are based on selling [an increasing] amount of electricity, while energy efficiency requirements aim at reducing this. Some highly progressive utilities have recognized the opportunity from energy efficiency, which requires a business model change, and have become energy services providers and made up lost electricity sale revenue. Despite the required change, utilities remain best placed to implement energy efficiency measures. Utilities should be encouraged to embrace energy efficiency as a route to diversification, with the initial focus on proving the business case for involvement.
4Net meteringEspecially in Ontario, but across Canada, developers are
beginning to consider how to deploy projects under minimal or (preferably) no subsidy mechanism. Net metering is one procurement mechanism which supports the democratization of power, allowing individual residents and businesses to generate their own energy, selling any excess and buying any shortfall. In the absence of calls for projects by utilities, net metering style contracting can allow project development to continue and can often reduce transmission loads at peak times.
As an example, using Ontario’s forecast cost of power (from the Long-term Energy Plan, 2010) and forecast levelized cost of solar PV electricity, the graph below indicates that net metering legislation would require minimal support to reach parity with wholesale power costs.
Centering the solutions
050
100150200250
201320142015201620172018201920202021202220232024202520262027202820292030
$/M
Wh
Source: Bloomberg New Energy Finance, EY
Market structure
Appropriate procurement
Enabling change
10 w
ays
acro
ss t
he v
alle
y
National coordination
Transparency
Energy efficiency
Net metering
All energy needs
Domestic benefits
Energy storage
Inherent resilience
Water impact
Extractives
Areas of focus
Forecast solar PV parity in Ontario
Forecast average solar PV levelized cost
Forecast residential cost
Forecast industrial cost
4 | Renewable energy investment: Canada
5All energy needsTo date, focus across Canada and globally has been on introducing
renewable sources for electricity generation, with significantly lower emphasis placed on renewable heating and renewable transport fuels. The development of a sustainable society requires renewable energy to encompass all three energy uses, which is especially true in Canada, where approximately two-thirds of our energy is used for heating.
Future policy should pause to broaden the focus to include all energy needs.
6Domestic benefitsThe history of markets successfully locking in additional
domestic benefits from renewable energy has varied greatly. Domestic benefits can include local employment or exportable skills and are considered to be beyond the inherent benefits from renewable energy, which include sustainable generation, reduced/eliminated fuel price risk, environmental benefits or distributed benefits.
The Ontario market is currently evolving following an adverse WTO ruling on the domestic content, while Quebec continues to enjoy contract-required employment in the Gaspé Region.
Our view is that additional domestic benefits can be important to a local market and shouldn’t be given up easily. These benefits have been able to be retained by those markets embracing sustainability, by placing environmental policy first and industrial policy second (even if the results are the same). Those markets seeking to retain additional domestic benefits should consider the intent of any new program and how this aligns with long-term sustainability goals.
7 Energy storagePortable, cheap and reliable energy storage has the potential
to drive a paradigm shift in energy use and management. While regarded as being at an early stage, Canada has been storing energy in hydro form for over 100 years and understands the benefits this can bring. Future energy policy encouraging the use of energy storage and innovation in the sector could propel Canada forward on the international stage while benefitting national energy interest.
8Inherent resilienceRecent flooding in Calgary, Toronto and New Brunswick
highlighted the vulnerability of our infrastructure to changes in climate and weather patterns. Renewable energy is inherently a distributed generation solution and can often be generated on site (see 4. Net metering), providing an energy network with an inherent resilience to disasters in a specific area. As the level of carbon in our atmosphere continues to increase (carbon dioxide in the atmosphere exceeded 400 parts per million in May 2013 at a Hawaii measuring station, Arctic-based measurements exceeded 400 parts per million on average for all of May 2012), the recent weather events are forecast to increase in frequency and severity. Renewable energy can offer an increased resilience to the impacts, while helping to reduce the amount of carbon entering the atmosphere.
9Water impactCanada has an abundance of available fresh water and an
equally high rate of water consumption. As the climate alters, both domestic and industry users are likely to face increased water pressures, providing a further benefit to many renewable energy generation technologies that consume little/no water through generation. The impact on our water supplies may become critical, and policy could start considering the level of water use through a generation station’s supply chain and production life when considering which generation sources to pursue.
10ExtractivesCanada is blessed with significant natural
resources. While extensive efforts are being made to make use of these resources, global extraction methods are being placed under increased scrutiny for a plethora of reasons, sustainability is just one. Already underway, the extractives industry has the potential to employ renewable energy technologies without the need for government support (renewables are often cheaper than diesel-based off-grid systems and can provide a myriad of additional benefits), for projects where the cost of a renewable energy facility is often immaterial when
compared to the overall project cost, and where the inclusion of renewable energy helps to reduce a significant business risk — fuel supply.
Although often considered non-core to extractive-project development, renewable energy (being electricity, heating/cooling and transport fuels) can reduce operating costs over the life of a project, while providing an ongoing community benefit once the project has closed. A role for government, if seeking to enhance the sustainability of its extraction industries, could be to work with project developers to understand how renewables can make a difference and increase Canada’s reputation as a centre of extraction excellence.
The future of renewable energy in CanadaGetting across the valley to a better future is not going to be an easy task. Industry must work with policy makers and consider solutions for the future, not simply repeating the past. Enabling policy can often be as effective (and cost free) at stimulating a market as the provision of subsidies. One example relates to installed costs for solar PV, which are reported to be double the cost in Canada when compared to some European installations, yet the equipment costs are similar. Costs attributed to red tape could be removed and provide a cost-free benefit to the industry while reducing costs for ratepayers.
The concepts discussed here are individual perspectives on a complex issue, which needs careful thought and an understanding of the impact to all stakeholders. It is important the discussion does not stop when the bridge appears to be out.
Renewable energy investment: Canada | 5
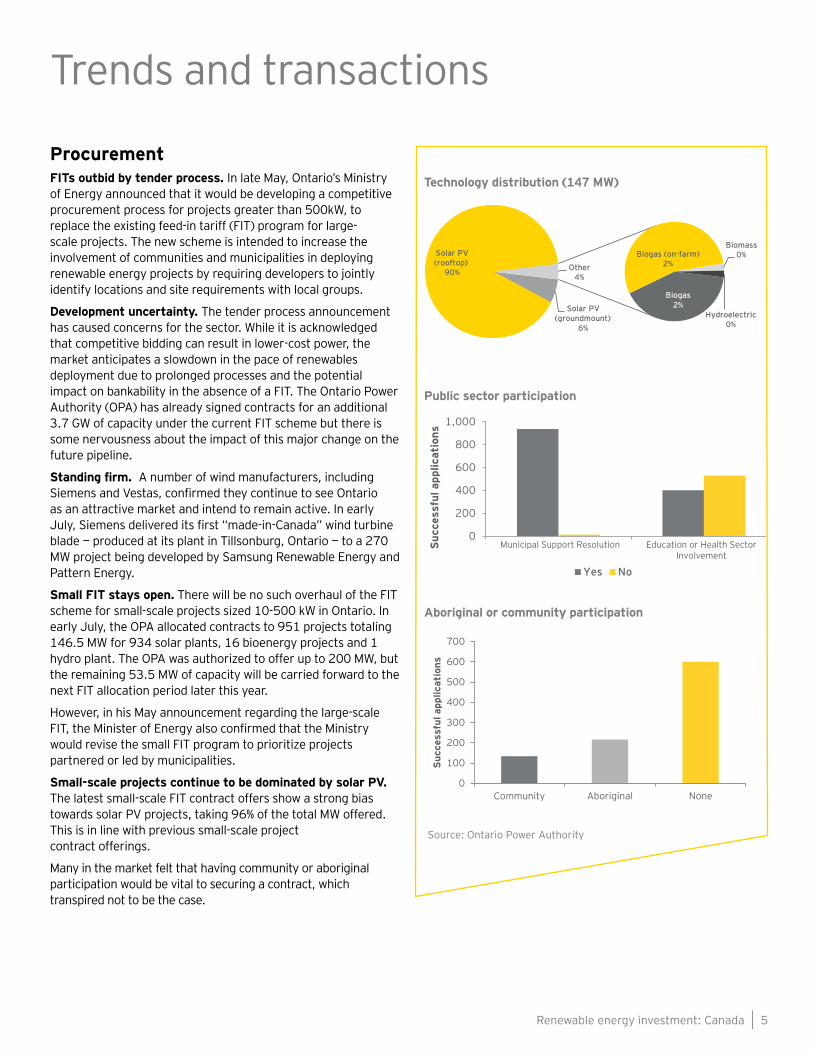
ProcurementFITs outbid by tender process. In late May, Ontario’s Ministry of Energy announced that it would be developing a competitive procurement process for projects greater than 500kW, to replace the existing feed-in tariff (FIT) program for large-scale projects. The new scheme is intended to increase the involvement of communities and municipalities in deploying renewable energy projects by requiring developers to jointly identify locations and site requirements with local groups.
Development uncertainty. The tender process announcement has caused concerns for the sector. While it is acknowledged that competitive bidding can result in lower-cost power, the market anticipates a slowdown in the pace of renewables deployment due to prolonged processes and the potential impact on bankability in the absence of a FIT. The Ontario Power Authority (OPA) has already signed contracts for an additional 3.7 GW of capacity under the current FIT scheme but there is some nervousness about the impact of this major change on the future pipeline.
Standing firm. A number of wind manufacturers, including Siemens and Vestas, confirmed they continue to see Ontario as an attractive market and intend to remain active. In early July, Siemens delivered its first “made-in-Canada” wind turbine blade — produced at its plant in Tillsonburg, Ontario — to a 270 MW project being developed by Samsung Renewable Energy and Pattern Energy.
Small FIT stays open. There will be no such overhaul of the FIT scheme for small-scale projects sized 10-500 kW in Ontario. In early July, the OPA allocated contracts to 951 projects totaling 146.5 MW for 934 solar plants, 16 bioenergy projects and 1 hydro plant. The OPA was authorized to offer up to 200 MW, but the remaining 53.5 MW of capacity will be carried forward to the next FIT allocation period later this year.
However, in his May announcement regarding the large-scale FIT, the Minister of Energy also confirmed that the Ministry would revise the small FIT program to prioritize projects partnered or led by municipalities.
Small-scale projects continue to be dominated by solar PV. The latest small-scale FIT contract offers show a strong bias towards solar PV projects, taking 96% of the total MW offered. This is in line with previous small-scale project contract offerings.
Many in the market felt that having community or aboriginal participation would be vital to securing a contract, which transpired not to be the case.
Trends and transactions
0
200
400
600
800
1,000
Municipal Support Resolution Education or Health SectorInvolvement
Succ
essf
ul a
pplic
atio
ns
Yes No
Technology distribution (147 MW)
Biogas2%
Biogas (on-farm)2%
Biomass0%
Hydroelectric0%
Solar PV (groundmount)
6%
Solar PV (rooftop)
90% Other4%
Public sector participation
Aboriginal or community participation
0
100
200
300
400
500
600
700
Community Aboriginal None
Succ
essf
ul a
pplic
atio
ns
Source: Ontario Power Authority
6 | Renewable energy investment: Canada
Procurement (cont’d)Quebec puts wind back on the market. This issue saw positive developments in Quebec with the launch of the much-awaited fourth round of wind power tenders. Quebec’s premier called for 800 MW of wind capacity, estimated to require approximately $2 billion in investment.
The latest tender, which contributes toward the province’s overarching goal of achieving 4 GW of installed capacity, is in response to calls from the wind sector to speed up the process to prevent a deployment gap, given the last of the wind projects contracted under previous tenders are due to come online in 2015. Quebec currently has 1.7 GW of installed wind capacity and a pipeline of approximately 1.6 GW under contract.
The WTO helps drive a market turn? While the decision to move to competitive bidding for large-scale projects in Ontario is likely to be driven by a number of factors, it may well have been impacted by the World Trade Organization’s (WTO’s) decision in early May to uphold a complaint filed by the EU and Japan against the local content requirements attached to Ontario’s FIT scheme.
The WTO ruled in December that the domestic content rules violate its “national treatment” rules, but the case was revisited following an appeal by Canada. May’s decision to uphold the original decision, however, means Ontario must now rewrite its Green Energy Act by late 2014 to exclude local content requirements, although it is not expected that existing FIT contracts will be cancelled.
Building a bridge. During this issue, SaskPower announced a second phase of the net metering program for small installations. The rebate will make an equivalent contribution of up to 20% of eligible costs to a maximum of $20,000. This phase of the program is open until November 2014 and is expected to add an additional 25% of the current net metering base.
Onshore windHunker down through uncertainty. The limited deal flow during this issue period draws a notable question on market optimism, an understandable position for many given the procurement changes taking place. Brookfield Renewable Energy Partners LP’s acquisition of Western Wind Energy Corp. and Capstone Infrastructure’s acquisition of Sprott Power were the two largest and notable deals in this issue period. Both transactions involved entities acquiring operating and development projects, something often usual for the average infrastructure fund investor. For project developers with a mixed-staged development portfolio, this provides light to a potential exit/partnership route should the need arise, while the rest of the market focuses on developing its existing pipeline while waiting for the policy dust to settle.
Project-level transactions continue. Wind assets remain a desirable investment asset class. Deals included Fiera Axium Infrastructure Inc. leading the purchase of GE’s stakes in two facilities in British Columbia. GE sold its 60% stake in the 235 MW Toba Montrose hydroelectric facility and its 49% interest in the 144 MW Dokie 1 wind farm. Enbridge Inc. acquired 50% of an operational 80 MW wind farm in Quebec from French utility Electricité de France SA.
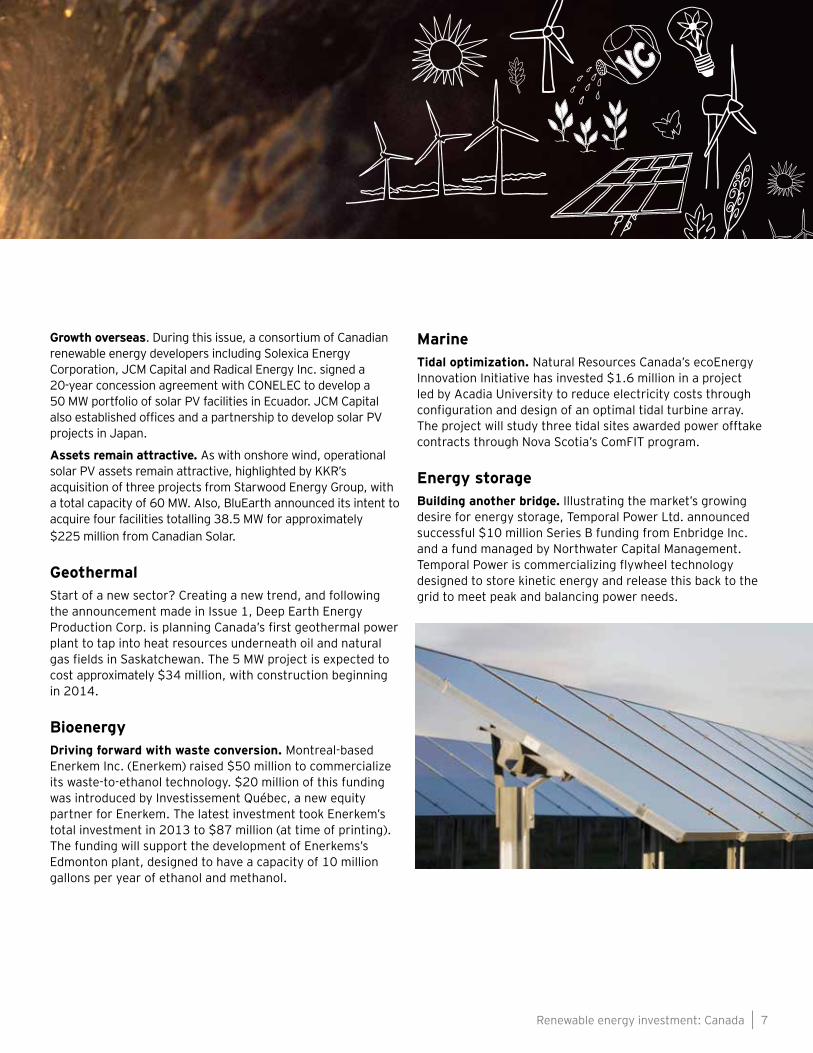
Solar PVSelf supply. During this issue, solar panel manufacturer Canadian Solar continued to acquire development assets for self-supply purposes. Transactions included Canadian Solar Solution Inc.’s acquisition of two projects totaling 24 MW from SunEdison Power Canada Inc. and an option to acquire up to three more projects from SunEdison. These acquisitions were financed by a one-year loan from Credit Suisse. SunEdison also divested five projects totalling 49 MW to Concord Pacific for approximately $277 million.
Renewable energy investment: Canada | 7
Growth overseas. During this issue, a consortium of Canadian renewable energy developers including Solexica Energy Corporation, JCM Capital and Radical Energy Inc. signed a 20-year concession agreement with CONELEC to develop a 50 MW portfolio of solar PV facilities in Ecuador. JCM Capital also established offices and a partnership to develop solar PV projects in Japan.
Assets remain attractive. As with onshore wind, operational solar PV assets remain attractive, highlighted by KKR’s acquisition of three projects from Starwood Energy Group, with a total capacity of 60 MW. Also, BluEarth announced its intent to acquire four facilities totalling 38.5 MW for approximately $225 million from Canadian Solar.
GeothermalStart of a new sector? Creating a new trend, and following the announcement made in Issue 1, Deep Earth Energy Production Corp. is planning Canada’s first geothermal power plant to tap into heat resources underneath oil and natural gas fields in Saskatchewan. The 5 MW project is expected to cost approximately $34 million, with construction beginning in 2014.
BioenergyDriving forward with waste conversion. Montreal-based Enerkem Inc. (Enerkem) raised $50 million to commercialize its waste-to-ethanol technology. $20 million of this funding was introduced by Investissement Québec, a new equity partner for Enerkem. The latest investment took Enerkem’s total investment in 2013 to $87 million (at time of printing). The funding will support the development of Enerkems’s Edmonton plant, designed to have a capacity of 10 million gallons per year of ethanol and methanol.
MarineTidal optimization. Natural Resources Canada’s ecoEnergy Innovation Initiative has invested $1.6 million in a project led by Acadia University to reduce electricity costs through configuration and design of an optimal tidal turbine array. The project will study three tidal sites awarded power offtake contracts through Nova Scotia’s ComFIT program.
Energy storageBuilding another bridge. Illustrating the market’s growing desire for energy storage, Temporal Power Ltd. announced successful $10 million Series B funding from Enbridge Inc. and a fund managed by Northwater Capital Management. Temporal Power is commercializing flywheel technology designed to store kinetic energy and release this back to the grid to meet peak and balancing power needs.
Rank State All renewables index
Long-term wind index
Long-term solar index*
BiomassIndex
Geothermal index
Infrastructure index**
1 California 75 70 79 77 79 802 Hawaii 71 67 75 67 72 693 Texas 69 74 67 60 58 633 Colorado 69 71 68 54 67 645 Nevada 68 64 72 54 70 626 New Mexico 67 67 69 57 62 727 Illinois 66 71 60 65 68 738 Maine 64 65 60 80 73 848 New York 64 65 62 66 70 7010 Massachusetts 63 64 63 63 60 6810 Pennsylvania 63 67 58 64 71 7210 Iowa 63 71 56 70 55 6413 Maryland 62 60 63 61 66 6814 Arizona 61 56 66 52 61 5115 Michigan 60 62 57 68 60 7016 Florida 59 55 63 63 58 5916 Minnesota 59 65 53 64 54 5616 North Carolina 59 59 59 62 54 6616 Vermont 59 60 57 57 67 5216 Oregon 59 65 50 71 66 6816 New Jersey 59 57 62 53 58 6016 Wisconsin 59 63 53 68 58 5923 Utah 57 58 55 49 63 6123 New Hampshire 57 58 53 65 67 5125 Ohio 56 56 56 59 56 55
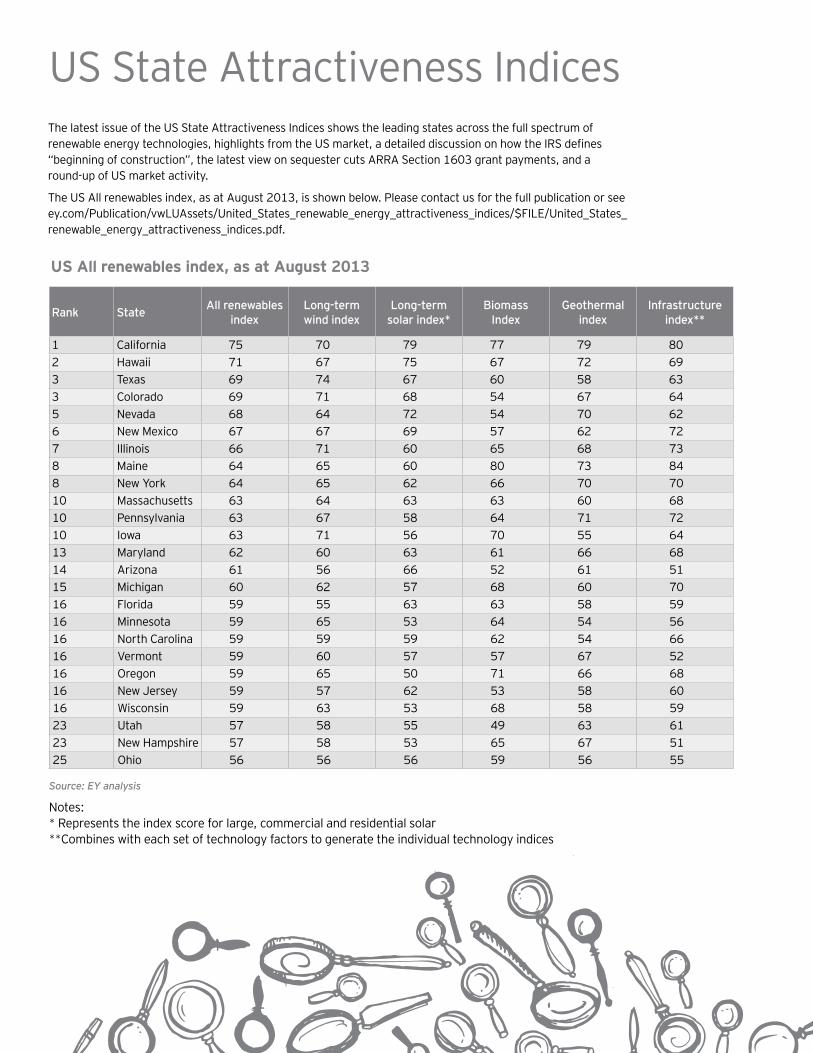
US State Attractiveness Indices The latest issue of the US State Attractiveness Indices shows the leading states across the full spectrum of renewable energy technologies, highlights from the US market, a detailed discussion on how the IRS defines “beginning of construction”, the latest view on sequester cuts ARRA Section 1603 grant payments, and a round-up of US market activity.
The US All renewables index, as at August 2013, is shown below. Please contact us for the full publication or see ey.com/Publication/vwLUAssets/United_States_renewable_energy_attractiveness_indices/$FILE/United_States_renewable_energy_attractiveness_indices.pdf.
Source: EY analysis
Notes: * Represents the index score for large, commercial and residential solar **Combines with each set of technology factors to generate the individual technology indices
US All renewables index, as at August 2013
Renewable energy investment: Canada | 9
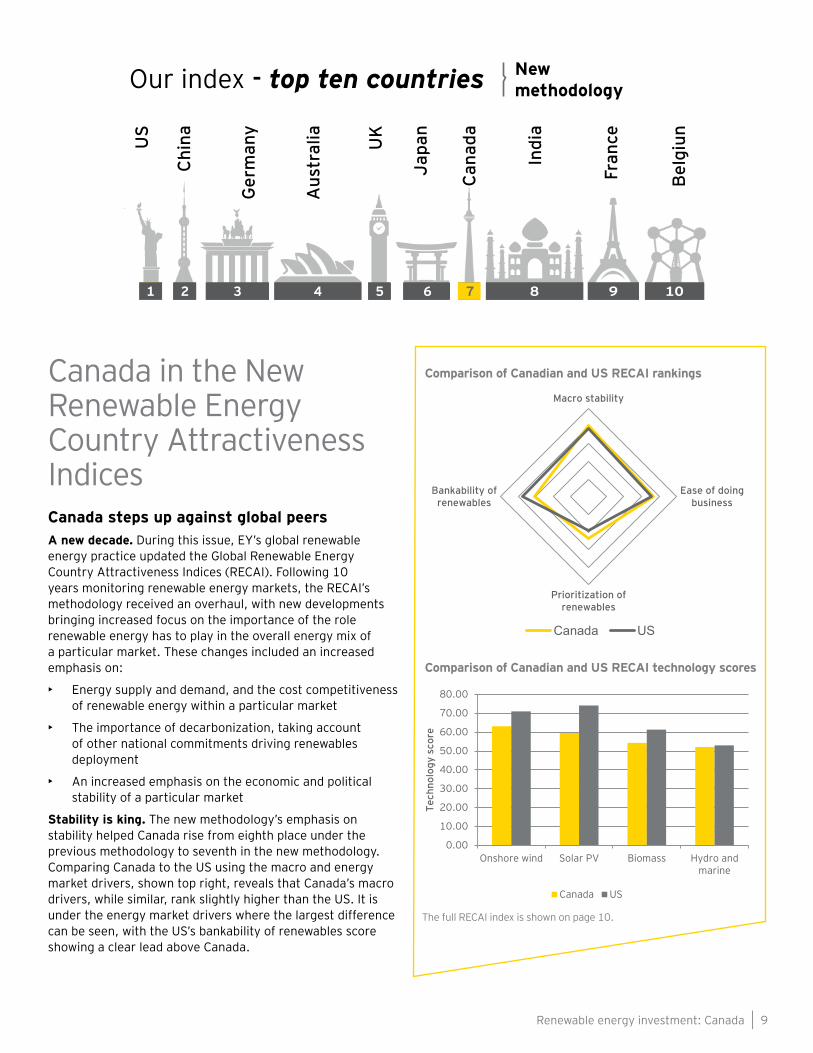
Canada in the New Renewable Energy Country Attractiveness Indices Canada steps up against global peersA new decade. During this issue, EY’s global renewable energy practice updated the Global Renewable Energy Country Attractiveness Indices (RECAI). Following 10 years monitoring renewable energy markets, the RECAI’s methodology received an overhaul, with new developments bringing increased focus on the importance of the role renewable energy has to play in the overall energy mix of a particular market. These changes included an increased emphasis on:
• Energy supply and demand, and the cost competitiveness of renewable energy within a particular market
• The importance of decarbonization, taking account of other national commitments driving renewables deployment
• An increased emphasis on the economic and political stability of a particular market
Stability is king. The new methodology’s emphasis on stability helped Canada rise from eighth place under the previous methodology to seventh in the new methodology. Comparing Canada to the US using the macro and energy market drivers, shown top right, reveals that Canada’s macro drivers, while similar, rank slightly higher than the US. It is under the energy market drivers where the largest difference can be seen, with the US’s bankability of renewables score showing a clear lead above Canada.
Comparison of Canadian and US RECAI rankings
Comparison of Canadian and US RECAI technology scores
The full RECAI index is shown on page 10.
0.00
10.00
20.00
30.00
40.00
50.00
60.00
70.00
80.00
Onshore wind Solar PV Biomass Hydro andmarine
Tech
nolo
gy s
core
Canada US
Macro stability
Ease of doingbusiness
Prioritization ofrenewables
Bankability ofrenewables
Canada US
1 2 3 4
US
Ger
man
y
Aus
tral
ia UK
Japa
n
Cana
da
Indi
a
Fran
ce
Bel
giun
Chi
na
Our index - top ten countries Newmethodology
5 6 7 8 9 101
10 | Renewable energy investment: Canada
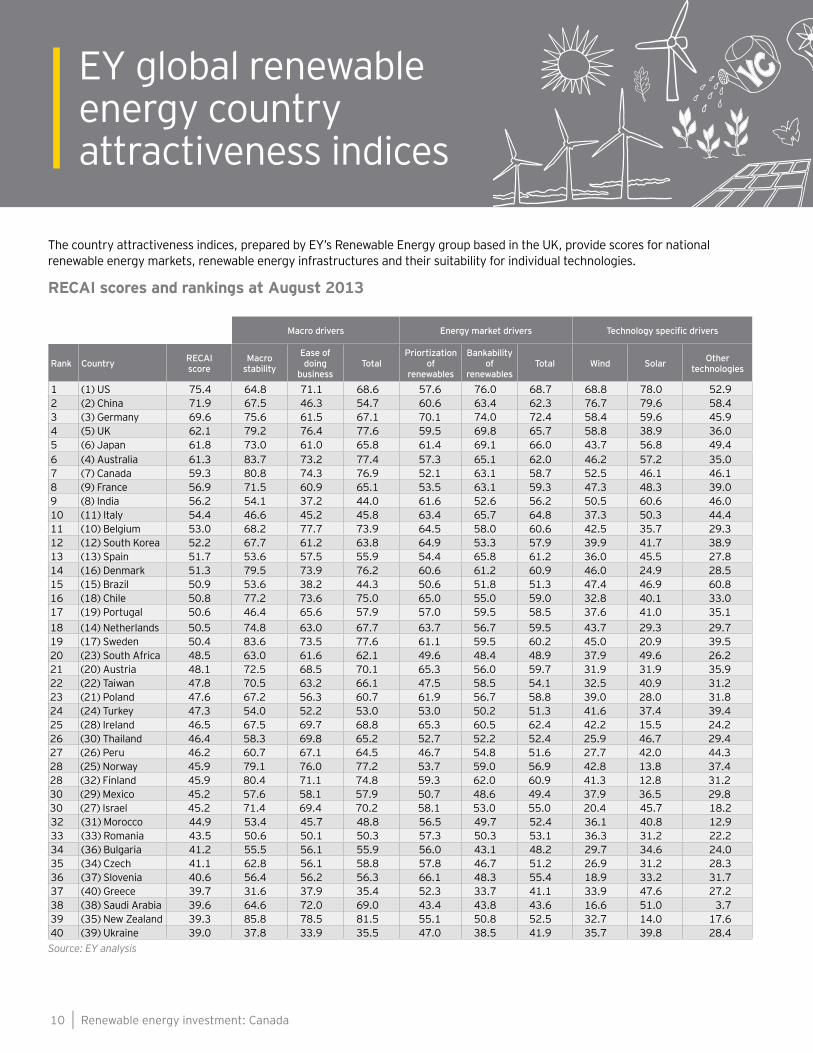
EY global renewable energy country attractiveness indices
The country attractiveness indices, prepared by EY’s Renewable Energy group based in the UK, provide scores for national renewable energy markets, renewable energy infrastructures and their suitability for individual technologies.
RECAI scores and rankings at August 2013
Source: EY analysis
Macro drivers Energy market drivers Technology specific drivers
Rank Country RECAI score
Macro stability
Ease of doing
businessTotal
Priortization of
renewables
Bankability of
renewablesTotal Wind Solar Other
technologies
1 (1) US 75.4 64.8 71.1 68.6 57.6 76.0 68.7 68.8 78.0 52.92 (2) China 71.9 67.5 46.3 54.7 60.6 63.4 62.3 76.7 79.6 58.43 (3) Germany 69.6 75.6 61.5 67.1 70.1 74.0 72.4 58.4 59.6 45.94 (5) UK 62.1 79.2 76.4 77.6 59.5 69.8 65.7 58.8 38.9 36.05 (6) Japan 61.8 73.0 61.0 65.8 61.4 69.1 66.0 43.7 56.8 49.46 (4) Australia 61.3 83.7 73.2 77.4 57.3 65.1 62.0 46.2 57.2 35.07 (7) Canada 59.3 80.8 74.3 76.9 52.1 63.1 58.7 52.5 46.1 46.18 (9) France 56.9 71.5 60.9 65.1 53.5 63.1 59.3 47.3 48.3 39.09 (8) India 56.2 54.1 37.2 44.0 61.6 52.6 56.2 50.5 60.6 46.010 (11) Italy 54.4 46.6 45.2 45.8 63.4 65.7 64.8 37.3 50.3 44.411 (10) Belgium 53.0 68.2 77.7 73.9 64.5 58.0 60.6 42.5 35.7 29.312 (12) South Korea 52.2 67.7 61.2 63.8 64.9 53.3 57.9 39.9 41.7 38.913 (13) Spain 51.7 53.6 57.5 55.9 54.4 65.8 61.2 36.0 45.5 27.814 (16) Denmark 51.3 79.5 73.9 76.2 60.6 61.2 60.9 46.0 24.9 28.515 (15) Brazil 50.9 53.6 38.2 44.3 50.6 51.8 51.3 47.4 46.9 60.816 (18) Chile 50.8 77.2 73.6 75.0 65.0 55.0 59.0 32.8 40.1 33.017 (19) Portugal 50.6 46.4 65.6 57.9 57.0 59.5 58.5 37.6 41.0 35.118 (14) Netherlands 50.5 74.8 63.0 67.7 63.7 56.7 59.5 43.7 29.3 29.719 (17) Sweden 50.4 83.6 73.5 77.6 61.1 59.5 60.2 45.0 20.9 39.520 (23) South Africa 48.5 63.0 61.6 62.1 49.6 48.4 48.9 37.9 49.6 26.221 (20) Austria 48.1 72.5 68.5 70.1 65.3 56.0 59.7 31.9 31.9 35.922 (22) Taiwan 47.8 70.5 63.2 66.1 47.5 58.5 54.1 32.5 40.9 31.223 (21) Poland 47.6 67.2 56.3 60.7 61.9 56.7 58.8 39.0 28.0 31.824 (24) Turkey 47.3 54.0 52.2 53.0 53.0 50.2 51.3 41.6 37.4 39.425 (28) Ireland 46.5 67.5 69.7 68.8 65.3 60.5 62.4 42.2 15.5 24.226 (30) Thailand 46.4 58.3 69.8 65.2 52.7 52.2 52.4 25.9 46.7 29.427 (26) Peru 46.2 60.7 67.1 64.5 46.7 54.8 51.6 27.7 42.0 44.328 (25) Norway 45.9 79.1 76.0 77.2 53.7 59.0 56.9 42.8 13.8 37.428 (32) Finland 45.9 80.4 71.1 74.8 59.3 62.0 60.9 41.3 12.8 31.230 (29) Mexico 45.2 57.6 58.1 57.9 50.7 48.6 49.4 37.9 36.5 29.830 (27) Israel 45.2 71.4 69.4 70.2 58.1 53.0 55.0 20.4 45.7 18.232 (31) Morocco 44.9 53.4 45.7 48.8 56.5 49.7 52.4 36.1 40.8 12.933 (33) Romania 43.5 50.6 50.1 50.3 57.3 50.3 53.1 36.3 31.2 22.234 (36) Bulgaria 41.2 55.5 56.1 55.9 56.0 43.1 48.2 29.7 34.6 24.035 (34) Czech 41.1 62.8 56.1 58.8 57.8 46.7 51.2 26.9 31.2 28.336 (37) Slovenia 40.6 56.4 56.2 56.3 66.1 48.3 55.4 18.9 33.2 31.737 (40) Greece 39.7 31.6 37.9 35.4 52.3 33.7 41.1 33.9 47.6 27.238 (38) Saudi Arabia 39.6 64.6 72.0 69.0 43.4 43.8 43.6 16.6 51.0 3.739 (35) New Zealand 39.3 85.8 78.5 81.5 55.1 50.8 52.5 32.7 14.0 17.640 (39) Ukraine 39.0 37.8 33.9 35.5 47.0 38.5 41.9 35.7 39.8 28.4
Renewable energy investment: Canada | 11
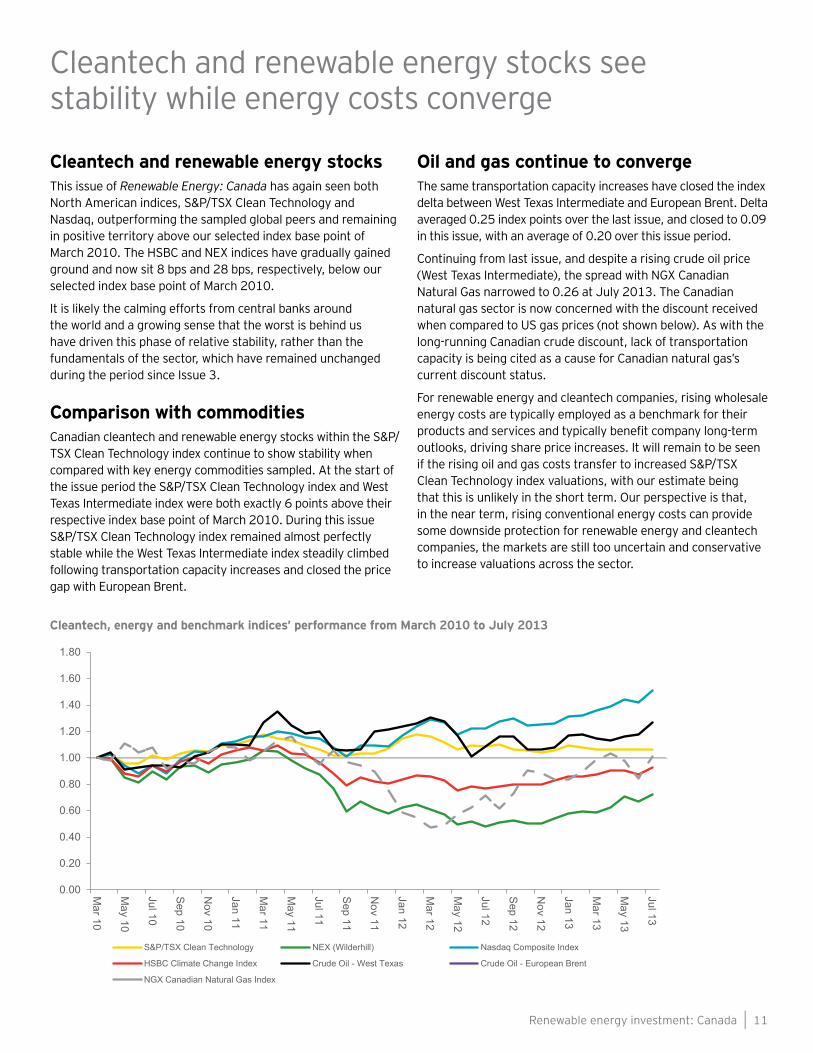
Cleantech and renewable energy stocksThis issue of Renewable Energy: Canada has again seen both North American indices, S&P/TSX Clean Technology and Nasdaq, outperforming the sampled global peers and remaining in positive territory above our selected index base point of March 2010. The HSBC and NEX indices have gradually gained ground and now sit 8 bps and 28 bps, respectively, below our selected index base point of March 2010.
It is likely the calming efforts from central banks around the world and a growing sense that the worst is behind us have driven this phase of relative stability, rather than the fundamentals of the sector, which have remained unchanged during the period since Issue 3.
Comparison with commoditiesCanadian cleantech and renewable energy stocks within the S&P/TSX Clean Technology index continue to show stability when compared with key energy commodities sampled. At the start of the issue period the S&P/TSX Clean Technology index and West Texas Intermediate index were both exactly 6 points above their respective index base point of March 2010. During this issue S&P/TSX Clean Technology index remained almost perfectly stable while the West Texas Intermediate index steadily climbed following transportation capacity increases and closed the price gap with European Brent.
Oil and gas continue to convergeThe same transportation capacity increases have closed the index delta between West Texas Intermediate and European Brent. Delta averaged 0.25 index points over the last issue, and closed to 0.09 in this issue, with an average of 0.20 over this issue period.
Continuing from last issue, and despite a rising crude oil price (West Texas Intermediate), the spread with NGX Canadian Natural Gas narrowed to 0.26 at July 2013. The Canadian natural gas sector is now concerned with the discount received when compared to US gas prices (not shown below). As with the long-running Canadian crude discount, lack of transportation capacity is being cited as a cause for Canadian natural gas’s current discount status.
For renewable energy and cleantech companies, rising wholesale energy costs are typically employed as a benchmark for their products and services and typically benefit company long-term outlooks, driving share price increases. It will remain to be seen if the rising oil and gas costs transfer to increased S&P/TSX Clean Technology index valuations, with our estimate being that this is unlikely in the short term. Our perspective is that, in the near term, rising conventional energy costs can provide some downside protection for renewable energy and cleantech companies, the markets are still too uncertain and conservative to increase valuations across the sector.
Cleantech, energy and benchmark indices’ performance from March 2010 to July 2013
0.00
0.20
0.40
0.60
0.80
1.00
1.20
1.40
1.60
1.80
Mar 10
May 10
Jul 10
Sep 10
Nov 10
Jan 11
Mar 11
May 11
Jul 11
Sep 11
Nov 11
Jan 12
Mar 12
May 12
Jul 12
Sep 12
Nov 12
Jan 13
Mar 13
May 13
Jul 13
S&P/TSX Clean Technology NEX (Wilderhill) Nasdaq Composite Index
HSBC Climate Change Index Crude Oil - West Texas Crude Oil - European Brent
NGX Canadian Natural Gas Index
Cleantech and renewable energy stocks see stability while energy costs converge
EY’s Renewable Energy groupOur Renewable Energy group helps companies increase value from their renewable energy activities. Our professionals provide advice and services in the following areas:
• Finance raising and structuring
• Divestiture support
• Transaction support
• Financial advisory and valuation
• Financial modelling
• Market entry strategy
• Strategic partnering
• Taxation
• IPO advice
• Asset value optimization
• Feedstock strategy
• PE advice
• JI/CDM financing
• Strategy review
• Technologies
• Onshore and offshore wind
• Biomass
• Biofuels
• Energy from waste
• Wave and tidal
• Solar
• Fuel cells
• CHP
• Landfill gas
• Hydro
• Carbon capture and storage
ContactFor further information on our services and for future copies of this or any other issue, please visit ey.com/renewables or contact:
Steve Lewis Senior Vice President +1 416 943 2659 [email protected]
Mark Porter Senior Associate +1 416 943 2108 [email protected]
Renewable energy investment: Canada | 13
EY’s Renewable Energy groupWith a dedicated 100-strong team of international advisors operating across our member firms worldwide, our Renewable Energy group helps clients increase value from renewable energy activity. Members of the group provide advice and services in many sectors of the renewable energy industry.
In addition to our global renewable energy country attractiveness indices, we publish carbon capture and storage country attractiveness indices and biofuels country attractiveness indices.

EY | Assurance | Tax | Transactions | Advisory
About EYEY is a global leader in assurance, tax, transaction and advisory services. The insights and quality services we deliver help build trust and confidence in the capital markets and in economies the world over. We develop outstanding leaders who team to deliver on our promises to all of our stakeholders. In so doing, we play a critical role in building a better working world for our people, for our clients and for our communities.
EY refers to the global organization and may refer to one or more of the member firms of Ernst & Young Global Limited, each of which is a separate legal entity. Ernst & Young Global Limited, a UK company limited by guarantee, does not provide services to clients.
© 2013 Ernst & Young LLP. All Rights Reserved. A member firm of Ernst & Young Global Limited.
1126413
ED 0114
This publication contains information in summary form, current as of the date of publication, and is intended for general guidance only. It should not be regarded as comprehensive or a substitute for professional advice. Before taking any particular course of action, contact Ernst & Young or another professional advisor to discuss these matters in the context of your particular circumstances. We accept no responsibility for any loss or damage occasioned by your reliance on information contained in this publication.
ey.com/ca