renewable energy investment canada - september … · 2 | renewable energy investment: canada...
TRANSCRIPT

September 2014 | Issue 5
Renewable energy investmentCanada

2 | Renewable energy investment: Canada
In this issueEnergy in the district – providing for Canada’s energy needs ............................. 2
Managing (climate) changing infrastructure risks ........................................ 6
Trends and transactions:
Procurement ........................................... 12
Projects .................................................. 13
Canadian-listed cleantech and renewable energy stocks .............................. 14
Global attractiveness ................................... 16
Our feature articleFollowing the 10 concepts discussed in issue 4, increasing market activity in the district energy sector prompted us to consider the opportunities and challenges presented from a district energy solution. Our lead article reviews district energy projects development best practice and discusses where future district energy growth is likely to occur...
Trends of the futureOur second feature article discusses the continuing need for overhaul to almost all our critical infrastructure and how Canada and most developed nations are now locked into a recurring cycle of infrastructure renewal. We discuss why, at a pivotal time for the next generation’s infrastructure, all actors in the sector should be considering the full breadth of tools available and leave a better working world for the future...
Providing investment stabilityOur ongoing monitoring of cleantech and renewable energy stocks, energy commodities and key equity benchmarks show that Canadian cleantech and renewable energy stocks have steadily increased gains over our March 2010 benchmark position. While energy commodity costs have behaved very differently – oil showing a slow, steady rise, while natural gas costs have wildly oscillated ....
How Canada compares to the worldEY’s global renewable energy team continue to monitor sector developments across the globe. Canada has just moved above the UK in attractiveness for investment in renewable energy and now ranks fifth, while lagging behind Japan by four clear index points...
2 | Renewable energy investment: Canada
District opportunityIn our previous issue of Renewable Energy in Canada (Issue 4, November 2013), our feature article highlighted the future of renewable energy in Canada, including our ”10 ways to get across the valley“. We said the development of a sustainable society requires renewable energy to encompass electricity generation, renewable heating/cooling and renewable transport fuels. This is especially true in Canada, where approximately two-thirds of our energy is used for heating.
We concluded by stating that future policy should pause to broaden the focus to include all energy needs. District energy is an area of growing interest across the renewable energy sector, as an increasing number of stakeholders realise the business opportunity, energy security and environment benefits arising from district energy solutions.
In just the residential, commercial and institutional sectors district energy provides an opportunity to supply 1,876 PJ of energy in heating and cooling requirements alone, which equates to over 70% of the residential, commercial and institutional sector total energy requirement (based on 2011 data).
Opportunities utilised… sporadicallyLeadership in district energy systems has been primarily found in entrepreneurs working in or with municipalities, from the City of Vancouver’s Athlete’s Village, City of Toronto’s Enwave, to City of Halifax’s Waterfront system. District Energy has developed haphazardly across Canada, when entrepreneurial spirit or vision has been found – in many cases district energy has been retro-fitted to existing buildings rather than considered in new-build plans. The extensive growth in many major urban centres in the past 30 years was a squandered opportunity from a district energy perspective.
District energy detractors will suggest that many Canadian municipalities lack the urban density to support an economically feasible district energy network; a perspective which begs the question: is the level of low-density development sustainable in the long-term?
In all the missed opportunity however, district energy did grow. CIEEDAC’s District Energy Inventory for Canada, 2013 (released March 2014) shows that installations (based on first commissioning) surged between 1960 – 1980 and again post 2000. Figures 2 and 3 show installations and where these are located. As of 2013, circa 166 district energy systems existed across Canada, with installations in every province and territory.
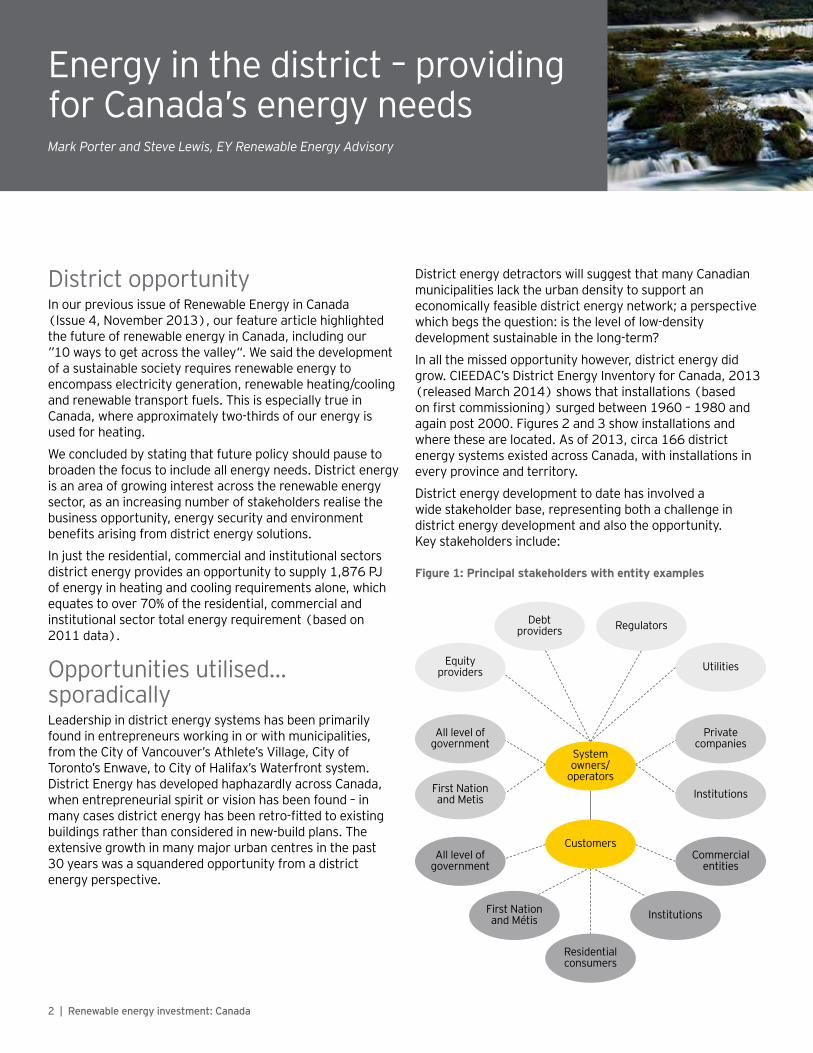
District energy development to date has involved a wide stakeholder base, representing both a challenge in district energy development and also the opportunity. Key stakeholders include:
Figure 1: Principal stakeholders with entity examples
Customers
Privatecompanies
Utilities
Commercial entities
Regulators
Institutions
Residential consumers
Debtproviders
First Nationand Métis
All level of government
Equity providers
All level of government
InstitutionsFirst Nation and Metis
Systemowners/
operators
Energy in the district – providing for Canada’s energy needsMark Porter and Steve Lewis, EY Renewable Energy Advisory

Renewable energy investment: Canada | 3
Figure 2: Facilities by location
40
35
30
25
20
15
10
5
0BC AB SK MB ON QC NB PEI NS NL YT NWT NU
Source: District Energy Inventory for Canada, 2013 (CIEEDAC, March 2014)
Figure 3: Facilities by year first commissioned
35
30
25
20
15
10
5
0Pre 1900 1900 - 1920 1920 - 1940 1940 - 1960 1960 - 1980 1980 - 2000 2000 - 2012
Source: District Energy Inventory for Canada, 2013 (CIEEDAC, March 2014)
Future policy should pause to broaden the focus to include all energy needs.

4 | Renewable energy investment: Canada
District energy’s long development history has affirmed the base technology and process – proven by the involvement of traditionally conservative partners, (figure 1) – providing a strong platform for continued and accelerated growth. While a typical district energy network can include boilers, chillers, piping, control systems etc., each project is unique. Our experience has seen many different technology and process variations, including the use of biomass based feedstock; using heat from wastewater; sea- and lake-water for air conditioning; or cogeneration units producing heating and electricity. Many more variations exist, a good example is the Drakes Landing Solar Community in the town of Okotoks, Alberta. Interestingly a number of current projects under development, including Lonsdale DE project, North Vancouver, BC, and Alston Campus at Harvard University, Cambridge, MA, are employing a dispersed generation plant model. This model allows a greater level of scaleability, as above-ground pipes are used to connect generation centres with load centres/customers as the business case for connection to new sites is proven.
New opportunity on the horizonDistrict energy is experiencing renewed emphasis thanks to new technology and resource options becoming more mainstream, as well as a growing realization that we need to better manage our energy and a changing focus towards all energy sources, rather than just electricity. The energy factors above are augmented by macro-level factors: a slowly recovering global economy where oil and natural gas prices remain above $100/barrel and $4.50/mmBTU respectively (see article on page 14) and could conceivably increase as demand rises and severe weather events escalate, impacting prices.
District energy’s local generation and supply characteristics support the increasingly urgent need for climate change resilience within energy and municipal infrastructure. And with some buried municipal assets approaching end of life, the time might be ripe to explore additional service offerings for municipalities relating to provision of district energy services.
Historical developments (Figure 4, below) show the majority of installations provide water-based heating, while the minority of facilities provide electricity from combined heat and power.
Our belief is that combined heat and power systems will become more mainstream. Our expectation is based on the rationale that the average system owner/operator typically requires large quantities of both heating/cooling and electricity, is usually energy savvy, has a desire to control increasingly volatile conventional-commodity prices, and secure supply. Supply security has not been a high priority for most Canadian users to date, however, with increasingly severe weather events and the impact of geo-political instability we expect this issue to become a greater topic for risk management.
District energy also presents the opportunity to benefit from economies of scale, when compared individually procured, managed and maintained building-specific heating and cooling infrastructure.
Figure 4: Facilities by type of service provided
Heating(water)
41%
Heating(stream)
23%
Electricityfrom CHP
9%
Cooling(water)
27%
Source: District Energy Inventory for Canada, 2013 (CIEEDAC, March 2014)
Energy in the district – providing for Canada’s energy needs (cont’d)

Renewable energy investment: Canada | 5
How to access the opportunityOften when considering a district energy opportunity the first thought is to dive into detailed technical calculations and schematics. However, district energy project development best practice shows that considerable up-front planning should be undertaken first – the business planning!
A district energy system should be considered a business like any other. Before commencing detailed technical analysis the system must have a robust business plan, covering: the business model; project objectives; ownership structure; risk tolerances; capital costs; development plan/timeline; operating costs; marketing strategy; key performance indicators; and operating structure.
As mentioned earlier, district energy projects have a wide array of stakeholders. It is very important to start working with a project’s stakeholders at an early stage of project development, starting a process of mutual learning and combined-ownership of the project’s development. The aforementioned business plan is often used as a tool to reach stakeholders, can capture stakeholder feedback and be an evolving, ‘living’, document.
Consider skills and resources available to the project development team, which leads to the procurement mechanism and requirements. As many district energy systems are public sector based, a decision must be made as to the level of private sector involvement required. While every project is different, one golden truth when approaching the private sector is the need for clear communication of the project’s goals, requirements and evaluation criteria. Private sector procurement works best under well-defined parameters, allowing for private sector innovation to meet project objectives.
Opportunity executionDistrict energy projects can take considerable time and effort to develop, and can be complex energy systems. But in the right circumstance, be this a community, institution or industrial application, the benefits can significantly outweigh the costs.
While Figure 1: Principal stakeholders with entity examples shows a high level view of some key stakeholders, developing and operating a district energy project requires the coordination of considerably more partners – creating a full stakeholder map, with stakeholder strategies as part of the planning process being an important element of development. And like with many elements of project development and operations, stakeholder mapping is fluid, requiring regular consideration and updates.
Depending on the breadth of internal skills and resources found within a developer, some level of external involvement is likely required or needed in development, construction or operation. External consultants, such as EY, can bring a track record of district energy experience to a developer undertaking their first project. An example of external advice is the need for careful timing, as a project has one opportunity to go to the market for the first time! A specific example can relate to approaching the market for an engineer, procure, construct (“EPC”) solution or for financing (which are sometimes linked). A developer should understand exactly the project’s aims and objectives; how the project will achieve its plan (with sensible and often market sounded assumptions); and what is sought from the market. Projects approaching the market without due care will often find significant overruns in all areas, often wasting a good opportunity.
In any case, as macro- and micro- conditions align the time for considering a district energy solution is now.
Please see contact details at the end of this Issue.

6 | Renewable energy investment: Canada
Managing (climate) changing infrastructure risksMark Porter and Emily Kwok, EY Climate Change and Sustainability Services
A $57 trillion opportunityOur everyday lives and perception of the world tend to revolve around the built infrastructure in our communities. Much of this infrastructure is older than we are and we sometimes struggle to imagine how the ‘unbuilt’ world looked. A considerable portion of the current infrastructure we enjoy was first built or expanded in the post-war infrastructure boom and many assets are now approaching end of life, at a time when government budgets are constrained and tax payer/voter fatigue has set in.
In January 2014, Standard & Poor’s estimated the global infrastructure need would require circa $57 trillion by 2030 (Figure 5). Despite this, infrastructure as an asset class commands a low allocation rate among investors, perhaps indicating the investment opportunity has yet to be fully considered.
The resulting need from expiring infrastructure is being recognised in some areas, with many countries establishing dedicated infrastructure funds for direct investing or to support other projects through non-financial assistance. However, not as widely recognised is the need for broader thinking in infrastructure design or redevelopment – the solutions from yesterday will not necessarily meet requirements of tomorrow – especially as our climate changes.
Long-term assets need longer term thinkingOf the $57 trillion global infrastructure need, the power sector will require $12.2 trillion by 2030, equating to $718 billion each year. In North America the challenge may be more pressing. “The US for example, where the electricity grid is more expensive than ever, still relies on what is essentially a century-old technology” (source: Standard & Poor’s RatingsDirect, January 16, 2014). The aforementioned need for broader thinking in infrastructure design or redevelopment is clearly paramount in the power sector. The Conference Board of Canada estimated the Canadian electricity sector alone would need to invest $294 billion from 2010 to 2030 (see allocation in Figure 6) – highlighting the need in developed nations and the challenges redeveloping built infrastructure.
Without the need for climate change resilience the impending/ongoing phase of infrastructure renewal would seem an ideal opportunity for the power sector to take advantage of technological advances made over the last century. Augment this with a changing regulatory landscape; shifting consumption patterns; and evolving requirements from our energy network – the changing climate only adds an urgency to this opportunity.
Figure 5: Global 2030 infrastructure need ($57 trillion, constant 2010 dollars)
Source: Standard & Poor’s RatingsDirect, January 16, 2014 (original source McKinsey & Co)
Roads29%
Rail8%
Power21%
Water20%
Telecom17%
Ports1%
Airports4%
Figure 6: Canadian electricity infrastructure need ($294 billion, 2010 to 2030)
Source: Conference Board of Canada, April 2011
Generation67%
Power21%
Transmission12%
Distribution21%

Renewable energy investment: Canada | 7
Figure 7: Infrastructure redevelopment cycle and potential future development cycle
Power sector infrastructure therefore needs to employ robust, long-term thinking and planning, incorporating resilience, adaptability and end of life planning – allowing for an easy transition to the next redevelopment cycle (see Figure 7).
Considering again that our current era of infrastructure renewal presents an opportunity to plan for the next, infrastructure stakeholders on all sides should be considering if full life cycle of infrastructure assets – cradle-to-grave, or cradle-to-cradle thinking (often considered for products) –can be applied to infrastructure.
Time to retire that well kicked can?Life cycle-cost and -impact thinking has been developed to sharpen focus on improving products and processes through the consideration of a wider set of evaluation criteria: environmental; economic; and social impacts, occurring throughout the life cycle, and how a product can be incorporated into the next generation.
An increasing number of entities are using life cycle assessment (”LCA“) methodologies to support the identification of environmental and social hotspots over the life of a project and provide data for economic-based decision making. While environmental LCA and life cycle costing are mature methodologies, social LCA is still an emerging approach. In an era of increasing stakeholder activism, LCA is also being used as a tool to demonstrate transparency and corporate credibility to stakeholders.
From the outset LCA requires project developers to consider a broad range of criteria (broader thinking than yesterday’s project development) through the creation of a life cycle inventory.
Establishing a project’s life cycle inventory requires developers to consider material and economic flows between a project and its environment – reflecting the real world perspective of how every project is part of the wider environment (see Figure 8). The inventory takes into account inputs (energy, water, raw materials) as well as emissions to air, land and water.
Ultimately, LCA is a risk analysis tool which forces consideration and project evaluation from the larger picture, basing decision-making on quantitative assessments of current and future impacts, risks and opportunities. An important element is the consideration of cradle to cradle thinking and building in functionality to allow for the second era of major infrastructure renewal (potentially in 2060s-2070s) and avoid continuing to ‘kick the can down the road’ as has been done so many times with infrastructure development (or lack of) since the infrastructure rebuild started in the late-1990s/early-2000s.
1950s-1960s 1990s 2000s 2010s-
2020s2060s-2070s
2080s-2100s
Post-war infrastructure boom
Infrastructure rebuild started
Need for second major renewal will arise
Infrastructure crisis detected
The current era of infrastructure renewal
Second era of infrastructure renewal
Source: EY
Figure 8: Considering the bigger picture
Source: EY
Project Economy Society Environment
8 | Renewable energy investment: Canada
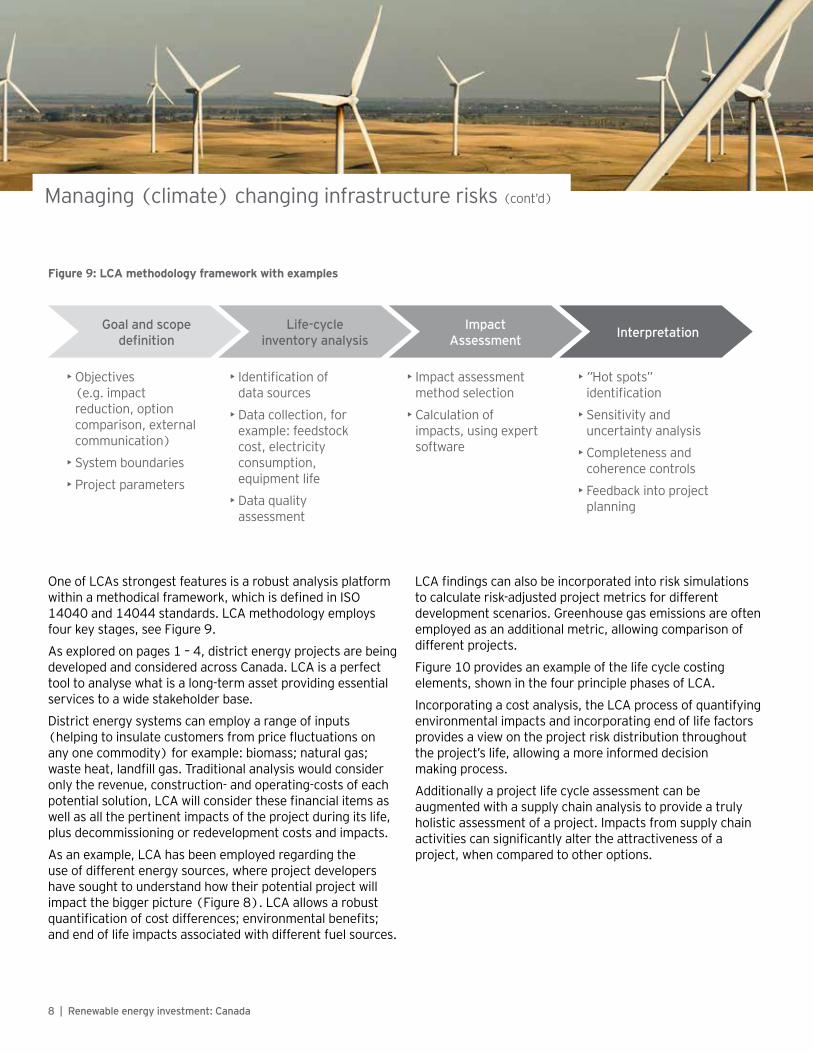
One of LCAs strongest features is a robust analysis platform within a methodical framework, which is defined in ISO 14040 and 14044 standards. LCA methodology employs four key stages, see Figure 9.
As explored on pages 1 – 4, district energy projects are being developed and considered across Canada. LCA is a perfect tool to analyse what is a long-term asset providing essential services to a wide stakeholder base.
District energy systems can employ a range of inputs (helping to insulate customers from price fluctuations on any one commodity) for example: biomass; natural gas; waste heat, landfill gas. Traditional analysis would consider only the revenue, construction- and operating-costs of each potential solution, LCA will consider these financial items as well as all the pertinent impacts of the project during its life, plus decommissioning or redevelopment costs and impacts.
As an example, LCA has been employed regarding the use of different energy sources, where project developers have sought to understand how their potential project will impact the bigger picture (Figure 8). LCA allows a robust quantification of cost differences; environmental benefits; and end of life impacts associated with different fuel sources.
LCA findings can also be incorporated into risk simulations to calculate risk-adjusted project metrics for different development scenarios. Greenhouse gas emissions are often employed as an additional metric, allowing comparison of different projects.
Figure 10 provides an example of the life cycle costing elements, shown in the four principle phases of LCA.
Incorporating a cost analysis, the LCA process of quantifying environmental impacts and incorporating end of life factors provides a view on the project risk distribution throughout the project’s life, allowing a more informed decision making process.
Additionally a project life cycle assessment can be augmented with a supply chain analysis to provide a truly holistic assessment of a project. Impacts from supply chain activities can significantly alter the attractiveness of a project, when compared to other options.
Managing (climate) changing infrastructure risks (cont’d)
Figure 9: LCA methodology framework with examples
Goal and scope definition
Life-cycle inventory analysis
Impact Assessment Interpretation
• Objectives (e.g. impact reduction, option comparison, external communication)
• System boundaries
• Project parameters
• Identification of data sources
• Data collection, for example: feedstock cost, electricity consumption, equipment life
• Data quality assessment
• Impact assessment method selection
• Calculation of impacts, using expert software
• ”Hot spots” identification
• Sensitivity and uncertainty analysis
• Completeness and coherence controls
• Feedback into project planning

Renewable energy investment: Canada | 9
Figure 10: Example project and supply-chain considerations in the four phases of whole-life analysts
Planning Procurement and project delivery
Operating Renewal/disposal
Project level considerations
• Engineering studies
• Preliminary design
• Stakeholder engagement
• Environmental assessments
• Technical feasibility studies
• Financial feasibility and business case development
• Legal
• Land
• Permits and approvals
• Site
• Design and engineering
• Hard construction
• Financing fees and interest during construction
• Legal
• Supervision
• Owner costs
• Occupancy/utilization
• Feedstock management
• Facilities management
• Routine maintenance
• Life cycle replacement
• Staff management
• Financing
• Indirect overhead allocation
• Decommissioning
• Disposal
• Site remediation
• Ongoing land or environmental requirements
Supply chain considerations
• Accessibility to resource source
• Current and future resource site impact
• Supply chain contracting • Resource extraction
• Resource transportation
• Resource site decommissioning
• Resource site remediation
• Resource site ongoing land or environmental requirements
Source: Adapted from Whole-life infrastructure asset management: good practice guide for civil infrastructure, Institution of Civil Engineers
10 | Renewable energy investment: Canada
Tools to meet future challengesWe understand our existing infrastructure needs replacing or extensive repairs in an era when tax payers have little appetite for increasing taxes. We also understand while this is the first time so much infrastructure has needed replacement at once, it is also not going to be the last. The question becomes whether we want to stop ‘kicking the can down the road’, by considering the full life cycle of a project, its impacts on the economy, society as a whole and the environment we all live in.
This challenge will compound as the world experiences a huge demographic shift over the next four decades. In 2010, 3.5 billion people, circa 50% global population, lived in an urban environment. By 2050 this is expected to increase to 70% (see Figure 11) - we will need build the same urban capacity as we have built over the last 4,000 years in the next 40 years.
We know in Canada that heating and cooling requirements alone equates to over 70% of the residential, commercial and institutional sector total energy requirement (see page 1). Globally cities represent three quarters of all energy consumption and circa 80% of global CO2 emissions. Energy self-sufficiency and reliable energy networks will become increasingly important to support rising energy demands in cities: district energy and solar PV are just two examples of a plethora of technology options to support the growing urbanisation.
Future development needs to be congruent and consider the long-term cycle. In the past, we considered the project in context with only the economy, see Figure 12, with little emphasis on the society or environment. Future project development must consider equally the impacts on the economy, environment and society to become sustainable in the long term (Figure 12). Communication and education will also be key to help build a climate where future projects can plan for a future beyond just an asset’s life.
LCA is one tool which introduces broader thinking and considers opportunities, risks and impacts of a project throughout the life cycle. Employing a stricter development discipline forces users to consider all the impacts a project has, weighs and measures these impacts and provides greater decision making information. Only through a full understanding of our impacts can we hope to avoid the mistakes of the past and work towards a better future.
Managing (climate) changing infrastructure risks (cont’d)

Renewable energy investment: Canada | 11
Figure 11: Growing global urbanisation
Source: US Census Bureau, Population Reference Bureau, WorldBank
2000 1800 1600 1400 1200 1000 800 600 400 200 0 200 400 600 800 1000 1200 1400 1600 1800 2000
Glo
bal p
opul
atio
n (m
llion
)
Year
0
1,000
2,000
3,000
4,000
5,000
6,000
7,000 1800
1820
1840
1860
1880
1900
1920
1940
1960
1980
2000
2020
2040
Glo
bal p
opul
atio
n (m
llion
)
Year
Urban populationGlobal population
0
1,000
2,000
3,000
4,000
5,000
6,000
7,000
Figure 12: Congruence in project development considerations (generalisation)
Source: EY
Future: Development focus must align
Project Economy Society Environment
Historical: Lacking congruence
Project Economy
Society
Environment

12 | Renewable energy investment: Canada
Trends and transactions: Procurement
ProcurementFirm power. Hydro Quebec issued call for tenders for wind energy projects in the province totalling 450 MW, all of which is required to be online by the end of 2017. The call sets a maximum price of $90/MWh, which excludes the cost of balancing and complementary power service and requires that local municipalities or groups have at least a 50% ownership stake in the projects. Preferential treatment for projects with domestic content above the standard Quebec requirements for wind projects was also stipulated. Successful projects will be awarded in December 2014.
Not so firm. Meanwhile in Nova Scotia, the Minister of Energy has announced the results of a review of the province’s Community feed-in Tariff (“COMFIT”) program based on feedback from market participants. As of March 2014, 123 COMFIT project applications had been received for a total of circa 280 MW, while 89 projects have been awarded totalling 200MW of capacity. Following the review Nova Scotia will not be accepting new eligible entities as part of the COMFIT program, and any new applications have a maximum size of 500kW.
Market Making – BC Northern Gateway. After a very long process, the 1,200km ‘Northern Gateway’ pipeline project from Northern Alberta to Kitimat, BC, was approved by the federal government. Although the project has received federal approval, this approval came with 209 conditions, resulting in considerable work ahead for Enbridge, the project developer. Renewable energy developers are watching the process closely, as the energy needs from coastal BC’s gas infrastructure presents an opportunity to be met through renewable energy sources. We implore all project stakeholders to work together and develop sustainable solutions for not only the project’s energy needs but overall sustainability.
Ontario evolves procurement. Following 1,779 applications received for the FIT 3.0 submissions window, totalling 436.23 MW, for projects from 10kW to 500kW, the Ontario Power Authority (“OPA”) allowed 345.16MW into connection testing (see Figure 13).
Subsequently the OPA announced 500 successful applicants received contracts totalling 123.50MW of capacity (see Figure 14), together with 63 applicants to the 15MW Unbuilt Rooftop Solar Pilot for 100% of this program’s capacity.
This issue period also saw the OPA release 11 projects holding feed-in tariff contracts, releasing capacity back into the system.
Heating in Ontario. Also during this issue period the OPA confirmed that the Combined Heat and Power Standard Offer Program (“CHPSOP”) 2.0 is being developed. CHPSOP intends to facilitate the increased development of CHP facilities, up to a 20MW maximum capacity, which provide thermal energy to operations in the agricultural industry and district energy sectors.
Incenting growth. At a federal level, the most recent Economic Action Plan proposed expanding the eligibility for accelerated capital cost allowance for clean energy generation equipment to include water-current energy equipment and a broader range of equipment to gasify eligible waste. The Section 43.2 rules allow for a tax deduction of 50% (on a declining-balance basis) for eligible equipment.
Figure 13: FIT 3.0 applications submitted for connection testing (345.2MW)
Solar PV(rooftop)
69%)
Solar PV(non-rooftop)
26%
Other5% Bioenergy
4%
Hydro1%
Source: OPA
Figure 14: FIT 3.0 contract awards (123.5MW)
Solar PV(rooftop)
69%)
Bioenergy2%
Solar PV(non-rooftop)
29%
Source: OPA

Renewable energy investment: Canada | 13
Trends and transactions: Projects
WindGrowth in the east. Despite the changes to Nova Scotia’s COMFIT program, onshore wind development continues in Nova Scotia. The province’s 25% renewable electricity target by 2015 and 40% by 2020 remain in place. Most recently, Affinity Renewables’ project in Kempton, Celtic Current’s wind project in Mulgrave, Wind4All’s two-turbine project in the community of Piedmont all received approval.
Long-term assets meeting long-term liabilities. While in Quebec, Caisse de depot et placement du Quebec agreed to acquire a $42 million minority stake in the Invenergy Wind owned Parc des Moulins wind farm in Quebec. The 135.7MW project began operations in December, under a 20 year PPA with Hydro-Quebec.
Wind in the west continues to grow. Following recent note of record wind production in Alberta, the Alberta Utilities Commission approved BluEarth Renewables’ 115MW Bull Creek wind project. While in British Columbia Finavera Wind Energy Inc. closed the divestiture of its 187MW Meikle wind project to Pattern Energy Group for gross consideration of up to $28 million. In March 2010 Finavera was awarded a 25 year Electricity Purchase Agreement from BC Hydro for the 47 MW Tumbler Ridge and 117 MW Meikle Wind Energy projects.
Looking offshore. St. John’s-based developer Beothuk Energy is progressing its landmark offshore wind demonstration project off the Newfoundland & Labrador coast, having picked the preferred site for the development. Beothuk Energy has selected St. George’s Bay, in western Newfoundland for a $400 million, 180 MW offshore wind project that it says will produce power below $100/MWh. For comparison, European offshore wind costs, as at April 2013, were reported to be circa €110/MWh or circa $160/MWh at the current exchange rate.
Solar PVTransactions slow. Reversing last issue’s trend of high solar PV transaction volumes this issue period witnessed a slower pace of transactions. Last issue’s transaction driver, Canadian Solar, continued to acquire development assets for self-supply purposes including the acquisition of two projects totaling 24 MW from SunEdison Power Canada Inc. and an option to acquire up to three more projects from SunEdison. In Feburary 2014, Canadian Solar announces the sale of its utility scale solar plant, Oro-Medonte solar power plant totaling 10 MW AC, to a fund managed by BlackRock. Canadian Solar is providing turnkey EPC services to complete the project and provide O&M after completion.
Also seen in Issue 4, Fiera Axium in this issue period led a consortium to acquire a 10% stake in Alterra Power’s 50 MW ABW Solar project, for proceeds of $9.8 million.
HydroBuilding on partnership strength. Also in the hydro sector, Fiera Axium have acquired another minority interest from Alterra Power. Fiera Axium has acquired a 49% stake in the 62MW Jimmie Creek hydro project, under construction, in British Columbia.
BioenergyProving the value in waste. Also in British Columbia, the City of Surrey has shortlisted three bidders relating to the City’s organic waste to biofuel development project. Once built, the biofuels will be used to power the City’s waste trucks.
While in Ontario, UK-based Advanced Plasma Power Ltd. is developing a 20 MW waste to energy facility at the Port of Hamilton to process 170,000 tonnes a year of commercial and municipal waste. The facility is expected to cost $34 million.

14 | Renewable energy investment: Canada
Cleantech and renewable energy stocks provide stability while natural gas prices fluctuate
Cleantech and renewable energy stocksThis issue of Renewable Energy: Canada has seen both S&P/TSX Clean Technology-index and Nasdaq-index outperform global peers and remain in positive territory. Although the S&P/TSX Clean Technology index has risen steadily since July 2013, Nasdaq has posted the most significant gains since the index base point of March 2010. Over half of the companies in S&P/TSX Clean Technology index are renewable power utility companies, and their growth, notably Boralex, Waterfurnace and Algonquin Power, over the past year is a strong contributing factor to the steady increase of the overall index from August 2013 to July 2014. It is hoped the trend of the previous eight months continues, despite the possible dampening effect of rising interest rate expectations on traditionally defensive stocks.
Comparison with commoditiesCanadian cleantech and renewable energy stocks within the S&P/TSX Clean Technology index continue to show stability when compared with key energy commodities sampled. At the start of the issue period the S&P/TSX Clean Technology index was 6 points above the index base point of March 2010, while the NGX Canadian Natural Gas index was 18 points below the index base point of March 2010. During this issue S&P/TSX Clean Technology index rose steadily to 24 points above the index base point of March 2010; however the NGX Canadian Natural Gas index significantly fluctuated, closing at 10 points above the index base point of March 2010. While the S&P/TSX Clean Technology index was outperforming the NGX Canadian Natural Gas index at July 2014, we expect the volatility in natural gas prices to continue.
Relative stability from oil… less so with gasThe most remarkable event in this issue is the surge in natural gas prices as a result of long, harsh winter in various parts of the country. The NGX Canadian natural gas index was at one of its lowest points in August 2013. The unexpected cold weather increased the demand for natural gas, constrained the gas pipelines, and storage struggled to handle the additional volume. The chart right shows the rollercoaster ride experienced by natural gas prices. A larger problem might be looming on the horizon – supply risk. Not a factor often considered in the North American sector (in contrast to Europe, which at time of writing was again experiencing a dispute between Russia and the Ukraine over natural gas), however natural gas storage is currently well below normal levels. Should this fall place greater demands on natural gas peaking plants the reserves may not recover. And if the winter of 2014/15 is as bad as the one just passed, those with a natural gas supply will be warm, while others may not.
Going forward, the expected increase in natural gas for electricity generation will increase our economic dependence on this volatile commodity, a factor which has the potential to reciprocally increase natural gas price volatility. Renewable energy technology generation provides a locally generated source of energy at stable prices, and provides grid managers with an important source of diversification at a fixed cost.

Renewable energy investment: Canada | 15
Cleantech and renewable energy stocks see stability while energy costs converge
Figure 15: Cleantech, energy and benchmark indices performance from March 2010 to July 2014
2.00
1.80
1.60
1.40
1.20
1.00
0.80
0.60
0.40
0.20
0.00
Source: Standard & Poor’s, Toronto Stock Exchange, Nasdaq exchange, Wilderhill, HSBC, US Energy Information Administration, NGX, CapitalIQ, EY
Mar 10
May 10
Jul 10
Sep 10
Nov 10
Jan 11
Mar 11
May 11
Jul 11
Sep 11
Nov 11
Jan 12
Mar 12
May 12
Jul 12
Sep 12
Nov 12
Jan 13
Mar 13
May 13
Jul 13
Sep 13
Nov 13
Jan 14
Mar 14
May 14
Jul 14
S&P/TSX Clean Technology NEX (Wilderhill) Nasdaq Composite Index
HSBC Climate Change Index Crude Oil - West Texas Crude Oil - European Brent
NGX Canadian Natural Gas Index

16 | Renewable energy investment: Canada
The country attractiveness indices, prepared by EY’s Renewable Energy Group provide scores for national renewable energy markets, renewable energy infrastructures and their suitability for individual technologies.
Global attractiveness
Technology-specific indices rankings
Rank Previous rankg
Country RECAI score
Onshore wind
Offshore wind
Solar PV Solar CSP Biomass Geothermal Hydro Marine
1 (1) US 75.2 2 4 2 1 2 1 2 4
2 (2) China 74.7 1 3 1 5 1 12 1 19
3 (3) Germany 67.0 3 2 4 26 8 7 9 27
4 (4) Japan 64.8 10 9 3 27* 3 3 3 12
5 (6) Canada 60.4 4 10 7 24 12 19 5 5
6 (5) UK 60.3 6 1 8 27* 4 18 23 1
7 (7) India 59.5 8 21 5 4 15 15 8 11
8 (9) France 58.2 11 8 9 17 9 14 16 6
9 (8) Australia 58.1 14 17 6 3 19 11 17 7
10 (12) Brazil 55.6 7 26 15 10 5 32 4 24
11 (10) South Korea 55.1 22 13 11 25 11 28 18 3
12 (11) Italy 53.7 21 20 13 11 14 6 11 22
13 (14) Chile 53.0 27 24 12 2 22 10 15 16
14 (13) Belgium 51.8 23 6 20 27* 16 20 30 32
15 (16) Netherlands 51.7 15 7 27 27* 10 27 31 30
16 (15) Denmark 51.6 12 5 29 27* 13 35% 36 15
17 (19) South Africa 51.5 25 29 14 6 37 35* 25 18
18 (17) Portugal 51.3 20 19 21 18 23 16 19 9
19 (18) Spain 50.7 26 23 18 9 25 34 29 14
20 (23) Turkey 50.6 16 25 26 12 32 4 10 20
21 (22) Thailand 50.5 31 39 10 20 17 29 34 28
22 (20) Sweden 50.2 9 12 36 27* 7 24 12 13
23 (21) Taiwan 50.0 30 16 16 23 28 21 22 25
24 (24) Austria 49.1 19 40 23 27* 18 22 14 31
25 (27) Mexico 47.5 24 31 28 19 30 9 28 21
26 (25) Peru 47.5 36 28 19 13 26 13 6 31*
27 (26) Poland 46.2 18 18 35 27* 20 17 24 31*
28 (29) Israel 46.1 39 37 17 8 38 35* 37 26
29 (31) Morocco 45.9 28 35 25 7 39 35* 39 31*
30 (30) Norway 45.4 13 14 38 27* 27 26 7 10
31 (32) Romania 45.0 29 32 30 27* 35 25 27 31*
32 (28) Ireland 44.8 5 15 40 27* 21 33 32 2
33 (33) Greece 44.7 33 36 24 14 36 23 38 31*
34 (35) Saudi Arabia 44.0 35 38 22 15 40 30 40 31*
35 N/A Philippines 44.0 37 30 31 22 29 8 21 8
36 (34) Finland 43.6 17 11 39 27* 6 35* 33 31*
37 (39) Kenya 43.4 32 34 33 16 31 5 26 29
38 (37) Ukraine 41.6 34 27 32 27* 33 35* 35 31*
39 N/A Indonesia 40.3 40 33 34 21 24 2 13 17
40 N/A Russia 40.0 38 22 37 27* 34 31 20 23
*Joint ranking
All-renewables index at June 2014

Renewable energy investment: Canada | 17
EY Renewable Energy Group
Our Renewable Energy Group assists companies increase value from their renewable energy activities. Our professionals provide advice and services in the following areas:
Divestituresupport
Transactionsupport
Financialadvisory and
valuation
TaxationFinancialmodelling
Market entrystrategy
Financeraising andstructuring
Renewableenergysector
EY’s Renewable Energy groupWith a dedicated 100-strong team of international advisors operating across our member firms worldwide, EY’s Renewable Energy group helps clients to increase value from renewable energy activity. Members of the group provide advice and services across the renewable energy industry, energy utilities and wider infrastructure sector.
Contact: For further information on the services we provide, and for future copies of the indices, please contact Steve Lewis, Mark Porter or Emily Kwok.

EY | Assurance | Tax | Transactions | Advisory
About EYEY is a global leader in assurance, tax, transaction and advisory services. The insights and quality services we deliver help build trust and confidence in the capital markets and in economies the world over. We develop outstanding leaders who team to deliver on our promises to all of our stakeholders. In so doing, we play a critical role in building a better working world for our people, for our clients and for our communities.
EY refers to the global organization and may refer to one or more of the member firms of Ernst & Young Global Limited, each of which is a separate legal entity. Ernst & Young Global Limited, a UK company limited by guarantee, does not provide services to clients. For more information about our organization, please visit ey.com/ca.
About Ernst & Young’s Transaction Advisory ServicesHow organizations manage their capital agenda today will define their competitive position tomorrow. We work with our clients to help them make better and more informed decisions about how they strategically manage capital and transactions in a changing world. Whether you’re preserving, optimizing, raising or investing capital, Ernst & Young’s Transaction Advisory Services bring together a unique combination of skills, insight and experience to deliver tailored advice attuned to your needs – helping you drive competitive advantage and increased shareholder returns through improved decision making across all aspects of your capital agenda.
© 2014 Ernst & Young LLP. All Rights Reserved. A member firm of Ernst & Young Global Limited.
1301307 ED0115This publication contains information in summary form, current as of the date of publication, and is intended for general guidance only. It should not be regarded as comprehensive or a substitute for professional advice. Before taking any particular course of action, contact Ernst & Young or another professional advisor to discuss these matters in the context of your particular circumstances. We accept no responsibility for any loss or damage occasioned by your reliance on information contained in this publication.
ey.com/ca
ContactFor further information on our services and for future copies of this or any other issue, please visit ey.com/renewables or contact any of the following individuals:
Steve Lewis 416 943 2659 [email protected]
Mark Porter 416 943 2108 [email protected]
Emily Kwok 403 206 5427 [email protected]
Bruno Gagnon 514 879 2876 [email protected]