removing aflatoxin m 1 fro1n milk using activated carbon
TRANSCRIPT

Removing Aflatoxin M1 fro1n Milk using Activated Carbon and its Effects on Protein Concentration
By: Kaylin Chaney
A Thesis,
Submitted to the Faculty of Mississippi State University in Partial Fulfillment of the Requirements for Cursus Honorum
Mississippi State, Mississippi
April 2015

Copyright by Kaylin Chancy 2015

Removing Aflatoxin M1 from Milk using Activated Carbon and its Effects on Protein Concentration
Approved by:
Dr. Ashli Brown
State Chemist (Director of Thesis)
Dr. Seth Oppenheimer
By Kaylin Chaney
Dr. Darrell Spark 5
Assistant Professor of Biochemistry, Molecular Biology, Entomology and Plant Pathology (Committee)
Professor of Mathematics and Director of Undergraduate Research (Shackouls Honors College Representative)
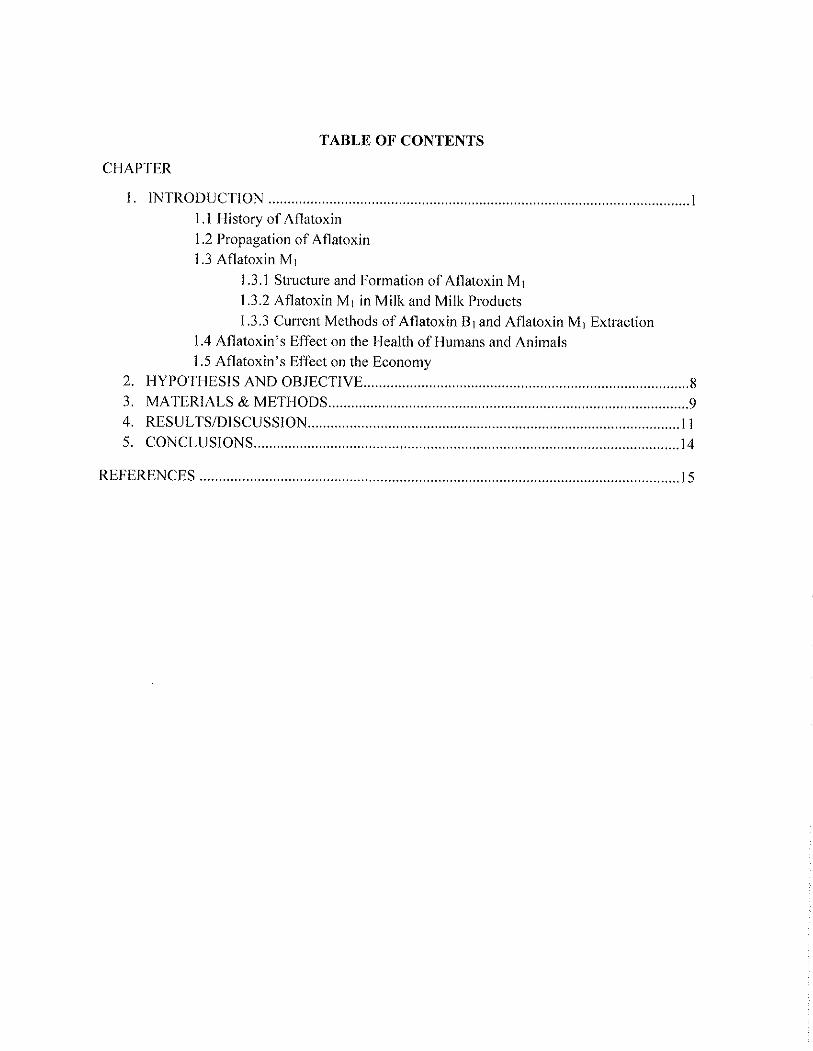
TABLE OF CONTENTS
CHAPTER
I. INTRODUCTION .............................................................................................................. 1 1.1 History of Aflatoxin
1.2 Propagation of Aflatoxin 1.3 Aflatoxin M 1
1.3.1 Structure and Formation of Aflatoxin M 1
1.3.2 Aflatoxin M1 in Milk and Milk Products
1.3 .3 Current Methods of Aflatoxin B 1 and Aflatoxin M 1 Extraction 1.4 Aflatoxin's Effect on the Health of Humans and Animals 1.5 Aflatoxin's Effect on the Economy
2. HYPOTHESIS AND OBJECTIVE ..................................................................................... 8 3. MATERIALS & METHODS .............................................................................................. 9 4. RESULTS/DISCUSSlON ................................................................................................. 11
5. CON CL U SI ON S ............................................................................................................... 14
REFERENCES ............................................................................................................................. 15

1. INTRODUCTION
1. 1 History of Aflatoxins
Mycotoxins are natural toxins produced by fungi including molds. The name mycotoxin
is translated from Greek as µuKllS (mykes, mukos) "fungus" and TO(;tK6v (toxikon) "poison," with
this term being introduced by British researchers in 1962. 1101 Mycotoxins are known to grow on
nuts, grains, and corn. There are three subcategories of mycotoxins: aflatoxins, fumonisins, and
vomitoxins, all of which are regulated due to the danger to human and animal health they
impose. Out of all mycotoxins, aflatoxins cause the greatest losses and highest management costs
due to their extremely high toxicity on a unit basis and their long history of harsh regulation. 1'71
They are also known to be the most toxic/carcinogenic compounds of all the mycotoxins. 171
Aflatoxins are produced by toxigenic strains of the fungi A:,pergillus flavus and
Aspergillus parasiticus and are found in feed as aflatoxin B1, B2, 0 1, and 0 2 and found in milk as
aflatoxin metabolite M I and M2. 12
• 201 All are quite stable in many foods while also being fairly
resistant to degradation. 12•
151 Because of the danger of these toxins, the maximum allowable
aflatoxin concentration is regulated by the Food and Drug Administration (FDA) for the United
States for feeds at 20 µg/kg and by the European Union (EU) for Europe at a much lower 2
µg/kg. I 17, 20]
Aflatoxins were first discovered when an outbreak of "Turkey X Disease," now known to
be aflatoxicosis, occurred over many turkey populations in England in the I 960s, which was
traced to aflatoxin contaminated groundnut meal that was being used as feed for the turkeys. l6l
From there, research was conducted that eventually led to the discovery of the four types of
aflatoxin and the two aflatoxin metabolites as mentioned previously. The aflatoxins were named
based on the physical characteristic of fluorescence at 395nm, with B1 and B2 fluorescing blue
1

and G1 and G2 fluorescing green. Both M1 and M2 were named instead for their presence in milk,
rather than their fluorescence. I 101
1.2 Propagation of Aflatoxin
Fungal contamination and subsequent production of aflatoxin can occur in crops while
growing in the field, at harvest, during postharvest operations, and in storage. 1231 However,
Aspergillus typically flourishes in grains stored in improper conditions. Hot, humid conditions,
usually caused by un-aerated storerooms, are linked to increased aflatoxin contamination in
stored feed. 18· 91 Animals given feed that has been in a storeroom exhibit higher aflatoxin levels
than animals that rely on grass and shrubbery as their main food source. 181 Because of this, cold
seasons usually yield animals with higher levels of aflatoxin due to the animals having to be fed
supplemental feed. In contrast, spring and summer seasons show a drop in aflatoxin levels in
animals due to the abundance of fresh grass and other edible greenery. 1131
1.3 Aflatoxin Mi
1.3.1 Structure and Formation of A.flatoxin M1
Aflatoxin B1, the most toxic and most frequent form found in contaminated food and
feeds, is ingested by humans or animals and metabolized by attaching to macromolecules. 121 It is
then transformed into different metabolites in the liver by the hepatic microsomal mixed function
oxidase system and cytochrome P450. 19· 131 The metabolites produced include aflatoxin B2a,
aflatoxin Q1, aflatoxin P1, aflatoxicol H1, aflatoxin M1 (AFM1), AFB 1 aflatoxicol-M 1, and
epoxide. Aflatoxin M1 is the compound 4-hydroxy AFB 1. 19· 101 The biliary, or bile ducts,
eliminates about 60% of these metabolites with aflatoxin B1 exiting the body through urine. 191
About 0.3-6.2% of AFB 1 present in animal feed is metabolized to AFM 1 that is secreted through
milk in the mammary glands of lactating humans and animals. 11 · 101
2

1.3.2 Aflatoxin M 1 in Milk and Milk Products
Aflatoxin MI binds to milk proteins such as casein and whey. 121 However, this binding to
proteins is not homogeneous. Most researchers find that aflatoxin binds preferentially to casein.
For example, a study by Grant and Carlson in 1971 showed that 80% of AFM 1 is found in the
skim portion of milk, which is made of casein proteins, when the cream is separated due to
AFM I binding to casein. In contrast, other researchers have found that aflatoxin binds
preferentially to whey at 50%, 50%, 53-58%, 60%, and 66%. 1131 Despite this discrepancy, it is
now a commonly accepted fact that AFM I binds preferentially to casein based on the reports of
many different researchers.
Levels of aflatoxin in milk depend on several factors such as animal breed, lactation
period, mammary infections etc., and can be detected 12-24 hours after AFB 1 ingestion, reaching
a high level after a few days. If ingestion of AFB 1 is stopped, a period of72 hours is required
before AFM I is no longer detectable. 161 Urine can also be assessed for AFM I levels 24-48 hours
after exposure. 1111 However, it is a more common method to test milk because milk is sold as a
product and urine is not. Experiments have been conducted with differing dairy cattle breeds to
assess the effects of aflatoxin between breeds. Holstein cows were given rations of feed
contaminated with 80, 86,470, 557, 1089 and 1493 µg/kg of AFB 1 which resulted in AFM 1
concentrations of 0.245, 1.5, 13.7, 4.7, 12.4 and 20.2 mg/L, respectively. Brindle cows were
given 540 µg/kg of AFB 1 resulting in 0.92 mg/L. 112J From these results, it can be concluded that
Holstein milk harbors more aflatoxin MI per µg/kg of AFB 1 given than Brindle milk does. In
other breeds, values of contamination range between 64 and 1799 µg/kg of AFB 1 giving some
residues in milk between 0.35 and 14.2 mg/L of AFM 1• Therefore, with an intake of AFB 1 for 2-
60 mg/ cow/ day, AFM I residues in milk can range between 1 and 50 µg/kg. 1121
3
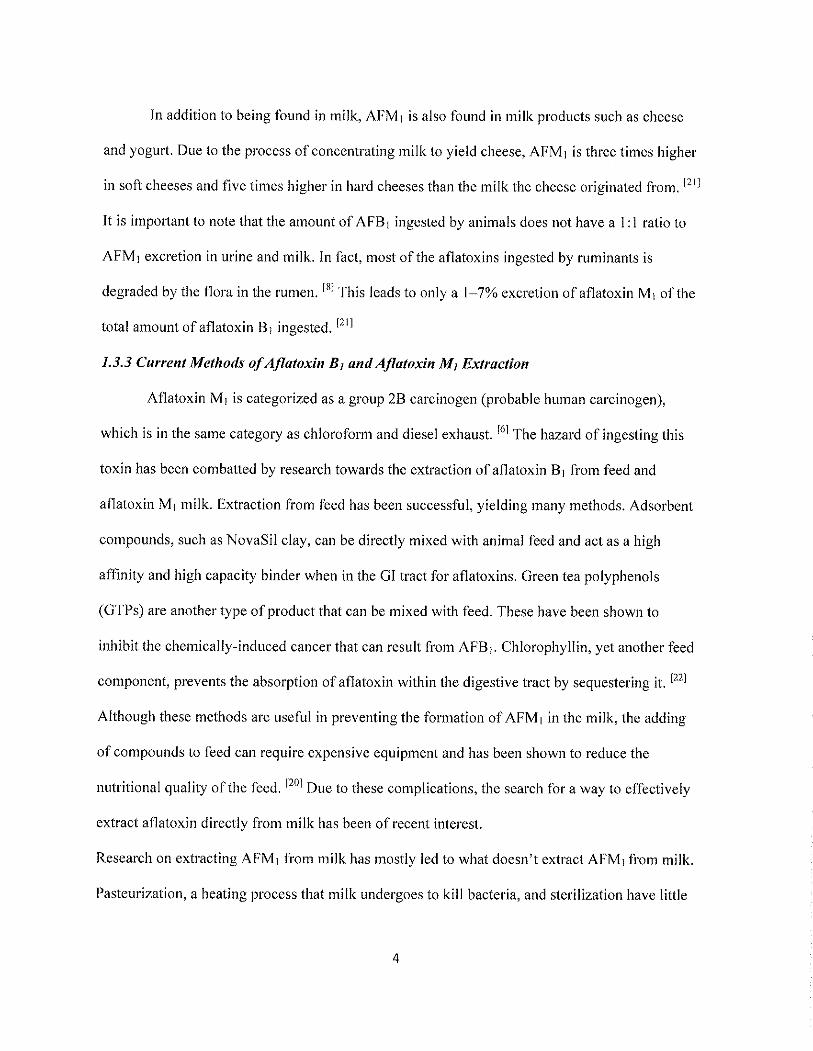
In addition to being found in milk, AFM 1 is also found in milk products such as cheese
and yogurt. Due to the process of concentrating milk to yield cheese, AFM 1 is three times higher
in soft cheeses and five times higher in hard cheeses than the milk the cheese originated from. 121 1
It is important to note that the amount of AFB 1 ingested by animals does not have a I: I ratio to
AFM1 excretion in urine and milk. In fact, most of the aflatoxins ingested by ruminants is
degraded by the flora in the rumen. 181 This leads to only a 1-7% excretion of aflatoxin M 1 of the
total amount ofatlatoxin B1 ingested. 1211
1.3.3 Current Methods of Ajlatoxin B 1 and Ajlatoxin M1 Extraction
Aflatoxin M1 is categorized as a group 2B carcinogen (probable human carcinogen),
which is in the same category as chloroform and diesel exhaust. 161 The hazard of ingesting this
toxin has been com batted by research towards the extraction of atlatoxin B1 from feed and
atlatoxin M1 milk. Extraction from feed has been successful, yielding many methods. Adsorbent
compounds, such as NovaSil clay, can be directly mixed with animal feed and act as a high
affinity and high capacity binder when in the GI tract for aflatoxins. Green tea polyphenols
(GTPs) are another type of product that can be mixed with feed. These have been shown to
inhibit the chemically-induced cancer that can result from AFB 1. Chlorophyllin, yet another feed
component, prevents the absorption of atlatoxin within the digestive tract by sequestering it. 1221
Although these methods are useful in preventing the formation of AFM 1 in the milk, the adding
of compounds to feed can require expensive equipment and has been shown to reduce the
nutritional quality of the feed. 1201 Due to these complications, the search for a way to effectively
extract atlatoxin directly from milk has been of recent interest.
Research on extracting AFM 1 from milk has mostly led to what doesn't extract AFM 1 from milk.
Pasteurization, a heating process that milk undergoes to kill bacteria, and sterilization have little
4
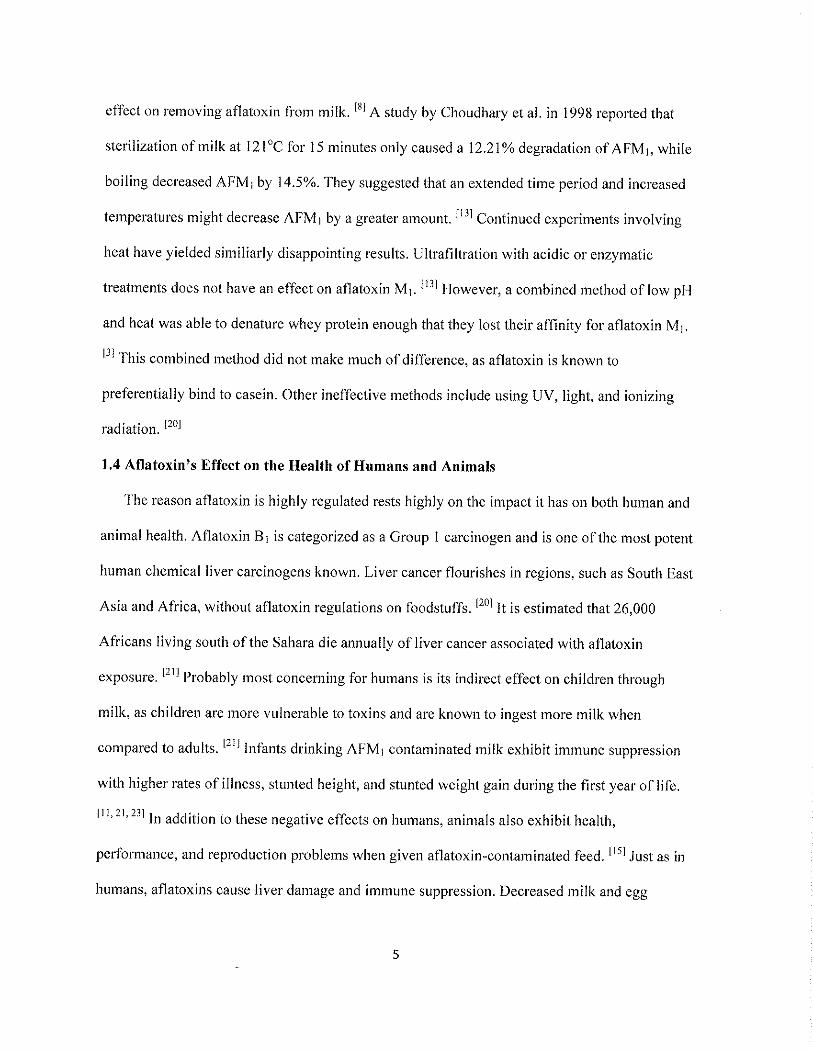
effect on removing aflatoxin from milk. 181 A study by Choudhary et al. in 1998 reported that
sterilization of milk at 121°C for 15 minutes only caused a 12.21% degradation of AFM 1, while
boiling decreased AFM 1 by 14.5%. They suggested that an extended time period and increased
temperatures might decrease AFM I by a greater amount. [I 3l Continued experiments involving
heat have yielded similiarly disappointing results. Ultrafiltration with acidic or enzymatic
treatments does not have an effect on aflatoxin M 1. 1131 However, a combined method of low pH
and heat was able to denature whey protein enough that they lost their affinity for aflatoxin M 1•
131 This combined method did not make much of difference, as aflatoxin is known to
preferentially bind to casein. Other ineffective methods include using UV, light, and ionizing
radiation. [201
1.4 Aflatoxin's Effect on the Health of Humans and Animals
The reason aflatoxin is highly regulated rests highly on the impact it has on both human and
animal health. Aflatoxin B1 is categorized as a Group I carcinogen and is one of the most potent
human chemical liver carcinogens known. Liver cancer flourishes in regions, such as South East
Asia and Africa, without aflatoxin regulations on foodstuffs. [201 It is estimated that 26,000
Africans living south of the Sahara die annually of liver cancer associated with aflatoxin
exposure. 1211 Probably most concerning for humans is its indirect effect on children through
milk, as children are more vulnerable to toxins and are known to ingest more milk when
compared to adults. 1211 Infants drinking AFM 1 contaminated milk exhibit immune suppression
with higher rates of illness, stunted height, and stunted weight gain during the first year of life.
111•
21•
231 In addition to these negative effects on humans, animals also exhibit health,
performance, and reproduction problems when given aflatoxin-contaminated feed. 1151 Just as in
humans, aflatoxins cause liver damage and immune suppression. Decreased milk and egg
5

production and embryo toxicity may also occur. 1201 Feed conversion ratios are known to increase
coupled with a decrease in average daily gain and general decrease in body weight. 1211 Dairy
animals are especially effected as, in addition to these health and reproduction problems, milk
production also decreases. For example, a Gregorian dairy herd eating contaminated feed was
found to produce 28% more milk after only three weeks of eating non-aflatoxin contaminated
feed. 1161 Because of these negative effects, regulatory limits for AFM 1 in milk are 0.5 µg/kg for
milk in the US and 0.05 µg/kg for milk in Europe. 11 · 91
1.5 Aflatoxin's Effect on the Economy
All relevant studies to date indicate that there is a significant cost impact due to combating
aflatoxins. For the United States, costs ofbiocontrol methods such as utilizing transgenic crops
in the hopes of combating aflatoxin have an estimated cost of $42-79/hectacre. 1221 Research
costs for the year 2000 are known to be over $17.7 million. Sixty scientists were provided this
amount for the primary focus of prevention of the fungus and toxin production in the crop. In
addition to biocontrol methods and research costs, test costs add another $30-50 million wmih of
loss per year. The peanut industry suffers a $25 million loss per year from testing costs, market
rejection, etc. For a particularly bad year (1999), south Texas alone exhibited estimated losses of
$7 million due to aflatoxin-contaminated cottonseed. The tree nut industry is also affected. The
total direct dollar market value loss of the walnut industry was $38,704,000 in 2000-2001. The
almond market suffered a similar loss in 1995-200 l as the total direct dollar market value loss
ranged from $23,265,000 to $47,310,000. 1171
However, the above numbers only represent the negative impacts to the United States.
Other countries suffer even bigger losses due to warmer climates and lack of regulations. 141 For
example, Roy reports that, due to regulations on African trade, the groundnut and cereal industry
6
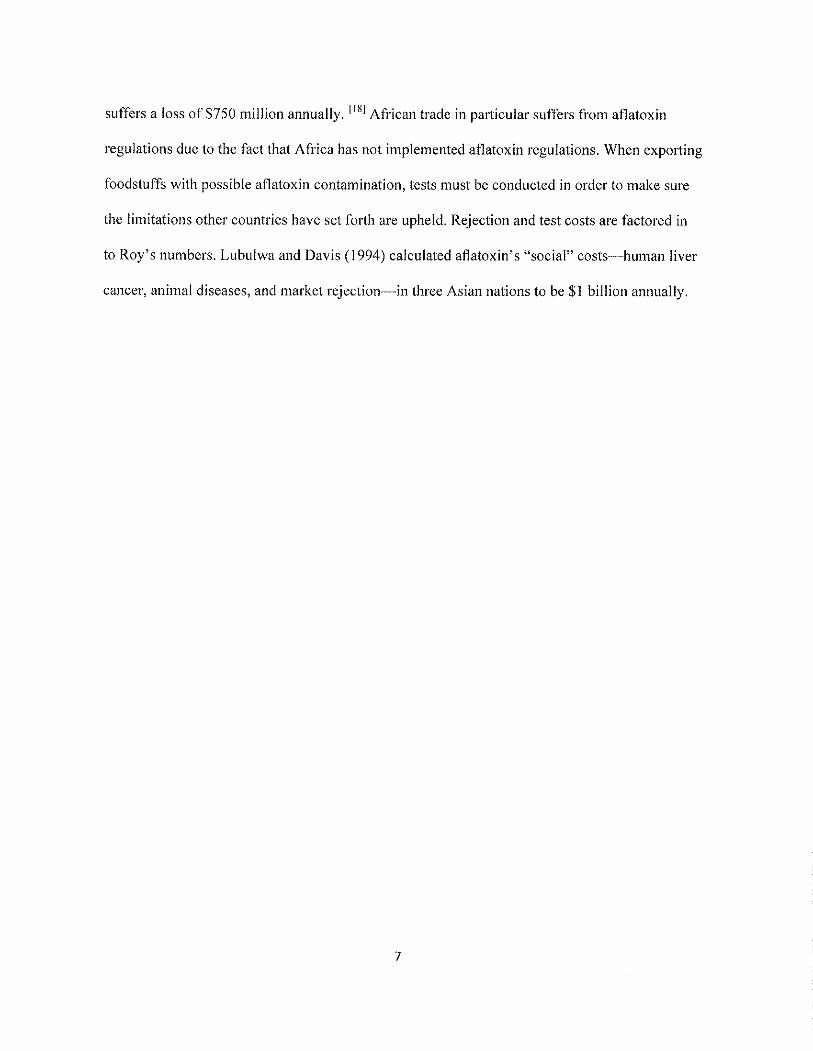
suffers a loss of $750 million annually. 1181 African trade in particular suffers from aflatoxin
regulations due to the fact that Africa has not implemented aflatoxin regulations. When exporting
foodstuffs with possible aflatoxin contamination, tests must be conducted in order to make sure
the limitations other countries have set forth are upheld. Rejection and test costs are factored in
to Roy's numbers. Lubulwa and Davis (I 994) calculated aflatoxin's "social" costs-human liver
cancer, animal diseases, and market rejection-in three Asian nations to be $1 billion annually.
7

2. HYPOTHESIS AND OBJECTIVE
AFM 1 binds to milk proteins such as casein, whey, and especially curds (which are made
out of acidified and concentrated casein proteins). During the heat treatment of milk, whey
proteins begin to denature and completely denature during fermentation. Whey proteins lose
their aflatoxin binding ability when denatured. Concurrently, casein is the protein that aflatoxin
mainly binds to via casein's hydrophobic sites. f2l Only the combined action of heat and low pH
is able to denature whey proteins to a point where they lose their AFM 1 binding ability. 131
The purpose of this study is to determine the effect that aflatoxin M 1 has on casein and whey
protein concentration in milk. The ability of activated carbon to remove AFM 1 after interaction
with added milk proteins will also be measured.
8

3. MATERIALS AND METHODS
2.1 Protein Determination in Milk
Raw milk was obtained from the Mississippi State Dairy Farm and separated into two
2000 mL volumetric flasks. AFM 1 was obtained from Sigma Aldrich and used to spike raw milk.
One 2000 mL volumetric flask served as the control (raw milk only), while the other was spiked
with I ppb AFM 1• Casein was obtained from Fisher Science Education (Nazareth, PA), and
spray-dried whey from bovine milk (concentration 11 %) was obtained from Sigma Aldrich, both
for the use of increasing protein concentration in milk. Activated carbon (DARCO l 2x20 LI)
was obtained from Norit (Marshall, TX) for use in binding AFM 1 from milk. Acetonitrile was
obtained from Optima for use in performing salting out with QuEChERS.
A 24
( 4 factors each at 2 levels) factorial arrangement of treatments was performed yielding 16
treatments of samples with different additions of AFM 1 (0 or I ppb), casein (0 or 2%), whey (0
or I%), and activated carbon (0 or I%). Milk was measured out into 50 mL centrifugation tubes
and the appropriate amount of casein and whey was added to each sample. Sodium hydroxide
(0.1 g) was added to each sample tube to assist in dissolving the protein with milk. Each sample
was also inverted, then stirred slowly for 5 minutes using a stir bar to ensure complete mixing
without breakdown of protein. Activated carbon was then added to respective samples and
allowed a 15 minute contact time with gentle shaking via Burrell Wrist-Action Shaker. Each
sample was run in 3 reps using LECO in order to determine protein concentration.
2.2 Determination of AFM1 in Milk
A volume of IO mL acetonitrile was added to each 15 mL milk sample for the extraction
of AFM 1 from milk samples. Samples were allowed to shake in a GenoGrinder 2010 Spex
9

Sampleprep for 1 min at 1000 strokes/min. QuEChERS extraction salts (AOAC method),
obtained from Agilent Technologies, were then added to each sample (1 packet per sample). The
samples were allowed to shake in the GenoGrinder again for 1 min at 1000 strokes/min. Samples
were centrifuged (!EC I-IN-SIi centrifuge) for 5 min at 3500 rpm. A volume of 1.5 mL of the
supernatant was collected from each sample and pipetted through PTFE syringe filters into 2 mL
auto sampler vials. An Agilent 1260 Infinity LC Triple Quadrupole Mass Spectrometry was used
to analyze samples for residual AFM 1 quantification.
10
4. RESULTS/DISCUSSION
Average percent protein results proved that activated carbon does not significantly affect
protein concentration. Other experiments have also proved that activated carbon allows the
preservation of chlorides and organic acids in addition to preserving proteins. 1141 A comparison
between sample one 3.89±0.07% (the control) and sample three 3.83±0.03% which contains I%
activated carbon can be made. The average percent protein differs only by 0.06% (Table I).
Therefore, average percent protein is not significantly affected by activated carbon.
Also as expected, upon the addition of casein or whey, average percent protein increased,
regardless of the presence of activated carbon. Methods from Damin et al. suggest that milk
proteins can be agitated for IO minutes at 800rpm without denaturing significantly. l5l Our
method of gentle shaking for 15 minutes ensured that added casein and whey proteins were not
denatured, which is reflected in the results as an increase in average percent protein upon
addition of casein and/or whey.
11
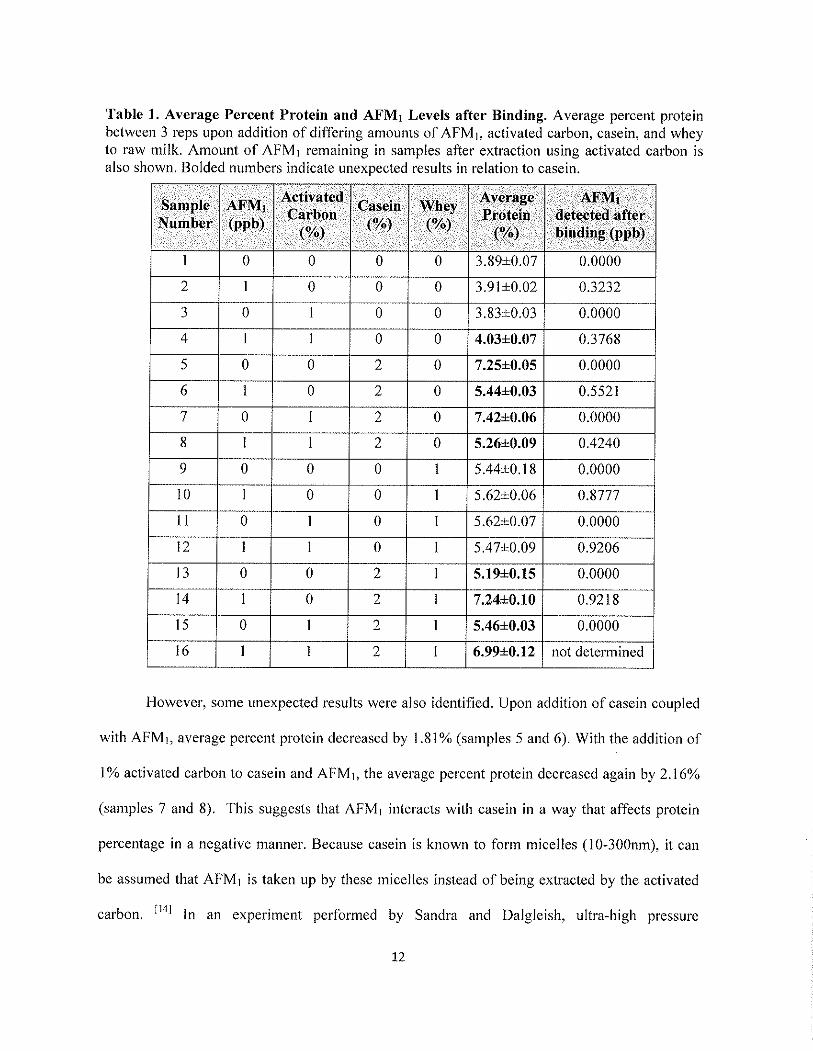
Table 1. Average Percent Protein and AFM1 Levels after Binding. Average percent protein between 3 reps upon addition of differing amounts of AFM 1, activated carbon, casein, and whey to raw milk. Amount of AFM I remaining in samples after extraction using activated carbon is also shown. Bolded numbers indicate unexpected results in relation to casein .
.... . . . .·. ... . ·• · .. ··.• .•
I < <,Afl\11 . Ac.tiva.ted Avenlg¢ Sample AFM1 Carbon
Casein Whey .. I Protein··.•. I detected after Number (ppb) (%) . (%). (%) I (%) ·. binding (ppb) I . •. . . . · .
. ... _ .. -: .. --.·.·.--,__ _-_ .. · .
I 0 0 0 0 3.89±0.07 0.0000
2 I 0 0 0 3.91±0.02 0.3232
3 0 1 0 0 3.83±0.03 0.0000
4 1 1 0 0 4.03±0.07 0.3768
5 0 0 2 0 7.25±0.05 0.0000
6 1 0 2 0 5.44±0.03 0.5521
7 0 1 2 0 7.42±0.06 0.0000
8 I I 2 0 5.26±0.09 0.4240
9 0 0 0 I 5.44±0.18 0.0000
10 I 0 0 1 5.62±0.06 0.8777
11 0 I 0 1 5.62±0.07 0.0000
12 I 1 0 1 5.47±0.09 0.9206
13 0 0 2 1 5.19±0.15 0.0000
14 I 0 2 1 7.24±0.10 0.9218
15 0 1 2 I 5.46±0.03 0.0000
16 I 1 2 1 6.99±0.12 not determined
However, some unexpected results were also identified. Upon addition of casein coupled
with AFM 1, average percent protein decreased by 1.81% (samples 5 and 6). With the addition of
1 % activated carbon to casein and AFM 1, the average percent protein decreased again by 2.16%
(samples 7 and 8). This suggests that AFM I interacts with casein in a way that affects protein
percentage in a negative manner. Because casein is known to form micelles (I 0-300nm), it can
be assumed that AFM I is taken up by these micelles instead of being extracted by the activated
carbon. [l4l In an experiment performed by Sandra and Dalgleish, ultra-high pressure
12

homogenization (186±7 MPa) plus heat treatment (85± I °C for IO min) was found to decrease the
average diameter of casein micelles. 1191 This method may be used in future experiments to lessen
the amount of AFM I binding to casein micelles and allow for easier extraction of AFM I from
milk proteins. Samples containing only whey and AFM I did not show this same pattern, which
suggests that AFM I does not interact with whey in a way that decreases protein concentration.
Another unexpected result was identified in samples thirteen-sixteen. In samples thirteen and
fifteen, average percent protein concentration did not increase as it should have upon the addition
of 2% casein and I% whey, only reaching an increase of 1.57% from the control. In samples
fourteen and sixteen, average percent protein increased abnormally, from 5.19% to 7.24% and
from 5.46% to 6.99%, considering the fact that AFM 1 was shown to decrease average percent
protein when coupled with casein. These results suggest that too much protein oversaturated the
milk samples. The combination of 2% casein and I% whey added to the 3.89% protein that
already existed in the raw milk likely caused oversaturation of the protein causing skewed
results. To resolve this, percent protein added can be decreased or milk can be made to undergo
ultra-high pressure homogenization, as mentioned above, which has been found to make casein
to become more soluble. 1191
The results obtained from the HPLC indicated that little, if any, AFM1 was bound from
the samples (Table I). Techniques using HPLC coupled with mass spectrometry have been
proven to successfully quantify aflatoxins, including AFM 1, in bovine milk and other milk
products. 1241 This can be attributed to the fact that the samples were not sieved to remove
activated carbon and were only allowed a 15 minute contact time, rather than sieving the
activated carbon out with a 200-US mesh sieve and allowing a one hour contact time, as done in
· • [141 previous expenments. ·
13

5. CONCLUSIONS
The results show that activated carbon does not affect percent protein concentration.
However, AFM 1 may interact with casein in a manner that decreases protein concentration. We
hypothesize that AFM 1 binds strongly to casein even when activated carbon is added. Future
experimentation sieving out activated carbon and allowing a longer contact time for the purpose
of extracting AFM 1 might be able to show whether or not AFM 1 will stay bound to casein or be
extracted as normal. Ultra-high pressure homogenization coupled with a heat treatment may be
used to make casein proteins more soluble. The effect on protein concentration after extraction of
AFM 1 will also be important in order to determine if AFM1 extraction by use of activated carbon
results in decreased protein concentration in milk.
14
REFERENCES
I. Anwar J., Hussain I., Shafique U. 2010. Microanalysis ofaflatoxin Ml in dairy products
at trace levels and its elimination. Foreign Agricultural Relations (FAR), Egypt, 29th
Nov. - 1st Dec., pp. 597 - 611.
2. Arab M., Sohrabvandi S., Mortazavian A. M., et al. 2012. Reduction of aflatoxin in
fermented milks during production and storage. Toxin Rev 31 :44-53.
3. Barbiroli A., Bonomi F., Benedetti S., 2007. Binding of aflatoxin Ml to different protein
fractions in ovine and caprine milk. J Dairy Sci 90:532-540.
4. Charmley L., Trenholm H., Prelusky D., et al. 1995. Economic Losses and
Decontamination. Natural Toxins 3: 199-203.
5. Damin M.R., Alcantara M. R., Nunes A. P. et al. Effects of milk supplementation with
skim milk powder, whey protein concentrate and sodium caseinate on acidification
kinetics, rheological properties, and structure of nonfat stirred yogurt. L WT Food Science
and Technology 42: 1744-1750.
6. Darsanaki R., Miri M. 2013. Aflatoxin Ml Contamination in Dairy Products. Journal of
Science and Today's World 2.5: 500-514.
7. Durakovic L., Tudic A., Delas F., et al. 2012. Aflatoxin M, in raw milk contaminated
artificially. Mljekarstvo 62: 24-34.
8. Flores-Flores M., Lizarraga E., Cerain A., et al. 2015. Presence ofMycotoxins in animal
milk: a review. Food Control 53: 163-176.
9. Ilie L. l. 2013. Aflatoxins-a real danger to public health. Lucrari Stiintifice Medicina
Veterinara 46:79-82.
15

10. Ketney 0., Ovidiu T., Tifrea A.2014. Structural Diversity and Biochemical and
Microbiological Characteristics of Atlatoxins. Acta Universitatis Cibiniensis Series E:
Food Technology 18.2: 1-18.
11. Khlangwiset P., Wu F. 2010. Costs and efficacy of public healtb interventions to reduce
atlatoxin-induced human disease. Food Addit Contam 27.7: 998-1014.
12. Lizarraga-Paulin E., Moreno-Maitinez E., Miranda-Castro S. 2011. Aflatoxins and Their
Impact on Human and Animal Health: An Emerging Problem. Aflatoxins - Biochemistry
and Molecular Biology, Dr. Ramon G. Guevara-Gonzalez (Ed.), 255-282.
13. Mohammadi H. 2011. A Review of Aflatoxin MI, Milk, and Milk Products, Aflatoxins -
Biochemistry and Molecular Biology, Dr. Ramon G. Guevara-Gonzalez (Ed.), 397-414.
14. Natale Di. F., Gallo M., Nigro R. 2009. Adsorbents selection for aflatoxins removal in
bovine milks. J Food Eng 95.1: 189-191.
15. Quieroz 0. C. M., Han J. H., Staples C. R., et al. 2012.Effect of adding a mycotoxin
sequestering agent on milk atlatoxin M 1 concentration and the performance and immune
response of dairy cattle fed an atlatoxin B 1-contamintated diet. Dairy Sci 95:5901-5908.
16. Rajan A., Ismail P. 1995. An Economic Appraisal of Aflatoxin Contamination in Dairy
Cattle Feed. Journal of Veterinary and Animal Sciences 26: 105-112.
17. Robens J., Cardwell K. 2003. The Costs of Mycotoxin Management to the USA:
Management of Aflatoxins in the United States. Journal of Toxicology 22.2-3: 139-152.
18. Roy D. 2013. Aflatoxins: Finding Solutions for Improved Food Safety, Trade Impacts of
Aflatoxin Standards. Focus 20 Brief 12: 1-2.
16

19. Sandra S., Dalgleish D. G. 2005. Effects of ultra-high pressure homogenization and
heating on structural properties of casein micelles in reconstituted skim milk powder.
International Dairy Journal 15: 1095-1104.
20. Talebi E., Khademi M., Rastad A. 2011. An Over Review on Effect of Aflatoxin in
Animal Husbandry. The Bioscan 6.4: 529-531.
21. Unnevehr L., Grace D. 2013. Aflatoxins: Finding Solutions for Improved Food Safety.
Focus 20: 1-62.
22. Wu F. 2013. Aflatoxins: Finding Solutions for Improved Food Safety, Cost-Effectiveness
of Interventions to Reduce Aflatoxin Risk. Focus 20 Brief 11: 1-2.
23. Wu F., Liu Y., Bhatnagar D. 2008. Cost-Effectiveness of Aflatoxin Control Methods:
Economic Incentives. Toxin Rev 27: 203-225.
24. Zhang K., Wong J. W., Hayward D. G., et al. 2013. Determination of Mycotoxins in
Milk-Based Products and Infant Formula using Stable Isotope Dilution Assay and Liquid
Chromatography in Tandem Mass Spectrometry. J Agric Food Chem 61: 6265-6273.
17