removal of nutrients and organic pollutants from household
TRANSCRIPT

ORIGINAL RESEARCH
Removal of nutrients and organic pollutants from householdgreywater by phycoremediation for safe disposal
R. M. Mohamed1 • A. A. Al-Gheethi1 • S. S. Aznin1 • A. H. Hasila1 •
A. A. Wurochekke1 • A. H. Kassim1
Received: 11 October 2016 /Accepted: 27 April 2017 / Published online: 3 May 2017
� The Author(s) 2017. This article is an open access publication
Abstract The present study aimed to investigate the
potential for application of phycoremediation system using
Botryococcus sp. for the treatment of bathroom greywater
at village houses. The greywater samples were obtained
from four houses. The treatment system was conducted at
ambient temperature for 21 days. Botryococcus sp. (Ac-
cession No. JQ585723.1) was inoculated into the greywater
in a dry mass (0.3 mg L-1). The results revealed high
effectiveness of the treatment system. The maximum
reduction of biological oxygen demand (BOD5) from four
types of greywater ranged from 85.3 to 98%, while was
between 71.22 and 85.47% for chemical oxygen demand
(COD) after 21 days. The reduction of nitrate (NO3-)
appeared rapidly within 18 days of the treatment period
with 98% of the reduction efficiency. Reduction of
ammonia (NH3) and orthophosphate (PO43-) was recorded
after 21 days with the efficiency ranged from 86.21 to 99
and 39.12 to 99.3%, respectively. The high removal per-
centage of potassium (K) (97%) recorded within 3 days,
while calcium (Ca) reduction (95%) was noted at the end of
the treatment period indicating the high applicability of
phycoremediation system to be used in the village houses.
Moreover, the system is easily implementable, very low
cost where no energy is required, eco-friendly and has no
toxic by-products.
Keywords BOD5 � COD � Nutrients � Elements � Growthrate � Malaysia
Introduction
Greywater is the wastewater generated from household
activities such as bathing and washing. The discharge of
these wastes represents a major environmental issues due
to organic and inorganic components which have adverse
effects on the environment and water bodies including
eutrophication phenomenon [1]. In the large cities of the
developing countries such as Malaysia with high popula-
tions, the greywater are discharged with the black water
through the sewerage network into the central wastewater
treatment plants and then subjected for the treatment pro-
cess. In the contrast, in the rural area the greywater is
discharged separately into the river water. This step is
performed to reduce the quantity of sewage which is dis-
charged into the individual septic tank (IST) due to the
absence of a central wastewater treatment plant. However,
these practices became unacceptable in the recent years due
to the decrease in the level of rains which play an important
role in the dilution of greywater [2, 3].
Unlike arid and semi-arid countries in Middle East and
Africa which have water shortage problems, Malaysia has
several water resources including seas, lakes, rivers and
groundwater. However, the rapid growing population and
urbanization in the country since 2000s have increased the
pollution levels of the natural water resources. There are
more than 17,633 water pollution point sources revealed in
Malaysia. About 41% of water resources in Malaysia
contain high concentrations of total suspended solid (TSS)
and biochemical oxygen demand (BOD5) than that rec-
ommended by EQA 1974 regulations. Hence, a crucial step
& R. M. Mohamed
& A. A. Al-Gheethi
1 Micro-Pollution Research Centre (MPRC), Department of
Water and Environmental Engineering, Faculty of Civil and
Environmental Engineering, Universiti Tun Hussein Onn
Malaysia, Parit Raja, 86400 Batu Pahat, Johor, Malaysia
123
Int J Energy Environ Eng (2017) 8:259–272
DOI 10.1007/s40095-017-0236-6

has to be taken in Malaysia to improve the water bodies
and then to become a fully developed nation by the year
2020. Malaysia has been adopted a practical, economical
and acceptable approach in managing and disposing sew-
age treated effluents since 1970s. There are two standards
for treatment of sewage effluents: EQA1974, Regulation
2009 (Sewage) which are Standard A and Standard B
(DOE 2010). However, the national guideline for grey-
water has not yet regulated [4].
Among 28 million of population equivalent (PE) in
Malaysia, about 9 million people (33%) standing in the
villages. Therefore, the huge quantities of the greywater are
generated from these villages. Moreover, there is no plan to
build wastewater treatment plants at rural area in Malaysia.
For this reason, the peoples used individual septic tanks as
a primary treatment process of sewage. It is estimated that
there are over 1 million individual septic tanks in Malaysia
[5]. In contrast, the greywater are disposed to the river
waters without treatment which increase the natural water
bodies’ pollution. Therefore, the village houses with the
absence of public treatment must depend on treatment
process to treat their greywater before the discharge into
the environment. The presence of a small treatment system
of greywater prior to discharge into the main drain with
high efficiency and low cost might reduce the pollutants in
the greywater [3].
The efficiency of phycoremediation using different
microalgae species as a treatment technology for several
types of wastewater such as greenhouse, brewery and dairy
wastewater has been reported in the literature. It has been
occurred high effectiveness to enhance the quality of
wastewater because they have overgrowth in these wastes
[6]. The main consideration in the phycoremediation pro-
cess is to use indigenous strains which have the ability to
survive and compete with other indigenous microorgan-
isms in the greywater such as bacteria. Botryococcus
braunii, Scenedesmus dimorphus, Spirulina sp., Chlorella
vulgaris and Phormidium sp., have high effectiveness
because they have the ability to tolerate hard environmental
conditions [7]. One of the effective techniques to improve
the phycoremediation efficiency is using starved microal-
gae, in which the activated algae is obtained from the
sludge thickness stage where hyper-concentrated algal
cultures are available, and then subject to the starvation
process by the drying at room temperature. Utilization of
microalgae which have already adapted to hard environ-
mental conditions might improve the phycoremediation
process to be more effective, even during colder periods
[8]. Besides, the starvation process induces the microalgae
to produce the resting cysts due to the deficiency in the
nutrients and has high potential to survive in a dormant
state in unfavorable conditions for long period [9]. These
cells grow rapidly after the inoculation into the greywater
with high nutrients and then accelerate the nutrients
removal within a very short period of time. Moreover, this
method is a good option to decrease the land and space
requirements; thus, the phycoremediation process was
performed in an individual tank for each house and this is
to emphasize the novelty of the present study.
The current work aimed to design a phycoremediation
system of greywater to be applied for each individual vil-
lage house. The potential of starved Botryococcus sp.
inoculated into the system tank to improve the parameters
of greywater before the discharge into the environment was
investigated. These parameters included BOD, COD,
nutrients (total nitrogen and total phosphorus) as well as
elements.
Materials and methods
Study area
The present study was focused on a village located at Parit
Raja (20 km from Batu Pahat, Johor Malaysia) because the
discharge of greywater into the main ditch is common
practice among the village community. These practices
increase the spreading infectious agents and provide a
breeding environment for insect pests [3, 4].
Estimation of raw greywater quantity
The gathering information which including the occupants
number and age as well as the households activities of four
houses were collected during the interview and a using
survey data form. These houses belong to families with
eight adults, four children and two babies. The quantity of
greywater generated from village houses was estimated
using bucket method as described by Mohamed et al. [3].
The quantities of greywater were estimated in the period
between November and December 2015 and within 24 h,
7 am to 12 pm, 12 pm to 6 pm, and from 6 pm to 7 am.
The time selected represents the peak bathing period and
ensures that the collected samples reflect the actual con-
stitutes of the greywater.
Greywater sampling
Plastic bottle polyethylene terephthalate (PET) bottles
(5 L) were used for the collection of greywater samples
(5 L). The samples were collected from the discharge point
of greywater at each house. The mouth of the tap was
disinfected with cotton wool soaked in ethanol to prevent
the contamination. The tap was allowed to run for few
minutes; the container was rinsed three times with grey-
water before collection of the final sample. The samples
260 Int J Energy Environ Eng (2017) 8:259–272
123

were kept in an ice box while transporting to wastewater
laboratory at Universiti Tun Hussain Onn Malaysia
(UTHM). The preservation of greywater samples was
carried out according to APHA [10].
Microalgae strain
An indigenous strain of Botryococcus sp. (Accession No.
JQ585723.1) was obtained from freshwater. It was
identified using molecular analysis based on the 18S
rRNA sequencing (Table 1). A pure culture of Botry-
ococcus sp. was sub-cultured on Bold Basal medium and
then sent to Axil Scientific Pte Ltd. for the identification
purpose. Botryococcus sp. was acclimatized to grow in
greywater by sub-culture in greywater and incubation for
1 month. This step was repeated three times; the
occurrence of overgrowth during the third subculture
indicates the ability of microalgae to grow in these
waters. Thereafter, Botryococcus sp. was subjected for
starvation process. In this experiment, pure culture of
Botryococcus sp. was sub-cultured in greywater medium
and then incubated at 25–29 �C for 1 month (12 h L:
12 h D period) [11]. The microalgae cells were har-
vested from the medium using centrifugation process
(4020 rcf), washed three times with sterilized deionized
water to remove the media residues. The microalgae
cells were placed in a sterilized glass bottle and left at
room temperature for 1 month. The ability of microalgae
to survivability during the starvation process (every
10 days) was tested by culture-based method; a loopful
of the microalgae biomass was subcultured into a Bold
Basal broth medium to observe the growth. To prepare
the microalgae inoculum, 1 mg of microalgae cells was
suspended in 10 mL of sterilized normal saline water,
then a fixed volume of (1 mL) the suspension was taken
for counting using haemocytometer as described by
APHA [10]. The weight of microalgae cells used as
inoculum (0.3 g L-1) was calculated to be equivalent to
106 cell mL-1.
Experimental set up
Factorial complete randomized design (CRD) (5 �8� 9)
in triplicate was used to study the efficiency of photo-re-
actor design here with Botryococcus sp. for improvement
of greywater characteristics, where: four photoreactor tanks
(one for each house), and one (1) control for the phy-
coremediation process making a total of five groups. Eight
interval periods (0, 3, 6, 9, 12, 15, 18 and 21) and nine
dependent variables including pH, BOD5, COD, NO3-,
PO43-, NH2, Na, Ca and K ions were tested after each
interval period and for each phycoremediation Tank.
Phycoremediation system operation
The phycoremediation treatment system used in the current
study was designed for laboratory scale (Fig. 1). The sys-
tem consisted of three tanks (5 L of each) including storage
tank, control tank (Tank I) and phycoremediation tank
(Tank II). Storage and control tanks were made up of
opaque PVC to prevent the photo-degradation of nutrients,
while tank II was made up of transparent PCV to allow
light to penetrate through the greywater and induce the
microalgae growth. The storage tank was used to com-
posite and storage of the samples collected in the morning
and evening as well as to clarify the greywater by natural
sedimentation of insoluble solid materials. The storage tank
was connected to tank (I) via a PVC pipe (3 mm of
diameter) with water valve fixed on 5 cm of the tank sur-
face. The greywater generated from the house was passed
through the membrane filter to remove the suspended
solids and stored in the storage tank and lastly to the tank I
and tank II with 20 mL min-1 of flowrate. Moreover, no
sterilization process was conducted for the greywater to
Table 1 Accession number of Botryococcus sp.
Description Max
score
Total
score
Query
cover
(%)
E
value
Ident
(%)
Accession
Botryococcus sp. AP101 18S ribosomal RNA gene, partial sequence 985 985 45 0.0 92 JQ585723.1
Botryococcus braunii strain KMRR 18S ribosomal RNA gene, partial sequence 981 981 45 0.0 92 KU678200.1
Botryococcus braunii strain AICB 53 18S ribosomal RNA gene, partial sequence;
internal transcribed spacer 1, 5.8S ribosomal RNA gene, and internal transcribed
spacer 2, complete sequence; and 28S ribosomal RNA gene, partial sequence
957 1606 81 0.0 91 JF261250.2
Botryococcus braunii genomic DNA containing 18S rRNA gene, ITS1, 5.8S rRNA
gene, ITS2, culture collection CCAP 807/2
957 1642 82 0.0 91 FR865761.1
Botryococcus sp. Tow 9/21 P-16w 18S ribosomal RNA gene, partial sequence 957 1664 83 0.0 91 AY197640.1
Botryococcus braunii strain AICB 859 18S ribosomal RNA gene, partial sequence;
internal transcribed spacer 1, 5.8S ribosomal RNA gene, and internal transcribed
spacer 2, complete sequence; and 28S ribosomal RNA gene, partial sequence
952 1592 81 0.0 90 JF261269.2
Int J Energy Environ Eng (2017) 8:259–272 261
123

test the efficiency of phycoremediation process when it be
applied onsite. After installing the treatment system, the
water valve fixed on tank (I) was opened to fill up tank (II)
with 4 L of greywater. The tank was inoculated with fixed
weight of Botryococcus sp. cells (0.3 g L-1) (equivalent to
106 cell mL-1). The tank was covered with loose woven
cloths (cheesecloth) to prevent outside contamination. Air
pump was used to provide air required to improve the
microalgae growth as well as to prevent the sedimentation
process of the microalgae biomass generated during the
phycoremediation process. The control tank was conducted
without Botryococcus sp. inoculation. The phycoremedia-
tion process was performed at ambient temperature and
sunlight for 21 days with 18 MJ m-2 day-1 of solar
intensity according to the Malaysian Meteorological
Department (MMD) and Ministry of Science, Technology
and Innovation (MOSTI). The characteristics of raw
greywater and that generated from the control and phy-
coremediation tank were determined for each length of the
phycoremediation period (0, 3, 6, 9, 12, 15, 18 and
21 days) as described below. Botryococcus sp. growth
during the phycoremediation process was tested daily in
comparison to the growth in Bold Basal broth medium.
Analytical methods
The tested parameters of greywater which included total
suspended solid (TSS), chemical oxygen demand (COD),
biochemical oxygen demand (BOD5), turbidity, pH val-
ues, nitrate (NO3-), orthophosphate (PO4
3-), ammonia
(NH2-), sodium (Na), calcium (Ca) and potassium
(K) were determined according to APHA [10]. pH value
was measured by pH meter (Hach 51750-60 Sension 3);
COD was by using closed reflux method (method 8000;
HACH DR 6000); BOD was determined by 5-day incu-
bation test at 20 �C; TSS was estimated by the photo-
metric method (method 430, HACH DR6000), Turbidity
was determined by Attenuated Radiation Method (Direct
Reading) (HACH 2100N Turbidi meter); Na, Ca and K
metals were determined using Atomic Absorption Spec-
trometer (Perkin Elmer Analyst 800). Nutrients including
nitrate (NO3-), phosphorus (PO4
3-), ammonia (NH2-)
were determined using ion chromatography system (IC)
(ICS-2000).
The comparison between greywater parameters before
and after the phycoremediation process was carried out to
determine the percentage removal pollutant and water
quality standards before the discharge to the main channel
or river nearby. The result of analysis data was compared
to EQA 1974, Regulations 2009.
The parameters removal efficiency by Botryococcus sp.
during phycoremediation period were calculated using
Eq. (1) according to Larsdotter et al. [12].
Removal percentage ð% Þ ¼ N0 � Nið ÞN0
� 100% , ð1Þ
Fig. 1 Scheme of the photo-reactor system; Tank I (Control); Tank II (inoculated with Botryococcus sp.)
262 Int J Energy Environ Eng (2017) 8:259–272
123
where N0 is the constituent amount at the initial experi-
ment; Ni is the constituent amount at the desired time.
The significant differences among the removal effi-
ciencies were analyzed using one-way analysis of variance
(ANOVA, P\ 0.05) (SPSS Inc.).
Results and discussion
Quantity of greywater from village houses
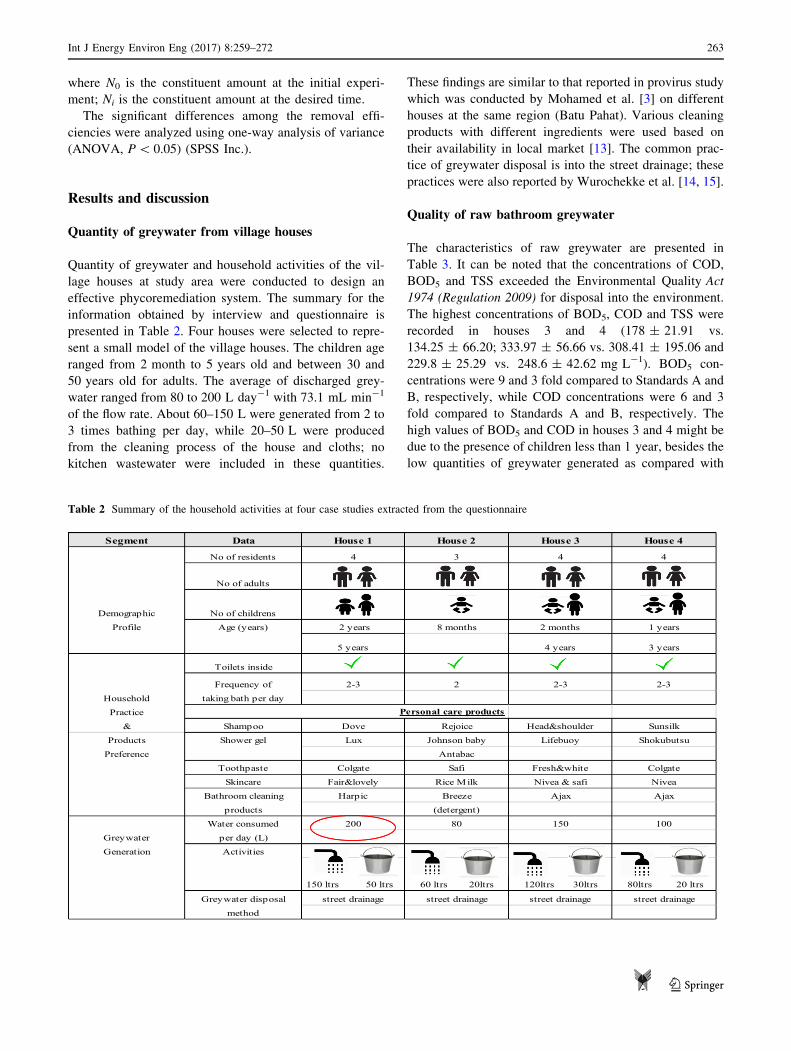
Quantity of greywater and household activities of the vil-
lage houses at study area were conducted to design an
effective phycoremediation system. The summary for the
information obtained by interview and questionnaire is
presented in Table 2. Four houses were selected to repre-
sent a small model of the village houses. The children age
ranged from 2 month to 5 years old and between 30 and
50 years old for adults. The average of discharged grey-
water ranged from 80 to 200 L day-1 with 73.1 mL min-1
of the flow rate. About 60–150 L were generated from 2 to
3 times bathing per day, while 20–50 L were produced
from the cleaning process of the house and cloths; no
kitchen wastewater were included in these quantities.
These findings are similar to that reported in provirus study
which was conducted by Mohamed et al. [3] on different
houses at the same region (Batu Pahat). Various cleaning
products with different ingredients were used based on
their availability in local market [13]. The common prac-
tice of greywater disposal is into the street drainage; these
practices were also reported by Wurochekke et al. [14, 15].
Quality of raw bathroom greywater
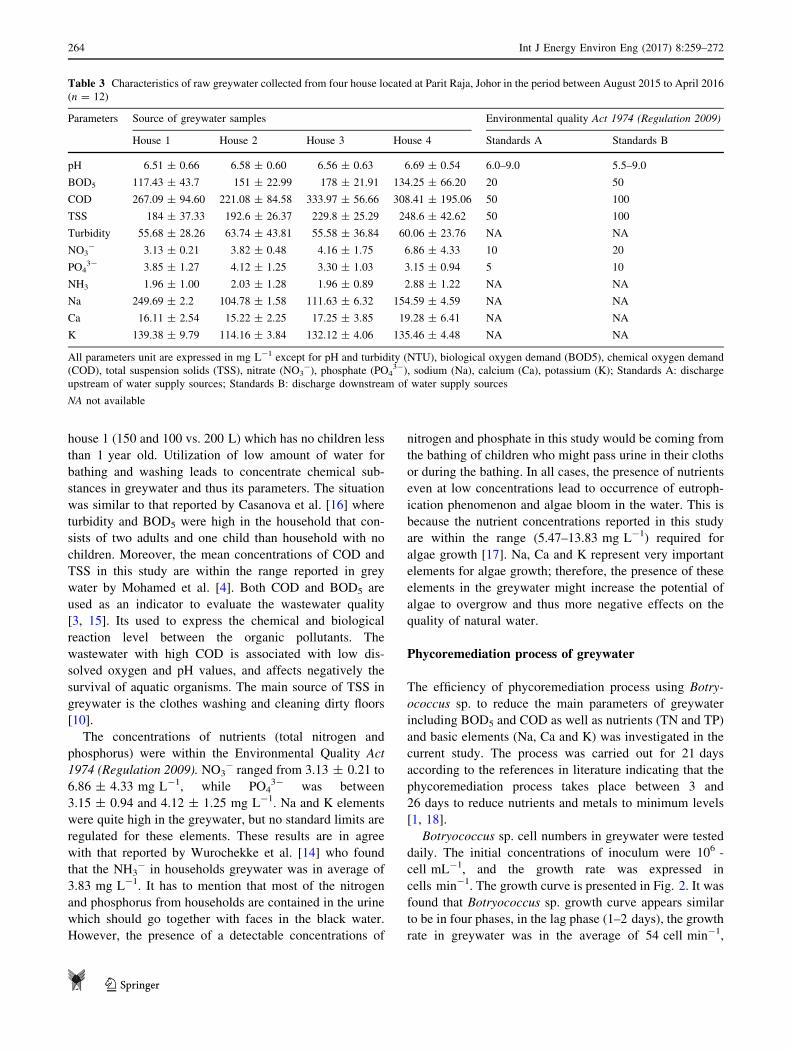
The characteristics of raw greywater are presented in
Table 3. It can be noted that the concentrations of COD,
BOD5 and TSS exceeded the Environmental Quality Act
1974 (Regulation 2009) for disposal into the environment.
The highest concentrations of BOD5, COD and TSS were
recorded in houses 3 and 4 (178 ± 21.91 vs.
134.25 ± 66.20; 333.97 ± 56.66 vs. 308.41 ± 195.06 and
229.8 ± 25.29 vs. 248.6 ± 42.62 mg L-1). BOD5 con-
centrations were 9 and 3 fold compared to Standards A and
B, respectively, while COD concentrations were 6 and 3
fold compared to Standards A and B, respectively. The
high values of BOD5 and COD in houses 3 and 4 might be
due to the presence of children less than 1 year, besides the
low quantities of greywater generated as compared with
Table 2 Summary of the household activities at four case studies extracted from the questionnaire
Segment Data House 1 House 2 House 3 House 4
No of residents 4 3 4 4
No of adults
Demographic No of childrens
Profile Age (years) 2 years 8 months 2 months 1 years
5 years 4 years 3 years
Toilets inside
Frequency of 2-3 2 2-3 2-3
Household taking bath per day
Practice Personal care products
& Shampoo Dove Rejoice Head&shoulder Sunsilk
Products Shower gel Lux Johnson baby Lifebuoy Shokubutsu
Preference Antabac
Toothpaste Colgate Safi Fresh&white Colgate
Skincare Fair&lovely Rice Milk Nivea & safi Nivea
Bathroom cleaning Harpic Breeze Ajax Ajax
products (detergent)
Water consumed 200 80 150 100
Greywater per day (L)
Generation Activities
150 ltrs 50 ltrs 60 ltrs 20ltrs 120ltrs 30ltrs 80ltrs 20 ltrs
Greywater disposal street drainage street drainage street drainage street drainage
method
Int J Energy Environ Eng (2017) 8:259–272 263
123
house 1 (150 and 100 vs. 200 L) which has no children less
than 1 year old. Utilization of low amount of water for
bathing and washing leads to concentrate chemical sub-
stances in greywater and thus its parameters. The situation
was similar to that reported by Casanova et al. [16] where
turbidity and BOD5 were high in the household that con-
sists of two adults and one child than household with no
children. Moreover, the mean concentrations of COD and
TSS in this study are within the range reported in grey
water by Mohamed et al. [4]. Both COD and BOD5 are
used as an indicator to evaluate the wastewater quality
[3, 15]. Its used to express the chemical and biological
reaction level between the organic pollutants. The
wastewater with high COD is associated with low dis-
solved oxygen and pH values, and affects negatively the
survival of aquatic organisms. The main source of TSS in
greywater is the clothes washing and cleaning dirty floors
[10].
The concentrations of nutrients (total nitrogen and
phosphorus) were within the Environmental Quality Act
1974 (Regulation 2009). NO3- ranged from 3.13 ± 0.21 to
6.86 ± 4.33 mg L-1, while PO43- was between
3.15 ± 0.94 and 4.12 ± 1.25 mg L-1. Na and K elements
were quite high in the greywater, but no standard limits are
regulated for these elements. These results are in agree
with that reported by Wurochekke et al. [14] who found
that the NH3- in households greywater was in average of
3.83 mg L-1. It has to mention that most of the nitrogen
and phosphorus from households are contained in the urine
which should go together with faces in the black water.
However, the presence of a detectable concentrations of
nitrogen and phosphate in this study would be coming from
the bathing of children who might pass urine in their cloths
or during the bathing. In all cases, the presence of nutrients
even at low concentrations lead to occurrence of eutroph-
ication phenomenon and algae bloom in the water. This is
because the nutrient concentrations reported in this study
are within the range (5.47–13.83 mg L-1) required for
algae growth [17]. Na, Ca and K represent very important
elements for algae growth; therefore, the presence of these
elements in the greywater might increase the potential of
algae to overgrow and thus more negative effects on the
quality of natural water.
Phycoremediation process of greywater
The efficiency of phycoremediation process using Botry-
ococcus sp. to reduce the main parameters of greywater
including BOD5 and COD as well as nutrients (TN and TP)
and basic elements (Na, Ca and K) was investigated in the
current study. The process was carried out for 21 days
according to the references in literature indicating that the
phycoremediation process takes place between 3 and
26 days to reduce nutrients and metals to minimum levels
[1, 18].
Botryococcus sp. cell numbers in greywater were tested
daily. The initial concentrations of inoculum were 106 -
cell mL-1, and the growth rate was expressed in
cells min-1. The growth curve is presented in Fig. 2. It was
found that Botryococcus sp. growth curve appears similar
to be in four phases, in the lag phase (1–2 days), the growth
rate in greywater was in the average of 54 cell min-1,
Table 3 Characteristics of raw greywater collected from four house located at Parit Raja, Johor in the period between August 2015 to April 2016
(n = 12)
Parameters Source of greywater samples Environmental quality Act 1974 (Regulation 2009)
House 1 House 2 House 3 House 4 Standards A Standards B
pH 6.51 ± 0.66 6.58 ± 0.60 6.56 ± 0.63 6.69 ± 0.54 6.0–9.0 5.5–9.0
BOD5 117.43 ± 43.7 151 ± 22.99 178 ± 21.91 134.25 ± 66.20 20 50
COD 267.09 ± 94.60 221.08 ± 84.58 333.97 ± 56.66 308.41 ± 195.06 50 100
TSS 184 ± 37.33 192.6 ± 26.37 229.8 ± 25.29 248.6 ± 42.62 50 100
Turbidity 55.68 ± 28.26 63.74 ± 43.81 55.58 ± 36.84 60.06 ± 23.76 NA NA
NO3- 3.13 ± 0.21 3.82 ± 0.48 4.16 ± 1.75 6.86 ± 4.33 10 20
PO43- 3.85 ± 1.27 4.12 ± 1.25 3.30 ± 1.03 3.15 ± 0.94 5 10
NH3 1.96 ± 1.00 2.03 ± 1.28 1.96 ± 0.89 2.88 ± 1.22 NA NA
Na 249.69 ± 2.2 104.78 ± 1.58 111.63 ± 6.32 154.59 ± 4.59 NA NA
Ca 16.11 ± 2.54 15.22 ± 2.25 17.25 ± 3.85 19.28 ± 6.41 NA NA
K 139.38 ± 9.79 114.16 ± 3.84 132.12 ± 4.06 135.46 ± 4.48 NA NA
All parameters unit are expressed in mg L-1 except for pH and turbidity (NTU), biological oxygen demand (BOD5), chemical oxygen demand
(COD), total suspension solids (TSS), nitrate (NO3-), phosphate (PO4
3-), sodium (Na), calcium (Ca), potassium (K); Standards A: discharge
upstream of water supply sources; Standards B: discharge downstream of water supply sources
NA not available
264 Int J Energy Environ Eng (2017) 8:259–272
123

while it was 27.1 cell min-1 in the control. These varia-
tions between the initial concentrations and after the
incubation for 2 days as well as between greywater med-
ium and BBM might be related to the adaption process.
Botryococcus sp. was acclimatized to grow in greywater;
therefore, the cell concentrations decreased slightly by only
10% compared to the initial concentrations. In the control,
the dropping was quite more; the decrease was 40%,
because BBM has different composition to the greywater.
Hence, microalgae need more time to acclimatize in this
medium.
The log phase started on 3rd day, and the growth rate
accelerated in the period between 6th and 9th day. The
highest growth rate of microalgae was recorded on 9th day
in greywater from house 1 (4236.1 cell min-1), house 2
(3263.9 cell min-1) and house 4 (4652.8 cell min-1),
while it was recorded on 10th day in greywater from house
3 (5486.1 cell min-1). Similar trend was observed for
microalgae in the control where the maximum growth rate
was 1388.89 cell min-1 on 9th and 10th day. A stationary
phase appeared clearly for microalgae growth in the control
medium in the period between 15th and 21st day, while it
was varied in the greywater. A semi-stationary phase was
noted between 12th and 15th day of greywater from houses
1 and 3. The minimum growth rate of Botryococcus sp. was
recorded on 21st day; the growth rate was 1736.1, 1388.9,
1527.8 and 1319.5 cell min-1 for greywater from houses 1,
2, 3 and 4, respectively. It might be due to the depletion in
the essential nutrient and increased the total mass of
microalgae which prevent the light penetration required for
photosynthesis process [19, 20].
Finally, the highest growth rate of Botryococcus sp.
during the phycoremediation process was noted in
greywater from house 3 followed by that obtained from
house 4. The minimum growth rate was noted in grey-
water from house 2. The explanations for these results
might be related to the concentrations of elements in the
greywater samples presented in Table 3, where the
greywater from house 2 recorded the lowest concen-
trations of Na, Ca and K. These findings indicate the
role of elements in microalgae growth induction [21].
However, microalgae need these macronutrients in low
concentrations and they were available in amounts
enough to induce the Botryococcus sp. growth. Hence,
the turbidity might be the more acceptable reason,
where the maximum turbidity was recorded in greywater
from house 2 and the quantity of greywater from this
house was the lowest (80 L day-1). The high turbidity
might limit the light penetration through the greywater
and thus reduce the photosynthesis level of the
microalgae. The light is one of the main factors
affecting microalgae growth because macroalgae cell
converts the light into energy via the photosynthesis
process and the microalgae cell has no mechanism to
store the light [1, 22].
Bathroom greywater pH was alkaline due to the use of
soaps and detergents and it increased significantly during
the phycoremediation process (Fig. 3). The maximum pH
value was recorded on 9th day; it ranged from 9 to 10.5 in
the greywater while it was 8.9 in the control. The increase
in pH value is in consistent with the growth rate of
Botryococcus sp. which recorded the maximum rate on 9
and 10th day. It has demonstrated before that the pH range
for most algal species is between 7 and 9. However, it has
to be indicated that the pH is not critical or it is an inde-
pendent factor that might be varied during the phycore-
mediation process depending on the availability of CO2,
H2CO3, and HCO3- [23]. Therefore, pH is a secondary
0
1000
2000
3000
4000
5000
6000
0 3 6 9 12 15 18 21 24
Gro
wth
rate
(cel
l/min
)
Phycoremedation period (days)
H1
H2
H3
H4
Control
Fig. 2 Botryococcus sp. growth
rate in the greywater during the
phycoremediation process by
using Botryococcus sp.
(0.3 g dry wt L-1). The
experiments were conducted in
5 L tank capacity under normal
environment conditions
(temperature: 25–29 �C, 12 h L:
12 h D period) for 21 days. The
control sample was carried out
using 1 L of Bold’s Basal
Medium (BBM) broth
Int J Energy Environ Eng (2017) 8:259–272 265
123
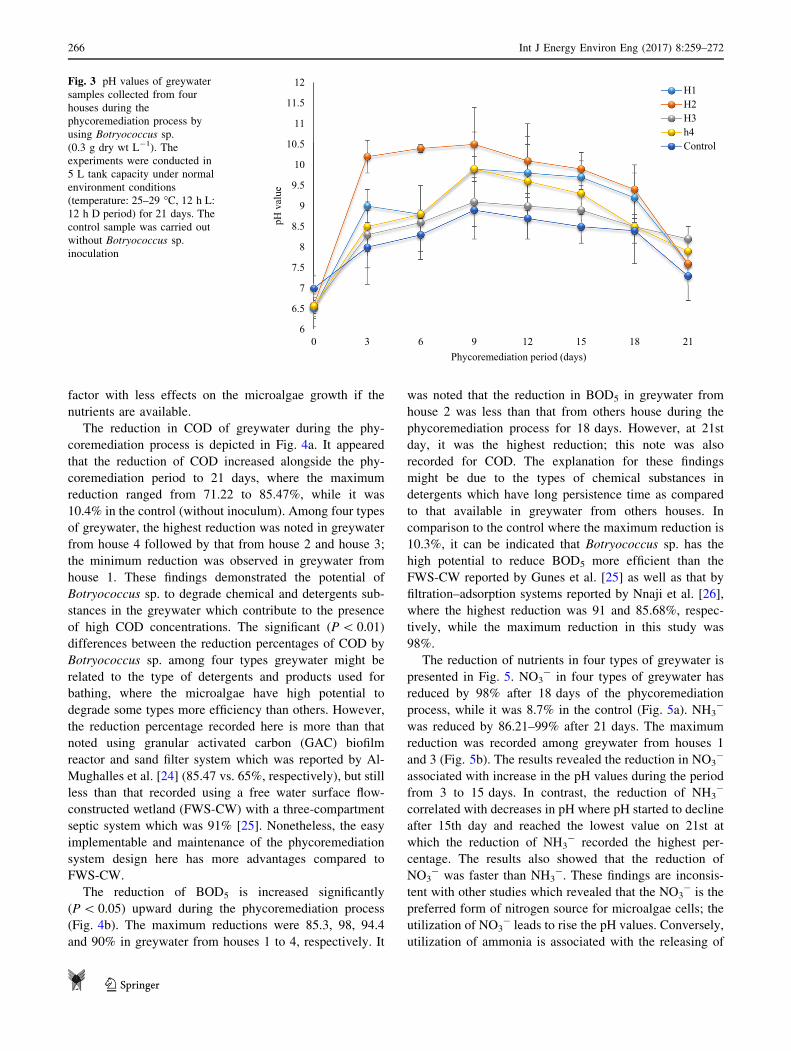
factor with less effects on the microalgae growth if the
nutrients are available.
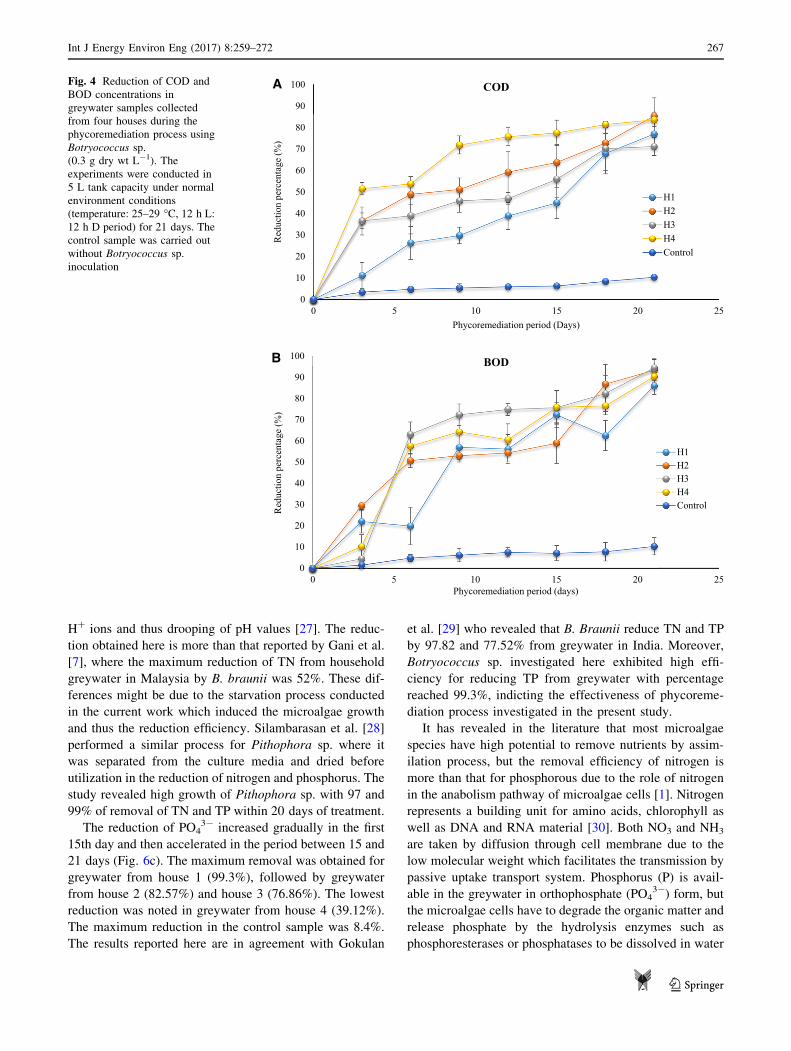
The reduction in COD of greywater during the phy-
coremediation process is depicted in Fig. 4a. It appeared
that the reduction of COD increased alongside the phy-
coremediation period to 21 days, where the maximum
reduction ranged from 71.22 to 85.47%, while it was
10.4% in the control (without inoculum). Among four types
of greywater, the highest reduction was noted in greywater
from house 4 followed by that from house 2 and house 3;
the minimum reduction was observed in greywater from
house 1. These findings demonstrated the potential of
Botryococcus sp. to degrade chemical and detergents sub-
stances in the greywater which contribute to the presence
of high COD concentrations. The significant (P\ 0.01)
differences between the reduction percentages of COD by
Botryococcus sp. among four types greywater might be
related to the type of detergents and products used for
bathing, where the microalgae have high potential to
degrade some types more efficiency than others. However,
the reduction percentage recorded here is more than that
noted using granular activated carbon (GAC) biofilm
reactor and sand filter system which was reported by Al-
Mughalles et al. [24] (85.47 vs. 65%, respectively), but still
less than that recorded using a free water surface flow-
constructed wetland (FWS-CW) with a three-compartment
septic system which was 91% [25]. Nonetheless, the easy
implementable and maintenance of the phycoremediation
system design here has more advantages compared to
FWS-CW.
The reduction of BOD5 is increased significantly
(P\ 0.05) upward during the phycoremediation process
(Fig. 4b). The maximum reductions were 85.3, 98, 94.4
and 90% in greywater from houses 1 to 4, respectively. It
was noted that the reduction in BOD5 in greywater from
house 2 was less than that from others house during the
phycoremediation process for 18 days. However, at 21st
day, it was the highest reduction; this note was also
recorded for COD. The explanation for these findings
might be due to the types of chemical substances in
detergents which have long persistence time as compared
to that available in greywater from others houses. In
comparison to the control where the maximum reduction is
10.3%, it can be indicated that Botryococcus sp. has the
high potential to reduce BOD5 more efficient than the
FWS-CW reported by Gunes et al. [25] as well as that by
filtration–adsorption systems reported by Nnaji et al. [26],
where the highest reduction was 91 and 85.68%, respec-
tively, while the maximum reduction in this study was
98%.
The reduction of nutrients in four types of greywater is
presented in Fig. 5. NO3- in four types of greywater has
reduced by 98% after 18 days of the phycoremediation
process, while it was 8.7% in the control (Fig. 5a). NH3-
was reduced by 86.21–99% after 21 days. The maximum
reduction was recorded among greywater from houses 1
and 3 (Fig. 5b). The results revealed the reduction in NO3-
associated with increase in the pH values during the period
from 3 to 15 days. In contrast, the reduction of NH3-
correlated with decreases in pH where pH started to decline
after 15th day and reached the lowest value on 21st at
which the reduction of NH3- recorded the highest per-
centage. The results also showed that the reduction of
NO3- was faster than NH3
-. These findings are inconsis-
tent with other studies which revealed that the NO3- is the
preferred form of nitrogen source for microalgae cells; the
utilization of NO3- leads to rise the pH values. Conversely,
utilization of ammonia is associated with the releasing of
6
6.5
7
7.5
8
8.5
9
9.5
10
10.5
11
11.5
12
0 3 6 9 12 15 18 21
pH v
alue
Phycoremediation period (days)
H1H2H3h4Control
Fig. 3 pH values of greywater
samples collected from four
houses during the
phycoremediation process by
using Botryococcus sp.
(0.3 g dry wt L-1). The
experiments were conducted in
5 L tank capacity under normal
environment conditions
(temperature: 25–29 �C, 12 h L:
12 h D period) for 21 days. The
control sample was carried out
without Botryococcus sp.
inoculation
266 Int J Energy Environ Eng (2017) 8:259–272
123
H? ions and thus drooping of pH values [27]. The reduc-
tion obtained here is more than that reported by Gani et al.
[7], where the maximum reduction of TN from household
greywater in Malaysia by B. braunii was 52%. These dif-
ferences might be due to the starvation process conducted
in the current work which induced the microalgae growth
and thus the reduction efficiency. Silambarasan et al. [28]
performed a similar process for Pithophora sp. where it
was separated from the culture media and dried before
utilization in the reduction of nitrogen and phosphorus. The
study revealed high growth of Pithophora sp. with 97 and
99% of removal of TN and TP within 20 days of treatment.
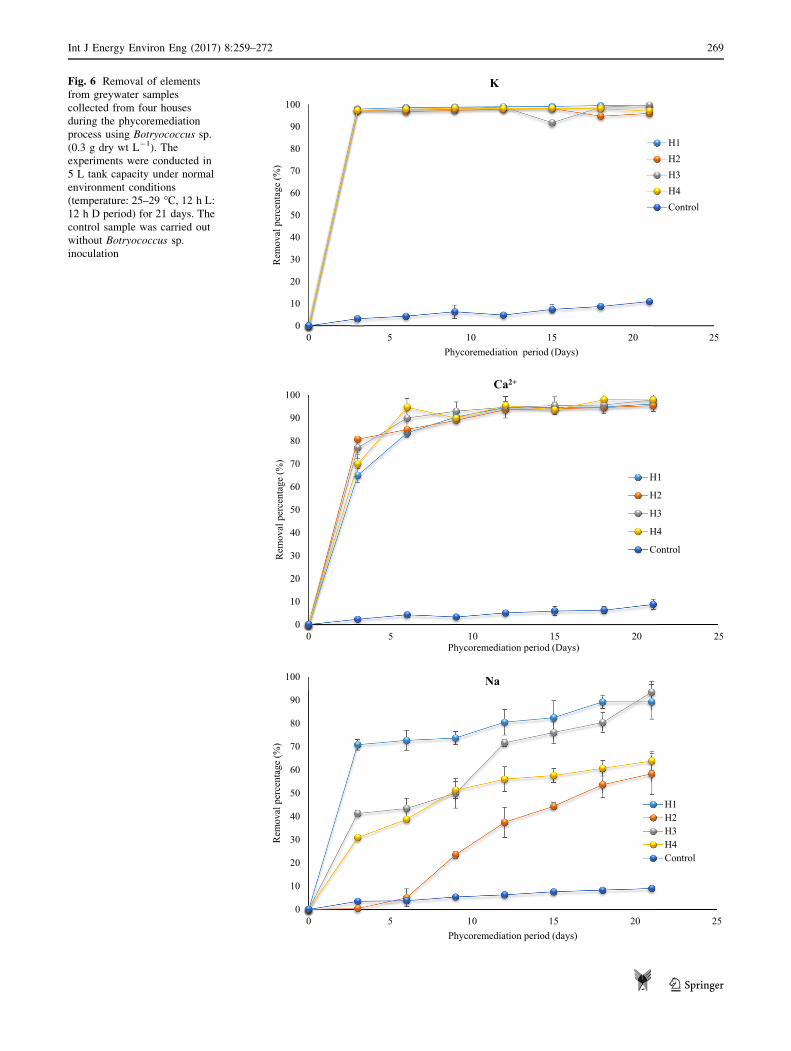
The reduction of PO43- increased gradually in the first
15th day and then accelerated in the period between 15 and
21 days (Fig. 6c). The maximum removal was obtained for
greywater from house 1 (99.3%), followed by greywater
from house 2 (82.57%) and house 3 (76.86%). The lowest
reduction was noted in greywater from house 4 (39.12%).
The maximum reduction in the control sample was 8.4%.
The results reported here are in agreement with Gokulan
et al. [29] who revealed that B. Braunii reduce TN and TP
by 97.82 and 77.52% from greywater in India. Moreover,
Botryococcus sp. investigated here exhibited high effi-
ciency for reducing TP from greywater with percentage
reached 99.3%, indicting the effectiveness of phycoreme-
diation process investigated in the present study.
It has revealed in the literature that most microalgae
species have high potential to remove nutrients by assim-
ilation process, but the removal efficiency of nitrogen is
more than that for phosphorous due to the role of nitrogen
in the anabolism pathway of microalgae cells [1]. Nitrogen
represents a building unit for amino acids, chlorophyll as
well as DNA and RNA material [30]. Both NO3 and NH3
are taken by diffusion through cell membrane due to the
low molecular weight which facilitates the transmission by
passive uptake transport system. Phosphorus (P) is avail-
able in the greywater in orthophosphate (PO43-) form, but
the microalgae cells have to degrade the organic matter and
release phosphate by the hydrolysis enzymes such as
phosphoresterases or phosphatases to be dissolved in water
0
10
20
30
40
50
60
70
80
90
100
0 5 10 15 20 25
Red
uctio
n pe
rcen
tage
(%)
Phycoremediation period (Days)
COD
H1H2H3H4Control
0
10
20
30
40
50
60
70
80
90
100
0 5 10 15 20 25
Red
uctio
n pe
rcen
tage
(%)
Phycoremediation period (days)
BOD
H1H2H3H4Control
A
B
Fig. 4 Reduction of COD and
BOD concentrations in
greywater samples collected
from four houses during the
phycoremediation process using
Botryococcus sp.
(0.3 g dry wt L-1). The
experiments were conducted in
5 L tank capacity under normal
environment conditions
(temperature: 25–29 �C, 12 h L:
12 h D period) for 21 days. The
control sample was carried out
without Botryococcus sp.
inoculation
Int J Energy Environ Eng (2017) 8:259–272 267
123

0
10
20
30
40
50
60
70
80
90
100
0 5 10 15 20 25
Red
uctio
n pe
rcen
tage
(%)
Phycoremediation period (days)
NO3-
H1
H2
H3
H4
0
10
20
30
40
50
60
70
80
90
100
0 5 10 15 20 25
Red
uctio
n pe
rcen
tage
(%)
Phycoremediation period (days)
NH3-
H1H2H3H4Control
Control
0
10
20
30
40
50
60
70
80
90
100
0 5 10 15 20 25
Red
uctio
n pe
rcen
tage
(%)
Phycoremediation period (Days)
PO43ˉ
H1H2H3H4Control
Fig. 5 Reduction of nutrients
concentrations in greywater
samples collected from four
houses during the
phycoremediation process using
Botryococcus sp.
(0.3 g dry wt L-1). The
experiments were conducted in
5 L tank capacity under normal
environment conditions
(temperature: 25–29 �C, 12 h L:
12 h D period) for 21 days. The
control sample was carried out
without Botryococcus sp.
inoculation
268 Int J Energy Environ Eng (2017) 8:259–272
123
0
10
20
30
40
50
60
70
80
90
100
0 5 10 15 20 25
Rem
oval
per
cent
age
(%)
Phycoremediation period (Days)
K
H1H2H3H4Control
0
10
20
30
40
50
60
70
80
90
100
0 5 10 15 20 25
Rem
oval
per
cent
age
(%)
Phycoremediation period (Days)
Ca2+
H1
H2
H3
H4
Control
0
10
20
30
40
50
60
70
80
90
100
0 5 10 15 20 25
Rem
oval
per
cent
age
(%)
Phycoremediation period (days)
Na
H1H2H3H4Control
Fig. 6 Removal of elements
from greywater samples
collected from four houses
during the phycoremediation
process using Botryococcus sp.
(0.3 g dry wt L-1). The
experiments were conducted in
5 L tank capacity under normal
environment conditions
(temperature: 25–29 �C, 12 h L:
12 h D period) for 21 days. The
control sample was carried out
without Botryococcus sp.
inoculation
Int J Energy Environ Eng (2017) 8:259–272 269
123

and the uptake by the cells via assimilation process [22].
The low reduction of PO43- from greywater of house 4
might be due to the structure of chemical substance in the
detergents and soaps which have more persistence to the
degradation process as mentioned above.
Botryococcus sp. exhibited high efficiency for removal
of elements; it has removed more than 97% of K for four
types of greywater within 3 days of the phycoremediation
period (Fig. 6a). Ca was also removed rapidly, where more
than 95% of the removal from different greywater was
recorded on 12th day. In contrast, the removal of Na from
greywater increased gradually and differed significantly
(P\ 0.05) among the greywater samples from different
houses (Fig. 6c). The maximum removal was noted on 21st
day where 93.47, 89.31, 63.89 and 58.32% were removed
from greywater of houses 3, 1, 4 and 2, respectively. The
maximum removal of K, Ca and N from control sample
was less than 10%. The ability of microalgae to accumulate
different types of metals ions has been reported in the lit-
erature and explained due to the presence of functional
groups on the cell wall and cell membrane of microalgae
cells which react with metal ions to form complex com-
pounds [31]. Microalgae cells removed metal ions by
chemisorption, surface precipitation, ion exchange, and
covalent bonding [32]. The metal ions could be also dif-
fused through the cell membrane via passive transport
system where they play important roles in the metabolic
and anabolic pathways of the microalgae cells.
The reduction of the greywater by Botryococcus sp. used
in the present study is more than that reported in the lit-
erature. Gani et al. [7] revealed that B. braunii reduced
BOD, COD and TN in the greywater in Malaysia by 82, 88
and 52%, respectively, as well as the resulted reported by
Gokulan et al. [29] who found that Botryococcus sp.
reduced BOD and COD in greywater from Men hostel by
66.7 and COD 85.6%, respectively. Liu et al. [18] con-
cluded that Botryococcus sp. reduce TP and TN in Aerated
Swine wastewater in China by 93.3 and 40.8%, respec-
tively. The high efficiency of Botryococcus sp. noted in this
study might be related to the starvation process which
accelerated the potential of Botryococcus sp. for the
assimilation of nutrients and soluble organic matter.
It should indicate that despite the growth rate of Botry-
ococcus sp. has declined after the 9th day of the phycoreme-
diation process of greywater from houses 1, 2 and 4 and after
12th day in greywater from house 3, the reduction percentage
of COD, BOD5, nutrients and elements has increased. This
could be explained due to the reduction capacity (Qmax) for the
microalgae cells. Qmax represents the amount of pollutant
removed by microalgae cells. The results found that the Qmax
for eachmicroalgae cell increasedwith decrease in the growth
rate. For example, theQmax for reduction COD at 9th day was
0.094 mg per growth rate (4236.1 cell min-1), and increased
to 0.56 mg per growth rate (1736.1 cell min-1). There are no
maximum and minimum Qmax reported in literature, but the
increase in the reduction percentage showed in this study
indicates that the microalgae cell has high reduction capacity
for the greywater parameters.
Characteristics of treated greywater
The characteristics of greywater generated after 21 days of the
phycoremediation process are illustrated in Table 4. It can be
noted that the BOD5 has dropped to meet Environmental
Table 4 Characteristics of treated greywater after phycoremediation using Botryococcus sp. (0.3 g dry wt L-1)
Parameters Source of greywater samples Environmental quality Act 1974 (Regulation 2009)
House 1 House 2 House 3 House 4 Standards A Standards B
pH 7.60 ± 0.34 7.60 ± 0.42 8.20 ± 0.61 7.90 ± 0.32 6.0–9.0 5.5–9.0
BOD5 16.50 ± 3.22 10.00 ± 2.5 10 ± 1.1 13.00 ± 2.6 20 50
COD 61.34 ± 5.3 52.08 ± 4.2 96.07 ± 7.43 134.26 ± 5.4 50 100
NO3- 0.03 ± 0.00 0.01 ± 0 0.28 ± 0.1 0.03 ± 0 10 20
PO43- 0.37 ± 0.0.1 0.71 ± 0.12 0.83 ± 0.8 1.92 ± 0.03 5 10
NH3 0 ± 0 0.28 ± 0.2 0.28 ± 0.09 1.3 ± 1.1 NA NA
Na 27.46 ± 1.5 40.83 ± 4.2 7.28 ± 2.2 55.82 ± 4.6 NA NA
Ca 0.63 ± 0.21 0.70 ± 0.2 0.36 ± 0.22 0.42 ± 0.2 NA NA
K 4.14 ± 0.98 4.07 ± 1.8 4.12 ± 1.2 4.32 ± 1.9 NA NA
The experiments were conducted in 5 L tank capacity under normal environment conditions (temperature: 25–29 �C, 12 h L: 12 h D period) for
21 days (n = 12)
All parameters unit are expressed in mg L-1 except for pH; biological oxygen demand (BOD5), chemical oxygen demand (COD), nitrate
(NO3-), phosphate (PO4
3-), sodium (Na), calcium (Ca), potassium (K); Standards A: discharge upstream of water supply sources; Standards B:
Discharge downstream of water supply sources
NA not available
270 Int J Energy Environ Eng (2017) 8:259–272
123

Quality Act 1974 (Regulation 2009), Standards A, while COD
met Standards B. Nutrients have reduced to the minimum
concentrations. The final concentrations of NO3- and PO4
3-
ranged from 0.01 to 0.28 and 0.37 to 1.92 mg L-1, respec-
tively, which is within the range recommended by EQA1974
(10 and 5 mg L-1, respectively). There are no standards limits
required for NH3 as well as Na, Ca and K ions. However, the
removal of NH3 ranged from 60 to 100%. The concentrations
ofNa,Ca andK ions reducedbymore than 90% to be available
with microelements concentrations range. pH of the treated
greywater was neutral which is more suitable for reuse in the
irrigation.
The greywater could be discharged without secondary
effects on the environment. These results indicate that the
phycoremediation process conducted in this study has high
efficiency and might be used by the individual house for
the treatment of greywater. In comparison with others
system, Mohamed et al. [3] investigated the efficiency of a
multicomponent filtration system for the treatment of
greywater at village house. The study reported that the
filtrated greywater meet Standards A, in terms of BOD5,
COD and TSS. Moreover, the filtration system is not
effective for removal of nutrients, while the phycoreme-
diation system suggested here have exhibited high effec-
tiveness for nutrients removal.
The application of phycoremediation system at village
house needs two tanks (storage and bioreactor tank). The
maximum quantity of greywater estimated in this study
was 200 L days and the maximum incubation period of
phycoremediation process was 21 days with 4200 L of
quantity. Therefore, the capacity of storage tank is sup-
posed to be 2100 L, while more than one phycoremediation
tank can be used with a total capacity of 2100 L. The
flowrate of the greywater into the phycoremediation tank
would be 139 mL min-1. As shown in Fig. 2 the flow of
greywater from the storage tank into phycoremediation
tank is happened seamlessly without water pump. Besides,
the process might provide air bubbles which might be used
as alternative for air pump. Based on that, it can be indi-
cated that no energy is required for the performance the
phycoremediation system; this advantage might induce the
people at village houses to apply for this system.
Botryococcus sp. was used as a dry mass to facility the
utilization by the people in the village houses and it need to
be inoculated only at the fixation of phycoremediation
system due to semi-continuous operation of this process.
Conclusion
The objective of the current work was to examine the
applicability of Botryococcus sp. for improving the charac-
teristics of bathroom greywater before the final disposal into
the environment. Botryococcus sp. exhibited high efficiency
for reducing BOD5 to comply with Standards limits required
for the environmental disposal (\20 mg L-1). Moreover, it
has the ability to reduce COD to meet the Standards limits
(100 mg L-1) in 75% of the samples after 21 days. The
results recorded rapidly reduction of NO3- within 18 days
with 98% of the efficiency. In comparison, the highest
reduction of ammonia (NH3) and orthophosphate (PO43-)
was 99 and 99.3%, respectively recorded after 21 days. It can
be concluded that the phycoremediation process system
investigated here exhibited high effectiveness for the treat-
ment of greywater from village houses. The process would
limit the level of contamination discharged with greywater
into the environment. The system is more applicable to be
used at village house because it is easily implementable, very
low cost where no energy is required, eco-friendly and has no
toxic by-products. The application of this system for indi-
vidual house would enhance the role of the community in
maintaining a sustainable environment.
Acknowledgement The authors are grateful for the financial support
provided by the Fundamental Research Grant Scheme (FRGS) Vot
1453 from the Ministry of Education, Malaysia.
Open Access This article is distributed under the terms of the Creative
Commons Attribution 4.0 International License (http://creative
commons.org/licenses/by/4.0/), which permits unrestricted use, distri-
bution, and reproduction in anymedium, provided you give appropriate
credit to the original author(s) and the source, provide a link to the
Creative Commons license, and indicate if changes were made.
References
1. Jais, N.M., Mohamed, R.M.S.R., Al-Gheethi, A.A., Hashim,
M.A.: The dual roles of phycoremediation of wet market
wastewater for nutrients and heavy metals removal and
microalgae biomass production. Clean Technol Environ Policy
19(1), 37–52 (2017)
2. Al-Gheethi, A.A., Mohamed, R.M., Efaq, A.N., Amir, H.K.:
Reduction of microbial risk associated with greywater utilized for
irrigation. Water Health J. 14(3), 379–398 (2016)
3. Mohamed, R.M., Al-Gheethi, A.A., Jackson, A.M., Amir, H.K.:
Multi component filters for domestic greywater treatment in
village houses. J. Am. Water Works Ass (AWWA) 108(7),405–414 (2016)
4. Mohamed, R.M., Chan, C.M., Senin, H., Kassim, A.H.: Feasia-
bility of the direct filtration over peat filter media for bathroom
greywater treatment. J. Water Environ. Sci. 5(6), 2021–2029
(2014)
5. IWK: Sewage treatment plant. Indah Water Konsortium Sdn Bhd.
http://www.iwk.com.my/v/knowledge-arena/sewage-treatment-
plant. Accessed on 10 Dec 2016
6. Abou-Shanab, R.A., Ji, M., Kim, H., Paeng, K., Jeon, B.:
Microalgal species growing on piggery wastewater as a valuable
candidate for nutrient removal and biodiesel production. J. Envi-
ron. Manag. 115, 257–264 (2013)
7. Gani, P., Sunar, N.M., Matias-Peralt, H.M.: Experimental study
for phycoremediation of Botryococcus sp. on greywater. Appl.
Mech. Mat. 773–774, 1312–1317 (2015)
Int J Energy Environ Eng (2017) 8:259–272 271
123
8. Sivasubramaniam, V.: Phycoremediation technology applied to
effluent treatment. Retrieved August 20, 2013 at Phycoremedia-
tion (Remediation using algae). http://phycoremediation.in/pro
jects.html (2013)
9. Rengefors, K., Karlsson, I., Hansson, L.A.: Algal cyst dormancy:
a temporal escape from herbivory. Proc. R. Soc. B Biol. Sci. 265,1353–1358 (1998)
10. American Public Health Association, Inc (APHA): Standard
Methods for the Examination of Water and Wastewater, 21st edn.
APHA, New York (2005)
11. Bischoff, H.W., Bold, H.C.: Some soil algae from enchanted rock
and related algae species. Phycol. Stud. 44(1), 1 (1963)
12. Larsdotter, K., Jansen, J.L., Dalhammar, G.: Biologically medi-
ated phosphorus precipitation in wastewater treatment with
microalgae. Environ. Technol. 28(9), 953–960 (2007)
13. Jefferson, B., Palmer, A., Judd, S.: Grey water characterization
and its impact on the selection. Water Sci. Technol. 50(2),157–164 (2004)
14. Wurochekke, A.A., Mohamed, R.M.S., Al-Gheethi, A.A., Atiku,
H., Amir, H.M., Matias-Peralta, H.M.: Household greywater
treatment methods using natural materials and their hybrid sys-
tem. J Water Health 14(6), 914–928 (2016)
15. Wurochekke, A.A., Harun, N.A., Mohamed, R.M.S.R., Kassim,
A.H.B.M.: Constructed Wetland of Lepironia Articulata for
household greywater treatment. APCBEE Procedia 10, 103–109(2014)
16. Casanova, L.M., Little, V., Frye, R.J., Gerba, C.P.: A survey of
the microbial quality of recycled household graywater. J. Am.
Water Res. Assoc. 37, 1313–1320 (2001)
17. Chinnasamy, S., Bhatnagar, A., Hunt, R.W., Das, K.C.:
Microalgae cultivation in a wastewater dominated by carpet mill
effluents for biofuel applications. Bioresour. Technol. 101(9),3097–3105 (2010)
18. Liu, J., Ge, Y., Cheng, H., Wu, L., Tian, G.: Aerated swine
lagoon wastewater: a promising alternative medium for Botry-
ococcus braunii cultivation in open system. Bioresour. Technol.
139, 190–194 (2013)
19. Zwietering, M.H., Jongenburger, I., Rombouts, F.M., van’t Riet,
K.: Modeling of the bacterial growth curve. Appl. Environ.
Microbiol. 56(6), 1875–1881 (1990)
20. Devi, P., Subhash, M.G., Mohan, S.V.: Heterotrophic cultivation
of mixed microalgae for lipid accumulation and wastewater
treatment during sequential growth and starvation phases: effect
of nutrient supplementation. Renew. Energy 43, 276–283 (2012)
21. Cavet, J., Borrelly, G., Robinson, N.: Zn, Cu, and Co in
Cynobacteria; a selective control of metal availability. FEMS
Microbial. Rev. 27, 165–181 (2003)
22. Atiku, H., Mohamed, R.M., Al-Gheethi, A.A., Wurochekke,
A.A., Kassim A.H.: Harvesting microalgae biomass from the
phycoremediation process of greywater. Environ. Sci. Poll. Res.
(Online) (2016)
23. Yaakob, Z., Ali, E., Mohamad, M., Takrif, M.S.: An overview:
biomolecules from microalgae for animal feed and aquaculture.
J. Biol. Res. 21(6), 1–10 (2014)
24. Al-Mughalles, M.H., Abd-Rahman, R., Suja, F., Mahmud, M.,
Jalil, N.A.: Household greywater quantity and quality in Sana’a.
Yemen. EJGE 17(2012), 1025–1034 (2012)
25. Gunes, K., Tuncsiper, B., Ayaz, S., Drizo, A.: The ability of free
water surface constructed wetland system to treat high strength
domestic wastewater: a Case Study for the Mediterranean. Ecol.
Eng. J. 44, 278–284 (2012)
26. Nnaji, C.C., Mama, C.N., Ekwueme, A., Utsev, T.: Feasibility of
a filtration-adsorption grey water treatment system for developing
countries. Hydrol. Curr. Res. S1, 006 (2013). doi:10.4172/2157-
7587.S1-006
27. Arumugam, M., Agarwal, A., Arya, A.C., Ahmed, Z.: Influence
of nitrogen sources on biomass productivity of microalgae Sce-
nedesmus bijugatus. Short communication. Bioresour. Technol.
131, 246–249 (2013)
28. Silambarasan, T., Vikramathithan, M., Dhandapani, R., Mukesh,
D.J., Kalaichelvan, P.T.: Biological treatment of dairy effluent bymicroalgae. World J. Sci. Technol. 2(7), 132–134 (2012)
29. Gokulan, R., Sathish, N., Kumar, R.P.: Treatment of grey water
using hydrocarbon producing Botryococcus braunii. Int. J. Chem.
Tech. Res. 5(3), 1390–1392 (2013)
30. Knud-Hansen, C.F., Clair, D.: Pond fertilization: ecological
approach and practical application. In: McElwee, K., Baker, J.
(eds.) Corvallis, Oregon: Pond Dynamics/Aquaculture Collabo-
rative Research Support Program, p. 112. Oregon State Univer-
sity (1998)
31. Al-Gheethi, A.A., Lalung, J., Efaq, A.N., Bala, J.D., Norli, I.:
Removal of heavy metals and b-lactam antibiotics from sewage
treated effluent by bacteria. Clean Technol. Environ. Policy
17(8), 2101–2123 (2015)
32. Munoz, R., Guieysse, B.: Algal bacterial processes for the
treatment of hazardous contaminants: a review. Water Res.
40(15), 2799–2815 (2006)
272 Int J Energy Environ Eng (2017) 8:259–272
123