removal of micro-pollutants from drinking water …
TRANSCRIPT
Fabian Sander
REMOVAL OF MICRO-POLLUTANTS FROM DRINKING WATER WITH ADVANCED OXIDATION PROCESSES
Thesis CENTRAL OSTROBOTHNIA UNIVERSITY OF APPLIED SCIENCES Degree Programme in Chemistry and Environmental Technology April 2009
I
ACKNOWLEDGEMENT
This work was entirely performed at ITT Wedeco´s research and development
facility in Herford, Germany. I would like to express my gratitude to all my co-
workers who supported me during this time from June 2008 until March 2009. The
R&D department with Dr. Achim Ried, Dr. Jörg Mielcke, Mike Bromen, Arne
Wieland, Stephan Baeck, Mechthild Rediker, Gesa Kruse, Jürgen Vogt, Khalid Al
Barim and especially Jens Krüger for his willingness to support my ideas. I want to
thank Joachim Anton and Friedhelm Krüger from the computational fluid design
team for the good co-operation and interest into my “new perspectives” of gas
diffusion. Furthermore I would like to thank Niels Peters, the master of the
warehouse, for his endless support of providing me plastic pipes for the practical
part of the work. Also, what would life be without food? Therefore I would like to
thank the staff restaurant team, Doris and Doris for their cuisine.
I want to thank David Owen from O.I.Filtration Ltd, Stoke on Trent, England, who
supplied a stone diffuser sample to us. In addition I want to thank Rob Jerman
from Markel Corporation, Plymouth Meeting, USA, for his tubing samples.
This work was supervised by MSc Jana Holm and MSc Esko Johnson from the
Central Ostrobothnia University of applied Sciences; I want to thank both for their
time and feedback regarding this work. Tack! Kiitos!
I
THESIS ABSTRACT
Department
Technology and Business,
Kokkola, Finland
Date
30.04.2009
Author
Fabian Sander
Degree Programme
Degree Programme for Chemistry and Environmental Technology
Name of Thesis
Removal of micro-pollutants from drinking water with advanced oxidation
processes.
Instructor
Jens Krüger and Dr. Achim Ried
Pages
96 + Appendices(2)
(57 confidential version)
Supervisor
MSc Jana Holm
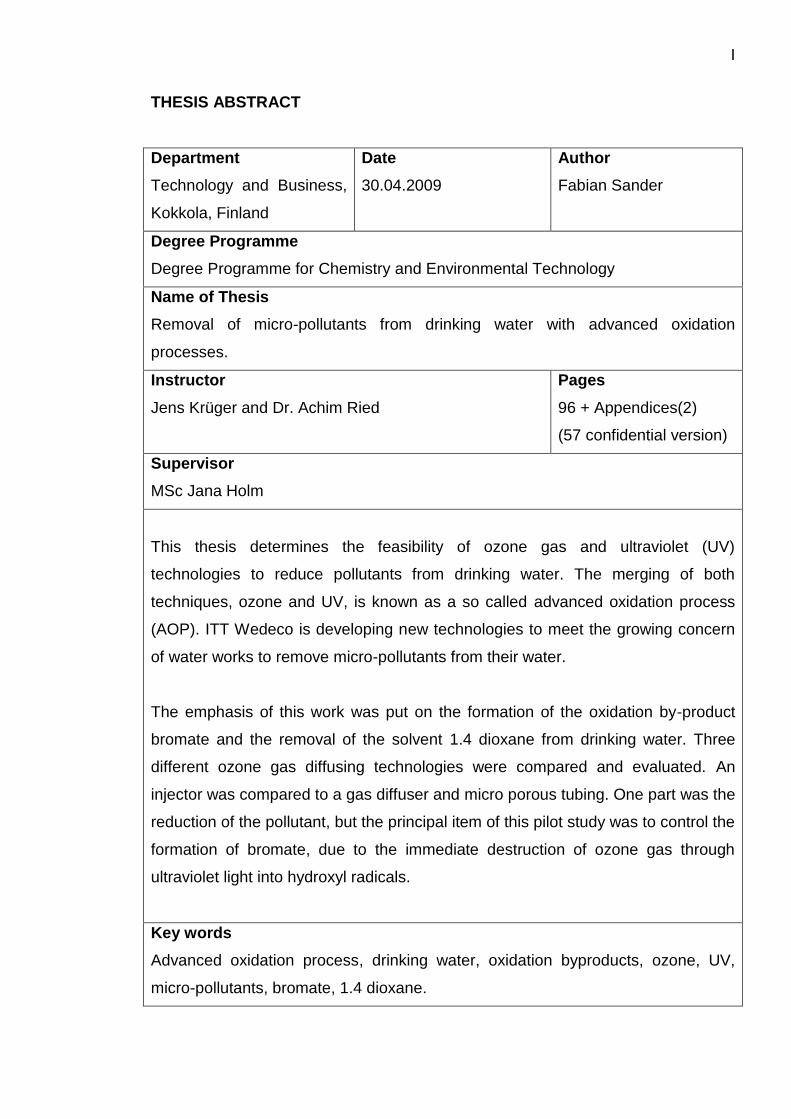
This thesis determines the feasibility of ozone gas and ultraviolet (UV)
technologies to reduce pollutants from drinking water. The merging of both
techniques, ozone and UV, is known as a so called advanced oxidation process
(AOP). ITT Wedeco is developing new technologies to meet the growing concern
of water works to remove micro-pollutants from their water.
The emphasis of this work was put on the formation of the oxidation by-product
bromate and the removal of the solvent 1.4 dioxane from drinking water. Three
different ozone gas diffusing technologies were compared and evaluated. An
injector was compared to a gas diffuser and micro porous tubing. One part was the
reduction of the pollutant, but the principal item of this pilot study was to control the
formation of bromate, due to the immediate destruction of ozone gas through
ultraviolet light into hydroxyl radicals.
Key words
Advanced oxidation process, drinking water, oxidation byproducts, ozone, UV,
micro-pollutants, bromate, 1.4 dioxane.
II
TABLE OF CONTENTS
LIST OF GRAPHS I
LIST OF TABLES I
LIST OF ABBREVIATIONS III
1 INTRODUCTION 1
2 THEORY OF ADVANCED OXIDATION PROCESS 4
2.1 Introduction to water pollutants 4 2.1.1 Micro pollutants 5
2.1.2 Solvent 1.4 dioxane 7 2.1.3 Transformation and persistence 9
2.2 Ozone 10 2.2.1 Chemistry of oxidation 12
2.2.2 Oxidation potential 12 2.2.3 Applications of ozone 14
2.2.4 Ozone generation from oxygen 15 2.2.5 Reaction properties 17
2.2.6 Scavengers of the hydroxyl radical 19 2.2.7 Ozone decomposition 19 2.2.8 Diffusion into water 20
2.3 UV radiation 22 2.3.1 Introduction to ultraviolet radiation 22
2.3.2 UV spectrum 24 2.3.3 Effect on micro organism 25 2.3.4 Dose of ultraviolet light 26 2.3.5 Ultraviolet lamps 27
2.3.6 Low pressure high output amalgam lamps 29 2.3.7 Medium pressure lamps 29
2.3.8 Effects of water quality on UV efficiency 31
2.4 Advanced oxidation processes 32 2.4.1 Ozone destruction by UV 33 2.4.2 Ozone photo dissociation 34 2.4.3 Hydroxyl radical formation 35
2.4.4 Comparison of ozone to hydrogen peroxide 38 2.4.5 Low pressure and medium pressure lamp differences 39 2.4.6 UV photolysis 40 2.4.7 Example of ozone destruction through ultraviolet light 40 2.4.8 Applications for AOP 40 2.4.9 Advantages and disadvantages of AOPs 41

III
2.4.10 Parameters affecting the AOP efficiency 44
2.5 Oxidation by-products 45 2.5.1 Bromate 45
2.5.2 Formation of bromate 46 2.5.3 Formation pathways 48
3 AOP SYSTEM AND PERFORMANCE 50
3.1 Pre examinations 50 3.1.1 The initial design of the reactor 50
3.1.2 Conclusions after first test run 50 3.1.3 Injector 50
3.1.4 Diffuser 51 3.1.5 Tubing 54 3.1.6 Determining bubble size of injector, diffuser and tubing 54 3.1.7 The first performance test: co-current 55 3.1.8 The first performance test: counter-current 55
3.1.9 Bubble contact time with UV radiation 56
3.1.10 Compounds of the system 56 3.1.11 Sampling 56
3.2 Results of pre study 57
4 DEGRADATION OF 1.4 DIOXANE AND BROMATE CONTROL 57
4.1 Final pilot runs 57
4.1.1 Sampling amounts and procedure 57
4.2 Results 57
5 CONCLUSIONS AND RECOMMENDATIONS 57
REFERENCES 58
APPENDIX 1 62
APPENDIX 2 64
i
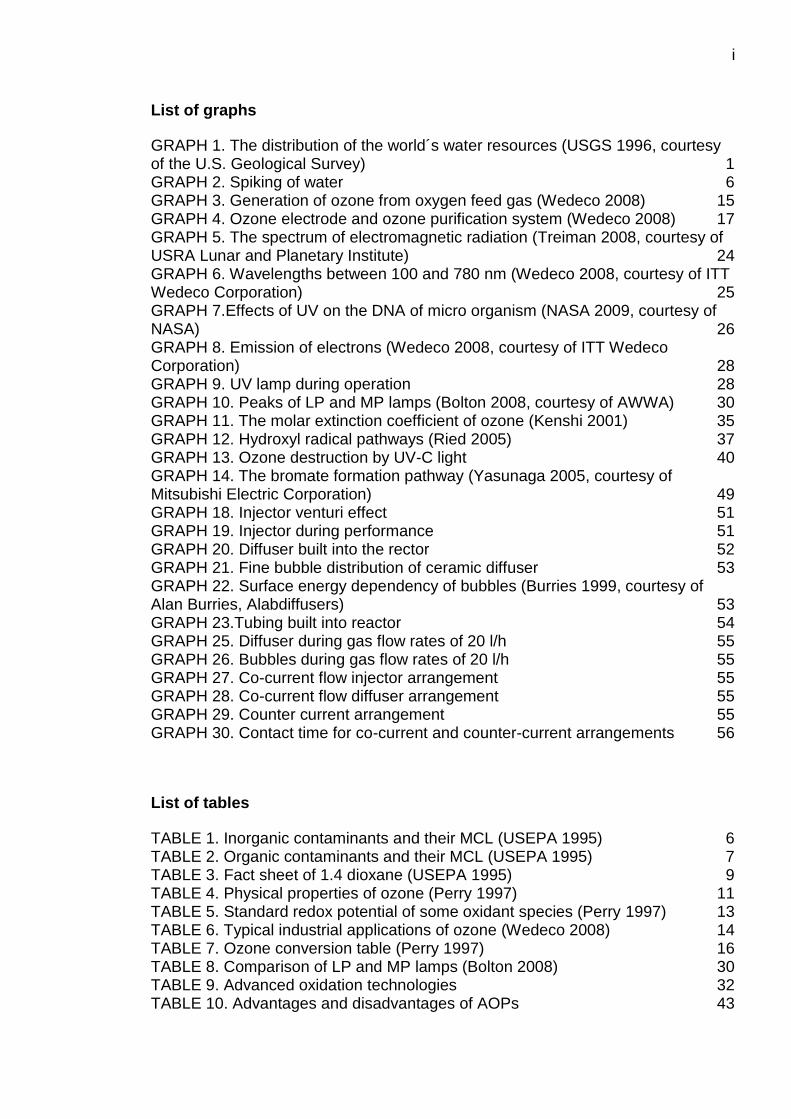
List of graphs
GRAPH 1. The distribution of the world´s water resources (USGS 1996, courtesy of the U.S. Geological Survey) 1 GRAPH 2. Spiking of water 6 GRAPH 3. Generation of ozone from oxygen feed gas (Wedeco 2008) 15
GRAPH 4. Ozone electrode and ozone purification system (Wedeco 2008) 17 GRAPH 5. The spectrum of electromagnetic radiation (Treiman 2008, courtesy of USRA Lunar and Planetary Institute) 24 GRAPH 6. Wavelengths between 100 and 780 nm (Wedeco 2008, courtesy of ITT Wedeco Corporation) 25
GRAPH 7.Effects of UV on the DNA of micro organism (NASA 2009, courtesy of NASA) 26
GRAPH 8. Emission of electrons (Wedeco 2008, courtesy of ITT Wedeco Corporation) 28 GRAPH 9. UV lamp during operation 28 GRAPH 10. Peaks of LP and MP lamps (Bolton 2008, courtesy of AWWA) 30 GRAPH 11. The molar extinction coefficient of ozone (Kenshi 2001) 35
GRAPH 12. Hydroxyl radical pathways (Ried 2005) 37 GRAPH 13. Ozone destruction by UV-C light 40
GRAPH 14. The bromate formation pathway (Yasunaga 2005, courtesy of Mitsubishi Electric Corporation) 49
GRAPH 18. Injector venturi effect 51 GRAPH 19. Injector during performance 51 GRAPH 20. Diffuser built into the rector 52
GRAPH 21. Fine bubble distribution of ceramic diffuser 53
GRAPH 22. Surface energy dependency of bubbles (Burries 1999, courtesy of Alan Burries, Alabdiffusers) 53 GRAPH 23.Tubing built into reactor 54
GRAPH 25. Diffuser during gas flow rates of 20 l/h 55 GRAPH 26. Bubbles during gas flow rates of 20 l/h 55
GRAPH 27. Co-current flow injector arrangement 55 GRAPH 28. Co-current flow diffuser arrangement 55 GRAPH 29. Counter current arrangement 55
GRAPH 30. Contact time for co-current and counter-current arrangements 56
List of tables
TABLE 1. Inorganic contaminants and their MCL (USEPA 1995) 6 TABLE 2. Organic contaminants and their MCL (USEPA 1995) 7 TABLE 3. Fact sheet of 1.4 dioxane (USEPA 1995) 9 TABLE 4. Physical properties of ozone (Perry 1997) 11 TABLE 5. Standard redox potential of some oxidant species (Perry 1997) 13
TABLE 6. Typical industrial applications of ozone (Wedeco 2008) 14 TABLE 7. Ozone conversion table (Perry 1997) 16 TABLE 8. Comparison of LP and MP lamps (Bolton 2008) 30 TABLE 9. Advanced oxidation technologies 32 TABLE 10. Advantages and disadvantages of AOPs 43
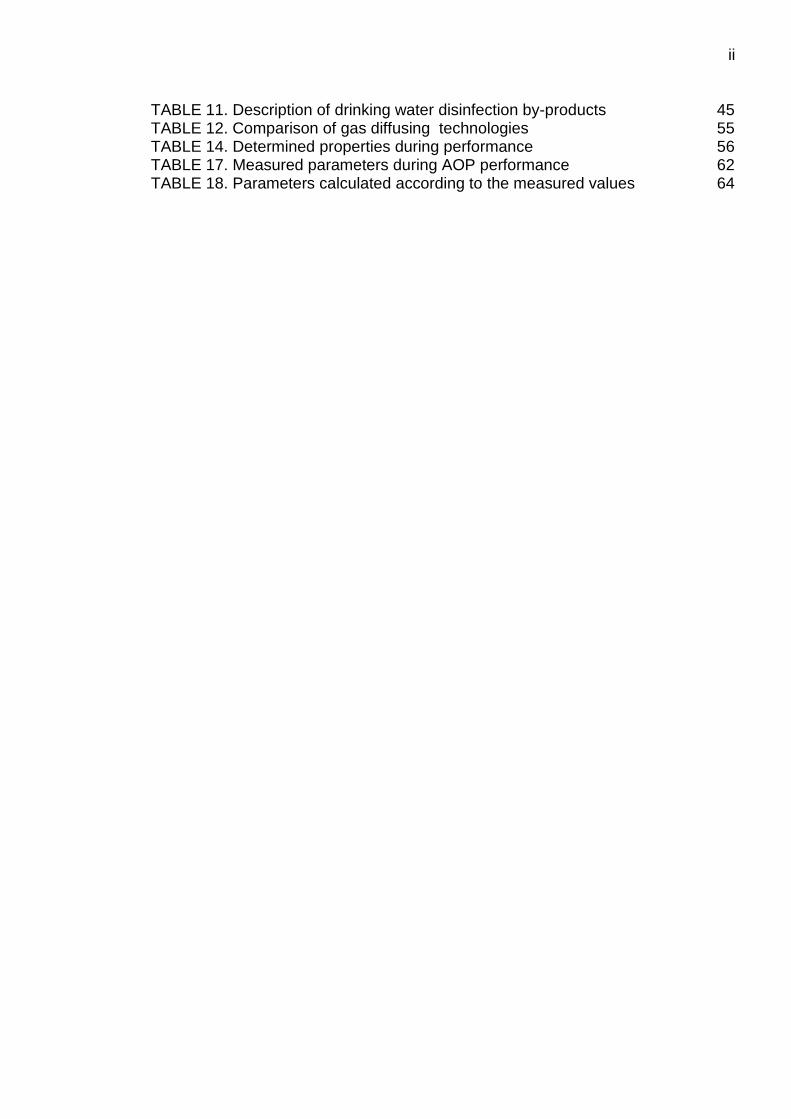
ii TABLE 11. Description of drinking water disinfection by-products 45 TABLE 12. Comparison of gas diffusing technologies 55 TABLE 14. Determined properties during performance 56
TABLE 17. Measured parameters during AOP performance 62 TABLE 18. Parameters calculated according to the measured values 64

iii
List of abbreviations
AOP Advanced oxidation process
AOT Advanced Oxidation Techniques
AOX Adsorbable Organohalogens
COD Chemical Oxygen Demand
COD Catalytic Ozone Destructor
DBD Dielectric Barrier Discharge
DOC Dissolved Organic Carbon
EDC Endocrine Disrupting Compounds
EEO Electrical Energy per Order
GAC Granulated Activated Carbon
H2O2 Hydrogen Peroxide
LOX Liquid Oxygen
LP Low Pressure UV lamp
MCL Maximum Contaminant Level
MP Medium Pressure UV lamp
MTBE Methyltertbutylether
NDMA N-nitrosodymethylamine
NOM Natural Organic Matter
NTP Normal Temperature Pressure
PPM Parts Per Million
PSA Pressure Swing Adsorption
RO Reverse Osmosis
TCE Trichloroethylene
THM Trihalomethane
TOC Total Organic Carbon
TSS Total Suspended Solids
USEPA United States Environmental Protection Agency
UV Ultraviolet
UVT Ultraviolet Transmission
WHO World Health Organisation

1
1 INTRODUCTION
No life on our planet would exist without water. Our planet’s surface is covered by
71% with water, which is equal to 1,386,000,000 billion m³. Only a fraction of that
amount can be used for consumption, as only 3% is fresh water.
GRAPH 1. The distribution of the world´s water resources (USGS 1996, courtesy
of the U.S. Geological Survey)
Fresh water is a carrier for minerals and organic substances which are essential
for flora and fauna. These substances such as salts, calcium carbonate, sodium,
nitrogen, carbon dioxide, etc. are part of a natural water matrix, but unfortunately
water can also carry undesired substances.
Only less than 5% of the commercially distributed water is consumed or used in
food preparation. This so called drinking water is of sufficient high quality which
can be consumed without risk of immediate or long term harm. Drinking water
quality is determined under two categories: physical/chemical and microbiological.
Physical/chemical parameters include heavy metals, trace organic compounds,
total suspended solids (TSS), and turbidity. Microbiological parameters include
Coliform bacteria, E. coli, and specific pathogenic species of bacteria, viruses, and
protozoan parasites. The physical/chemical parameters are associated to a more
chronic health risk than microbiological. Mostly produced by mankind, these trace

2 organic compounds such as pesticides, endocrine disrupting compounds (EDC),
by-products of industrial productions and other toxic synthetic products cause
increasing problems to natural water systems. Once released into the
environment, these elements blend into surface water and eventually end up
polluting lakes, rivers and ground water reservoirs. The amount of these
compounds in water is rather low. Concentrations of micro-pollutants range in milli
(m), micro (µ), or even nano (n) grams per liter.
Nevertheless, they are considered pollutants due to the long term toxicity on
human and animals. While short term consumption of such polluted water would
not be expected to cause problems on human, the long term consumption of
polluted drinking water is a contentious issue. The world health organisation
(WHO) and national environmental authorities like the United States
Environmental Protection Agency (USEPA) have released recommendations such
as the maximum contaminant level (MCL) which is the legal threshold limit on the
amount of a hazardous substance that is allowed in drinking water. This MCL is
applied for pesticides, solvents and disinfection by products and is usually
expressed as a concentration in milligrams or micrograms per liter of water.
To achieve such low concentrations in drinking water, water distributors need to
treat the product before it is released into the water network. As to the removal of
micro pollutants, this treatment step often requires very high efforts, due to the
complex molecular structure of most pollutants. In most cases, the typical
treatment by bacteria biodegradation is not successful, since absorption by
activated carbon does not achieve the desired results either and reverse osmosis
(RO) leaves the problem of a concentrate. The destruction of the undesired
molecule into less harmful substances would therefore be ideal.
The so called advanced oxidation process (AOP) is capable of breaking the
molecular bonds within the pollutant molecule and therefore crack it into smaller,
less harmful parts. Ideally, this would be carbon dioxide and water. In most cases
the oxidation of undesired molecules will create less harmful substances, but
unfortunately this is not always the case.
3
This work determines the degradation of a solvent called 1.4 dioxane, which is
fortunately known to break into less harmful fragments after oxidation. Such
advanced oxidation technologies (AOT) are capable of destroying pollutants due
to the generation of very reactive radicals. Hydroxyl radicals (•OH) are a
connection of oxygen and hydrogen atoms by a covalent bond, and highly reactive
with any substance present in water. The generation of such radicals can be
initiated through different pathways such as the combination of ultraviolet light
(UV) with ozone, UV with hydrogen peroxide (H2O2) or hydrogen peroxide and
ozone.
(CONFIDENTIAL)

4
2 THEORY OF ADVANCED OXIDATION PROCESS
2.1 Introduction to water pollutants
Water pollution is estimated to be the leading cause of deaths and diseases
worldwide and is expected to account for the deaths of 14,000 people per day.
Water is typically referred to be polluted when it is impaired by manmade
contaminants and does not support human use or negatively affects its constituent
part for animals and plant life. These contaminants can affect human health on a
short term basis such as micro organism pollution; but also long term
contamination with substances such as heavy metals or chemicals ranging in low
concentrations in water. These micro pollutants can cause chronic poisoning or
support the chance of cancer if consumed by humans through drinking water.
(USEPA 1994.)
This thesis work about the technology of advanced oxidation processes is
specialized to pollutions ranging in very low concentrations in water. Since the late
eighties of the last century, pesticides are found in raw water sources. The issue
has caused increasing attention during the last years, with ongoing debates about
maximum contaminant levels in the EU. They were encountered in surface water
and bank filtrate, as well as in ground water. This development triggered the water
supply companies to search for solutions in the removal / degradation of the
pesticides in order to meet the European standard. The Netherlands are affected
by this problem in particular, since most of the drinking water is obtained from
surface water bank filtrate. Surface water has the highest tendency of being
polluted. Some water works have started considering the reduction of micro
pollutants for the sake of their customers even without any mandatory reduction
level by the authorities.
5 ITT Wedeco has started pilot plant co-operations with water suppliers in the
Netherlands for the reduction of such pollutants by either ozone-hydrogen
peroxide, UV-ozone or UV-hydrogen peroxide AOPs. In general, the pesticide
concentration can be lowered by oxidation, granulated activated carbon (GAC)
and membrane filtration. Disadvantages of oxidation is the formation of smaller
degradation products and the relatively high costs if the process is applied for
pesticide control only. The advantage of oxidation processes may be the
combination of disinfection and degradation of organic micro-pollutants.
Optimization of the process conditions with respect to the desired degree of
degradation of micropollutants and by-products formation is needed. (Ijpelaar
2001.)
2.1.1 Micro pollutants
As can be referred from the word micro (µ), micro pollutants range in
concentrations of parts per million (ppm). Such pollutants are therefore hard to
detect, do not cause immediate intoxication, are often difficult to remove and,
unfortunately, are expensive to treat. The removal requires very high dosages of
treatment material. In the case of ultraviolet radiation with ozone, this would be a
high intensity of light flux (J/m²) and ozone gas (g/m³). A 99.99% (4log)
deactivation of micro-organisms from water by UV light would typically require a
dose of 400 J/m², whereas the 90% (1log) removal of a micro pollutant such as 1.4
dioxane would require 10000 J/m² and a second media such as ozone to achieve
a reduction of the desired pollutant. (Wedeco 2008.)
This problem of high treatment dosages is eventually a commercial one. The
treatment cost of one cubic meter of water will increase significantly if micro-
pollutants are being removed. Municipal water works try to keep the treatment
costs as low as possible, meaning that only obliged pollutants are being removed.
Graph 2 gives an example of spiking a pollutant into water for degradation tests.
To obtain the concentration of 80 µg/l, the content of this pipette, 1.4 dioxane, was
diluted with 2000 l of water; this is equal to 1000 beakers in the graph.
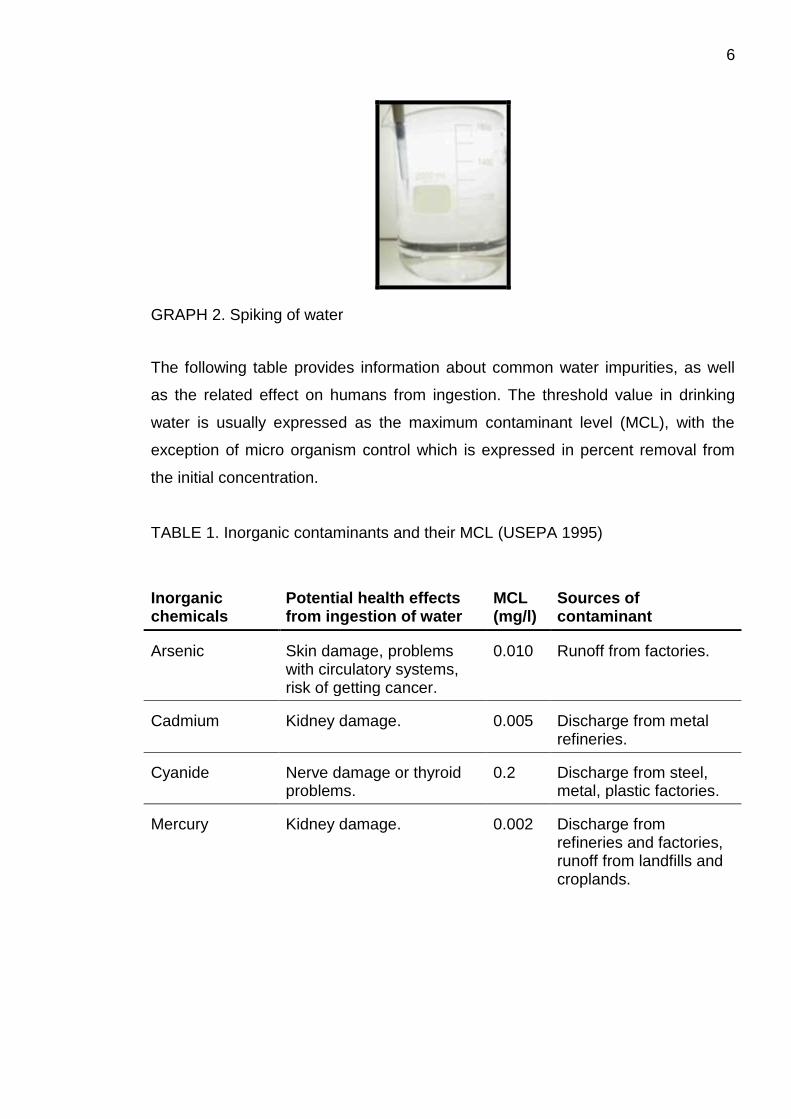
6
GRAPH 2. Spiking of water
The following table provides information about common water impurities, as well
as the related effect on humans from ingestion. The threshold value in drinking
water is usually expressed as the maximum contaminant level (MCL), with the
exception of micro organism control which is expressed in percent removal from
the initial concentration.
TABLE 1. Inorganic contaminants and their MCL (USEPA 1995)
Inorganic chemicals
Potential health effects from ingestion of water
MCL (mg/l)
Sources of contaminant
Arsenic Skin damage, problems with circulatory systems, risk of getting cancer.
0.010 Runoff from factories.
Cadmium Kidney damage. 0.005 Discharge from metal refineries.
Cyanide Nerve damage or thyroid problems.
0.2 Discharge from steel, metal, plastic factories.
Mercury Kidney damage. 0.002 Discharge from refineries and factories, runoff from landfills and croplands.

7 TABLE 2. Organic contaminants and their MCL (USEPA 1995)
Organic chemicals
Potential health effects from ingestion of water
MCL (mg/l)
Sources of contaminant
Atrazine Cardiovascular system or reproductive problems.
0.003 Runoff from herbicide used to grow crops.
Benzene Anemia; decrease in blood platelets; increased risk of cancer.
0.005 Discharge from factories; leaching from gas storage tanks and landfills.
Polychlorinated biphenyls (PCBs)
Skin changes, immune deficiencies; reproductive or nervous system difficulties, risk of cancer.
0.0005 Runoff from landfills; discharge of waste chemicals.
Tetra chloroethylene
Liver problems; increased risk of cancer.
0.005 Discharge from factories and dry cleaners.
Dioxin Reproductive difficulties; increased risk of cancer.
0.00000003
Emissions from waste incineration and other combustion; discharge from chemical factories.
1,4 dioxane Damage to liver and kidneys.
No limit
Solvent for manufacture of textile, cosmetics, shampoos, paper and cotton.
2.1.2 Solvent 1.4 dioxane
The solvent 1.4 dioxane is a manmade compound primarily used as an industrial
solvent or solvent stabilizer that prevents the breakdown of chlorinated solvents
during manufacturing processes. C4H8O2, 1.4 dioxane, also called dioxane, dioxan,
p-dioxane, diethylene dioxide, diethylene oxide, diethylene ether or glycol ethylene
ether, is a colourless, flammable, and oily liquid with the melting point of 11.8°C
and boiling point of 101°C. (Heiland 2004.)
One remarkable property is the excellent dissolving power of solvents. Due to
these properties, it is commonly used as a solvent stabilizing agent. It is an
8 ingredient in paints, varnishes, detergents, cements, stains, inks, cosmetics and is
a natural component in vine-ripped tomatoes and tomato products, fresh shrimps,
brewed coffee and fried chicken. It is also present in ordinary household products
like shampoos, liquid/ dishwashing soap, baby lotion, hair lotions, bath foam, and
other cosmetic products. (Zenker 2003.)
Other solvent applications include those for dyes, fats, greases, lacquers, mineral
oil, paints, resins and waxes. It can be blended with water and most organic
solvents in any kind of ratio. On the other hand, dioxane has a high stability and is
not reactive in chemical reactions. Therefore it can be used in chemical reactions,
in determining the optical activity and for cryoscopy and it is formed as a by-
product during the manufacture of polyester and various polyethoxylated
compounds. (Heiland 2004.)
Dioxane is commonly used to dissolve acetyl cellulose, cellulose ether and
chlorinated rubber. Furthermore it is used for extraction of animal and plant tissue.
It can form an addition reaction with several organic and inorganic substances,
whereas the bonding is formed through van der Waals forces, donor-acceptor, or
hydrogen bonds. In high concentrations, dioxane is narcotic to human and causes
severe damage to kidney and liver. In vapour, it irritates eyes and the respiratory
tract. In liquid phase, it can be absorbed by human skin. It is expected to be
human carcinogen by the USEPA and therefore classified as group B2 (probable
human carcinogen). A person must drink 2 liters per day of water over the action
level of 3 µg/l for a period of 70 years in order to generate one additional cancer
case out of a million people. (Zenker 2003.)
The long term effects on animals were examined in laboratory trials. Rats, which
were exposed to 1.4 dioxane in their drinking water, showed damage to liver and
kidneys. Short-term inhalation exposure to high levels of 1.4 dioxane has caused
vertigo, drowsiness, headache, anorexia and irritation of the eyes, nose, throat,
and lungs in humans. It may also irritate the skin. (USEPA 1995.)
9 Dioxane is highly soluble in groundwater, does not readily bind to soils, and
accidental solvent spills have resulted in the contamination of groundwater with
1.4 dioxane. It can remain in groundwater for several years and has caused
increasing attention to the public. Dioxane has been detected at concentrations of
1–220,000 µg/l in groundwater, 1-290 µg/l in surface water and 0.1-2,100 µg/l in
drinking water. The EPA has not yet established a federal drinking water standard
or maximum contaminant level for 1.4 dioxane, but some state level Environmental
Protection Agencies in the US have established state drinking water guidelines
which vary between 3 µg/l in California and 70 µg/l in Maine. (USEPA 1995.)
To treat waters containing 1.4 dioxane, volatilization and sorption are not
significant treatment mechanisms due to 1.4 dioxane's complete miscibility with
water. Advanced oxidation processes, and therefore the destruction of molecular
bonds, are the only proven technology for 1.4 dioxane treatment at the moment. In
North America, there are several known ground water remediation sites using
either UV-H2O2 or ozone-H2O2 to treat 1.4 dioxane. (USEPA 1995.)
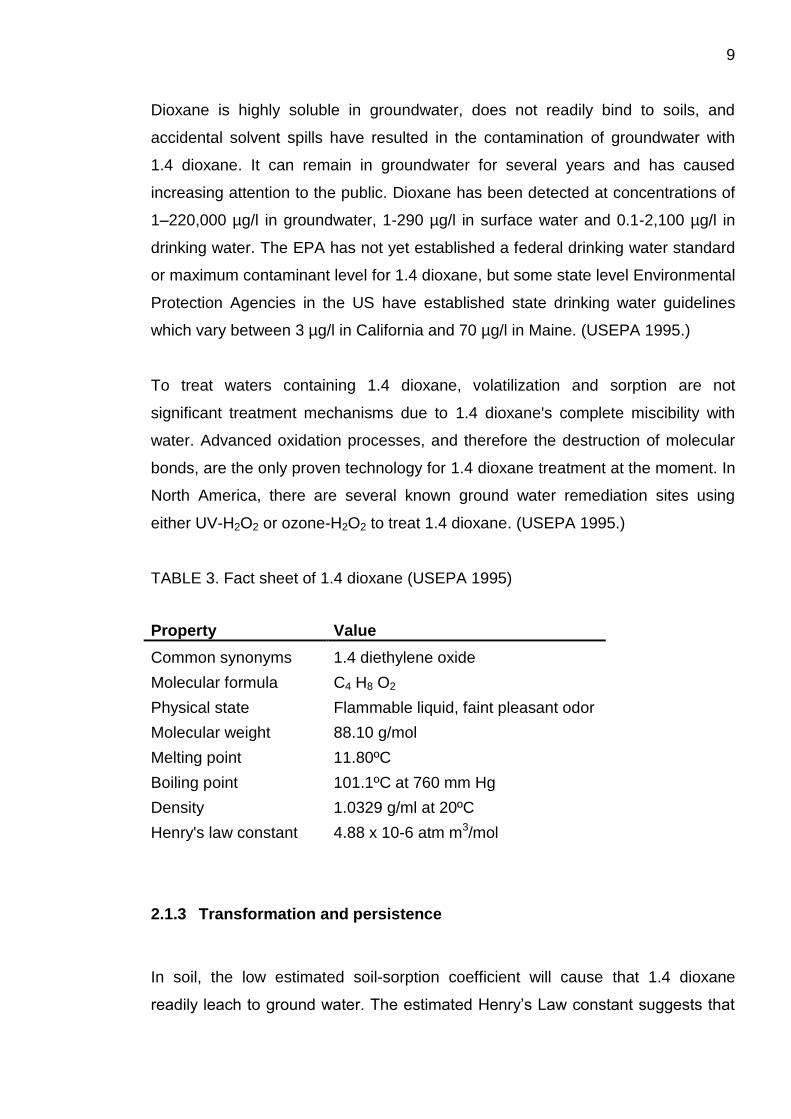
TABLE 3. Fact sheet of 1.4 dioxane (USEPA 1995)
Property Value
Common synonyms 1.4 diethylene oxide
Molecular formula C4 H8 O2
Physical state Flammable liquid, faint pleasant odor
Molecular weight 88.10 g/mol
Melting point 11.80ºC
Boiling point 101.1ºC at 760 mm Hg
Density 1.0329 g/ml at 20ºC
Henry's law constant 4.88 x 10⁻⁶ atm m3/mol
2.1.3 Transformation and persistence
In soil, the low estimated soil-sorption coefficient will cause that 1.4 dioxane
readily leach to ground water. The estimated Henry’s Law constant suggests that

10 volatilization from moist soils will be slow; however, based on its vapor pressure,
volatilization from dry soils should be fast. 1.4 dioxane is not expected to
biodegrade in soil. (Howard 1989.)
In water, ethers in general have been classified as generally resistant to
hydrolysis. Therefore 1.4 dioxane is not expected to hydrolyze significantly. The
estimated Henry's Law constant for 1.4 dioxane and its miscibility in water suggest
that volatilization will be slow. It is not expected to significantly adsorb to
suspended sediments and is not expected to biodegrade in water. (Howard 1989.)
2.2 Ozone
Ozone is a gas consisting of three oxygen atoms which is highly reactive. It is
formed naturally in the upper zones of the atmosphere (25 km above sea level)
where it surrounds the earth and protects the surface of our planet from UV-B and
UV-C radiation which are dangerous to human. In the atmosphere close to the
surface, ozone is unfortunately a toxic gas with a maximum contaminant level of
0.1 parts per million (ppm) for an exposure of 8 h. Exposure of 0.1 to 1 ppm
produces headaches, burning eyes, and irritation to the respiratory passages.
(Carrithers 1997.)
On the other hand, due to the reactive properties of ozone, it became popular for
the treatment of water, medicine, organic chemical synthesis, etc. as an
environmental friendly treatment technology. The reactivity is due to the structure
of the molecule. Each oxygen atom has the following electronic configuration
surrounding the nucleus: 1s² 2s² 2px2 2py
1 2pz1. The valence band has two
unpaired electrons, each one occupying one 2p orbital. In order to combine three
oxygen atoms and yield the ozone molecule, the central oxygen rearranges in a
plane sp² hybridation from the 2s and two 2p atomic orbitals of the valence band.
With this rearrangement the three new sp² hybrid orbitals form a triangle. The high
11 reactivity can be attributed to the electronic configuration of the molecule.
(Carrithers 1997.)
Ozone has gained increased attention for the disinfection of water since the
discovery of trihalomethanes (THM), due to chlorination of natural substances
present in raw water, in the late 1970s. The search began for alternative oxidant
disinfectants that could play the role of chlorine without generating the problem of
THM formation. (Beltran 2004.)
Studies have shown that organohalogen compounds formed in the treatment of
surface waters with chlorine and other chlorine derived oxidant disinfectants cause
a higher disinfection by-product risk than ozone. However, chlorine is not the only
concern in water quality. Other compounds are often discharged into natural
waters or in soils and eventually leach into the aquatic system, resulting in
contamination of wells and aquifers. Ozonation or hydroxyl radical oxidant based
processes have proven to be efficient technologies for the removal of such
pollutants. (Beltran 2004.)
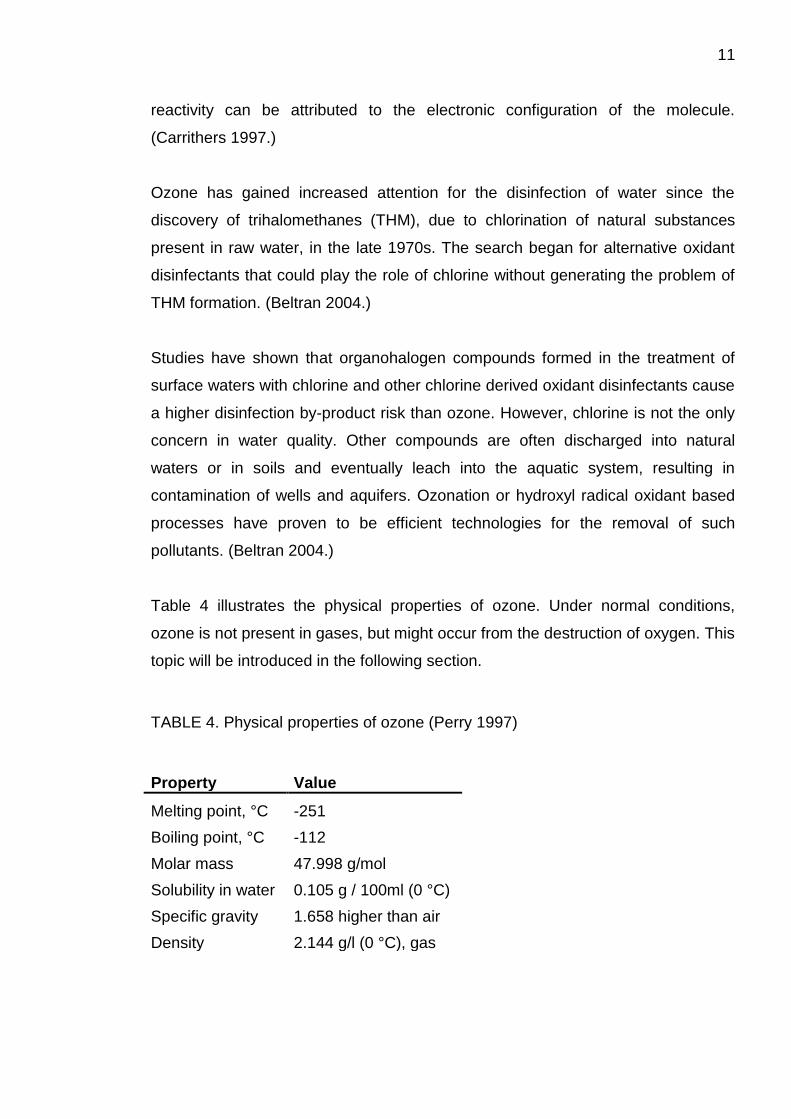
Table 4 illustrates the physical properties of ozone. Under normal conditions,
ozone is not present in gases, but might occur from the destruction of oxygen. This
topic will be introduced in the following section.
TABLE 4. Physical properties of ozone (Perry 1997)
Property Value
Melting point, °C -251
Boiling point, °C -112
Molar mass 47.998 g/mol
Solubility in water 0.105 g / 100ml (0 °C)
Specific gravity 1.658 higher than air
Density 2.144 g/l (0 °C), gas

12 2.2.1 Chemistry of oxidation
The term oxidation corresponds to the transfer of one or more electrons from an
electron donor (reductant) to an electron acceptor (oxidant). Both the oxidant and
the reductant are chemically transformed. Species with an odd number of valence
electrons are produced as well, which are known as radicals. Radicals are highly
unstable and highly reactive because one of their electrons is unpaired which is
represented by a dot next to the chemical structure, for example the hydroxyl
radical (•OH). Radicals that were produced in oxidation reactions tend to react
further between radical oxidants and other organic and inorganic reactants until
thermodynamically stable compounds are formed. The oxidation potential
measures the ability of an oxidant to initiate reactions. The end products of
complete oxidation (mineralization) of organic compounds such as MTBE or 1.4
dioxane are carbon dioxide (CO2) and water (H2O). (Beltran 2004.)
2.2.2 Oxidation potential
The oxidation potential, expressed in electron volts, is an indicator of how strongly
a compound is potentially forming a oxidation reaction with other molecules. The
higher the Eo value, the more reactive the species, but also the more difficult the
handling of such reactions will become. The following table presents the oxidation
potential of the most oxidative species known. (Perry 1997.)
Fluorine has the highest oxidation potential, but for commercial applications, this
compound is not suitable due to the high reactivity. The next available compound
is the hydroxyl radical, which is produced during the reaction of ozone and UV.
Ozone alone has a lower potential to oxidize species, but it is still relatively high.

13 TABLE 5. Standard redox potential of some oxidant species (Perry 1997)
Oxidant species Eo, Volts Relative potential to ozone
Fluorine 3.06 1.48
Hydroxyl radical 2.80 1.35
Atomic oxygen 2.42 1.17
Ozone 2.07 1.00
Hydrogen peroxide 1.77 0.85
Chlorine dioxide 1.50 0.72
Bromine 1.09 0.53
Oxygen 0.40 0.19

14
2.2.3 Applications of ozone
Ozone has a wide range of commercial applications. Due to its environmental
friendly properties to decompose into oxygen, ozone is widely used for water
purifications, as presented in the following table.
TABLE 6. Typical industrial applications of ozone (Wedeco 2008)
Application Usage
Drinking water Improvement of flocculation
Decoloration, taste, odor improvement
Iron / manganese elimination
Disinfection
TOC-elimination
Elimination of persistent substances
Desodoration Oxidation of H2S
Ozonolysis
Synthesis
Synthesis of new products
Modification of synthesis
Surface treatment
Laminating / coating
Bleaching
Pulp
Kaolin
Wastewater treatment
Elimination of COD
Elimination of surfactants
Elimination of phenols
Decoloration
Sludge treatment
Elimination of AOX
Elimination of endocrine and/or persistent substances
Process water
Cooling water (in power plants)
Swimming pools
Rinsing water in beverage industry
Product polishing
Stabilization of still water
Disinfection of food (salad, fish)
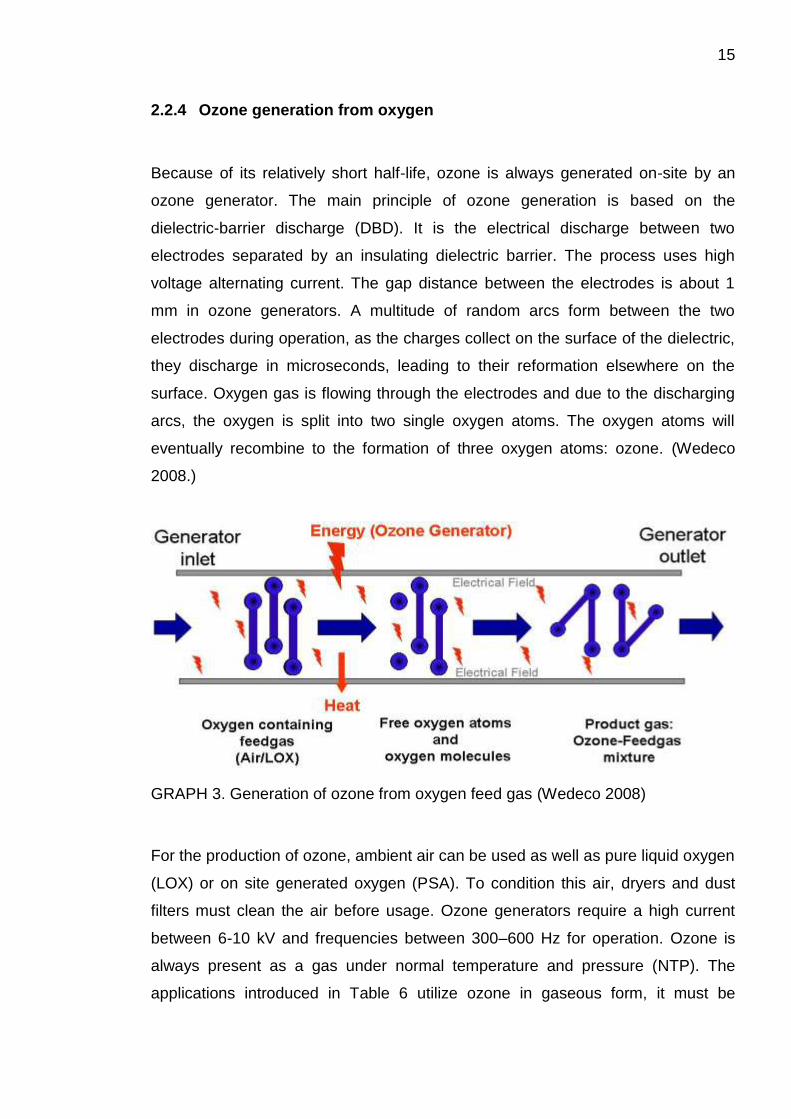
15 2.2.4 Ozone generation from oxygen
Because of its relatively short half-life, ozone is always generated on-site by an
ozone generator. The main principle of ozone generation is based on the
dielectric-barrier discharge (DBD). It is the electrical discharge between two
electrodes separated by an insulating dielectric barrier. The process uses high
voltage alternating current. The gap distance between the electrodes is about 1
mm in ozone generators. A multitude of random arcs form between the two
electrodes during operation, as the charges collect on the surface of the dielectric,
they discharge in microseconds, leading to their reformation elsewhere on the
surface. Oxygen gas is flowing through the electrodes and due to the discharging
arcs, the oxygen is split into two single oxygen atoms. The oxygen atoms will
eventually recombine to the formation of three oxygen atoms: ozone. (Wedeco
2008.)
GRAPH 3. Generation of ozone from oxygen feed gas (Wedeco 2008)
For the production of ozone, ambient air can be used as well as pure liquid oxygen
(LOX) or on site generated oxygen (PSA). To condition this air, dryers and dust
filters must clean the air before usage. Ozone generators require a high current
between 6-10 kV and frequencies between 300–600 Hz for operation. Ozone is
always present as a gas under normal temperature and pressure (NTP). The
applications introduced in Table 6 utilize ozone in gaseous form, it must be

16 indicated though, that ozone will never be available in pure form. The technical
generation of ozone from oxygen is limited to the following concentrations of
ozone in oxygen gas. Table 7 indicates the ozone/oxygen ratio for various
concentrations of ozone, which were utilized during the performance of this thesis.
(Wedeco 2008.)
TABLE 7. Ozone conversion table (Perry 1997)
Ozone concentration g/m³ (NTP)
O3 to O2
Wt%
O3 to O2
Vol%
kg Oxygen /
kg Ozone
m³ Oxygen /
kg Ozone
10 0.6 0.4 143.2 100
20 1.3 0.9 71.7 50
50 3.4 2.3 28.9 20
100 6.8 4.6 14.6 10
150 10 6.9 9.8 6.9
200 13 9.2 7.4 5.2
The oxygen/ozone ratio shows the limitations of ozone generation. A typical ozone
generator cannot produce a higher ozone ratio due to physical limitations. The
highest utilized ozone concentration during the experiments was 200 g/Nm³; which
would correspond for about 9% of ozone by volume. The largest part of the utilized
gas was therefore still oxygen.
Graph 4 presents a schematic view of a large ozone water purification unit. (Not
AOP). The gas supply can consist of liquid oxygen, air or on-site oxygen
generation through pressure swing adsorption (PSA). A chiller unit is required for
cooling of the ozone generator. The off-gas ozone must be converted back into
oxygen before released into the environment; this is done by a catalytic ozone
destructor (COD). Ozone is generated from oxygen, based on the dielectric barrier
discharge phenomenon, inside the ozone electrodes.

17
GRAPH 4. Ozone electrode and ozone purification system (Wedeco 2008)
2.2.5 Reaction properties
Due to its electronic configuration, ozone has different reactions in water. The
three main categories are: Oxidation-reduction, dipolar cycloaddition and
electrophilic substitution reaction. (Beltran 2004.)
In some cases, free radicals are formed from these reactions. These free radicals
propagate themselves through mechanisms of elementary steps to yield hydroxyl
radicals, which are extremely reactive with any organic matter present in water.
For this reason, ozone reactions can be divided into direct and indirect reactions.
Direct reactions undergo with any other type of chemical species, like molecular
products and free radicals. Indirect reactions are those between the hydroxyl
radical, formed from the decomposition of ozone or from other direct ozone
reactions, with compounds present in water. The direct ozone reaction is the
initiation step towards the indirect reaction. (Beltran 2004.)
Redox reactions are characterized by the transfer of electrons from one species
(redactor) to another one (oxidant). The oxidizing or reducing character of any
18 chemical species is given by the standard redox potential. Ozone has one of the
highest redox potentials, lower only than those of fluorine atom, oxygen atom and
hydroxyl radical. Because of its high standard redox potential, the ozone molecule
has a high capacity to react with numerous compounds. (Beltran 2004.)
Addition reactions are those reactions resulting from the combination of two
molecules to yield a third one. One of the molecules usually has atoms sharing
more than two electrons, unsaturated compounds with carbon double bonds, and
the other molecule has an electrophilic character. (Beltran 2004.)
In electrophilic substitution reactions one electrophilic agent (ozone) attacks one
nucleophilic position of the organic molecule (e.g. an aromatic compound),
resulting in the substitution of one part (e.g. atom, functional group) of the
molecule. This type of reaction is the base of the ozonation of aromatic
compounds. (Beltran 2004.)
Indirect reactions of ozone are due to the action of free radical species resulting
from the decomposition of ozone in water. The free radical species are formed in
the initiation or propagation reactions of the mechanisms of advanced oxidation
processes. In the ozone decomposition mechanisms, the hydroxyl radical is the
main responsible species in the indirect reactions. The reactions of ozone with the
hydroxyl radical can be considered the main initiation reactions of the ozone
decomposition mechanism in water. (Beltran 2004.)
Other initiation reactions develop when other agents, such as UV radiation are
present. The direct photolysis of ozone that yields hydrogen peroxide and then
free radicals, or the ozone adsorption and decomposition are also examples of
initiation reactions. There are also other reactions that lead to the decomposition
or stabilization of ozone in water. These substances are initiators, inhibitors and
promoters of the decomposition of ozone. The initiators are the substances that
directly react with the ozone to yield the superoxide ion radical, such as the ionic
form of hydrogen peroxide. The superoxide ion radical is important for propagating
free radical species, because it reacts immediately with ozone to yield the hydroxyl
19 radical. Promoters are those substances which propagate the radical chain to yield
the free radical through their reaction with the hydroxyl radical. Hydrogen peroxide
plays an important part in this role, it is in fact the initiating agent, but it also acts
as a promoter of ozone decomposition. (Beltran 2004.)
2.2.6 Scavengers of the hydroxyl radical
Inhibitors are also called hydroxyl-free radical scavengers because their presence
limits or inhibits the action of these radicals on the target contaminants. The
presence of carbonates for example, reduces the efficiency of ozonation to oxidize
contaminants in water. Theses carbonates, which also account for the hardness of
water, limit the degradation of the desired pollutant significantly. (Beltran 2004.)
Hydrogen carbonate: HCO3- + ●OH → CO3
- + H2O
Carbonate: CO32- + ●OH → CO3
- + HO-
Another problem is the presence of bromide ion in ozonated water. Ozone readily
oxidizes bromide ion to yield bromate ion, which is considered a highly toxic
pollutant. Formation of bromate is highly dependent on the presence of other
substances that consume ozone, for instance hydrogen peroxide. The presence of
natural organic matter (NOM) is another factor which can affect the decomposition
of ozone; it can act as promoter or inhibitor. A fraction of hydroxyl radical yields the
superoxide ion radical during reaction with NOM. Therefore, a fraction of NOM is a
promoter of the ozone decomposition. (Beltran 2004.)
2.2.7 Ozone decomposition
Once dissolved in water, ozone is unstable and decomposes. This can be
considered an advantage, but also a drawback. When ozone decomposes, free
radicals are generated and oxidation of compounds occurs. But due to its
instability, ozone cannot be used for a final disinfectant of water. There are two

20 ozone decomposition periods when treating natural waters. The first one, called
fast ozone demand, lasts from a few seconds to 1-2 minutes and is due to the
presence of substances that readily react with ozone through direct reactions.
Once these substances have disappeared or their concentrations decrease, the
longer ozone decomposition starts. During this period, instantaneous or very fast
consumption takes place. During the second or long ozone decomposition, ozone
slowly decomposes until all dissolved ozone has decomposed. (Beltran 2004.)
2.2.8 Diffusion into water
In a gas-liquid reacting system, diffusion convection and chemical reactions
proceed simultaneously. In general, when gas and liquid phases are in contact,
the components of one phase can transfer to the other phase to reach equilibrium.
If component A of a gas phase is transferred to the liquid phase, the rate of mass
transfer or absorption rate of A is:
NA= kG (PAb – Pi) = kL (CA – CAb)
kG = mass transfer coefficient for gas phase
kL = mass transfer coefficient for liquid phase
PAb = Partial pressure of A in bulk gas
Pi = Partial pressure of A at the interface
CA = Concentration of A at the interface
CAb = Concentration of A in the bulk of liquid
(Beltran 2004.)
The transfer rate is dependent on the physical properties of gas and liquid, the
difference in concentration across the surface and turbulence. (Beltran 2004.)
When two phases (gas and water) are in contact, the main resistance to mass
transfer is the layer of thickness close to the interface. This so called film layer
consists of two films in a gas-liquid system, one for each phase. In most situations
the gas is bubbled into the liquid phase, thus the interfacial surface is due to the

21 external surface of bubbles. Ozone solubility is a fundamental parameter in the
absorption rate. Ozone-water systems are characterized by a low concentration of
dissolved ozone, ambient pressure and temperature. In order to achieve good
degradation of pollutants in water, a high ozone transfer into water phase is
desired. (Beltran 2004.)
This absorption process is dependent on pressure and temperature according to
Henry’s law:
P = He * x
P = partial pressure of gas above the solution (in atm)
x = mole fraction of gas in solution
He = Henry’s law constant which accounts pressure and temperature dependency
Henry’s law can be described at a constant temperature. The amount of a given
gas dissolved in a given type and volume of liquid is directly proportional to the
partial pressure of that gas in equilibrium with that liquid. However the Bunsen
adsorption coefficient is expressed as a volume of gas at NTP which is dissolved
at equilibrium by a unit volume of liquid at a given temperature, when the partial
pressure of the gas is the unit atmosphere. The Bunsen coefficient has no
dimension. In the coefficient, the gas absorption rate into water decreases with
increasing temperature. (Beltran 2004.)
For efficient ozone transfer, it is therefore important to achieve low water
temperatures. In practice, this is not always applicable, but it is important to
monitor the temperature of water during application of ozone. In real life
applications, less gas can be absorbed into a liquid than stated in Henry’s law.
This is caused by circumstances which the absorption factor takes into
consideration.
Af = (Vw / Vg) * α * P
22 The absorption factor determines the amount of gas absorbed by the solving liquid
under known conditions.
Vw= Volume of solving liquid
Vg= Volume of gas
α= Bunsen coefficient
P= Total pressure
(Beltran 2004.)
The efficiency of dissolving ozone into water, which is usually carried out at
conditions close to NTP, is not ideal. A higher operating pressure would allow a
higher gas to liquid ratio, but this process is virtually impossible during continuous
operation of the AOP system. (Beltran 2004.)
As can be inferred from the absorption factor, the solubility of ozone gas is
depending on the concentration in gas and partial pressure and temperature, pH
and ion concentration in the solution. The solubility can theoretically be enhanced
by increasing the ozone concentration in the air (oxygen), increasing air pressure
(oxygen), decreasing the water temperature, decreasing the amount of solutes or
decreasing the pH. (Beltran 2004.)
In practice, these values are considered as limiting factors, because the only
economical reasonable variable is the pH factor and ozone concentration in air,
while other factors remain important to be monitored during operation.
2.3 UV radiation
2.3.1 Introduction to ultraviolet radiation
Ultraviolet radiation is energy of electromagnetic waves. Electromagnetic radiation
is classified according to the wavelength or frequency of the light wave. This
radiation includes radio waves, microwaves, terahertz radiation, infrared radiation,

23 visible light, ultraviolet (UV) radiation, X-rays and gamma rays. Of these, radio
waves have the longest wavelengths and gamma rays the shortest. Ultraviolet
radiation is defined as that portion of the electromagnetic spectrum between x rays
and visible light, between 40 and 400 nm. (Bolton 2008.)
The ultraviolet radiation spectrum is divided into UV-A (320-400 nm), UV-B (290-
320 nm), UV-C (220-290 nm), Far UV (190-220 nm) and Vacuum UV (40-190 nm),
whereas the UV-C radiation spectrum is the important frequency range for the
technical usage of light. Ultraviolet light, which travels in “packets” of energy
known as photons, can exert a variety of beneficial or deleterious effects on plants,
animals and materials in the biosphere, including processes responsible for driving
atmospheric chemistry. Other photochemical processes, utilizing the absorption of
light (either visible or ultraviolet), include photosynthesis in plants, sun
tanning/burning, snow blindness, fading of textiles and in contaminated waters the
photo degradation of organic pollutants by advanced oxidation processes. UV
radiation is also commonly used for disinfection of water or surfaces from micro
organism. (Bolton 2008.)

24 2.3.2 UV spectrum
Graph 5 presents the wavelength spectrum of electromagnetic radiation. Light is
the same form of electromagnetic radiation as other non visible wavelengths, yet
with a different wavelength. The human eye will interpret wavelengths between
400 and 700 nm as visible light. (Zeman 2008.)
GRAPH 5. The spectrum of electromagnetic radiation (Treiman 2008, courtesy of
USRA Lunar and Planetary Institute)
Visible light only accounts for a small fraction of the wavelength range. The
ultraviolet spectrum has a shorter wavelength. Therefore a shorter frequency and
carries more energy. The shorter the wavelength, the more damage such radiation
can cause to human skin. Gamma rays penetrate deep into the human cell tissue
and cause severe damage to cells. (Zeman 2008.)

25
GRAPH 6. Wavelengths between 100 and 780 nm (Wedeco 2008, courtesy of ITT
Wedeco Corporation)
Electromagnetic wavelengths between 100 and 780 nm can be considered as
light. The ultraviolet spectrum is further divided into fractions, where the UV-C
spectrum causes most damage to human skin. The low pressure lamps used in
water disinfection have their maximum power output at 254 nm. (Wedeco 2008.)
2.3.3 Effect on micro organism
Certain electromagnetic wavelengths are mutagenic to bacteria, viruses, other
micro-organisms and even humans. UVC is almost never observed in nature
because it is absorbed completely in the atmosphere, as are far UV and vacuum
UV. The wavelength of 254 nm will break the molecular bonds within micro-
organism DNA, producing thymine dimmers in their DNA and destroying them,
rendering them harmless or prohibiting growth. A similar process can be seen with
the UV-B effect on humans, including sunburn. Micro-organisms have less
protection from UV than humans and cannot survive prolonged exposure to it.
(Infralight 2008.)

26
GRAPH 7.Effects of UV on the DNA of micro organism (NASA 2009, courtesy of
NASA)
Due to the ability of UV-C light to act germicidal to damage the DNA, this
wavelength is commonly used in water purification systems. ITT Wedeco is
specialized into this environmental friendly disinfection technology, and is currently
the world leader in waste and drinking water disinfection systems.
2.3.4 Dose of ultraviolet light
In waste and drinking water applications, a certain dosage of UV light irradiation is
required to achieve a so called 4-log reduction (99.99%) of harmful organism. This
dosage is measured in J/m2, the amount of photons per area. For disinfection of
drinking water this dose usually requires about 400 J/m2. In contrast, the required
dose for AOP applications is usually around 10000 J/m². Certain factors, such as
the water transmission and turbidity, affect the calculation of such doses.
Therefore the UV dose depends greatly on the specific water property.
Furthermore the light intensity is also expressed as the amount of light applied per
volume of water. This value is expressed as watts per cubic meter of water
(W/m3). This value is used to express a cost based calculation value, since the

27 energy demand of the light source is expressed as watts. The utilized UV lamp
during this performance has the power output of 330 W. (Wedeco 2008.)
The energy of light (and any other electromagnetic energy) is given by Planck’s
equation:
hhc /
The intensity of UV light at 254nm is expressed as h
h is Planck’s constant = 6.63 x 10⁻³⁴ J sec
has the unit sec-1, also called “Hertz” or Hz
is the wavelength, expressed in meter (m) or nm
c is the speed of light in (m/s)
The energy of the emitted light is inversely proportional to its wavelength () or
directly proportional to its frequency (Bolton 2008).
2.3.5 Ultraviolet lamps
The most important lamps for UV disinfection and therefore AOP as well are gas
discharge lamps. These usually have two electrodes, one at each end of a tube
containing a gas, which contains metal atoms (mercury). In such lamps, light
emission arises from atoms that have been exited to higher energy states by high
energy electrons emitted from the electrodes. The lamps used in UV disinfection
systems are mercury vapour lamps. In the lamps, electric current that flows
through the ionized hot plasma causes the mercury atoms to be raised to higher
energy states. When exited states return to their ground state, UV light is emitted
with a wavelength inversely proportional to the energy difference between the
exited state and the ground state. The lifetime of the exited mercury atoms is
limited and in microseconds they decay to lower energy levels with the excess
energy emitted as light or heat. The wavelength of the light is determined by the
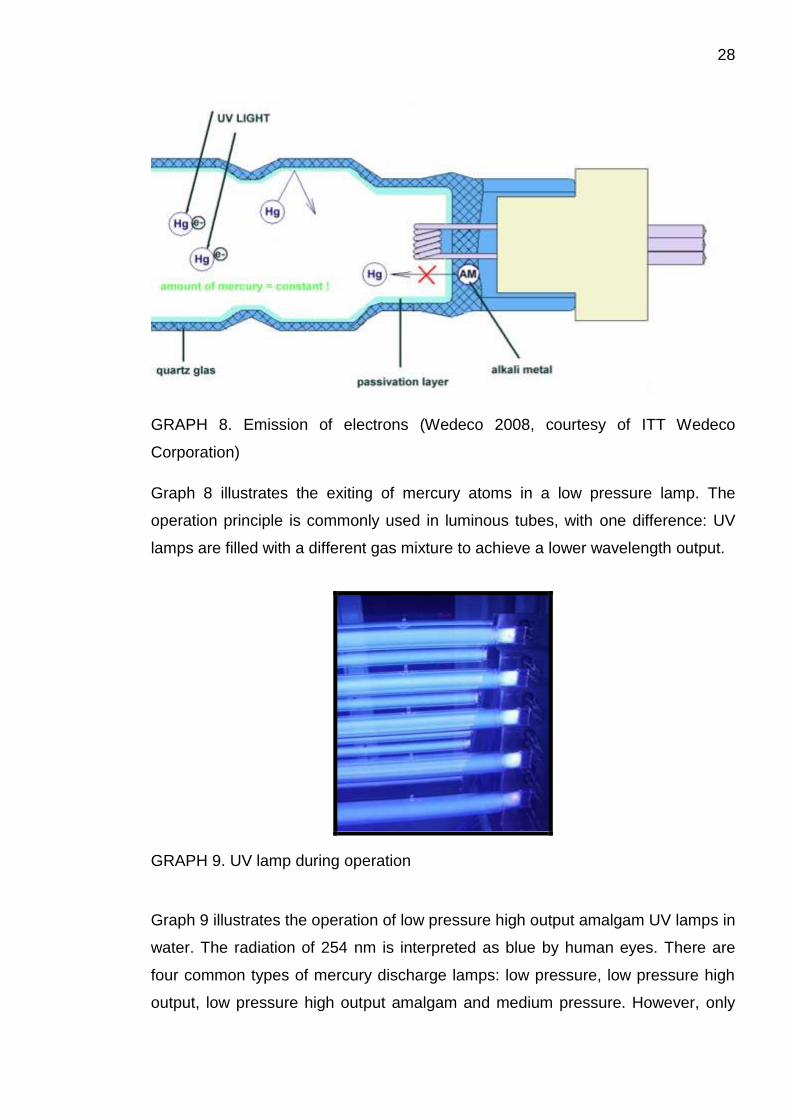
difference in the energy levels. Graph 8 illustrates this process. (Wedeco 2008.)
28
GRAPH 8. Emission of electrons (Wedeco 2008, courtesy of ITT Wedeco
Corporation)
Graph 8 illustrates the exiting of mercury atoms in a low pressure lamp. The
operation principle is commonly used in luminous tubes, with one difference: UV
lamps are filled with a different gas mixture to achieve a lower wavelength output.
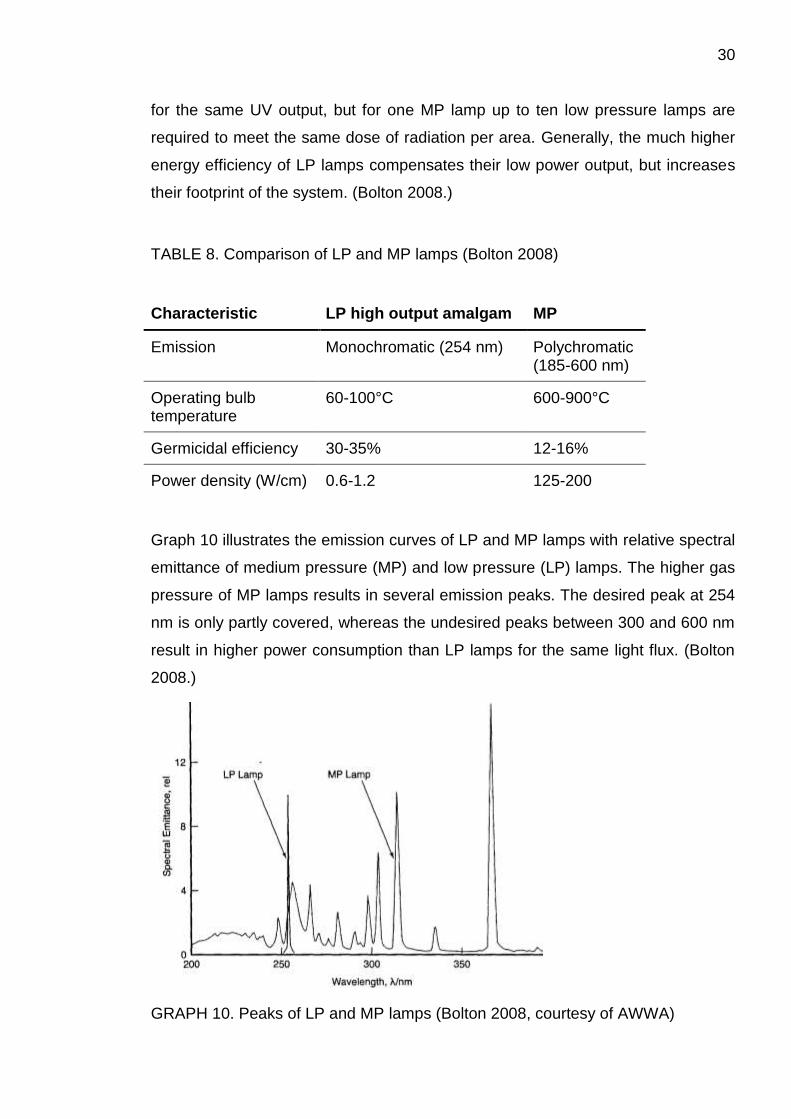
GRAPH 9. UV lamp during operation
Graph 9 illustrates the operation of low pressure high output amalgam UV lamps in
water. The radiation of 254 nm is interpreted as blue by human eyes. There are
four common types of mercury discharge lamps: low pressure, low pressure high
output, low pressure high output amalgam and medium pressure. However, only

29 the two most competing systems, low pressure high output amalgam and medium
pressure are presented here.
2.3.6 Low pressure high output amalgam lamps
Low pressure lamps emit only in narrow lines with no emission between the lines.
Graph 10 will show the wavelengths and relative emittances for the lines of a low
pressure mercury vapour lamp. As can be seen from the graph, the emission
spectrum is rather concentrated to 254 nm. The inner surface of the lamp
envelope can be coated with various types of phosphors, which absorb the 245
nm radiation and emit longer wavelengths. This is the basis of the popular
fluorescent lamp. The low pressure high output amalgam lamp is a modified
version with a 2 to 3 times higher output than a regular low pressure lamp. The
lamps have heavy electrodes and contain no free mercury. A solid amalgam (a
compound of mercury and another element, such as indium or gallium) spot is
placed on the inner wall of the lamp. This spot serves to control the mercury
vapour pressure. The XLR 30 low pressure high output amalgam lamp used in the
experiments has a length of 143 cm and was capable of 330 W output energy.
(Bolton 2008.)
2.3.7 Medium pressure lamps
The emission lines of a mercury lamp are only sharp when the pressure of the gas
is low (<100 Pa). If the pressure is increased, the lamp can carry much more
power, but the increased collision rate from other gas molecules causes the
emission lines to broaden. For the same length of lamp, an MP lamp (pressure of
100 KPa) can carry up to 30000 W instead of 330 W. Medium pressure lamps
operate very hot. Thus they are less efficient in comparison to low pressure lamps.
The emission spectrum is polychromatic, with several emission peaks between
186 and 600 nm. The operating bulb temperature is ranging between 600 and
900°C. Medium pressure lamps require several times more energy than LP lamps
30 for the same UV output, but for one MP lamp up to ten low pressure lamps are
required to meet the same dose of radiation per area. Generally, the much higher
energy efficiency of LP lamps compensates their low power output, but increases
their footprint of the system. (Bolton 2008.)
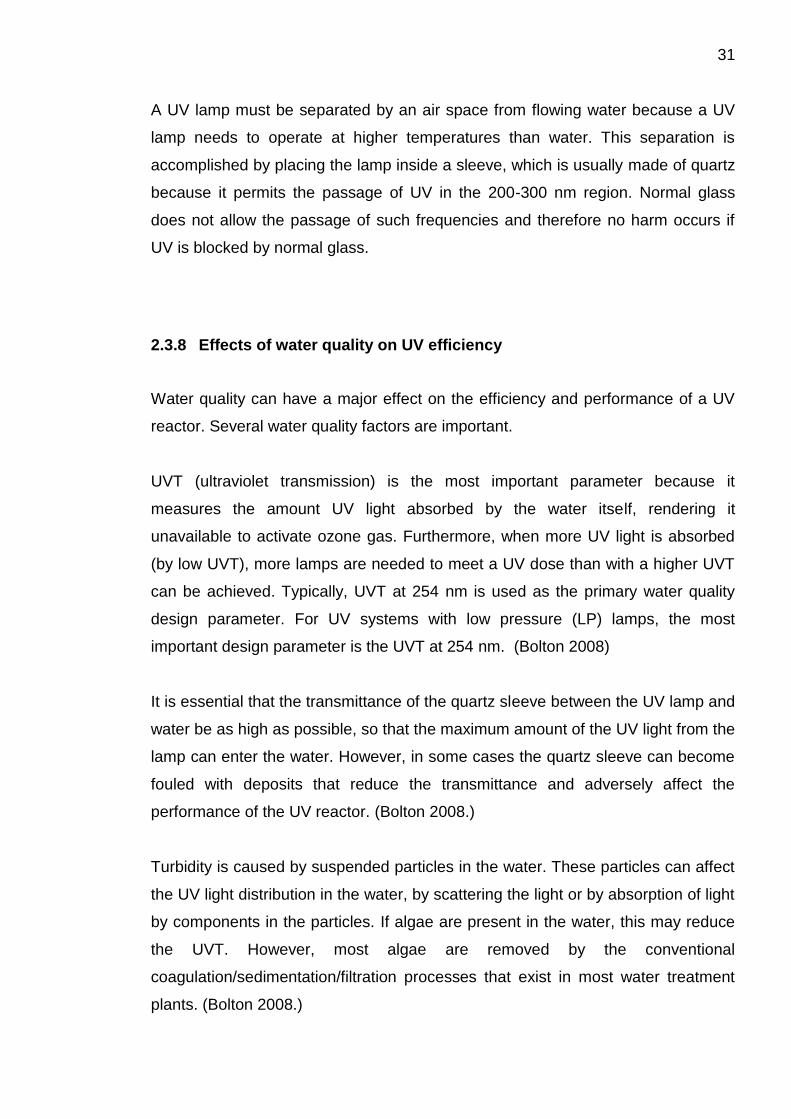
TABLE 8. Comparison of LP and MP lamps (Bolton 2008)
Characteristic LP high output amalgam MP
Emission Monochromatic (254 nm) Polychromatic (185-600 nm)
Operating bulb temperature
60-100°C 600-900°C
Germicidal efficiency 30-35% 12-16%
Power density (W/cm) 0.6-1.2 125-200
Graph 10 illustrates the emission curves of LP and MP lamps with relative spectral
emittance of medium pressure (MP) and low pressure (LP) lamps. The higher gas
pressure of MP lamps results in several emission peaks. The desired peak at 254
nm is only partly covered, whereas the undesired peaks between 300 and 600 nm
result in higher power consumption than LP lamps for the same light flux. (Bolton
2008.)
GRAPH 10. Peaks of LP and MP lamps (Bolton 2008, courtesy of AWWA)
31 A UV lamp must be separated by an air space from flowing water because a UV
lamp needs to operate at higher temperatures than water. This separation is
accomplished by placing the lamp inside a sleeve, which is usually made of quartz
because it permits the passage of UV in the 200-300 nm region. Normal glass
does not allow the passage of such frequencies and therefore no harm occurs if
UV is blocked by normal glass.
2.3.8 Effects of water quality on UV efficiency
Water quality can have a major effect on the efficiency and performance of a UV
reactor. Several water quality factors are important.
UVT (ultraviolet transmission) is the most important parameter because it
measures the amount UV light absorbed by the water itself, rendering it
unavailable to activate ozone gas. Furthermore, when more UV light is absorbed
(by low UVT), more lamps are needed to meet a UV dose than with a higher UVT
can be achieved. Typically, UVT at 254 nm is used as the primary water quality
design parameter. For UV systems with low pressure (LP) lamps, the most
important design parameter is the UVT at 254 nm. (Bolton 2008)
It is essential that the transmittance of the quartz sleeve between the UV lamp and
water be as high as possible, so that the maximum amount of the UV light from the
lamp can enter the water. However, in some cases the quartz sleeve can become
fouled with deposits that reduce the transmittance and adversely affect the
performance of the UV reactor. (Bolton 2008.)
Turbidity is caused by suspended particles in the water. These particles can affect
the UV light distribution in the water, by scattering the light or by absorption of light
by components in the particles. If algae are present in the water, this may reduce
the UVT. However, most algae are removed by the conventional
coagulation/sedimentation/filtration processes that exist in most water treatment
plants. (Bolton 2008.)

32 2.4 Advanced oxidation processes
The elimination of organic contaminants by advanced oxidation processes is a
destructive process. Typically a chemical or photochemical oxidant is used to
destroy a contaminant compound directly or indirectly through reaction
intermediates. In the case of AOP, this oxidant is either ozone or the hydroxyl
radical or ultraviolet radiation. Since the contaminant is physically broken up into
its elemental components, the process depends on the efficient transfer of energy
to achieve contaminant destruction. If such a process is not 100% efficient,
remnants of the contaminant may still remain. These remnants may produce
adverse health effects or reform the parent compound.
The hydroxyl radical has a higher oxidation potential and reacts immediately with
nearly all organic compounds. This enhanced reaction leads to better treatment
results regarding advanced degradation and faster kinetics (shorter contact times).
Theoretically, there are several technologies that exist for advanced oxidation, see
table 9.
TABLE 9. Advanced oxidation technologies
AOP combinations
Hydrogen peroxide + ultraviolet light
Hydrogen peroxide + ozone
Ultraviolet light + ozone
Ultraviolet light + titanium dioxide
The photo-fenton process
Oxidation in combination with electrolysis
Various catalytic processes (oxidant chemical + catalyst)
Although there are a number of processes which are defined as advanced
oxidation processes, the most widely used definition includes techniques that are
based on ozone, hydrogen peroxide and ultraviolet light. In the case of ultraviolet
33 light and ozone, an ozonised gas stream, produced by a dielectric barrier
discharge, is introduced into the aqueous medium to be treated. The ultraviolet
light radiation has a wavelength of 254 nm and is readily absorbed by ozone,
resulting in the formation of highly reactive hydroxyl radicals. These short-lived
radicals are more powerful oxidizing agents than ozone and hydrogen peroxide
alone and are capable of converting virtually all organic compounds to carbon
dioxide, water and similar species. (Sakaji 2002.)
There are a number of alternative reactions that can take place and it is known
that high concentrations of both ozone and hydrogen peroxide need to be avoided
as hydroxyl radicals are not selective in their reactivity and can react with excess
oxidants. The oxidation rates achieved with hydroxyl radicals are much higher than
those attainable from conventional oxidants such as ozone. In some cases,
reaction rates achieved using hydroxyl radicals are 106 to 109 times higher than
the rates achieved using ozone alone. (Sakaji 2002.)
2.4.1 Ozone destruction by UV
The pilot plant in this work was designed for the purification of water in which an
ultraviolet lamp simultaneously irradiates the water and ozone mixture, combining
the catalytic effect of ultraviolet radiation and the disinfecting and oxidizing effects
of ozone on bacteria, viruses and chemical compounds in the water. Photolysis
(direct absorption of UV) and photo-initiated oxidation (activation of ozone by UV
to form oxidative hydroxyl radicals) have great potential for the destruction of a
wide range of organic contaminants in water. (Taghipour 2004.)
During the advanced oxidation process of ozone with UV, ozone concentrations
are expected to decrease inside the reactor. This is due to the ozone
decomposition by UV radiation. The concentration of •OH is higher near the UV
lamp, where the UV fluence rate is higher. This is expected as •OH formation
depends on the fluence rate. The concentration of micro pollutants, such as
atrazine or 1.4 dioxane, would be reduced along the reactor due to direct

34 photolysis and oxidation with •OH radicals. The water pollutant would show lower
concentration near the UV lamp, where higher UV fluence rate and •OH radicals
are present. It is evident that the pollutant decomposition is influenced by both
reactor hydrodynamics and fluence rate. (Taghipour 2004.)
2.4.2 Ozone photo dissociation
The energy of an absorbed photon is strong enough to break molecular bonds and
therefore capable of molecular fragments. One example of photo dissociation can
be found in the stratospheric ozone. Ozone is produced in the stratosphere from
molecular oxygen through the following pair of reactions:
O2 + hν → O + O and O + O2 → O3 where hν represents the energy of a photon of
ultraviolet light with a wavelength less than 260 nm. (Taghipour 2004.)
Ozone is also dissociated by short-wavelength ultraviolet light (200-300 nm)
through the reaction: O3 + hν → O2 + O. The oxygen atom formed from this
reaction may recombine with molecular oxygen to regenerate ozone, thereby
completing the ozone cycle. The ozone layer in the stratosphere absorbs the UV-C
radiation and “filters” the sunlight radiation before it reaches the earth’s surface.
The same reaction is used in the advanced oxidation processes, with the
difference that the UV light is used to break the ozone into radical fragments.
(Taghipour 2004.)
The utilized wavelength for this process is 254 nm, because the highest ozone
absorption rate is achieved at exactly this point. The molar extinction coefficient ε,
which describes the amount of absorbed photons by the ozone molecule, is 3300
M-1 cm-1. The higher the extinction coefficient, the easier it is for ozone to absorb
the UV light. The following graph presents the absorption rate of ozone for
different wavelengths of light. The highest absorption rate is achieved at exactly
254 nm. This benefits the selection of low pressure lamps in contrast to medium
pressure lamps which would work less efficient. (Kenshi 2001.)

35
GRAPH 11. The molar extinction coefficient of ozone (Kenshi 2001)
2.4.3 Hydroxyl radical formation
The formation of hydroxyl radicals is based on a multi step mechanism. The
introduced ozone is first broken up into one oxygen (O2) molecule and one oxygen
atom (O). This reaction is very efficient at the wavelength of 254 nm with a
quantum yield of almost Ф=1. The quantum yield is the number of destroyed
molecules divided by the number of photons absorbed by the system. That means
almost all photons are absorbed by the ozone. The oxygen atom reacts with water
to form hydrogen peroxide. Hydrogen peroxide will partly be destructed directly by
the UV irradiation into hydroxyl radicals, but due to the low extinction rate of
hydrogen peroxide, most of the formed liquid will react further with ozone and HO2-
which can be seen in the following equations. There is the significant difference of
dissolved ozone and gaseous ozone in water. Ideally, all ozone should dissolve
when introduced into the water phase. (Beltran 2004.)

36 The following reactions indicate the properties of dissolved ozone in water and
hydroxyl radical formation with hydrogen peroxide formation. (Beltran 2004.)
O3 (aqueous) + h → 2 •OH
•OH + •OH → H2O2
H2O2 ↔ HO2- + H+
HO2- + O3 → O3
- + HO2
HO2 + h → •OH + O
O + H2O → 2 OH.
H2O2 + •OH → H2O + HO2
H2O2 + h → 2 •OH
In contrast, the following reactions present the reactions of gaseous ozone in
water. However these reactions can only occur on the film layer of gas and water.
(Beltran 2004.)
O3 (gas)+ h → O2 + O
O + O3 → 2 O2
O + H2O → 2 •OH
O + H2O → H2O2
O3 + H2O2 → O2 + •OH + HO2-
H2O2 ↔ H+ + HO2-
O3 + HO2- → •OH + O2
- + O2
O3 + O2- → O3
- + O2
O3-+ H2O → •OH + HO- + O2
•OH + •OH → H2O2
H2O2 + •OH → HO2 + H2O
H2O2 + h → 2•OH
HO2 + h → •OH + O
There are further ways for the generation of hydroxyl radicals which are dependent
on the generated intermediates such as excited oxygen atoms (O), hydrogen
peroxide or the conjugated base of hydrogen peroxide (HO2-). (Beltran 2004.)

37 Graph 12 shows the four main pathways for the generation of hydroxyl radicals in
advanced oxidation processes.
ozone (O3)
• OH radical
UV - h • , = 254 nm , = 19 M-1
cm-1
Water compounds
OH- , Fe , TOC
Initiation
Promotion
O1
2 • OH H2O2
H2O2 HO2-
UV h • = 254 nm,
= 3.300 M-1 cm-1
H2O2
+ h •
O3 + HO2-
O3
+ HO2-
O1
+H2O
+ H2O2
a)a) b)b) c)c)
+ H2O244
332211
GRAPH 12. Hydroxyl radical pathways (Ried 2005)
1. Ozone alone. Typical water compounds such as hydroxyl anions, iron ions or
organic compounds can initiate or promote a decomposition of dissolved ozone
and generate hydroxyl radicals. When using ozone for waste water treatment,
there is a possibility of generating the hydroxyl radical without the addition of UV or
H2O2. However, it is difficult to predict the hydroxyl radical formation in this
pathway as it is highly specific to water chemistry and the reaction kinetics of the
system. It is unlikely that one would use ozone alone as an advanced oxidation
process for water, but it is important to note that the impact of ozone alone may
achieve the desired result. (Ried 2005.)
2. Ozone in combination with UV. Different oxidized species will be generated
during the UV radiation of ozone molecules in water. Depending on the generated
intermediates, e.g. excited oxygen atoms (O), hydrogen peroxide or the
conjugated base of hydrogen peroxide (HO2-), there are different further pathways
(a, b, c in the graph) for hydroxyl radical generation. (Ried 2005.)

38 3. Ozone in combination with hydrogen peroxide. In the presence of hydrogen
peroxide, ozone reacts with the conjugated base of hydrogen peroxide (HO2-) to
form hydroxyl radicals. (Ried 2005.)
4. Ultraviolet light in combination with hydrogen peroxide. The UV radiation of
H2O2 leads directly to the formation of hydroxyl radicals. From the stoichiometric
yield (1 mol H2O2 → 2 mol •OH radicals) this process is theoretically the most
efficient, but the molar extinction coefficient for H2O2 (at 254 nm) is only 19 mol-
1cm-1. This means that this process is highly dependent on the UV transmittance,
when the UVT decreases, the low coefficient results in lower hydroxyl radical
yields. For a given UV radiation this low coefficient and low radical yield can be 20
times less than the ozone + UV process. It is possible to work with wavelengths in
the range of 180 to 250 nm to improve the molar extinction coefficient. (Ried
2005.)
Since low pressure lamps have a 99% output at 254 nm, a polychromatic, medium
pressure (MP) lamp may be more efficient at converting H2O2 to the •OH radical.
The energy input will be significantly increased in this case due to the use of MP
lamps. This may become the limiting factor in comparison to other AOP. In
addition, the depth of penetration of lower wavelengths (180–200 nm) is very low
so the positive effect on the extinction coefficient at this lower wavelength is highly
dependent on UVT. (Ried 2005.)
2.4.4 Comparison of ozone to hydrogen peroxide
While the production of ozone is relatively more expensive than hydrogen
peroxide, one major advantage is due to the photochemical properties of ozone.
The molar absorption coefficient at 254 nm is much higher for ozone than for
hydrogen peroxide with 3300 M-1cm-1 in comparison to 19 M-1cm-1, respectively.
Therefore a high efficiency of ozone absorption can be achieved at 254 nm, in
comparison to the UV-hydrogen peroxide AOP. The problems of ultraviolet - ozone
based systems are the high operating costs for both the ozone generation and UV
39 light radiation. A high intensity of UV flux is required for ozone to break. While this
is also the case in UV-hydrogen peroxide AOP, the capital costs are lower due to
the easier treatment train. The only energy consumed in these systems is the UV
light demanded to break the liquid hydrogen peroxide. In comparison, ozone-UV
AOP require the UV light unit, but also the ozone generation unit, which will cause
high initial costs and therefore a larger treatment unit in general. (Ijpelaar 2007.)
2.4.5 Low pressure and medium pressure lamp differences
Low pressure and medium pressure lamps are both used for the “destruction” of
hydrogen peroxide by UV light. The wavelength of 254 nm, which is used in LP
lamps, is excellent for H2O2 irradiation compared to the spectrum of MP lamps.
The contribution of the 254 nm emission of a typical MP lamp to the total emission
is 5-10%. For a LP lamp this is >90%. At the same input level of UV dose, LP
lamps perform comparable in high water quality or better in low water quality
regarding the fraction of light absorbed by H2O2. (Ijpelaar 2007.)
Due to the low molar extinction coefficient of the UV + H2O2 process, the percent
conversion of H2O2 to the hydroxyl radical is low. One way to overcome this fact is
to dose a higher amount of peroxide into the water. By overdosing, the required
hydroxyl radicals may be produced, but there will also be excess H2O2 in the water
after the UV process. Especially for drinking water, excess H2O2 cannot remain in
the system therefore an absorption process (GAC), quenching process
(chlorination, sodium bisulphite) or catalytic quenching with metal oxides must be
considered downstream of the UV oxidation step. UV + ozone based AOP will also
produce hydrogen peroxide during reaction, but the remaining concentrations of
peroxide are rather low and therefore do not require further removal. (Ijpelaar
2007.)
40 2.4.6 UV photolysis
The pathways mentioned in graph 12 are specifically used for the formation of the
hydroxyl radical, but certain contaminants can be treated without the generation of
radicals. For example, N-nitrosodymethylamine (NDMA) can be destroyed by
direct UV photolysis. UV photolysis takes place when UV light is absorbed by the
target contaminant and causes it to breakdown. In effect, NDMA absorbs UV light
at 228 nm, which results in cleavage of the N-N bond. No hydrogen peroxide is
required with UV photolysis since the hydroxyl radical is not needed. The emitted
photons from the UV lamp are strong enough to break some molecular bonds and
therefore capable of destroying the pollutant. This effect only works for some
pollutants, such as NDMA, while most compounds are somewhat resistant to the
ultraviolet radiation. (Ijpelaar 2007.)
Another example where the hydroxyl radical is not required is the oxidation of
endocrine disrupting compounds (EDCs). Studies have shown that ozone alone
can oxidize most EDCs and achieve removal levels greater than 90%. For
treatment of EDCs in wastewater, UV based AOP systems may also be adversely
affected by the typically low transmission of wastewater, compared to drinking
water, whereas UVT has no impact on ozone oxidation. (Ried 2005.)
2.4.7 Example of ozone destruction through ultraviolet light
(CONFIDENTAIL)
GRAPH 13. Ozone destruction by UV-C light
2.4.8 Applications for AOP
There are several areas where advanced oxidation processes can be
commercially used for the degradation of pollutants from water. Examples include

41 endocrine disrupting compounds, pharmaceuticals, pesticides (e.g. atrazine),
persistent substances, taste and odor causing substances (such as algae during
the summer months), 1.4 dioxane, NDMA (N-nitrosodimethylamine), MTBE
(methyl-tertiary-butyl-ether), chlorinated hydrocarbons (e.g. TCE).
2.4.9 Advantages and disadvantages of AOPs
The advantage of AOPs is the actual treatment technology. AOP is a destruction
process and the final products are only carbon dioxide, water and inert salts. The
process residuals do not need any further treatment. If ozone is utilized, the
oxidant can replace the disinfection properties of chlorine and therefore reduce the
toxic properties of chlorine. Because ozone must be generated on site and used
immediately, no storage area is required for the oxidant. A wide variety of
contaminants and concentrations can be treated.
Some pollutants (e.g. MTBE) can be removed by air stripping, granulated
activated carbon (GAC) adsorption and resin sorption, whereas the actual
destruction of the pollutant would require additional processes. In contrast, AOPs
destroy primary organic contaminants directly in water. Several AOP technologies
involving UV light or ozone would also have the positive side effect of disinfection
capability of the source water. Therefore no further disinfection treatment step
would be required.
The components utilized in AOP (UV light and ozone) have been used by the
water community in commercial water disinfection applications for many years
already. Consequently, even conservative treatment plant operators are already
familiar with these technologies in contrast to hydrogen peroxide, Fenton´s
reaction, TiO2 or other emerging technologies.
42 The disadvantage is that the reaction between organic contaminants and the
hydroxyl radical is fast, but does not directly result in the mineralization of these
contaminants. Instead, organic oxidation by-products are produced which can
further react with hydroxyl radicals for complete mineralization.
Ideally, AOP treatment systems are capable to completely mineralize the organic
contaminants of concern to carbon dioxide and water. In real life applications this
may require high energy and greater chemical doses and can therefore be too
costly in certain applications.
In some cases, the actual pollutant cannot be mineralized completely, and the
remaining substances might cause higher risks of concern than the initial
substance. These oxidation by-products must be fully understood and determined
according to the specific water matrix to be treated. Both organic and inorganic
oxidation by-products can be formed. When ozone is employed in AOP
applications, bromate can be formed from bromide, which is naturally present in
the source water. This will be further discussed in the following section.
The effectiveness of AOPs can be limited through the presence of nitrites, TOC
and other inorganics. This is due to the scavenging of radicals that would
otherwise react with pollutants. Operational costs will increase when
concentrations of these scavengers in source water increase. Contact times and
chemical dosages will also increase to maintain treatment goal. AOPs are hard to
plan due to the sensitivity of operational costs to changing source water.
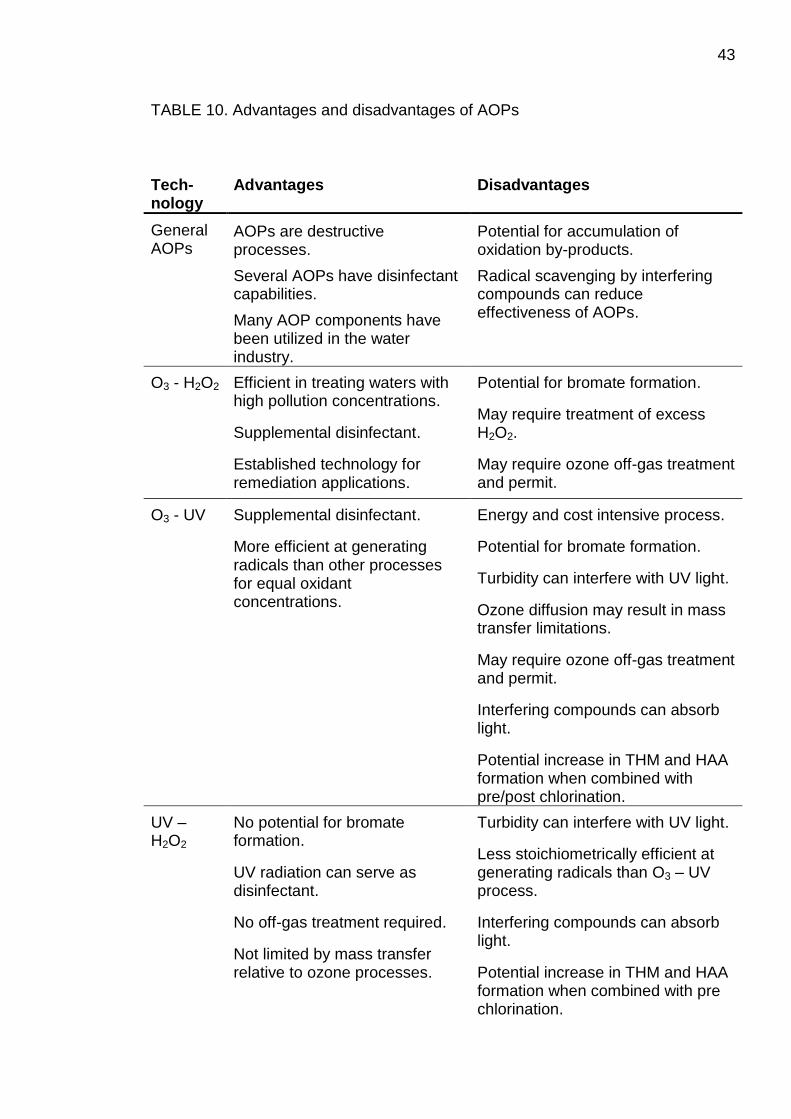
43 TABLE 10. Advantages and disadvantages of AOPs
Tech-nology
Advantages Disadvantages
General AOPs
AOPs are destructive processes.
Several AOPs have disinfectant capabilities.
Many AOP components have been utilized in the water industry.
Potential for accumulation of oxidation by-products.
Radical scavenging by interfering compounds can reduce effectiveness of AOPs.
O3 - H2O2 Efficient in treating waters with high pollution concentrations.
Supplemental disinfectant.
Established technology for remediation applications.
Potential for bromate formation.
May require treatment of excess H2O2.
May require ozone off-gas treatment and permit.
O3 - UV Supplemental disinfectant.
More efficient at generating radicals than other processes for equal oxidant concentrations.
Energy and cost intensive process.
Potential for bromate formation.
Turbidity can interfere with UV light.
Ozone diffusion may result in mass transfer limitations.
May require ozone off-gas treatment and permit.
Interfering compounds can absorb light.
Potential increase in THM and HAA formation when combined with pre/post chlorination.
UV – H2O2
No potential for bromate formation.
UV radiation can serve as disinfectant.
No off-gas treatment required.
Not limited by mass transfer relative to ozone processes.
Turbidity can interfere with UV light.
Less stoichiometrically efficient at generating radicals than O3 – UV process.
Interfering compounds can absorb light.
Potential increase in THM and HAA formation when combined with pre chlorination.
44 2.4.10 Parameters affecting the AOP efficiency
There are several water quality parameters that influence the effectiveness of any
AOP. The most important parameters are the following:
Alkalinity: The hydroxyl radical is non selective and can be exhausted by the
presence of organic or inorganic compounds other than the contaminants of
concern. Both carbonate and bicarbonate will scavenge hydroxyl radicals to create
carbonate radicals which react with other organic or inorganic compounds present,
but at a much slower rate. Source waters with medium to high alkalinities usually
contain carbonate and bicarbonate. High concentrations are likely to react with the
hydroxyl radical and therefore scavenge it, which could otherwise react with micro
pollutants. (Hoigne 1976.)
TOC and NOM: Organic matter present in water will scavenge and therefore limit
the effectiveness of the hydroxyl radical. Total organic carbon (TOC)
measurement include all organic compounds in water; with concentrations usually
ranging from <1 mg/l to >7 mg/l and include pesticides, oil and gasoline traces and
chlorinated compounds. Non organic matter (NOM) accounts macromolecular
organic compounds, which also negatively affect the effectiveness of hydroxyl
radicals. Furthermore there are concerns about potential negative side effects of
UV irradiation in combination with chlorine addition. Such combination might lead
to the formation of harmful by-products. (Steward 1993.)
Nitrates and nitrites adsorb ultraviolet light in the range of 230 to 240 nm and 300
to 310 nm and will decrease the formation of radicals. This effect is especially
affecting the polychromatic spectral curve of medium pressure lamps, which have
several emission peaks in that region. (Steward 1993.)
Phosphates and sulfates are present in low amounts in source waters, but are
slow in reacting with hydroxyl radicals. Therefore their influence can be
diregarded.
45 Turbidity and transmission lower the transmittance of the source water for light.
The efficiency will decrease with increasing turbidity. (Wedeco 2008.)
2.5 Oxidation by-products
Minimizing the risks of disinfection by-products while maintaining adequate
protection from microbial and organic contamination is one of the dilemmas water
utilities and regulating agencies are faced with today. Disinfection by-products are
formed during water treatment when disinfectants and oxidants react with organic
and inorganic matter present in water. Several of these by-products have been
associated with various health effects, including cancer risks. The by-product
concerning the usage of ozone-UV techniques is called bromate. (Bundy 2002.)
TABLE 11. Description of drinking water disinfection by-products
Disinfection by-products
Potential health effects from ingestion of water
MCL
(mg/l)
Bromate Increased risk of cancer. 0.010
Chlorite Anemia, nervous system effects. 1.0
Haloacetic acids Increased risk of cancer. 0.060
Total Trihalomethanes
Liver, kidney or central nervous system problems; increased risk of cancer.
0.080
2.5.1 Bromate
Bromate (BrO3-) is an inorganic disinfection by-product of potable water that is
potentially carcinogenic and mutagenic (Neal 2006). It is not expected to be
present in natural water, but may be formed during treatment by oxidation.
Deafness, renal failure, coma and convulsions to humans have been attributed to
bromate ingestion (Quick 1975), which results in bromic acid formation in the
stomach in the presence hydrochloric acid. (Turkington 1994).
46
Bromate is considered a potential human carcinogen by the International Agency
Research on Cancer and a probable human carcinogen by the
disinfection/disinfection by-product rule of the USEPA (USEPA 1994).
Compounds with bromine in formal oxidation state −1 are called bromides;
therefore bromide is the ion of bromine and is present in natural soft water in
concentrations between 30 and 200 µg/l (Haag 1983.)
Bromide can originate from saltwater intrusion, natural fractionation, anthropogenic
bromide emissions, water disinfection with chloride, or agricultural applications.
Even if bromide ion in drinking water supplies has not been observed to cause
direct public health problems, it is a precursor of the formation of bromate ion.
(Myllykangas 1999.)
2.5.2 Formation of bromate
Bromate is formed in potable water mostly as a result of ozonation of raw water
containing bromide. For those processes using ozone alone the by-product that
causes most concern is the bromate ion. EU, Japanese and the US regulations
specify a bromate standard of 10 µg/l, the WHO guideline value is 25 µg/l and the
Australian regulations limit bromate to 20 µg/l. (Legube 1996.)
The mechanism for bromate formation is rather complicated and includes both
molecular ozone and •OH radical reactions. During the chemical oxidation and / or
disinfection of natural waters containing bromide with ozone, bromate is formed at
concentrations ranging from 0 to 50 µg/l under normal drinking water treatment
conditions. Fortunately, the reactions of ozone with bromide and hypobromide ions
are relatively slow. Hence, ozonation of waters during a brief period of time will
lead to a low oxidation yield of bromide ion to bromate ion. (Legube 1996.)
47 Bromate ion formation by reaction of hydroxyl radicals on bromide ion is possible
only in the presence of hypobromite ion. Moreover, hypobromite ion cannot be
formed by reaction of hydroxyl radical with bromide ion. Therefore, hydroxyl
radicals alone are not precursors of bromate ion formation. (Legube 1996.)
Several parameters can impact the conversion of bromide to bromate. Parameters
such as bromide concentration, dissolved organic carbon (DOC), temperature and
pH are important to be determined during performance. The rates of reaction
depend especially on pH because ozone reacts predominantly on OBr-. Therefore
acid waters have lower risk of bromate formation. (Neal 2006.)
It is possible to optimize the design and the operation to keep the bromate
formation down. Low residual ozone concentrations in water, the addition of
hydrogen peroxide, pH control, several injection points instead of one, the reaction
time of ozone or the direct irradiation of ozone gas by UV light are some
possibilities to use ozone even in the presence of bromide in the source water.
Furthermore, UV irradiation in the wavelength range of 180-300 nm provides
energy sufficient for producing intermolecular changes of the irradiated molecules.
The decomposition of bromate leads to the production of bromite ion. (Neal 2006.)
2 BrO3- + h → 2BrO2
- + O2
Bromite ion (BrO2-) is further decomposed to hypobromite ion (BrO-) and bromide
ion (Br-) via complex reactions which are initiated by the products generated by the
primary reactions of photolysis.
2BrO2- + h → 2BrO- + O2
2BrO- + h → 2Br- + O2
These reactions indicate that the photodecomposition of bromate leads to the
production of Br- and oxygen as end products. However, the required UV
irradiation dose cannot be applied for typical AOP applications due to the high
energy needed for this process. (Siddiqui 1996.)
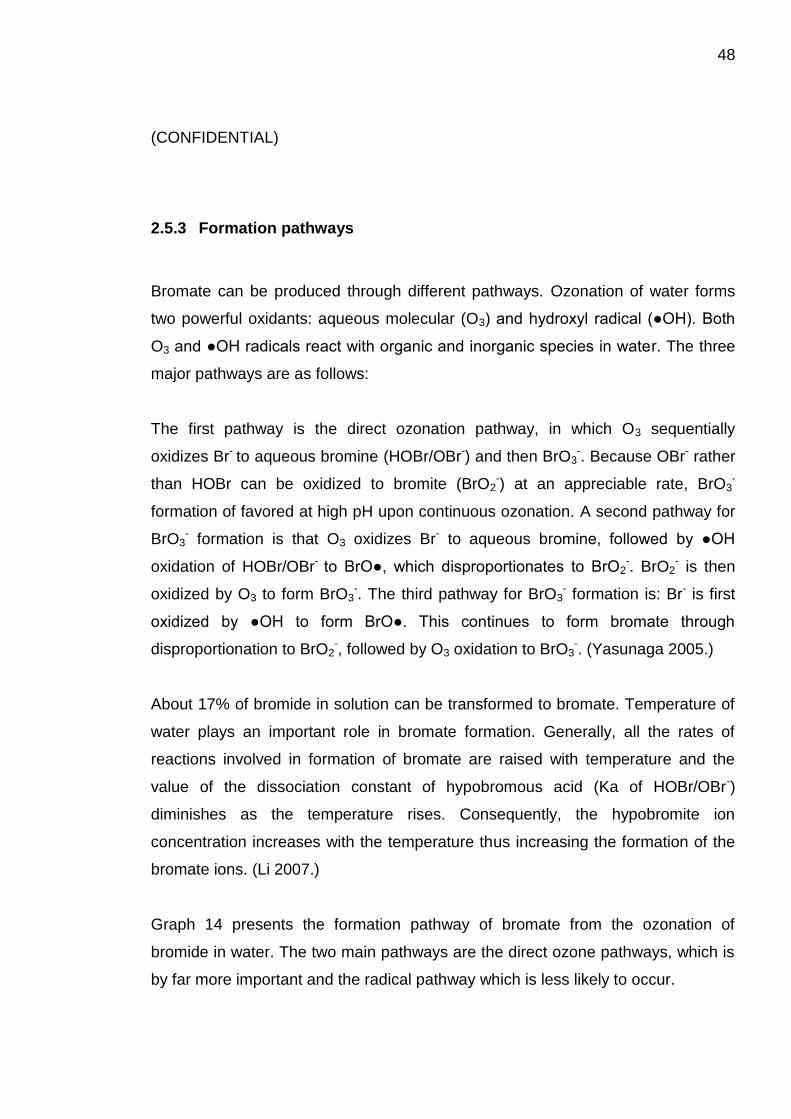
48
(CONFIDENTIAL)
2.5.3 Formation pathways
Bromate can be produced through different pathways. Ozonation of water forms
two powerful oxidants: aqueous molecular (O3) and hydroxyl radical (●OH). Both
O3 and ●OH radicals react with organic and inorganic species in water. The three
major pathways are as follows:
The first pathway is the direct ozonation pathway, in which O3 sequentially
oxidizes Br- to aqueous bromine (HOBr/OBr-) and then BrO3-. Because OBr- rather
than HOBr can be oxidized to bromite (BrO2-) at an appreciable rate, BrO3
-
formation of favored at high pH upon continuous ozonation. A second pathway for
BrO3- formation is that O3 oxidizes Br- to aqueous bromine, followed by ●OH
oxidation of HOBr/OBr- to BrO●, which disproportionates to BrO2-. BrO2
- is then
oxidized by O3 to form BrO3-. The third pathway for BrO3
- formation is: Br- is first
oxidized by ●OH to form BrO●. This continues to form bromate through
disproportionation to BrO2-, followed by O3 oxidation to BrO3
-. (Yasunaga 2005.)
About 17% of bromide in solution can be transformed to bromate. Temperature of
water plays an important role in bromate formation. Generally, all the rates of
reactions involved in formation of bromate are raised with temperature and the
value of the dissociation constant of hypobromous acid (Ka of HOBr/OBr-)
diminishes as the temperature rises. Consequently, the hypobromite ion
concentration increases with the temperature thus increasing the formation of the
bromate ions. (Li 2007.)
Graph 14 presents the formation pathway of bromate from the ozonation of
bromide in water. The two main pathways are the direct ozone pathways, which is
by far more important and the radical pathway which is less likely to occur.

49
GRAPH 14. The bromate formation pathway (Yasunaga 2005, courtesy of
Mitsubishi Electric Corporation)
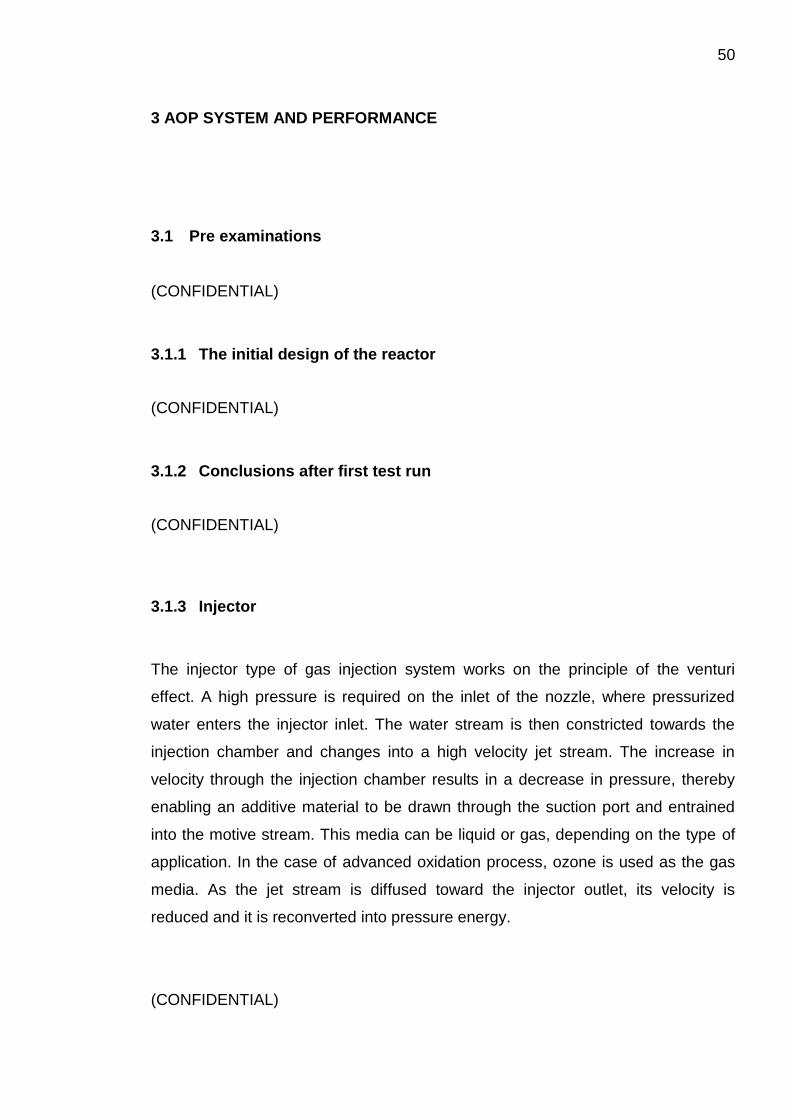
50
3 AOP SYSTEM AND PERFORMANCE
3.1 Pre examinations
(CONFIDENTIAL)
3.1.1 The initial design of the reactor
(CONFIDENTIAL)
3.1.2 Conclusions after first test run
(CONFIDENTIAL)
3.1.3 Injector
The injector type of gas injection system works on the principle of the venturi
effect. A high pressure is required on the inlet of the nozzle, where pressurized
water enters the injector inlet. The water stream is then constricted towards the
injection chamber and changes into a high velocity jet stream. The increase in
velocity through the injection chamber results in a decrease in pressure, thereby
enabling an additive material to be drawn through the suction port and entrained
into the motive stream. This media can be liquid or gas, depending on the type of
application. In the case of advanced oxidation process, ozone is used as the gas
media. As the jet stream is diffused toward the injector outlet, its velocity is
reduced and it is reconverted into pressure energy.
(CONFIDENTIAL)
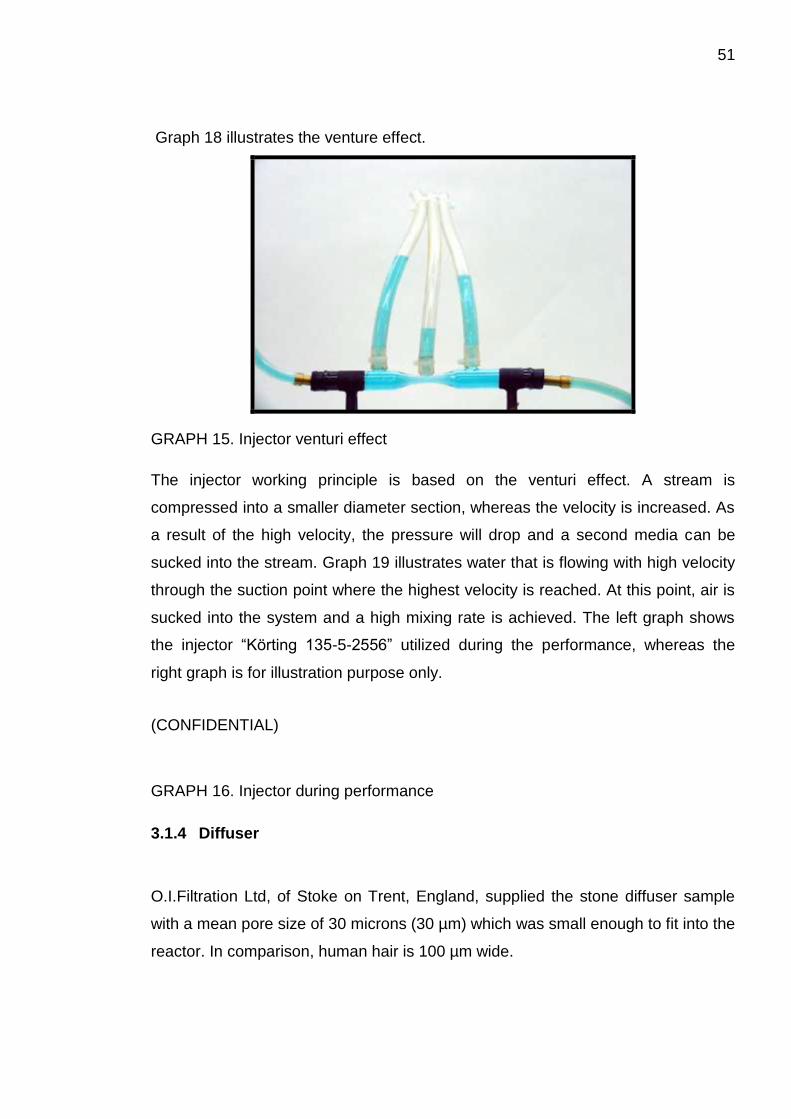
51
Graph 18 illustrates the venture effect.
GRAPH 15. Injector venturi effect
The injector working principle is based on the venturi effect. A stream is
compressed into a smaller diameter section, whereas the velocity is increased. As
a result of the high velocity, the pressure will drop and a second media can be
sucked into the stream. Graph 19 illustrates water that is flowing with high velocity
through the suction point where the highest velocity is reached. At this point, air is
sucked into the system and a high mixing rate is achieved. The left graph shows
the injector “Körting 135-5-2556” utilized during the performance, whereas the
right graph is for illustration purpose only.
(CONFIDENTIAL)
GRAPH 16. Injector during performance
3.1.4 Diffuser
O.I.Filtration Ltd, of Stoke on Trent, England, supplied the stone diffuser sample
with a mean pore size of 30 microns (30 µm) which was small enough to fit into the
reactor. In comparison, human hair is 100 µm wide.

52 (CONFIDENTIAL)
GRAPH 17. Diffuser built into the rector
Graph 20 shows the diffuser built into the reactor bottom part. The small reactor
diameter of 80 mm was the limiting factor for most commercial diffusers. The
utilized stone diffuser was capable of creating relatively small bubbles.
For processes such as ozonation, aeration of drinking water, waste water,
aquariums, fish farms, lakes and ponds, air stripping of volatile organic
compounds, iron and sulfide removal by oxidation, the bubble creation is very
important. Especially the bubble diameter can critically affect process efficiency,
because it determines the surface area of the bubbles. For two different spherical
bubble diameters with the same total volume of gas, the ratio of the total surface
areas is inversely proportional to the ratio of the diameters. To give an example, if
the mean bubble diameter would be decreased from 2.5 mm to 0.5 mm, the
interfacial contact area between the air and water would increase by the factor 5
for the same gas flow rate.
A finer pore size is expected to offer the best solution for increasing the ozone
transfer efficiency. Ceramic diffusers with very small pores can create fine
bubbles, but are not suitable for this type of ozone diffusion due to the high
pressure drop. The ozone generator used in this AOP application, “Ozomantic
Modular 8HC”, is only capable of handling pressure up to 1 bar.
A fine ceramic diffuser with pore size of 2.0 µm (Kerafol, Membrane disc Ø 152
mm) would have delivered very fine bubbles, but the bubble point of air into water
had to be larger than 1.6 bar, which would have required a larger ozone generator.
In addition to this, the size of the diffusing disk did not fit into the reactor with a
diameter of only 80 mm. Graph 21 illustrates the bubble size of the Kerafol disk
diffuser. It created very fine bubbles, which would have been ideal for the AOP
pilot trials.

53
GRAPH 18. Fine bubble distribution of ceramic diffuser
Experiments have shown that the diffuser material property that is the primary
determinant of bubble size is not only the pore size, but also the free energy at the
surface, which is a result of intermolecular attraction. With the small contact angle,
water displaces the gas from the high energy diffuser surface pore so that the
tension holding the bubble to the surface is minimized. A smaller upward force
from the gas balloon is enough to detach it to rise up into the liquid. In contrast, the
contact angle for a low surface energy diffuser is greater so that the gas displaces
the water. The bubble must increase in dimension before the upward force
produced by the density difference between gas and liquid is sufficient to
overcome the surface tension of the larger area and rises up into the liquid. The
surface energy of materials is the primary factor for the yield of small bubbles.
(Burries 1999.)
GRAPH 19. Surface energy dependency of bubbles (Burries 1999, courtesy of
Alan Burries, Alabdiffusers)

54 3.1.5 Tubing
(CONFIDENTIAL)
GRAPH 20.Tubing built into reactor
3.1.6 Determining bubble size of injector, diffuser and tubing
The actual size of the gas bubble is the key indicator for efficient transfer of ozone
into the water phase. In order to achieve reliable results, the comparison between
the compared technologies included the optical determination of average bubble
size. This test was once again conducted with a plastic pipe and the size was
manually evaluated according to the following graphs. For safety reasons, the test
was performed with oxygen gas, not with ozone. The bubble size during ozonation
is expected to remain similar. One influencing factor is the water flow rate. During
counter current flows, the water will act against the rise of the bubbles. This leads
to a flattening of the bubble.
The average bubble size of the injector was determined to be ~2.5 mm in
diameter. This value is based on averages taken from several pictures during flow
rates of 20, 50 and 80 liters of oxygen gas, respectively.
(CONFIDENTIAL)

55
GRAPH 21. Diffuser during gas flow rates of 20 l/h
(CONFIDENTIAL)
GRAPH 22. Bubbles during gas flow rates of 20 l/h
TABLE 12. Comparison of gas diffusing technologies
(CONFIDENTIAL)
3.1.7 The first performance test: co-current
(CONFIDENTIAL)
GRAPH 23. Co-current flow injector arrangement
(CONFIDENTIAL)
Graph 28 illustrates the co-current diffuser arrangement.
(CONFIDENTIAL)
GRAPH 24. Co-current flow diffuser arrangement
(CONFIDENTIAL)
3.1.8 The first performance test: counter-current
(CONFIDENTIAL)
GRAPH 25. Counter current arrangement
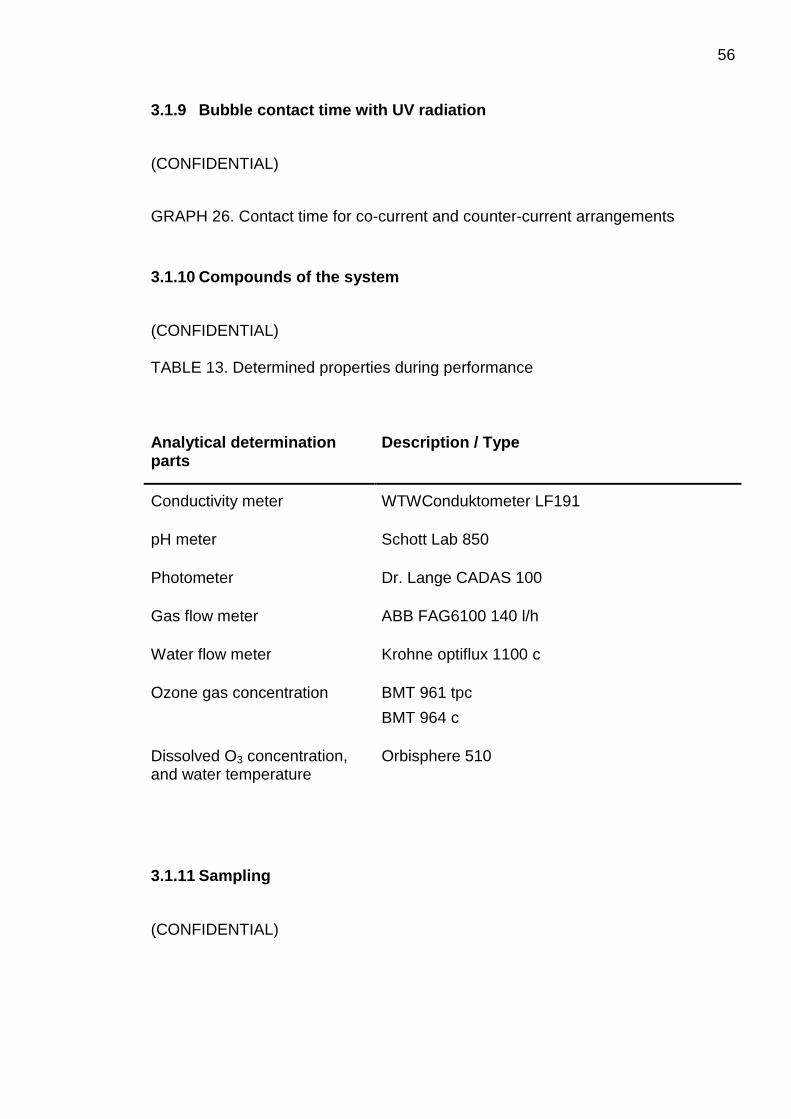
56 3.1.9 Bubble contact time with UV radiation
(CONFIDENTIAL)
GRAPH 26. Contact time for co-current and counter-current arrangements
3.1.10 Compounds of the system
(CONFIDENTIAL) TABLE 13. Determined properties during performance
Analytical determination parts
Description / Type
Conductivity meter WTWConduktometer LF191
pH meter Schott Lab 850
Photometer Dr. Lange CADAS 100
Gas flow meter ABB FAG6100 140 l/h
Water flow meter Krohne optiflux 1100 c
Ozone gas concentration BMT 961 tpc
BMT 964 c
Dissolved O3 concentration, and water temperature
Orbisphere 510
3.1.11 Sampling
(CONFIDENTIAL)
57 3.2 Results of pre study
(CONFIDENTIAL)
4 DEGRADATION OF 1.4 DIOXANE AND BROMATE CONTROL
(CONFIDENTIAL)
4.1 Final pilot runs
(CONFIDENTIAL)
4.1.1 Sampling amounts and procedure
(CONFIDENTIAL)
4.2 Results
(CONFIDENTIAL)
5 CONCLUSIONS AND RECOMMENDATIONS
(CONFIDENTIAL)
REFERENCES
Beltran, F. 2004. Ozone Reaction Kinetics for Water and Wastewater Systems.
Boca Raton. Florida: CRC Press LLC.
Bolton, J. and Cotton, C. 2008. First Water purification Ultraviolet treatment
Handbook. Denver, USA: American Water Works Association.
Bundy, J. Amirtharajah, A. and Spivey, N. 2002. Disinfection by-product analysis
and modelling in a water distribution system. In M, Lacey ed. American Water
Works Association. Annual Conference Proceedings 2002, 1-12.
Burris, A. 1999. Discovery of factors affecting bubble size in water. Water
Technology Magazine. 12, 54-57.
Available: http://www.alabdiffusers.com/WTDiffuser%20Article.pdf.
Accessed February 2009.
Christophersen, A. Jørgensen, K. and Skibsted, L. 1991. Photobleaching of
astaxanthin and canthaxanthin: quantum-yields dependence of solvent,
temperature, and wavelength of irradiation in relation to packageing and storage of
carotenoid pigmented salmonoids. Zwickau, Germany: Lebensmittel Untersuchung
und Forschung.
Gleick, P. H. 1996. Water resources Encyclopaedia of Climate and Weather.
volume 2. New York, NY, USA: Oxford University Press.
Haag, W.R. and Hoigne, J. 1983. Ozonation of Bromide Containing waters:
Kinetics of Formation of Hypobromous Acid and Bromate. Environmental Science
Technology Journal 17, 261-267.
Heiland, A. 2004. The adsorption of 1.4 dioxane and 1.3.5-trioxane on a silver
surface. Doctoral thesis. Berlin, Germany: Freie Universität Berlin.
Available: www.diss.fu-berlin.de/diss/receive/FUDISS_thesis_000000001224.
Accessed online: January 2009.
Hoigne, J. and Bader, H. 1976. The role of hydroxyl radical reactions in ozonation
processes in aqueous solution. Water Research. Volume 10, 377-460.
Howard, P.H. 1989. Handbook of Environmental Fate and Exposure Data.
Chelsea, MI: Lewis Publishers.
Ijpelaar, G. and Kruithof, J. 2001. Advanced oxidation processes for the
Degradation of Pesticides in Ground Water and Surface Water. Kiwa N.V. Water
Research. Nieuwegein, Netherlands.
Ijpelaar, G. 2007. Effective UV / H2O2 Treatment of contaminated water with LP
Lamps. Kiwa N.V. Water Research. Nieuwegein, Netherlands.
Legube, B. 1996. A Survey of Bromate Ion in European Drinking Water.
International Ozone Association Journal 24, 325-380.
Li, J. and Crawford, S. 2007. Practical Bromate Control. Houston, Texas, USA:
CDM.
Myllykangas, T. Nissinen, T. and Vartiainen, T. 1999. Bromate Formation during
Ozonation of Bromide Containing Drinking Water – A Pilot Scale Study.
International Ozone Association Journal 27, 487-488.
Neal H. Phillip, Gürten, E., Diyamandoglu, V. 2006. Transformation of Bromine
Species During Decomposition of Bromate under UV Light from Low Pressure
Mercury Vapor Lamps. Ozone Science and Engineering 28, 217-228.
Perry, R.H. and Green, D.W., 1997. Perry´s Chemical Engineers Handbook. 7th
edition. New York, NY, USA: Mc Graw-Hill.
Quick, C.A., R.A. Chole, and S.M. Mauer. 1975. Deafness and Renal Failure Due
to Potassium Bromate Poisoning. Archives of otolaryngology 101, 494-540.

Ried, A. and Lobo, W. 2005. Advanced oxidation processes But Which Process is
Best? A Comparison of Treatment Processes Combining Ozone UV and Hydrogen
Peroxide. Charlotte, NC, USA: ITT Advanced Water Treatment.
Sakaji, R. and Book, S. 2002. Treatment Technologies for the Removal of
Endocrine Disruptors from Wastewater and Drinking water. Berkeley, California,
USA: California Department of Health Services Drinking Water Program.
Siddiqui, M. S. Amy, and G. Mc Collum, 1996. Bromate Destruction by UV
irradiation and Electric Arc Discharge. International Ozone Association Journal 24,
271-273.
Steward, M.H. Hwang, C.J. Hacker, and Yates, P.A. 1993. Microbial and chemical
implications of using ultraviolet irradiation for treatment of biological filter effluent.
Proceedings of 1993 Annual Water Works Association, 45-51.
Taghipour, F. Elyasi, S. Sozzi, A. 2004. Simulation of Ozone-UV Reactors for
Water Treatment. IWA Leading-Edge Conference on Water and Wastewater
Treatment Technologies. University of British Columbia, 67-75.
Takahashi, K. 2001. Photodissociation of Ozone in the Hartley Band. Nagoya,
Japan: Nagoya University.
Turkington, C. 1994. Poisons and Antidotes. New York, NY,USA: Facts on File
Incorporated.
USEPA, United States Environmental Protection Agency. 1994. National Primary
Drinking Water Regulations - Disinfections and Disinfection Byproducts Proposed
Rule. Federal Register 59(154):38668-38829. Washington, USA: USEPA
USEPA, United States Environmental Protection Agency. 1995. 1, 4-Dioxane Fact
Sheet. Pollution Prevention and Toxics. Paper: EPA 749-F-95-010a. Washington,
USA: USEPA
Available http://www.epa.gov/chemfact/dioxa-sd.pdf.
Accessed online: January 2009
Wedeco ITT Corporation. 2008. Ozone and Ultraviolet product details
presentation. Herford, Germany. ITT.
Yasunaga, N. Yamauchi, T. Noda, S. and Furukawa, S. 2005. The investigation of
bromate formation by ozonation of bromide-containing waters. Amagasaki City,
Japan: Mitsubishi Electric Corporation Advanced R&D center.
Zeman, G. 2008. Ultraviolet radiation. McLean, Virginia, USA: Health Physics
Society.
Available: http://www.hps.org/hpspublications/articles/uv.html.
Modified 2 July 2008,
Accessed November 2008.
Zenker, M. Borden, R. Barlaz, M. 2003. Occurrence and Treatment of 1.4 dioxane
in Aqueous Environments. Environmental Engineering Science 20, 423-432.
Available: http://www.liebertonline.com/doi/abs/10.1089/109287503768335913
Accessed online: January 2009

APPENDIX 1
Determined parameters
The following process parameters were measured during the AOP comparison.
TABLE 14. Measured parameters during AOP performance
Parameter Unit Description
Gas flow m3/h Volume of oxygen/ozone gas mixture flowing into the
reactor.
Water flow m3/h Volume of water flowing into the reactor.
Ozone IN g/Nm3 Concentration of ozone in oxygen/ozone gas mixture
streaming into the reactor from the generator.
Ozone OUT g/Nm3 Concentration of ozone in oxygen/ozone gas mixture
streaming out of the reactor after UV.
Ideally, no ozone should be detected here anymore.
Ozone OUT
(no UV)
g/Nm3 Concentration of ozone in oxygen/ozone gas mixture
streaming out of the reactor, when no UV light was
present. This indicates how much ozone is
“consumed” by the water matrix even without any UV
light present.
Dissolved
ozone pre UV
mg/l Amount of dissolved ozone in water matrix before the
UV irradiation. This value shows how much ozone
would have been able to be destructed by UV light.
Dissolved
ozone after UV
mg/l Amount of dissolved ozone after the UV irradiation.
Ideally no ozone should be detected here anymore,
due to the UV destruction.
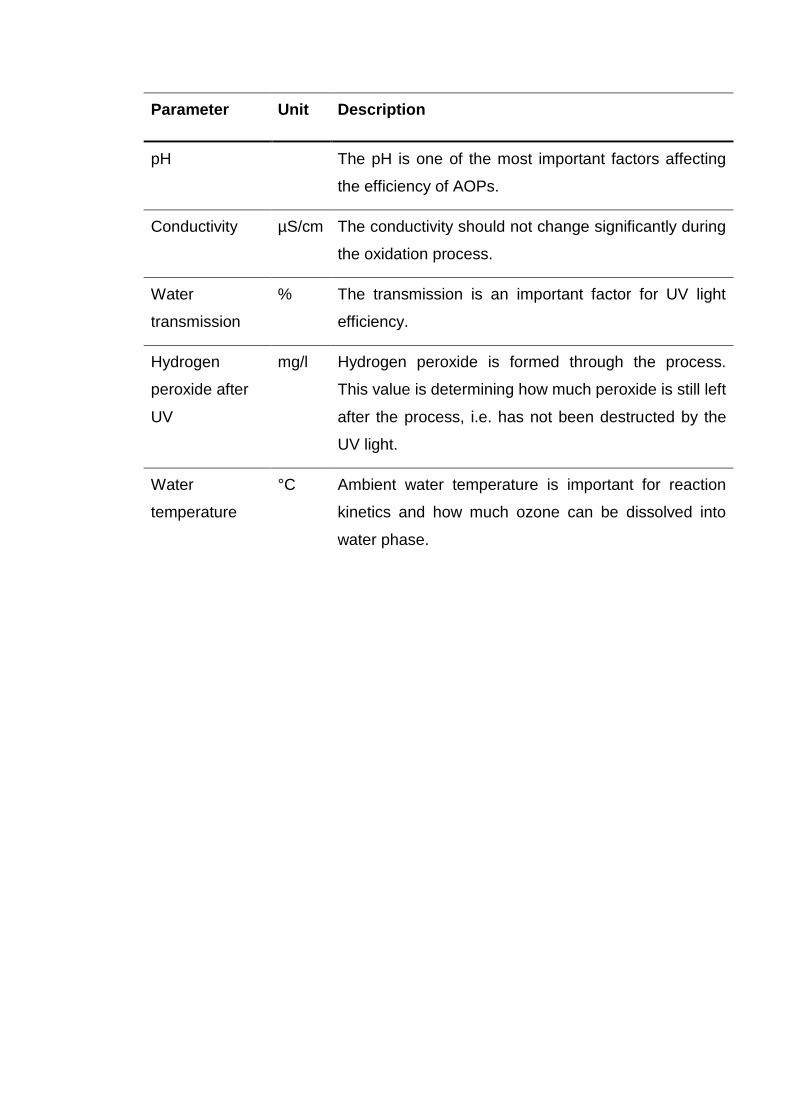
Parameter Unit Description
pH The pH is one of the most important factors affecting
the efficiency of AOPs.
Conductivity µS/cm The conductivity should not change significantly during
the oxidation process.
Water
transmission
% The transmission is an important factor for UV light
efficiency.
Hydrogen
peroxide after
UV
mg/l Hydrogen peroxide is formed through the process.
This value is determining how much peroxide is still left
after the process, i.e. has not been destructed by the
UV light.
Water
temperature
°C Ambient water temperature is important for reaction
kinetics and how much ozone can be dissolved into
water phase.

APPENDIX 2
TABLE 15. Parameters calculated according to the measured values
Parameter Unit Description
Ozone dose IN g/m3 The dose of ozone applied to the water per hour. It is
calculated from (ozone IN*gas flow)*water flow.
Ozone dose
OUT
g/m3 The dose of ozone which has not been activated by
the UV. Ideally, this value should be zero.
It is calculated from (ozone OUT*gas flow)*water flow.
Reacted ozone
TOTAL
g The amount of ozone reacted inside the system. For
both gas and dissolved phases.
This value is most important, because it shows how
effective ozone has been activated.
Ideally, if ozone dose IN is 4 g, 4 g should have also
reacted in this value.
Reacted ozone
gas phase
% Amount of ozone which has reacted in the gas phase.
The higher the percentage, the better the percentage
activation.
Activated
dissolved
ozone
mg/l Amount of ozone which has reacted into radicals in
dissolved phase. It subtracts dissolved ozone pre UV
– dissolved ozone after UV.
Activated
dissolved O3
% Amount of dissolved ozone which has been activated
in percent.
Hydrogen
peroxide
concentration
(theoretical)
mg/l It is calculated how much hydrogen peroxide would
theoretically be formed during the process from the
reaction theory of ozone.