remote sensing of urban areas: linear spectral unmixing of ... · unmixing of landsat thematic...
TRANSCRIPT

19
Proc. Estonian Acad. Sci. Biol. Ecol., 2007, 56, 1, 19�32
Remote sensing of urban areas: linear spectral unmixing of Landsat Thematic Mapper images
acquired over Tartu (Estonia)
Tõnis Kärdi
Institute of Geography, University of Tartu, Vanemuise 46�326, 51014 Tartu, Estonia; [email protected] Received 27 January 2006, in revised form 18 July 2006 Abstract. Urban areas are characterized by a pattern of very heterogeneous patches resulting from the co-occurrence of different materials within the ground instantaneous field of view of a moderate resolution scanner, e.g. Landsat Thematic Mapper (TM). The main objective of this study was to map vegetation, impervious surface, and soil from Landsat TM images acquired over the town of Tartu (Estonia) on three different dates (in 1988, 1995, and 2001). The linear spectral unmixing method was utilized for endmember fraction estimation. Accuracy assessment was conducted on the 1995 fraction images using the Estonian basic map at 1 : 10 000 scale. The overall fraction estimation error was 9% (by classes: vegetation and soil 6%, impervious surface 15%). Key words: Landsat, linear spectral unmixing, urban remote sensing, Estonia, Tartu.
INTRODUCTION The proportion of people of the total world population living in urban areas
has risen to 50% from approximately 10% in 1900. This increase is estimated to proceed further and to reach 60% by 2030 (O�Meara Sheehan, 2002). Urban areas themselves are considered to cover approximately 1% of the total land area but these areas are in a stage of considerable growth as more agricultural land around urban areas is suburbanized (Carlson & Traci Arthur, 2000). O�Meara Sheehan (2002) pointed out that in many cases where the urban population has remained stable (or even declined) cities themselves have grown in size. This growth is to a large extent taking place at the expense of agricultural lands around cities (so-called greenfield development) as it proves to be more cost-efficient than brownfield development, i.e. utilizing lands that have already been used for manufacturing, housing, etc. In other words, real estate development outweighs agriculture in the case of free market economy (Tammaru, 2000).

20
The main aim of this study was to conduct a normalized spectral unmixing of Landsat Thematic Mapper (TM) and Landsat Enhanced Thematic Mapper Plus (ETM+) images acquired over Tartu, Estonia, and to estimate the fractions of vegetation, impervious surfaces, and soil (VIS) in the study area in 1988, 1995, and 2001. Secondly, the unmixed fraction images were compared to the Estonian basic map at 1 : 10 000 scale for the purpose of accuracy assessment. Thirdly, a closer inspection of the effects of landcover changes on the VIS model fractions in a suburban area of Ihaste, which has undergone considerable development during the period under question (from Soviet-era temporary summerhouse area with backyard fields to permanent house suburbia where inhabitants live all year round), will be presented as a case study of using the unmixed fraction images for detecting urban landcover changes in the VIS model framework.
Urban remote sensing Past years have seen an increased use of Landsat images in urban remote
sensing. Small (2001) used Landsat TM images to estimate vegetation abundance in New York City and monitor changes over one year (Small, 2002) by using linear spectral unmixing and pseudoinvariant endmembers. Gillies et al. (2003) established a change in the impervious cover in the Greek Line watershed near Atlanta (USA) from Landsat TM and Landsat Multispectral Scanner System (MSS) imagery between 1979 and 1997 and used the change in impervious area as an ecological indicator for assessing the population dynamics of river mussels.
Clapham (2003) pointed out that in the case of classification of urban land-cover using satellite imagery, continua of different classes should be considered instead of creating categorical clusters of landcover types. Ridd (1995) proposed the vegetation�impervious surface�soil (VIS) model by which a certain area (e.g. an image pixel) in an urban environment can be described through proportions of vegetation, impervious surface, and soil. Ridd (1995) himself used the VIS model to describe the urban morphology of Salt Lake City�s (USA) metropolitan area from the Satellite Probatoire pour l�Observation de la Terre (SPOT) images with unsupervized classification.
Phinn et al. (2002) used the VIS model as a conceptual framework for describing the landcover of the city of Brisbane (Australia) and applied different image processing methods (including unsupervised classification, visual ortho-photo interpretation, and linear spectral unmixing). The VIS model was used as a framework also by Wu & Murray (2003) and Wu (2004), though the main effort in both of these papers was on modelling impervious surfaces in and around the city of Columbus (USA).
According to Herold et al. (2005), previous studies have reported that for the purposes of urban remote sensing scanner systems with 5 m ground instantaneous field of view (GIFOV) could be considered optimal. In the case of a coarser spatial resolution categorical urban landcover classes would have some inherent ambiguity. The existence of mixed pixels on satellite imagery acquired over

21
urban areas is well noted in the literature (Ridd, 1995; Small, 2002; Wu & Murray, 2003; etc.). Improved spatial resolution tends to reduce the problem of mixed pixels (Ridd, 1995), though Small (2003) noted that even high resolution IKONOS imagery of urban areas has a significant amount of spectrally heterogeneous pixels.
Spectral unmixing Spectral unmixing of satellite images is one of the most widely used methods
for deriving information from mixed pixels (Lu et al., 2003). According to Lunetta (1998), spectral mixture analysis was developed for interpreting High Spectral Resolution Advanced Visible/Infrared Image Spectrometer (HSR AVIRIS) data and was later expanded to be used with Landsat data. The spectral unmixing method has been successfully used for assessing forest thinning (Lunetta, 1998) and for forest landcover/landuse change detection (e.g. Lu et al., 2003; Souza et al., 2003).
The idea behind linear spectral mixture analysis is that every image pixel is a mixture of different components (called endmembers) and the spectrum recorded by the sensor is a linear combination of endmember spectra (Tompkins et al., 1997). It has to be kept in mind that the assumption of linear mixing holds only if multiple scattering between different landcover types is insignificant (Tompkins et al., 1997; Wu & Murray, 2003). Although multiple scattering might have some effect on spectral unmixing, previous research has established that it can be neglected in the case of urban areas (Small, 2002; Wu & Murray, 2003).
Therefore, in the case of linear spectral mixing the value of a pixel in an image for a band equals the weighted sum of the radiance values for that band of all targets present in the pixel:
1,
n
i k ik ik
R f R ER=
= +∑ (1)
where 1, ,i m= … (number of spectral bands); 1, ,k n= … (number of end-members); iR is the value of a pixel in band ;i kf is the fraction of endmember k in that pixel; ikR is the radiance of endmember k in band ;i and iER is the unmodelled residual in band i (Weng et al., 2004).
Usually the endmember fractions in a pixel are constrained to sum to unity and each endmember fraction itself is expected not to have a negative value or be greater than 1 (Weng et al., 2004):
11
n
kk
f=
=∑ and 0 1.kf≤ ≤ (2)
The model root mean square ( )RMS error based on the residuals from formula (1) (Weng et al., 2004) is:
21( ) / .m
iiRMS ER m=
= ∑ (3)
22
Endmembers used for spectral unmixing can be derived from the image itself (called image endmembers), or measured in a laboratory or in field conditions (reference or library endmembers) (Lunetta, 1998). Tompkins et al. (1997) de-scribed also the creation and use of virtual endmembers, i.e. endmembers that are spectrally �purer� than the potential image endmembers. All in all image endmembers are most widely used as they are relatively easy to define and are in the same radiometric scale as the image itself (Weng et al., 2004).
To a large extent the success of spectral unmixing rests on endmember selection (Tompkins et al., 1997). It is widely noted that image endmembers should be selected from the extreme values of the image spectral feature space. This step in image analysis is based on the assumption that the extreme values represent spectrally the purest pixels, i.e. composed only of one endmember (Roberts et al., 1998).
In order to use the VIS model components as endmembers for linear spectral unmixing, their variation in spectral values over the image has to be accounted for (Song, 2005). Most of this variation can be attributed to impervious surfaces that vary from bright (e.g. concrete, glass) to dark objects (e.g. asphalt) (Herold et al., 2004). The same has been found to hold for vegetation and soil (Wu, 2004).
Wu (2004) proposed the normalized spectral unmixing method for decreasing endmember spectral variability to facilitate the use of the VIS model components as endmembers. The normalized reflectance R in band b for a given pixel can be expressed by (Wu, 2004):
100,bb
RRµ
= × (4)
where
1
1 ,n
bb
RN
µ=
= ∑ (5)
where bR is the radiance of a pixel in band ,b N is the number of spectral bands, and µ is the average reflectance of a pixel over all the spectral bands. The normalized spectral unmixing method was further also used by Zhang et al. (2005) for assessing the abundance of different lichen species on a rock surface.
DATA AND METHODS
Study area The study area is located in South-Central Estonia and includes the area of the
second largest town in Estonia, Tartu (~ 100 000 inhabitants), together with its immediate surroundings (Fig. 1). Tartu has experienced outward growth in the past years, mainly in the direction of major highways originating from the town. To the north of the town lies a former Soviet army airfield (Raadi airfield). Agricultural fields and forests surround the urban area. The Emajõgi River flows

23
Fig. 1. The study area is bounded by the grey box. The Ihaste subregion is highlighted by the white box.
through the town centre and two stillwater bodies (the Anne Channel and the fishponds of Haaslava) lie also within the study area.
Data and software Three satellite images covering a time span of 13 years were utilized in this
research. The images from 16 May 1988 and 24 August 1995 were acquired by Landsat 5 TM and the image from 3 May 2001, by Landsat 7 ETM+. All three images were acquired in relatively favourable atmospheric conditions with a high atmospheric transparency measured at Tõravere meteorological station ~ 20 km from Tartu. Therefore no atmospheric correction was considered necessary. Furthermore, Song et al. (2001) did not consider atmospheric factors of major influence on the accuracy of unmixing results. Their study used image endmembers and their spectral signatures for every image independently of others. All reflective bands (except for the thermal band 6) were used for spectral unmixing.
The IDRISI 32 Release Two software package (Eastman, 2001a, 2001b) was used for image processing. Pixel values from the unmixed fraction images were calculated with the public domain software Lokaalstatistikud developed at the Institute of Geography, University of Tartu, downloadable at http://map.gg.ut.ee/kalle_r/Lokaalstatistikud/.

24
Data processing The satellite images were georeferenced to the Estonian basic map using black
and white orthophotos dating from 1995 with the IDRISI Resample module. The image ground resolution was kept at 30 m and the resulting root mean square error was less than 0.3 Landsat TM pixels. For subsequent image processing a 10 km by 12 km area was windowed from the Landsat scenes, so that the whole town of Tartu with the neighbouring settlements, the Raadi airfield northwards from the town, and agricultural areas and forests around the town were within the images.
In determining the mixing space topology (Small, 2004), a principal component transformation was conducted on the spectrally normalized images and scatterplots of the first three components were constructed for every image date. Subsequent inspection showed that the extreme areas of the mixing space corresponded to soil, vegetation, and water. As water bodies are not included in the VIS model, a binary image mask for terrestrial (non-water) pixels was created.
Removal of water surfaces revealed impervious surfaces as image endmember (Fig. 2). Also an outward cloud of pixels spans out on the line connecting impervious
Fig. 2. Scattergrams of the first three principal components for the 16 May 1988 Landsat TM image with water surfaces masked out. Approximate locations of main landcover types on the mixture space projections are shown.
25
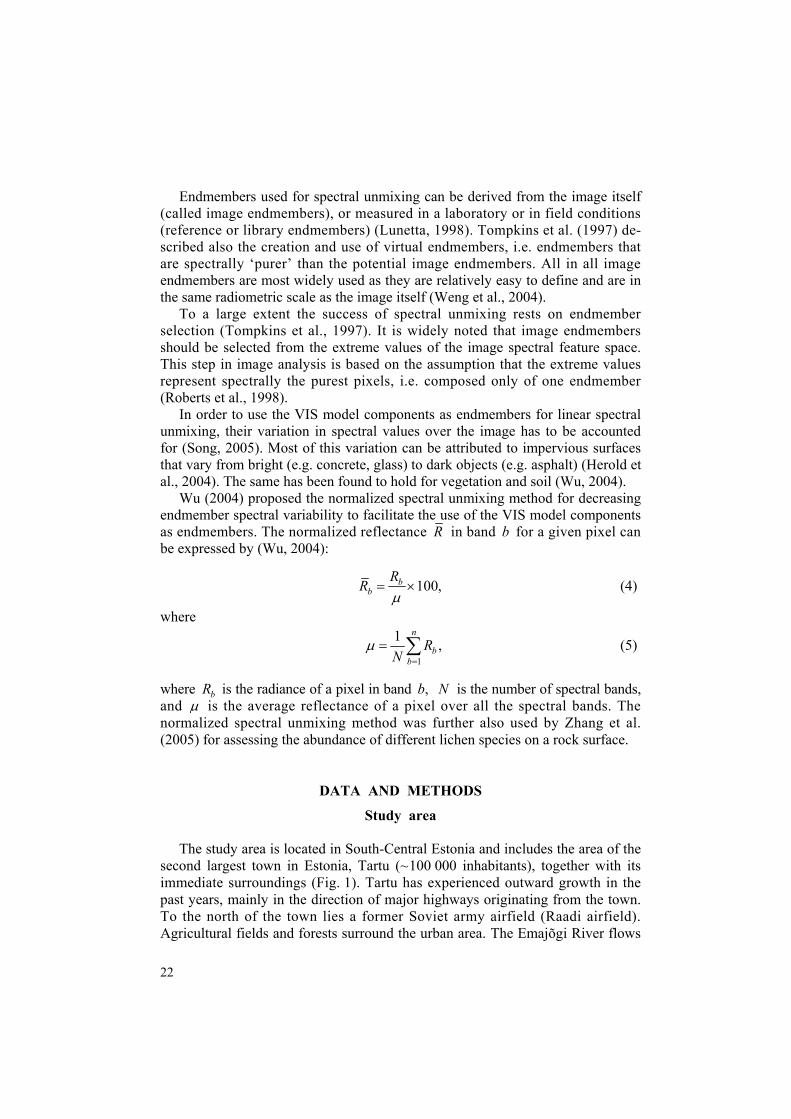
Fig. 3. Typical endmember signatures for the 1988 normalized Landsat TM scene.
surfaces and vegetation endmembers in the mixing space that corresponded to areas of forest inside and around the town. This was incorporated into the mixture model as a shade endmember. The shade endmember should be considered as a mixture of vegetation and shadow, which is not directly observable in medium resolution satellite images.
Typical spectral signatures for the chosen endmembers from the 1988 Landsat scenes normalized according to formulas (4) and (5) are shown in Fig. 3.
Accuracy assessment For the purpose of accuracy assessment the unmixed fraction images were
compared to the Estonian basic map at 1 : 10 000 scale. The fractions of all basic map classes were calculated in a circular kernel with a radius of 2 Landsat TM pixels (60 m). Next, the basic map categories were regrouped into two classes � impervious surfaces and pervious surfaces (classes associated with vegetation and soil). As the basic map categories depict land use rather than landcover, their assignment to the pervious or impervious class was decided according to their description in the Estonian Land Board�s mapping procedure (Maa-ameti kartograafiabüroo, 2002). Water surfaces are not included in the VIS model
26
categories and therefore a separate class �other� was created for reclassification purposes.
Accuracy assessment was conducted in 1400 stratified random points, which were generated into 7 subset areas (each approximately 1.5 by 1.5 km in size). The error of unmixed fraction images was quantified using the generalized area-based confusion matrix proposed by Lewis & Brown (2001). The generalized area-based confusion matrix is somewhat similar to a regular confusion matrix only that it does not require sampled random points used for accuracy assessment to have a hard membership to one class only � it allows classes to have an area (or a probability) in the sampled point.
Ihaste case study To reveal the changes in the VIS model components at Ihaste between 1988
and 2001, 30 sample points were created in areas where a landcover change was known beforehand. The fractions of vegetation, soil, and shade were calculated in those sample points with the public domain software Lokaalstatistikud using a circular kernel with a radius of 2 Landsat TM pixels. Simple calculus (addition, subtraction of mean fraction values calculated from the unmixed fraction images) was used for analysing the fraction changes.
RESULTS
The unmixed fraction images Figure 4 shows the unmixed fraction images of vegetation, soil, and impervious
surface for 1988, 1995, and 2001. Vegetation fraction images (upper row in Fig. 4) were found by adding the vegetation endmember fraction and the shade endmember fraction images. High fractions of vegetation were found on areas covered with low and dense vegetation, lower fractions were associated with forested areas, and fractions close to zero with some agricultural fields around the town and surfaces expected to be covered with impervious materials. High fractions of shade were primarily associated with forested areas around the town, parks (such as Toomemägi for example), and fractions close to zero with agri-cultural fields around Tartu.
Higher fractions of impervious surface cover (middle row in Fig. 4) were mainly associated with urban areas and they represent known impervious surface locations in Tartu. The fraction images of soil are presented in Fig. 4 in the bottom row. Lower fractions of soil are associated with urban areas, higher fractions with agricultural fields around Tartu.

27
Fig. 4. The unmixed fraction images: (a) vegetation, (b) impervious surfaces, (c) soil. A scalebar for the density of grey is given beside the fraction images.
Accuracy assessment The unmixed fraction images were then compared to the Estonian basic map.
Table 1 presents the generalized area based confusion matrix for the data. The overall error of spectral unmixing of the 1995 Landsat TM image was found to be 9% (by classes: vegetation with soil overestimated by 6%, impervious surfaces underestimated by 15%). The model RMS error images calculated according to formula (3) show that approximately 2 DN (i.e. < 5% of the initial data) remains unmodelled in every spectral band. By a rule of thumb it is the riverbanks of the Emajõgi that demonstrate the highest values of model RMS error.

28
Table 1. The generalized area-based confusion matrix for quantifying the spectral unmixing error
Impervious surface Vegetation and soil Other
Impervious surface 36.3826 �38.1873 1.8047 Vegetation and soil 20.134 �24.4142 4.2802 Other �2.6466 �2.0385 4.6851
Ihaste case study The Ihaste case study subregion is shown in Fig. 1 bounded by a white box.
The case study results of Ihaste indicate that forest areas will be very stable (variation 1�2%) if vegetation, shade, and soil fractions are taken as a whole throughout the study years. If the fractions of vegetation, shade, and soil are considered separately then phenologic changes will become evident. The unmixed vegetation endmember estimates of the years 1988 and 2001 (May) have lower fractions than the 1995 estimates (August). The opposite holds true for soil � higher fractions in 1988 and 2001 and lower in 1995. The shade fractions are relatively stable (variation ~ 5%) throughout the study period.
The areas of Uus-Ihaste, which according to the 1995 orthophoto were developed, underwent a decline in vegetation and shade fractions between 1988 and 1995. Those fractions are generally stable from 1995 to 2001. Some areas where undeveloped land parcels have existed in between developed parcels have undergone further decline in vegetation and shade fractions. Both of these cases demonstrate a rise in the soil fraction, though this rise is not sufficient enough to keep the pervious surface fraction stable. The pervious surface fractions have decreased from a couple of percentage points (attributable to georeferencing RMS error) to 40%.
Agricultural fields that were not developed by 2001 show a sharp decrease in soil fractions. A slight phenologic change is present as the August 1995 image shows somewhat lower soil fractions than the May 2001 image. The fractions of vegetation and shade increase so that the resulting fraction of pervious surface remains relatively stable (variation 1�2%). According to the sample point estimates, Uus-Ihaste experienced a substantial decrease in the pervious surface cover (and concurrently an increase in the impervious surface cover) between 1988 and 2001. According to the sample points used, most of this landcover change occurred between 1988 and 1995.
DISCUSSION The main aim of this research was to conduct a linear spectral unmixing of
Landsat TM imagery and map the areas of impervious surfaces, soil, and vegetation within and around Tartu in 1988, 1995, and 2001. Prior to spectral unmixing the satellite data were normalized according to the procedure suggested

29
by Wu (2004). After having masked out water surfaces, vegetation, impervious surface, and soil could be used as image endmembers. Examination of mixing spaces revealed that the normalization procedure did not completely remove the brightness variation of vegetation. Because of this a fourth endmember, called shade, was introduced into the mixing model that was later added to the unmixed vegetation endmember fraction to keep the fraction images in the VIS model framework. This addition can be justified because inspection of the mixing spaces showed that endmember shade lied on the axis connecting the areas of �pure� vegetation and water (i.e. spectrally normalized dark objects).
At this point the question why the normalization method did not remove the spectral variation of dark (e.g. forests) and bright (e.g. pastures) vegetation should be raised. The main reason here is most probably the difference in spectral response for dark and bright vegetation as the landcover for either case is different. For this reason for example Adams et al. (1995) used an endmember called non-photo-synthetic vegetation, which depicted tree trunks, branches, and other tree parts that do not contain leaf chlorophyll. A closer inspection of the fraction images called shade in this study would reveal that its higher fractions are associated with areas covered with trees � inner town parks, cemeteries, and forests.
The use of the Estonian basic map for the purpose of accuracy assessment in this study could be questioned as most of the basic map categories depict land use rather than landcover, which in turn would mean that the reclassification scheme for transforming the basic map classes into VIS classes could be questionable. Nevertheless, the Estonian basic map is the best of the available data sets � especially considering the scale of Landsat imagery � on the town of Tartu. In principle it is possible to derive �ground truth� maps for all VIS model classes from it.
Another possibility would be to use field data or ground truthing. However, this was not deemed necessary, as there is some doubt that this would have produced better results than the basic map could offer. Furthermore, the accuracy assessment was conducted on the 1995 unmixed fraction images and the basic map is based on the 1995 black and white orthophotos. Ground truthing would have some point if the accuracy assessment were conducted on an unmixed satellite image of a more recent date (e.g. 2004 or 2005).
The basic map does not essentially provide any information on vegetation abundance, which in the context of this study would be important. However, this should have no influence on the accuracy assessment results as vegetation and soil were treated as one class (pervious surface). If sparse vegetation is present (e.g. a summer crop field in the spring image), it is by default considered as a mixture of soil and vegetation.
As for the Ihaste subregion case study it must be stressed that these results cannot be considered in a wider context, as this would lead to biased conclusions. The sampled points in the study area are not really representative for describing any changes as they were not randomly created. They were specifically chosen to determine how certain landcover changes affect the fractions of VIS components in the unmixed fraction images.
30
In conclusion it should be emphasized that the fraction estimation error of impervious surface in this study (15%) is comparable to the results obtained in other studies (Wu, 2004; Yang & Liu, 2005). Further research should still focus on finding better methods of deriving fuzzy ground truth maps, as the method described above leaves the investigator to reclassify a categorical ground truth map into fewer landcover classes (such as vegetation, impervious surface, and soil) the results of which could be ambiguous.
CONCLUSIONS Urban areas are characterized by a pattern of very heterogeneous patches
resulting from co-occurrence of different materials within the ground instantaneous field of view of a moderate resolution scanner, e.g. Landsat Thematic Mapper (TM). Therefore categorical mapping algorithms have limited applications in remote sensing of urban areas. In this situation the linear spectral unmixing method has been proved to be much more effective. The vegetation�impervious surface�soil (VIS) model proposed by Ridd (1995) offers a good conceptual framework for describing urban areas using moderate resolution sensor data. The VIS model proposes that an area (e.g. an image pixel) is a composite of vegetation, impervious surface, and soil fractions.
The main goal of this research was to derive the fraction images of vegetation, impervious surface, and soil from Landsat TM/ETM+ data acquired over Tartu, Estonia, from three different years (1988, 1995, and 2001) using the method of linear spectral unmixing.
The second aim of this research was to compare the unmixed fraction images with the Estonian basic map at 1 : 10 000 scale (as an accuracy assessment of the unmixed fraction images). The basic map itself was derived by visual interpretation of orthophotos. The overall error in the study area was found to be 9% (respective errors by classes: impervious surfaces 15%, vegetation and soil 6%).
Further, a case study in a Tartu suburban area (Ihaste) was conducted. Changes in the pervious surface cover were calculated and analysed. The results indicate that Ihaste as an expanding suburbia on the outskirts of Tartu experienced sub-stantial loss of pervious surface between 1988 and 2001. Interestingly, most of the pervious to impervious conversion occurred between 1988 and 1995. The extent of this change has to be still validated in some other way as the fraction changes were found in a handful of non-randomly created sample points.
ACKNOWLEDGEMENT This study was partly supported by Estonian Science Foundation grant
No. 6845.
31
REFERENCES
Adams, J. B., Sabol, D. E., Kapos, V., Filho, R. A., Roberts, D. A., Smith, M. O. & Gillespie, A. R. 1995. Classification of multispectral images based on fractions of endmembers: application to land-cover change in the Brazilian Amazon. Remote Sens. Environ., 52, 137�154.
Carlson, T. N. & Traci Arthur, S. 2000. The impact of land use � land cover changes due to urbanization on surface microclimate and hydrology: a satellite perspective. Global Planet. Change, 25, 49�65.
Clapham, W. B., Jr. 2003. Continuum-based classification of remotely sensed imagery to describe urban sprawl on a watershed scale. Remote Sens. Environ., 86, 322�340.
Eastman, R. J. 2001a. IDRISI 32 Release 2. Guide to GIS and Image Processing. Vol. 1. Clark Labs.
Eastman, R. J. 2001b. IDRISI 32 Release 2. Guide to GIS and Image Processing. Vol. 2. Clark Labs.
Gillies, R. R., Brim Box, J., Symanzik, J. & Rodemaker, E. J. 2003. Effects of urbanization on the aquatic fauna of the Creek watershed, Atlanta � a satellite perspective. Remote Sens. Environ., 86, 411�422.
Herold, M., Roberts, D. A., Gardner, M. E. & Dennison, P. E. 2004. Spectrometry for urban areas for remote sensing � development and analysis of a spectral library from 350 to 2400 nm. Remote Sens. Environ., 91, 304�319.
Herold, M., Couclelis, H. & Clarke, K. C. 2005. The role of spatial metrics in the analysis and modelling of urban land use change. Comput. Environ. Urban Systems, 29, 369�399.
Lewis, H. G. & Brown, M. 2001. A generalised confusion matrix for assessing area estimates from remotely sensed data. Int. J. Remote Sens., 22, 3223�3235.
Lu, D., Morana, E. & Batistella, M. 2003. Linear mixture model applied to Amazonian vegetation classification. Remote Sens. Environ., 87, 456�469.
Lunetta, R. S. 1998. Applications, project formulation, and analytical approach. In Remote Sensing Change Detection: Environmental Monitoring Methods and Applications (Lunetta, R. S. & Elvidge, C. D., eds), pp. 1�19. Taylor & Francis, London.
Maa-ameti kartograafiabüroo. 2002. Eesti põhikaardi 1 : 10000 digitaalkaardistuse juhend. Kinni-tatud Maa-ameti peadirektori käskkirjaga nr 13, 27. veebruar 2002. a. Tartu.
O�Meara Sheehan, M. 2002. What will it take to halt sprawl? World Watch Magazine, January/February 2002, 12�23.
Phinn, S., Stanford, M., Scarth, P., Murray, A. T. & Shyy, P. T. 2002. Monitoring the composition of urban environments based on the vegetation�imperious surface�soil (VIS) model by subpixel analysis techniques. Int. J. Remote Sens., 23, 4131�4153.
Ridd, M. K. 1995. Exploring a V-I-S (vegetation�impervious surface�soil) model for urban eco-system analysis through remote sensing: comparative anatomy for cities. Int. J. Remote Sens., 16, 2165�2185.
Roberts, D. A., Batista, G. T., Pereira, J. L. G., Waller, E. K. & Nelson, B. 1998. Change identification using multitemporal spectral mixture analysis: applications in eastern Amazonia. In Remote Sensing Change Detection: Environmental Monitoring Methods and Applications (Lunetta, R. S. & Elvidge, C. D., eds), pp. 137�161. Taylor & Francis, London.
Small, C. 2001. Estimation of urban vegetation abundance by spectral mixture analysis. Int. J. Remote Sens., 22, 1305�1334.
Small, C. 2002. Multitemporal analysis of urban reflectance. Remote Sens. Environ., 81, 427�442. Small, C. 2003. High spatial resolution spectral mixture analysis of urban reflectance. Remote Sens.
Environ., 88, 170�186. Small, C. 2004. The Landsat ETM+ spectral mixing space. Remote Sens. Environ., 93, 1�17. Song, C. 2005. Spectral mixture analysis for subpixel vegetation fractions in the urban environment:
how to incorporate endmember variability? Remote Sens. Environ., 95, 248�263.

32
Song, C., Woodcock, C. E., Seto, K. C., Lenney, M. P. & Macomber, S. A. 2001. Classification and change detection using Landsat TM data: when and how to correct atmospheric effects? Remote Sens. Environ., 75, 230�244.
Souza, C., Jr., Firestone, L., Silva, L. M. & Roberts, D. 2003. Mapping forest degradation in the Eastern Amazon from SPOT 4 through spectral mixture models. Remote Sens. Environ., 87, 494�506.
Tammaru, T. 2000. Suburbanisatsioon Eesti linnastumises. In Inimesed, ühiskonnad ja ruumid. Inimgeograafia Eestis (Jauhiainen, J. & Kulu, H., eds), pp. 77�88. Tartu Ülikooli Kirjastus, Tartu.
Tompkins, S., Mustard, J. F., Pieters, C. M. & Forsyth, D. W. 1997. Optimization of endmembers for spectral mixture analysis. Remote Sens. Environ., 59, 472�489.
Weng, Q., Lu, D. & Schubring, J. 2004. Estimation of land surface temperature�vegetation abundance relationship for urban heat island studies. Remote Sens. Environ., 89, 467�483.
Wu, C. 2004. Normalized spectral mixture analysis for monitoring urban composition using ETM+ imagery. Remote Sens. Environ., 93, 480�492.
Wu, C. & Murray, A. T. 2003. Estimating impervious surface distribution by spectral mixture analysis. Remote Sens. Environ., 84, 493�505.
Yang, X. & Liu, Z. 2005. Use of satellite-derived landscape imperviousness index to characterize urban spatial growth. Comput. Environ. Urban Systems, 29, 524�540.
Zhang, J., Rivard, B. & Sánchez-Azofeifa, A. 2005. Spectral unmixing of normalized reflectance data for the deconvolution of lichen and rock mixtures. Remote Sens. Environ., 95, 57�66.
Linnaliste alade kaugseire: Tartu kohalt saadud satelliidipiltide spektrisegu lineaarne lahutamine
Tõnis Kärdi
Linnadele on omane väga heterogeenne ruum, mis põhjustab erinevate pin-
dade üheaegset koosesinemist keskmise ruumilise lahutusega satelliidi Landsat skanneri Thematic Mapper (TM) sensori hetkvaateväljas. Artikli peamiseks ees-märgiks on kaardistada taimkattega kaetud maapinna, vettpidava pinna ja taim-katteta mullapinna paiknemist Tartu linnas ja selle lähiümbruses Landsati TM-i satelliidipiltidelt aastatel 1988, 1995 ja 2001. Eelnimetatud maakatete kaardista-miseks on kasutatud spektrisegu lineaarse lahutamise meetodit. Leitud 1995. aasta fraktsioonipiltidele on antud veahinnang Eesti põhikaardi alusel. Spektrisegu lahutamise üldine viga on 9% (taimkate ja taimkatteta mullapind 6%, vettpidav pind 15%).