remote sensing coral reefs curriculum - noaa's coral reef
TRANSCRIPT

Remote Sensing and Coral Reefs
A Curriculum for 4th - 6th Grade Students
Satellites have revolutionized communication, entertainment, and scientific monitoring. It becomes increasingly relevant for our 21st-century students to learn about these objects that hover around our planet. Satellite monitoring of the environment around coral reefs offers invaluable information to those working to preserve these unique ecosystems. The lessons in this unit are designed to be taught in sequence; however, many of the activities are suited to teaching in isolation. This science unit is appropriate for grades four through six. Some concepts tend to be abstract, so depending on students' ability and background knowledge, this unit might be more suitable in a gifted and talented setting. On this CD, you will find the PDF lesson plans and Power Point presentations. You may choose one file with the entire curriculum, or individual lesson plans.
During the summer of 2004, Margaret "Peggy" Koenig created this curriculum unit for NOAA Coral Reef Watch as part of the Earth/Space Science Internship Program funded by the Maryland Space Grant Consortium in collaboration with Johns Hopkins University. The unit was first launched by Ms. Koenig at the Satellites and Education Conference XVII, hosted by the
Satellites in Education Association (SEA) in Los Angeles, CA in August of 2004. Ms. Koenig has taught in Baltimore County Public Schools since 1998, and currently teaches fifth grade at Hillcrest Elementary School in Catonsville, Maryland. She is a graduate of the College of Notre Dame of Maryland and Loyola College, and is pursuing a second Master's degree from Johns Hopkins University. Her internship with NOAA Coral Reef Watch was part of her work toward this degree: a Master of Science in Education with a concentration in Earth/Space Science. MORE RESOURCES: For more information about the Earth/Space Science Internship Program, see http://www.mdspacegrant.org/ssip_about.html. The website that hosts these lesson plans can be found at http://coralreefwatch.noaa.gov/satellite/education/reef_remote_sensing.html. For more about NOAA Coral Reef Watch, and to find current data, please visit our website at http://coralreefwatch.noaa.gov/satellite/. For more information about all of NOAA’s coral reef activities, including more education resources, please visit the NOAA Coral Reef Conservation Program at http://coralreef.noaa.gov/. If you have questions about the lesson plans or satellite monitoring, please send us an e-mail at [email protected].
Table of Contents Acknowledgements ......................................................................................................... 3 Introduction..................................................................................................................... 4 Culmination of Remote Sensing and Coral Reef Unit ............................................. 5 Lesson #1: Remote Sensing and the Electromagnetic Spectrum........................ 6
Beyond the Red activity .......................................................................................... 13 Spectrum poster ....................................................................................................... 17
Lesson #2: Altimetry .................................................................................................. 19 Radar Run activity .................................................................................................... 25 Satellite Altimetry Facts ....................................................................................... 29
Lesson #3: Phytoplankton and Ocean Color ........................................................... 31 Phytoplankton Farming activity ............................................................................. 39 Phytoplankton Facts ................................................................................................. 43 Blooming Algae activity ........................................................................................... 46 Ocean Color Evaluation ............................................................................................ 47
Lesson #4: Introduction to Coral Reefs................................................................. 49 Why Is the Ocean Salty? ....................................................................................... 54 Corals’ Comfort Zone activity ................................................................................ 57 Shoebox Coral Reef activity .................................................................................. 59
Lesson #5: Symbiosis and Coral Anatomy .............................................................. 61 Symbiotic Images ..................................................................................................... 66 Corals 101 presentation ........................................................................................... 73 Edible Coral Polyp activity ...................................................................................... 79
Lesson #6: Sea Surface Temperature and Coral Bleaching............................... 80 Coral Bleaching teacher demonstration .............................................................. 85 What Happened to the Coral? ............................................................................... 87 Pinpointing Peril ......................................................................................................... 90
Lesson #7: Conservation............................................................................................. 93 Oily Mess activity ..................................................................................................... 98 Threats to Coral Reefs presentation................................................................. 101 Coral Quotations ..................................................................................................... 106
Peggy Koenig June 2004
2

Acknowledgements The six weeks I spent as an intern at NOAA would not have gone so smoothly if not for the guidance and patience of so many. During the course of the internship, I gathered a tremendous amount of information and relied heavily on the scientists around me. Dr. Eric Bayler, chief of the Oceanic Research and Applications Division, was most helpful in steering me toward a particular scientist for help on specific topics for this unit. I am grateful to him for finding the funds so that I could present at the Satellite Educators Association Conference. I would like to thank the NESDIS Coral Reef Watch team for allowing my placement with them, especially Dr. Alan Strong, Dr. Scott Heron, Dr. Gang Liu, Felipe Arzayus, Dr. William Skirving, and Chunying Liu. I appreciated having fellow intern Chinyere Mgbenka nearby since she “showed me the ropes.” NESDIS’ Laboratory for Satellite Altimetry team provided a great deal of technical information. Special thanks to Dr. Bob Cheney, Dr. Walter Smith, Dr. Laury Miller, Dr. Karen Marks, and Dr. John Lillibridge. Dr. Mike Ondrusek of the Ocean Color team provided me with a great deal of resources. My first few days would not have gone so smoothly if not for Aaron Saks, Software and Training Specialist.
Thank you to the Maryland Space Grant Consortium, especially Anne Anikis, for finding me this placement for my internship. Thank you to Johns Hopkins University’s School of Professional Studies in Business and Education, and especially to my instructor throughout the internship experience, Dorothy Pesce.
There are two people to whom I owe a debt of gratitude. Alissa Barron of NOAA’s Coral Reef Conservation Program and Scott Heron of Coral Reef Watch co-coordinated my internship. These two individuals bent over backwards to help me. Alissa paved the way for this science unit to be made available to other educators through NOAA publications and made sure that I was aware of all the resources at hand. Scott cheerfully proofread all lesson plans and offered constructive feedback, lending his expertise as a scientist. He took the time to teach me what I did not understand and answered my countless questions every day. Scott and Alissa are responsible for my presenting at the Satellite Educators Association Conference.
Finally, special thanks to my mother, Sue, and my brother, Larry, for their everlasting supply of support, advice, and encouragement.
Peggy Koenig June 2004
3

Introduction Satellites have revolutionized communication, entertainment, and scientific monitoring and collection of data. As students in the 21st century, it becomes increasingly relevant for children to learn about these objects that hover around our planet. Satellite monitoring of the environment around coral reefs offers invaluable information to those working to preserve the unique ecosystems.
The lessons in this unit on coral reefs and remote sensing are designed to be taught in the sequence they are presented, however, many of the activities are suited to teaching in isolation. This science unit is appropriate for use in grades four through six. Some concepts and skills tend to be abstract, so depending on the ability level and background knowledge of your students, this unit might be more suited in a gifted and talented setting.
Peggy Koenig June 2004
4

Culmination of Remote Sensing and Coral Reef Unit One entertaining connection to the topic of coral reefs is the movie “Finding Nemo.” Consider rewarding your class with a viewing of it.
Hold a “Coral Reef Open House” and invite other grade levels or even the community to your school. Use the available space in the gymnasium, cafeteria, or classrooms to:
• Have students set up their “Compact Coral Reefs” from the introductory lesson to reefs.
• Depending on the resources available to you, either: o Have students make an edible coral polyps display from the
Symbiosis lesson. To make a colony, they should place more than one marshmallow on a plate, touching so that the melted chocolate bonds them together.
o Set aside a location for open house visitors to make their own edible coral polyps. Select some of your students to be the “teachers” at this station, instructing how to make the polyp and especially one’s actual anatomy.
• Select some students to conduct the “Blooming Algae” demonstration for visitors.
• In the computer lab, allow students to share their PowerPoint presentations on coral reef conservation from the final lesson of this unit.
Peggy Koenig June 2004
5
Lesson #1: Remote Sensing and the Electromagnetic Spectrum Introduction/Rationale Students have seen rainbows in the sky, on a soap bubble, or even from the spray of a garden hose. They should already possess an understanding that white light is the combination of all colors of the spectrum. In addition, students should already know that the climate is warmest around the equator and coolest around the poles.
The purpose of this lesson is two-fold; to teach students that energy from the Sun can be measured with a thermometer, and that there is measurable energy beyond the visible spectrum, specifically, the ultraviolet and infrared wavelengths. From these realizations, students will have the foundation of knowledge to help understand how satellites measure sea surface temperature from space. Lesson Concepts and Skills Infrared radiation Ultraviolet radiation Materials Six to eight ultraviolet beads strung together, per group Flashlight (labeled “incandescent bulb, white light”) Fluorescent work light (labeled “fluorescent bulb, white light”) Halogen light source (labeled “halogen bulb, white light”) Ultraviolet light (labeled “ultraviolet light”) Glass prisms for each group Three alcohol thermometers per group Black paint or black permanent marker (for blackening thermometer bulbs) Cardboard box per group Stopwatch per group Copies of “Beyond the Red” packets for each student Spectrum posters Transparencies of world map for pairs of students Orange and blue transparency markers for each pair Overhead projector Computer with projector for teacher demonstration Access to computer lab, if possible (for Extension)
Peggy Koenig June 2004
6

Preparation • Blacken the bulbs of the thermometers using black paint (careful to
use the same amount on each bulb) or a black permanent marker. • Secure three thermometers together, making sure the scales line up. • Cut a notch out of the top edge of the box so that it holds the prism
securely but allows for rotation. • Make transparencies of a world map (preferably with the Pacific in
the center) for each pair of students Teaching Strategies Employed Guided discovery Cooperative learning Direct instruction Time Frame One 90 minute class period Target Audience Grade five National Science Content Standards As a result of their activities in grades 5-8, all students should develop abilities necessary to do scientific inquiry. As a result of their activities in grades 5-8, all students should develop an understanding of transfer of energy. Behavioral Objectives Students will conclude that each color of the spectrum has a different amount of thermal energy by measuring temperature with a thermometer. Students will infer that there is an invisible band of the spectrum by measuring temperature beyond the visible light. Engagement Play the song “Rainbow Connection” by the Muppets. While they are listening, have students brainstorm all of the different places rainbows
Peggy Koenig June 2004
7

appear naturally. (In the sky, soap bubbles, surface of an oil or gas spill, through a decorative prism, on a CD) Have students share their ideas with the class. Review the order and colors of the spectrum (ROY G. BIV). Tell students that today they are going to learn about energy that is not visible, but is measurable. Divide students into groups of three or four. Provide each group with a string of ultraviolet beads, telling them only that they are “special beads.” (Make sure that classroom shades are closed and/or students are working away from sunlight.) Instruct them to conduct an initial observation of the beads in the classroom (they should be colorless). Shut off the lights. Provide groups with different light sources to observe any changes in beads. Students should discover that the beads change to bright colors only when exposed to ultraviolet light. Open the window shades or send students outside to observe what effect natural light has on the beads (they change to bright colors). Exploration Distribute “Beyond the Red” handouts to students. Read through and discuss as a class. Divide students into the same groups as those from the Engagement. Provide each group with a prism, thermometer, box, and stopwatch. Lead groups outside, in direct sunlight. Circulate to monitor and assist the groups. Remind students to answer the questions at the end of the experiment. Explanation Lead the class in a discussion of what they observed during the “Beyond the Red” experiment. They should have observed the highest temperature in the colorless area beyond the red. Display the poster of the visible spectrum. Explain that there is energy traveling all around us that we cannot see. When the temperature rose in
Peggy Koenig June 2004
8

the area beyond the red, that thermometer was actually measuring infrared energy. Infrared energy can be detected in the form of heat. Additionally, the beads from the beginning of the lesson can sense the energy beyond the violet, called ultraviolet radiation. (Identify the infrared and ultraviolet wavelengths’ location on the spectrum poster with labeled sticky notes.) Ask students if a person must touch an object to tell whether it’s hot or cool. (No.) Ask them to cite examples as proof. (Standing near a fire, opening the door to the refrigerator, etc.) Tell students that scientists can detect infrared energy all around us by using special sensors, cameras, or even satellites in space! Direct students to the infrared images at http://coolcosmos.ipac.caltech.edu/image_galleries/ir_profiles.html. Click on a portrait and ask students why they think the faces are different colors. (The colors show different temperatures.) Point out the scale next to each image, which indicates temperature based on color. Ask where the colder parts of a person’s head are (hair, tip of nose, ears). Where are the warmer parts? (Forehead and neck generally.) Tell students that the reason they can detect these hot and cold temperatures is because of the infrared waves traveling through the air. Additionally, scientists who are studying coral reefs use satellites that sense infrared energy so that they can monitor the temperature of the ocean at any time of the day. N.B. Since infrared energy is not part of the visible spectrum, it can be detected 24 hours a day, no matter whether it is dark or light out. Evaluation Assign students to work with a partner. Distribute transparency maps and markers. Tell the students that they are going to do the job of an infrared-sensing satellite and identify the temperature of the ocean. Using what they know of Earth’s climate, instruct students to shade in orange the parts of the ocean that are the warmest and shade blue the parts that are the coolest. (Depending on your students’ background knowledge, this might work better as a whole-class activity.) Have each pair
Peggy Koenig June 2004
9

display their transparency on the overhead projector for the rest of the class to see. Students should explain their reasoning behind the predicted hot and cold areas. Display maps of sea surface temperature from http://coralreefwatch.noaa.gov/satellite/current/key_sst_50km_field.html. Discuss which are the warm areas and which are the cooler areas of water. (Be sure to point out that ice is white on the image.) Have students continue to work with their partners to complete Part II of the “Beyond the Red” packet. Display the Earth image taken from the visible spectrum http://earthobservatory.nasa.gov/Newsroom/NewImages/images.php3?img_id=4573 to help with their answers. Extension Have students see the world with infrared vision on the website http://coolcosmos.ipac.caltech.edu/cosmic_games/what/img11.html. They are shown an infrared image and then must guess what it is. By moving the mouse over the image, a caption detailing the answer is revealed. Bibliography Thaller, M. (n.d.). Herschel infrared experiment. Retrieved June 25, 2004,
from http://coolcosmos.ipac.caltech.edu/cosmic_classroom/classroom_activities/herschel_experiment2.html.
Further Resources Cosmic Colors http://spaceplace.jpl.nasa.gov/en/kids/cosmic/index.shtml# Kid-friendly information about the electromagnetic spectrum, including interactive images of solar system objects viewed at different wavelengths. Pixel This! http://spaceplace.jpl.nasa.gov/en/kids/p_imager/pixel_this.shtml#Game in which children must identify an object when shown a low resolution image of it.
Peggy Koenig June 2004
10

UV beads are available from Educational Innovations, Inc. 362 Main Avenue Norwalk, CT 06851 Toll Free: 888-912-7474 Direct link to UV Bead page http://www.teachersource.com/direct/33370 or Arbor Scientific P.O. Box 2750 Ann Arbor, MI 48106-2750 Direct link to UV Bead page http://www.arborsci.com/Products_Pages/Light&Color/LightBuy6.htm
Peggy Koenig June 2004
11

Student __________________
Assessment (Rubric) Areas Assessed Points
Possible Points Earned
Student’s responses indicated a basic understanding of the infrared part of the spectrum.
6
Each response included two or more reasons citing strengths of visible or infrared images
4
Student worked cooperatively, participating in all activities
2
TOTAL 12
Comments:
Peggy Koenig June 2004
12

Name _____________________ Date _____________________
Beyond the Red activity
PART I QUESTION: Do different colors of the spectrum have the same temperature? HYPOTHESIS: __________________________________________________________________________________________________________________________because___________________________________________________________________________________________________________________ MATERIALS Cardboard box (from photocopier paper) Glass prism Three thermometers with blackened bulbs Tape White sheet of paper Stopwatch PROCEDURE
1. Find a sunny location outside. Set the box on the ground and place the white paper at the bottom.
2. Place the thermometers in a shaded portion of the box. Use the
stopwatch to time five minutes, then record the temperature of the three thermometers. This is the air temperature.
3. Turn the box so that the notch side is closest to the sun. Insert the
prism into the notch.
4. Rotate the prism to find the widest spectrum displayed on a shaded portion of the white paper (see next page).
Peggy Koenig June 2004
13

5. Place the thermometers on the spectrum so that one is in the blue
area, another is in the yellow, and the third is just beyond the red area. (See below)
6. Using the stopwatch, observe and record the temperatures of the
three thermometers during five minutes’ time.
7. Answer the conclusion questions.
AIR TEMPERATURE Thermometer 1 Thermometer 2 Thermometer 3
Temperature (Celsius)
Peggy Koenig June 2004
14

SPECTRAL TEMPERATURES Elapsed Time Blue Temperature Yellow
Temperature Beyond the Red
Temperature 1 minute 2 minutes 3 minutes 4 minutes 5 minutes
CONCLUSION QUESTIONS Do different colors of the spectrum have the same temperature? (Prove it using what you observed.) __________________________________________________________________________________________________________________________ Was your hypothesis correct? __________________________________________________________________________________________________________________________ What do you think happened? (Try to explain any differences between the temperatures.) _______________________________________________________________________________________________________________________________________________________________________________________
Peggy Koenig June 2004
15

______________________________________________________________________________________________________________________________________________________________________________________________________________________________________________________________________________________________________________________________________________________________________________
3. Name the senses that a person uses to detect infrared energy. Explain your answer using what you have learned about the infrared part of the spectrum.
______________________________________________________________________________________________________________________________________________________________________________________________________________________________________________________________________________________________________________________________________________________________________________
2. Sometimes scientists need to use the visible pictures of Earth and not infrared. Describe any strengths that visible pictures might have over infrared.
Peggy KoenigJune 2004
16
Beyond the Red PART II
1. Compare the infrared picture that shows ocean temperature with the regular (visible light) picture of Earth. Why might a scientist choose to use an infrared image instead of a visible one? ______________________________________________________________________________________________________________________________________________________________________________________________________________________________________________________________________________________________________________________________________________________________________________

Peggy Koenig June 2004
17
Peggy Koenig June 2004
17
Spectrum poster

Peggy Koenig
July 2004 18

Lesson #2: Altimetry Introduction/Rationale Many students are aware that there are satellites orbiting around the Earth. They probably can cite some applications of them that tie into their daily lives, namely satellite radio, satellite television, and meteorological reports on television. The purpose of this lesson is to introduce the use of satellites as a tool for studying the Earth. Students will learn how satellites help scientists monitor sea surface height. Lesson Concepts and Skills Radar – Acronym for “radio detection and ranging.” Method of detecting the distance of an object by reflecting radio waves off a surface. Materials Six to eight different types of balls, there should be a mixture of bouncing
and non-bouncing ones (e.g. Styrofoam, tennis, ping pong, hacky sack) “Radar signal” sign for each group 10 meter length of rope with markings every 10cm for each group Stopwatch for each group Nine traffic cones per group (for use in the Radar Run setup) Electronic tape measure per group (if possible) Standard tape measure per group (if possible) Pair of cymbals (contact music teacher) Computer lab access or computer projector Copies of “Satellite Altimetry Facts” for each student Large copy of “Ocean Floor” image Teaching Strategies Employed Multi-sensory (kinesthetic approach) Cooperative learning Direct instruction Demonstration Time Frame One class period Target Audience Grade five
Peggy Koenig
July 2004 19

Teacher Preparation
• Select an open area where the students have room to run safely, such as the gymnasium or the playground.
• Label one traffic cone “Satellite” for each group, label the remaining eight with a letter A-H.
• Arrange the cones so that they are varying distances (not exceeding the length of the rope) from the satellite. (see below)
A B C D Satellite Ocean E F G H National Science Content Standard As a result of activities in grades 5-8, all students should develop understandings about scientific inquiry.
• Mathematics is important in all aspects of scientific inquiry. • Technology used to gather data enhances accuracy and allows
scientists to analyze and quantify results of investigations. As a result of activities in grades 5-8, all students should develop understandings about transfer of energy.
• Energy is a property of many substances and is associated with heat, light, electricity, mechanical motion, sound, nuclei, and the nature of a chemical. Energy is transferred in many ways.
Behavioral Objectives Students will accurately measure the distance to eight points on an uneven surface by conducting a simulation of satellite altimetry.
Peggy Koenig
July 2004 20

Students will create a two-dimensional model of the simulated ocean surface by graphing data from the Radar Run activity. Engagement Write the word “yes” on the board on one half of the room and “no” on the other half. Select six to eight student volunteers (depending on the number of balls available for the demonstration) and give each one a ball. Be sure to place the students with balls that bounce on the “yes” side and those without bouncing balls on the “no” side. Instruct the class that they will observe a demonstration and then need to determine how the yes and no groups were categorized. Have the volunteers drop the balls, and then ask the rest of the class what made some of the balls a yes and others a no. (Their ability to bounce.) Tell students that all the balls in the yes group have something in common with satellites, and that in today’s lesson they will find out what that commonality is. Exploration Inform students that they will participate in a simulation of a satellite sensing the height of the ocean’s surface. Distribute the “Radar Run” paper to all students. Review the directions as a class. Point out that it is impossible to move through the air in the same direction as a radar signal, therefore our simulation is turned on its side. Divide students into groups of six. Lead them to the area set aside for the Radar Run. Distribute materials. Circulate among the groups. Once the simulations are complete, return to the classroom. (If possible, keep one set of traffic cones in place until the “Extension” part of the lesson.) Explanation Tell students that light is not instantaneous, it takes a brief time to travel from one place to another. The speed of light is measurable. In fact, light’s speed is 300,000 km/sec (186,000 mi/sec.), as is ultraviolet radiation’s and infrared’s. If people could travel that fast, we could circle Earth seven
Peggy Koenig
July 2004 21
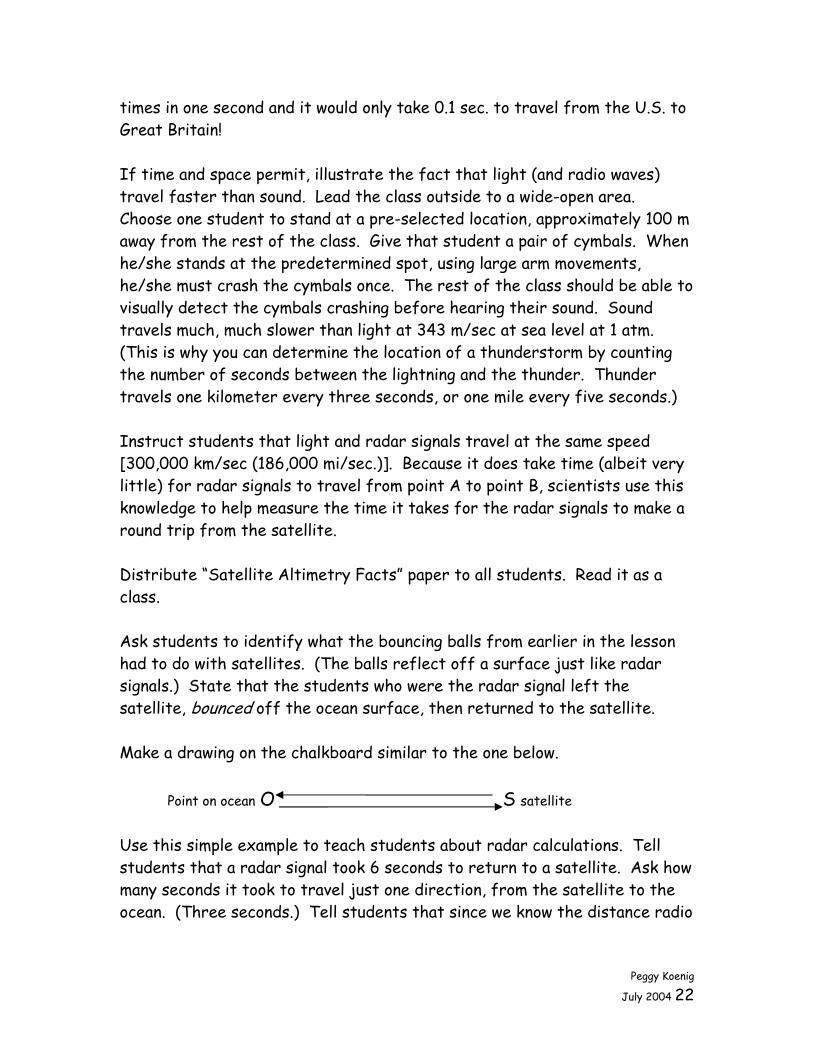
times in one second and it would only take 0.1 sec. to travel from the U.S. to Great Britain! If time and space permit, illustrate the fact that light (and radio waves) travel faster than sound. Lead the class outside to a wide-open area. Choose one student to stand at a pre-selected location, approximately 100 m away from the rest of the class. Give that student a pair of cymbals. When he/she stands at the predetermined spot, using large arm movements, he/she must crash the cymbals once. The rest of the class should be able to visually detect the cymbals crashing before hearing their sound. Sound travels much, much slower than light at 343 m/sec at sea level at 1 atm. (This is why you can determine the location of a thunderstorm by counting the number of seconds between the lightning and the thunder. Thunder travels one kilometer every three seconds, or one mile every five seconds.) Instruct students that light and radar signals travel at the same speed [300,000 km/sec (186,000 mi/sec.)]. Because it does take time (albeit very little) for radar signals to travel from point A to point B, scientists use this knowledge to help measure the time it takes for the radar signals to make a round trip from the satellite. Distribute “Satellite Altimetry Facts” paper to all students. Read it as a class. Ask students to identify what the bouncing balls from earlier in the lesson had to do with satellites. (The balls reflect off a surface just like radar signals.) State that the students who were the radar signal left the satellite, bounced off the ocean surface, then returned to the satellite. Make a drawing on the chalkboard similar to the one below. Point on ocean O S satellite Use this simple example to teach students about radar calculations. Tell students that a radar signal took 6 seconds to return to a satellite. Ask how many seconds it took to travel just one direction, from the satellite to the ocean. (Three seconds.) Tell students that since we know the distance radio
Peggy Koenig
July 2004 22

waves and light travel in a second, we can calculate that the satellite must be 900,000 km away because 300,000 km/sec x 3 sec = 900,000 km. Stress to students that in real life, the travel time is in fractions of a second and the calculations are more complicated. Additionally, scientists also have to take into account changes in the radio waves as they travel (Doppler shift). Project the image from the website http://www.jason.oceanobs.com/html/alti/principe_uk.html to better illustrate the mechanics of satellite altimetry. Evaluation Have students complete the “Evaluation” part of the Radar Run packet to create a diagram of the “ocean surface” using measurements from the activity. Hold a class discussion to review responses to evaluation questions. Extension In the computer lab or on the teacher’s computer projector, go to http://electronics.howstuffworks.com/radar.htm. Discuss additional uses for radar besides satellite altimetry. Return to the area where the ocean and satellite model is. Using an electronic tape measure such as the Strait Line Laser, measure the distances from the satellite cone to the ocean cones. (It might be necessary to have a student stand in place of the cone for a larger target.) Explain to students that the tape measure sends out waves and can calculate distance based on the amount of time it takes for the waves to bounce back. In the case of this tool, sound waves are sent out rather than radar. If possible, provide each group with an electronic tape measure and standard tape measure. Give them 10 minutes to experiment with each tool. Reassemble the class and hold a discussion about the pros and cons of each tool. Ask students to guess what would happen if the electronic tape measure were used from a higher in the atmosphere. (Changes in air
Peggy Koenig
July 2004 23

pressure would affect the travel time of the sound waves and the measurements’ accuracy would be affected.) If you only have one electronic tape measure and one standard one, pull a single group at a time to experiment with them. Meanwhile, the rest of the class could be working on the evaluation questions. Bibliography Brain, M. (n.d.). How radar works. Retrieved July 7, 2004, from
http://electronics.howstuffworks.com/radar.htm. Cheney, R.E. (2001). Satellite altimetry. Encyclopedia of Ocean Sciences,
2504-2510. Holle, R. (2002). How to estimate lightning’s distance. Retrieved July 8,
2004, from http://www.usatoday.com/weather/wlight1.htm. Miller, L. (2004). Satellite altimetry and the NOAA/NESDIS Sea-Surface
Height science team. Backscatter, 15, 29-34. NOVA Online. (1996). How fast is that? Retrieved July 7, 2004, from
http://www.teachersdomain.org/6-8/sci/phys/energy/erhowfast/ Smith, W.H.F. and Sandwell, D.T. (1996). Global seafloor topography.
Retrieved July 7, 2004, from http://www.ngdc.noaa.gov/mgg/image/global_topo_large.gif.
Peggy Koenig
July 2004 24

Name _______________________ Date _______________________
Radar Run activity Materials Radar Signal sign Rope Stopwatch Procedure
1. Select one person in your group to be the “Radar Signal.” He/she must wear the “Radar Signal” sign. Another person should be the timer and a third, the rope holder.
2. All students must stand at the “satellite” area designated by the traffic
cone.
3. Tie one end of the rope around Radar Signal person’s wrist. The rope holder person should hold the rope so that there is little to no slack. Both the Radar Signal person and rope holder must stand next to the “satellite” cone.
4. The person with the stopwatch will signal when to start the radar run
so that timing may begin.
5. The radar signal person must run as fast as she/he can, touch cone A with the hand attached to rope, and continue running straight back to the satellite, at which point timing should stop. As the radar signal is running, the rope holder should lightly hold the rope as it is pulled away. Once the rope has stopped moving, it should be grasped until the radar signal returns and it can be measured.
6. Count the number of marks on the rope from the rope holder to the
radar signal person’s hand. Remember that every mark is 10cm, or 1dm. Record in the Radar Run Data table below.
Peggy Koenig
July 2004 25

7. Complete next column by converting decimeters to meters, which is accomplished by multiplying the number by ten. Finally, record the time it took the radar signal to return back to the satellite.
8. Repeats steps 4-7 for cones B-H.
RADAR RUN DATA Ocean Surface Point
Distance between ocean and satellite in decimeters
(number of marks on rope)
Multiply decimeters by 10 to change to
METERS
Round trip running time of
radar signal A B C D E F G H
Peggy Koenig
July 2004 26
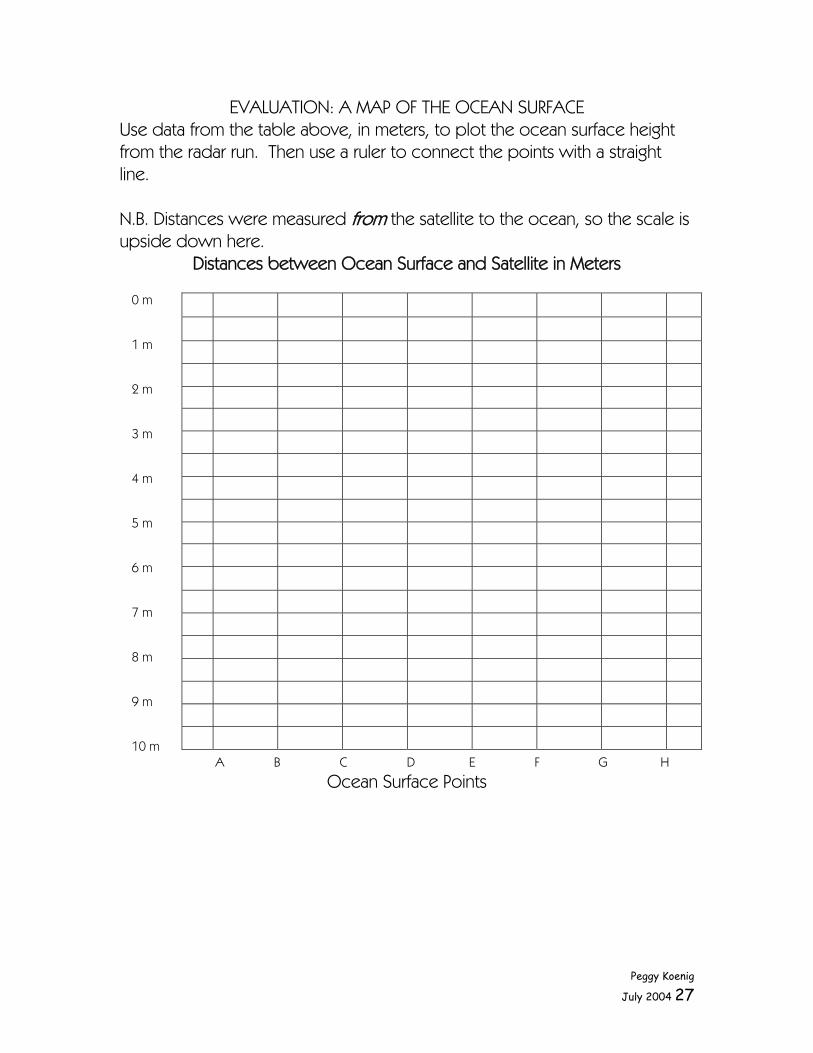
EVALUATION: A MAP OF THE OCEAN SURFACE Use data from the table above, in meters, to plot the ocean surface height from the radar run. Then use a ruler to connect the points with a straight line. N.B. Distances were measured from the satellite to the ocean, so the scale is upside down here.
Distances between Ocean Surface and Satellite in Meters
0 m
1 m
2 m
3 m
4 m
5 m
6 m
7 m
8 m
9 m
10 m
A B C D E F G H
Ocean Surface Points
Peggy Koenig
July 2004 27

_____________________________________________________________
_____________________________________________________________
____________________________________________________________________________________________________________________________________________________________________________________________________________________________________________________
____________________________________________________________________________________________________________________________________________________________________________________________________________________________________________________
Peggy Koenig
July 2004 28
EVALUATION QUESTIONS
1. Compare the graph you drew of the ocean surface with the actual
model from the Radar Run activity. Do they appear to be similar or are there large differences? Explain.
____________________________________________________________________________________________________________________________________________________________________________________________________________________________________________________
2. What did the Radar Run activity teach you about satellite altimetry? ______________________________________________________________________________________________________________________________________________________________________________________________________________________________________________________________________________________________________________________________________________________________________________
4. Using what you’ve read and experienced during this lesson, explain some limitations (negative points) of satellite altimetry. (For instance, does the data from the radar run really tell you the height of the ocean?)
3. Why is the height of the ocean important to scientists? (How do they use this information?)

Satellite Altimetry Facts
• Satellite altimetry – using radar pulses from a satellite to measure the height of the ocean
• Radar pulses travel at the speed of light, 300,000 km/sec (186,000 mi/sec.).
• The ocean is not level. Its surface is full of hills and valleys that form from an unevenness in gravity’s pull and the depth of the ocean. Scientists use the height of the ocean to help map what its floor looks like. (See image below.)
o An area of the Indian Ocean dips down 100 m because of this strong pull of gravity.
• Scientists use measurements from satellites to find out the speed and direction of ocean currents. This helps them:
o Study the climate and make predictions o Monitor the habits of fish and other ocean creatures, such as sea turtles o Track oil spills o Study drifting of debris (garbage)
• Sea level/ocean level is rising little by little each year (approximately 2 mm per year, or the thickness of a nickel). Because of the information gathered from satellites, scientists believe that the rising is caused by melted ice from the continents and glaciers.
o Since the Ice Age, sea level has risen 100 m because ice from Canada and Northern Europe melted over time.
o If all of Greenland’s ice melted, there would be a 70 m rise in sea level. If Antarctica’s ice melted, the rise would be greater than 100 m.
• Finally, satellite altimetry data are used in the measurements of ocean wave height and wind speed.
Peggy Koenig
July 2004 29

Peggy Koenig
July 2004 30
Ocean Floor
Scientists used satellite data to create this image of the ocean floor. The colors show how deep the different parts of the ocean are. The orange areas are the “continental shelf,” which measure about 100 m below the surface. The yellow areas show where tectonic plates meet (“plate boundaries”) and are approximately 1000 m below the surface. The dark blue areas are around 3-5 km deep and show the “abyssal” zones of the oceans.

Lesson #3: Phytoplankton and Ocean Color Introduction/Rationale/Background Satellites are able to collect four types of ocean data: sea surface temperature, sea surface height, ocean color, and ocean roughness. Ocean color is affected by the amount of phytoplankton (algae) present. The greener the ocean, the more phytoplankton present; the bluer the ocean, the less phytoplankton there are. (Therefore, the beautiful blue of tropical waters actually signifies low productivity.) Phytoplankton hold such significance because they are the beginning of the food chain and they are early indicators of climate change since they depend on specific conditions for growth. Phytoplankton live in the surface, sunlit waters of the ocean. When they grow and reproduce, they absorb CO2 and other chemicals from the water. When large phytoplankton blooms occur, the surface waters lose CO2. This disturbs the previous equilibrium between ocean and atmosphere, and the ocean replenishes its CO2 by absorbing more from the atmosphere. This process is one of many processes that affect the concentration of carbon in the atmosphere and indirectly may play a role in the greenhouse effect. Lesson Concepts and Skills Phytoplankton - microscopic green plant component of the plankton that is
responsible for most of the photosynthetic activity in the ocean Materials Chart paper, one piece per group of four or five students Markers for use on chart paper, one per group Masking tape or magnets Copies of the “Phytoplankton Farming” packet for each student Wax pencils (or masking tape and a pen) Two containers 250-500 mL, either clear glass or plastic Eye droppers Algae sample (from an aquarium, pond, or scientific supply company) Liquid plant fertilizer Water Aluminum foil cut into 10 cm x 10 cm square pieces, two per group Sunny classroom location
Peggy Koenig
July 2004 31

Green paint samples from a home improvement store’s paint department, for each group
Copies of “Phytoplankton Facts” for each student Computer with a projector Beaker Healthy potted plant with leaves Petroleum jelly The following are used in the “Extension” simulation “Blooming Algae.” Decide whether it will be a teacher demonstration or group activity.
• 500 mL beaker or large glass vase • Approximately 120 mL (½ c.) light brown sugar • Approximately 60 mL (¼ c.) light corn syrup • Candy creatures (gummy worms, gummy fish, or gummy lobsters) • Cold water • Approximately 120 mL (½ c.) cooking oil • Approximately 60 mL (4 Tbsp.) Green decorative sugar
Poster or color transparency of “Carbon Cycle” diagram Copies of “Ocean Color Evaluation” for each group of four students Management/Preparation Consider having students set up the “Phytoplankton Farming” experiment two weeks before this lesson so that instruction may take place in one class period. Algae must be disposed of responsibly. Do not allow students to pour the algae cultures down the drain once the exploration activity is complete. Microwave the cultures until they boil (no harm will be done to the microwave). Once cool, pour down the drain. An alternate method for disposal is to add bleach to the cultures to make a 1% solution. Let them sit overnight, then pour them down the drain with plenty of running water. Teaching Strategies Employed Cooperative learning Guided discovery Time Frame Two weeks for the Exploration activity, one class period for the remainder of the lesson
Peggy Koenig
July 2004 32

Target Audience Grade five National Science Content Standards As a result of activities in grades 5-8, all students should develop
• Abilities necessary to do scientific inquiry • Understandings about scientific inquiry
As a result of activities in grades 5-8, all students should develop an understanding of populations and ecosystems. Behavioral Objectives Students will identify function of phytoplankton in the biosphere by conducting experiments and simulations and reading for information. Students will detect the presence of phytoplankton in bodies of water by examining ocean color in satellite images and classroom models. Engagement Divide students into groups of four or five. Distribute chart paper and markers to groups. On the chalkboard, draw a web with the word “Plants” in the center and four branches sprouting from it. Label the different branches “Appearance,” “Basic Needs,” “Where They Grow,” and “Size and Shape.” Instruct students to copy the web onto their chart paper. Tell students to brainstorm facts they know about plants and fill in the appropriate part of the web. Allow ten minutes for this activity and circulate to assist students. (If necessary, jumpstart the activity by filling in one or two items on the chalkboard example web so that students understand what you are looking for.) Stop the class after ten minutes, or when the bulk of their ideas are on paper. Provide masking tape or magnets to each group and have them secure their web to the chalkboard/wall. Next, tell the groups to select a spokesperson. One by one, have the spokespeople share their web while the rest of the class listens. At this point in the lesson, do not correct students’ mistakes on the web. The focus of the lesson is to teach them about plants in an unfamiliar setting – the ocean.
Peggy Koenig
July 2004 33

Leave the webs on display. They will be used again later in the lesson. Exploration Distribute “Phytoplankton Farming” packet to students. (This experiment takes place over the course of one to two weeks, so it might be beneficial to have students begin before the official phytoplankton lesson is taught.) Once the students have completely carried out the experiment and have written conclusions, hold a class discussion to review results and observations. Do not correct any responses until students have read about phytoplankton in the “explanation” section of the lesson. Explanation Distribute copies of the “Phytoplankton Facts” sheet to all students. Read and discuss as a class. Visit http://svs.gsfc.nasa.gov/vis/a010000/a010000/a010030/index.html to see an animation of upwelling. Review the basic needs of plants (sunlight, nutrients, carbon dioxide) and reinforce the fact that phytoplankton share those needs. Refer back to the “Phytoplankton Farming” activity. Ask students what made the phytoplankton/algae grow so much in the one sample. (Nutrients, or fertilizer.) To illustrate the fact that plants, and therefore phytoplankton, “breathe,” carry out these simple demonstrations. (Try to conduct both demonstrations simultaneously, if possible, to save time.) About 45 minutes before class begins, fill a beaker with water and drop a healthy, freshly gathered leaf into it. Place it in a sunny location by a window. It should remain there until the container feels warm, about one hour. Allow students to observe using a hand lens. They should see small bubbles on the surface of the leaf and the inside of the beaker.
Peggy Koenig
July 2004 34

For the second demonstration, find a healthy potted plant. Select one leaf to cover with petroleum jelly. Be sure not to remove the leaf from the plant and to cover both sides of the leaf. It should eventually turn yellow and die. Ask students how the bubbles got on the leaf and the beaker in the first demonstration. (Leaf released a gas while under water.) Tell students that the bubbles contained oxygen. Plants need carbon dioxide to live and they release oxygen into the atmosphere. Ask students to explain what happened in the second demonstration. (The petroleum jelly suffocated the leaf so that it could not take in carbon dioxide or release oxygen. Chlorophyll makes food for the plant and gives leaves their green color. Since the leaf could not make its own food, it quit making new chlorophyll and turned yellow.) Teach students that phytoplankton (along with grass and trees on land) play an important role in the carbon cycle by removing some of the excess carbon dioxide from the atmosphere. Display the carbon cycle diagram (below) and explain. Extension Conduct the “Blooming Algae” simulation. Decide whether to conduct this as a teacher demonstration or, if the materials are available, allow students to carry out the simulation in groups. For extra credit, allow students to work in a group and visit the site http://earthobservatory.nasa.gov/Study/PrecisionFarming/. They should read about the way farmers are using satellites to aid in maintaining their farmland. Instruct groups to write a summary of the article once they have read and discussed it. (Caution: all but the first page is a bit technical. Be sure to preview so that you may decide its appropriateness for your students’ abilities.) (Gifted and talented extension: In the computer lab, direct students to visit http://www.bigelow.org/hab/color.html. They should read the information on the page, focusing in particular on the “ocean optics” and “scattering and absorption” sections rather than the “harmful algae blooms.”)
Peggy Koenig
July 2004 35
Evaluation Have students collect the web from the “Engagement” portion of the lesson. Distribute a contrasting color marker from what they used earlier. Tell them to read what they wrote on the webs and make corrections and additions to the content. If you wish, have the spokesperson share these corrections with the class, or simply have students hang the webs again so that all may see. Ask students to brainstorm with a partner some negative outcomes of a phytoplankton bloom. (Blocking the sunlight from the bottom of shallow areas of the ocean which kills sea grasses - food for fish and other creatures. Decaying phytoplankton blooms eventually strip the water of oxygen.) Have students work in groups to complete the Ocean Color Evaluation paper. Assessment Use the rubric below to evaluate students’ progress throughout the lesson. Bibliography Bigelow Laboratory for Ocean Sciences. (n.d.). Toxic and harmful algal
blooms. Retrieved July 19, 2004, from http://www.bigelow.org/edhab/fitting_algae.html.
Brown, C. (1997). Long-Term Monitoring of Emiliania huxleyi Blooms.
Retrieved July 19, 2004, from http://cics.umd.edu/~chrisb/ehux.html. Feldman, G.C. (2004). Carbon: where does it all go?
http://oceancolor.gsfc.nasa.gov/SeaWiFS/LIVING_OCEAN/TEACHER4.html.
__________ (2004). Phytoplankton – all things great and small.
http://oceancolor.gsfc.nasa.gov/SeaWiFS/TEACHERS/sanctuary_4.html.
Goddard DAAC. (2000). Creeping Dead Zones. Retrieved July 19, 2004,
from
Peggy Koenig
July 2004 36
http://disc.gsfc.nasa.gov/oceancolor/scifocus/oceanColor/dead_zones.shtml.
Herring, D. (2001). Precision farming. Earth Observatory, Found at
http://earthobservatory.nasa.gov/Study/PrecisionFarming/, July 19, 2004.
Loeschnig, L.V. (1996). Simple earth science experiments with everyday
materials. New York: Sterling Publishing Co., Inc., 49-50. Macquitty, M. (1995). Eyewitness books: ocean. New York: Alfred A. Knopf.
26-27. SeaWiFS Project, NASA/Goddard Space Flight Center and ORBIMAGE.
(2002). Introduction to Emiliania huxleyi (Ehux). Retrieved July 19, 2004, from http://www.soes.soton.ac.uk/staff/tt/eh/.
Zike, D. (1993). The earth science book. New York: John Wiley and Sons,
Inc., 90-91.
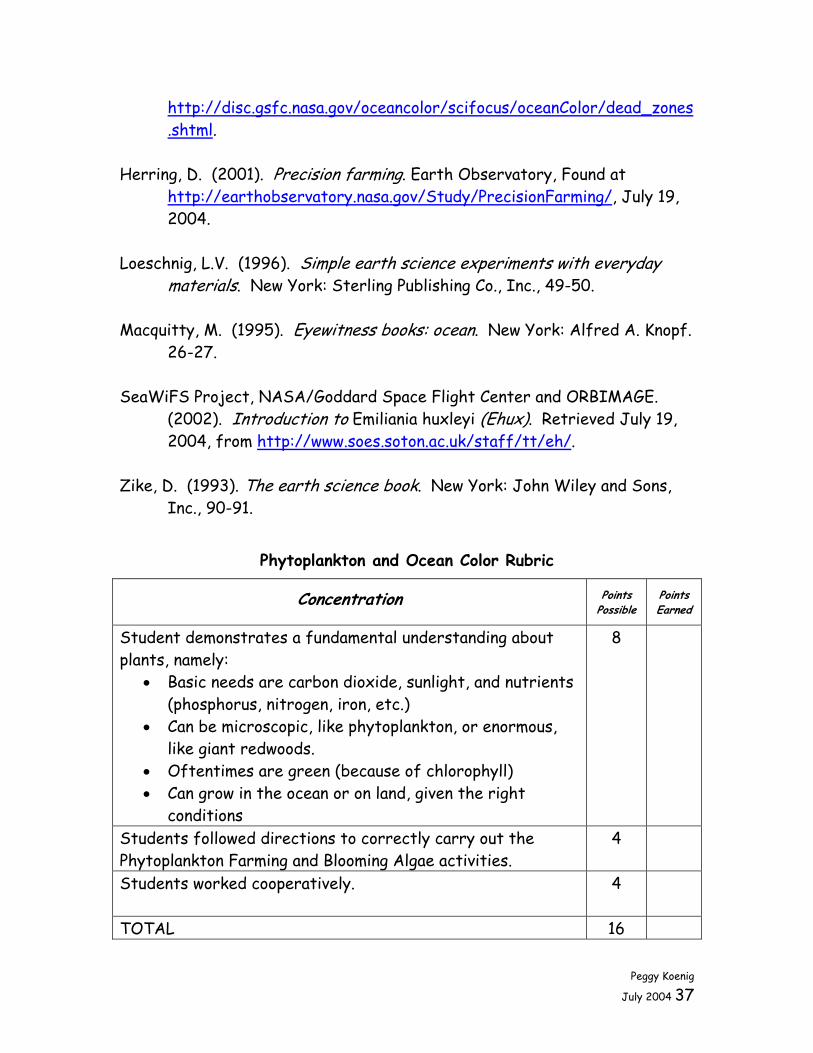
Phytoplankton and Ocean Color Rubric
Concentration Points Possible
Points Earned
Student demonstrates a fundamental understanding about plants, namely:
8
• Basic needs are carbon dioxide, sunlight, and nutrients (phosphorus, nitrogen, iron, etc.)
• Can be microscopic, like phytoplankton, or enormous, like giant redwoods.
• Oftentimes are green (because of chlorophyll) • Can grow in the ocean or on land, given the right
conditions Students followed directions to correctly carry out the Phytoplankton Farming and Blooming Algae activities.
4
Students worked cooperatively. 4 TOTAL 16
Peggy Koenig
July 2004 37

Peggy Koenig
July 2004 38
Carbon Cycle Diagram

Phytoplankton Farming activity (Modified from “Building a Bloom” http://www.bigelow.org/edhab/building_bloom.html)
Question/Problem Does adding nutrients to water affect living things, namely phytoplankton? Hypothesis After adding nutrients to water, I predict that ________________________________________________ _______________________________ because ______________________________________________ ____________________________________________________________________________________. Materials Wax pencils (or masking tape and a pen) Two containers 250-500 mL, either clear glass or plastic Eye droppers A few drops of the phytoplankton sample Liquid plant fertilizer, “Nutrients” Water Aluminum foil Sunny classroom location Paint samples
Peggy Koenig
July 2004 39
Procedure 1. Write your group’s name on the containers, either with the wax pencil or on masking tape. One should be
labeled “Control,” the other, “Nutrients.”
2. Add an equal amount of water to both containers.
3. Add an equal number of drops (just a few) of the phytoplankton sample to both containers.
4. Cover the top of the “Control” container with a piece of aluminum foil.
5. Add a few drops of the liquid plant fertilizer to the “Nutrients” container.
6. Cover the top of the “Nutrients” container with a piece of foil.
7. Place the containers in a sunny window so that the light and temperature conditions are the same.
8. Every two to three days, make observations about the color and smell of the phytoplankton in the containers. Write your observations on the “Data” table on the next page.
Peggy Koenig
July 2004 40

DATA Date: Date: Date: Date: Date: Date: Control General Observation What do you see? What looks different?
Nutrients General Observation What do you see? What looks different?
Control Smell (Don’t use opinions, be scientific and objective.)
Nutrients Smell (Don’t use opinions, be scientific and objective.)
Control Color (Use paint sample cards.) Nutrients Color (Use paint sample cards.)
Peggy Koenig
July 2004 41

Peggy Koenig
July 2004 42
Conclusions Answer in complete sentences.
1. Was your hypothesis correct? Explain. ____________________________________________________________________________________________
____________________________________________________________________________________________
____________________________________________________________________________________________
2. What do you think phytoplankton is another name for?
____________________________________________________________________________________________
3. What had the biggest effect on the phytoplankton? ____________________________________________________________________________________________
____________________________________________________________________________________________
____________________________________________________________________________________________

Phytoplankton Facts
Phytoplankton are microscopic floating plants that live in the ocean all
over the world. A teaspoon of sea water can contain as many as a million one-celled phytoplankton.
PLANKTON
http://www.bigelow.org/flowcam/flo_r2.html
They require sunlight, water, carbon dioxide, and nutrients for growth
and are only found in the ocean’s upper zones. Phytoplankton are the base of the ocean’s food web, so they support almost all things that live there.
Peggy Koenig July 2004
43

Marine Food Web
Phytoplankton are eaten by swarms of tiny, drifting animals, called
zooplankton that, in turn, are eaten by small fish, such as herring. Herring are eaten by larger fish, such as dogfish, which are then eaten by even larger fish or dolphins. Whale sharks and blue whales feed directly on zooplankton.
Studying phytoplankton is important because the world’s fish stocks
are affected by how much plankton there is for young fish to eat. More importantly, some scientists believe that phytoplankton can have an effect on the gases trapped within our atmosphere that change Earth’s climate. All of the world’s phytoplankton create at least half of the oxygen that we breathe. Scientists who use satellites to study ocean color are really looking at phytoplankton. There can be so many phytoplankton in one area that they actually change the water to green! From outer space, satellite sensors can distinguish even slight variations in color to which our eyes are not sensitive. Different shades of ocean color reveal varying concentrations of phytoplankton.
Basically, there are five essential reasons why scientists monitor
phytoplankton: Peggy Koenig
July 2004
44
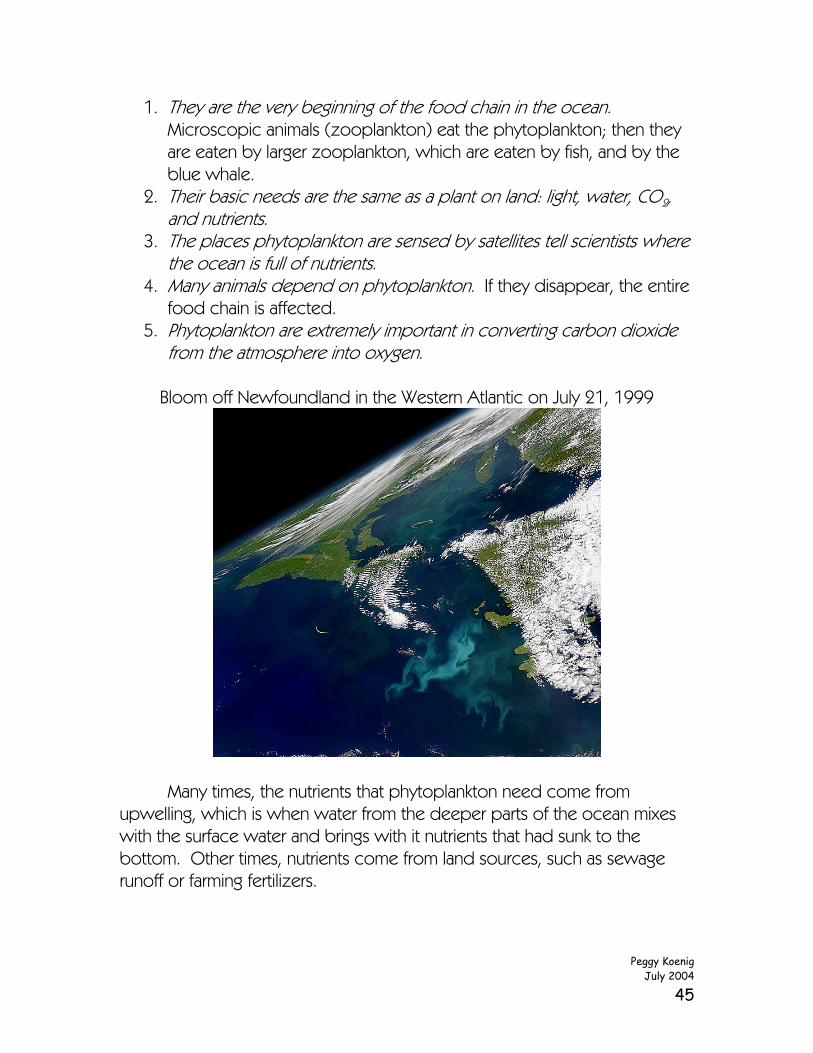
1. They are the very beginning of the food chain in the ocean. Microscopic animals (zooplankton) eat the phytoplankton; then they are eaten by larger zooplankton, which are eaten by fish, and by the blue whale.
2. Their basic needs are the same as a plant on land: light, water, CO2, and nutrients.
3. The places phytoplankton are sensed by satellites tell scientists where the ocean is full of nutrients.
4. Many animals depend on phytoplankton. If they disappear, the entire food chain is affected.
5. Phytoplankton are extremely important in converting carbon dioxide from the atmosphere into oxygen.
Bloom off Newfoundland in the Western Atlantic on July 21, 1999
Many times, the nutrients that phytoplankton need come from upwelling, which is when water from the deeper parts of the ocean mixes with the surface water and brings with it nutrients that had sunk to the bottom. Other times, nutrients come from land sources, such as sewage runoff or farming fertilizers.
Peggy Koenig July 2004
45

Blooming Algae activity Materials 500 mL beaker or large glass vase Approximately 120 mL (½ c.) light brown sugar 0.5 cm x 5cm strips of green “Fruit by the Foot” snack or “Fruit Roll-Up” Approximately 60 mL (¼ c.) light corn syrup Candy creatures (gummy worms, gummy fish, or gummy lobsters) Cold water Approximately 120 mL (½ c.) cooking oil Approximately 60 mL (4 Tbsp.) Green decorative sugar Procedure
1. Put a layer of brown sugar (about 1 cm thick) at the bottom of the beaker or vase. Place one end of the strips of the green fruit roll snack into the brown sugar. These represent sea grass.
2. Add the corn syrup until it covers the brown sugar. These two layers
represent the bottom of the ocean.
3. Place a gummy creature on the brown sugar near the side of the container so that you can make observations.
4. Gently add the water until it is 6-8 cm deep. You should see some
air bubbles rising from the bottom since it is a healthy environment.
5. Add a 2 cm layer of cooking oil so that it creates a top layer. This layer is called the photic zone because it receives the Sun’s light.
6. The green sugar represents healthy phytoplankton that are getting
enough sunlight, carbon dioxide, and nutrients. SLOWLY sprinkle a small amount of the phytoplankton onto the photic zone. Observe what it does.
7. Continue sprinkling the phytoplankton on the surface. What eventually
happens to it? What does this suggest about its basic needs?
Adapted from http://www.bigelow.org/foodweb/bloom1.html Peggy Koenig
July 2004
46

Names ___________________ ___________________ ___________________ ___________________
Date ___________________
Ocean Color Evaluation 1. Study the pictures below. Using what you know of ocean color and phytoplankton, explain what you observe in the “Mississippi River Delta Image.” ________________________________________________________________________________________________________________________________________________________________________________________________________________________________________________________________________________________________________________________________________________________________________________________________________________________________________________________________________________________________________ 2. Study the bottom two images. Do you think the cause of the water discoloration is the same in the Yangtze River and Pearl River images compared to the Mississippi image? Explain your reasoning. ________________________________________________________________________________________________________________________________________________________________________________________________________________________________________________________________________________________________________________________________________________________________________________________________________________________________________________________________________________________________________ __________________________________________________________________________________________________________________________
Peggy Koenig July 2004
47

Peggy Koenig July 2004
48

Lesson #4: Introduction to Coral Reefs Introduction/Rationale Coral reefs are known as the “rainforests of the sea.” They cover less than one percent of Earth’s surface, but are home to one quarter of known marine fish species. Scientists estimate that there are one to eight million undiscovered species living in and around the reef. Just like species in the rain forest, reef animals and plants contain medicinal compounds, many of which are just being discovered. Several important drugs have already been developed from chemicals found in coral reef organisms. AZT, a treatment for people with HIV infections, is based on chemicals extracted from a Caribbean reef sponge. Compounds from coral reefs have also yielded treatments for cardiovascular diseases, ulcers, leukemia, and skin cancer. In addition, coral's unique skeletal structure has been used to make the most advanced forms of bone grafting materials. More than half of all new cancer drug research focuses on marine organisms. Coral reefs are in trouble around the globe. Already, 20% of the world’s coral reefs have been lost and another 16% were severely damaged during the 1998 El Niño event. Scientists predict that another 25% may be lost by the year 2035 if human threats are not reduced. The purpose of this lesson is to introduce students to coral reefs by identifying their locations, both in the water and around the globe. Lesson Concepts and Skills
• Warm water rises, cooler water sinks • Reef building corals live in the top layer of the ocean because the
water is warm, and it is where sunlight penetrates Materials Access to a computer lab “Why Is the Ocean Salty?” Norwegian Tale Copies of “Corals’ Comfort Zone” packets for each student Prepare the following materials for each group of 4-6 students:
• 2 L (64 oz.) glass jar or glass bowl • 2 L (8 c.) warm water
Peggy Koenig July 2004
49

• 78 mL (1/3 c.) salt • blue food coloring • measuring cup • spoon • mixing bowl • paper cup • pencil or pen with point • refrigerator or freezer
Political map of Earth, per pair of students, with clearly marked lines of latitude and longitude
Shoebox for each student Teaching Strategies Employed Read aloud Cooperative learning Discovery model Time Frame Two 45-minute class periods Target Audience Grade five National Content Science Standards As a result of activities in grades 5-8, all students should develop
• Abilities necessary to do scientific inquiry • Understandings about scientific inquiry
As a result of activities in grades 5-8, all students should develop an understanding of populations and ecosystems. Behavioral Objectives Students will identify the relative depth of corals in the ocean by observing the behavior of cold and warm saltwater in an experiment. Students will gain a global understanding of coral reef life by reading for information and creating a model of a reef.
Peggy Koenig July 2004
50

Engagement Tell students that they are going to be learning about ocean life in today’s lesson. Ask students to think of facts they know about ocean and seawater. Elicit that oceans and seas are saltwater environments. Read aloud the tale from Norway that explains the saltiness of seawater (or, if desired, distribute copies of the tale to students and have them take turns reading aloud). Exploration Tell students that they are going to determine the layer of the ocean at which corals thrive by conducting an experiment. Distribute “Corals’ Comfort Zone” packets to all students. Read and discuss as a class. Instruct students to complete the hypothesis section. Divide class into groups of four to six students, and distribute materials to each group. Circulate to assist students as they work. They should answer the questions at the end of the packet. Explanation Distribute copies of the Time for Kids article “Can We Rescue the Reefs?” found at http://www.timeforkids.com/TFK/magazines/story/0,6277,59687,00.html. Read the article as a class, skipping the “Precious Underwater Habitats” and “Sucking the Life out of the Reefs” sections. (This content will be covered in a later lesson.) Discuss the content, reinforcing how valuable and fragile the reefs are. Explain to students that corals thrive in saltwater environments where the temperature is between 20 and 32ºC for a sustained period and the water is clear so that light can penetrate. Visit the site http://reefgis.reefbase.org/mapper.asp and click “topography” on the side menu to show students the locations of coral reefs around the world. Point out that most corals live between 30º N and S latitude. Discuss students’ responses to questions at the end of “Corals’ Comfort Zone.”
Peggy Koenig July 2004
51
Extension (This activity could be completed in class or as a long-term home assignment.) Create a shoebox reef by following the directions on the “Shoebox Coral Reef” handout. Evaluation Review the fact that corals live in warm water in the top layer of the ocean. Tell students that they actually are quite fragile creatures. Ask students to brainstorm some risks to corals that might occur because of their location. (Destruction from careless boating, harmful fishing practices, i.e. cyanide fishing and blast fishing, pollution, climate change, tourism, etc.) Revisit the global map of coral reefs at http://reefgis.reefbase.org/mapper.asp. Select on “Protected Areas” on the left hand menu, then click “Refresh Map.” Assessment Assign students to work with a partner. Distribute political maps of the Earth to each pair. Instruct the students that one partner must identify a location on the Earth by using the atlas or a classroom global map. The other partner must decide whether or not a coral reef could exist there, given a general knowledge of the conditions necessary. That partner must say, “It’s possible,” or “It’s impossible,” then explain why. Next, have students refer back to the site http://reefgis.reefbase.org/mapper.asp and click the pushpin button on the right of the map. A window will pop up in which students must type the latitude and longitude of a given location. That location will be displayed, and the presence or absence of brown spots will identify it as a coral reef. N.B. Instruct students that they should substitute “south” and “west” with a negative sign. Bibliography Castaldo, N.F. (2002). Oceans: an activity guide for ages 6-9. Chicago:
Chicago Review Press, Incorporated.
Peggy Koenig July 2004
52

NOAA’s National Ocean Service. (2004). Importance of coral reefs. Retrieved July 12, 2004, from http://oceanservice.noaa.gov/education/kits/corals/coral07_importance.html.
The Coral Reef Alliance. (2004). Why should I care? Retrieved July 12,
2004, from http://www.coralreefalliance.org/aboutcoralreefs/care.html.
West, K. (2002). Hands on projects about oceans. New York: The Rosen
Publishing Group, Inc.
Peggy Koenig July 2004
53

Why Is the Ocean Salty? A Tale from Norway
Once upon a time there were two brothers, one rich and one poor. It came to pass that on Christmas Eve the poor brother came asking the rich one for something to eat. The rich brother was tired of hearing his brother ask for things, so before the poor brother had even reached the house, he called out to him, “If you will promise to do as I ask, I will give you one of the large hams that is hanging from the chimney.” The poor brother called back to him, “I promise.” With that the older brother threw down the ham and said, “Good. Now go away and never come begging back here again.” The poor brother took his ham and walked away. On his way he met a man with a long, white beard. “Good evening,” said the old man. “Where are you headed?” The poor brother stopped and nodded at the old man. “I am going home to my wife.” “If you go just a bit farther you will come to an enchanter’s castle. Go inside. You will be asked by the enchanter’s trolls to sell your ham. Do not sell it, but instead trade it for an old coffee mill that rests beside the door you entered. Return to me with the coffee mill and I will tell you how to use it.” The poor brother thought it a bit strange but thanked the man and went on his way. After quite a while he finally reached the castle. He knocked on the huge door in front of him and instantly it opened. The trolls quickly surrounded him and asked for the ham, just as the old man had said. After much discussion, the trolls reluctantly agreed to trade the ham for the coffee mill. The poor brother carried the coffee mill back to the place where he had met the old man. The old man had waited for his return and quickly showed the poor brother how to use the coffee mill. To set the mill in action he merely had to tell it what he wished for and turn the handle, but to make it stop he needed to turn it on its side. After thanking the kind old man, the poor brother turned toward his home. By the time he arrived, it was very late. His wife had waited for his return before beginning to prepare their holiday meal. When he arrived it was much too late to prepare anything. The poor brother placed the coffee mill on the table, wished for a splendid meal, and turned the handle of the mill. In an instant
Peggy Koenig July 2004
54
the table was covered with a beautiful tablecloth, candles, and enough food for a king! The two sat down and enjoyed the feast. During the week after Christmas, the man and his wife gave a grand party for all of their friends and family. They used the coffee mill to provide food and drink for the party. The rich brother came and saw his brother’s new wealth. “How is it, Brother, that you come to have this grand party and yet last week begged at my door?” asked the rich brother. His brother was reluctant to tell his secret, but after a few days, he told him everything. Well, his brother decided that he must have the coffee mill and offered his brother a large sum of money for it. The previously poor brother agreed to sell it to him after the summer because he figured that he would use the coffee mill to get everything he needed before then and then sell it to his brother for a fine price. The end of summer finally arrived, and the coffee mill was sold. The other brother was in such a rush to get it home that he did not wait for directions. That night he wished for a delicious soup. His wish was answered and answered and answered, for he had not learned how to stop the mill. The soup filled all the dishes and all the pots and nearly flooded the house. He ran to his brother and demanded that he take the mill back. The previously poor brother said he would take it back, but he would charge his brother the same price he had sold it to him for. The brother agreed. The previously poor brother was now incredibly rich. He used his money to buy his wife a castle by the sea with gold turrets. Many people came to the castle to see who lived there. One visitor was a sea captain who saw the castle from his ship. When he arrived at the castle, he was greeted kindly and shown the now famous mill. “If I had this mill I would no longer need to sail the seas to buy cargoes of salt,” he said to his host. “Indeed,” said the previously poor brother. “I will sell the mill to you, if you so desire.” The sea captain paid a large sum for the mill and was so eager to get it to his ship (for he feared the man would change his mind) that he did not ask for directions on how to use the mill. Once the ship was far enough away from land, the captain took the mill out onto the deck. “I wish for salt,” he said to the mill. He turned the handle, and the mill began to give him salt. Since he did not know how to stop the mill, the salt
Peggy Koenig July 2004
55

kept coming. It filled the deck and then the ship. Eventually the ship cracked under the weight of the salt and sank to the bottom of the sea. The mill fell into the sea, where it is still grinding salt. And that is why the sea is salty.
Peggy Koenig July 2004
56
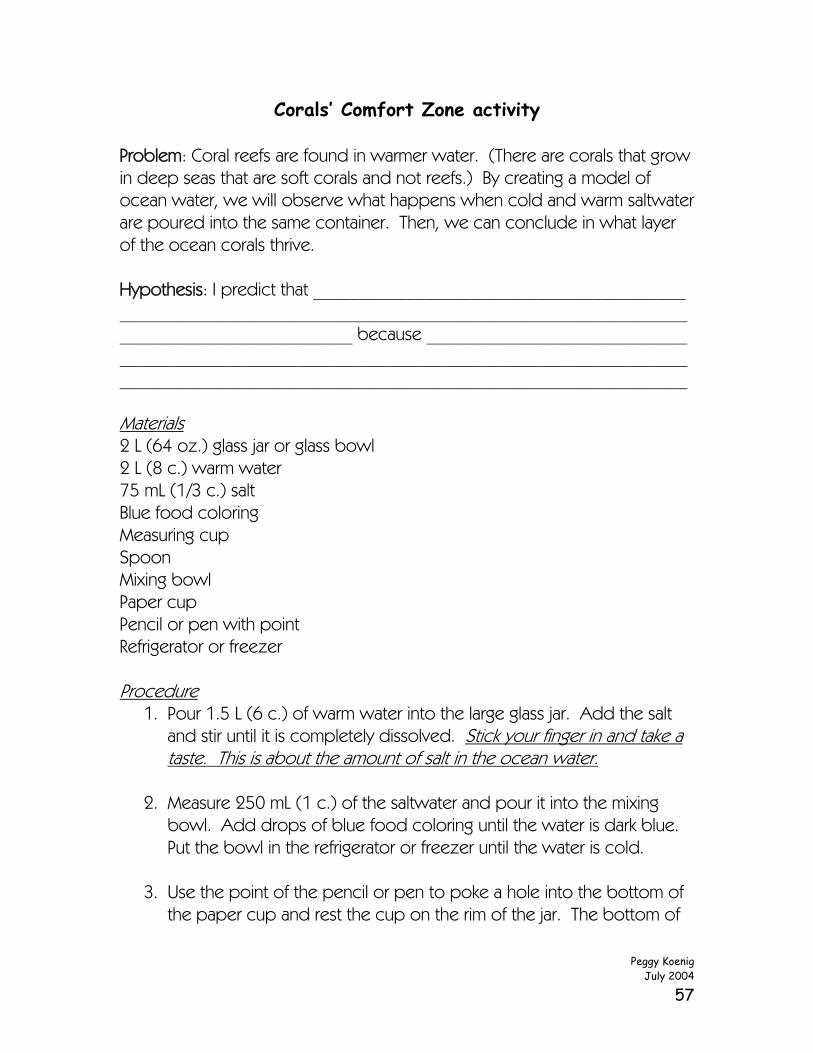
Corals’ Comfort Zone activity Problem: Coral reefs are found in warmer water. (There are corals that grow in deep seas that are soft corals and not reefs.) By creating a model of ocean water, we will observe what happens when cold and warm saltwater are poured into the same container. Then, we can conclude in what layer of the ocean corals thrive. Hypothesis: I predict that ________________________________________ ______________________________________________________________________________________ because ____________________________ __________________________________________________________________________________________________________________________ Materials 2 L (64 oz.) glass jar or glass bowl 2 L (8 c.) warm water 75 mL (1/3 c.) salt Blue food coloring Measuring cup Spoon Mixing bowl Paper cup Pencil or pen with point Refrigerator or freezer Procedure
1. Pour 1.5 L (6 c.) of warm water into the large glass jar. Add the salt and stir until it is completely dissolved. Stick your finger in and take a taste. This is about the amount of salt in the ocean water.
2. Measure 250 mL (1 c.) of the saltwater and pour it into the mixing
bowl. Add drops of blue food coloring until the water is dark blue. Put the bowl in the refrigerator or freezer until the water is cold.
3. Use the point of the pencil or pen to poke a hole into the bottom of
the paper cup and rest the cup on the rim of the jar. The bottom of
Peggy Koenig July 2004
57

the cup should be underwater. (If you’re using a bowl, a partner will need to hold the cup over the water.)
4. When the blue water in the refrigerator is cold, pour it very slowly into
the cup and observe. Observations & Conclusions 1a. Was your hypothesis correct? Describe what happened to the cold blue water when it was poured into the warm water. ____________________________________________________________________________________________________________________________________________________________________________________________________________________________________________________ b. Use crayons or colored pencils to draw what you observed. Label the drawing. 2. If corals grow in the warmer waters of the ocean, would a diver have to swim very deep to observe the animals? Explain. _________________________________________________________________________________________________________________________________________________________________________________________________________________________________________________________________________________________________________________
Peggy Koenig July 2004
58

Shoebox Coral Reef activity Materials Shoebox with lid Scissors Blue tissue paper Blue construction paper Pencil White craft glue Card stock or oak tag Shells (optional) Procedure
1. Poke a hole in the shoebox lid with the scissors, about 1.27 cm (½ inch) from the edge of the lid. Cut a window in the lid, leaving a 1.27 cm (½ inch) border all around the edges.
2. Place the lid on the tissue paper and trace around the outside edge of it with a pencil. Cut out the completed rectangle and glue it to the underside of the lid to cover the window. Place the lid aside.
3. Using scissors, cut a small peephole in the center of a small end of the
shoebox.
Peggy Koenig July 2004
59

4. Place the lid gently on the box and take a peek inside through the peephole. The blue tissue paper will let just enough light in to make your reef appear to be under the blue ocean waves. Start picturing your reef inside the box. Glue some blue paper or tissue paper to the inside of the box to cover the cardboard.
5. Visit http://www.coexploration.org/bbsr/coral/lessons/coralws.pdf to
print out copies of coral reef creatures. They will need to be colored and cut out. (Or, copy the illustrations from One Small Square Coral Reef, by Donald M. Silver.) Mount them on pieces of card stock or oak tag, checking to make sure that the box lid will fit with the coral pieces standing straight up.
6. Create a tab by folding down the bottom of the coral card stock so
that it will be able to stand in your box after it is glued to the bottom.
7. Glue the first piece of coral toward the front of your box. Gradually work towards the back with the remainder of the creatures, checking through the peephole to make sure they are visibly positioned.
8. After the coral is positioned, color, cut out, and mount the reef
creatures. Glue them to the back wall of the box, the side walls, or even the coral. If desired, add shells to the floor of the box to make it resemble the sea floor.
9. Place the lid on the box once you are finished. Take a peep through
the peephole.
- Modified from Oceans: an Activity Guide for Ages 6-9, by Nancy F. Castaldo.
Peggy Koenig July 2004
60

Lesson #5: Symbiosis and Coral Anatomy Introduction/Rationale This lesson’s aim is to build students’ background knowledge before teaching coral bleaching in a later lesson. Students will learn the basic structure of corals and build upon the understanding that corals are animals and zooxanthellae are plants. They will be introduced to the concept of symbiosis through other examples in nature. Finally, students will learn the mutualistic symbiosis of corals and zooxanthellae. Lesson Concepts and Skills Polyp – Coral is comprised of these tiny animals living in colonies. Polyps
resemble inverted jellyfish. Zooxanthellae – Tiny plants (algae) living inside coral polyps Symbiosis - a relationship between two species of organisms in which both
members benefit from the association (mutualism), or where only one member benefits but the other is not harmed (commensalism), or where one member benefits at the expense of the well-being of the other (parasitism)
Materials Boom box Copy of “Happy Together” by The Turtles One copy of “Symbiosis” from
http://www.pz.harvard.edu/ucp/curriculum/ecosystems/s5_res_symbiosis.pdfOne copy of “Symbiotic Images” Access to a microwave or hot plate for melting chocolate Gather the following for each student:
• Small paper plate • 1 large marshmallow (or section of a banana or a strawberry) • Toothpick (for boring holes in marshmallow) • Six 2-inch strips of red licorice (either whip or regular cut into thin
strips) • ½ square (½ oz.) white baking chocolate or hard candy coating • 1 tsp. blue, green, or red sprinkles
Computer with projector Hard copy of “Corals” PowerPoint presentation, for each student (optional)
Peggy Koenig July 2004
61

Teacher Preparation • Go to the site
http://www.pz.harvard.edu/ucp/curriculum/ecosystems/s5_res_symbiosis.pdf and print the symbiosis documents. Cut apart each paragraph.
• Laminate the “Symbiotic Images” and “Symbiosis” paragraphs so that they may be used again in future lessons. (You could even mount them together on large construction paper.
• Contact a few parent volunteers to assist in melting chocolate for the Extension’s “Edible Coral Polyp.”
Teaching Strategies Employed Multi-sensory (aural, tactile) Direct instruction Time Frame One class period Target Audience Grade five Behavioral Objectives Students will demonstrate their understanding of symbiosis by creating an original pair of organisms living symbiotically. Students will create an edible model of a coral polyp by reading to perform a task. Engagement Play the song “Happy Together” by The Turtles. Ask students what they think this song has to do with plants and animals, specifically ocean life. (Some animals live together happily.) Tell students that they are about to learn about some living things with unique relationships. Exploration Divide students into seven groups and randomly distribute a symbiosis paragraph from http://www.pz.harvard.edu/ucp/curriculum/ecosystems/s5_res_symbiosis.pdf to each. Instruct students to read the information and work together to
Peggy Koenig July 2004
62

prepare to tell the rest of the class about the relationship between the two different organisms. Stress to students that they should not read directly from the paragraph, rather they should put it into their own words. Give students a reasonable amount of time to work. Circulate to “translate” as necessary. Explanation Ask students if the animals’ and plants’ relationships (from the Exploration) were equal. (No, sometimes only one organism benefited.) Tell students that when two living things have a relationship like the ones described in the Exploration, it is called symbiosis. Show the PowerPoint presentation “Corals” to teach students about coral polyps, zooxanthellae, and symbiosis. Depending on the abilities of your students, consider printing out copies of it for them to study. Following the completion of the presentation, display slide 5 again, with the diagram of a polyp. Keep it displayed to aid students with the next activity. Extension Distribute “Edible Coral Polyp” directions to students. Have students silently read the directions and then ask any clarification questions. Tell them that you will be guiding them through the process step by step. Distribute the materials and have an adult volunteer melt the chocolate by this point. Call on a student to read the procedure, one step at a time, as you follow the directions and hold up the work in progress. As you demonstrate, ask students what each ingredient of the edible polyp represents.
• Plate = limestone base • Marshmallow = polyp body • Licorice = tentacles • White chocolate = limestone skeleton • Sprinkles = zooxanthellae (algae)
Evaluation Tell students that they must use what they have learned about symbiotic mutualism and parasitism to create a pair of organisms living symbiotically. They must:
Peggy Koenig July 2004
63

1. Name both organisms and draw a diagram of each 2. Identify the type of symbiosis (mutual or parasitic) and describe it in
relation to the organisms 3. Briefly describe the organisms’ habitat and diet
Assessment Use the rubric below to score students’ original symbiotic organisms and assembly of the edible coral polyp. Bibliography Byatt, A., Fothergill, A., & Holmes, M. (2001). The blue planet: A natural
history of the oceans. New York: DK Publishing, Inc. pp. 108. Center for Marine Conservation. (n.d.). Coral reefs: a fact sheet. Retrieved
http://www.aquarium.usm.edu/old/coralreef/01.pdf, July 22, 2004. Coral Forest. (1996). The edible coral polyp. Retrieved
http://www.aquarium.usm.edu/old/coralreef/04.pdf, July 21, 2004. President and Fellows of Harvard College. (n.d.). Symbiosis. Retrieved
http://www.pz.harvard.edu/ucp/curriculum/ecosystems/s5_res_symbiosis.pdf, July 21, 2004.
Peggy Koenig July 2004
64
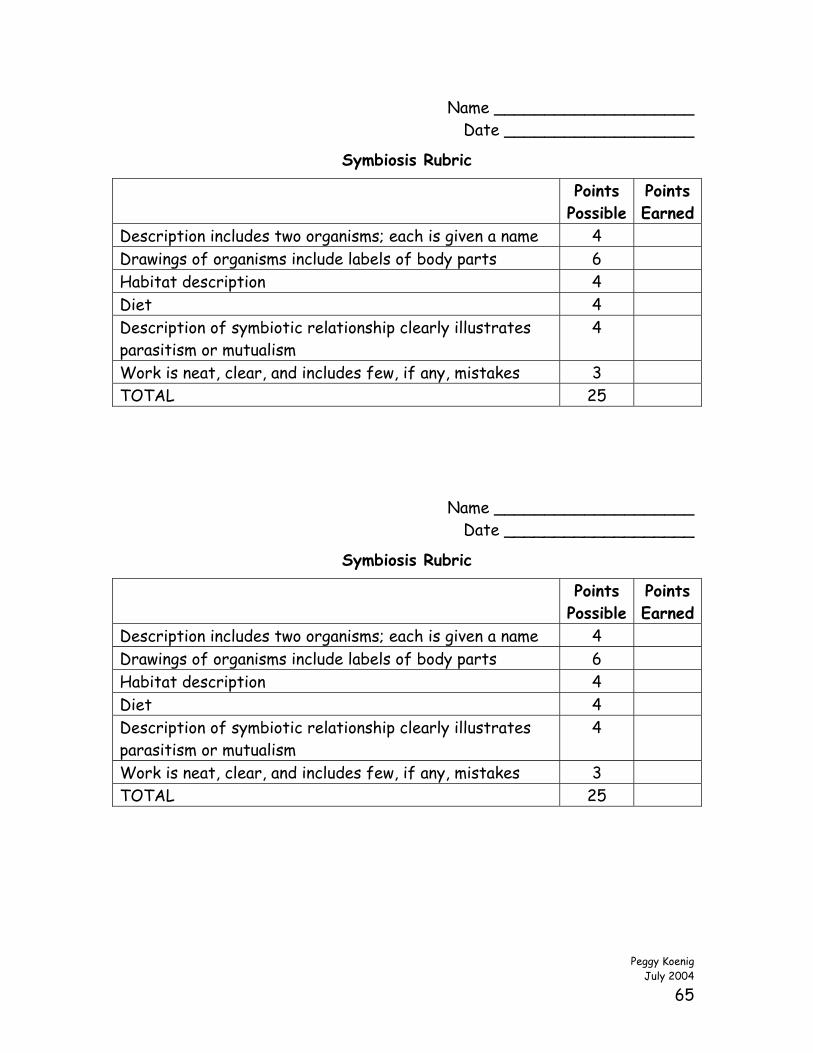
Peggy KoenigJuly 2004
65
Name ____________________ Date ___________________
Symbiosis Rubric
Points Possible
Points Earned
Description includes two organisms; each is given a name 4 Drawings of organisms include labels of body parts 6 Habitat description 4 Diet 4 Description of symbiotic relationship clearly illustrates parasitism or mutualism
4
Work is neat, clear, and includes few, if any, mistakes 3 TOTAL 25

Symbiotic Images Egyptian Plover Crocodile
http://www.mtaudubon.org/html/birdwatching_field_trips_and_programs_Gambia.htm http://photos-nature.dyndns.org/reptiles/crocodiliens/crocodile%20du%20nil%202.jpg
Peggy Koenig July 2004
66

Bumblebees and Flowers
http://www.english-nature.org.uk/news/story.asp?ID=466 http://www.bigeastern.com/eotp/ep_opunt.jpg
Peggy Koenig July 2004
67

Lichen (Fungi and algae)
http://www.javajane.co.uk/texture2/lichen_on_branch.jpg http://www.javajane.co.uk/texture2/lichen3.jpg
Peggy Koenig July 2004
68

Intestine Bacteria
http://www.cindys-friends.com/images/pic_intestine.jpg http://www.irtc.org/ftp/pub/stills/2001-10-31/bacteria.jpg
Peggy Koenig July 2004
69

Tapeworm Intestine
www.ndpteachers.org/perit/Tapeworm%5B2%5D.JPG http://www.cindys-friends.com/images/pic_intestine.jpg
Peggy Koenig July 2004
70

Ticks Cow
http://www.cdc.gov/ncidod/dvbid/lyme/4ticks_cm.htm http://ohldecattle.com/assets/img/Matsn213.jpg
Peggy Koenig July 2004
71

Peggy Koenig July 2004
72
Mistletoe
www.rms.nau.edu/ mistletoe/ www.botgard.ucla.edu/. ../a0009tx.html

Corals 101 presentation
Peggy Koenig July 2004
73

Peggy Koenig July 2004
74
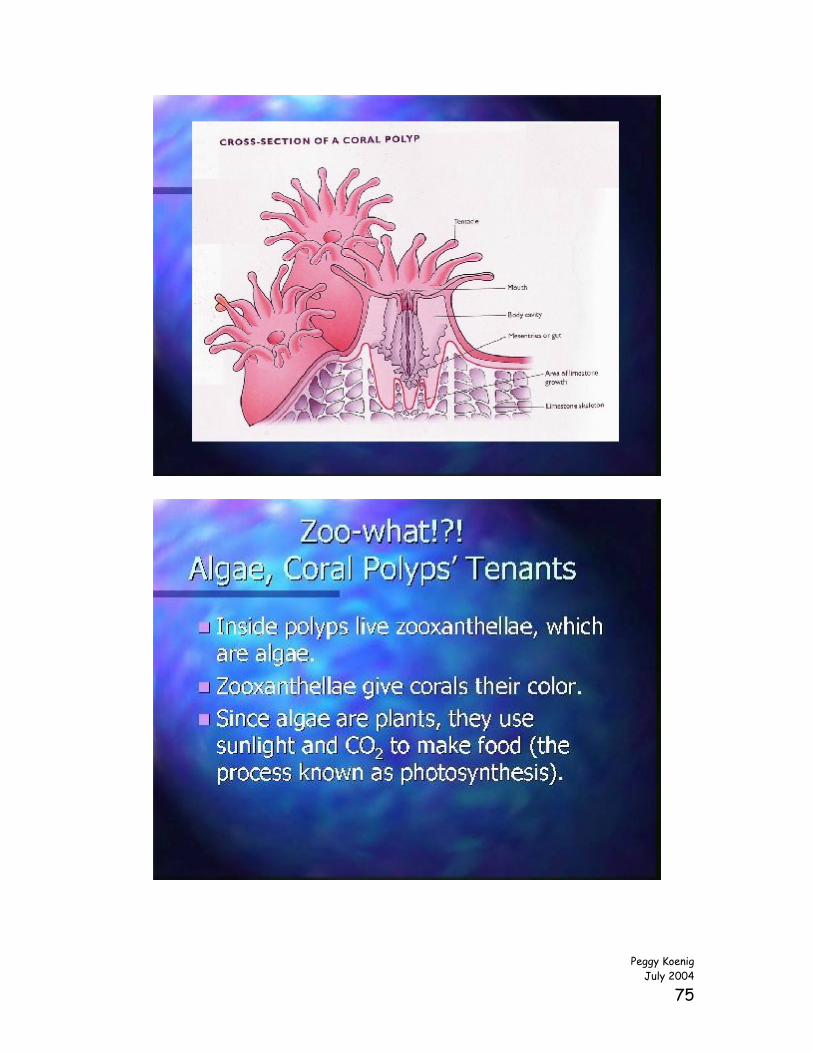
Peggy Koenig July 2004
75

Peggy Koenig July 2004
76

Peggy Koenig July 2004
77

Peggy Koenig July 2004
78

Edible Coral Polyp activity Materials Small paper plate 1 large marshmallow (or section of a banana or a strawberry) Toothpick (for boring holes in marshmallow) Six 2-inch strips of red licorice (either whip or regular cut into thin strips) ½ square (½ oz.) white baking chocolate or hard candy coating 1 tsp. Blue, green, or red sprinkles Microwave or hot plate Procedure
1. Have an adult help you melt the white chocolate.
2. Roll the marshmallow in the melted white chocolate so that only the sides are coated and then stand it on the paper plate.
3. Use the toothpick to carefully poke six holes evenly around the top of
the marshmallow. Be sure to remove the toothpick.
4. Insert the licorice pieces into each hole in the marshmallow.
5. Choose one color of sprinkles to sprinkle the marshmallow and licorice with. (It might be necessary to slightly dampen the marshmallow.)
Congratulations, you’ve made a coral polyp!
Peggy Koenig July 2004
79

Lesson #6: Sea Surface Temperature and Coral Bleaching Introduction/Rationale/Teacher Background Coral reefs are a fragile ecosystem. Scientists monitor ocean temperature since it is linked to coral bleaching episodes. Coral bleaching is caused by environmental stresses and results in corals ejecting zooxanthellae from their polyps. Sometimes, small, localized bleaching events result from chemical spills, sedimentation, and decreases in ocean salinity from heavy rains or flooding. Large global instances of bleaching, called mass bleaching, appear to be caused primarily by an increase in water temperature and calm sunny conditions. Even small temperature increases, as little as a 1-degree Celsius above normal temperature range, over a period of a week or more, can cause corals to expel their zooxanthellae. If conditions quickly return to normal, the coral may recover. Unfortunately, in the face of other numerous threats, corals are often vulnerable and die from the bleaching process. In this lesson, students will be introduced to the bleaching phenomenon and gain experience reading satellite sea surface temperature data. Tropical ocean temperatures have increased 1°C over the past 100 years and are currently increasing at a rate of 1-2°C per century. It is likely that this global temperature increase is due, in part, to the burning of coal, oil, and gas. Some of the images used in this lesson are labeled “DHW,” which stands for Degree Heating Weeks. One DHW is equal to one week of a sea surface temperature ≥ 1ºC above the expected summertime maximum. Two DHWs are equal to two weeks at 1ºC or one week at 2ºC above the expected summertime maximum temperature. A DHW of 4, indicated in green, means that coral bleaching will occur in areas where there are coral reefs. Lesson Concepts and Skills Coral bleaching - the process in which a coral polyp, under environmental
stress, expels its symbiotic zooxanthellae from its body. The affected coral colony appears whitened.
Coral bleaching HotSpot – a region of sea surface temperature that exceeds
the climatological maximum for a region by 1°C or more. These conditions may cause sufficient stress to coral reefs to result in coral bleaching.
Peggy Koenig
July 2004
80

Materials Access to computer lab Copies of “Coral Catastrophe Student Work” for each student, found
following teacher demonstration instructions Rubber glove (thick) Freezer Bowl Whipped cream Green, blue, or red sprinkles Red pen or pencil Class computer with a projector Copies of “What Happened to the Coral?” for each student Copies of “Predicting Peril” for each student (or read the note in
“Preparation” below to conserve ink and paper) Copies of blank US map for each group, found at
http://dstreme.comet.ucar.edu/extras/bmap.gif. Preparation At least one day before the lesson, prepare for the Coral Bleaching
Demonstration by filling a thick rubber glove with water and freezing it. Hanging the glove upside down to freeze will create a flat base for the hand.
Images in “Predicting Peril” student work are in color and will require a great deal of ink. Consider making color transparencies or allowing students to link to the website http://www.osdpd.noaa.gov/PSB/EPS/icg/wsub.7.31.1998.gif themselves to make their predictions.
Teaching Strategies Employed Demonstration Modeling Direct instruction Cooperative learning Time Frame One class period
Peggy Koenig July 2004
81

Target Audience Grade five National Science Content Standards As a result of their activities in grades 5-8, all students should develop an understanding of structure of the earth system. As a result of their activities in grades 5-8, all students should develop understanding of structure and function in living systems. Behavioral Objectives Students will determine the anatomy of coral bleaching by drawing conclusions from a teacher demonstration. Students will identify temperature increase as one cause of coral bleaching by observing a teacher demonstration. Students will predict general areas likely to be affected by coral bleaching by interpreting sea surface temperature data over a period of months in 1998. Engagement Ask students how they measure the temperature outside. (Place a thermometer outside and read it.) Next, ask them how they would measure the water in a swimming pool. (Put the thermometer in the water to get a reading.) Instruct students to go to the website http://www.ametsoc.org/amsedu/dstreme/. They must scroll down to “Satellite” and click “Infrared Surface Temperature Determination.” Tell them that as they move their mouse over different portions of the map, the temperature, latitude and longitude of that of that particular location will be displayed. Ask the students how scientists got this information. (Satellite data.) Exploration Follow the directions to carry out the “Coral Bleaching” teacher demonstration. Instruct students to answer the accompanying “Coral Catastrophe” student worksheet.
Peggy Koenig July 2004
82

Explanation Display the map found at http://reefgis.reefbase.org/mapper.asp to remind students where coral reefs are found across the globe. You might want to zoom into specific regions. Discuss the results of the “Coral Bleaching” demonstration as a class and review students’ answers to the “Coral Catastrophe” questions. Teach students that when zooxanthellae leave the coral polyp it is called “coral bleaching.” The coral appears colorless and eventually dies unless new algae “move in” to complete the symbiotic relationship. Distribute the “What Happened to the Coral?” handouts to all students. (If your students need extra help with their geography skills, distribute world atlases at this point as well.) Read and discuss the information as a class, then direct them to work with a partner to complete pages 2 and 3 of the handout. Check answers as a class. Extension Direct students back to the weather map at http://www.ametsoc.org/amsedu/dstreme/ (they must follow the same navigation steps as in the Engagement). Divide the class into three groups: Gulf of Mexico, Atlantic Ocean (or East Coast), and Pacific Ocean (or West Coast). Instruct students to use the information from the AMS’s Datastreme Atmosphere website to create a rough map of current sea surface temperatures in their assigned region. Stress to student that it is impossible for them to map every temperature variation in their assigned body of water, so they must just sample different areas. Write the following scale up on the board for students to use: 10.3-13.9°C = purple, 14.0-19.2°C = blue, 19.3-24.4°C = green, 24.5-27.1°C = yellow, 27.2-29.8°C = orange, 29.9-31.6°C. Have them visit the site http://www.osdpd.noaa.gov/PSB/EPS/SST/contourthumb.html and click
Peggy Koenig July 2004
83

their assigned location in the Colored Field column. Students are to compare their maps with NOAA produced ones. Evaluation Distribute “Pinpointing Peril” handouts to students. Instruct them to work with a partner to make predictions of coral bleaching events in the Caribbean. Assessment Use the site http://www.osdpd.noaa.gov/PSB/EPS/SST/data/anw98d.gif to determine the accuracy of students’ predictions in “Predicting Peril.” Bibliography Cerullo, M.M. (1996). Coral reef: A city that never sleeps. New York:
Cobblehill Books. pp. 47-48. The Coral Reef Alliance. (2002). International coral reef information
network. Retrieved http://www.coralreef.org/factSheets/coralbleaching.html, July 23, 2004.
Hoegh-Guldberg, O. (n.d.) Climate change, coral bleaching, and the future
of the world’s coral reefs. Retrieved http://archive.greenpeace.org/climate/science/reports/coralbleach.pdf, July 27, 2004.
Intergovernmental Panel on Climate Change (2001). Summary for
Policymakers: A Report of Working Group I of the Intergovernmental Panel on Climate Change, January 2001.
NOAA/NESDIS. (2003). NOAA/NESDIS experimental degree heating
weeks. Retrieved http://www.osdpd.noaa.gov/PSB/EPS/icg/ehet.s51998.e71998.gif, July 27, 2004.
Wells, S. and Hanna, N. (1992). The Greenpeace book of coral reefs. New
York: Sterling Publishing Co., Inc. pp. 54-55.
Peggy Koenig July 2004
84

Coral Bleaching teacher demonstration Materials Rubber glove (thick) Freezer Bowl Whipped cream Green sprinkles Procedure
1. Fill the glove with water and tie the end shut. Place in freezer overnight or until completely frozen.
2. Remove the rubber glove. Place hand upright in bowl.
3. Carefully pour whipped cream over the palm and back of hand. Avoid
getting any on the fingers or thumb.
4. Add sprinkles to the topping.
5. Have students observe what happens as the ice melts. (The sprinkles should fall off, leaving a white polyp behind.)
Key Frozen hand = coral polyp Fingers = tentacles Bowl = limestone cup Whipped cream = limestone skeleton Sprinkles = zooxanthellae
Peggy Koenig July 2004
85

Name ___________________ Date ___________________
Coral Bleaching Student Work
1. Use what you have learned about corals to identify the parts of the
model. Limestone cup = _____________________ Zooxanthellae = _____________________ Coral polyp = _______________________ Tentacles = _________________________
2. Describe how the “polyp” changed throughout the class period. _______________________________________________________________________________________________________________________________________________________________________________________
3. What caused these changes to occur? _______________________________________________________________________________________________________________________________________________________________________________________
4. How do you think a real polyp’s appearance would change after the zooxanthellae left? Why?
__________________________________________________________________________________________________________________________ __________________________________________________________________________________________________________________________
Peggy Koenig July 2004
86

What Happened to the Coral? Coral bleaching is a natural disaster in which most or all of corals’ plant partners (zooxanthellae) leave their host polyp. The polyp itself is colorless, so when the algae leave, it appears to have been bleached. “Bleaching” is triggered by environmental stress and very often has been linked to increases in the temperature of the ocean water. Once the zooxanthellae are gone, the polyps lose their ability to build a reef. Sea Surface Temperature
The temperature of the ocean changes as you dive deeper and deeper. Scientists measure sea surface temperature because it gives clues about the water below the surface. If surface water is warm, then the deeper water below it usually is warm. If surface water is cool, then the water below it usually is too. Sea surface temperature monitoring is done by satellites and buoys, which gather the data twice a week. Scientists identify an area as a coral bleaching “HotSpot” if the SST is 1°C higher than a typical hot temperature for that reef.
It is important to note that warmer water alone may not cause bleaching events. Other factors may make the stress worse for the corals. A variety of other environmental stresses—such as disease, too much shade, increased levels of ultraviolet radiation, sedimentation, pollution, and salinity changes (how salty the water is)—and human stresses – such as pollution, oil spills, breaking coral, littering, overfishing, and sewage - may also play a role.
Peggy Koenig July 2004
87

Look at the following SST data, displayed in order. They show the areas that had higher than normal temperatures. The worst hit spots are in purple and the least affected are blue. On the last map, from 7/31/98, use a red pen or pencil to mark your prediction of a coral bleaching area around India and Australia.
Peggy Koenig July 2004
88

Now go to http://www.osdpd.noaa.gov/PSB/EPS/SST/data/ane98c.gif to view the animated version of the Indian Ocean’s hotspots in 1998. Check your predictions by looking for the small black asterisks that show where there was bleaching.
Peggy Koenig July 2004
89

Pinpointing Peril Study the following SST data. They show the areas that had above normal temperatures. The worst hit spots are in purple and the least affected are blue. On the last map, from 10/31/98, use a red pen or pencil to mark your prediction of a coral bleaching area around the Gulf of Mexico and Atlantic Ocean.
Peggy Koenig July 2004
90

Peggy Koenig July 2004
91
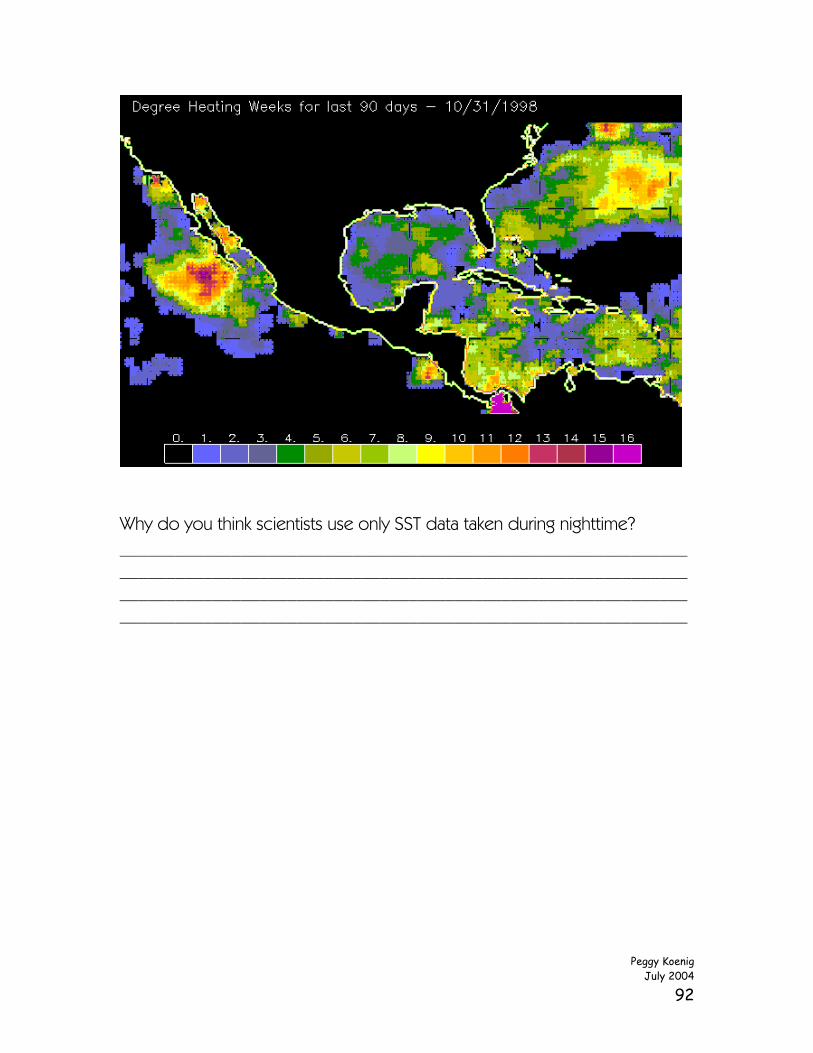
Why do you think scientists use only SST data taken during nighttime? ____________________________________________________________________________________________________________________________________________________________________________________________________________________________________________________
Peggy Koenig July 2004
92

Lesson #7: Conservation Introduction/Rationale Now that students have a basic understanding of coral reefs and the purpose of remote sensing of them, they need to know what to do with this knowledge. The purpose of this unit is to illustrate the ways that our actions can affect the health of coral reefs, directly and indirectly. Lesson Concepts and Skills Destructive fishing practices Materials DVD player “Finding Nemo” DVD with bonus feature “Exploring the Reef with Jean-
Michel Cousteau.” One copy of “Coral Quotations” paper Access to computer lab Copies of the Time for Kids article Can Coral Reefs Be Saved? for each
child, from the Introduction to Coral Reefs lesson, found at http://www.timeforkids.com/TFK/magazines/story/0,6277,59687,00.html.
The following materials are needed for each group of students: • Large pan • Water • Cooking oil • Drinking straw • Sand • Cotton balls • Paper towels
Teacher Preparation Print the “Coral Quotations” paper and cut apart each quote. Teachers are strongly encouraged to read the coral reefs fact sheet found at http://www.aquarium.usm.edu/old/coralreef/01.pdf before presenting the PowerPoint presentation “Threats to Coral Reefs.” Teaching Strategies Employed Direct instruction
Peggy Koenig July 2004
93

Time Frame One 60-minute class period plus three to five subsequent class periods to allow students to complete their PowerPoint presentations for the Evaluation. Target Audience Grade five Behavioral Objectives Students will create background knowledge of natural and anthropogenic threats to coral reefs by reading for information. Students will disseminate information about coral reefs and conservation by creating a PowerPoint presentation. Engagement In the bonus features of the “Finding Nemo” DVD, play the “Exploring the Reef with Jean-Michel Cousteau” movie (seven minutes). Ask students which topics were mentioned that they have already learned about in this unit (coral bleaching, symbiosis). Ask them what did the movie mention that they have not studied yet? (Humans’ responsibility in the health of coral reefs. Tell students that the coral reproduction will not be included in this lesson.) Exploration Divide students into groups of four or six. Distribute the materials for the “Oily Mess” activity. Circulate to assist students in their exploration. Ask students to brainstorm how the activity connects to coral reefs. (Pollution is a big risk to coral reef health.) Have students share the techniques they used to clean the oil spill, and discuss which worked better than others. Ask students to brainstorm other factors that would harm coral reefs. Hold a class discussion so that students may share their answers.
Peggy Koenig July 2004
94

Explanation Refer back to the Time for Kids article “Can We Rescue the Reefs?” from the introduction to coral reefs lesson. http://www.timeforkids.com/TFK/magazines/story/0,6277,59687,00.html As a class, read the sections “Precious Underwater Habitats” and “Sucking the Life out of the Reefs,” which were skipped in the earlier lesson. Display the PowerPoint presentation “Threats to Coral Reefs.” (Teachers are strongly encouraged to read the coral fact sheet found at http://www.aquarium.usm.edu/old/coralreef/01.pdf since it aligns closely with the content in the PowerPoint presentation. This will aid a great deal in filling in the gaps from the presentation.) The site http://www.publicaffairs.noaa.gov/25list.html contains a list of 25 things people can do to save the coral reefs. http://www.coralreefalliance.org/aboutcoralreefs/help.html details conservation whether living near a reef or far removed from one. Either have students visit the sites, print a hard copy for them, or display the web page. Read and discuss them as a class. Extension Divide students into eight groups. Randomly give each group one “Coral Quotation.” Give students approximately five minutes to read and discuss their quote. Call on groups one at a time to share the quote with the whole class and relate the meaning of it. Evaluation Have students create a PowerPoint presentation that integrates what they’ve learned about coral bleaching and conservation. Decide whether you want students to work individually or in small groups. Instruct them that the presentation should be appropriate for fourth grade students as well as adults. (If possible, make arrangements for presentations to be given in the auditorium to the fourth grade and school principal and assistant principal.) Students might want to visit http://www.onr.navy.mil/focus/ocean/habitats/coral3.htm for background on risks to corals.
Peggy Koenig July 2004
95

Assessment Use the rubric below to score the students’ PowerPoint presentations from the Evaluation part of the lesson. Bibliography Castaldo, N. F. (2002). Oceans: An activity guide for ages 6-9. Chicago:
Chicago Review Press Incorporated, 114. NOAA. (2004). Coral health and monitoring program: Quotations.
Retrieved http://www.coral.noaa.gov/quotations.shtml, July 23, 2004. Zike, D. (1993). The earth science book. New York: John Wiley & Sons,
Inc. pp. 67.
Peggy Koenig July 2004
96

Coral Reef PowerPoint Presentation Rubric
Points Possible
Points Earned
Presentation included important facts about coral reefs 4 Any animations or images added to the presentation’s message and did not distract
4
Presentation included essential information about coral reefs and conservation
8
Spelling, grammar, and mechanics (punctuation, capitalization)
4
Slides hold the attention of the audience 2 TOTAL 22 Comments:
Coral Reef PowerPoint Presentation Rubric Points
Possible Points Earned
Presentation included important facts about coral reefs 4 Any animations or images added to the presentation’s message and did not distract
4
8 Presentation included essential information about coral reefs and conservation Spelling, grammar, and mechanics (punctuation, capitalization)
4
Slides hold the attention of the audience 2 TOTAL 22 Comments:
Peggy Koenig July 2004
97
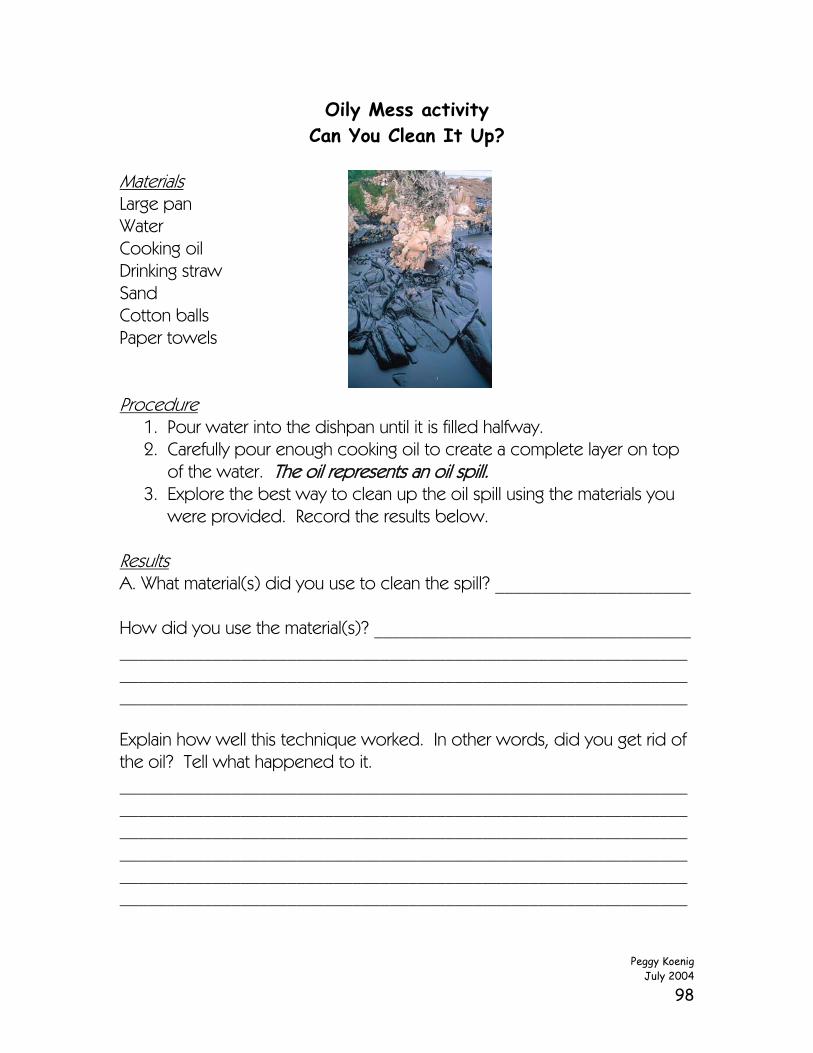
Oily Mess activity Can You Clean It Up?
Materials Large pan Water Cooking oil Drinking straw Sand Cotton balls Paper towels Procedure
1. Pour water into the dishpan until it is filled halfway. 2. Carefully pour enough cooking oil to create a complete layer on top
of the water. The oil represents an oil spill. 3. Explore the best way to clean up the oil spill using the materials you
were provided. Record the results below. Results A. What material(s) did you use to clean the spill? _____________________ How did you use the material(s)? __________________________________ _______________________________________________________________________________________________________________________________________________________________________________________ Explain how well this technique worked. In other words, did you get rid of the oil? Tell what happened to it. _____________________________________________________________ _________________________________________________________________________________________________________________________________________________________________________________________________________________________________________________________________________________________________________________
Peggy Koenig July 2004
98
B. What material(s) did you use to clean the spill? _____________________ How did you use the material(s)? __________________________________ _______________________________________________________________________________________________________________________________________________________________________________________ Explain how well this technique worked. In other words, did you get rid of the oil? Tell what happened to it. _____________________________________________________________ _________________________________________________________________________________________________________________________________________________________________________________________________________________________________________________________________________________________________________________ C. What material(s) did you use to clean the spill? _____________________ How did you use the material(s)? __________________________________ _______________________________________________________________________________________________________________________________________________________________________________________ Explain how well this technique worked. In other words, did you get rid of the oil? Tell what happened to it. _____________________________________________________________ _________________________________________________________________________________________________________________________________________________________________________________________________________________________________________________________________________________________________________________ D. What material(s) did you use to clean the spill? _____________________ How did you use the material(s)? __________________________________ _______________________________________________________________________________________________________________________________________________________________________________________
Peggy Koenig July 2004
99

Explain how well this technique worked. In other words, did you get rid of the oil? Tell what happened to it. _____________________________________________________________ _________________________________________________________________________________________________________________________________________________________________________________________________________________________________________________________________________________________________________________
Peggy Koenig July 2004
100

Threats to Coral Reefs presentation
Peggy Koenig July 2004
101
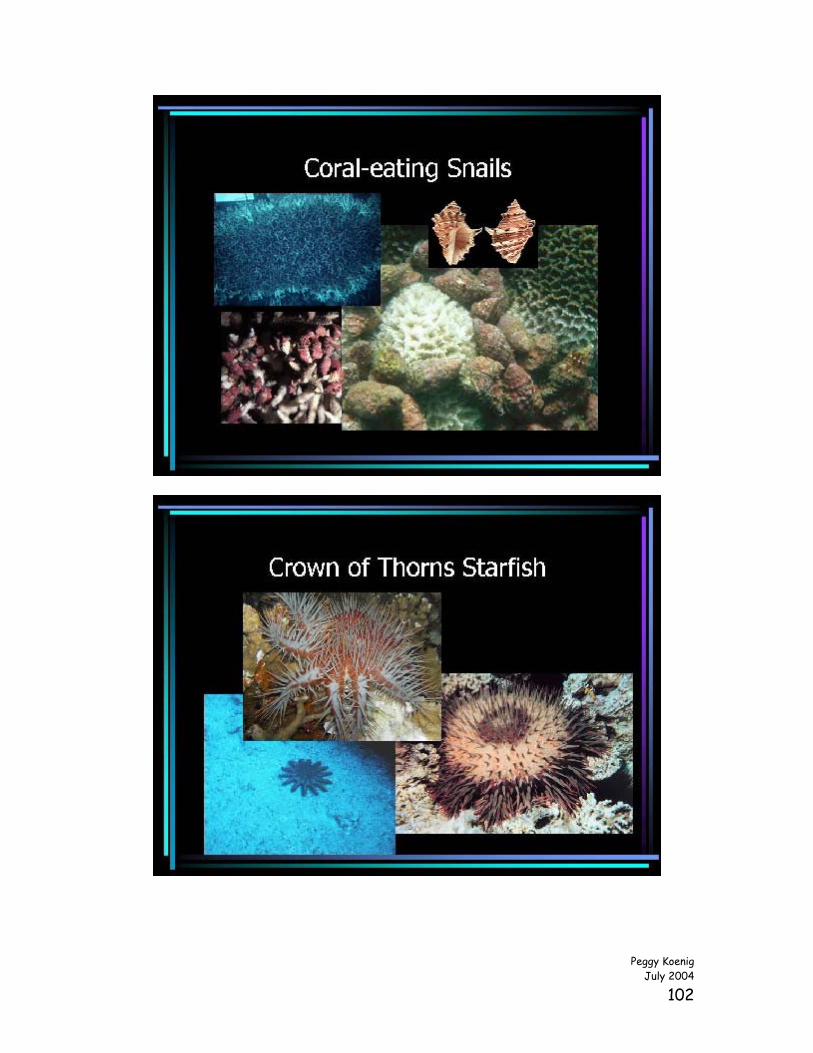
Peggy Koenig July 2004
102

Peggy Koenig July 2004
103

Peggy Koenig July 2004
104

Peggy Koenig July 2004
105
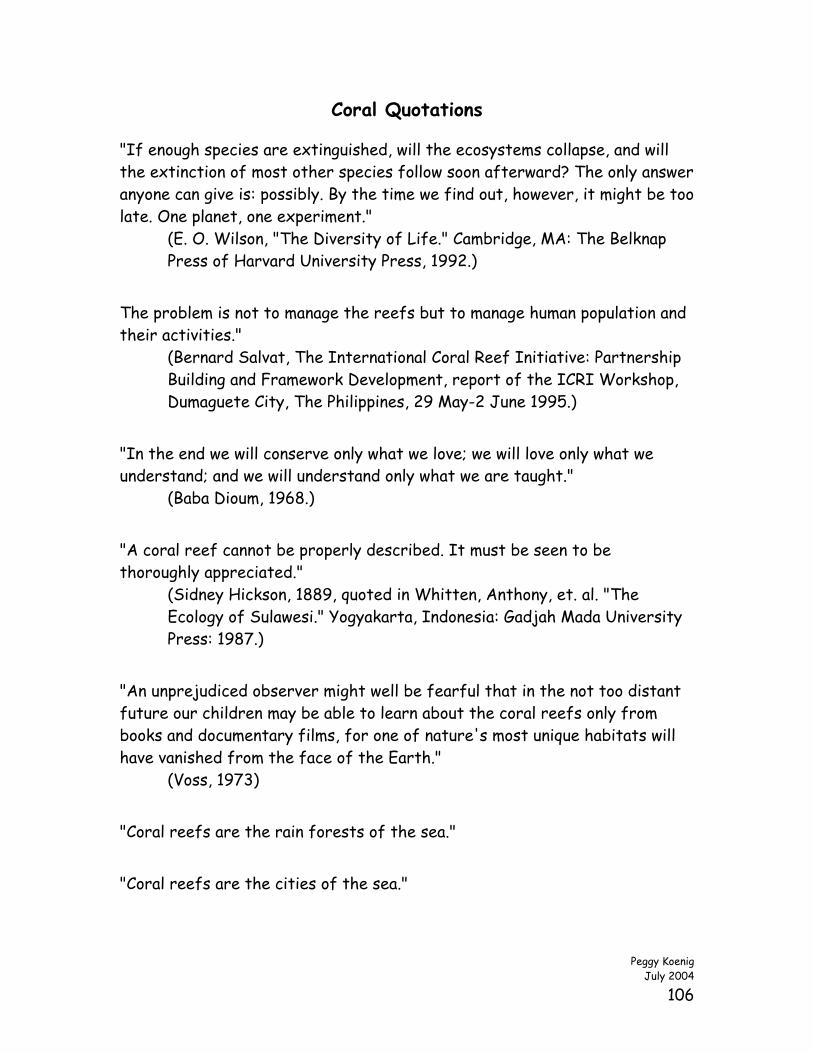
Coral Quotations
"If enough species are extinguished, will the ecosystems collapse, and will the extinction of most other species follow soon afterward? The only answer anyone can give is: possibly. By the time we find out, however, it might be too late. One planet, one experiment."
(E. O. Wilson, "The Diversity of Life." Cambridge, MA: The Belknap Press of Harvard University Press, 1992.)
The problem is not to manage the reefs but to manage human population and their activities."
(Bernard Salvat, The International Coral Reef Initiative: Partnership Building and Framework Development, report of the ICRI Workshop, Dumaguete City, The Philippines, 29 May-2 June 1995.)
"In the end we will conserve only what we love; we will love only what we understand; and we will understand only what we are taught."
(Baba Dioum, 1968.)
"A coral reef cannot be properly described. It must be seen to be thoroughly appreciated."
(Sidney Hickson, 1889, quoted in Whitten, Anthony, et. al. "The Ecology of Sulawesi." Yogyakarta, Indonesia: Gadjah Mada University Press: 1987.)
"An unprejudiced observer might well be fearful that in the not too distant future our children may be able to learn about the coral reefs only from books and documentary films, for one of nature's most unique habitats will have vanished from the face of the Earth."
(Voss, 1973)
"Coral reefs are the rain forests of the sea."
"Coral reefs are the cities of the sea."
Peggy Koenig July 2004
106