religious attendance and affiliation patterns in australia
TRANSCRIPT
Religious Attendance and Affiliation Patterns in Australia
1966 to 1996
The Dichotomy of Religious Identity and Practice
John Malcolm Armstrong
June 2001
A thesis submitted for the degree of Doctor of Philosophy of
the Australian National University
1
Candidate’s Statement
This work was an original piece of research, which investigated data-sets made
available through the Australian Bureau of Statistics, The Australian Institute of
Family Studies and the Social Science Data Archives.
The data sets provided by these bodies are
Australian Bureau of Statistics
Census Data in printed form 1961, 1966, 1971, 1976, 1981, 1986
Census Data for the 1991 and 1996 Censuses compiled in a format
requested by the researcher.
Australian Institute of Family Studies
The Australian Family Formation Project 1991 Stage Two
The Australian Living Standards Survey 1991
These contained limited data-sets of each survey and were
compiled in a format requested by the researcher.
Social Science Data Archives
The Religion in Australia Survey 1966
The Australian Family Formation Project 1981 Stage One
The International Social Science Survey 1993
____________________
John Malcolm Armstrong
2

Acknowledgements
It needs to be acknowledged that many people have helped in drawing this
project to a conclusion. Without their help, support, encouragement and prayer it
would have been hard for me to have drawn the many threads of this research
together. From the time I have commenced this project I have realised what a
privilege it has been for me to have the support of so many people. I am especially
grateful to his Grace, Archbishop Francis Carroll, who listened carefully to my plans
and the difficulties I had faced while trying to complete this project while also
working full time as a parish priest in my parish. In providing me with a years study
leave he allowed me the invaluable opportunity of drawing this work together. I give
thanks also to Fr. Joe Rheinberger who encouraged me to undertake further study and
who has acted as a mentor for me at every stage of this thesis.
As with all studies it is necessary to bend the ear of many people and engage
their help in addressing questions vital to this study. I am especially grateful to my
supervisors Peter McDonald, Siew Ean Khoo, Gordon Carmichael and my advisor
Mariah Evans who have guided me to the completion of this study. I am also
especially grateful to those who helped me to gain special insights into the study of
religion especially Philip Hughes, Ken Hutchings, Ruth Powell, Bob Dixon, Michael
Mason, Charles Price and Hans Mol. In addition, John Andrews, Warwick Neville,
Tim Power, The Library Staff at ABS and members of ABS staff in Canberra,
Melbourne and Adelaide, who searched in vain for data from the 1966 Census. Also
Lixia Qu, and Helen Glezer from the Australian Institute of Family Studies and the
staff of the Social Science Data Archives provided practical assistance relating to the
data-sets used in this thesis.
3

I also owe a great degree of gratitude to the following people who provided
assistance during the writing of my thesis. Frs.Peter Doai and Ken Heffernan who
managed the parish in my absence. Graham Upshall for his ability to provide cups of
coffee and that essential book arriving at the opportune time in the Catholic
Bookshop. Fr. John Ryan who helped me fill out my action plan for the year of full
time study. The staff of Favier House who looked after practical needs. Diana Crow
and Karen Ewens who attended to my various computer needs. My colleagues in the
Demography Program especially Terry Hull, Kay Nantes, Christine Inglis and Ann
Evans who provided support and encouragement.
Along the way you meet many friends who provide you insight into yourself
and in many little ways encouraged me to keep going. These are Helen Avong,
Therese Ha Kim Hoa, Ngoc Phan, Margie and Paul Doyle, Kevin and Merran Martin,
Martin Dolan, Brendan Kelly, Gina Poulos , Roger and Cora O’Donnell, Phillip Tule,
Gregor Neonbasu, Pat Power, Paul Huthnance, Tony Percy, Bernie Patterson, Eddie
Evans, Michael McKenna, Brian Finnegan, Catharina Williams, Frank Jones, Ken
and Edith Hagan, Mary Ryan and Mavis Sherd who put up with my highs and lows. I
am especially grateful to members of my family, my mother Alma, my sister Carol
and her husband Alfred, my brother Graham and his wife Ira, my nieces and nephews
Dominic, Sean, Robbie and Ada.
4

“Until quite recently, it was easier in traditionally Christian countries to
keep Sunday holy because it was an almost universal practice and
because, even in civil society, Sunday rest was considered a fixed part of
the work schedule. Today, however, even in those countries which give
legal sanction to the festive character of Sunday, changes in
socioeconomic conditions have often led to profound modifications of
social behaviour and hence of the character of Sunday. The custom of
the ‘weekend’ has become more widespread, a weekly period of respite,
spent perhaps far from home and often involving participation in
cultural, political or sporting activities which are usually held on free
days. This social and cultural phenomenon is by no means without its
positive aspects if, while respecting true values, it can contribute to
people’s development and to the advancement of the life of society as a
whole. All of this responds not only to the need for rest, but also to the
need for celebration which is inherent in our humanity. Unfortunately,
when Sunday loses its fundamental meaning and becomes merely part
of a ‘weekend’, it can happen that people stay locked within a horizon
so limited that it can no longer see ‘the heavens’. Hence, though ready
to celebrate, they are really incapable of doing so.”
‘Dies Domini’ Paragraph 1,Section 4
John Paul II, August 1998
5
Dedicated to the Memory of Robert (Bob) Harold Rowland Armstrong and Ann Josephine Patricia Vella
FIDELIS
6
Abstract
The period between 1966 and 1996 was a period of great change for society in
Australia. Two particular aspects of that change have been highlighted in this study. It
will examine the changing patterns of attendance at religious services and religious
affiliation over this time period. In particular it examines the connection of attendance
and belief patterns, which have changed during this period, with particular reference
to Christian religious groups.
By examining data from each of the Censuses in the period between 1966 and
1996 it was possible to note three fundamental changes in the patterns of religious
affiliation. The first was the movement away from patterns of Christian affiliation to
no religious affiliation. The second was the shift of migration patterns which drew
substantially from Europe in the period prior to 1971 to a pattern with higher levels of
migration from Asia and Oceania. The third saw a decline in Christian affiliation
among the 15-24 age group.
After analysing this affiliation data a weekly average religious attendance
measure was composed to compare data from each of the social science surveys. This
made it possible to examine generational trends by age and sex which resulted from
changing patterns of affiliation, immigration, stability of residence and marital status
Also a case study of the Canberra parishes in the Catholic Archdiocese of Canberra
and Goulburn was undertaken to examine the particular impact that these changes had
on a particular religious grouping.
In studying these indicators it is believed that the change in patterns of
Australian religious attendance and affiliation while influenced by life course events
has also been substantially affected by issues of generational change. These changes
7

not only produce lower levels of religious attendance but also have significant impact
on aspects of society which have sustained communal life.
8

Preface
In a time of great change often the starting point for reflection is on how a
person changes in his life. My initial interest in this topic reflects some of my own
spiritual journey. When I was born my parents made the decision that none of their
children would be baptised. Part of this decision arose from some disillusionment with
the Church of England, which they saw as being particularly partisan in its approach
to the Second World War, and also the belief that as children we should be able to
make our own choices about religion when we reached maturity. This was the first
significant event in my spiritual life that my parents allowed me the choice of how I
would make my own religious commitment.
As I grew up in England, I came under the influence of various religious
traditions. My grandmother and older sister took me to Baptist Sunday school. I went
to the local Church of England Primary School and became involved in the local
Scouting movement. At Grammar school, the headmaster was a lay preacher for the
local Methodist Church and my close friends were Jewish, Catholic, Hindu and
Atheist.
I witnessed the conversion of my sister to Catholicism and this had a profound
effect on my own conversion. This was probably the second significant event in the
desire to belong to a religious organisation and to define my religious belief.
Subsequent to this decision came the first thought of issues of vocation and priesthood
which I shared with a Muslim friend, a Ugandan Asian who had escaped the
murderous regime of Idi Amin, who suggested that I could always become an Imam!
9
The third significant event in my spiritual life was the migration to Australia
where I found that the Catholic Church in Australia and the attitude to religion was
quite different from that in England. During that time I lapsed from regular practice
but still maintained a strong sense of Catholic principles. In most cases it was the
Eucharist and Reconciliation which allowed me to remain connected with the church
during that time. Also it was a period in which I was called to reflect upon what my
faith meant. This was influenced by living with people from diverse religious
backgrounds and experience. The influence of meditation, introduced to me by an
atheist friend, allowed me to reflect on what way my life was going. Also his further
challenge as a result of the 1981 Census that I was not really a Catholic if I did not
practice caused me to consider what my faith meant to me. At the same time my
parents made the choice to become Catholic and this made the consideration of
discovering what they had found more engaging for myself.
The fourth significant event in my spiritual life was the decision about my own
life choices in my commitment towards others. The choice of entering seminary
followed a realisation of what I considered important and also how I could best help
others. This choice far from removing me from the life of the world engaged me
deeper in trying to understand the religious and social issues of our time. The choice
in seminary allowed me to make a decision in my life, which would allow me to
experience both satisfaction and joy. What would be the wellspring and life source
that I could draw on for others and myself?
The fifth significant choice is the living out of that commitment as a priest.
This is still a work in progress but it is a reflection that in my life there is a struggle
not just to be a cipher for an organisation but to be a person who is authentic in my
10

own spiritual life. The question does not seem to be defined by terms that label my
religious identity but what I bring as person to give substance to that identity.
While this study reflects on the two important expressions of religious identity
and practice it also points to a time of great religious change as people grow in their
understanding of what it means to be who they are. In a time of change these can be
important indicators of how people see themselves and their connection to institutions
of religious thought. However, as in all studies they are limited by their ability to
define a person’s relationship to those institutions. It appears evident that as I
conclude this study there would also be great value in undertaking a study of people’s
religious history to gain an understanding of how their life has changed and continues
to change.
11

Table of Contents
Candidate’s Statement ...................................................................................................2 Acknowledgements........................................................................................................3 Abstract ..........................................................................................................................7 Preface............................................................................................................................9 Table of Contents.........................................................................................................12 Index of Figures and Tables.........................................................................................14 1. Introduction..............................................................................................................17
1.1 Objectives of the thesis ......................................................................................17 1.2 Why demography? .............................................................................................17 1.3 Measuring attendance ........................................................................................19 1.4 Demographic studies..........................................................................................22 1.5 Life course and generational changes ................................................................26 1.6 Outline of thesis .................................................................................................29
2. Changes in religious affiliation................................................................................32 2.1 Introduction........................................................................................................32 2.2 Census data on religion......................................................................................33
2.2.1 The census question on religion..................................................................33 2.2.2 The classification of religion ......................................................................35 2.2.3 The changes that affected Christian religious groups .................................38 2.2.3 The presentation of the data........................................................................40
2.3 Changes in religious affiliation 1966-96............................................................43 2.4 Immigration and changes in religious affiliation 1966 to 1996.........................48 2.5 Cohort analysis...................................................................................................58
2.5.1 The first period of change 1966-1976.........................................................58 2.5.2 The second period of change 1976-1986 ....................................................64 2.5.3 The third period of change 1986-1996........................................................66
2.6 Summary ............................................................................................................68 3. Method of analysing attendance data.......................................................................70
3.1 Introduction........................................................................................................70 3.2 An overview of surveys used in the thesis.........................................................71
3.2.1 Religion in Australia Survey, 1966.............................................................71 3.2.2 International Social Survey Programme, Religion, Australia, 1991...........72 3.2.3 Australian Family Formation Project, 1981and 1991.................................74 3.2.4 Australian Living Standards Survey 1991 ..................................................75
3.3 Collecting religious attendance data ..................................................................76 3.3.1 The headcount of people attending a religious service...............................76 3.3.2 Social science surveys.................................................................................77
3.4 Method of comparing attendance across surveys ..............................................79 3.4.1 Explanation of method................................................................................79 3.4.2 Allocation of values to surveys...................................................................81 3.4.3 Comparison of results between surveys......................................................85
3.5 Example of average weekly attendance measure...............................................87 3.6 Comparison of average weekly attendance measure with headcounts ..............88 3.7 Comparison of average weekly attendance measure in surveys........................92 3.8 Summary ............................................................................................................94
4. Changes in religious affiliation and its effects on religious attendance...................96
12

4.1 Introduction........................................................................................................96 4.2 Definitions..........................................................................................................97 4.2 Comparison of changes of religious affiliation in Mol and ISSP surveys.........99 4.4 Changes shown in the AFFP surveys..............................................................101 4.5 Movement between religious groups ...............................................................103 4.6 Change in religious affiliation and attendance.................................................107 4.7 Summary ..........................................................................................................110
5. Patterns of religious attendance by age and sex.....................................................113 5.1 Introduction......................................................................................................113 5.2 Differences in attendance by sex .....................................................................114 5.3 Difference by age and sex................................................................................119 5.3.1 Catholics .......................................................................................................120
5.3.2 Anglicans ..................................................................................................121 5.3.3 Uniting/Presbyterian .................................................................................122 5.3.4 Other Christians ........................................................................................124
5.4 Comparison of age effects on retention and conversion..................................125 5.5 Comparison of attendance patterns of those who retain their affiliation .........128 5.6 Summary ..........................................................................................................129
6. The impact of immigration and mobility ...............................................................132 6.1 Introduction......................................................................................................132 6.2 The effects of place of birth and gender on level of attendance ......................134 6.4 Second generation effect..................................................................................136 6.4 Time at current place of residence ...................................................................137 6.5 Summary ..........................................................................................................139
7. Marital status..........................................................................................................141 7.1 Introduction......................................................................................................141 7.2 Marital status and changes in attendance between 1966 and 1993..................147 7.3 The effects of changes in marital status on attendance....................................148 7.4 Partner’s affiliation and patterns of attendance ...............................................150 7.5 Summary ..........................................................................................................152
8. A case study of attendance levels and institutional changes to the Catholic Church in the Australian Capital Territory.............................................................................154
8.1 Introduction......................................................................................................154 8.2 Liturgical changes............................................................................................155 8.3 Changes in the celebration of Mass on Sundays..............................................156 8.4 Changes in the number of diocesan priests available to lead Sunday celebrations................................................................................................................................160 8.5 Conclusions......................................................................................................163
9. Conclusion .............................................................................................................164 9.1 The measurement of religious affiliation and weekly attendance ...................164 9.2 Changes in patterns of religious attendance and affiliation .............................166 9.3 Issues of Christian religion ..............................................................................169 9.4 Issues of international migration and mobility ................................................174 9.5 Issues of changes in marital status ...................................................................175 9.6 Avenues for future research .............................................................................176 9.7 Concluding remarks .........................................................................................179
Bibliography ..............................................................................................................184
13

Index of Figures and Tables
Table 2.1 The classification of religious affiliation in the censuses represented by number of categories identified with each religious groups ................................36
Table 2.2 The growth factor of the No Religion group between 1961 and 1971 ........42 Table 2.3 The growth factor of the Not Stated group between 1961 and 1971...........42 Table 2.4 The size of religious groups between 1966 and 1996..................................44 Table 2.5 The percentage distribution of religious groups between 1966 and 1996 ...47 Table 2.6 Distribution of the overseas born population by country of birth according
to period of arrival ...............................................................................................50 Table 2.7 Religious affiliation of Australia's population by selected country of birth
according to 1991 Census ....................................................................................52 Table 2.8 Overseas born population by period of arrival and religious affiliation......55 Table 2.9 Changes in religious affiliation of male age cohorts, 1966-1996: results
from cohort analysis.............................................................................................62 Table 2.10 Changes in religious affiliation of female age cohorts, 1966-1996: results
from cohort analysis.............................................................................................63 Table 3.1 Comparison of attendance data with respondents indicating attendance on
the previous Sunday. ............................................................................................82 Table 3.2 Comparison of re-coding of survey responses on religious attendance and
percentage of sample in each new response category..........................................85 Table 3.3 Comparison of religious attendance for all the surveys...............................86 Table 3.4 Percentage of Catholics attending a religious service weekly based on their
responding to the Mol survey, 1966 ....................................................................88 Table 3.5 Comparison of Mol 1966 average weekly attendance and attendance last
Sunday..................................................................................................................89 Table 3.6 The comparison of attendance levels contained in ISSP 1993 Religion
Survey and ALSS 1991/92 compared to 1993 Head Counts ...............................91 Table 3.7 A Comparison of average weekly attendance levels according to the Mol
1966 survey, ISSP 1993 Survey and ALSS 1991 Survey....................................92 Table 3.8 A Comparison of attendance levels for the respondents contained in AFFP
stage 1 1980/81 and stage 2 1990/91 ...................................................................93 Figure 4.1 Model of movements between affiliation...................................................98 Figure 4.2 Model of movements based on changes in frequency of attendance .........99 Figure 4.3 Changes in religious affiliation patterns of respondents in the Mol survey
............................................................................................................................100 Figure 4.4 Changes in religious affiliation patterns of respondents in the ISSP .......101 Table 4.1 Religious affiliation of respondents at stage one of AFFP, study based on
those respondents in stage one only and respondents in stage one and two ......102 Table 4.2 Proportion of respondents attending religious services weekly in stage one,
1981 AFFP survey among respondents in stage one only and those respondents in stage one and two based by religious group ..................................................103
Table 4.3 Distribution of respondents by their religious groups in stage one and stage two, AFFP study ................................................................................................104
Figure 4.5 Summary of movements between religious groups,1981 and 1991, AFFP study...................................................................................................................105
14

Table 4.4 Movements between religious groups by age group, 1981-1991, AFFP study...................................................................................................................107
Table 4.5 Comparison of average weekly attendance level at religious services according to changes in religious affiliation, 1981-1991, AFFP study .............108
Table 4.6 Comparison of average weekly attendance level at religious services according to changes in religious affiliation between Christian groups and No Religion group, 1981-1991, AFFP study...........................................................109
Table 4.7 Comparison of average weekly attendance level at religious services according to changes in religious affiliation between Christian groups and Non Christian religious group, 1981-1991, AFFP study ...........................................110
Table 5.1 Comparison of weekly attendance by sex and religious group from the Mol, 1966 and ISSP, 1993 Surveys............................................................................115
Table 5.2 Comparison of weekly attendance between those who retain affiliation with converts to religious group present in Mol, 1966 and the ISSP, 1993 surveys .117
Table 5.3 Percentage of Catholics who attend weekly by age and sex, Mol, 1966 and ISSP, 1993 surveys ............................................................................................120
Table 5.4 Percentage of Anglicans who attend weekly by age and sex, Mol 1966 and ISSP 1993 surveys .............................................................................................121
Table 5.5 Percentage of Uniting/Presbyterians who attend weekly by age and sex, Mol 1966 and ISSP 1993 surveys..............................................................................123
Table 5.6 Percentage of Other Christians who attend weekly by age and sex, Mol 1966 and ISSP 1993 surveys..............................................................................124
Table 5.7 Comparison of weekly attendance by age and sex for those who retained religious affiliation and those who converted in Mol,1966 and ISSP, 1993 Surveys...............................................................................................................126
Table 5.8 Comparison of weekly attendance level at religious services based on retention of religious affiliation by age in stage one and stage two, AFFP study............................................................................................................................129
Table 6.1 Comparison of weekly attendance levels between 1966 and 1991 based on place of birth ......................................................................................................135
Table 6.2 Comparison of Weekly Attendance Levels by Place of Birth of Parents and Respondent in 1966 and 1991............................................................................136
Table 6.3 Comparison of 1966 and 1991 attendance levels based on place of birth compared by length of time at current residence ...............................................138
Table 7.1 Comparison of marital status for those over age of 15 in 1966 and 1993 .141 Table 7.2 Percentage never married by age and sex 1966 to 1996............................142 Table 7.3 Median age at first marriage ......................................................................143 Table 7.4 Percentage of currently married persons who cohabited prior to marriage
............................................................................................................................144 Table 7.5 Proportion of population aged 15-44 in couple relationships who were in de
facto relationships in 1991 .................................................................................145 Table 7.6 1991 Proportion of partners with same affiliation .....................................146 Table 7.7 Percentage of marriages by ministers of religion and civil celebrants ......146 Table 7.8 Comparison of weekly attendance level based on marital status in 1966 and
1993....................................................................................................................147 Table 7.9 Comparison of weekly attendance levels in 1981 and 1991 AFFP Study
based on change in marital status of those belonging to Christian Groups .......149
15

Table 7.10 Weekly attendance levels of respondents in 1981 and 1991 based on a comparison of a respondent’s religious affiliation in 1981 and its similarity with partner’s religious affiliation in 1981 and 1991.................................................151
Table 8.1 Catholic population in the Australian Capital Territory between 1966 and 1996....................................................................................................................157
Table 8.2 Catholic population by masses in the Australian Capital Territory between 1966 and 1996....................................................................................................157
Table 8.3 Change in distribution of masses in Canberra between 1966 and 1996 ....159 Table 8.4 Change in number of priests in Canberra between 1966 and 1996 ...........162
16

1. Introduction
1.1 Objectives of the thesis Over the period between 1966 and 1996, there have been distinct
changes in the patterns of religious affiliation and religious attendance in Australia.
This has affected the composition of religious groups and has marked a distinct
change in the way people are involved with the institutions which represent those
religious groups. This thesis will concentrate on how the patterns of attendance and
affiliation have changed within these Christian religious groups over this time period.
The objectives of this study are fourfold. The first objective is to formulate a
standard measure of weekly religious attendance based on data from surveys that use
different methods of recording levels of attendance at religious services. The second
is to compare and contrast changing patterns of attendance and affiliation within
Christian groups. This will highlight the connection between levels of weekly
attendance and affiliation and any changes which occurred between 1966 and 1996.
Third, the thesis will concentrate on how various demographic and socio-economic
measures help to explain whether life cycle events or generational change have a
significant influence on religious identity and practice. Lastly, theories will be put
forward to explain these changes.
1.2 Why demography?
Often during the course of my thesis I have been asked the question, why
Demography? Other disciplines such as Sociology and Religious Studies have made
fundamental contributions to the debate about changes to the nature of religion both in
17

Australia and internationally. In each discipline there is a tendency to focus on
particular issues which are pertinent to the area. Thus in Sociology the interest in
religious affiliation and attendance looks at the social nature of religion in society.
Religious Studies on the other hand looks at the theological aspects of religious
attendance and affiliation. In these two disciplines, demographic indicators have often
been used in an attempt to understand more clearly the particular issues that are
relevant to each discipline. By way of cohort analysis Demography can play an
important part in clarifying and naming the major changes in patterns of religious
affiliation and attendance that have occurred in the period between 1966 to 1996.
Changes in religious attendance and affiliation are important indicators of more
general changes in religious behaviour. Religious Affiliation provides the broadest
definition of what it means for a person to belong to a religious group. It allows a
researcher to examine how a person's religious identity may change over time and
how those changes affect the religious group. Religious Attendance provides one
interpretation of how a person's behaviour is linked to a particular religious group and
also indicates the way a person associates with that institution. The strength of this
association can be determined by how frequently a person attends services conducted
by that religious group. As such religious attendance is a more specific definition of
what it means for a person to belong to a religious group. What is of particular
interest to this thesis is how the pattern of association between religious affiliation and
religious attendance has changed over the period of 1966-1996 and what demographic
characteristics might help chart those changes.
In looking at religious affiliation and religious attendance there are specific
issues, which need to be examined in order to understand how both terms are used by
researchers. It is also necessary to examine the issues raised by other researchers to
18

explain changes in religious affiliation and attendance. However, this study will seek
to build on this knowledge by highlighting how the patterns of religious attendance
and affiliation have changed during the period between 1966 and 1996. It will seek to
argue that a study of religious attendance needs to consider the level of weekly
attendance among those who change religious affiliation, which might explain the
different levels of attendance between and within religious groups. Lastly, it will
examine the levels of weekly attendance of those who do not change their religious
affiliation and how this may be related to socio-economic and demographic factors.
1.3 Measuring attendance
In 1993, Hadaway, Marler and Chaves1 created a major debate on the way data
on church attendance were collected in the United States. This debate arose from a
comparison of ‘headcount’ data that was collected among Protestants in the rural
Ohio county of Ashtabula and from 18 Catholic Dioceses in America with those
collected by other social science surveys. Their major contention was that there was a
difference between self reported behaviour and observed behaviour and that the
counts taken by social science surveys and opinion polls tend to overestimate the level
of attendance on any given Sunday. They also added that this tendency to over-report
had increased over time and that as a result church attendance in America, which had
declined in the 1960s and 1970s, might have continued to decline in the 1980s and
1990s. This created considerable debate within the research community in America
and led to a symposium of articles on church attendance in the American Sociological
Review in 1998.
1 Hadaway, Marler, Chaves (1993) ‘What the polls don’t show: A closer look at U.S. Church Attendance’ in American Sociological Review, Vol. 58, December 741-752
19

This symposium raised some important ideas that any researcher examining
the issue of church attendance or attendance at any religious service needs to take into
account. Caplow2 contends that part of this difference in measurement of attendance
may be due to the over-reporting of people who claim to be members of the
Episcopalian Church rather than an under-reporting of attenders. He also stresses the
need to ensure that when surveys are compared the attendance counts take place at the
same time of year. He adds that in many cases the counts taken are estimates rather
than physical head counts of those attending a service. Greeley and Hout 3 contend
that the over-reporting of levels of attendance is due to the ‘social desirability’ of
attendance and that the level of ‘over-reporting’ has actually increased in the 1980s
and 1990s. They argue that the over-reporting of attendance figures provided by
surveys is not as great as that reported by Hadaway, Marler and Chaves. They make
two important points to support this argument. The first is that if actual church
attendance has declined among younger generations it can be assumed that some sign
of this will appear in reported attendance. The second point they raise is that actual
church attendance tends to increase with age and that this makes it less likely for the
older generations to under-report their attendance. Lastly, Woodberry4 suggests that
the results of telephone polls conducted by researchers can explain half of the
difference between actual attendance and reported attendance highlighted by
Hadaway, Marler and Chaves. Thus he suggests that a good part of the sampling
problems involved in collecting attendance data derive from the method by which the
2 Caplow, (1998), ‘The Case of the Phantom Episcopalians’ in American Sociological Review, Volume 63, February 112-113 3 Hout, Greeley (1998) ‘What Church Officials’ reports don’t show: Another look at Church Attendance’ in American Sociological Review, Volume 63, February 113-119 4 Woodberry (1998), “When Surveys Lie and People Tell the Truth: How Surveys Oversample Church Attenders’ in American Sociological Review, Volume 63, February, 119-121
20

data are collected. He argues that asking the question in face to face polls is more
reliable.
In addressing these concerns, Smith5 points out some particular difficulties
that are pertinent to any debate about levels of church attendance. The first is the
method by which religious attendance is measured, whether it is based on a survey or
a physical headcount of those attending a religious service. The second point that he
raises is how broadly based the survey question is worded. For example, the response
to a question on attendance at a religious service in the last seven days will not be the
same as the response to a question about attendance on a particular day of worship.
The last point he makes is that the standard attendance question assumes personal
attendance at a formal place of worship at a regular worship service. This tends to
ignore those who attend some other type of religious service or who watch a religious
service on television or listen to a service on radio. There is also the possibility that
those who attend a religious service and another religious event may actually have
their attendance over-reported. As a result of his research he found that there is a
tendency to over-report the level of attendance in social science surveys compared to
actual headcounts. However the over-reporting was not as great as that reported by
Hadaway, Marler and Chaves. This finding is also supported by work conducted by
Presser and Stinson6.
This research is important when considering similar comparisons of the social
science surveys used in this thesis to see whether there are levels of over-reporting in
the time period examined. This comparison is limited in part by the historical nature
of the data and the way in which questions were asked in each of the surveys.
5 Smith, (1998) ‘A Review of Church Attendance Measures’ in American Sociological Review, Volume 63, February 131-136
21

However, it does appear that two questions need to be asked of each of the surveys
used. Is there a difference between reported behaviour collected by social science
surveys and observed behaviour collected by headcounts? Is there a difference in
behaviour, which can be related to what is defined as attendance at a religious service
by the researcher and the respondent? The first question is probably the easier to
answer, as it is possible to compare the attendance levels in surveys with head-counts
or surveys conducted at similar times. The second is more complicated. At best it is
only possible to arrive at speculations about why the level of attendance reported by a
particular religious group may be different from that reported in a survey. Thus
attendance reported in surveys may vary depending on whether it refers to attendance
at a particular worship service, in a formal place of worship, on a particular day.
People may attend a service on a day other than the formal day of worship. They may
attend at a place or manner separate from a formal place of worship. They may attend
at more than one service on a particular day. They may attend at a service of another
religious group than the one to which they are affiliated.
1.4 Demographic studies
Australia is probably one of the few countries which provides for the
collection of religious affiliation data at each census. As a result it is possible to
compare this historical data over a period of time. This has resulted in the Australian
Bureau of Statistics and other bodies compiling a few special studies focussing on the
nature of religion in Australia. These are ‘Census 86: Religion in Australia’7, a special
supplement published in ‘Australian Social Trends 1994’8 and the series of ‘Religious
6 Presser and Stinson (1998) ‘Data Collection Mode and Social Desirability Bias in Self-reported Religious Attendance’ In American Sociological Review, Volume 63, 137-145 7 Castles (1991), Census 86: Religion in Australia, Australian Bureau of Statistics, Canberra 8 Castles (1994), Australian Social Trends, 1994, Australian Bureau of Statistics, Canberra, 175-197
22
Community Profiles’ published by the Bureau of Immigration, Multicultural and
Population Research9. This has allowed researchers to gain a better understanding of
changes that have occurred to religious affiliation, particularly in the period from
1966 to 1996.
The studies show that there has been a shift in the patterns of affiliation
between 1966 and 1996. Specifically, there has been a decline in the percentage of
people of Christian affiliation and an increase in the percentage of those belonging to
Non Christian religions and who have 'No Religion'. The measurement of these
changes is made possible by refinement of the questions that were asked in each
census and of the classification of responses to the question asked on religion.
Two main factors appear to explain the changes in levels of affiliation. The
first is the different countries of birth of those people who were born overseas and
who arrived in Australia between 1966 and 1996. These people may display different
levels of religious affiliation depending on their country of birth when compared to
the Australian population as a whole. Price10 comments that certain ethnic groups
report significant percentages of people who state they have “No Religion”. The first
group come from the United Kingdom, Western Europe and North America. They
show percentages of people who state that they have 'No Religion' which are similar
to those born in Australia. However, those people born in China and Japan had much
higher proportions in the 'No Religion' category when compared to those born in
Australia. On the other hand, those who were born in East Europeans from
Communist regimes and now lived in Australia had lower percentages stating they
had “No Religion”. This was similar for people from Southern Europe, West Asia and
9 Hughes (ed.) (1996) The Religious Community Profiles, Australian Government Printing Service, Canberra
23

South Asia. He also states that those in the third and later generations from countries
with high levels of “No Religion” come closer to levels of No Religion represented by
the Anglo-Celtic third and later generations. Lastly, he points out that in marriages
between people of different ethnic origins, especially where the husband and wife are
of different religious traditions, this often leads to children dropping both parental
faiths.
The second point, raised by Hughes,11 is that there are differing age structures
across religious groups. In the 1991 Census, among the Anglicans, Churches of
Christ, Jewish, Lutheran, Presbyterian/Reformed, The Salvation Army, The Seventh
Day Adventists, and The Uniting Church there is a tendency to have higher
proportions of people in the older age groups than the total Australian population and
lower proportions of people in the younger age groups. Those in the Orthodox group
display a similar pattern except in the 20-29 age group where the proportion of people
is higher than that in the Australian population. The Catholic and Baptist Churches
show age structures that are close to those displayed by the Australian population.
Lastly, Buddhists, Hindus, Muslims, Pentecostals and those who state they have No
Religion have higher proportions of people in younger age groups when compared to
the total Australian population and lower proportions of people in older age groups.
This may indicate that some religious groups are better represented by higher levels of
people in younger age groups while other groups show a higher retention of people in
older age groups. However, of itself age structure cannot be used as an explanation for
the different levels of religious affiliation. It can only point to the fact that levels of
religious affiliation may have changed in different age groups.
10 Price, (1991) Religion and Ancestry in Australia: Changes over the Generations: 1986, Australian Immigration Research Centre, Canberra 36-37 11 Hughes(1997) Religion In Australia: Facts and Figures, Christian Research Association, Melbourne
24

An associated point that needs to be raised is the relationship between
affiliation and attendance that was identified in the Religious Community Profiles12.
Some religious groups showed clear associations between attendance and affiliation
by age group. Others showed that there was a much higher proportion of attendance
among older people compared to the proportion of those affiliated to that group and
correspondingly lower proportions of attendance in younger age groups. Thus it
appears that in 1991 the Pentecostal13, Lutheran14, Baptist15 religious groups and
Orthodox Jewish males16 show a strong association between affiliation and
attendance. That the percentage of each age group who said they attend regularly
matched the percentage of those in each age group who stated that they belonged to
that religious group. However, those belonging to Catholic,17Anglican18, Uniting19
and Presbyterian20 churches did not show this association.
Bouma21 suggests that the level of attendance does not act as an indicator of
how strong a religious group is and that different denominations have different
standards of attendance. This is also noted by Richter and Francis 22who state that
while Protestant churches may display high levels of attendance people do not remain
12 Hughes (ed.) (1996) The Religious Community Profiles, Australian Government Printing Service, Canberra 13 Hughes(1996) The Pentecostals in Australia, Australian Government Printing Service, Canberra, 95 14 Schild & Hughes(1996) The Lutherans in Australia, Australian Government Printing Service, Canberra, 66 15 Hughes(1996) The Baptists in Australia, Australian Government Printing Service, Canberra, 71 16 Rubenstein(1996) Judaism in Australia, Australian Government Printing Service, Canberra, 50 17 Hughes(1996) Religion in Australia: Facts and Figures, Christian Research Association, Melbourne, 20 18 Blomberry( 996) The Anglicans in Australia, Australian Government Printing Service, Canberra, 74 19 Bentley & Hughes(1996) The Uniting Church in Australia, Australian Government Printing Service, Canberra,79 20 Burke &Hughes(1996) The Presbyterians in Australia, Australian Government Printing Service, Canberra, 85 21 Bouma(1992) Religion: Meaning, Transcendence and Community in Australia, Longman Cheshire, Melbourne,95 22 Richter & Francis,(1998) Gone but not Forgotten: Church Leaving and Returning, Darton, Longman and Todd, London, 9
25

part of these churches for long periods of time. Currie, Gilbert and Horsley23, in their
study of patterns of membership and attendance in Protestant churches, make the
point that in many cases affiliation and thus attendance are influenced more by
demographic and social factors than the actual theological style of the churches. Mol24
adds to this debate by suggesting that:
“If individual thought and conscience begin to move centre stage, a religious organisation begins of necessity to be less cohesive, more devisive and pluriform. It may maintain all the trappings of the ancient theology but it has now opened its flank to an ideology in which individual autonomy is strong. And this means that institutional decision making has to compete more with individual opinion. Church going now becomes more optional”
1.5 Life course and generational changes
When issues of attendance are debated, Greeley and Hout 25 argue that the
changes in patterns of attendance are linked to life course events. This view is
supported by Firebaugh and Harley26 who note that where age differences occur in
patterns of attendance this can be explained by life cycle changes rather than by
generational effects. Ploch and Hastings27 add that where cohort studies have been
undertaken there are signs that older cohorts have higher levels of attendance.
Bouma28 summarises this position in stating that:
“Those who are under twenty are likely to be living at home and dependent upon their parents. Their religion is more likely to be like that of their parents. Those in their twenties are in the transition from dependency to growing independence, family relationships, completing training or education, finding jobs, and sorting out career issues, and are less likely to be residentially stable. This age group is likely to have the least time for religion, is likely to
23 Currie, Gilbert and Horsley, (1977) Churches and Churchgoers: Patterns of Church Growth in the British Isles since 1700, Clarendon Press, Oxford, 118 24 Mol(1985) The Faith of Australians, George, Unwin and Allen, Sydney, 62 25 Hout, Greeley (1998) ‘What Church Officials’ reports don’t show: Another look at Church Attendance’ in American Sociological Review, Volume 63, February 113-119 26 Firebaugh & Harley (1991), ‘Trends in U.S. Church Attendance: Secularism and Revival’ in Journal for the Scientific Study of Religion, 30(4) 487-500 27 Ploch and Hastings (1994) ‘Graphic Presentations of Church Attendance using General Social Survey Data’ in Journal for the Scientific Study of Religion,33(1) 16-33 28 Bouma(1992) Religion: Meaning, Transcendence and Community in Australia, Longman Cheshire, Melbourne,128
26
view religion as constraining, when what they want is freedom, and is likely to be more interested in experimentation, including experimenting with meaning systems. No wonder it is the lowest level of religious practice. People in their thirties are usually in some form of family relationship, most have children, mortgages and relatively settled jobs. It is often reported that this group shows a return to religion. People between forty and seventy again tend to be dealing with growing families, maturing children, settled jobs and increased interest in finding meaning, opportunities to be of service and tend to demonstrate more interest in religious activity. This tapers off after seventy as they become less able to get out and about.” On the other hand Chaves29 argues that differences in attendance by age
suggest that some other factor is at work. Thus the changing patterns of attendance
may be due to other social processes at work within society. Several researchers point
to generational issues which may explain these changes in the case of Australia.
Flynn30 in his study of Catholic schools in Australia points to declines in
attendance of successive generations of students completing Year 12. He finds that
these declines can be associated with issues of sexuality, faith understanding and
issues of authenticity. Mason31 finds that the influence of Catholic schooling has a
positive effect on the level of Catholic attendance. While it is not possible to test these
influences in this study, it is possible to examine comments that Mason makes that
age, sex, divorce, mixed marriage, and ethnic status are distinct indicators of changing
levels of attendance among young people.
Bentley, Blombery and Hughes32 point to other demographic issues which
may explain the change in patterns of attendance. The first is that young families have
greater involvement in Church than young single people. As a result the post war baby
29 Chaves(1989), ‘Secularisation & Religious Revival: Evidence from U.S. Church Attendance Rates 1972-1986’ in Journal for Scientific Study of Religion, 28(4) 464-477 30 Flynn,(1993), The Culture of Catholic Schools: A Study of Catholic Schools 1972-1993, St. Paul’s Publications, 426-427 31 Mason (1985), ‘The Future of the Australian Church’ A Paper presented to The Redemptorist Pastoral Seminar at Kew, September 28th-29th, 1985, 17 32 Bentley, Blombery & Hughes, (1992) Faith without the Church? Christian Research Association, Melbourne, 106
27
boom may well have increased levels of attendance in the 1950s and 1960s but lower
fertility rates have seen those levels of attendance fall in subsequent generations. This
observation would appear to be sustained in Schoenherr and Young’s studies of the
aging of Catholic Priests in the United States33 where they detail issues of the
demographic transition which have an impact on levels of attendance. However they
also point to an age effect in explaining the changing levels of vocations with fewer
young single men committing themselves to a life as a priest.
Currie, Gilbert and Horsley34add that the demographic and religious issues
affecting religious attendance need to be taken into account in understanding these
changes. They point to generational issues of cultural utility as being significant in
explaining changing patterns of attendance and affiliation. Thus they argue that where
a person no longer believes in the influence of the supernatural they are less likely to
remain part of an institution which promotes such a belief. This would also seem to be
linked with the idea that where a person does not see the utility of an institution in
interceding with such a supernatural force that their attendance is likely to decline.
They add that in situations where this separation from an institution occurs, a lengthy
process of formation has to be undertaken to reinstitute a person into regular church
practice. As with Mason, they also point to issues of education, geographic and
occupational mobility as being significant events which may cause a person’s level of
attendance to decline. This has also been highlighted by Hughes and Blombery35:
“ Our mobility has enabled us to draw on a greater number of options for work and leisure correspondingly, the significance of the local community has declined. At the same time, life has become more thoroughly segmented. The
33 Schoenherr and Young, (1993), Full Pews and Empty Altars, The University of Wisconscin Press, Wisconscin, 331-347 34 Currie, Gilbert and Horsley, (1977) Churches and Churchgoers: Patterns of Church Growth in the British Isles since 1700, Clarendon Press, Oxford, 122-123 35 Hughes and Blombery (1990) Patterns of Faith in Australian Churches, CRA, Melbourne 141
28

chance of overlap between people or the geographical areas in which they shop, work, take our leisure or go to church has declined.”
1.6 Outline of thesis A great deal of data have been collected which have sought to measure the
level of religious affiliation and attendance. Chapter Two provides an analysis of how
census data on religious affiliation have been collected from 1966 to 1996. It looks
particularly at the changes in the question asked in the census, the refinement in the
classification of religious affiliation and the changing religious profile over the time
period. In addition it looks specifically at the effects of age and those born overseas in
trying to explain these changes in patterns of affiliation. There is evidence that a large
part of the changes to patterns of affiliation relate to these two points. This combined
immigration/conversion effect is examined by an analysis of five cohorts, which
experienced these changes in patterns of affiliation between 1966 and 1996.
In Chapter Three, the main four data sets used in this thesis are described. Two
of these surveys, Mol’s ‘Religion in Australia’ survey (1966) and the International
Social Science Survey, Religion, Australia (1993) were chosen to form the basis of
the comparison of religious attendance at the beginning and end of the time period.
The Australian Family Formation Project, a longitudinal survey conducted in 1981
and 1991, and the Australian Living Standards Survey (1991), both conducted by the
Australian Institute of Family Studies, also provide useful data in areas not covered by
the first two surveys. In analysing these data it is necessary to arrive at a measure of
attendance which allows a comparison of data from all the surveys. In undertaking
this comparison it was decided to adopt an approach similar to that taken by
29

Woodberry36 to arrive at a measure of average weekly attendance. The chapter also
compares data from other surveys and headcount data to see whether the surveys used
in this thesis tend to show higher or lower levels of attendance.
Chapter Four examines changes in the religious affiliation of individuals who
took part in the Australian Family Formation Project and discusses a model which
attempts to explain the changing patterns of religious affiliation between 1981 and
1991. It also proposes a model which tries to explain the changes in levels of
attendance. This looks specifically at the levels of attendance of those who have
always belonged to the same religious group and those who changed their religious
group sometime in their life.
Chapter Five concentrates on a comparison of the levels of average weekly
attendance by age and sex for those who have always belonged to the same religious
group. This study will compare the periods in 1966 and 1993 to discover whether
average weekly attendance is influenced by these demographic characteristics.
Finally, specific religious movements will be examined to see if these explain some of
the changes in patterns of affiliation and attendance.
In order to examine these changes, it was decided that certain demographic
indicators related to migration, residency, and marital status would be used. These
indicators are compared by age and sex to note any particular differences which may
be due to generational or gender differences. By analysing these demographic
characteristics it was hoped to identify the relationship they have to changing patterns
of attendance. In Chapter Six, the relationship between country of birth and religious
attendance is examined with a particular focus on migrants from non-English
36 Woodberry, (1998) ‘When Surveys Lie and People tell the Truth: How Surveys Oversample Church Attenders’ in American Sociological Review, Volume 63, February 121
30

speaking countries. The length of residency at a particular place is examined to
determine whether issues of stability of residence has an effect on levels of
attendance. Chapter Seven examines the levels of religious attendance of those who
were never married, married, divorced or separated or widowed to determine whether
there are changes in patterns of attendance between 1966 and 1993 based on marital
status. Data from the Australian Family Formation Project are examined to observe
how the religious identity of married and never married couples are related to their
religious attendance. In Chapter Eight, a case study of the Catholic Church in the
Archdiocese of Canberra and Goulburn between 1966 to 1996 was examined to
observe how these particular changes affected attendance patterns in Canberra
parishes.
The conclusion concentrates on three points. The first is how religious
attendance can be measured in future surveys to arrive at more precise results. The
second is how census data can be used to provide more useful information on the
changing nature of religion in Australia. The third item that will be discussed is the
relationship of demographic and social characteristics and the association they have
with changing patterns of religious attendance and affiliation. As such it will try to
postulate theories about the change in the nature of these relationships and how they
may be tested through further research.
31

2. Changes in religious affiliation
2.1 Introduction Before examining the changes in patterns of religious attendance, it is
important that the changes in the religious profile of Australia's population are
examined. It is also necessary to examine some important areas of change in the
collection of the data on religious affiliation. This information will provide a clearer
insight into how changes in religious affiliation affect particular religious groups. This
is especially important because religious affiliation is used as the denominator of
religious attendance in all surveys. Thus it is essential to understand how patterns of
affiliation may have changed before examining changing patterns of attendance.
The five yearly censuses of the Australian population conducted by The
Commonwealth Bureau of Census and Statistics, later known as the Australian
Bureau of Statistics from 1976, are the sources of information on religious affiliation.
Before analysing this information, it is important to understand how the question
asked in the census has changed between 1966 and 1996 and also how the data have
been categorised in the census reports. There have also been changes to how these
data have been published over time and this needs to be reflected upon to understand
how data on religion have been made available to researchers.
Another point to consider is how responses to the census question on
religion can be affected when one person provides information on the religious
affiliation of other people living in the household. A change can occur between
censuses when the person answering the religion question changes from the parent
reporting the details of a child’s affiliation to the adult children reporting their own
32

affiliation in a later census. This change may occur due to a parent’s assumption of
the child’s religious affiliation. However, it is also possible that the change occurs
because the child’s religious affiliation actually changes between censuses. For the
purpose of this study the age groups that are of particular interest are those between
15 and 65.
To examine changes in religious affiliation over the period 1966 to 1996 it is
also useful to follow three cohorts of males and females, those aged 15-24 years old,
25-34 years old and 35-44 years old in 1966, through the three subsequent censuses in
1976, 1986 and 1996. By examining these age groups more closely it will be possible
to assess the changes which have occurred to the size of each religious group due to
the net effects of net migration and movements from one religious group to another.
Comparisons will also be made with two other cohorts, those aged 15-24 in 1976 and
1986, to examine whether similar changes of affiliation are present in these cohorts.
In undertaking such a comparison it is important not to ignore the significant
influence of immigration in changing patterns of affiliation. While it is not possible to
isolate the effect that this has on the changes in religious affiliation, the 1991 and
1996 Census data are used to examine the religious affiliation of those born overseas
by the period of their arrival.
2.2 Census data on religion
2.2.1 The census question on religion
The religion question has been asked in each census but it has always been an
optional question under the Census and Statistics Act 1905.37 The reasons for
collecting these data have been: to assist in the location of places of worship and
33
welfare agencies, to assist governments in the appointment of Chaplains and
accreditation of Marriage Celebrants, and in providing grants to religious groups to
assist in provision of education and allocation of air time on radio.38
There were four transitions in the method of asking the question on religion
between the 1966 and 1996 Censuses:
1966 Census:
State the full name of the religious denomination (There is no penalty
for failure to answer this question.)
1971 and 1976 Censuses:
What is each person’s religious denomination?
(If no religion write “None”)
1981 and 1986 Censuses
What is each person’s religious denomination?
(This question is optional)
(If no religion write “None”)
37 Castles (1989), 1991 Census of Population and Housing: Content and Procedures, Australian Bureau of Statistics, Canberra, 29 38 Ibid 29
34

1991 and 1996 Census
What is this person’s religious denomination?
(Answering this question is OPTIONAL)
(If no religion mark last box)
Catholic
Anglican (Church of England)
Uniting Church
Presbyterian
Greek Orthodox
Baptist
Lutheran
Other- Please Specify
No Religion
2.2.2 The classification of religion The classification of Religious Groups by the Australian Bureau of Statistics
has undergone a refinement of categories, particularly in the 1991 and 1996 Censuses,
which has allowed a more detailed study of religious groups present in Australia. This
can be observed in table 2.1 which highlights the greater detail that has been made
available in the 1991 and 1996 Censuses. The classification structure adopted in 1996
provides for seven broad groupings: Buddhism, Christianity, Hinduism, Islam,
Judaism, Other Religions and No Religion.39 The classification can then be divided
into 33 categories known as "Narrow Groupings" and then further subdivided into a
100 specific religious groupings. The religious groups can be further defined by 1591
35

individual groups which are so small that statistical information is not available for
them.
Table 2.1 The classification of religious affiliation in the censuses represented by number of categories identified with each religious groups40
Religious Group 1966 1971 1976 1981 1986 1991 1996
Catholic 2 2 2 2 1 1 4 Anglican 1 1 1 1 1 1 1 Uniting/Presbyterian 3 3 3 4 3 4 4 Orthodox/Oriental 1 1 1 1 2 15 14 Other Christian 8 9 10 12 11 40 39 Non Christian 2 3 3 4 5 14 29 No Religion/Not Stated 3 3 3 3 4 4 9 Total Categories 20 22 23 27 27 79 100
The changes in classification allow greater access to the religion data which
have been collated by the Australian Bureau of Statistics. This allows for both a broad
analysis of major religious groups and a more specific analysis of the spectrum of
religious groups represented within the Australian population. This change in
classification seems to have come about for the following reasons:
1. A more comprehensive study of Religious Groups in Australia41
2. The level of computer technology which allowed greater sophistication in
the recording and presentation of data.
3. Requests by religious groups and researchers for more accurate data on the
composition of affiliates.
39 McLennan, Australian Standard Classification of Religious Groupings, Australian Bureau of Statistics, Canberra, 1996, 15 40 A detailed summary of these classifications is contained in Appendix A 41 Humphreys and Ward, Religious Bodies in Australia, 3rd Edition, New Melbourne Press, 1995
36

4. The change in the production and presentation of statistics on religion
within the Australian Bureau of Statistics following the 1991 Census
which provided individual tables on a fee for service basis.
5. The increased diversity and changing religious identity of Australia’s
population.
How these changes in classification affect the presentation of statistics on
Religion is not clear. While the increase in the number of religious groups allows for a
more comprehensive view of religious affiliation it seems not to have affected the
classification of the five Christian religious groups used in this study. In table 2.1 it
can be seen that the Orthodox/Oriental and Catholic categories have been reclassified
and this is done in order to take account of different rites based on ethnic identity.
Thus within the Orthodox/Oriental groups this would include such rites as the
Egyptian Copts while the Catholic group would include those belonging to Marionite
and Melikite rites. The Other Christian group on the other hand shows a change in
composition to account for the increase in the number of smaller Christian groups
which has occurred between 1966 and 1996. A detailed presentation of these changes
has been provided in Appendix A.
The increase in the number of Non Christian Religions classified takes into
account the increasing numbers of people affiliated with Buddhism, Hinduism, Islam
and Judaism among immigrants to Australia, and the number of smaller Non Christian
religious groups which represent 11.1% of Non Christians in the 1996 Census.
The No Religion group also included Humanists/Materialists in 1991 and
Agnostics, Atheists, Humanists and Rationalists in 1996. While the size of these
groups is not large their inclusion within the census shows a more specific
identification of those groups contained within the No Religion category than has
37

been seen in the previous censuses. These broader ranges of classification of all
religious categories provide opportunities for a better understanding of the religions
present in Australia.
2.2.3 The changes that affected Christian religious groups
During the period from 1966 to 1996 four of the Christian Religious groups
examined in this thesis underwent significant institutional changes. The Catholic
Church in Australia was influenced by the Second Vatican Council that was held in
Rome between 1962 and 1965. This council produced sixteen documents that dealt
with the relationship of the Church with the modern world. The most significant
document, “Sacrosanctum Concilium” affected the liturgical practice of the Catholic
Church and is the most important in considering issues of attendance. This document
not only sought to change the liturgical rites from Latin into the vernacular but also to
involve the people in the celebration of those rites. This encouragement of lay
participation in the life of the Catholic Church was also accompanied by their
inclusion in areas that would have previously been the preserve of priests and
members of religious orders. At the same time it has also been noted that there has
been a decline in the number of priests and people belonging to religious orders in
Australia42.
In the same time period the Church of England was also subject to significant
changes in its organisational structure. This was initially established by the new
constitution approved by the 1955 General Synod which recognised the Church of
England in Australia as an autonomous Church in communion with the Church of
England. This was followed in 1978 by the publication of An Australian Prayer Book.
38

In 1981 the Church of England in Australia became the Anglican Church in
Australia.43 The Anglican Church in Australia became progressively self governing
and eventually all legal ties with the Church of England were removed. This group
will be referred to as “Anglicans” in this study.
The religious group that is identified as “Uniting/Presbyterian” in this study is
made up of three churches, the Methodists, Congregationalists and Presbyterians.
These churches had been discussing church union since 1924, firstly between the
Methodists and Congregationalists but later including the Presbyterians in the 1940s
and again in 1954. These discussions continued to 1977 when the majority of
Congregationalist churches, all Methodist churches and 64% of Presbyterian churches
joined together under the banner of the Uniting Church in Australia.44 The
Presbyterian Church of Australia stills forms a sizeable minority of those Presbyterian
churches who voted against church union. In New South Wales, half the
congregations remained as part of the Presbyterian Church, and also in Queensland
and Victoria, significant numbers of people remained in this church. This group was
combined as one group within the study because of the similarities in their traditions,
the discussions which led to the creation of the Uniting Church and the need to
compare the attendance levels of this religious group before and after that union.
The Other Christian group while containing established churches such as the
Baptists, Churches of Christ, Salvation Army and Lutherans was influenced by the
establishment of Pentecostal churches between 1966 and 1996. This development
was probably most evident in the 1960s and 1970s during which the growth of
Pentecostal churches and the influence of the Pentecostal movement within
42 The Archives of the Catholic Archdiocese of Canberra & Goulburn 43 Blombery, (1996) The Anglicans in Australia, Australian Government Printing Service, Canberra, 19
39

established churches was most evident. The emergence of this movement occurred at
similar times across the world, most notably in the USA, United Kingdom, India,
South Africa and Australia45. As such it can be assumed that the Pentecostal
movement has a significant impact on the composition of the Other Christian group
within this time period.
2.2.3 The presentation of the data
As has been noted with the changes in the question on religious
affiliation in the censuses, there have also been changes in the coding of the data on
religious affiliation. When the investigation of these data was first undertaken there
were initial difficulties in tracing data on religion by age and sex. While the data on
religion from the 1961 Census had been published by the Commonwealth Bureau of
Statistics in table 44 in “Part II. Cross Classifications of the Characteristics of the
Population by State and Territory” and those in the 1971 Census were presented in
table 23, it was found that a similar Table 76 prepared for the 1966 Census remained
unpublished by the same body. It was known by consulting research undertaken by
Hans Mol that this information was available at the time and helped in the publication
of his book, “Religion in Australia” in 1971.46
It was decided that in order to derive these data as accurately as possible it was
necessary to average the data available in ten year age groups provided in the 1961
Census with the comparable group aged by ten years from the 1971 Census. In this
44 Bentley & Hughes, The Uniting Church in Australia, Australian Government Publishing Service, 7-11 45 Hughes, (1996) The Pentecostals in Australia, Australian Government Printing Service, Canberra, 10 46 After discussions with Hans Mol, Gary Bouma, Charles Price, Michael Mason, Peter McDonald and a search of archive records at the Australian National Library, Australian National University and the Australian Bureau of Statistics it is believed that this information is no longer available.
40

manner it was possible to produce data on the religion of each age group by sex for
1966 for ages 15 and above.
Group 1961 Age Groups 1971 Age Groups 1966 Age Groups
1 10-19 years old 20-29 years old 15-24 years old
2. 20-29 years old 30-39 years old 25-34 years old
3. 30-39 years old 40-49 years old 35-44 years old
4. 40-49 years old 50-59 years old 45-54 years old
5. 50-59 years old 60-69 years old 55-64 years old
6. 60 years and above 70 years and above 65 years and above
These data were then compared with information prepared by Hans Mol in
“Religion in Australia”47 for the Catholic and Anglican religious groups. It was found
that the average of the 1961 and 1971 data corresponded with a great deal of accuracy
to the information recorded in Mol's study. It was thus considered that this method
accurately represented the Christian groups and Non Christian groups in the 1966
Census.
The one difficulty that was encountered was that the growth in the No
Religion group occurred at a greater rate between 1966 and 1971 than in the period
1961 and 1966. Part of the reason behind this growth was due to the fact that the 1971
Census stated that if a person had No Religion they were asked to state this on the
census form. This seemed to shift people from the Not Stated category to No
Religion. The consequence was that the Not Stated group experienced a decline in the
period 1966 to 1971.
47 Mol,.(1971) Religion in Australia: A Sociological Investigation, Allen and Unwin, Melbourne, 35
41

In order to calculate the 1966 population for each group the growth factor
between 1961 and 1966 and between 1961 and 1971 was measured in tables 2.2 and
2.3. This growth factor was calculated by dividing the population in the No Religion
and Not Stated groups in 1966 and 1971 by the population present of each group in
1961. Then for each age category in the 1961 Census they were divided by the 1971
growth factor and multiplied by the 1966 growth factor calculated for each group.
This made it possible to arrive at approximate population sizes for each of the ten year
age groups from age 15 and over for the No Religion and Not Stated groups in 1966.
Table 2.2 The growth factor of the No Religion group between 1961 and 1971
Year Male GrowthFactor
Female Growth Factor
1961 24857 - 12157 - 1966 60524 2.43 33567 2.76 1971 517359 20.81 338316 27.83
Table 2.3 The growth factor of the Not Stated group between 1961 and 1971
Year Male Growth Factor
Female Growth Factor
1961 593024 - 504547 - 1966 620607 1.05 518293 1.03 1971 421596 0.71 359651 0.71
After these calculations were undertaken each age group was totalled and this
total was compared against the age structure for the total population available through
the 1966 Census. It was discovered that the calculation produced differences between
the 1966 Census age structure and that calculated by averaging of the 1961 and 1971
Censuses. These differences were proportionally applied across each religious group
in the particular age group. After this calculation had been completed the number of
people in each religious group aged 0-14 was calculated by deducting the total
42

number of people age 15 and above from the total population for each religious group
in the 1966 Census. This calculation was carried out separately for males and
females. While these estimates by Religion, Age and Sex may not be exactly the same
as that produced in 1966 in table 76 by the Commonwealth Bureau of Census and
Statistics it represents the best approximation given the data available. These
estimates are used in the cohort analysis tables in Appendix B.
Data on religion by age and sex from the 1976 and 1986 Censuses were
available from tables published by the ABS. The data were in a similar format to that
made available in the 1971 Census, the main changes being the expansion of the Non
Christian groups to provide specific details about individual religious groups: Hebrew,
Muslim in 1976 and Buddhist, Hindu, Jewish, Muslim in 1986. It can also be noted
that the establishment of the Uniting Church occurred in 1977. The Presbyterian
group was also expanded to include the Reformed Churches in the 1986 Census.
A special 1996 Census table was constructed by the Australian Bureau of
Statistics which corresponded to the groups included in this study. Thus it was
possible to gain information by religion, age and sex for each religious group used in
this thesis. Thus the information prepared corresponded to the five Christian groups,
Catholic, Anglican, Uniting/Presbyterian, Orthodox/Oriental and Other Christian and
the three groups, Non Christian, No Religion, and Not Stated/Inadequately described.
2.3 Changes in religious affiliation 1966-96
It is important when examining changes in religious groups that both their
numerical size and their proportional representation within the Australian population
are observed. It should be noted that where this proportion changes over time it is not
necessarily a sign of numerical growth or decline of a religious group. Where changes
43
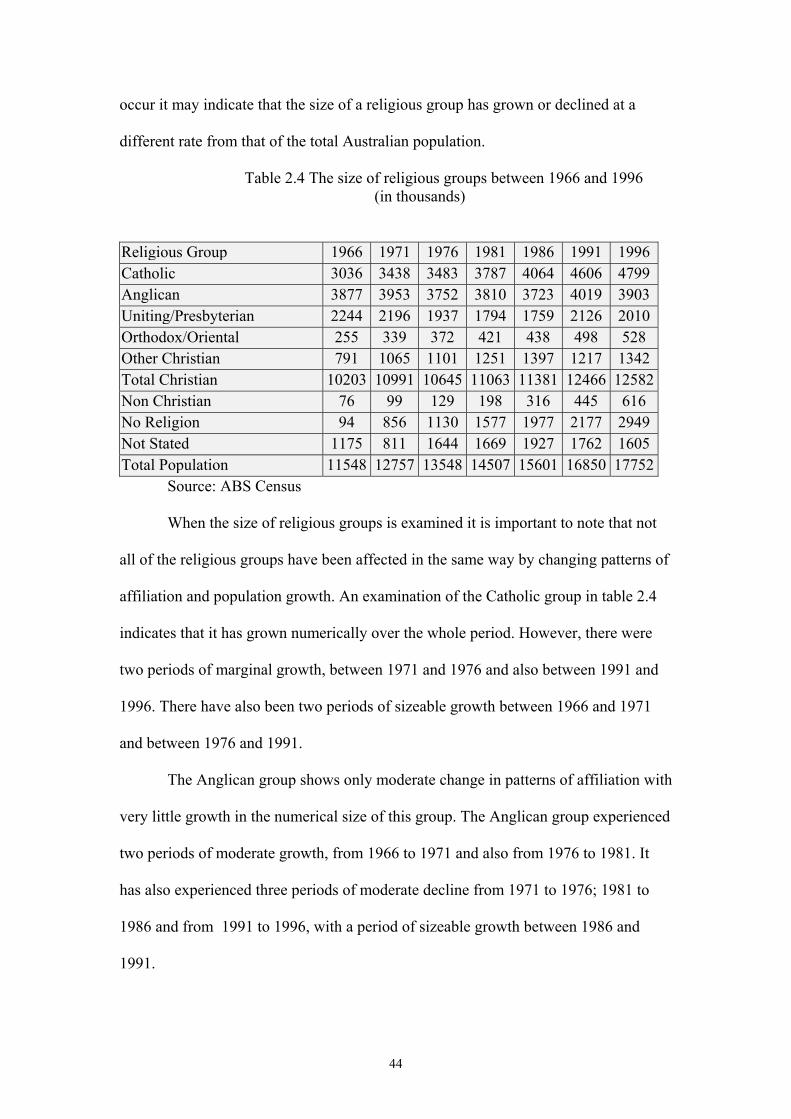
occur it may indicate that the size of a religious group has grown or declined at a
different rate from that of the total Australian population.
Table 2.4 The size of religious groups between 1966 and 1996 (in thousands)
Religious Group 1966 1971 1976 1981 1986 1991 1996 Catholic 3036 3438 3483 3787 4064 4606 4799 Anglican 3877 3953 3752 3810 3723 4019 3903 Uniting/Presbyterian 2244 2196 1937 1794 1759 2126 2010 Orthodox/Oriental 255 339 372 421 438 498 528 Other Christian 791 1065 1101 1251 1397 1217 1342 Total Christian 10203 10991 10645 11063 11381 12466 12582Non Christian 76 99 129 198 316 445 616 No Religion 94 856 1130 1577 1977 2177 2949 Not Stated 1175 811 1644 1669 1927 1762 1605 Total Population 11548 12757 13548 14507 15601 16850 17752
Source: ABS Census
When the size of religious groups is examined it is important to note that not
all of the religious groups have been affected in the same way by changing patterns of
affiliation and population growth. An examination of the Catholic group in table 2.4
indicates that it has grown numerically over the whole period. However, there were
two periods of marginal growth, between 1971 and 1976 and also between 1991 and
1996. There have also been two periods of sizeable growth between 1966 and 1971
and between 1976 and 1991.
The Anglican group shows only moderate change in patterns of affiliation with
very little growth in the numerical size of this group. The Anglican group experienced
two periods of moderate growth, from 1966 to 1971 and also from 1976 to 1981. It
has also experienced three periods of moderate decline from 1971 to 1976; 1981 to
1986 and from 1991 to 1996, with a period of sizeable growth between 1986 and
1991.
44
There are also signs that the changes in the numerical size of the
Uniting/Presbyterian group can be correlated to changes in the numerical size of the
Other Christian group. Between 1966 and 1986 the Uniting/Presbyterian group
experienced a sustained period of decline while the Other Christian group experienced
a period of sustained growth. In the 1986 to 1991 period the Uniting/Presbyterian
group experienced sizeable growth while the Other Christian group experienced a
decline relative to their total numerical size. The following period from 1991 to 1996
saw the Other Christian group experience a sizeable growth while the
Uniting/Presbyterian group experienced a similarly sized decline. Part of these
changes may result from the regrouping of the Reformed Churches within the
Uniting/Presbyterian group from 1986 onwards. However, this does not seem to
explain the close link between the two groups, which existed for the whole period. It
may suggest that a certain synchronicity between these two groups enables people to
easily shift affiliations within and between these two groups. The
Uniting/Presbyterian group was smaller in size in 1996 than in 1966
A study of the Orthodox/Oriental and Non Christian groups shows that both
have grown over the time period. The Orthodox /Oriental group experienced two main
periods of significant growth, from 1966 to 1971 and to a lesser extent from 1986 to
1991. The Non Christian group saw moderate growth from 1966 to 1976 and then
more sustained growth from 1976 to 1996.
A comparison of the No Religion and Not Stated groups shows that for two
periods of time the growth in the No Religion group was accompanied by a decline in
the Not Stated group. This can be seen particularly in the 1966 to 1971 period and to a
lesser extent in the 1986 to 1996 period. These changes seem to be closely correlated
to times when the census question changed to enable a more explicit indication that a
45

person had no religion. The provision of specified responses in the 1991 Census might
also in part explain the growth in the Catholic, Anglican, Uniting/Presbyterian and
Orthodox groups in the 1986 to 1991 period and a decline of the Other Christian
group. However, in the 1991 to 1996 period the No Religion group continued to grow,
as did the Catholic, Orthodox and Other Christian groups while the Anglican and
Uniting/Presbyterian groups experienced a period of decline. This suggests that the
change in the manner of asking the question has tended to make explicit the nature of
a person’s affiliation and has tended to reduce the number of those who have not
responded to the religion question. The one main exception appears to be in the 1976
Census where there was a high degree of non-response to many questions in the
census. The 1976 Census had a larger number of questions than other censuses
conducted in the period 1966 to 1996.
Where the proportion of a religious group has increased in table 2.5 it
indicates that it has grown at a rate faster than that of the population. Where the
proportion of a religious group has decreased it indicates that it has not grown as fast
as the total population. The proportion of Christians in the total population has
decreased between 1966 and 1996. This period of sustained change was only
interrupted by a slight increase in the 1986 to 1991 period. The Catholic group on the
other hand managed to keep up with population growth for the twenty years between
1966 and 1986. However, the Catholic group grew slightly faster than the total
population during the 1986 to 1996 period.
The Anglican and Uniting/Presbyterian groups were the most affected by this
change. It can be seen that both sustained similar patterns of decline in the 1966 to
1986 period. In the 1986 to 1991 period the Anglican group retained its proportional
size and the Uniting/Presbyterian increased its proportional size. However, in the
46

subsequent period the Anglican group continued to diminish to a level lower than that
reported in the 1986 Census while the Uniting/Presbyterian group diminished to the
same level reported in the 1986 Census.
The greatest period of growth for the Orthodox/Oriental group was between
1966 and 1971 with a sustained period of moderate growth continuing in the
subsequent censuses until 1991. In the 1991 to 1996 period there are signs that this
group has grown at a similar rate to the overall population.
Table 2.5 The percentage distribution of religious groups between 1966 and 1996
(in percentages)
Religious Group 1966 1971 1976 1981 1986 1991 1996
Catholic 26.3 26.9 25.7 26.0 26.1 27.3 27.0 Anglican 33.6 31.0 27.7 26.1 23.9 23.9 22.0 Uniting/Presbyterian 19.4 17.2 14.3 12.8 11.3 12.6 11.3 Orthodox/Oriental 2.2 2.7 2.7 2.9 2.8 3.0 3.0 Other Christian 6.9 8.3 8.1 8.6 9.0 7.2 7.6 Total Christian 88.4 86.2 78.6 76.4 73.0 74.0 70.9 Non Christian 0.7 0.8 1.0 1.4 2.0 2.6 3.5 No Religion 0.8 6.7 8.3 10.8 12.7 12.9 16.6 Not Stated 10.2 6.4 12.1 11.4 12.3 10.5 9.0 Total Categories 100.0 100.0 100.0 100.0 100.0 100.0 100.0 Source: ABS Census
The Other Christian group showed three periods of growth in its proportional
size, from 1966 to 1971, 1976 to 1986 and 1991 to 1996 and two periods of decline in
the period between 1971 and 1976 and between 1986 and 1991. The first decline may
have been influenced by the higher level of non-response in the 1976 Census but this
does not appear to have had a marked effect on the proportional size of this group.
However, the second decline may have resulted, in part, from the change in the way
the responses to the 1991 and 1996 Censuses were structured.
47

The changes in the proportion of people in the No Religion, Non Christian and
Not Stated groups show that both the Non Christian and No Religion groups have
grown at a faster rate than the overall population. The Not Stated category, however,
is less proportionally significant as a group in the 1996 Census than it was in the 1966
Census and this seems to be largely a result of the changes in the manner in which the
question was asked particularly in the 1971 Census and in the 1991 and 1996
Censuses. Thus in the 1971 Census the option of indicating that you had no religion
was introduced as a response to the religion question. In 1991 and 1996 the censuses
included an answer which allowed people to tick a box which indicated the religious
group that they belonged to. Both these changes seem to have resulted in more people
responding to the religion question.
2.4 Immigration and changes in religious affiliation 1966 to 1996
As has been seen earlier the period from 1966 to 1996 is characterised by
changes in the size and proportional representation of all religious groups. Part of the
growth or lack of growth in some Christian groupings observed in the previous
section may be related to immigration patterns during the period. This section will
examine the extent to which immigration may be a factor in explaining the size and
proportional distribution of the varied religious affiliations. The difficulty in
comparing a person's country of birth with their religious affiliation was first faced in
Australia by Charles Price48 in 1986. The greatest problem is how to determine the
religious affiliation of an immigrant at the time of arrival from the affiliation he or she
professes at the time of a census. It is recognised that while the country of birth and
48 Price, (1991) Religion and Ancestry in Australia: changes over the generations:1986, Australian Immigration Research Centre, Deakin, Canberra
48

the time of residence in Australia are unlikely to change the same cannot be said of
religious affiliation.
The Community Profiles 1991 Census produced by the Bureau of Immigration,
Multicultural and Population Research were used to determine the representation of
those born overseas who were resident in Australia at the time of the census. The
profiles included those overseas born residents from 24 countries which represented
the largest migrant groups in Australia. These were further classified by their period
of arrival into five time periods (pre 1971; 1971-75; 1976-80, 1981-85 and 1986-90).
A similar set of The Community Profiles 1996 Census produced for the Department of
Immigration and Multicultural Affairs was used to determine the representation of
those born overseas from 16 of these 24 countries for the period from 1991 to 1995
who were resident in Australia at the time of the 1996 Census. This made it possible
to determine the changes to the proportional size of migrant groups by measuring
those born overseas by their country of birth and the period of their arrival in
Australia.
The most distinct change to immigration patterns that occurred between 1966
and 1996 was the change from a migrant intake dominated by those born in the United
Kingdom and Europe to one which drew more migrants born in the Asian and Pacific
region. In the period up to 1971 immigration was heavily dominated by those born in
the United Kingdom and Europe. In the period from 1971 to 1976 the migration flow
was particularly dominated by migrants from the former Yugoslavia and the United
Kingdom. However, people from the Asian region, New Zealand and other parts of
the world also formed an increased proportion of immigrants.
49

Table 2.6 Distribution of the overseas born population by country of birth according to period of arrival49
Place of Birth Pre
1971 %
1971-1975
%
1976-1980
%
1981-1985
%
1986-1990
%
1991-1995
% UK/Eire 39.6 37.3 21.9 24.9 18.3 12.6 Italy 12.7 2.7 1.3 0.7 0.4 0.3 Greece 6.3 3.0 1.0 0.6 0.4 0.4 Germany 4.8 1.4 1.2 1.9 1.0 0.9 Netherlands 4.4 0.7 1.0 1.0 0.4 0.4 Yugoslavia 3.1 14.7 5.3 1.7 1.0 - Malta 2.4 1.1 0.5 0.4 0.1 0.1 Poland 2.2 0.5 1.0 3.1 1.4 0.9 Rest of Europe 4.6 3.0 2.4 1.8 2.8 11.5 Sub Total Europe 80.1 64.4 35.6 36.1 25.8 27.1 Vietnam 0.1 0.4 4.9 14.4 5.6 6.2 Philippines 0.1 0.7 2.5 3.7 6.1 4.4 India 1.1 2.6 1.3 1.7 2.6 4.0 Sri Lanka 0.4 1.4 0.6 1.3 2.4 2.3 Malaysia 0.5 1.5 2.8 3.0 4.9 3.2 Indonesia 0.3 0.8 1.1 1.7 1.8 - Korea - 0.2 0.8 0.9 1.9 - Cambodia - 0.1 0.5 2.1 0.8 - Singapore 0.3 0.8 0.9 0.8 1.4 - China 0.7 0.7 1.9 2.4 6.5 6.6 Hong Kong 0.3 0.8 1.8 2.4 4.9 4.6 Rest of Asia 0.9 0.8 3.0 - 4.1 13.0 Sub Total Asia 4.7 10.8 22.1 34.4 43.0 44.3 New Zealand 2.6 5.4 15.3 10.9 13.8 10.2 Egypt 1.2 1.0 0.3 0.3 0.7 - Turkey 0.4 2.0 1.1 0.7 0.8 - Lebanon 1.1 3.0 4.2 1.5 2.3 1.3 Other Parts of World 9.9 13.4 21.4 16.1 13.6 17.1 Total 100.0 100.0 100.0 100.0 100.0 100.0
Migrants (‘000s) 1758.0 381.0 314.0 404.0 746.0 563.5 Source: ABS Census Community Profiles 1991 & 1996
During the 1976-80 period there was an increase in those who were born in
Asia and this was dominated by migrants from Vietnam and to a lesser extent by
people born in Malaysia, Philippines, China and Hong Kong. There was also a noted
surge in migration from New Zealand and to a lesser extent from Lebanon. Many
migrants from Vietnam and Lebanon entered the country as refugees.
49 The figures in the five periods prior to 1990 are based on data from the 1991 Census. The period 1991-1995 is based on data made available from the 1996 census.
50

In the 1981-85 period, the growth in the number of immigrants from Asia was
dominated by migrants born in Vietnam. However, the levels of migration from other
Asian countries also rose. This was the first time that the proportion of migrants from
Asia matched the proportion from the United Kingdom and Europe. There was a
decline in the proportion of migrants from New Zealand and from other parts of the
world.
The 1986-90 period was one of significant migration to Australia. Once again
a larger proportion of these migrants came from countries in Asia, most notably,
China, Philippines, Vietnam, Malaysia and Hong Kong. Migration of people from
New Zealand and Lebanon was also proportionally higher in this period. It was also
evident that, in this period, migration from Europe comes largely from the United
Kingdom and Eire.
An examination of the 1990-1995 period shows that the significant change in
immigration were the smaller proportions of migrants from the United Kingdom/Eire
and an increase in migrants from other parts of Europe. The largest proportion of
these migrants came from Croatia and other Balkan countries that were part of the
former Yugoslavia.
The religious affiliation of migrants from these countries is presented in table
2.7 based on data made available in the 1991 Census. These data show that particular
countries are dominated by a particular religious group. This is significant in two
ways: the extent to which that religious group might contribute to the change in
patterns of religious affiliation in Australia and the extent to which the proportional
distribution of each religious group may be similar to that of the country from which a
person migrated.
51

Table 2.7 shows that those who were born in Australia made up a greater
proportion of the Uniting/Presbyterian and Anglican groups and a smaller proportion
the Orthodox/Oriental and Non Christian groups when compared to the religious
affiliation profile of the whole Australian population. This indicates that the
proportional size of these groups had been affected by the changing patterns of
immigration during this time period.
Table 2.7 Religious affiliation of Australia's population by selected country of birth according to 1991 Census
Place of Birth
Catholic
Anglican
Uniting/Presbyteria
n
Orthodox/O
riental
Other C
hristian
Islam
Jewish
Hindu/Sikh
Buddhist
Other N
on C
hristian
Not Stated
No R
eligion
Total
Australia 27.0 26.3 14.5 1.4 7.7 0.4 0.3 - - 0.4 9.3 12.8 100UK 12.1 43.9 11.7 0.1 6.0 - 0.4 - 0.1 0.4 11.1 15.2 100Eire 73.9 5.8 4.0 - 2.7 - 0.2 - 0.1 0.1 6.9 6.2 100Italy 93.2 0.2 0.1 0.1 1.8 - 0.1 - - 0.1 3.1 1.4 100Greece 0.5 0.2 0.1 94.0 1.5 0.3 - - - 0.1 2.4 0.9 100Germany 29.6 4.7 2.3 0.8 36.2 - 1.8 - - 0.6 9.8 14.2 100Netherlands 35.3 3.8 12.7 0.1 10.9 - 0.2 - 0.2 0.2 11.8 24.7 100Yugoslavia 46.2 0.4 - 36.0 4.2 3.1 0.1 - - 0.3 4.9 4.7 100Malta 92.8 0.9 0.3 - 1.2 - - - - - 3.4 1.5 100Poland 75.7 0.4 0.1 1.5 4.3 - 8.4 - - 0.1 5.4 4.1 100Vietnam 22.5 - - - - - - - 47.6 - 5.6 24.3 100Philippines 82.9 1.2 - - 8.8 - - - - 0.8 4.1 2.1 100India 41.7 13.4 2.1 - 5.0 1.9 0.6 24.9 - 1.6 5.0 3.8 100Sri Lanka 36.0 13.8 6.9 - 5.3 1.5 14.8 16.0 0.1 3.2 2.4 100Malaysia 18.0 7.0 7.4 - 10.6 2.9 - 4.1 17.6 0.9 9.6 21.9 100Indonesia 31.1 2.8 11.2 - 9.4 14.7 - 1.1 7.6 0.8 6.8 14.6 100Korea 25.7 3.5 35.4 0.2 10.9 - - - 2.6 0.2 4.2 17.3 100Cambodia 4.2 0.7 1.5 - 7.2 0.1 - - 59.9 0.3 9.7 16.6 100Singapore 25.4 11.1 8.7 - 9.3 4.7 - 4.2 6.5 1.4 7.6 21.2 100China 5.7 2.2 2.6 5.9 6.1 - 0.4 - 7.8 0.7 13.3 59.3 100Hong Kong 19.0 4.5 3.2 0.1 9.0 0.1 - - 3.6 0.3 6.3 54.0 100New Zealand 15.9 22.5 14.7 0.2 10.7 - 0.2 - 0.2 0.5 11.5 23.5 100Egypt 32.3 2.0 0.7 45.8 3.4 7.0 2.2 - - 0.1 4.3 2.2 100Turkey 1.9 - - 9.5 1.3 76.6 0.2 - - - 5.8 4.4 100Lebanon 40.2 0.3 - 10.2 1.7 37.0 - - - 1.3 5.3 1.4 100Total Population 27.3 23.9 12.6 3.0 7.6 0.9 0.4 0.3 0.8 0.2 12.9 10.5 100Source: ABS Census
52
Immigrants from the United Kingdom have the largest proportion of
Anglicans. Therefore, the Anglican group is most likely to be affected by immigration
from the United Kingdom. Any decline in the number of migrants from the United
Kingdom would have an adverse effect on the size of the Anglican religious group
moving to Australia. Although some migrants from New Zealand, India, Sri Lanka
and Singapore are affiliated to the Anglican group, the proportion of Anglicans among
these people is much lower than that among the Australian-born population.
It is not as clear that the decline in migration from the United Kingdom has
significantly affected the proportion of the Uniting/Presbyterian group within the
Australian population. This is mainly because the proportion of the
Uniting/Presbyterian group among migrants from the United Kingdom is smaller than
that for the proportion of this group among the Australian-born population. However,
it does appear that this group has significantly benefited from immigration from
Korea since 35% of Korean migrants were affiliated to this group. To a lesser extent
this group has also benefited from immigration from those of New Zealand and the
Netherlands origin.
The Orthodox/Oriental group is most heavily represented by migrants from
Greece, Egypt and the former Yugoslavia. Therefore, the decline in migration from
Greece after 1971 and the decline in migration from Yugoslavia after 1975 could have
affected the size and growth of this group after 1976.
The Catholic group is likely to have been significantly affected by levels of
immigration. Before 1976, this group would have been augmented by immigrants
from European countries such as Italy, Malta, Poland, the Former Yugoslavia,
Netherlands and Germany. There was also a signifcant proportion of Catholics among
immigrants from Lebanon and Egypt during this period. In the 1980s and 1990s the
53

Catholic group was likely to have been augmented by immigration from Asian
countries most notably, the Philippines, India, Sri Lanka, and Indonesia. The
percentage of Catholics among Australian residents from these countries were higher
than the percentage of Catholics among those born in Australia.
The Non Christian groups on the other hand are dominated by a mix of
different religions. Migrants from Turkey, Lebanon and Indonesia include many
professing Islam as their faith. Those from India and Sri Lanka include many people
belonging to Hindu and Sikh groups. Those from Vietnam, Cambodia, and to a lesser
extent Malaysia and Sri Lanka contain a significant number of Buddhists. Those from
Poland have a large proportion who are of the Jewish faith.
Lastly, it needs to be noted that the proportion stating that they have no
religion is higher among migrants from China, Hong Kong, New Zealand,
Netherlands, Vietnam, Malaysia, Singapore, Korea, Cambodia, United Kingdom,
Indonesia, and Germany than among the Australian born population. It is also
significant that among the other countries represented in table 2.7 there is a very low
proportion of people reporting No Religion compared to those born in Australia. It
would appear that there are three distinct groups among those who profess no religion.
There are Europeans who appeared to have moved from Christian religions towards
No Religion. There are those from South East and Eastern Asian countries who have
large numbers of people who state that they have No Religion. There are also those
who express they have No Religion who make up only a small proportion of those
who come from countries such as Greece, Italy, Malta, Philippines, India, Sri Lanka,
Egypt, Turkey and Lebanon where religion is a significant part of the culture from
which the person originates.
54

Table 2.8 Overseas born population by period of arrival and religious affiliation50
1991 Census 1996 Census Religious Group
Pre 1971
1971-1975
1976-1980
1981-1985
1986-1990
1991-1996
Catholic 34.9 29.8 26.4 29.0 27.0 20.6
Anglican 22.4 26.6 14.4 13.8 10.6 9.8
Uniting/Presbyterian 8.7 6.9 8.7 6.1 5.0 4.4
Orthodox/Oriental 5.1 2.7 0.6 3.3 2.4 4.1
Other Christian 7.6 9.0 4.8 7.9 10.0 9.5
Total Christian 78.7 75.0 54.9 60.1 55.0 48.4
Non Christian 2.1 6.7 15.0 14.4 17.4 21.9
No Religion (Asia)
0.7 1.1 6.1 8.2 11.9 14.2
No Religion (Other)
9.3 7.6 10.0 11.3 10.5 10.3
Total No Religion 10.0 8.7 16.1 19.5 22.4 24.5
Not Stated 7.2 9.4 11.0 6.0 5.2 5.2
Total Categories 100.0 100.0 100.0 100.0 100.0 100.0
What becomes evident from table 2.8 is the extent to which the religious
profile of immigrants has changed during the period from 1966 to 1996. It can be seen
that the Anglican group form a progressively smaller proportion of those who arrived
in Australia after 1975. On the other hand the Catholic group has maintained a
significant representation coverage of immigrants in each time period. However, in
the period from 1991 to 1996 the proportion of Catholic migrants was much lower.
50 The figures for periods of residence prior to 1981 are drawn from Australian Bureau of Statistics (1994), 1991 Census of Population and Housing Sample File [computer file], Canberra: Australian Bureau of Statistics, the figure for the periods subsequent to 1981 are drawn from Australian Bureau of Statistics (1998), 1996 Census of Population and Housing Sample File [computer file], Canberra: Australian Bureau of Statistics
55

Migrants belonging to the Orthodox/Oriental group appear to be well
represented in the period prior to 1975 due to migration primarily from Greece and
Yugoslavia. The period from 1991 to 1996 was also significant in introducing Russian
Orthodox migrants from China.
The Uniting/Presbyterian group appears to be most affected by migration in
periods prior to 1971 and 1976 to 1980. The proportion of the Uniting/Presbyterian
group was smaller among more recent migrants. The Other Christian group appears to
be affected by migration in the periods from 1971 to 1975 and in the period from
1986 to 1996. The proportion of Christians among the immigrant population is lower
than that reported in the total Australian population in each census.
The proportion of Non Christians was larger among the migrants in each
period from 1971 to 1996. The No Religion group also forms a larger proportion of
the migrant intake in each successive period. This is explained by the proportion of
people from Asia, who state that they have No Religion increasing in each subsequent
period. Those from other places who state that they have No Religion but come from
other parts of the world has remained proportionally at similar levels for the period
between 1976 and 1996. There appears to be two groups of respondents who may
appear to have contributed to the increase in those stating that they have No Religion.
The first are those who arrived from Europe and have stated that they have No
Religion, the second are largely migrants from South East and East Asian countries.
While it is not possible to examine in detail the actual levels of migration by
religious affiliation it is possible to note some significant influences that migration has
had on the levels of religious affiliation. There has been a shift away from
immigration patterns which in the initial part of the period had been dominated by
migration from Europe in general and the United Kingdom in particular. It is likely
56
that the decline in migration from the United Kingdom has contributed to the
Anglican and Uniting/Presbyterian groups becoming proportionally smaller. The
Catholic group on the other hand has had significant levels of immigration over the
whole period.
It would appear that the growth in the Orthodox/Oriental and Non Christian
groups might be largely due to immigration. While it was seen in table 2.7 that some
within the Australian-born population did identify that they belonged to these two
groups it was a smaller proportion than that identified with these religious affiliations
among the whole Australian population. Therefore, it is probable that where these two
groups have experienced growth it is more likely due to changes in levels of migration
rather than conversion. Also it is more probable that these groups also retain a strong
cultural identity which makes it less likely that they would see change their affiliation
away from these groups.
The effect of immigration on the No Religion group would appear to have
been much greater in later parts of the period. In the early part of the period where
migration was dominated by immigrants from Europe and the United Kingdom it was
possible that the levels of those professing No Religion were similar to those for
persons born in Australia. It was less likely that those immigrants professing No
Religion would have had a marked effect on the size of this group and that the rise in
the size of this group was more likely to be due to movement away from other
religious groups. However, as migration from South East and East Asia, particularly
China and Hong Kong, became stronger towards the end of the period, immigration
may have played a greater part in explaining the rise in the level of those who stated
that they had No Religion, since a large proportion of immigrants from these places
stated that they had ‘No Religion’.
57
2.5 Cohort analysis Another approach that may be used to examine the net effects of immigration
and movement between religious groups is to follow three ten-year age cohorts for
each religious group across the whole time period. These were people aged 15-24
years, 25-34 years and 35-44 years in 1966. Each of these groups had population
survival ratios applied to them based on the change in the total Australian population
for each cohort aged by ten years between each census. This expected population of
survivors was compared with the observed population for the appropriate age group
ten years later and the difference calculated. This difference represented the increase
or decrease due to the combined effect of net overseas migration and the net result of
movements between religious groups. The results also provide an indication of the
direction of movement between the various religious groups. Two other cohorts of 15-
24 year olds in the 1976 Census and 1986 Census were added to the cohort analysis to
allow consideration of whether this age group displayed any characteristics which
were different from the overall trends. A summary of the findings are presented in
tables 2.9 and 2.10. The background for these calculations is presented in Appendix C
2.5.1 The first period of change 1966-1976
Tables 2.9 and 2.10 show that each of the three largest Christian religious
groups, Catholic, Anglican, and Uniting/Presbyterian experience a decline in numbers
during this period. The decline was greatest among males and females aged 15-24
years. The Anglican and Uniting/Presbyterian groups show a greater loss among
males than females in this age group. In the older age groups there was also a larger
decline among Anglican males than females, while among Uniting/Presbyterian
females the level of decline is similar to that of males. While the Catholics display
58
similar patterns of decline by sex, they occur at much lower levels among both males
and females when compared to the Uniting and Anglican religious groups. In each of
the age groups, males show a greater level of decline than females.
Among Orthodox/Oriental Christians and Non Christians, there were similar
patterns of increase for both females and males. Similar to other religious groups the
greatest level of change occurs among the 15-24 age group with each of the
subsequent age groups displaying successively lower levels of change.
The Other Christian group, however, shows a distinctly different pattern from
that observed in all of the other four Christian groups. In this group too, both males
and females, more people in the oldest age group become Other Christian during the
period than in each of the preceding age groups. It is significant to note that among
the youngest male cohort there is a decline in affiliates. Also this is the only religious
group where the increase in affiliation is higher for females than males.
The No Religion group experiences increases among females and males in a
similar pattern to the decline of affiliation that was experienced by the three main
Christian groups. This would suggest that the movement from these three religious
groups was towards the No Religion group as two characteristics are evident in the
distribution of affiliates. The first is that the increase is larger among males than
females. The second is that the size of the changes fall as age increases.
There was also an increase in numbers among both males and females in the
15-24 age group in the Not Stated/Indefinite group although the pattern was not the
same for the two sexes. The males in this group displayed similar patterns of increase
to the No Religion group but not the females. Part of the reason for the growth in this
group may well be the larger number of questions contained in the 1976 Census and
the larger non-response rate to questions in that census.
59

These observations suggest that four distinct but inter-related phenomena were
beginning to emerge during this period. The first is the movement away from the three
main Christian religious groups towards No Religion. This movement became more
noticeable in the 1971 and 1976 Censuses partly due to the change in the manner of
asking the question on religious affiliation.
This movement away from Christian religion seems to express itself in
different forms across the groups. It is significant that the greatest movement away
from the Christian religion occurred among the Anglican and Uniting/Presbyterian
groups. When the changes among the Catholic religious group are examined similar
patterns of decline are observed as in the Anglican and Uniting/Presbyterian groups.
However, the level of decline is not as pronounced. This could indicate that the
smaller decline was influenced by the higher levels of Catholic migration that were
observed during this period as shown in Table 2.8. Also as some of those Catholics
who migrated to Australia came from places where Catholicism was the dominant
religion and the numbers of those who stated that they had No Religion were much
lower than those present in the Australian born population, this would suggest that
Catholic migrants may be less likely to move from the Catholic group to No Religion
than Catholics born in Australia. This appears to be sustained when the levels of
increase of Non Christian and Orthodox/Oriental groups are observed. Both of these
groups would have been augmented by migrants from countries with low levels of
those who stated that they had No Religion. This would suggest that a large part of the
apostotic movement was dominated by those who were Australian born or who
migrated from United Kingdom.
The other significant change is that this apostotic movement seems to have
occurred at a greater rate among males than among females and also among those of
60
younger age groups. This in itself is also a cultural shift and suggests that these groups
are more affected by the changes within society and that these changes affect their
religious identity.
A larger part of the increase among the Other Christian group occurred among
those in the older age groups. The fact that this increase occurred when the Anglican
and Uniting/Presbyterian groups were declining tends to indicate that a counter trend
was also present within this religious group. This trend can be accounted for by the
Pentecostal movement that started to find greater expression within Australia during
this time period.
61

Table 2.9 Changes in religious affiliation of male age cohorts, 1966-1996: results from cohort analysis
1966-1976 1976-1986 1986-1996 Religious Group
15-24 (‘000s)
25-34 (‘000s)
35-44 (‘000s)
15-24 (‘000s)
25-34 (‘000s)
35-44 (‘000s)
45-54 (‘000s)
15-24 (‘000s)
25-34 (‘000s)
35-44 (‘000s)
45-54 (‘000s)
55-64 (‘000s)
Catholic (32.7) (20.3) (17.2) (30.8) 5.5 2.1 0.6 (18.4) 15.3 15.2 6.6 3.0
Anglican (80.2) (34.0) (27.0) (74.0) (20.4) (9.3) (7.9) (31.7) 3.8 14.4 10.0 6.7
Uniting/Presbyterian (63.2) (29.1) (22.5) (52.6) (20.7) (11.4) (10.8) (12.9) 15.2 22.6 18.1 16.5
Orthodox/Oriental 9.0 4.5 1.3 1.8 0.2 0.7 0.5 3.7 4.8 2.8 0.9 0.6
Other Christian (1.0) 2.0 3.6 4.2 10.8 6.0 4.6 (23.8) (12.6) (15.2) (11.1) (9.0)
Total Christian (168.1) (76.9) (61.8) (151.4) (24.6) (11.9) (13.0) (83.1) 26.5 39.8 24.5 17.8
Non Christian 5.3 2.4 0.5 19.3 11.2 4.6 2.9 27.3 20.8 8.4 3.4 2.7
No Religion 131.2 61.6 52.4 121.5 21.6 12.0 6.1 100.6 (0.7) 1.6 0.9 2.4
Not Stated/ Indefinite 31.6 12.9 8.9 10.7 (8.2) (4.7) 4.0 (44.8) (46.6) (49.8) (28.8) (22.9)
Total Categories 0 0 0 0 0 0 0 0 0 0 0 0
Source: Calculated by the author Notes
1. Figures recorded in brackets indicate a decrease in the level of affiliation. Those not in brackets indicate an increase in affiliation.
2. Age groups refer to base year in each period.
62

Table 2.10 Changes in religious affiliation of female age cohorts, 1966-1996: results from cohort analysis
1966-1976 1976-1986 1986-1996 Religious Group
15-24 (‘000s)
24-34 (‘000s)
35-44 (‘000s)
15-24 (‘000s)
24-34 (‘000s)
35-44 (‘000s)
45-54 (‘000s)
15-24 (‘000s)
25-34 (‘000s)
35-44 (‘000s)
45-54 (‘000s)
55-64 (‘000s)
Catholic (12.1) (3.7) (3.8) (12.9) 9.5 3.3 1.2 (12.0) 15.4 12.1 5.0 5.3
Anglican (57.4) (21.8) (16.1) (58.0) (20.5) (10.4) (10.3) (26.8) (7.9) 7.9 6.1 4.8
Uniting/Presbyterian (50.7) (23.6) (19.1) (44.4) (21.2) (11.4) (10.1) (6.2) 11.5 20.7 16.4 18.4
Orthodox/Oriental 9.4 4.3 2.5 (0.1) (0.4) 0.5 0.8 1.3 3.5 1.4 0.7 0.8
Other Christian 5.6 6.5 7.1 11.8 14.7 7.7 7.2 (17.6) (12.3) (17.0) (11.3) (11.9)
Total Christian (105.2) (38.3) (29.4) (103.6) (17.9) (10.3) (11.2) (61.3) 10.2 25.1 16.9 17.4
Non Christian 4.4 1.8 0.4 18.5 9.9 4.2 3.8 28.3 21.9 9.7 5.0 3.4
No Religion 86.4 38.3 32.9 77.0 15.6 8.9 3.2 70.1 9.7 7.7 1.9 1.5
Not Stated/ Indefinite 14.4 (1.8) (3.9) 8.1 (7.6) (2.8) 4.2 (37.1) (41.8) (42.5) (23.8) (22.3)
Total Categories 0 0 0 0 0 0 0 0 0 0 0 0
Source: Calculated by the author
Notes 1. Figures recorded in brackets indicate a decrease in the level of affiliation. Those not in brackets indicate an increase in affiliation.
2. Age groups refer to base year in each period.
63
2.5.2 The second period of change 1976-1986 The patterns of decline noted in the 1966-76 period continued for both males and females
in the Anglican and Uniting/Presbyterian groups during this period. This decline continued to be
dominated by males and females in the 15-24 age group. Some of the decline among the
Anglican and Uniting/Presbyterian groups can be explained by lower levels of migration from
the United Kingdom.
Among Catholics, males and females in the 15-24 age group experienced significant
levels of decline similar to those experienced in the 1966-76 period but this did not happen in the
older age groups. It appeared that the Catholic group might have been sustained by immigration
from countries such as Poland, Vietnam, Yugoslavia, Lebanon and the Philippines during this
period.
The Orthodox/Oriental group experienced very marginal growth and this may be due to
slow down in migration from countries such as Greece. However, some of the increase can be
explained by a reclassification of Oriental Christians by the Australian Bureau of Statistics in the
1986 Census. This by itself would cause an increase in the size of this group and a corresponding
decrease of the Other Christian group under which they would have been formerly classified.
When the Other Christian group is examined, however, it can be seen that if this
reclassification occurred it was more than compensated by immigration or higher levels of
conversion from other religious groups. The pattern displayed by this group indicates that the
most significant increase occurred in the 25-34 age group. There is also the possibility that the
15-24 age group, which experienced lower levels of increase than the 25-34 age group, was
affected by the decline of religious affiliation. Thus while the Other Christian group did not
experience a decline in this age group the increase was more muted than would have been
expected if the highest level of conversion and migration was occurring in the 15-24 age group.
64

This would suggest that while this group might have attracted younger people it was also tending
to lose some due to the affect of the apostotic movement towards No Religion.
Corresponding to this increase in the Other Christian group was the growth in the Non
Christian group. Once again there was a similar pattern for males and females across each of the
age groups. Each of the younger age groups grew at a higher rate than the next age group. This
can most likely be accounted for by higher levels of migration than by conversion. This is useful
to note when we contrast the pattern present in the Other Christian group. This may also suggest
that the Other Christian group was affected in a similar way by the apostotic movement and that
the Non Christian group was isolated from this movement.
The increase in the No Religion group does not fully account for the decline in the three
main Christian groups as it did in the 1966-76 period. While the 15-24 year old age group
displays the greatest increase the subsequent age groups display much lower levels of increase
than were noted in the previous time period. This would suggest that while the apostotic
movement greatly affected those in the 15-24 age group this effect had become much more
muted in the older age groups. It would also tend to suggest that the movement away from the
three main Christian groups was not solely part of the apostotic movement but was also linked to
a process of conversion towards the Other Christian group.
Lastly, the Not Stated/Indefinite group shows similar levels of change for males and
females. Once again while the 15-24 age group experienced the largest change, the 25-34 and
35-44 age groups actually show declines. This may result from a wording change in the religion
question asked in the 1986 Census which indicated that a response was optional. However, it is
more likely that more people responded to the religion question due to the fewer questions asked
in the 1986 Census than were asked in the 1976 Census .
The four phenomena that were noted in the 1966-76 period seem to have been sustained
in this period. The apostotic movement became more significant in this period. This would tend
65

to suggest that the process of transformation and self reflection continued both within religious
groups and in society as a whole. This period not only saw the continued application of new
liturgical forms in the Catholic Church, it also witnessed the creation of the Uniting Church, the
change of name of the Church of England to the Anglican Church and a rapid expansion in the
number of smaller Evangelical churches.
It becomes evident also that the connection between cultural identity and religious
identity becomes a more significant explanation of the changes between religious groups. Once
again the Catholic group is the most significant example of this phenomenon. Thus while
migrants from countries with a strong religious identity such as Yugoslavia, Poland, Lebanon
and the Philippines tended to increase size of the Catholic religious group whereas the presence
of migrants where religious identity and culture were not as strongly identified such as the
United Kingdom and New Zealand tended to decrease the level of affiliation. Also the distinction
in changes in the level of affiliation between males and females also appears to have been
lessened during this period.
It is also significant that the Other Christian and Non Christian groups experienced their
greatest level of growth in this period. This would suggest that while this period was
overshadowed by the apostotic movement towards No Religion there was also a smaller counter
movement of conversion from the three main Christian groups towards the Other Christian
group. The trend towards Non Christian religious faiths was likely to be due to the arrival of new
migrants from Asian and Middle Eastern countries.
2.5.3 The third period of change 1986-1996 This period shows similar patterns of change for the Catholic, Anglican and
Uniting/Presbyterian group with increases for all but the youngest age group. This would
indicate that there was a reversal of the trend observed in the previous two periods and a growth
66
in these three traditional religious groups. The one exception is among Anglicans in the 25-34
age group where there was a slight decline for females.
The Orthodox/Oriental group again achieved similar levels of growth for males and
females. It is not clear whether the movement towards No Religion which was affecting the 15-
24 age group in the Other Christian group might also explain the lower level of growth in this
time period for those in the same age group in the Orthodox/Oriental group. That is, the second
generation from the Orthodox/Oriental group might become more influenced by the same
cultural influences affecting other young people and some might adopt similar attitudes towards
religious affiliation.
The Other Christian group experienced a decline in each age group for both males and
females. There seems to be a combination of factors at work in this change. However, it appears
that the main factor is that the 15-24 age group may well have been affected by the apostotic
movement towards No Religion. There also appears to be a movement away from the newer
Christian groups towards more established Christian groups.
The Non Christian group experienced significant levels of growth and this is most likely
due to higher levels of migration from Asian countries. The No Religion group still displayed
significant levels of growth but this occurred almost totally within the 15-24 age group.
The Not Stated/Indefinite group experienced its most significant level of decline for each
age group and in a similar pattern for both males and females. This would indicate that in the 15-
24 age group there was a shift from this group towards No Religion. The same is probably not
true for older age groups where there may have been a change to other religious groups. The fact
that the 1996 Census contained a tick box answer may have led to a greater response to this
question. Lower levels of the not stated response may not actually indicate a greater level of
conversion from the Not Stated/Indefinite but simply an identification with a religious group
when previously this was not made explicitly available. The change in the 1996 Census might
67

thus be a more explicit expression of people’s religious identity than was evident in previous
censuses. It would also mean that where people did not respond to the religion question in a
census this cannot be linked with a statement about the level of religious identity within the
community. Rather it is an indication of those within the population who do not want to identify
their religious affiliation or, for whatever reason, do not respond to the question.
The apostotic movement seems largely to have affected males and females in the 15-24
age group. The distinction between males and females in the level of change in affiliation also
seems to have disappeared. Thus the distinctions between male and female attitudes to affiliation
which were present in the 1966-76 period do not appear to have been sustained over time and
distinctions now are much more likely to be based on a person’s age.
The cultural distinction between people from countries with strong religious identities
and those where religion is not strongly identified with a person’s culture seems to have been
sustained over each of the time periods. However, the change in the classifications which
occurred in the final two time periods might well mask the decline of affiliation among second
generation members of Orthodox/Oriental and Catholic religious groups which retain both a
strong religious and cultural identity.
The Other Christian group also seems to have been affected by the same phenomenon
which affected the three main Christian groups. This saw a decline in the 15-24 age group but
indications of growth in the older age groups might have been partially masked by the
reclassification of broad religious groupings.
2.6 Summary The most significant trend in the period between 1966 and 1996 was the shift from the
three main Christian religious groups towards the No Religion group. While this apostotic
movement seemed to affect males and females in all the age groups in the 1966-76 period, it
68
became more and more isolated to the 15-24 age group in subsequent years. There was also an
increasing correlation over time between males and females in changes of affiliation in each
religious group and age group. There also appears to be a greater identification with a formal
statement that a person has No Religion. This may be due to the change in the formatting of the
question by the Australian Bureau of Statistics.
There was also a decline in immigration from the United Kingdom and Europe and an
increase in immigration from parts of Asia and New Zealand during this period. This change is
likely to contribute to the decrease in the size of the Anglican group. The Catholic group which
has drawn migrants from both the Asian and European regions has not been affected in the same
way. It is also significant to note the high proportion of migrants who make up the
Orthodox/Oriental and Non Christian groups which helps to explain the growth in these groups
over the period from 1966 to 1996. What is also significant is the number of immigrants from
Asia who state they have No Religion. This would indicate that the growth in the No Religion
group might also be influenced by migration from Asian countries in the later part of the period.
These results, raise some interesting questions that will be addressed in subsequent
chapters. Does the decline in affiliation based on age also correspond to a decline in attendance
at religious services? How does a person’s change in religious affiliation affect their attendance
and can movements between religious groups be more clearly identified? Given that a person’s
country of birth affects religious affiliation does it also affect attendance at religious services? In
answering these questions it will also be necessary to look at issues of family life, marital status
and residence to examine how these may have changed people’s outlook on affiliation and, as a
consequence, their attendance at religious services.
69
3. Method of analysing attendance data
3.1 Introduction
The method of collecting religious attendance data suggests that it may provide only an
approximate measure of actual attendance on a particular day of worship. As noted in Chapter 1,
part of this ambiguity arises from the varying methods of enumeration used in different places of
worship. The methods not only reflect the different theological approaches of different religions
to worship and gathering of people on a principal day of worship but also the pastoral approach
adopted in encouraging people to attend services regularly.
Data on religious attendance collected in different surveys can also be affected by
different ways of asking the question and different perceptions of the respondent to the question
being asked. This may be due to the different reasons for asking the question: whether it is to
determine religiosity, a useful measure in sociological research, or whether it is to track trends in
attendance over time, a useful measure for pastoral planning by religious organisations. The
question and particularly the responses to the question, tend to vary from one survey to the other.
It is, therefore, important to examine the methods by which data on religious attendance
are collected in the four surveys to be used in this study. These surveys are:
1. Religion in Australia Survey in 1966 by Hans Mol (Mol’s Survey),
2. International Social Survey Programme, Religion in 1991, by Kelley, Evans and
Bean (ISSP),
3. Australian Family Formation Project Stage 1 1980/81 and Stage Two 1990/91, by
Australian Institute of Family Studies (AFFP1 & 2),
4. Australian Living Standards Survey 1991 by Australian Institute of Family Studies
(ALSS).
70

3.2 An overview of surveys used in the thesis
3.2.1 Religion in Australia Survey, 196651
This survey was carried out by Mol, as part of a study conducted by the
Department of Sociology, Research School of Social Sciences at the Australian National
University. The survey was conducted between April and September 1966 in New South Wales,
Victoria and Southern Tasmania by way of personal interview of respondents who were adults of
over 20 years old. Out of an initial sample of 1352 households chosen to take part in the survey
165 households did not respond, giving a non-response rate of 12.2%. This resulted in 2602 adult
respondents being interviewed.
The questionnaire that was administered was split into two sections. The first schedule
collected information that any adult could usually provide for the rest of those living in the
household. The second is an individual schedule that contained questions about attitude and
beliefs. Altogether, 2602 cases were recorded in responding to questions in the first schedule and
1832 cases responded to questions in the second schedule. The first schedule was used to analyse
data on age, sex, religious affiliation, church attendance, previous Sunday attendance, place of
birth of respondent, father and mother, length of residence and marital status.
This survey was chosen for a number of reasons.
1. It provided an age structure which closely resembled that of the Australian population
in the 1966 Census.
2. The proportions of religious groups recorded in the survey closely resembled that of
the Australian population in the 1966 Census.
3. The timing of the survey occurred prior to the initial changes in patterns of affiliation
recorded in the 1971 Census.
51 Mol, (1984) Religion in Australia, 1966 User Guide, Social Science Data Archives, The Australian National University, Canberra, 2-4
71

The survey does, however, present a couple of limitations that need to be noted. The first
is that many of the responses to questions were pre-grouped into particular categories. This is the
case for age which was categorised into non even age groups: 20-24 years old, 25-39 years old,
40-59 years old, and 60+ years old. When other surveys are compared against the Mol Survey,
similar categories have to be used. Also the survey was confined to New South Wales, Victoria
and Southern Tasmania which
meant that it was not a sample of the total Australian population. Lastly, the method in which the
religious questions were asked placed an emphasis on Church attendance and Christian
affiliation and practice. This limited the scope of this study to attendance at Christian places of
worship.
3.2.2 International Social Survey Programme, Religion, Australia, 199152
This survey was carried out by Kelley, Evans and Bean as part of a study conducted by
the Sociology Program, Research School of Social Sciences at the Australian National
University. This project was part of an International survey commenced in 1991. The Australian
part of the survey was conducted between March 1993 and July 1993 as part of a cross sectional
study of persons listed on the Australian Federal Election Rolls. The respondents for the
Religion survey were chosen from two earlier National Social Science Surveys conducted on
Family and Lifestyle53. The Family Sample had an initial sample of 11245 with 4511
completions, a non-completion rate of 59.8%. The Lifestyle sample had an initial sample of 3798
and 1625 completions, a non-completion rate of 57.2%. Those who were chosen to take part in
the Religion survey were selected on the basis that they had not indicated that they did not wish
to participate further and were still resident at the same address. The survey method was by self-
52 Kelley, Evans, Bean (1995) International Social Survey Programme, Religion, Australia 1991 User’s Guide Social Science Data Archives, Australian National University, Canberra, 1995, 1-3
72

completion of a questionnaire by the respondent. A sample of 2023 respondents took part in the
survey. The survey was used to analyse data related to age, sex, religious affiliation, religious
attendance, religious affiliation as a child and marital status.
The survey was chosen because:
1. It provided an age structure which closely resembled that of the Australian population
in the 1991 Census.
2. The survey collected data at close to the end of the period which this thesis is
studying.
The survey does, however, contain a number of shortcomings. The first is that the sample
was drawn from previous surveys that had high non-response rates. This may indicate that the
sample is biased to a more conservative response and thus may provide higher levels of
attendance as it would contain people who had stability of residence and who were willing to
participate in the survey. The level of religious affiliation indicates that the Anglican and
Uniting/Presbyterian groups are over-represented in the sample compared to the 1991 Census,
while the Catholic and Orthodox groups are under-represented. As the latter two groups contain
higher levels of migrants from non-English speaking backgrounds this may indicate that the
sample is also biased towards Australian-born residents and away from those who do not come
from an English speaking background. Also as participants were chosen from the electoral roll it
does not include non-Citizens except for those Commonwealth citizens who arrived in Australia
prior to 1983.
53 Bean, (1995) National Social Science Survey 1989-1990: Family and Lifestyle, Social Science Data Archives, Australian National University, Canberra, Study Description D861
73

3.2.3 Australian Family Formation Project, 1981and 199154
The Australian Family Formation Study (AFFP) was carried out by the Australian
Institute of Family Studies in Melbourne. The study was conducted in two stages in 1981 and
1991 as part of a longitudinal study of 18-34 year olds contained within a stratified random
sample of households in the 1976 Census Collector’s Districts. The first stage of the survey was
conducted by way of personal interview and the second stage by mail back questionnaire. In the
first stage, 4074 households were chosen to take part in the survey; of these 1530 failed to take
part in the survey, a non-response rate of 37.5%. This resulted in 2544 respondents in the 18-34
age group being interviewed in stage one. In stage two, 1488 of these respondents in the 28-44
age group were retained within the study, representing an attrition rate of 41.5% of the original
sample. This survey was used in analysing data related to age and sex, and changes in marital
status, religious attendance and religious affiliation between the two stages of the survey.
This survey was chosen because:
1. It provided a longitudinal study of the 18-34 age group who appeared to be most
affected by changes in patterns of affiliation and attendance.
2. It covered a period of significant change in patterns of religious affiliation and
attendance.
3. It provided data on the changing patterns of marital status over a ten year period.
The survey does have one major limitation. This relates to the high level of attrition the
two stages. This will be examined in Chapter Four to see whether it has a marked affect on the
level of religious affiliation and attendance.
54 Australian Institute of Family Studies, Family Formation Study-Stage 1, 1980-81-Study Description, Social Science Data Archives, Australian National University, Canberra, 1984, 2-6
74
3.2.4 Australian Living Standards Survey 199155
The Australian Living Standards Study (ALSS) was carried out by the Australian
Institute of Family Studies in fourteen local government areas around Australia. The study was
conducted between 1991 and 1993 as part of a cross-sectional study of parents with at least one
child under twenty years of age. The respondents came from a random sample of households
contained in a listing of residential properties drawn from relevant council rates lists. The survey
was conducted in five parts. Parts 1 and 2, relating to personal demographics of household
members, were conducted by way of mailed questionnaire. Part 3, pertaining to children’s
services, was carried out by way of personal interview. Parts 4 and 5 regarding personal views
were collected by personal self-completion questionnaires. The average non-response rate was
29% and this resulted in a final sample of 9111 respondents over the age of 15. The data
analysed as part of this study included age, sex, religious affiliation, religious attendance, non-
English speaking background and place of birth.
This survey was chosen as it provided important data related to:
1. parental and childhood influences on levels of religious attendance,
2. the effect of linguistic background on religious attendance.
The survey does have one major limitation. It is limited to parents with children under 20
years old. This may mean that the sample may be slightly biased towards higher levels of
attendance, due to possible greater involvement of parents in the religious formation of children.
55 Brownlee, (1994) Employment Report: Spatial Aspects of Employment in Australian Cities, Australian Institute of Family Studies, Melbourne, Appendix A
75

3.3 Collecting religious attendance data
3.3.1 The headcount of people attending a religious service A headcount of people attending a religious service is usually undertaken so that a
religious institution may gain a better understanding of the numbers of people attending a
particular service on a particular day of the week. As such it is used for pastoral planning in
helping to determine how much a parish should contribute to the overall administrative costs
incurred by a religious institution. It also can be used as a measure of the vitality of religious life
in a community.
Some problems can be faced in undertaking such a count and these can cause variations
between and within religious groups. The first can be a matter of perception about why the count
is being undertaken. As noted before, the count is undertaken to achieve two measures, one
which allows the religious community to be levied and the other which tests the levels of vitality
of that community. At times these can be seen as competing measures as high levels of
attendance do not always equate to high levels of income and vice versa. Thus if there is a
tendency to use attendance as a measure which equates to the payment of levies this may result
in a pastor recording lower levels of attendance in a given period. If, however, attendance is
stressed as a measure of vitality this can result in a pastor recording higher levels of attendance
in a given period. These differences can be minimised by ensuring headcounts are undertaken at
the same time by all religious communities belonging to a particular religious group.
The timing of the headcount can also lead to some differences between religious groups.
In the Catholic Church the headcount is taken as an average of attendance at all masses
conducted within a parish on two Sundays in October. Other Protestant churches may include
attendance at other services held during the week, while the Anglican Church would tend to use
attendance at services of Easter and Christmas. It should be noted that some attempt has been
76
made to eliminate these differences in collection technique. These were undertaken in the
National Church Life Survey, conducted by the Anglican and Protestant Churches in 1991 and
1996, and in the Catholic Church Life Survey conducted by the Catholic Church in 1996 which
measured the levels of attendance of people over the age of 15 years. These measures have been
used to compare levels of attendance against those recorded in the ISSP and ALSS surveys.
Headcounts, however, tend to limit the religious attendance of people to a particular place
of worship on a Sunday. This of itself would indicate that those attending on this day are those
who identify with the religious group and that worship on this day is an important part of their
life. Thus in addition to being a sign of vitality and pastoral planning it can also be seen as a sign
of orthodoxy on the part of the person attending. Here orthodoxy relates to the fact that a
person’s actions equate to the norms of the religious group as a whole rather than an indication
that a person’s beliefs may be orthodox.
Also because a headcount is used for raising finances for the administration of a religious
group there has been a tendency to confine counts to particular locations and times of worship. In
Australia this has tended to mean that groups which fall outside the normal parameters of regular
church community life are often excluded from headcount data. This would exclude those who
belong to particular ethnic and religious communities that are not defined by normal geographic
locations adopted by a religious institution. It would also not count those who participate in
religious services outside the normal definition of places of worship such as those who
participate in home churches, those attending services in nursing homes and retreat centres, and
those who access services on television or radio.
3.3.2 Social science surveys Religious attendance is used in social science surveys as an indicator of religiosity. Thus
it is hoped that the frequency of a person’s attendance will give an indication of the degree to
77

which one pattern of behaviour will influence other attitudes and behaviours. As a result when
social scientists measure patterns of attendance they do not adopt as strict a definition of
religious attendance as that undertaken by a religious institution. This can be seen by the fact that
most religious attendance questions adopt a measure that examines attendance patterns in the last
seven days rather than attendance on a specific day. This is done in order to capture all religious
activity that may occur within a week. This avoids the problem of religious attendance being
identified with attendance on a particular day that is stressed by a particular religious group. Also
there is a tendency to use a more liberal definition of what is meant by a religious service to
include all aspects of worship which might not be confined to a particular place or type of
celebration. The sampling technique adopted by a social science survey also captures people who
would normally be excluded from counts undertaken by the headcount method.
Two questions that need to be addressed before the data from these surveys are
used to examine the trend in religious attendance are :
1. How comparable are data on religious attendance from the surveys?
2. Can a measure of religious attendance be developed that can be applied to
data across surveys when the surveys differ in wording of the religious
attendance question and the coding of responses?
The measure developed must not only be meaningful but must also be able to be applied
consistently over each of the data-sets. The problem is how a measure of religiosity can be
converted to a measure that usefully aids researchers in their task of measuring changes in
religious attendance over time. Thus in adopting a methodology that measures the frequency of
weekly attendance it is necessary to examine how this enables a comparison between these
surveys. The method that seems simplest is to attempt to convert the responses made available
into weighted averages of frequency of attendance. This should allow for an easy comparison
between surveys that provide both different numbering and coding of responses to the question
78
of religious attendance. This also allows the comparison of weekly levels of attendance from
these surveys with the results from other surveys.
However, difficulties occur when comparisons between surveys are made. The first
problem arises from the variety of responses which are used to measure attendance between
surveys. Surveys may measure attendance through attitudinal responses like always, often,
occasionally and never. This makes it difficult to give a precise measure of an individual’s level
of attendance in a particular year. Also where surveys do use quantitative measurements, these
tend to group attendance levels particularly at either end of the scale. Thus, for example,
attendance is reported as having occurred on a monthly basis or more frequently or twice a year
or less. Comparisons between surveys are limited by this lack of consistency. What this study
will do is introduce and test a measure of average level of weekly attendance which will enable
comparisons between surveys to be undertaken.
3.4 Method of comparing attendance across surveys
3.4.1 Explanation of method
The major difficulty that arises in comparing the surveys is the different response
categories that are adopted in recording the level of attendance. Various studies in America have
indicated that the attendance levels measured by the headcount method are between 0.73356 and
0.957 of the levels reported in social science surveys. Some researchers58 suggest that headcount
measures may be as low as 0.54 of that recorded in social science surveys. These differences
may apply only in America but it would appear appropriate that a similar comparison be made of
the data in the surveys that this thesis will examine with headcount data.
56 Smith, (1998) “A Review of Church Attendance” in American Sociological Review, 32,135 57 Hout, &Greeley, (1998) “What Church Officials’ reports Don’t Show: Another Look at Church Attendance Data” in American Sociological Review 32, 118 58 Hadaway,Marler and Chaves, “Overreporting Church Attendance in America: Evidence that Demands the Same Verdict” in American Sociological Review, 32,122-130
79

In order to compare the data from the four surveys used in this thesis it is necessary to
arrive at a measure of average weekly attendance that can be applied to the data. This measure
should also be appropriate for comparison against the headcount data collected. To arrive at such
a measure, it is necessary to ascribe values to each of the responses made to the question on
religious attendance. It is proposed that the measure will be based on the following assumed
frequency of attendance:
Survey Response Assumed Annual Frequency
Never 0
Once a year 1
Twice a year 2
Every two months 6
Once a month 12
Twice a month 24
Three times a month 36
Every week 4859
It is hoped that use of assumed annual frequencies across all surveys will allow
the data contained from the surveys to be compared, and also enable comparisons with
the headcount data.
59 The last category has been reduced to a factor of 48 rather than 52 to allow an even spread of intervals in the last four categories and to reflect the reality that a person may be unable to attend a religious service on a weekend due to sickness or travel
80

3.4.2 Allocation of values to surveys The following values were assigned to the response categories in the Church Attendance
question asked in the Religion in Australia, 1966 Survey:
Survey Response Assumed Annual Frequency
Never 0
Hardly ever 1
Occasionally 2
Usually 24
Always 48
The responses in the Mol Survey refer to a broad description of levels of attendance.
However, it is necessary to arrive at a more precise measure for the levels of activity attributed to
the responses ‘usually’, ‘occasionally’ and ‘hardly ever’ in order for comparison of attendance to
be made across surveys. The above values are adopted after analysis of another question in the
Mol survey that asked about particular attendance on the previous Sunday. Table 3.1 shows that
by comparing the response to the question about attendance with that on attendance on the
previous Sunday it is possible to estimate the annual frequency of attendance. The levels of
attendance on the previous Sunday are similar to those estimated from the assumed annual
frequencies. In adopting these values it is important to stress the following point, the more
frequent the level of attendance the greater the difference that exists between estimated and
assumed frequency. This gives a greater degree of confidence that the assumed attendance
measure does report the respondent’s actual behaviour.
81

Table 3.1 Comparison of attendance data with respondents indicating attendance on the previous Sunday.
Responses To Attendance Question.
Total Survey
Population
Attended Last
Sunday %
Estimated Annual
Frequency60
Assumed Annual
Frequency
% Difference
of Estimated
and Assumed Frequency
Never 612 2.1 1.1 0 1.1 Hardly Ever 433 2.1 1.1 1 0.1 Occasionally 690 3.2 1.7 2 -0.3 Usually 263 42.6 22.1 24 -1.9 Always 600 84.7 43.5 48 -4.5 No Answer 4 25.0 13 N/A N/A Total 2602 25.3 13 N/A N/A
The International Social Survey Programme, Religion, Australia, 1991 uses a broader
range of attendance categories. There are more numeric categories that are similar to those
adopted in allocating the assumed annual frequencies. This means that values can be assigned to
the responses on religious attendance with a greater degree of certainty. Where attendance has
been recorded as more than once a week this is measured as if the person were attending once a
week. This is to ensure that the measure adopted corresponds as closely as possible to the other
surveys that assume that the highest level of religious attendance is once a week. The assumed
annual frequencies adopted for the ISSP study are as follows:
60 Average Days of Attendance calculated by multiplying the proportion of those answering Yes to the question on attendance last Sunday by the number of 52 possible Sundays of attendance in a year.
82

Survey Response Assumed Annual Frequency
Never 0
Less than once a year 0
About once or twice a year 1
Several times a year 6
About once a month 12
Two or three times a month 24
Nearly every week 36
Every week 48
Several times a week 48
Once a day 48
Several times a day 48
(Can’t say) 0
In the Australian Living Standards Survey, the values adopted are similar to those in the
Mol survey. In this survey, religious attendance tends to be grouped at either end of the scale.
The values adopted are as follows:
Survey Response Assumed Annual Frequency
More than once a week 48
Once a week 48
Most weeks, but not every week 36
Several times a year 6
Rarely (just weddings, etc.) 1
Never 0
The responses are similar to those of other surveys. The only major difference appears to
be in the response "rarely" that attaches a statement “just weddings”. This indicates a difference
in the interpretation of religious attendance within this question. While the other responses could
83

be assumed to refer to attendance on a principal day of worship, the response “rarely” might well
see a higher level of people indicating this answer than has been seen in the other surveys.
A similar set of response categories to the religious attendance question was adopted in
both stages of the Australian Family Formation Project. Two broad quantitative responses
adopted in the survey pose some difficulties. The response “3-12 times a year” was noted to
cover two possible statements previously identified as “once every two months” and “once every
month” in the allocation of assumed annual frequencies. The range allows a value of somewhere
between 3 and 12 to be applied to this response. The application of this value needs to be
consistent to that which has been applied in the other three surveys. Since the response appears
to cover two possible answers detailed in the allocation of assumed annual frequency it would
seem reasonable to obtain an average of the two values “once every two months” and “once
every month”. Thus a value of 9 can be given to the response “3-12 weeks”. The other category
“13-52 weeks” also covers two value labels “Twice a month” and “Three times a month”. If the
same method is applied an average value of 30 can be assigned to this response.
The values given to the responses in the AFFP surveys are as follows:
Survey Response Assumed Annual Frequency
Not at all (did not) 0
Less than once a year 0
1-2 times a year 1
3-12 times a year 9
13-52 times a year 30
Over 52 times a year 48
Unsure/Don’t know 0
84

3.4.3 Comparison of results between surveys An initial comparison of the values assigned to the religious attendance response in these
surveys in table 3.2 reveals a couple of important points. The first is that the ALSS survey
records a higher proportion of people who have been identified as attending a religious service at
least once a year. This is most likely due to the manner in which the response is worded. It
broadens the idea of religious services to include weddings and funerals. People responding this
way may, therefore, include those who would in other surveys have said that they never attend a
religious service. The Mol survey produced a smaller proportion of people who indicated that
they never attended a religious service when compared to the other surveys. It also appears that
the Mol survey indicates a higher proportion of people who attended a religious service each
week. This comparison can be made clearer when the levels of attendance are consolidated into
three distinct groups: low level attenders, those with values between 0 and 2, medium level
attenders, those with values between 6 and 24, and high level attenders, those coded between 30
and 48,
Table 3.2 Comparison of re-coding of survey responses on religious attendance and percentage of sample in each new response category
Re-coded frequency of religious atttendance
MOL 1966
%
AFFP1 1980/81
%
AFFP2 1990/91
%
ALSS 1991/92
%
ISSP 1993
%
0 23.7 47.4 54.5 19.2 52.4 1 16.6 18.7 15.5 43.5 15.6 2 26.5 6 15.3 8.8 9 15.4 12.2 12 2.6 24 10.1 3.1 30 11.4 6.4 36 7.6 4.6 48 23.1 7.1 11.4 14.4 12.9 Total 100.0 100.0 100.0 100.0 100.0
85
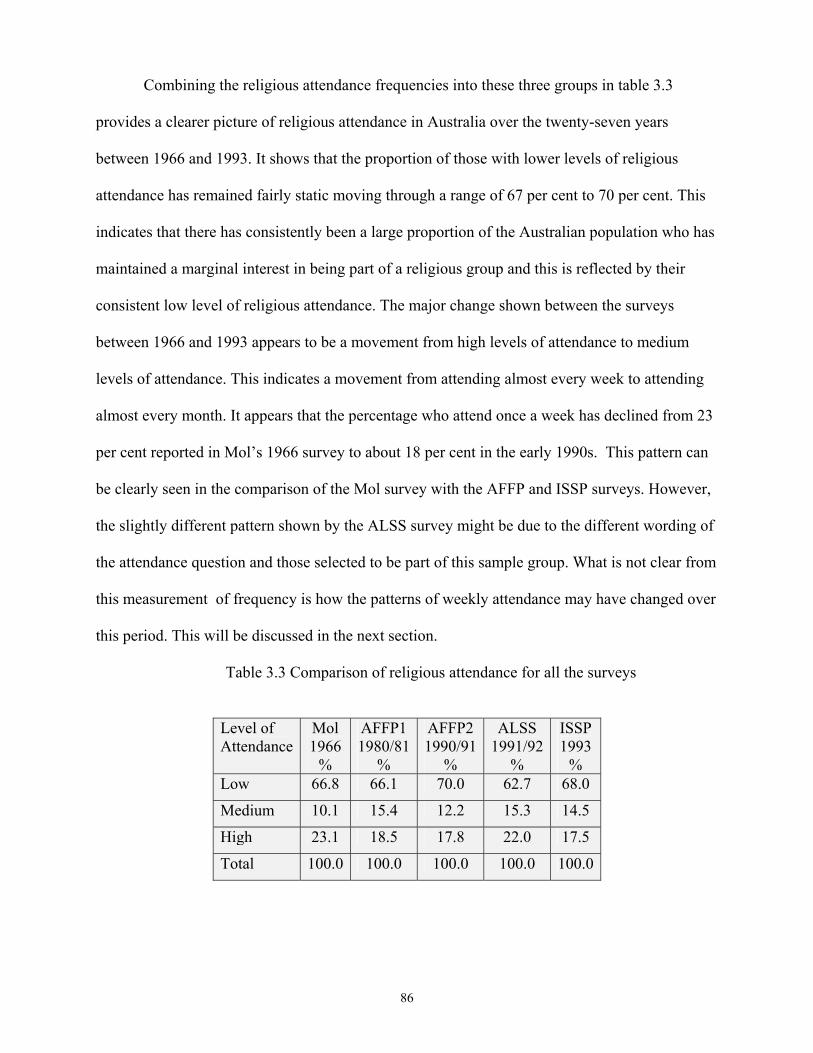
Combining the religious attendance frequencies into these three groups in table 3.3
provides a clearer picture of religious attendance in Australia over the twenty-seven years
between 1966 and 1993. It shows that the proportion of those with lower levels of religious
attendance has remained fairly static moving through a range of 67 per cent to 70 per cent. This
indicates that there has consistently been a large proportion of the Australian population who has
maintained a marginal interest in being part of a religious group and this is reflected by their
consistent low level of religious attendance. The major change shown between the surveys
between 1966 and 1993 appears to be a movement from high levels of attendance to medium
levels of attendance. This indicates a movement from attending almost every week to attending
almost every month. It appears that the percentage who attend once a week has declined from 23
per cent reported in Mol’s 1966 survey to about 18 per cent in the early 1990s. This pattern can
be clearly seen in the comparison of the Mol survey with the AFFP and ISSP surveys. However,
the slightly different pattern shown by the ALSS survey might be due to the different wording of
the attendance question and those selected to be part of this sample group. What is not clear from
this measurement of frequency is how the patterns of weekly attendance may have changed over
this period. This will be discussed in the next section.
Table 3.3 Comparison of religious attendance for all the surveys
Level of Attendance
Mol 1966
%
AFFP1 1980/81
%
AFFP2 1990/91
%
ALSS 1991/92
%
ISSP 1993
% Low 66.8 66.1 70.0 62.7 68.0
Medium 10.1 15.4 12.2 15.3 14.5
High 23.1 18.5 17.8 22.0 17.5
Total 100.0 100.0 100.0 100.0 100.0
86

3.5 Example of average weekly attendance measure
The level of average weekly attendance will be applied to each of the data-sets by the
application of the following formula.
∑(Vp*F)/T Tp Where Vp = Population for a particular level of attendance
F = Assumed frequency of attendance on a principal day of worship
T = 52 Principal days of worship in a year
Tp = Total population of religious group in the survey
Having allocated values to each of the response categories in the surveys, it is possible to
calculate the percentage of people attending weekly for each religious group. This measure can
be compared against headcounts by the following relationship:
∑(Vp*F)/T = Hc ± D Tp
Where Hc = Head count or equivalent survey taken as percentage of religious group
D = Percentage difference of headcount from the survey
Table 3.4 shows how the above formula is used to calculate the percentage of Catholics
who attend a religious service weekly from their response to the religion question in Mol's
survey. The weekly attendance measure is obtained by multiplying the number of people in each
of the response categories by the annual frequency assumed for that response category. As can be
seen in table 3.4 this produces the total shown in column C that is then divided by 52, which is
the number of weeks in each year. The result represented in column D is the average number of
people in each response category who would be expected to be attending in any particular week.
Column E, the expected proportion of people from each category who attend a religious service
weekly, is then calculated by dividing each of the response values in column D by the total
sample size of 631. The total of values in column E is the total proportion of people attending
87

weekly. In this table, the calculations show that a total of 56.7 per cent of Catholics would on
average have attended a religious service in a given week. This value can then be compared
against data collected by other surveys and by headcounts.
Table 3.4 Percentage of Catholics attending a religious service weekly based on their
responding to the Mol survey, 1966
A B C D E Responses Sample
Size (Vp)
Assumed Annual
Frequency (F)
Column A Multiplied by Column
B
Column C Divided by
52 (T)
Column D divided by
Total Column A
(TP) %
Never 79 0 0 0 0
Hardly Ever 55 1 55 1.1 0.2
Occasionally 85 6 510 9.8 1.6
Usually 72 24 1728 33.2 5.2
Always 340 48 16320 313.8 49.7
Total 631 18613 357.9 56.7
3.6 Comparison of average weekly attendance measure with headcounts Table 3.5 shows the estimated percentage of those attending weekly for each of the
Christian religious groups in the Mol survey. This is compared with another question in the Mol
survey of those who indicated that they had attended a religious service on the previous Sunday.
The close agreement between these two measures indicates that the estimated measure is a good
indicator of the average level of weekly attendance. In examining this table it is seen that the
Catholic group had a higher level of average weekly attendance than any of the other groups. Of
the Other Christian and Orthodox/Oriental groups about a third of each group attend weekly on
average compared to about a quarter of the Uniting/Presbyterian group.. The Anglican group had
the lowest level of attendance with about a seventh of that group attending weekly on average.
88
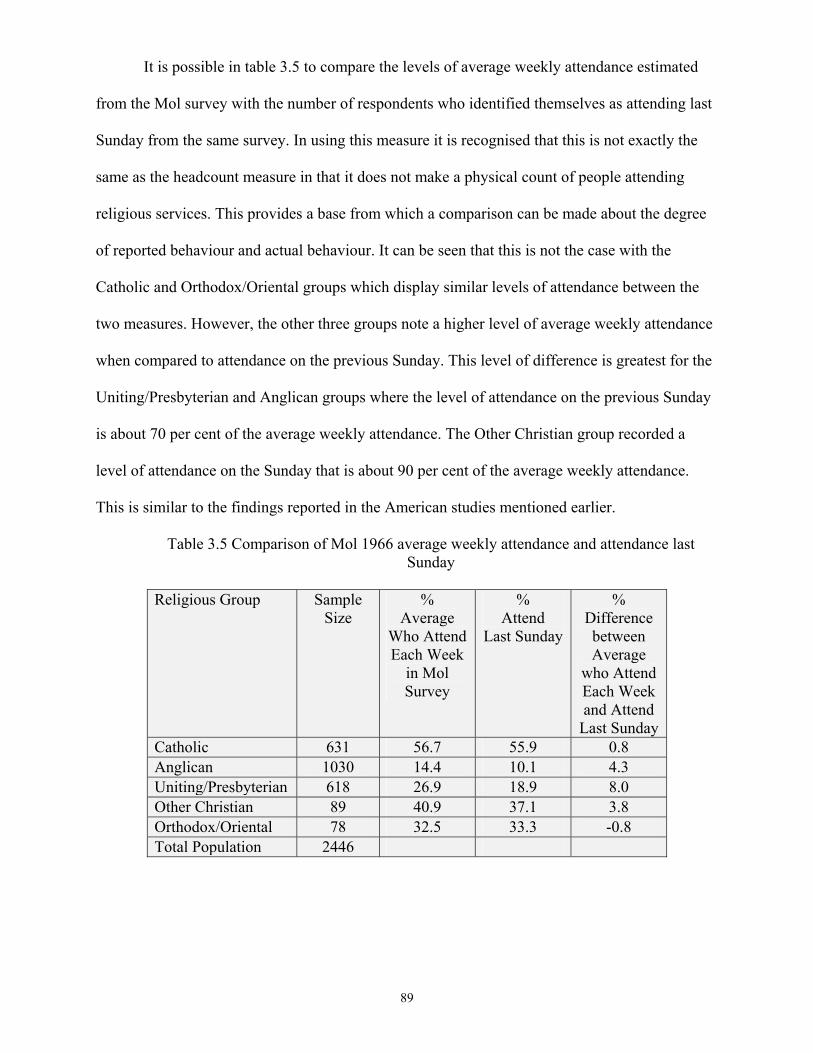
It is possible in table 3.5 to compare the levels of average weekly attendance estimated
from the Mol survey with the number of respondents who identified themselves as attending last
Sunday from the same survey. In using this measure it is recognised that this is not exactly the
same as the headcount measure in that it does not make a physical count of people attending
religious services. This provides a base from which a comparison can be made about the degree
of reported behaviour and actual behaviour. It can be seen that this is not the case with the
Catholic and Orthodox/Oriental groups which display similar levels of attendance between the
two measures. However, the other three groups note a higher level of average weekly attendance
when compared to attendance on the previous Sunday. This level of difference is greatest for the
Uniting/Presbyterian and Anglican groups where the level of attendance on the previous Sunday
is about 70 per cent of the average weekly attendance. The Other Christian group recorded a
level of attendance on the Sunday that is about 90 per cent of the average weekly attendance.
This is similar to the findings reported in the American studies mentioned earlier.
Table 3.5 Comparison of Mol 1966 average weekly attendance and attendance last Sunday
Religious Group Sample
Size %
Average Who Attend Each Week
in Mol Survey
% Attend
Last Sunday
% Difference between Average
who Attend Each Week and Attend
Last SundayCatholic 631 56.7 55.9 0.8 Anglican 1030 14.4 10.1 4.3 Uniting/Presbyterian 618 26.9 18.9 8.0 Other Christian 89 40.9 37.1 3.8 Orthodox/Oriental 78 32.5 33.3 -0.8 Total Population 2446
89

A comparison of the ISSP and ALSS studies in table 3.6 indicates that the levels of
average weekly attendance among the Catholic and Orthodox/Oriental groups were lower than
those in the Mol Study. Compared to the Mol survey, the levels of average weekly attendance
were similar for the Uniting/Presbyterian and Anglican groups and higher for the Other Christian
group. The reasons for these differences will be examined in chapters four and five.
However, when these two surveys are compared against the headcounts taken in the same
period, there were notable differences. The Catholic group shows that percentage attending last
Sunday is about 60 per cent of that according to the average weekly attendance measure
estimated from the surveys. The Anglican and Uniting/Presbyterian groups show that the Sunday
attendance is between 60-80 per cent of the average weekly attendance. On the other hand, the
Other Christian group indicates that the attendance level on a Sunday is about 130 per cent of the
average weekly attendance. Two things need to be noted in this examination. The first is the
similar proportional difference in the levels of attendance of Catholics to those displayed by the
Anglican and Uniting/Presbyterian groups. What this indicates is that the difference between the
attendance among the Catholics may be influenced by such factors as survey overstatement that
also existed in the responses from those belonging to the Uniting/Presbyterian and Anglican
groups.
90

Table 3.6 The comparison of attendance levels contained in ISSP 1993 Religion Survey and ALSS 1991/92 compared to 1993 Head Counts
Religious Group ISSP
Sample Size
% Attending
each Week in
ISSP Survey
ALSS Sample
Size
% Attending
each Week in ALSS Survey
% Attending according to Head Counts61
Difference between
ISSP Survey
and Head Counts
Difference between ALSS Survey
and Head Counts
Catholic 443 35.6 2354 33.3 20.4 15.2 11.3 Anglican 507 13.7 2455 10.0 7.9 5.8 2.1 Uniting/Presbyterian 336 20.4 1168 18.2 14.8 5.6 3.4 Other Christian 158 46.0 1009 48.3 60.3 -14.3 -12.0 Orthodox/Oriental 35 15.4 160 25.0 N/A N/A N/A Total 1479 7146
For the Other Christian group, however, the headcount measure of attendance in the
1990s is higher than that reported in the ISSP and ALSS. This may have occurred for two
reasons. The first is that the Other Christian group may attract people to attend on a Sunday who
are not actually affiliated with that group. Higher levels of attendance for that group would then
be due to a smaller denominator being used to arrive at the headcount attendance levels. The
second reason is that the headcount attendance levels may be higher due to double counting of
those who attend more than one service on a given Sunday.
61 The actual rates of participation were collated from two sources: The Catholic data
were collected by Dixon, (1996) on behalf of the Australian Catholic Bishop’s Conference and were based on actual head counts collected by parish and compared against the number of people indicated as Catholics in the 1996 ABS Census and in
Dixon, Catholics in Australia, AGPS. The rates identified were 0.220 in 1991 and 0.187 in 1996. The median rate for 1993 is calculated as 0.204. The other data were made available from Kaldor, (et al)1994 Winds of Change, Lancer, 344 modified to new
groupings for Uniting/Presbyterian (313691/2117662=0.148) Other Christian (537243/891488=0.603)
91

3.7 Comparison of average weekly attendance measure in surveys
Table 3.7 A Comparison of average weekly attendance levels according to the Mol 1966 survey, ISSP 1993 Survey and ALSS 1991 Survey
Religious Group %
Average Attending
each Week in
Mol Survey
% Average
Attending each
Week in ISSP
Survey
% Average
Attending each
Week in ALSS Survey
Catholic 56.7 35.6 33.3 Anglican 14.4 13.7 10.0 Uniting/Presbyterian 26.9 20.4 18.2 Other Christian 40.9 46.0 48.3 Orthodox/Oriental 32.5 15.4 25.0
A comparison of the weekly average attendance levels in 1966 and the 1990s indicates
that there have been some changes in the levels of attendance between religious groups. The
most noticeable in the lower weekly attendance among Catholics. In the Mol Survey one half of
Catholics would have attended a religious service in an average week compared to a third in the
ISSP and ALSS surveys. This points to a substantial change in the likelihood of Catholics
attending in a given week. An examination of the Anglican and Uniting/Presbyterian groups
shows a moderately lower attendance in the 1990s compared to 1966. What is significant in
comparing the ISSP and ALSS surveys is that the former produces slightly higher levels of
weekly attendance. This difference may occur as a result of differences between the surveys. As
was noted earlier the ISSP was considered to be a more conservative sample due to higher levels
of non-response and the sample being collected by mail back questionnaire. This may have led to
slightly higher levels of attendance in this survey. The ISSP is also an older age sample on
average.
92

A comparison from the ISSP and ALSS studies of the Other Christian and
Orthodox/Oriental groups show that both have higher attendance in the ALSS study. It is
possible that the greater difference shown for the Orthodox/Oriental group may be due to more
people from non-English speaking backgrounds in the ALSS which provided instructions in six
different languages and also conducted interviews in languages other than English. This would
indicate that the ALSS study may be more reliable in examining attendance of people from a
non-English background. Finally, it is shown that the attendance of Other Christians is higher in
the later surveys compared to that reported in the Mol study. This may result from the changes in
the composition of this group that have occurred between 1966 and 1993. The attendance level
of the Orthodox/Oriental group is lower in the ALSS and ISSP studies compared to the Mol
Study.
Table 3.8 A Comparison of attendance levels for the respondents contained in AFFP stage 1 1980/81 and stage 2 1990/91
Religious Group Sample
Size Sample
Size %
Attending each
Week in AFFP 1 Survey
% Attending
each Week in AFFP2 Survey
1980/81 1990/91 1980/81 1990/91
Catholic 710 378 27.9 29.6 Anglican 642 390 8.5 8.7 Uniting/Presbyterian 370 228 11.0 9.6 Other Christian 281 117 32.2 41.3 Orthodox/Oriental 54 28 20.6 18.5 Total Sample 2057 1141
The AFFP study shows that each of the religious groups have lower levels of attendance
than those reported in the ALSS and ISSP studies. These surveys are not directly comparable as
the AFFP represents people in the 18-34 age group in 1980/81 and 28-44 in 1990/91. Hence, the
93
lower levels of attendance in the AFFP may indicate a difference exists in the attendance patterns
of young people. This will be examined more closely in Chapter Five.
An examination of table 3.8 indicates that for some religious groups the levels of average
weekly attendance of those between the ages of 18-34 in 1980/81 changed over the following ten
years. There were marginally higher levels of average weekly attendance among the Catholic and
Anglican groups. The average weekly attendance among the Uniting/Presbyterian and
Orthodox/Oriental group was marginally lower. The Other Christian group, however, showed a
distinctly higher level of average weekly attendance. This may indicate that those retained in the
survey as part of this group increased their levels of weekly attendance. It may also indicate that
those retained in the two stages of the survey as part of this group had higher levels of attendance
than those who were not retained. Lastly, it may indicate that people who became members of a
religious group during the ten year time period displayed higher levels of attendance than those
who left the group, This will be examined in Chapter Four.
3.8 Summary The average weekly attendance measure appears to provide a reliable method to compare
religious attendance from the four surveys in this study. This measure is not the same as that
which records the level of attendance on a particular Sunday. There are indications that the
survey-based average weekly attendance measure may indicate a higher percentage attending
than is reported by a headcount of those attending on a particular Sunday. This difference may be
related to four factors. The first is that the smaller the religious group the greater the likelihood
that the headcount will be affected by other factors such as attendance by other people. The
second is the method by which people are counted at the religious services they attend on Sunday
and the time of the year in which the head-count is taken. The third is that there may be a
tendency for people to attend on a different day of the week or in a different form from that
94

which is measured by the headcount method. The fourth is the possibility that responsdents
overstate their attendance in surveys.
The application of this method raises a number of areas that need to be investigated in
subsequent chapters. The first is the reasons behind the decline in average weekly attendance
levels among the Catholic and Orthodox/Oriental groups between 1966 and 1993. The second is
the reasons behind similar patterns of attendance being reported by the Anglican and
Uniting/Presbyterian groups. The last is the reason behind the higher levels of attendance among
the Other Christian group.
95
4. Changes in religious affiliation and its effects on religious
attendance
4.1 Introduction The main results which have emerged from the cohort analysis in Chapter Two have
suggested that two movements have a marked influence on patterns of religious affiliation. The
first is a distinct decline in the affiliation of both females and males in the Christian groups in the
15-24 age group. The second suggests that in older age groups there has been an increase in
religious affiliation. This chapter will explore the changes in religious affiliation and attendance
between 1981 and 1991 recorded in the Australian Family Formation Project which covers the
age group 18-34 years in Stage 1 and 28-44 years in Stage 2. The surveys show that the
movements between affiliation and non-affiliation are more fluid than is initially understood.
Thus it becomes necessary that certain definitions are adopted to describe these movements. This
will also clarify both the state of a person’s affiliation and level of attendance and also the
movements between states of identity and adherence to a religious group.
Using these definitions it will be possible to look at whether there is a difference in the
attendance patterns of those respondents who participated in both stages of the AFFP study with
those who only took part in stage one in 1981. It is also useful to observe how retention or
change of affiliation, as shown in the two stages of the AFFP study, affects levels of attendance.
This chapter will also examine this issue using data from the two cross-sectional surveys, the
Mol survey in 1966 and the ISSP survey in 1993.
96

4.2 Definitions Previous studies by National Church Life Study62 have tended to emphasise the decline in
religious attendance and affiliation. It has been assumed that attendance and affiliation are the
norm and that states and movements away from this represent movements away from the norm.
Thus much of the language adopted in reference to these changes stresses the dysfunctional
nature of such behaviour. The difficulty with this approach is that it does not account for the
more fluid state of movement both between and within patterns of religious identity and the
movement between non-affiliation and affiliation. The picture becomes more complicated when
it is considered that there are different levels of adherence within a religious group which are
indicated by frequency of attendance. As a result, it is not only important to examine the size of a
religious group and the level of attendance but also the relation between these two measures.
This makes it necessary to have some definitions of the movements between affiliation and non-
affiliation which were observed in Chapter Two. The changes in levels of attendance also need to
be defined so as to arrive at a better understanding of these patterns. In seeking to arrive at
definitions for some of these movements it is necessary to explore some terms which may not be
in common usage.
Figure 4.1 acknowledges two terms which are already familiar. The term apostasy or the
apostotic movement refers to the change from affiliation to non-affiliation with a religious group
while conversion refers to the movement from one affiliation to another. The more difficult
movement to name is the movement from non-affiliation with a religious group to affiliation.
This movement has been described as conversion from one affiliation to another but it is actually
different. The movement is one in which spiritual values are taken more seriously. However,
there is difficulty in adopting a term which suggests a move away from secular values because of
97

the implication that spiritual values are somehow at odds with secular values. This runs the risk
of adopting a theological position known as dualism.63 The term spiritualisation is used here
instead. It has been adopted to contrast with the process of apostasy and to be clearly distinct
from the process of conversion.
Figure 4.1 Model of movements between affiliation RELIGIOUS GROUP CONVERSION RELIGIOUS GROUP APOSTASY SPIRITUALISATION
NO AFFILIATION WITH A RELIGIOUS GROUP The changes in frequency of attendance have been more difficult to define because of the
assumption that there are two extremes of attendance: that either you attend regularly or you do
not attend at all. These two positions do not fully describe the pattern observed that there are
different levels of attendance. While it can be acknowledged that regular attendance refers to the
pattern of attending on each principal day of religious observance and nominal attendance refers
to infrequent and irregular attendance they do not adequately explain the patterns that are
observed later in this chapter. Here it is possible to see that the largest change was from regular
attendance to more moderate levels of attendance. The term which seems to be most appropriate
for this pattern of attendance would appear to be periodic attendance. This is where a person
attends in a set pattern and sequence of intervals over a period of time.
The move from the highest frequency of attendance to the lowest frequency will be
referred to as lapsation while the term consolidation will be used to refer to the reverse
98
62 Kaldor, Bellamy, Powell, Correy and Castle (1994), The Winds of Change, Lancer, Sydney 342-344 and Kaldor (1987) Who Goes Where? Who Doesn't Care?, Lancer 63 Dualism is the process commonly seen in some faiths which views issues of bodily function as evil and issues of spirituality as good.

movement from the lowest frequency to the highest frequency (Figure 4.2). In using these terms
it also needs to be noted that there can be partial lapsation or consolidation which will refer to the
movements from lowest or highest level of attendance to more intermediate levels.
In this analysis it also needs to be noted that the attendance measure used in this study is
not actually a description of regular attendance but is an aggregated attendance measure which
seeks to describe the expected average level of attendance in any given week. Thus this measure
would include nominal, periodic and regular attenders. The measure is used to describe changes
in the proportion of all people affiliated to a particular religious group who attend a service on
the principal day of worship. Thus any lapsation or consolidation according to this measure
reflects the effect on the particular religious group of all the people affiliated to that group.
Figure 4.2 Model of movements based on changes in frequency of attendance
LOW ATTENDANCE NOMINAL C O N L S A O P L S
MODERATE ATTENDANCE PERIODIC I A D T A I T O
I N O HIGH ATTENDANCE REGULAR N
4.2 Comparison of changes of religious affiliation in Mol and ISSP surveys The Mol and ISSP surveys examined the changes in affiliation patterns of individuals
contained within each study. In each of these surveys, two questions were asked: one about the
person’s current religious affiliation and the other about previous affiliation. In the Mol survey
the question was whether a person had ever held another religious affiliation. The ISSP survey
99

asked which affiliation a person was raised in as a child. Where the responses to the two
questions were different it can be assumed that the person had sometime in his/her life changed
his/her religious affiliation.
Figure 4.3 shows the changes in religious affiliation according to the Mol survey. There
was little change due to Apostasy and Spiritualisation. The greatest degree of change appears to
be in the conversion from one religious group to another. These changes of religious identity
were similar levels for the religious groups. These changes reflect years prior to 1966 primarily
in the 1950’s and early 1960’s.
Figure 4.3 Changes in religious affiliation patterns of respondents in the Mol survey RELIGIOUS GROUP CONVERSION 9.4% RELIGIOUS GROUP APOSTASY 1.2% SPIRITUALISATION 0.2% NO AFFILIATION WITH RELIGIOUS GROUP
A comparison with patterns in the ISSP in figure 4.4 show that their are greater changes
in patterns of religious affiliation in 1993 survey than were shown in 1966. These reflect patterns
of change that occurred in the years prior to 1993 and could be due to changes of affiliation in
the 1970’s and 1980’s. While there is still a significant level of conversion between religious
groups, the Apostotic movement accounts for a greater portion of change. The change due to
spiritualisation is very small. A possible explanation for the low level of spiritualisation is that
people who have changed from having a religious affiliation to no religion may have returned to
their original religious affiliation at a later stage in life. This movement can occur over different
times during a person’s life. Thus while for the older people this may indicate that changes in
affiliation may be complete the same can not be concluded for those in younger age groups.
100

Figure 4.4 Changes in religious affiliation patterns of respondents in the ISSP RELIGIOUS GROUP CONVERSION 14.5% RELIGIOUS GROUP APOSTASY 22.7% SPIRITUALISATION 0.8% NO AFFILIATION WITH A RELIGIOUS GROUP
The comparison of these two surveys shows a greater level of change in levels of
affiliation in the years up to 1993 primarily the 1970’s and 1980’s. In 1966 only 11 per cent of
the sample had changed from one religious affiliation to another during their lifetime. However,
in 1993, 38 per cent had changed their pattern of affiliation. This change notes the marked
increase in apostasy from 1.2% to 22.7%, while conversion only rose from 9% to 14.5%This
suggests that changes in patterns of affiliation, particularly apostasy, may have an effect on
levels of weekly attendance at a religious service. This will be studied more closely in the study
of longitudinal data made available through the AFFP.
4.4 Changes shown in the AFFP surveys
One of the important issues which was highlighted in Chapter Three in relation to the
analysis of data from the AFFP survey was the loss of respondents between stages one and two.
The relevant issue in this study is whether those respondents retained in the study represented a
substantially different group of people from those who took part only in stage one. This is an
important issue because it can affect any observed differences in patterns of affiliation and
attendance observed in the two stages.
101

Table 4.1 Religious affiliation of respondents at stage one of AFFP, study based on those respondents in stage one only and respondents in stage one and two64
Stages Catholic Anglican Uniting/
Presbyter-ian
Orthodox/Oriental
Other Christian
Non Christian
No religion
Total
Stage 1 Only
319 (30.2%)
275 (26.0%)
133 (12.6%)
27 (2.6%)
105 (9.9%)
31 (2.9%)
166 (15.7%)
1056 (100%)
Stage 1 & 2 391 (27.3%)
367 (25.6%)
237 (16.5%)
27 (1.8%)
176 (12.3%)
30 (2.1%)
206 (14.4%)
1434 (100%)
Attrition Rate
44.9% 42.8% 35.9% 50.0% 37.4% 50.8% 44.6% 42.4%
A Pearson Chi-Square test65 showed that there was a significant difference between the
religious affiliation of those respondents who took part in stages 1 and 2 of the AFFP and those
who took part only in stage one. Table 4.1 shows that the Uniting/Presbyterian and Other
Christian groups are both represented at a proportionally greater level among those who were
retained in both stages of the AFFP than those who participated only in stage one. The converse
is true of all the other groups. The one exception is the Anglican group which appears to retain
similar levels of participants in both stages of the study. The groups most affected by the lower
levels of participation in Stage Two were the Catholic, Orthodox and Non Christian groups.
What also needs to be tested is whether this significant difference based on religious affiliation is
also present in proportions of those who attended a religious service each week.
A similar test of significance was used to examine the difference in levels of attendance
by religious group of those who took part in both stages of the AFFP survey and those included
only in stage one. This helped to establish that the only significant difference in levels of
attendance occurred in the Anglican group. 66 This test showed that those Anglicans who were
64 These proportions of significance are based on the direct attendance question used in the AFFP survey not the estimated measure presented in the formula in Chapter 3 65 The Pearson Chi Square Test showed that the difference was significant at p= .017 66 The Chi square test for the Anglican group showed a level of significance at p= .008
102

retained in the survey were likely to have a higher level of attendance than those who
participated only in stage one. However, the Anglican group appears to be the only religious
group affected significantly by the retention of people with patterns of higher attendance. This
may mean that overall patterns of attendance may be slightly higher among those who were
retained in both stages of the AFFP study. However, as the Anglican group is only about a third
of the total sample the overall effect is small.
Table 4.2 Proportion of respondents attending religious services weekly in stage one, 1981 AFFP survey among respondents in stage one only and those respondents in stage
one and two based by religious group
Stages Catholic %
Anglican %
Uniting/ Presbyt-
erian %
Orthodox %
Other Christian
%
Non Christian
%
No Religion
%
Stage 1 Only
25.4 6.4 10.1 24.9 29.6 14.2 2.1
Stage 1 & 2
29.8 10.0 11.5 16.1 33.8 14.3 1.5
4.5 Movement between religious groups
Table 4.3 shows the movements between religious affiliations that took place among
those respondents involved with both stages of the AFFP study. A study of this longitudinal data
is important as it provides an insight into the changes that occurred among these respondents in
the period between 1981 and 1991. This examination will lay the basis for testing whether
changes in patterns of affiliation have an effect on changes in levels of attendance. However, it is
necessary that to examine how these changes in patterns of affiliation have affected each
religious group.
103

Table 4.3 Distribution of respondents by their religious groups in stage one and stage two, AFFP study
Religious Group Stage Two 1991 Religious Group Stage 1 1981
Cat
holic
Ang
lican
Uni
ting/
Pres
byte
rian
Orth
odox
/Orie
ntal
Oth
er C
hris
tian
Jew
ish
Mus
lim
Oth
er N
on C
hris
tian
No
Rel
igio
n
Tota
l
Catholic 348 6 2 5 1 4 25 391
Anglican 4 302 15 6 6 34 367
Uniting/Presbyterian 1 15 181 8 2 30 237
Orthodox/Oriental 24 1 2 27
Other Christian 9 19 11 2 85 1 19 30 176
Jewish 7 2 9
Muslim 4 4
Other Non Christian 1 1 7 8 17
No Religion 16 48 18 2 11 3 8 154 260
Total 378 390 228 28 117 10 6 46 285 1488
The levels of conversion both in and out of the Catholic group are fairly low. However
the levels of apostasy are greater than those of spiritualisation. Thus the decline in this group is
more largely due to the movement to No Religion.
The increase in the Anglican group is the result of both conversion and spiritualisation.
Movements are larger than for the Catholic group and are marked by high levels of change both
in and out of the group.
The Uniting/Presbyterian group records some conversion primarily from the Other
Christian group. The group also experienced a level of apostasy similar to that of the Catholic
group. Overall there was a small decline in affiliation. This would indicate that while levels of
104
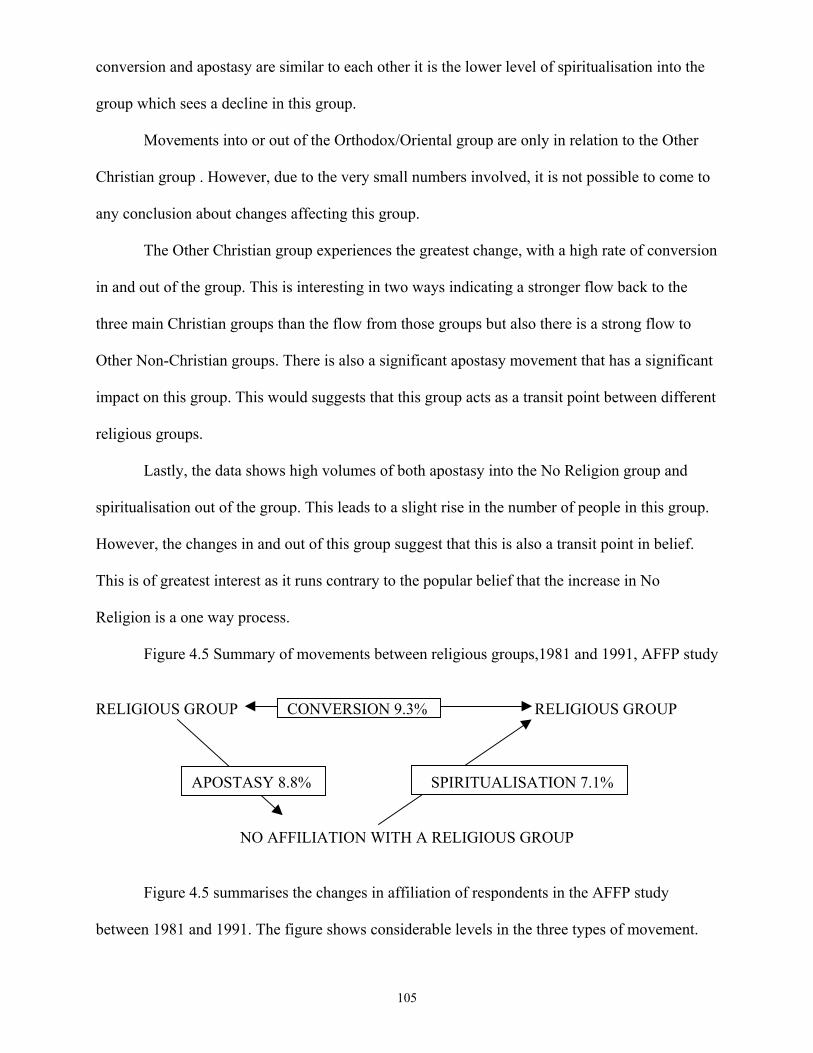
conversion and apostasy are similar to each other it is the lower level of spiritualisation into the
group which sees a decline in this group.
Movements into or out of the Orthodox/Oriental group are only in relation to the Other
Christian group . However, due to the very small numbers involved, it is not possible to come to
any conclusion about changes affecting this group.
The Other Christian group experiences the greatest change, with a high rate of conversion
in and out of the group. This is interesting in two ways indicating a stronger flow back to the
three main Christian groups than the flow from those groups but also there is a strong flow to
Other Non-Christian groups. There is also a significant apostasy movement that has a significant
impact on this group. This would suggests that this group acts as a transit point between different
religious groups.
Lastly, the data shows high volumes of both apostasy into the No Religion group and
spiritualisation out of the group. This leads to a slight rise in the number of people in this group.
However, the changes in and out of this group suggest that this is also a transit point in belief.
This is of greatest interest as it runs contrary to the popular belief that the increase in No
Religion is a one way process.
Figure 4.5 Summary of movements between religious groups,1981 and 1991, AFFP study
RELIGIOUS GROUP CONVERSION 9.3% RELIGIOUS GROUP APOSTASY 8.8% SPIRITUALISATION 7.1%
NO AFFILIATION WITH A RELIGIOUS GROUP
Figure 4.5 summarises the changes in affiliation of respondents in the AFFP study
between 1981 and 1991. The figure shows considerable levels in the three types of movement.
105

There were more conversions than apostasy. However, there is also a significant movement from
no affilaition to affiliation through the process of spiritualisation. Altogether 25% of the total
population in this study changed their religious affiliation between 1981 and 1991. This level of
change is significant in that it runs counter to the theory that the decline in religious affiliation is
the result of secularisation alone. It is evident that this is a period of dramatic change for all
religious groups and while the period between 1966 and 1976 witnessed a significance apostotic
movement, the 1981 to 1991 period was a period of equal or greater significance in the change of
religious affiliation, at least for people aged 18-34 in 1981. Therefore, the net changes observed
in the census data do not give a complete explanation about the level of change in affiliation that
occurred during this period.
Table 4.4 shows that changes in affiliation in the younger age groups are mainly due to
the processes of apostasy and spiritualisation. The process of conversion tends to occur more
among the older age groups. What is probably of greater significance is that apostasy tends to
occur more among the 18-24 age group over the ten-year period than spiritualisation. This would
mean that the net effect of apostasy is more noticeable among this group than among older age
groups.
In the 25-34 age group the level of apostasy is similar to the level of spiritualisation. This
means that our initial understanding of the apostotic movement being increasingly isolated to the
18-24 age group needs to be broadened to take account of this. Some of the change in affiliation
among those in the younger age group may be explained by movement away from parental
influence. However, it is also clear that older age groups in the AFFP study are also affected by
changes in affiliation. This indicates that the changes in affiliation may also be influenced by
other factors such as marriage.
106

Table 4.4 Movements between religious groups by age group, 1981-1991, AFFP study
1981 18-19 Years Old
20-24 Years Old
25-29 Years Old
30-34 Years Old
1991 28-29 Years Old
30-34 Years Old
35-39 Years Old
40-44 Years Old
Change in Religious Affiliation 1981-1991
% % % % Remained in Same Group 71.9 76.1 73.1 76.0 Christian to Christian 6.1 6.4 7.0 7.9 Christian to Non Christian 2.0 1.7 2.8 2.3 Christian to No Religion 9.2 9.0 8.0 7.0 Non Christian-Christian 0.3 0.2 Non Christian-No Religion 1.0 1.2 0.3 0.5 No Religion-Christian 8.2 5.4 7.5 5.5 No Religion- Non Christian 1.6 0.2 1.0 0.6 Total 100.0 100.0 100.0 100.0 Number of People 195 423 398 469
.
4.6 Change in religious affiliation and attendance
The preceding analysis indicates that the effects of apostasy, conversion and
spiritualisation have had a marked impact on the composition of all the religious groups. It is
also possible to examine how each of these processes affect weekly attendance at religious
services. Table 4.5 shows average weekly attendance estimated for those participants in the
AFFP survey who changed their religious affiliation between stages one and two. That the effect
of conversion from one Christian group to another has the impact of increasing the level of a
person’s attendance. The one exception to this rule is the conversion from the
Uniting/Presbyterian group to the Anglican group.
107

When a person retains the same religious affiliation over the ten year period, a process of
lapsation occurs and attendance declines except among Catholics. A number of factors may
explain why Catholics maintained the same level of attendance over the ten-year period. The first
is that Sunday attendance is stressed as an important part of Catholic practice. A person who
remains Catholic is more likely to maintain his/her level of practice. Also there may be a
tendency for Catholics to marry a person of similar affiliation which would allow the
maintenance of regular attendance on Sunday.
Table 4.5 Comparison of average weekly attendance level at religious services according to changes in religious affiliation, 1981-1991, AFFP study
Religious Change
1981 1991
Number Participating
Average Weekly
Attendance 1981
Average Weekly
Attendance 1991
Catholic Catholic 348 30.8 30.7 Catholic Anglican 6 15.7 27.8 Anglican Anglican 302 10.6 7.9 Anglican Catholic 4 9.6 42.3 Anglican Uniting/Presbyterian 15 7.7 14.8 Uniting/Presbyterian Anglican 15 7.8 1.9 Uniting/Presbyterian Uniting/Presbyterian 181 11.5 9.2 Total Catholic/ Anglican/ Uniting/Presbyterian
Other Christian 19 25.2 55.7
Other Christian Total Catholic/ Anglican / Uniting/Presbyterian
39 13.6 21.0
Other Christian Other Christian 85 47.8 39.2
Apostasy is likely to lead to non-attendance. This is certainly borne out by an
examination of table 4.6 which shows that when a person moves from any of the Christian
groups to No Religion they stop attending religious services, as expected. What is significant
about this group is that their attendance in 1981 would be considered to be in the lower ranges
108

for each of the groups in question. This indicates that a person’s attendance has already begun to
decrease prior to the decision to move out of the religious group.
The movement from No Religion to Catholic and Uniting/Presbyterian affiliation leads to
nominal levels of attendance. The movement from No Religion to Anglican and Other Christian
appears to lead to periodic attendance. This may indicate that while a person receives an identity
from belonging to a religious group this does not translate into the average weekly attendance
pattern expected by the institution represented by that religious group. As such it may indicate
that while the religious affiliation provides a religious identity for the person, his/her spiritual
needs may not necessarily be met by attendance at religious ceremonies provided by that group.
Table 4.6 Comparison of average weekly attendance level at religious services according to changes in religious affiliation between Christian groups and No Religion group, 1981-
1991, AFFP study
Religious Change
1981 1991
Number Participating
Average Weekly
Attendance 1981
%
Average Weekly
Attendance 1991
% Catholic No Religion 25 21.3 0.1 Anglican No Religion 34 5.1 0.5 Uniting/Presbyterian No Religion 30 8.8 0.1 Other Christian No Religion 30 8.1 0.3 Non Christian No Religion 10 0.1 0.2 No Religion Catholic 16 1.3 3.4 No Religion Anglican 48 0.5 6.7 No Religion Uniting/Presbyterian 18 1.1 1.4 No Religion Other Christian 11 8.6 32.5 No Religion Non Christian 11 0.2 18.5
When the corresponding comparison is made for the shift from Non Christian
groups to No Religion, there is little change in attendance, which is close to zero. However,
when the movement from No Religion to Non Christian takes place, it leads to periodic
attendance.
109
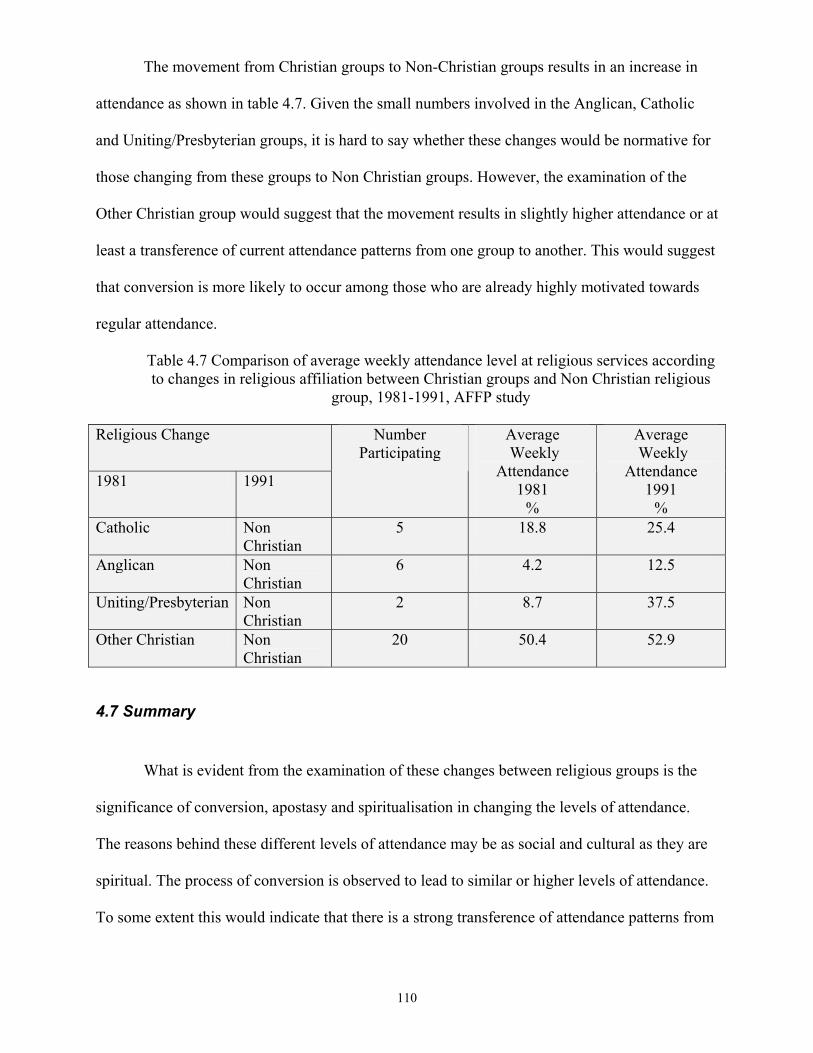
The movement from Christian groups to Non-Christian groups results in an increase in
attendance as shown in table 4.7. Given the small numbers involved in the Anglican, Catholic
and Uniting/Presbyterian groups, it is hard to say whether these changes would be normative for
those changing from these groups to Non Christian groups. However, the examination of the
Other Christian group would suggest that the movement results in slightly higher attendance or at
least a transference of current attendance patterns from one group to another. This would suggest
that conversion is more likely to occur among those who are already highly motivated towards
regular attendance.
Table 4.7 Comparison of average weekly attendance level at religious services according to changes in religious affiliation between Christian groups and Non Christian religious
group, 1981-1991, AFFP study
Religious Change
1981 1991
Number Participating
Average Weekly
Attendance 1981
%
Average Weekly
Attendance 1991
% Catholic Non
Christian 5 18.8 25.4
Anglican Non Christian
6 4.2 12.5
Uniting/Presbyterian Non Christian
2 8.7 37.5
Other Christian Non Christian
20 50.4 52.9
4.7 Summary
What is evident from the examination of these changes between religious groups is the
significance of conversion, apostasy and spiritualisation in changing the levels of attendance.
The reasons behind these different levels of attendance may be as social and cultural as they are
spiritual. The process of conversion is observed to lead to similar or higher levels of attendance.
To some extent this would indicate that there is a strong transference of attendance patterns from
110

one group to another and that a person may well be influenced by regular exposure to religious
issues and thus previous modes of behaviour are enhanced in the new group. This is probably
significant in that conversion appears to be more likely in older age groups. This would tend to
suggest that issues of spirituality and religious identity become more important and lead to a
greater level of attendance as a person grows older.
However, this pattern of greater attendance as a person ages appears to be confined to
those who retain their religious identity or who convert from one religious group to another. The
processes of apostasy and spiritualisation lead to different patterns of attendance. The apostasy
movement as was noted earlier leads to a pattern of non-attendance. Conversely spiritualisation
results in levels of attendance which would be considered nominal or periodic for the group
which they join. The process of apostasy while more evident in the 18-24 age group is not
confined to that group as initially thought. Movements in the 25-34 age group are mitigated by
corresponding movements in the older age group towards affiliation with a religious group. As
such it may be argued that the reasons for lower levels of attendance at younger ages may result
from the effects of these two movements on younger people. The process of spiritualisation may
also explain the lower levels of attendance among young people who retain their affiliation: that
the movement is not away from religious belief but away from institutional expressions of that
belief.
Thus it would appear that two major issues emerge in explaining the changing levels of
attendance. The first is the effect of the processes of conversion, apostasy and spiritualisation on
overall levels of attendance which can be clearly seen by an examination of the AFFP study in
this chapter. The second is how attendance of those who retain their religious affiliation changes
as a consequence of broader societal changes. Thus the subsequent chapters will concentrate on
those who retain their religious identity in order to understand how some of the changes in the
111

wider society affect attendance patterns. This will also highlight the differences between males
and females within the age groups adopted by the Mol study.
112

5. Patterns of religious attendance by age and sex
5.1 Introduction It was observed by Greeley that almost all the decline in church attendance in the United
States of America during the period from 1958 to 1986 was due to the declining attendance of
Catholics while the level of attendance in Protestant churches remained virtually unchanged. 67
This chapter will seek to examine whether similar changes can also be observed within the
religious attendance of Australia for the period between 1966 and 1993. The main aim of this
comparison will be to determine whether the changes in attendance patterns within religious
groups are due to generational, cross sectional or life course changes.
Since the aim is to examine changes in attendance patterns between 1966 and 1993, data
from the Mol and ISSP surveys are used. These surveys are based on respondents 20 years and
older and their age distributions are similar to those in the 1966 and 1991 Australian Censuses.
The comparison of these surveys examines whether there were changes in the levels of
attendance of males and females in the five Christian religious groups between 1966 and 1993.
In considering the change in attendance according to age, each of the Christian Groups,
except the Orthodox/Oriental group68, has been examined by two methods. The first looks at the
overall changes between cross-sectional age groups in the Mol survey and the ISSP. By using the
religion questions asked in the Mol and ISSP surveys regarding the person’s current affiliation
and whether the person had grown up with a different affiliation, it is also possible to compare
the weekly attendance of converts with that of those who retained their religious affiliation up to
the time of the survey. The second approach seeks to observe the attendance patterns of the
67 Greeley, A.(1989) Religious Change in America, Harvard University Press, Cambridge, p55
113

18-34 age group in the 1981 AFFP survey over the subsequent ten-year period for those who
retained their religious affiliation. These analyses will show the changes in attendance for each
age group between 1966 and 1993 and also the change in attendance for specific cohorts which,
as was already noted in Chapter Four, underwent a profound change between 1981 and 1991.
In analysing this data it is important to remember that the weekly attendance measure has
been used by applying the methodology explained in Chapter Three. As this is a derived measure
it is not possible to apply statistical tests of significance to these calculations. Thus where the
measure is based on a small number of cases, these will be interpreted with caution.
5.2 Differences in attendance by sex
Both the Mol and ISSP surveys show that females are more likely than males to attend
religious services weekly. This finding is not new and appears to have been a consistent pattern
in each of the surveys examined during the time period. However, there has been a change in the
relationship between the attendance levels of males and females over the time period.
Table 5.1 shows two distinct changes in attendance patterns. The Catholic and Orthodox
groups both recorded marked declines in weekly attendance between 1966 and 1993. This
decline was greater among females than males. The result is that in 1993 female attendance in
these two groups was similar to that of males. The change in levels of attendance was similar for
both males and females in the other three religious groups. There was a reduction in attendance
in the Uniting/Presbyterian group, a slight increase in attendance in the Anglican group and a
larger increase in the Other Christian group.
68 The Orthodox/Oriental group was excluded from this analysis as the sample size was too small in the ISSP and the AFFP surveys to compare attendance rates by age and sex.
114

Table 5.1 Comparison of weekly attendance by sex and religious group from the Mol, 1966 and ISSP, 1993 Surveys
Male Female Religious
Group %
Attending Each Week 1966
% Attending
Each Week 1993
Difference between 1966 and
1993
% Attending
Each Week 1966
% Attending
Each Week 1993
Difference between 1966 and
1993Catholic 51.1
(n=311) 34.7
(n=236) -16.4 59.9
(n=320) 36.3
(n=206) -23.6
Anglican 8.9 (n=495)
9.4 (n=252)
0.5 14.7 (n=535)
17.8 (n=253)
3.1
Uniting /Presbyterian
20.5 (n=300)
15.7 (n=169)
-4.8 28.2 (n=318)
24.6 (n=166)
-3.6
Other Christian
34.4 (n=43)
41.4 (n=80)
7.0 44.1 (n=46)
50.8 (n=78)
6.7
Orthodox 25.6 (n=43)
14.1 (n=19)
-11.5 34.4 (n=35)
16.9 (n=16)
-17.5
All Christian Groups
23.7 15.6 -8.1 30.7 21.6 -9.1
While one can speculate about the causes of these changes, the movement in patterns of
affiliation noted in Chapter Two may explain some of the differences in attendance observed in
the Anglican, Uniting/Presbyterian and Other Christian religious groups. However, it is also
possible that the combination of the Uniting/Presbyterian group in the 1970’s might explain
some of the decline in attendance among people upset by this change. The rise in the Pentecostal
movement during the 197o’s and 1980’s might also explain the rise in levels of attendance in the
Other Christian group.
The Orthodox and Catholic groups are also affected but there may be other factors
present in these two religious groups. These two groups were augmented by migration from
countries other than the United Kingdom from countries such as Greece, where the main religion
is Orthodox, and Italy and the Philippines where Catholicism is the predominant religion. There
115

is a possibility that where attendance levels may have remained high when people from these
countries first arrived their attendance may have declined as they became part of the wider
community. This hypothesis will be examined in Chapter Six. However, it is also possible that
declines especially in the Catholic group may be related to changes within the style of worship
and this will be examined in the case study in Chapter Eight.
As shown in table 5.2, there is a distinct difference in 1966 between the level of
attendance of those who have retained their religious affiliation from their childhood and those
who have converted. Among Catholics those who have retained their religious affiliation have
higher levels of attendance than those who have converted to Catholicism. There is also a greater
percentage point difference between the attendance of males who retained their affiliation and
those who converted than among females. This may suggest that in 1966 males who had
converted to Catholicism may have done so for reasons other than those which motivated people
to convert to other religious groups.
Table 5.2 shows that this distinctly lower level of attendance among male converts to
the Catholic group is also observed in 1993. This indicates that a consistent factor is present
which causes this lower level of attendance among male converts to Catholicism that is not
present among males who have retained their Catholic identity. However, it can be seen that this
pattern is the reverse of all the other religious groups where those who convert usually have a
distinctly higher level of attendance than those who retain their affiliation. These conversions
may have resulted from the situation where the Catholic Church used to adopt different
arrangements for marriages between Catholics and non Catholics which did not permit them to
be married in the Church but only in the sacristy. This may indicate that the reason for some of
the male Catholics converting may be less related to issues of faith and more related to issues of
accommodating the woman’s wish to marry in the Church. The issue of marriages between
people of different denominations will be examined more closely in Chapter Seven.
116

Table 5.2 Comparison of weekly attendance between those who retain affiliation with converts to religious group present in Mol, 1966 and the ISSP, 1993 surveys
Male Female
% Attending Each Week
% Attending Each Week
Religious Group
Retained Affiliation
Converted to
Affiliation
Difference between
Retained and Convert
Retained Affiliation
Converted to
Affiliation
Difference between
Retained and Convert
1966
Catholic 52.3 (n=289)
38.9 (n=22)
-13.4 60.2 (n=291)
56.8 (n=29)
-3.4
Anglican 8.7 (n=459)
11.9 (n=36)
3.2 14.2 (n=481)
19.4 (n=54)
5.2
Uniting/ Presbyterian
19.3 (n=263)
29.3 (n=37)
10.0 27.2 (n=276)
34.2 (n=42)
7.0
Other Christian
27.5 (n=25)
44.0 (n=18)
16.5 39.0 (n=34)
58.5 (n=12)
19.5
1993
Catholic 35.7 (n=195)
25.7 (n=41)
-10.0 34.7 (n=181)
47.2 (n=25)
12.5
Anglican 8.5 (n=216)
16.5 (n=36)
8.0 15.4 (n=202)
33.1 (n=51)
17.7
Uniting/ Presbyterian
9.1 (n=86)
21.0 (n=83)
11.9 12.3 (n=70)
35.3 (n=96)
23.0
Other Christian
38.0 (n=38)
44.8 (n=42)
6.8 34.6 (n=13)
65.1 (n=35)
30.5
Female converts to the Catholic group had attendance rates that are marginally lower in
1993 than those of female converts in 1966. Catholic females who have retained their religious
identity up to the point when the ISSP survey was conducted, show much lower levels of
attendance in 1993 when compared to 1966. This would suggest that conversion among Catholic
females still leads to similar levels of high attendance in 1993 as were seen among converts in
1966. However, the weekly attendance of Catholic females who have retained their Catholic
religious affiliation is similar to that of Catholic males who have retained their affiliation.
117
It can be observed that the Anglican group, which was shown in Chapter Four to have the
lowest levels of conversion, has the smallest percentage point difference in the average weekly
attendance between those who have retained their religious affiliation and those who have
converted. On the other hand, the Other Christian group, which was shown to have high levels of
conversion, has the highest level of percentage point difference between those who have retained
their religious affiliation and those who have converted. When the Uniting/Presbyterian group is
examined it is found that the percentage point difference falls mid way between these other two
religious groups. It would appear that in 1966 the more a religious group is influenced by levels
of conversion the greater the difference in levels of attendance between those who have
converted and those who have retained that religious identity from birth.
An examination of these three religious groups in table 5.2 also shows that there are some
percentage point differences between males and females. However, these differences do not give
a strong indication that conversion leads to higher levels of weekly attendance among female
than males. What it does indicate is that in 1966 conversion had the same positive effect on
weekly attendance for males and females belonging to these three religious groups.
When these observations made in 1966 are compared to 1993, conversion retains this
same positive effect among those who belong to the Anglican, Uniting/Presbyterian and Other
Christian groups. It can also be observed that the percentage point difference between female
converts and those who retain their religious affiliation is still present in each of these religious
groups. The difference remains much greater among the Other Christian group compared to the
other two. However, it can also be observed that the percentage point difference between
converts and those who retained their religious affiliation in 1993 is much greater than that seen
in 1966. This is the result of two changes. First, those who retained their religious affiliation and
belonged to the Uniting/Presbyterian group in 1993 had lower levels of attendance compared to
those who took part in the 1966 survey. Second, those who converted to Anglicanism and took
118
part in the 1993 survey had higher levels of attendance than those who took part in the 1966
survey. These changes seem to suggest that conversion has a much greater influence in
explaining high levels of attendance among females in 1993 than in 1966.
The same conclusion cannot be drawn from a comparison of male converts belonging to
these three religious groups. It would appear that the converts to the Anglican group show higher
levels of attendance in 1993 compared to those in the 1966 survey and the Uniting/Presbyterian
group displays slightly lower levels of attendance. The levels of attendance among those who
have converted to the Other Christian group are the same. Where changes have occurred it
appears to be among the attendance levels of those who have retained their religious affiliation
up to the point when the ISSP survey was conducted. Here it can be seen that the attendance
level of those belonging to the Uniting/Presbyterian group is lower in 1993 among those who
retained their religious affiliation when compared to those who took part in the 1966 survey. The
attendance of Other Christians who have retained their affiliation is higher, while Anglicans
show similar levels of attendance. Given the small changes that have occurred, the attendance
patterns of males in the Anglican, Uniting/Presbyterian and Other Christian groups are similar in
1993 to those seen in 1966.
5.3 Difference by age and sex
These findings indicate that the Catholic group has been most affected by changing
patterns of attendance. However, it is necessary to examine each of the Christian religious
groupings to discover whether attendance patterns are affected by a person's age and sex. This is
especially important in the consideration of whether attendance patterns are affected by life
course, generational or cross sectional changes. If the patterns of attendance remain similar over
time it is possible to consider that this is the result of life course events. However, if they show
119

distinctly different patterns of attendance then the changes may result from factors related to
generational change. The third option is that a cross sectional change, such as Vatican II within
the Catholic group, may have affected all generations at the same time.
5.3.1 Catholics As shown in table 5.3, the attendance patterns of Catholics of both sexes was similar in
1966. Among males, there was a small increase in levels of attendance with age to age 59 before
a marked decline in level of attendance in the 60+ age group. A similar pattern is present for
females, with similar levels of attendance in the 20-39 age group, a slight increase in the 40-59
age group and a marked decline in attendance above 60 years of age.
Table 5.3 Percentage of Catholics who attend weekly by age and sex, Mol, 1966 and ISSP, 1993 surveys
Male Female Age Group
% Attending
Each Week 1966
% Attending
Each Week 1993
Difference between 1966 and
1993
% Attending
Each Week 1966
% Attending
Each Week 1993
Difference between 1966 and
1993 20-24 years 50.3
(n=42) 20.4
(n=14) -29.9 60.1
(n=41) 16.7
(n=20) -43.4
25-39 years 52.6 (n=113)
28.9 (n=71)
-23.7 59.8 (n=113)
24.0 (n=84)
-35.8
40-59 years 53.5 (n=112)
34.4 (n=93)
-19.1 63.5 (n=112)
48.5 (n=70)
-15.0
60+ Years 41.4 (n=42)
48.3 (n=53)
6.9 52.5 (n=42)
56.2 (n=29)
3.7
The 1993 ISSP results show that a greater percentage of males and females in the
oldest age group attend a religious service weekly than was the case in 1966. Between 1966 and
1993, there was a greater decline in religious attendance for females than males under age 40.
Females in the 20-24 and 25-39 age groups attended less frequently than males in the same age
120
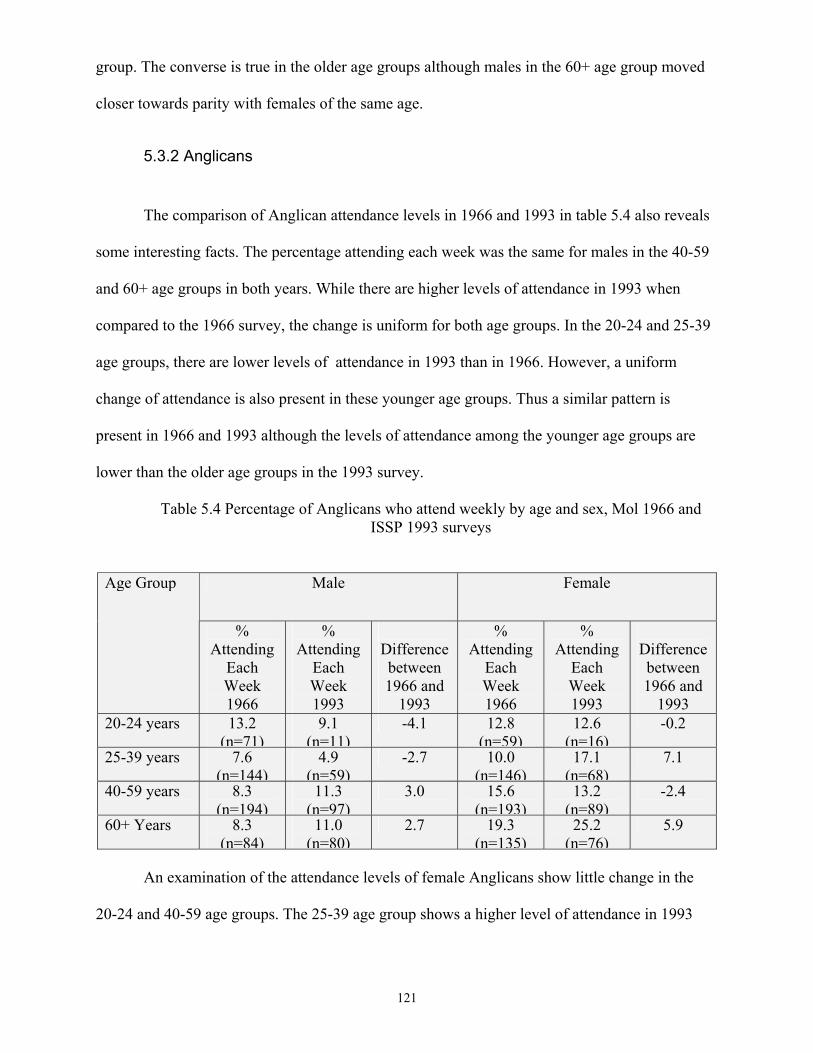
group. The converse is true in the older age groups although males in the 60+ age group moved
closer towards parity with females of the same age.
5.3.2 Anglicans
The comparison of Anglican attendance levels in 1966 and 1993 in table 5.4 also reveals
some interesting facts. The percentage attending each week was the same for males in the 40-59
and 60+ age groups in both years. While there are higher levels of attendance in 1993 when
compared to the 1966 survey, the change is uniform for both age groups. In the 20-24 and 25-39
age groups, there are lower levels of attendance in 1993 than in 1966. However, a uniform
change of attendance is also present in these younger age groups. Thus a similar pattern is
present in 1966 and 1993 although the levels of attendance among the younger age groups are
lower than the older age groups in the 1993 survey.
Table 5.4 Percentage of Anglicans who attend weekly by age and sex, Mol 1966 and ISSP 1993 surveys
Male Female Age Group
% Attending
Each Week 1966
% Attending
Each Week 1993
Difference between 1966 and
1993
% Attending
Each Week 1966
% Attending
Each Week 1993
Difference between 1966 and
1993 20-24 years 13.2
(n=71)9.1
(n=11)-4.1 12.8
(n=59)12.6
(n=16)-0.2
25-39 years 7.6 (n=144)
4.9 (n=59)
-2.7 10.0 (n=146)
17.1 (n=68)
7.1
40-59 years 8.3 (n=194)
11.3 (n=97)
3.0 15.6 (n=193)
13.2 (n=89)
-2.4
60+ Years 8.3 (n=84)
11.0 (n=80)
2.7 19.3 (n=135)
25.2 (n=76)
5.9
An examination of the attendance levels of female Anglicans show little change in the
20-24 and 40-59 age groups. The 25-39 age group shows a higher level of attendance in 1993
121

compared to those who took part in the 1966 survey. This difference may be explained by
converts to Anglicanism who formed a significant part of this age group and whose level of
attendance was higher than those who had retained their affiliation. The level of attendance of
females in the 60+ age group in 1993 is also higher than in 1966. This may suggest that better
health may have enabled a larger proportion of older Anglicans to attend religious services on a
regular basis.
Given that the patterns of attendance are broadly similar in 1966 and 1993 it is possible to
conclude that the strength of the link between affiliation and attendance has been maintained.
This link would suggest that attendance is likely to be higher among females than among males
and that Anglicans in the older age groups are more likely to attend than those in the younger age
groups. This would indicate that patterns of attendance in the Anglican group are more likely to
be affected by life cycle events.
5.3.3 Uniting/Presbyterian
The attendance patterns of the Uniting/Presbyterian group in table 5.5 also shows little
change between 1966 and 1993. There is a high rate of attendance in the 20-24 year age group
but a decline in the 25-39 age group for males and females. This is then followed by higher
levels of attendance in the 40-59 and 60+ age groups. The one exception is the lower level of
attendance in the ISSP study among females in the 40-59 age group.
A comparison of the two time periods shows that where lower attendance occurs in 1993
compared to 1966 it is in the older age groups for both males and females. However, even given
these lower levels of attendance a similar pattern of retention of the links between attendance and
affiliation is maintained in both years. This would suggest two things. The first is that this group
would be more influenced by any changes in levels of affiliation over this period. The second is
122
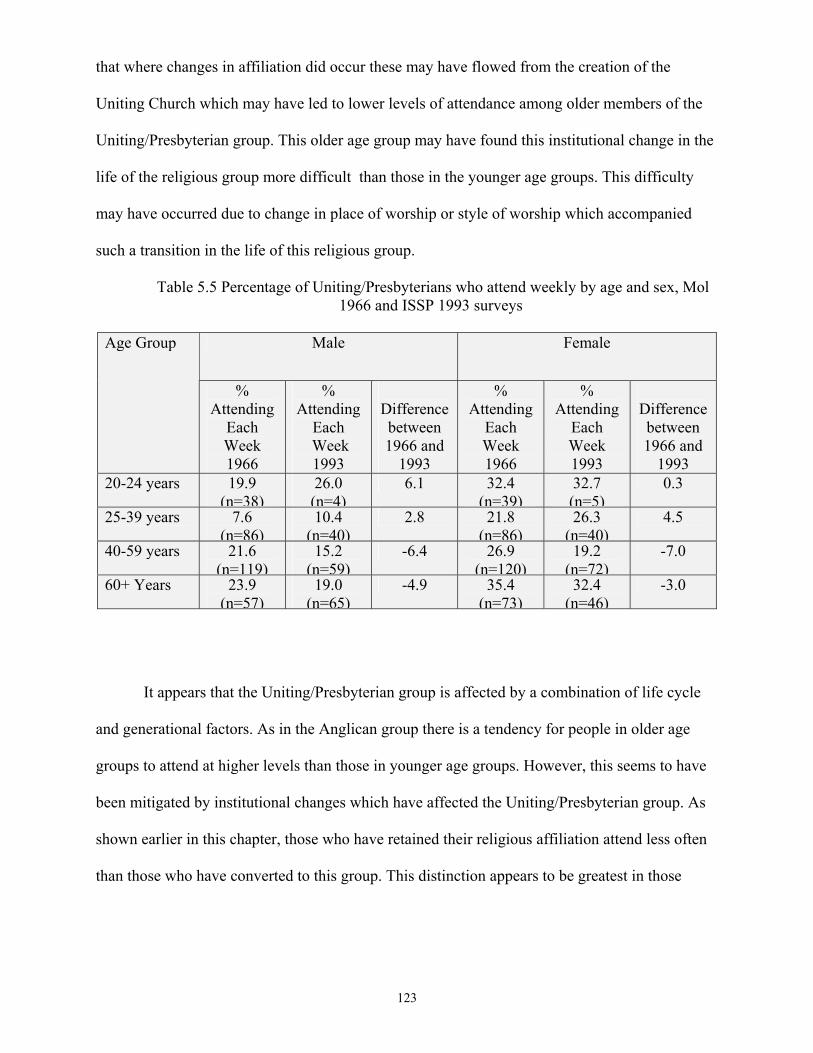
that where changes in affiliation did occur these may have flowed from the creation of the
Uniting Church which may have led to lower levels of attendance among older members of the
Uniting/Presbyterian group. This older age group may have found this institutional change in the
life of the religious group more difficult than those in the younger age groups. This difficulty
may have occurred due to change in place of worship or style of worship which accompanied
such a transition in the life of this religious group.
Table 5.5 Percentage of Uniting/Presbyterians who attend weekly by age and sex, Mol 1966 and ISSP 1993 surveys
Male Female Age Group
% Attending
Each Week 1966
% Attending
Each Week 1993
Difference between 1966 and
1993
% Attending
Each Week 1966
% Attending
Each Week 1993
Difference between 1966 and
1993 20-24 years 19.9
(n=38)26.0 (n=4)
6.1 32.4 (n=39)
32.7 (n=5)
0.3
25-39 years 7.6 (n=86)
10.4 (n=40)
2.8 21.8 (n=86)
26.3 (n=40)
4.5
40-59 years 21.6 (n=119)
15.2 (n=59)
-6.4 26.9 (n=120)
19.2 (n=72)
-7.0
60+ Years 23.9 (n=57)
19.0 (n=65)
-4.9 35.4 (n=73)
32.4 (n=46)
-3.0
It appears that the Uniting/Presbyterian group is affected by a combination of life cycle
and generational factors. As in the Anglican group there is a tendency for people in older age
groups to attend at higher levels than those in younger age groups. However, this seems to have
been mitigated by institutional changes which have affected the Uniting/Presbyterian group. As
shown earlier in this chapter, those who have retained their religious affiliation attend less often
than those who have converted to this group. This distinction appears to be greatest in those
123

between the ages of 40 and 59. This appears to be the age group most affected by any changes to
the institutional nature of this religious group.
5.3.4 Other Christians
The Other Christian group is a combination of different churches. They are combined
together because of the similarities in the strong links that they maintained between affiliation
and attendance. These different combinations may affect changes in levels of attendance over
time. However, as this group also attracts large numbers of converts from other religious groups
this may also help explain different levels of attendance. This group is also significantly smaller
than the other three religious groups discussed in this section that resulted in much smaller
sample sizes for each of the age groups. As a result the age groups were combined into two
groups: those aged 20-39 and those aged 40+.
Table 5.6 Percentage of Other Christians who attend weekly by age and sex, Mol 1966 and ISSP 1993 surveys
Male Female Age Group
% Attending
Each Week 1966
% Attending
Each Week 1993
Difference between 1966 and
1993
% Attending
Each Week 1966
% Attending
Each Week 1993
Difference between 1966 and
1993 20-39 years 38.2
(n=15) 43.7
(n=24) +5.5 39.0
(n=17) 46.4
(n=31) +7.4
40 + years 32.4 (n=28)
40.6 (n=54)
+8.2 47.1 (n=29)
53.0 (n=45)
+5.9
Table 5.6 shows that the Other Christian group had slightly higher attendance patterns in
1993 in every age group when compared with similar age groups in 1966. When the 20-39 age
group is examined, it can be observed that both males and females retained patterns of
124

attendance similar to each other. Thus while there was an increase in attendance over the period
this did not lead to a significant difference between the attendance patterns of males and females
in this age group.
However, there does appear to be a significant difference in the patterns of attendance of
males and females aged over 40. This difference appears to be maintained in both periods even
though males and females in this age group were attending at higher levels in 1993 compared to
the same age group in 1966.
The higher levels of converts present in the 1993 survey, explains the higher levels of
attendance in each age group when these are compared with the 1966 survey. This would
indicate that religious conversion plays an important part in explaining the changes in attendance
patterns of those who belong to this religious group. The influence of the Pentecostal movement
might also explain part of the rise in the levels of attendance in this group.
5.4 Comparison of age effects on retention and conversion
In examining the differences in patterns of attendance by religious group it becomes
apparent that religious conversion can also have a significant effect. Whether a person has
retained his religious affiliation at the point when the survey is conducted or whether he has
converted to a religious group can influence his level of attendance. It is important, therefore, to
discover whether particular age groups are more affected by conversion and whether these
patterns are similar in 1966 and 1993.
125
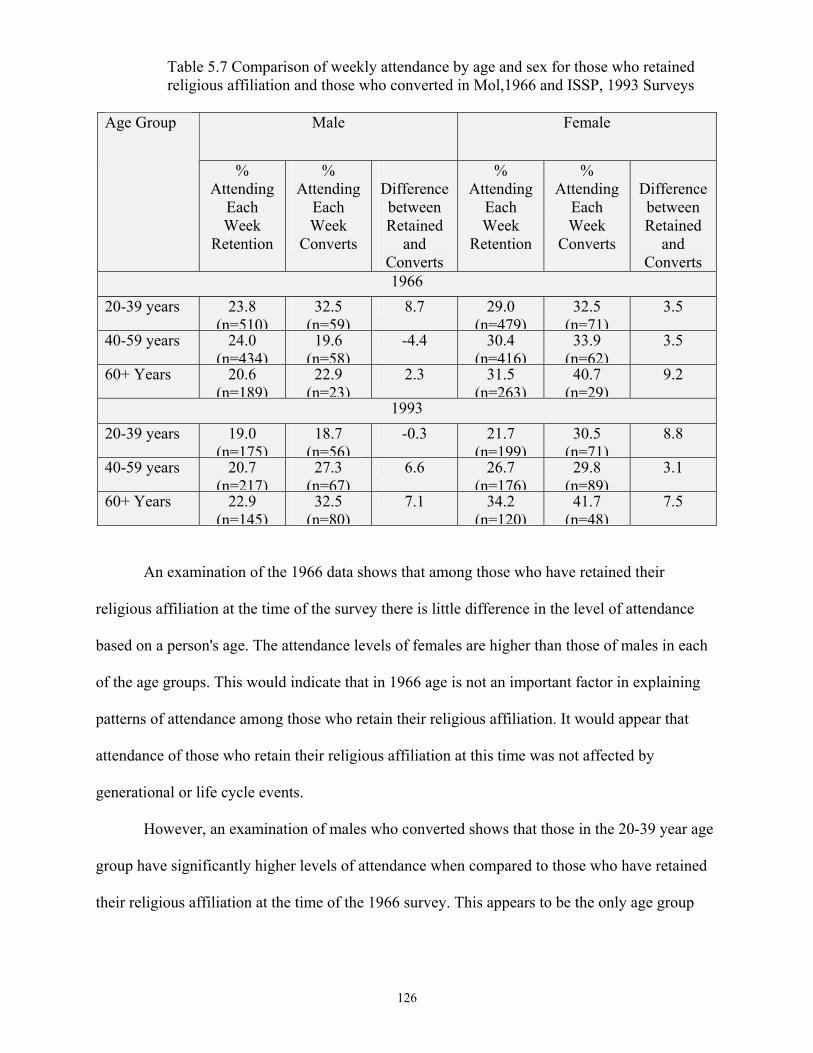
Table 5.7 Comparison of weekly attendance by age and sex for those who retained religious affiliation and those who converted in Mol,1966 and ISSP, 1993 Surveys
Male Female Age Group
% Attending
Each Week
Retention
% Attending
Each Week
Converts
Difference between Retained
and Converts
% Attending
Each Week
Retention
% Attending
Each Week
Converts
Difference between Retained
and Converts
1966 20-39 years 23.8
(n=510)32.5
(n=59)8.7 29.0
(n=479)32.5
(n=71)3.5
40-59 years 24.0 (n=434)
19.6 (n=58)
-4.4 30.4 (n=416)
33.9 (n=62)
3.5
60+ Years 20.6 (n=189)
22.9 (n=23)
2.3 31.5 (n=263)
40.7 (n=29)
9.2
1993 20-39 years 19.0
(n=175)18.7
(n=56)-0.3 21.7
(n=199)30.5
(n=71)8.8
40-59 years 20.7 (n=217)
27.3 (n=67)
6.6 26.7 (n=176)
29.8 (n=89)
3.1
60+ Years 22.9 (n=145)
32.5 (n=80)
7.1 34.2 (n=120)
41.7 (n=48)
7.5
An examination of the 1966 data shows that among those who have retained their
religious affiliation at the time of the survey there is little difference in the level of attendance
based on a person's age. The attendance levels of females are higher than those of males in each
of the age groups. This would indicate that in 1966 age is not an important factor in explaining
patterns of attendance among those who retain their religious affiliation. It would appear that
attendance of those who retain their religious affiliation at this time was not affected by
generational or life cycle events.
However, an examination of males who converted shows that those in the 20-39 year age
group have significantly higher levels of attendance when compared to those who have retained
their religious affiliation at the time of the 1966 survey. This appears to be the only age group
126

significantly affected by conversion. This suggests that a particular life cycle change occurs for
males who convert in this age group that is not present in any of the other age groups.
Female converts in the each age group have higher levels of attendance than the retention
group. The 60+ year age group shows higher levels of attendance among those who convert
when compared to those who retain their affiliation. This indicates that females in the older age
groups may be influenced by a combination of life cycle and generational effects. This suggests
that two issues affect the attendance patterns of females who convert: that older women who
have converted are likely to attend more often and that the age when they convert may affect the
level of their attendance.
In 1993 there were some significant differences by age in the level of weekly attendance
at religious services. The patterns of attendance are similar for males and females in each age
group. They show that in each younger age group people who retain their religious affiliation are
less likely to attend a religious service weekly. This change in pattern from 1966 indicates that
generational factors play a more important part in explaining the differences in the levels of
attendance of those who have retained their religious affiliation.
Attendance patterns of females who converted to a religious affiliation are broadly
similar in 1993 to those recorded in the 1966 survey. It can be seen that the attendance of female
converts is higher than that of male converts in each age group. The main difference is that
female converts in the 60+ age group attend at higher levels in 1993 than the same age group in
1966. This difference supports the finding shown in the 1966 survey that women who convert to
a religion and who are in the 60+ age group are more likely to attend a religious service on a
weekly basis. The male pattern of attendance in 1993 among those who converted shows lower
levels of attendance in the 20-39 age group and higher levels of attendance among the older age
groups compared with the same age groups in 1966.
127

A comparison of the attendance levels in 1993 of those who retain their religious
affiliation and those who convert shows a different pattern emerging for males and females.
Among males it is only the 20-39 age group that shows some similarities between converts and
those retaining their affiliation. For the older male age groups, converts show higher levels of
attendance. However, among females it appears that there are higher levels of attendance for
converts in every age group.
This comparison suggests that the process of conversion is similar in 1966 and 1993.
Those who convert to a religion are likely to have higher levels of attendance than those who
have always belonged to a religious group. The process of conversion also appears to result in
higher levels of attendance among women than men. Lastly, the data shows that older women are
likely to attend at higher levels than younger women.
However, there appears to have been a change in the attendance patterns of those who
have retained their religious affiliation. The comparison of the 1966 and 1993 surveys suggests
that there is a generational factor which is related to lower levels of attendance among those in
the younger age groups. This would indicate that where a decline in attendance has occurred
among religious groups it has occurred among those who retained their religious affiliation and
more among younger persons than among older persons. The reasons for this decline in
attendance among those who have retained their religious affiliation need to be examined more
closely.
5.5 Comparison of attendance patterns of those who retain their affiliation
As has been shown the attendance levels of those who have retained their affiliation has
undergone a period of change between 1966 and 1993. This appears to have occurred as a result
of generational changes among younger age groups. An examination of the AFFP survey in table
128
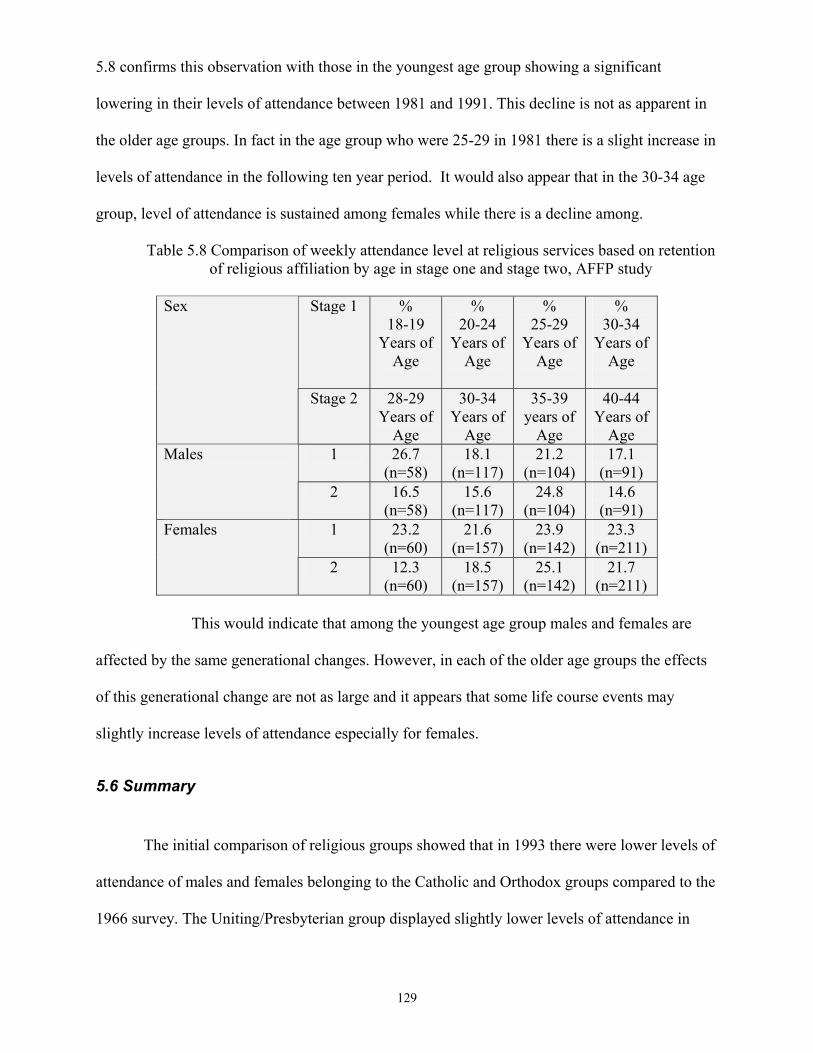
5.8 confirms this observation with those in the youngest age group showing a significant
lowering in their levels of attendance between 1981 and 1991. This decline is not as apparent in
the older age groups. In fact in the age group who were 25-29 in 1981 there is a slight increase in
levels of attendance in the following ten year period. It would also appear that in the 30-34 age
group, level of attendance is sustained among females while there is a decline among.
Table 5.8 Comparison of weekly attendance level at religious services based on retention of religious affiliation by age in stage one and stage two, AFFP study
Stage 1 %
18-19 Years of
Age
% 20-24
Years of Age
% 25-29
Years of Age
% 30-34
Years of Age
Sex
Stage 2 28-29 Years of
Age
30-34 Years of
Age
35-39 years of
Age
40-44 Years of
Age 1 26.7
(n=58) 18.1
(n=117) 21.2
(n=104) 17.1
(n=91) Males
2 16.5 (n=58)
15.6 (n=117)
24.8 (n=104)
14.6 (n=91)
1 23.2 (n=60)
21.6 (n=157)
23.9 (n=142)
23.3 (n=211)
Females
2 12.3 (n=60)
18.5 (n=157)
25.1 (n=142)
21.7 (n=211)
This would indicate that among the youngest age group males and females are
affected by the same generational changes. However, in each of the older age groups the effects
of this generational change are not as large and it appears that some life course events may
slightly increase levels of attendance especially for females.
5.6 Summary
The initial comparison of religious groups showed that in 1993 there were lower levels of
attendance of males and females belonging to the Catholic and Orthodox groups compared to the
1966 survey. The Uniting/Presbyterian group displayed slightly lower levels of attendance in
129

1993 compared to 1966. The Anglican group showed very small changes in levels of attendance
and the Other Christian group showed higher levels of attendance in 1993 compared to 1966.
Difference in levels of attendance are related to three factors: whether a person has changed
religious affiliation, the age of the person at the time of the survey and the religious group to
which a person belongs.
Whether a person has retained his/her affiliation up to the point of the survey or whether
he/she has converted to a religious group is a significant factor in explaining different levels of
attendance. The 1966 and 1993 surveys show that converts to the Anglican, Uniting/Presbyterian
and Other Christian groups have higher levels of attendance than those who have always
belonged to these affiliations. In both surveys for these three religious groups, the difference in
levels of attendance between converts and those who retain their affiliation is higher among
females than among males. It has also been shown that in 1966 and 1993 those belonging to the
Other Christian group have the greatest difference in the level of attendance between those who
convert and those who retain their religious affiliation while the Anglican group has the smallest
difference. This indicates that conversion plays an important part in explaining the different
levels of attendance in these three groups.
When the Catholic group is examined it was found that converts had lower levels of
attendance in 1966 than those who retained their affiliation. In 1993 this was found to be true for
males but not for females. This indicates that the process of conversion is different for those
belonging to the Catholic group when compared to the Anglican, Uniting/Presbyterian and Other
Christian groups.
A comparison of those who had retained their affiliation and those who had converted to
a religious grouping by age showed that those who had converted maintained similar patterns of
attendance in each age group in 1966 and 1993. The greatest level of change in levels of
130

attendance occurred among those who retained their affiliation, especially among those at
younger ages who had a tendency to attend at lower levels.
A closer examination of a cohort of young people aged 18-19 in 1981 who had retained
their affiliation in the AFFP study showed that they attended much less frequently in 1991. The
analysis for those aged 20-34 in 1981 showed that their attendance levels had been maintained at
similar levels in 1991. This suggests that in the period between 1981 and 1991 there had been a
distinct change in the patterns of attendance of those in the 18-19 age group when aged over ten
years. In subsequent chapters it will be necessary to examine the factors which may show a
relationship to the lower levels of attendance in this age group.
131

6. The impact of immigration and mobility
6.1 Introduction
It is noted in chapter two that immigration has had a marked influence on the
composition of religious affiliation in the period 1966-1996. The major shift is from a migration
pattern dominated by people from the United Kingdom and Europe prior to 1971 to one where
migrants from Asian countries make up a significant proportion. What this chapter will seek to
highlight is how this change in immigration pattern may have affected the levels of weekly
attendance. As has been noted by Mol in earlier works the level of attendance rose during
periods of higher immigration to Australia in the late 19th Century. While the circumstances for
immigration in the 1966 to 1996 period might have been different it is important to trace how
immigration changes the culture of a religious group.
Bouma69 notes that there are two distinct issues that affect a migrant’s religious affiliation
and behaviour. These are:
1. Religion as a source of motivation, assistance and support provided to the migrant.
2. Religion aiding the individual migrant’s settlement and identity formation in a new
society.
Bouma70 asserts that the shift experienced by international migrants, is more
significant than other patterns of social change such as internal migration, a change of work or
change in marital status. Hughes71 adds that while many religious communities bring remarkable
diversity to the religious landscape they share common experiences of settlement in Australia.
69 Bouma, (1997) ‘Religion and the Migration Process’ in Many Religions, All Australian: Religious Settlement, Identity and Cultural Diveristy, 53 70 Bouma, (1997) ‘Religion and Identity Formation in a Multicultural Society’ in Many Religions, All Australian: Religious Settlement, Identity and Cultural Diveristy, 70
132
Gilllman72 also identifies that Australians have developed a particular form of religious culture
which is largely tribal, non-institutional and based on living by a ‘golden rule’.
Given the importance that each of these researchers place on international migration it is
important to examine the significance that a person’s place of birth may have on the level of
religious attendance. The central premise that will be tested in this chapter is that patterns of
behaviour such as religious attendance are not dependent on the migration of a person but can be
identified with their attachment to a cultural group. Thus it is likely that the more a person
identifies with a cultural group the more likely their behaviour will reflect the norms of that
group. If that cultural group strongly values religious attendance this is likely to be reflected in
patterns of higher attendance but if it does not value higher attendance it is likely to reflect lower
levels of attendance.
In seeking to test this theory three separate but connected phenomena will be examined.
The first will note the place of birth of a person and will examine differences in birthplace
composition of religious groups between 1966 and 1991 observed in the Mol and ALSS studies.
As both these studies used different criteria to examine a person’s place of birth it was decided
that the best way of comparing the two studies was to divide the place of birth into three separate
categories: those born in Australia, those born in English Speaking countries and those born in
non-English speaking countries. This has the benefit of distinguishing any difference in patterns
of weekly attendance between those from an English speaking and those from a non-English
speaking background.
The second point identified is that some differences exist in the weekly attendance levels
of those from different places of birth. These differences appeared to be more significant for
migrants from a non-English speaking background. By comparing migrants by period of current
71Hughes(1997) ‘Some Patterns in the Settlement of Religious Communities in Australiay’ in Many Religions, All Australian: Religious Settlement, Identity and Cultural Diveristy, 27
133
residence with those of non-migrants it was hoped that it would be possible to discover whether
longer periods of residency led to attendance patterns of migrants becoming similar to those of
non-migrants. This will seek to examine whether migrants become more immersed in the local
culture their level of attendance becomes more affected by that culture.
The third issue linked with the process of immigration is whether the children of
immigrants, the second-generation adopt similar patterns of attendance to the children of non-
migrants. This seeks to find whether a second-generation effect is present in explaining the
changes in religious attendance. For people from a non-English speaking background this effect
only starts to emerge in the 1991 study and it is not possible to draw conclusions as to whether
this was a phenomenon present in 1966. This is due to the fact that the children of immigrants in
this period would have only entered into the 15-24 age group in significant numbers after 1981.
6.2 The effects of place of birth and gender on level of attendance
Table 6.1 shows that the patterns of attendance appear to differ depending upon a
person’s country of birth. Males who are born in English speaking countries have the lowest
pattern of religious attendance and the level does not appear to have changed across the two
periods measured. Males who are born in non-English speaking countries record the highest
levels of religious attendance and the level also appears to remain the same in both periods of
time. Where change has occurred, it is among those males born in Australia who have a lower
level of religious attendance in 1991 than in 1966.
When the attendance levels of female migrants are examined it is possible to note that
those born in non-English speaking countries maintain similar patterns. However, females who
were born in Australia or in an English speaking country both indicate lower levels of religious
attendance in 1991 than in 1966.
72 Gillman, (1988) Many Faiths, One Nation,48
134

Table 6.1 Comparison of weekly attendance levels between 1966 and 1991 based on place of birth
% Weekly Attendance of Year
Born in Australia
Born in English
Speaking Country Overseas
Born In Non-English
Speaking Country Overseas
Males
1966 23.7 (n=440)
13.5 (n=85)
31.1 (n=158)
1991 16.3 (n=3001)
13.4 (n=459)
32.2 (n=803)
Females
1966 31.0 (n=462)
24.7 (n=98)
37.2 (n=129)
1991 20.9 (n=3492)
15.4 (n=499)
36.6 (n=842)
This poses the question as to what phenomena occurred in Australia and in English
speaking countries that led to lower levels of religious attendance while the attendance levels of
those who are born in non-English speaking countries remains unchanged. It would appear on
face value that this is not related to arguments about assimilation as it would be assumed that
those who arrive from English speaking countries would be more likely to adapt easily to local
patterns of behaviour due to a similar culture and language. However, it appears that the reverse
is true, that those born in Australia have actually adopted the lower levels of religious attendance
displayed by those born in English speaking countries. This brings with it the understanding that
patterns of lower level of attendance experienced in Australia mirrored those experienced in
other parts of the English-speaking world and were influenced by similar experiences in those
countries.
However, it appears that those born in non-English speaking countries were not
influenced by these experiences of lower attendance. It is of interest to see whether this is a result
135

of differences in language or as a result of people maintaining their cultural identity in a new
country. Although they have migrated from one country to another their continued high levels of
religious attendance may be connected to their national identity. This in turn might indicate that
their national identity and patterns of religious behaviour may be implicit parts of their religious
identity.
It can also be observed that the period between 1966 and 1991 there were two distinct
changes in the composition of those from non-English speaking backgrounds. The first, was the
shift away from those of European countries to those arriving from Asian countries. Second,
certain ethnic groups were more likely to establish particular churches based on religious and
language groups. This can be particularly noticed among the Greek, Vietnamese, Korean,
Croatian, Lebanese and Chinese communities. Other communities such as the Italian, Spanish,
German and other European countries have seen a gradual decline in the provision of religious
services for these particular communities.
6.4 Second generation effect
Table 6.2 Comparison of Weekly Attendance Levels by Place of Birth of Parents and Respondent in 1966 and 1991
Place of Birth of Respondent Place of Birth of
Both Parents Year of Study
Born in Australia Born Overseas
1966 25.4 (n=40)
22.4 (n=293)
Overseas English Speaking
Countries 1991 12.9 (n=128)
13.7 (n=874)
1966 - 33.1 (n=321)
Overseas Non-English
Speaking Countries
1991 22.6 (n=385)
35.5 (n=1588)
136

This issue of lower levels of attendance by younger people may indicate that while
assimilation does not occur among those who are first generation migrants there may a change in
the attendance patterns of their children. An examination of table 6.2 indicates that change in the
second generation is more significant in determining the patterns of attendance of children of
parents from non-English speaking countries than those from English speaking countries. This
would seem to indicate that the issue of the assimilation of patterns of behaviour related to
religious attendance maybe related English as the person’s language. While a person who is born
overseas in a non-English speaking country maintains similar patterns of attendance in 1966 and
1991 there is a significantly lower level of attendance among those who are born in Australia.
This may in part be related to the adoption of the English language by those children born in
Australia which allows them to adapt more easily to the culture of the overall population and the
prevalent attitudes towards religious attendance. However, among those from non-English
speaking cultures who were born overseas it appears that their attendance pattern remains similar
in both 1966 and 1991.
6.4 Time at current place of residence
The place of birth does appear to play a significant part in determining the pattern of
religious attendance of a person. However, what needs to be considered is whether the length of
time a person has been living at their current place of residence affects the level of attendance.
The longer people are resident in their current location the more likely they are to become
associated with the local community and adopt patterns of behaviour which are prevalent in the
place where they live. There are of course some difficulties in using such a measure. The first
would be that those with longer periods of residence are likely to be older and as has already
been seen older people are more likely to attend a religious service more frequently. The second
would be that a higher proportion of migrants from non-English speaking countries would have
137
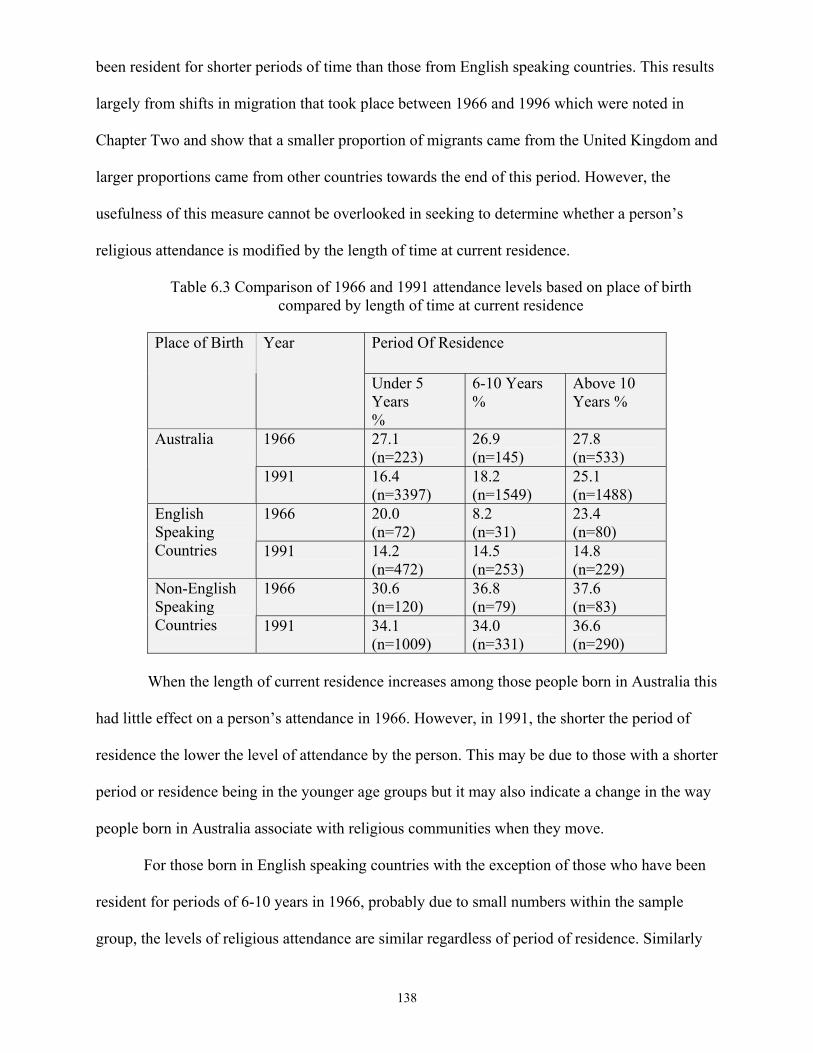
been resident for shorter periods of time than those from English speaking countries. This results
largely from shifts in migration that took place between 1966 and 1996 which were noted in
Chapter Two and show that a smaller proportion of migrants came from the United Kingdom and
larger proportions came from other countries towards the end of this period. However, the
usefulness of this measure cannot be overlooked in seeking to determine whether a person’s
religious attendance is modified by the length of time at current residence.
Table 6.3 Comparison of 1966 and 1991 attendance levels based on place of birth compared by length of time at current residence
Period Of Residence Place of Birth Year
Under 5 Years %
6-10 Years %
Above 10 Years %
1966 27.1 (n=223)
26.9 (n=145)
27.8 (n=533)
Australia
1991 16.4 (n=3397)
18.2 (n=1549)
25.1 (n=1488)
1966 20.0 (n=72)
8.2 (n=31)
23.4 (n=80)
English Speaking Countries 1991 14.2
(n=472) 14.5 (n=253)
14.8 (n=229)
1966 30.6 (n=120)
36.8 (n=79)
37.6 (n=83)
Non-English Speaking Countries 1991 34.1
(n=1009) 34.0 (n=331)
36.6 (n=290)
When the length of current residence increases among those people born in Australia this
had little effect on a person’s attendance in 1966. However, in 1991, the shorter the period of
residence the lower the level of attendance by the person. This may be due to those with a shorter
period or residence being in the younger age groups but it may also indicate a change in the way
people born in Australia associate with religious communities when they move.
For those born in English speaking countries with the exception of those who have been
resident for periods of 6-10 years in 1966, probably due to small numbers within the sample
group, the levels of religious attendance are similar regardless of period of residence. Similarly
138

in 1991 while levels of attendance are lower the change does not appear to be affected by the
period of a person’s current residence.Among those born in non-English speaking countries
longer periods of residence might seem to lead to slightly higher attendance in both 1966 and
1991. It would appear that, where changes have occurred in patterns of attendance, they have
been related to changes of behaviour among those born in English speaking countries including
Australia, but as has been noted in Chapter Five this may be due to changes in the attendance
patterns of younger people.
6.5 Summary
This analysis indicates that the impact of immigration does have an influence on issues of
cultural identity such as religious attendance.
Over the period between 1966 and 1991 there was an increasing level of congruity
between the patterns of attendance of those born in Australia and those born in other English
speaking countries. Both these groups of people have lower levels of attendance in 1991
compared to 1966. However, those born in non-English speaking countries appear to have
maintained similar patterns of attendance in both periods. It appears that children who were born
in Australia but whose parents were born in a non-English speaking country adopt levels of
attendance that are closer to those of persons born in Australia or other English speaking
countries.
A person’s length of time at their present place of residence does not appear to have a
significant impact on their level of attendance both in 1966 and 1991.
As a result of these findings it is possible to put forward the following hypothesis: That
the greater the differences in culture that exist between the country of birth and the country of
139

residence the greater the likelihood that patterns of religious attendance will be maintained as a
significant part of a person’s religious identity and practice.
140

7. Marital status
7.1 Introduction
One of the most significant demographic changes to occur in the period between 1966
and 1996 was the increase in cohabitation associated with increasing age at marriage. This can be
linked to the change to the Family Law Act in 1975 but also the emergence of de-facto
relationships that started to occur in the 1970’s. These changes can be observed in table 7.1,
which shows the significant increase in the percentage of those who are never married and those
who are divorced. There is a significant decrease in those who are married. What is hidden by
this table is those who have been divorced and remarried and those in de-facto relationships.
Table 7.1 Comparison of marital status for those over age of 15 in 1966 and 1993
1966 1993 Marital Status (in 000s) % (in 000s) %
Never Married 2145.6 26.3 4171.1 30.2 Married 5170.7 63.4 7994.6 57.8 Married but Separated 162.4 2.0 - - Divorced 94.0 1.1 803.3 5.8 Widowed 585.3 7.2 861.2 6.2 Total 8158.0 100 13830.4 100 Source: ABS Marriages 1966 &1993 Given that these changes in marital status have taken place it would be considered that
there may be a corresponding relationship to changes in patterns of religious attendance. This
can be attributed to two reasons. Most religious groups would believe that sexual relationships
between men and women should occur within marriage and that they would discourage other
forms of relationships outside of marriage such as de-facto relationships. Also they would
consider that most relationships between men and women would be monogamous and lifelong.
As a result there would be discouragements to couples to divorce or to remarry. The institution
141

may well also apply sanctions that would prevent people exhibiting such behaviours from
participating fully in the life of the religious group. As a consequence these sanctions may well
have an effect on a person’s pattern of attendance based on their marital status.
However, against this background of religious institutions promoting the importance of
marriage, greater proportions of young people remained unmarried for longer periods of time in
1996 when compared to 1966. Table 7.2 shows that a greater proportion of young women in the
20-24 and 25-29 age group delay marriage in 1996 when compared to women in the same group
in 1966. There are also indications that a higher proportion of people remain never married in the
30-34, 35-39 and 40-44 age groups in 1996 when compared to the same age groups in 1966.
Table 7.2 Percentage never married by age and sex 1966 to 1996
MALES Age Groups
1966 1976 1986 1996
15-19 98.7 98.9 99.5 99.9 20-24 70.0 66.7 83.7 90.9 25-29 29.3 25.5 45.3 61.4 30-34 16.2 13.0 22.0 34.3 35-39 12.7 9.5 12.4 20.9 40-44 10.6 8.7 9.0 13.5 45-49 9.5 8.8 7.9 9.2
FEMALES
1966 1976 1986 1996
15-19 91.8 92.7 97.6 99.3 20-24 40.3 40.1 64.4 81.2 25-29 12.2 13.1 27.8 45.1 30-34 6.8 7.0 12.7 22.6 35-39 5.6 5.1 7.0 13.8 40-44 5.4 4.5 5.1 8.9 45-49 5.9 4.6 4.4 6.1 Source: ABS Marriages 1986 & 1996
When the median age at first marriage is examined in table 7.3 it can be seen that the
longer periods of remaining unmarried have resulted in both males and females marrying at older
142

ages. This delay in marriage is of particular significance to this study of religious attendance,
because of the longer period of time that a person might not have formal contact with a religious
institution between leaving school and entering into a married relationship. This in itself may
indicate a weakening in associations between attendance and religious affiliation. This would be
more significant for those who attended schools affiliated to religious institutions. Second, there
is a greater likelihood that those who are unmarried but in a relationship with a partner are living
in a de-facto relationship.
Table 7.3 Median age at first marriage (years)
Sex 1966 1976 1986 1996
Males 23.5 23.6 25.6 27.6
Females 21.2 21.2 23.5 25.7
Source: ABS Marriages 1986 and 1996
What is of particular interest in this thesis is whether the change over time in patterns of
attendance is affected by changes in marital status, This chapter will concentrate on three
significant issues related to people’s relationships. The first is the question of whether a person’s
marital status affects his/her pattern of religious attendance. The second is whether a person’s
change in marital status affects his/her pattern of religious attendance. The third is whether a
partner’s religious affiliation affects the person’s pattern of religious attendance. These issues
will examined in order to test two hypothesis:
1. That marriage and religious attendance are mutually supportive of each other.
2. That partners from the same affiliation are more likely to attend religious services.
As can be seen in table 7.4 a greater proportion of those married in 1992 indicated that
they lived at the same address as the person they were marrying. This is significantly different
143
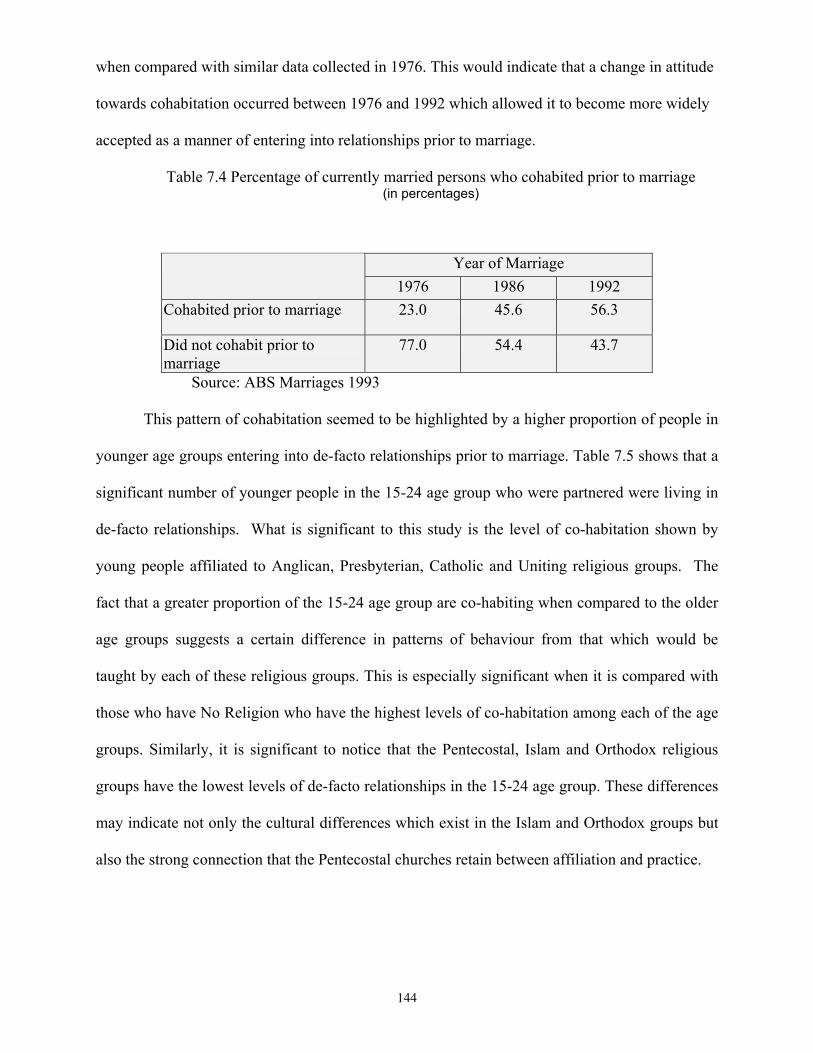
when compared with similar data collected in 1976. This would indicate that a change in attitude
towards cohabitation occurred between 1976 and 1992 which allowed it to become more widely
accepted as a manner of entering into relationships prior to marriage.
Table 7.4 Percentage of currently married persons who cohabited prior to marriage (in percentages)
Year of Marriage 1976 1986 1992
Cohabited prior to marriage 23.0 45.6 56.3
Did not cohabit prior to marriage
77.0 54.4 43.7
Source: ABS Marriages 1993
This pattern of cohabitation seemed to be highlighted by a higher proportion of people in
younger age groups entering into de-facto relationships prior to marriage. Table 7.5 shows that a
significant number of younger people in the 15-24 age group who were partnered were living in
de-facto relationships. What is significant to this study is the level of co-habitation shown by
young people affiliated to Anglican, Presbyterian, Catholic and Uniting religious groups. The
fact that a greater proportion of the 15-24 age group are co-habiting when compared to the older
age groups suggests a certain difference in patterns of behaviour from that which would be
taught by each of these religious groups. This is especially significant when it is compared with
those who have No Religion who have the highest levels of co-habitation among each of the age
groups. Similarly, it is significant to notice that the Pentecostal, Islam and Orthodox religious
groups have the lowest levels of de-facto relationships in the 15-24 age group. These differences
may indicate not only the cultural differences which exist in the Islam and Orthodox groups but
also the strong connection that the Pentecostal churches retain between affiliation and practice.
144

Table 7.5 Proportion of population aged 15-44 in couple relationships who were in de facto relationships in 1991
(in percentages)
Age Groups Religious Group 15-24 25-34 35-44
No Religion 58.0 22.1 11.4 Anglican 47.8 14.7 6.8 Presbyterian and Reformed 45.2 14.4 6.9 Salvation Army 38.1 11.9 6.4 Catholic 37.8 11.3 5.2 Uniting Church 37.6 9.3 4.3 Lutheran 36.8 11.9 5.7 Judaism 35.0 9.8 4.6 Baptist 26.8 7.5 3.8 Seventh Day Adventist 23.9 7.7 3.6 Buddhism 22.1 7.5 4.3 Churches of Christ 21.0 6.6 3.7 Hinduism 12.3 4.7 2.5 Pentecostal 10.7 3.0 1.7 Orthodox 9.0 4.0 2.1 Islam 4.9 2.9 1.8 Total Australia 41.3 13.3 6.4 Source: ABS, Social Trends 1994 p188
The Australian Bureau of Statistics 1994 Social Trends also showed in table 7.6 that
people who are married to their partner are more likely to have the same religious identity as
their partner than those living in a de-facto relationship. This would suggest that the sharing of
affiliation may be a strong determining factor in how people form relationships with each other.
As a consequence the pattern of a person’s religious attendance might also be affected by the
nature of their relationship.
145

Table 7.6 1991 Proportion of partners with same affiliation (in percentages)
Marital Status Religious Group
Married De Facto Catholic 67.9 39.8 Anglican 65.3 47.9 Presbyterian and Reformed 45.9 19.5 Uniting Church 64.0 28.2 Orthodox 87.3 39.5 Baptist 66.7 19.3 Churches of Christ 73.1 25.6 Lutheran 59.4 19.8 Pentecostal 88.5 45.0 Salvation Army 58.8 13.2 Seventh Day Adventist 80.3 32.2 Total Australia 68.9 49.0 Source: ABS Social Trends 1994, p188 Lastly, it appears that there has been a change in the proportion of marriages conducted
by religious celebrants. What can be seen is that while the majority of marriages in 1996 were
still conducted by religious celebrants, a significant proportion were conducted by civil
celebrants. Part of this may as a result of those seeking to be remarried after divorce not being
allowed to marry according to Christian rites but it may also indicate a significant proportion of
younger people choosing not to be married by religious celebrants.
Table 7.7 Percentage of marriages by ministers of religion and civil celebrants
1966 1976 1986 1996
Ministers of Religion 89.2 71.1 59.5 53.2
Civil Celebrants 10.8 38.9 40.5 46.8
Source: ABS Marriages 1996
146
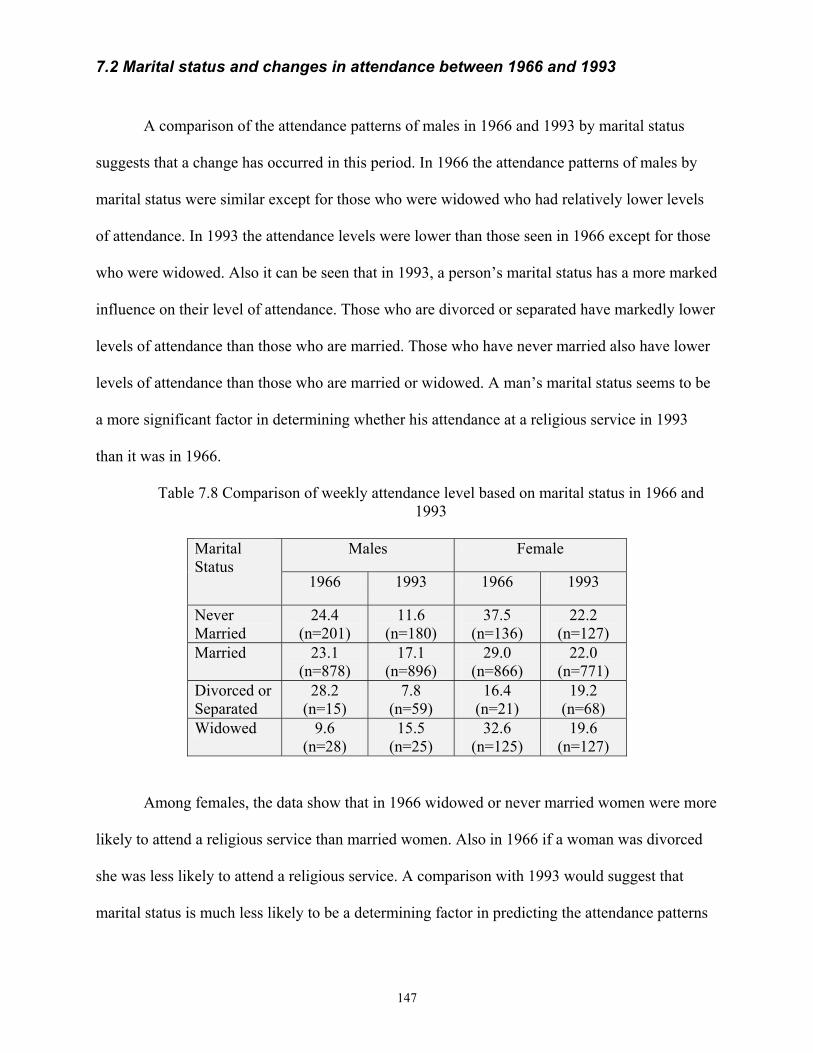
7.2 Marital status and changes in attendance between 1966 and 1993
A comparison of the attendance patterns of males in 1966 and 1993 by marital status
suggests that a change has occurred in this period. In 1966 the attendance patterns of males by
marital status were similar except for those who were widowed who had relatively lower levels
of attendance. In 1993 the attendance levels were lower than those seen in 1966 except for those
who were widowed. Also it can be seen that in 1993, a person’s marital status has a more marked
influence on their level of attendance. Those who are divorced or separated have markedly lower
levels of attendance than those who are married. Those who have never married also have lower
levels of attendance than those who are married or widowed. A man’s marital status seems to be
a more significant factor in determining whether his attendance at a religious service in 1993
than it was in 1966.
Table 7.8 Comparison of weekly attendance level based on marital status in 1966 and 1993
Males Female Marital
Status 1966 1993 1966 1993
Never Married
24.4 (n=201)
11.6 (n=180)
37.5 (n=136)
22.2 (n=127)
Married 23.1 (n=878)
17.1 (n=896)
29.0 (n=866)
22.0 (n=771)
Divorced or Separated
28.2 (n=15)
7.8 (n=59)
16.4 (n=21)
19.2 (n=68)
Widowed 9.6 (n=28)
15.5 (n=25)
32.6 (n=125)
19.6 (n=127)
Among females, the data show that in 1966 widowed or never married women were more
likely to attend a religious service than married women. Also in 1966 if a woman was divorced
she was less likely to attend a religious service. A comparison with 1993 would suggest that
marital status is much less likely to be a determining factor in predicting the attendance patterns
147

of women. It can also be seen that in 1993 the attendance levels of women are much lower than
in 1966 with the exception of those who are divorced or separated, which is slightly higher.
Thus in addition to other influences which have led to lower levels of attendance in 1993
than in 1966, marital status is more likely to affect the level of male attendance than that of
females in 1993. This leads us to consider whether a person’s marital status actually determines
the pattern of a person’s religious attendance or whether it is a person’s religious attendance
which determines their marital status.
7.3 The effects of changes in marital status on attendance
The longitudinal nature of the AFFP data used made it possible to compare the
attendance patterns of those who changed their marital status with those who did not. Table 7.9
shows that those who were married or never married in 1981 and had the same marital status in
1991 maintained similar levels of attendance in both periods, with married men having higher
levels of attendance than men who had never married. Among females the reverse can be seen
with the attendance of women who had never been married being a little higher in 1981 than it
was for married women. In 1991, the levels of attendance of married women and women who
had never been married were almost the same. This can also be seen by the group of men and
women who move from being never married to married retaining very similar patterns of
attendance. It appears that in this case it could be assumed that marriage has the effect of
maintaining attendance patterns already established.
148

Table 7.9 Comparison of weekly attendance levels in 1981 and 1991 AFFP Study based on change in marital status of those belonging to Christian Groups
Male Female N Marital Status 1981-1991 Stage 1
% Stage 2
% Stage 1
% Stage 2
% Males Females
Never Married 16.8 18.7 28.1 24.6 80 61
Married 18.4 22.3 24.0 25.3 219 397
Never Married-Defacto 11.8 7.1 14.1 12.5 57 39
Never Married-Married 21.8 22.2 23.0 20.0 163 143
De facto-Married 1.9 15.7 2.1 0.2 19 14
Married-Post Marriage 23.6 1.1 15.7 19.6 26 61
However, it is significant to note that there are three groups where attendance declines or
remains distinctly lower than among married and never married people. The first group, are those
who are never married who enter into a de-facto relationship with a partner. Here it can be seen
that the level of attendance is lower in 1981 when compared with the group who were never
married for both periods. This would suggest that they already have a pattern of lower attendance
prior to their decision to enter into a de-facto relationship. It is also observed that the attendance
of males and females declines moderately for this group in the period between 1981 and 1991.
This decline is greater among males than among females. This would indicate that where young
people enter into a relationship of living together there is a small adverse effect on levels of
attendance.
Among the group who move from a de-facto relationship to marriage it is observed that
attendance of males increases to a level similar to that of males who moved from a state of never
married to a de-facto relationship. However, it is seen that the attendance of the females remains
very low. Part of the difficulty in coming to conclusions based on this group is its small size
149
within the total sample. Also those moving from a de-facto relationship to a married relationship
retain relatively lower levels of attendance. What this suggests is that while de-facto
relationships may act as a prelude to a future married relationship they do appear to break the
connection between marriage and regular attendance at a religious service.
When the third group is examined there is a distinct difference in the attendance patterns
of men and women who move from being married to being separated, divorced or widowed.
Among males it is observed that there is a movement from attendance similar to that of all
married people to patterns of very low attendance after they are separated, divorced or widowed.
This would seem to indicate, as was mentioned earlier, that for men a separation from a lifelong
partner also seems to separate them from regular attendance at a religious service. This may
indicate a distinct characteristic of how males deal with marital separation that distances them
from a religious institution as they seek to come to terms with that separation. However, among
females it appears that a marital separation increases their attendance. The reasons for this are
not clear. It would have been expected that marriage would increase the levels of attendance
while marital separation would decrease attendance. While this may be due to the small nature of
the sample it is an issue worthy of further research.
7.4 Partner’s affiliation and patterns of attendance
One of the observations that flows from the previous section is that the status of a
person’s relationship with a significant other can affect their level of attendance. When a person
in that relationship has a different religious affiliation from his/her partner, this may also lower
the level of religious attendance. Table 7.10 compares attendance in 1981 and 1991 based on the
compatibility of a respondent’s affiliation in 1981 with that of their partner in 1981 and 1991.
This examines the changing patterns of attendance based on the similarity or difference in a
150
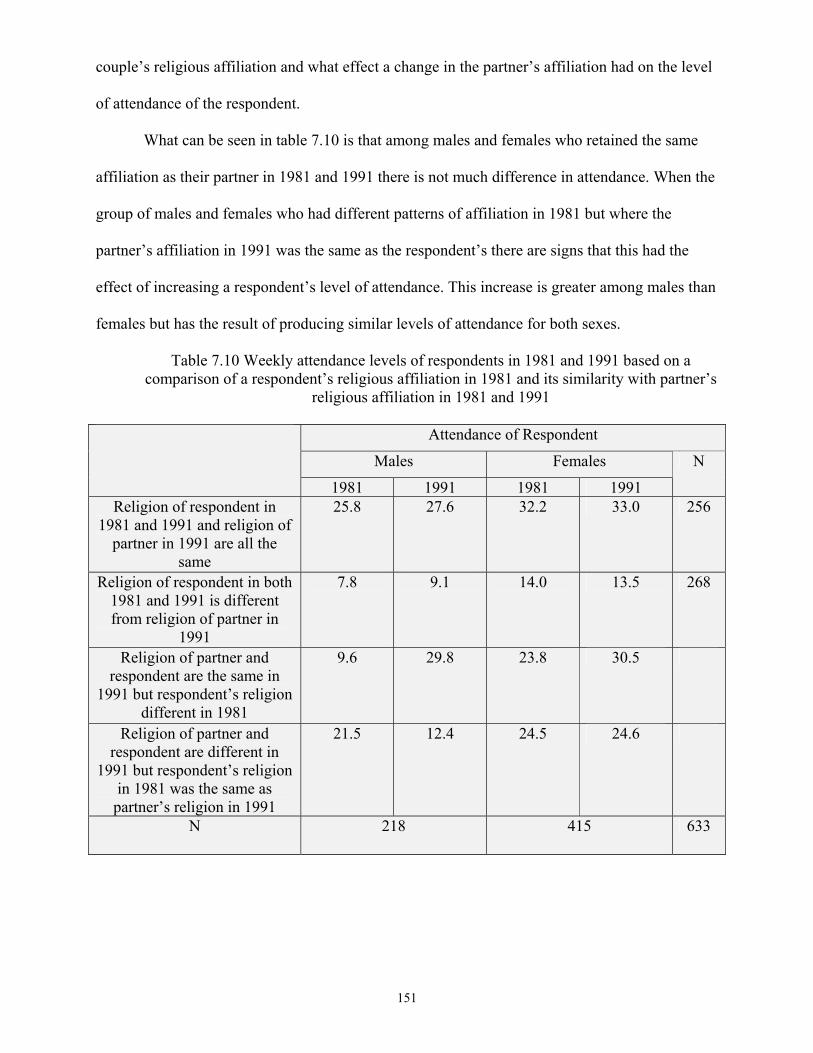
couple’s religious affiliation and what effect a change in the partner’s affiliation had on the level
of attendance of the respondent.
What can be seen in table 7.10 is that among males and females who retained the same
affiliation as their partner in 1981 and 1991 there is not much difference in attendance. When the
group of males and females who had different patterns of affiliation in 1981 but where the
partner’s affiliation in 1991 was the same as the respondent’s there are signs that this had the
effect of increasing a respondent’s level of attendance. This increase is greater among males than
females but has the result of producing similar levels of attendance for both sexes.
Table 7.10 Weekly attendance levels of respondents in 1981 and 1991 based on a comparison of a respondent’s religious affiliation in 1981 and its similarity with partner’s
religious affiliation in 1981 and 1991
Attendance of Respondent
Males Females
1981 1991 1981 1991
N
Religion of respondent in 1981 and 1991 and religion of
partner in 1991 are all the same
25.8 27.6 32.2 33.0 256
Religion of respondent in both 1981 and 1991 is different from religion of partner in
1991
7.8 9.1 14.0 13.5 268
Religion of partner and respondent are the same in
1991 but respondent’s religion different in 1981
9.6 29.8 23.8 83
Religion of partner and respondent are different in
1991 but respondent’s religion in 1981 was the same as partner’s religion in 1991
21.5 12.4 24.5 26
N 218 415 633
30.5
24.6
151
When this situation is reversed and the partner’s religious affiliation in 1991 was similar
to the respondent’s affiliation in 1981 but different in 1991 the level of attendance among males
drops to similar levels as those males who had different affiliations from their partners in 1981
and those males who had different affiliations than their partners in both periods. However,
among females where the partner’s affiliation in 1991 is something different from the respondent
but was the same in 1981 this does not lower the attendance of the respondent. Also where
females partner’s affiliation differs from that of the respondents in both periods the level of
attendance remains at similar low levels.
This comparison would indicate that a woman’s pattern of attendance is not influenced
by the religious affiliation of her partner. However, a man’s pattern of attendance is influenced
by the religious affiliation of his partner. Where the religious affiliation is the same there are
indications that both men and women have very similar patterns of attendance. However, where
religious affiliations are different men’s attendance will be much lower. This again indicates that
men’s attendance is more influenced by the affiliation of their partner. It may also indicate that
women have a greater influence in maintaining higher levels of attendance where affiliations of a
partner are similar.
7.5 Summary There is a strong connection between a person’s marital status and their pattern of
religious attendance. It is clear that the levels of attendance are much lower among those who
enter into de-facto relationships, among males and females who are divorced and remarried, and
among those couples who maintain different patterns of affiliation.
This would suggest that three factors are at work. The first appears to be that males are
more likely to stop attending when they are divorced or remarried. The second is that people who
enter into de-facto relationships are more likely to be separated from a religious institution which
152

would consider marriage as the norm for relationships between males and females. Lastly, a
difference in belief between partners leads to lower levels of attendance especially among males.
This allows a modification of the hypothesis that were put forward at the beginning of
this chapter.
1. That marriage between partners with the same religious affiliation is likely to result in
the maintenance of a person’s religious attendance patterns.
2. That marriage between partners with different religious affiliations is likely to result
in a decline of the person’s religious attendance patterns.
3. Lower levels of religious attendance are more likely to occur with a person’s decision
to enter into a de-facto relationship.
4. Lower levels of male and female religious attendance are more likely to follow a
relationship breakdown.
These hypotheses in turn would suggest that there is a strong nexus between a person’s
religious affiliation and their manner of forming relationships. Where either of these patterns
experience a process of transition this will result in a change in the pattern of a person’s religious
attendance. Where two people who are in relationship share the same religious affiliation this is
more likely to be reflected in higher levels of religious attendance. Where two people who are in
relationship have different religious affiliations, this is likely to lead to lower levels of
attendance. Also where a couple’s marital status is different from that promoted by the religious
group to which they belong this also is likely to lead to lower levels of attendance. As a result it
can be concluded that in a period in which there have higher levels of divorce and de-facto
relationships these may be significant contributing factors in explaining lower levels of religious
attendance.
153
8. A case study of attendance levels and institutional
changes to the Catholic Church in the Australian Capital
Territory
8.1 Introduction
The previous chapters have shown that the period between 1966 and 1996 was one of
significant change in the patterns of religious attendance, particularly for the Catholic religious
group. While it has been possible to highlight some of the demographic characteristics of these
changing patterns, it is also important to note that this was a period in which changes occurred in
the institutional characteristics of Sunday worship within the Catholic church. This study would
not be complete without an examination of these changes.
This chapter discusses the changes to the celebration of Sunday liturgy that have taken
place within the Catholic Church between 1966 and 1996. Some of these changes to the liturgy
occurred as a result of the Second Vatican Council that was held between 1963 and 1965, but it
would be wrong to conclude that changes had not been made to the liturgical celebration prior to
the calling of the council as part of liturgical reform.
It is also relevent to examine how these changes affect the celebration of the Sunday
liturgy in a case study of parishes within a particular region. This case study examines at what
stages the attending population changed in relation to the overall Catholic population. In
particular it will examine the changes in levels of attendance related to the number of masses
154
offered, number of priests available to celebrate masses and changes in the times of celebration.
The Australian Capital Territory was chosen for a number of reasons:
1. The availability of data within the Archdiocese of Canberra and Goulburn archives
2. The ability to collate and compare data collected with that collected by the Australian
Bureau of Statistics.
3. The transformation of the region from a small city to a larger city.
4. The diverse mix of ethnic, social and cultural groups in the population.
8.2 Liturgical changes
In the document, Sacrosanctum Concilium it was stated that in order to increase the
vigour of the Christian life of the faithful, it was necessary:
“to adapt more closely to the needs of our age those institutions which are subject to change; to foster whatever can promote union among all who believe in Christ ; to strengthen whatever can help to call all people into the Church’s fold.”73 It was in the light of this document that many of the other liturgical changes occurred.
Probably the most significant of these were:
1. The introduction of the vernacular into the liturgy
2. The introduction of changes to the liturgical calendar
3. The change to the architectural design of Churches
4. The introduction of acolyte, lector and special minister of the eucharist as non-clerical
roles which could be undertaken by lay people.
5. The reception of communion in the hand.
6. The celebration of communion under both kinds.
7. The permission for priests to concelebrate mass.
8. The introduction of the vigil on the Saturday night prior to a Sunday celebration.
155

9. Revision of Sacramental rites.
10. The shortening the Eucharistic fast from three hours to one hour.
11. The celebration of the sign of peace allowing physical contact between people in
Church.
Most of these changes occurred between 1966 and 1975 but were
recognised as part of the sacramental life of the Church in the Code of Canon Law that was
published in 1983. This would indicate that any changes to attendance patterns occurring as a
result of institutional reform to the liturgy would be most likely to be reflected in the ten-year
period from 1966 to 1976. This would mean that changes to attendance patterns subsequent to
1976 could not be directly linked to people’s responses to institutional changes in the liturgical
celebration on a Sunday.
8.3 Changes in the celebration of Mass on Sundays
An examination of table 8.1 shows that the percentage of those who are Catholic in the
ACT population is larger than the national average. It can also be noted that over the thirty-year
period those who are Catholic form a smaller percentage of the ACT community in 1996 than
they did in 1966. Their representation in 1996 is much closer to the national average. The fall in
the Catholic proportion may be due to lower proportions of Catholics migrating to the ACT in
the period following 1966 or at least greater proportions of Catholics leaving rather than entering
the territory when compared to the total population who migrated to the ACT. It may also
indicate that some Catholics may have changed their affiliation away from the Catholic religious
grouping during this time period.
73 Flannery(ed.) (1975) ‘Sacrosanctum Concilium’, in Vatican II, Conciliar and Post Conciliar Documents,§1, 1
156

Table 8.1 Catholic population in the Australian Capital Territory between 1966 and 1996
1966 1976 1986 1996 Catholic 31295 61415 75021 88672 Total Population 96013 197623 249047 299243 Percentage Catholic in ACT 32.6% 31.1% 30.1% 29.6% Percentage Catholic Australia 26.3% 25.7% 26.1% 27.0%
Source: The Archives of the Catholic Archdiocese of Canberra and Goulburn In table 8.2 it is observed that while there was an initial increase in the total number of
Sunday services between 1966 and 1976 to cater for the growing population, this did not
continue into the later part of the period. In 1986 there was a significant decline in the number of
masses offered while in 1996 this had increased slightly. The number of Catholics per mass
celebrated increased substantially between 1976 and 1986 .
However, not only has the total Catholic population attending declined since 1976 but
also the average number of those attending each Sunday service is smaller in 1996 than in 1966.
Hence, if more services had been provided, there would have been smaller congregations at each
of the services.
Table 8.2 Catholic population by masses in the Australian Capital Territory between 1966 and 1996
1966 1976 1986 1996
Catholic Population 31295 61415 75021 88672 Masses 52 93 73 82 Catholic Population Per Mass 601.8 660.4 1028.7 1081.3 Attendance 16659 27265 18476 14536 Percentage Catholic Attendance
53.2% 44.3% 22.7% 16.3%
Average Number attending each mass
320 293 253 177
Source: The Archives of the Catholic Archdiocese of Canberra and Goulburn
What can also be seen is that the decline in attendance over the whole period appears to
have happened in three stages. There was a moderate decline between 1966 and 1976, a more
157

dramatic decline between 1976 and 1986 then another moderate decline between 1986 and 1996.
There are signs that since 1996 the level of attendance has remained about the same. When this
pattern of decline in attendance is observed against the period of liturgical change following the
Vatican Council it is possible that this may have led to some decline in levels of attendance
during the 1966-1976 time period. However, it would be more difficult to extend a direct link
between these changes and subsequent declines in attendance to the 1976-1986 time period.
This would tend to indicate that the later changes in attendance might be due to other factors.
Thus if institutional factors played a part in the decline in levels of attendance it would be
important to examine the period between 1976 and 1986 more closely. This can be seen not only
through the evidence in this case study but also the information, which was provided in the
longitudinal survey, the Australian Family Formation Project. This survey highlighted that two
factors combined together to explain lower levels of attendance between 1981 and 1991. The
first was the lower percentages of young people attending religious services. The second was that
changes in marital status also led to a decline in attendance levels because those who were
divorced and those who entered into de-facto relationships had much lower attendance rates.
This would tend to indicate that there were two substantially different periods of change
that affected the levels of Church attendance. The first decline between 1966 and 1976 occured
at a time of great transition within the Catholic Church initiated by the Second Vatican Council.
This also occurred in a period when people tended to question their individual allegiance to an
institutional form of religion. This period can been seen to be highlighted by high levels of
disaffiliation from institutional forms of religion and moderate declines in patterns of attendance.
The period between 1976 and 1986 seems to be led by a transition in the patterns of relationship
that individuals enter into and the way this affects their religious behaviour. This period was
marked by more moderate levels of disaffiliation and greater levels of decline in patterns of
attendance. This would tend to indicate that while the Second Vatican Council might have
158

highlighted a broadening of people’s questioning of religious beliefs, the second transition
between 1976-1986 might highlight a divergence between the beliefs held by the institution and
the beliefs of the individual.
Table 8.3 Change in distribution of masses in Canberra between 1966 and 1996
Saturday Night Vigil
Early Morning 6am-8am
Mid Morning
8am-10am
Late Morning 10am-12noon
Sunday Evening
Total Masses
1966 0 13 25%
16 31%
11 21%
12 23%
52
1976 15 16%
5 5%
28 30%
23 25%
22 24%
93
1986 16 22%
2 3%
24 33%
20 27%
11 15%
73
1996 20 24%
0 27 33%
21 26%
14 17%
82
Source: The Archives of the Catholic Archdiocese of Canberra and Goulburn Lastly, as shown in table 8.3 there was an institutional change away from services
occurring exclusively on a Sunday to the possibility of attending the equivalent of a Sunday
service on a Saturday night. This change in itself allowed the possibility of people attending at a
time that extended over a greater portion of the weekend than exclusively on one day. While this
change was enabled through a reflection within the Catholic tradition that was based on the
Jewish custom of the celebration of the Sabbath extending from sunset on one day to the sunset
on another it is not clear that this same mindset would be present within the Catholic population
as a whole. What is evident is that with the provision of services on a Saturday night this would
tend to change peoples attitudes to Sunday observance. As a result the observance of religious
practice might be extended beyond the Sunday even if that was not the intention of the provision
of the Saturday Night vigil masses. This weakening of links between Sunday observance and the
159
attendance at a Sunday service would need to be examined more closely to observe whether this
would have changed the pattern of attendance.
8.4 Changes in the number of diocesan priests available to lead Sunday celebrations
One of the areas which is often overlooked in the changes to the observance of Sunday
liturgies is the availability of priests to celebrate the Sunday mass. What has been observed over
the period subsequent to 1966 is a decline in vocations to the religious way of life. In observing
these changes it is apparent that while there has been a rapid decline in those called to religious
communities especially among women the same decline is not as apparent among diocesan
clergy. While similar numbers of clergy are present in 1996 as were present in 1966, the average
age of priests has risen from 46.5 years to 57.5 years. This ageing of the clergy is partially due to
three factors, the lower levels of vocations of young people, a greater number of people entering
religious life at later stages of life, and the ageing of those who entered in the 1960’s, a period
during which a significant number of these priests were ordained. This ageing process may
explain part of the gap that exists between priests celebrating mass and the number of young
people attending religious services. It might also indicate a change in the attitudes of young
people towards the celebration of religious services. Thus fewer young people are willing to lead
these services because they are not attending themselves.
What is apparent from table 8.4 is that while the levels of attendance might indicate that a
smaller proportion of Catholics are attending Sunday services on a regular basis the number of
priests available to lead those who do attend appears sufficient. This suggests that there is a
nexus between the number of priests available to lead a religious service and the actual numbers
of Catholics attending service. What can be seen in table 8.4 is that while the number of priests
has remained similar over the period the number of Catholics attending religious services per
160

priest has also remained constant over that period except in 1976 when the number of Catholics
attending services per priest was significantly higher. This may suggest that there is a close
connection between the change in levels of attendance and the number of priests available to
celebrate and lead services. Thus a decline in the number of priests able to lead Sunday worship
may also be associated with a decline in the total numbers attending. This would suggest that
there is a finite number of people whom a priest can lead within Sunday worship and still
maintain a sense of closeness and involvement with the community. This brings with it two
observations. First, religious attendance is reliant on the provision of priests available to lead
services rather than the number of services provided. This would indicate that greater provision
of services will not automatically lead to larger numbers of people attending. The second is that
rises in levels of attendance may lead to increases in the number of people willing to offer to lead
those services.
This could well indicate that the number of people who wish to become priests may be as
valuable an indicator of those wishing to attend services as the actual numbers attending
services. If there was an increase in vocations among Diocesan priests it would suggest that there
is an active involvement and engagement of people with the Sunday celebration. This would not
be surprising as a causal link between attendance at Sunday worship and the desire to lead that
celebration would be expected. As a result this is one area over which local pastors do have an
influence by providing liturgies that engage and encourage people to attend a Sunday service.
However, the degree of influence will be mitigated by the fact that one priest only has the ability
to care pastorally for a finite number of people regularly attending a Sunday service. While he
may cater for the provision of the basic sacramental needs of all those who identify themselves
as Catholic he is only able to provide a regular Sunday service for those with whom he has a
regular relationship on a Sunday.
161

Table 8.4 Change in number of priests in Canberra between 1966 and 1996
1966 1976 1986 1996
Parishes 10 18 24 20
Diocesan Priests 31 38 35 28
Masses 52 93 73 82
Catholic Population per priest
1009 1616 2143 3167
Mass Attending Population per priest
537 717 527 519
Number of Masses celebrated by each priest
1.7 2.4 2.1 2.9
Source: The Archives of the Catholic Archdiocese of Canberra and Goulburn
There are also certain factors over which the priest would have no control. These would
include the changing number of Catholics within a district and their varying characteristics.
While these issues would affect the number attending they are not issues over which he would
have direct influence. These issues would be affected by the provision and location of parishes
in response to the number of Catholics living in an area and the number of people to whom the
priest ministers.
162

8.5 Conclusions
The case study mirrors the findings of the surveys that have been analysed as part of this
thesis. It points to a marked decline in the level of attendance between 1966 and 1996 and that a
large part of this decline occurred in the period between 1976 and 1986. Where the decline
coincided with Second Vatican Council this may mirror peoples concerns with disaffection from
institutionalised religion. However, the larger part of the decline in attendance seems to occur in
a period in which these institutional changes may have had a more marginal impact on people’s
decisions to attend and issues of personal relationships assume a greater importance in
influencing a person’s attendance patterns.
It would also appear that there has been a change in the culture of attendance both in the
provision and style of services and the importance placed on Sunday attendance. Thus Sunday is
not the only day on which people would have been willing to attend a Church service and this
may have changed people’s attitudes towards regular attendance. Linked with the smaller
number of priests available to celebrate Sunday services there may have been a similar decline in
the number of people attending. This would seem to stress the important personal association
between people participating in a service and the person leading the service. This might in itself
make it imperative for priests to be allocated not solely on the demographic distribution of the
Catholic population but also on the basis of the culture and needs of the congregation that he will
serve. If a priest is to serve the people he also needs to understand the culture in which he leads
worship and feels at home in that culture.
163

9. Conclusion
9.1 The measurement of religious affiliation and weekly attendance One of the obvious issues in any study of religious affiliation and weekly religious
attendance is the need to arrive at good definitions of the terms that are used. Thus in most
common usage religious attendance would be defined as the attendance by a person at a formal
place of worship on a particular day. This definition would identify religious attendance as that
which conforms with the model put forward as acceptable by the religious institution to which a
person belongs. This can cause difficulties when a person’s definition of religious attendance
may differ from that of the religious institution. It is important, therefore, when it comes to the
conclusion of this study that these issues are addressed so that they may be used to refine the
study of religious attendance in the future.
The first issue which was identified by Smith74 is to determine what an institution means
by a religious service and principal day of worship which may differ from what a person
understands by referring to those same terms. This is no easy task as different religious groups
would place different degrees of importance on the frequency and nature of such services.
Within Christian churches it would be commonly assumed that Sunday would be considered to
be the principal day of worship. However, it is clear also that the priorities placed by each
Christian church on the celebration of services on a Sunday show that this importance can vary.
Within the Catholic Church there is a tendency to stress that the obligation to attend on
Sundays and days of Holy Obligation is the expected norm for each Catholic. However, over the
years there has been the development of the pastoral practice that this obligation can be mitigated
due to issues of sickness, care of a sick relative, travel, work obligations and by permission of the
164
pastor. Also there has been a trend to the provision of vigil masses on a Saturday evening which
have been counted as fulfilling a person’s Sunday obligation.
Within the Anglican and Protestant traditions the stress on Sunday Obligation has been
placed in a more biblical context but there is also a tendency to place stresses on particular
services. Thus among some churches within this group there is a tendency to stress the principal
soleminities of Christmas and Easter as being the principal signs of Christian faith. Among
others within these traditions there is a tendency to stress regular attendance on each Sunday as a
sign of common fellowship.
When Other Religions are encountered it can be seen that the degree of attendance can
also depend on the level of stress that is placed on regular attendance by a religious group in
general and by sections of a religious group in particular. Thus among Orthodox Jewish groups
there would be a particular stress on regular Saturday attendance at Synagogue and by Orthodox
Muslims the attendance at communal prayers on a Friday. Among less Orthodox members of
these two groups there would be a tendency to stress the feasts such as ‘Yom Kippur’, ‘Rosh
Hashanah’, “Pesach’ and ‘Hannakah’ as signs of faith for Jewish groups and ‘ eid al fitr’ at the
end of ‘Ramadan’ and seventy days later ‘eid al adhah’ for the followers of Islam. Among the
Buddhist and Hindu faiths the stress is placed on personal devotions and practices. However,
among the Buddhist community the feast of “Vesak’ would have special significance. Among
the Hindu faith there is no such single feast which would be considered the most important but
several significant occasions are celebrated during the year such as ‘Rama-navami’, ‘Kishna-
janmastami’, Raksha-bandhan’ and ‘Nava-Varsha’.
When the individual is asked what they mean by attending a religious service this may be
as specific as the term used by the religious institution or it may be more general in character. As
74 Smith(1998), ‘A Review of Church Attendance Measures’ in American Sociological Review, Volume 63, February 131-136
165

a result it may be possible for people to say that they have attended a religious service during the
last seven days when what they mean is that they attended a wedding, funeral or baptism of a
family member or a friend. It may also mean that they attended a religious service on a day
which was not considered the principal day of worship of the affiliation to which they belong.
Lastly, it may also refer to alternatives to attendance at a formal place of worship either by
watching a service on television or at a place where religious services would be conducted
outside the normal constraints of a religious institution.
It is realised that this study has used a strict definition of religious attendance which is
based on the Christian model of attendance, that a person of a Christian Affiliation will attend a
formal place of worship to fulfil their Sunday Obligation. As with all models this is restrictive if
it was to be used as a comparison with other religious groups and was part of the reason why an
extensive study of non-Christian groups was not undertaken. If a broader measure of attendance
was to be used it would probably be more appropriate to gain attendance figures on a particular
feast day such as Christmas or Easter. Given that there is some evidence that patterns of
attendance have changed, a measurement of attendance on principal feast days may give a better
understanding and comparison between religious groups which stress different levels of
institutional attendance. Thus while weekly attendance may be a measure of conformity to the
level of attendance expected by an Christian institution, attendance at a principal feast may be a
better sign for measurement of personal faith and association with a religious affiliation.
9.2 Changes in patterns of religious attendance and affiliation
It is realised that in the study of weekly attendance at religious services there are
associated issues which relate to a person’s affiliation history. As such it is necessary to see that
the movement in charting changing patterns of attendance is not as simple as stating that a person
166

does or does not attend a religious service. What becomes evident is that there are at least six
movements which can explain a person changing the level of attendance.
The Apostotic movement notes that people who move from a pattern of affiliation to non
affiliation no longer attend religious services. The one exception appears to be that they may on
the rare occasion attend a religious service such as a funeral, wedding or baptism. However, it
appears that the movement towards non-affiliation can be predicted by low levels of attendance
prior to that decision being made.
The Spiritualisation Movement, however, sees that the reverse movement from No
Religion to a religious group leads to patterns of nominal attendance. The fact that this
movement was only identified within the longitudinal study conducted as part of the Australian
Family Formation Project may suggest two things. The first is that this movement is a counter
force to that shown by the Apostotic movement and it involves the return of people to a religious
group who previously classified themselves as having no religion. Their return from a period of
suspension of religious identity would see them adopt patterns of nominal attendance. The
second is the movement of people to a religious group who have never belonged to a religious
group and this may lead to nominal levels of attendance among those who have not been raised
in a household where regular attendance is considered normative.
When issues of changing levels of attendance within religious groups are examined there
is a movement towards lower levels of attendance, known as lapsation. Here people who retain
their affiliation but view religion as less important in their lives are more likely to have lower
levels of attendance. The contrasting movement which occurs among those who move from one
religious affiliation to another, a process known as Conversion, sees mild levels of consolidation
and most likely the transfer of attendance patterns from one religious group to another.
Finally, movements of attendance also appear to reflect issues which are not related
directly to religious identity and are probably due to social, economic and demographic change.
167

Thus the group of respondents who had retained their religious affiliation for the whole of the
survey period were isolated in order to examine changes. It is pertinent to note that this
movement appear to be related to differences in the life cycle. Thus the partial lapsation of
people in younger age groups appears to detect a movement from regular attendance to more
periodic attendance. The corresponding movement notes that among people in older ages
groups, particularly females there is tendency to higher levels of attendance.
The significance of these movements should not be overlooked and has been identified in
other research by Kaldor , Bellamy, Powell, Castle and Hughes as newcomers, stayers, switchers
in, switchers out and drifters75 This study is significant to the extent that it identifies the
proportional representation of each movements as present within each religious group. It is,
however, evident that these groups may also maintain different patterns of attendance. This may
also be linked with Hughes and Blombery’s work on patterns of faith which shows that different
faith patterns result in different levels of attendance76. These are Conversionism, Devotionalism,
Conventionalism and Prinicipalism. Also Currie, Gilbert and Horsley highlight five stages of
institutional growth and decline; depression, activism, revival, deactivation and declension77.
What seems apparent is that these give possible explanations about how religious movements
affect both the level of affiliation of religious groups and the level of attendance. They
concentrate on three points. The first examines the extent to which the worship style and the
theological emphasis of a particular religious group can place an emphasis on regular attendance.
Here it can be seen that if more emphasis is placed on the worship of the community then
attendance will be higher compared to a religious group which emphasises the formation of
75 Kaldor, Bellamy, Powell, Hughes, and Castle, (1999),Build My Church: Trends and Possibilities for Australian Churches, Openbook Publishers, Adelaide, 50-58 76 Hughes and Blomberry (1990), Patterns of Faith in Australian Churches, Christian Research Association, Hawthorn, Victoria,11-26 77 Currie, R., Gilbert, A. and Horsley, L.(1977),Churches and Chruchgoers: Patterns of Church Growth in the British Isles Since 1700, Clarendon Press, Oxford,44
168

people in religious values. Second, there is a tendency for religious groups which place greater
emphasis on recruiting new affiliates also being affected by high levels of departure of old
affiliates. This seems especially true of religious groups which are recently established. Third,
those groups which rely on replacement levels of affiliates to come from the children of existing
affiliates will experience decline in the long term as some of these children will not remain
members of the religious group on reaching maturity if they do not recruit new affiliates.
9.3 Issues of Christian religion
It is clear that in examining the changing patterns of religious affiliation each religious
group has been affected differently by these religious movements. As a result it is necessary to
examine more closely what associations have changed between affiliation and attendance in each
of these groups.
At first glance it would appear that the Catholic group has been the most affected by
changing patterns of attendance among young people. In 1966 there was little distinction in the
levels of attendance by age group and a greater distinction between attendance based on a
person’s sex. When the same age groups are examined in 1993 it appears that weekly attendance
of people becomes progressively less with each younger age group. When this is examined in the
light of the religious movements which have been highlighted it would appear that lapsation acts
as the predominant force in explaining the declining attendance levels. While there are some
signs that the Apostotic movement has an influence on the level of affiliation this may well have
been balanced by the arrival of Catholic immigrants. Thus it would appear that the greatest effect
of apostasy can be confined to the 1966 to 1986 time period. While there are signs that it still has
some effect in the 1986 to 1996 time period this tends to be limited to the 15-24 age group. This
would tend to suggest that the religious change which has most affected the Catholic group is
169
lapsation. While patterns of affiliation and attendance have in the past been strongly linked this is
no longer the case. It would also appear that the primary reason behind this change is an age
effect which has become stronger with each younger generation.
A corresponding examination of the Anglican, Uniting/Presbyterian and Other Christian
groups shows that in 1966 and 1993 there are remarkably similar patterns of attendance for each
of the groups. The Anglican group shows low levels of attendance in both periods. The
Uniting/Presbyterian group shows moderate levels of attendance in both periods. The Other
Christian group shows high levels of attendance in both periods, Where differences in levels of
attendance occur these patterns seem to be similar to each other both in 1966 and 1993. At first
appearance this would seem to confirm Bouma, Greeley and Hout’s theory that levels of
attendance are affected solely by life course changes, that at younger ages people may fall away
from regular patterns of attendance but as they move into the family formation stage and stable
employment these patterns of regular attendance return.
What is often ignored in such an analysis is that while the Anglican and
Uniting/Presbyterian groups retain similar patterns of attendance over time they are more likely
to be affected by changing patterns of affiliation. Thus it is significant that the Anglican and
Uniting/Presbyterian groups both experienced strong levels of disaffiliation in the 1966 to 1986
period. Also similar to the Catholic group disaffiliation became isolated to the 15-24 age group
in 1986-1996. Hence, the Anglican and Uniting/Presbyterian groups have retained stable patterns
of attendance for those who remain affiliated but there has been a significant level of movement
away from these religious groups in the 15-24 age groups. This would suggest that these two
groups have been affected by the apostotic movement but there are some signs particularly in the
older people of the Uniting/Presbyterian group in 1986-96 that there is some growth in this
affiliation.
170

At a time when the other religious groups were declining the Other Christian group
experienced an increase in levels of affiliation. There were moderate levels of change in each age
cohort between 1966 and 1976 but much greater rates of growth between 1976 and 1986
especially in the 15-24 and 25-34 age groups. It has been noted that these patterns of growth
happened especially at times when the Uniting/Presbyterian group was experiencing a period of
decline in affiliation. This may suggest that some of the growth was due to conversion between
these two groups. This is significant when the decline in the Other Christian group in the 1986-
1996 are paralleled with those levels of growth in the Uniting/Presbyterian group.
What is possible to conclude from these comparisons of different religious groups is that
each has been affected by changing behaviour of people in the younger age groups. Among the
Catholic group this has tended to see a process of lapsation among the younger age groups.
Among the Anglican, Uniting/Presbyterian and Other Christian groups this has been more
affected by patterns of apostasy and conversion between these groups. This would indicate that
an age effect has been present in each of the religious groups but it has been experienced in
different ways by each group. The long term effect, however, is the same that fewer young
people are proportionally represented among those who regularly attend religious services
conducted by each of these religious groups.
The paradox that is faced currently in the Australian context is that while Protestant
Churches have high levels of attendance they do not have high levels of retention of affiliation.
Conversely the Catholic Church retains high levels of affiliation and low rates of attendance. The
fact that these differences exist indicate a profound shift in the religious culture in Australia
especially among younger generations. Regele78 would argue that the reasons behind these
changes are periods of religious transition which are 80-90 years long. Here he would suggest the
period between 1966 and 1996 is a period in which each successive generation seeks to stress
171

external issues of life and thus spiritual issues are considered less central. He would see 1966 to
2011 as the outward part of the cycle. This would be followed by an inward cycle which would
see the return to the consideration of issues of spirituality being stressed. While this theory holds
some appeal it is evident that this does not account for changes between religious groups and the
fact that levels of attendance might grow in some religious groups while declining in others.
While it may explain changes to particular religious groups when examined in isolation it does
not appear to explain the dynamic nature of faith and belief.
However, it appears that the comment made by Mol may explain part of the decline in
levels of attendance and affiliation:
“If Individual thought and conscience begin to move centre stage, a religious organisation begins of necessity to be less cohesive, more devisive and pluriform. It may maintain all the trappings of the ancient theology but it has now opened its flank to an ideology in which individual autonomy is strong. And this means that institutional decision making has to compete more with individual opinion. Church going now becomes more optional”79
He would argue further that a theology which stresses the personal salvation of the
individual would act against the religious institution and carried to extreme would see that the
function carried out by that institution as no longer being necessary. This theology of personal
salvation would thus see the shift in religion investigations move from a study of the institution
to the study of the individual. However, it is pertinent to note that in a recent series of articles in
the Tablet, commenting on changes in religious affiliation and attendance in Europe, a Protestant
theologian , Willame80, states that ‘there is some Protestantising of Catholics going on, while
Protestants tend to a vague agnosticism’. This may indicate that a theology which stresses the
importance of an individual may lead away from the ecclesial nature of the church that promotes
78 Regele,(1995), Death of the Church, Zondervan, Grand Rapids, 27-36 79 Mol, (1985), The Faith of Australians, George, Allen and Unwin, Sydney, 62 80 Kerkhofs (1999) ‘Europe needs therapy’in The Tablet, 24th July, 1016
172

that theology. In many ways the theory of a move towards personal autonomy may find its
grounding within Protestant theology.
The effects of this theology of personal autonomy are commented on by Rolheiser. He
notes that there is a growing dichotomy between institutional and personal religion. He identifies
five areas where this separation has occurred: a divorce between religion and sexuality;
spirituality and ecclesiology; private morality and social justice; the giving parent and the gifted
child, and contemporary culture and Christian heritage81.
However, while this may explain the recent changes in attendance of those who come
from Western European, Anglo-Celtic countries and the United States of America it does not
seem to explain adequately the high levels of attendance of those immigrants who belong to
Christian groups from South East Asia, Southern Europe and other parts of the world. This may
indicate that those countries which have been less exposed to a Protestant theology are able to
sustain stronger patterns of attendance and affiliation. The reasons behind this may well flow
from the Catholic theology which would stress communal salvation and the common good of all
believers. The fact that such a theology would lay stress on the precept that we are saved as a
body of people and not as individuals would tend to stress the need for each person to be
involved in building up the corporate body of the religious institution. This in turn would tend to
stress the importance of attendance not for the individual’s sake alone but for the good of the
faith of all believers.
What is apparent is that it appears that both theologies need to be kept in balance
with each other. When the importance of personal salvation is stressed there is a tendency to see
the importance of a person’s relationship with God preached to the exclusion of a relationship
with the community. When the stress is placed on communal salvation there is a tendency to
stress the importance of the corporate body to the exclusion of the individual’s spiritual needs. It
173

would thus appear that Mol’s initial insight into the importance of personal autonomy in an
individual’s life may be one of the key factors in explaining the decline in religious attendance
among younger age groups. You do not need to attend a religious service in a formal place of
worship on a given day if you can attend to that relationship on your own.
9.4 Issues of international migration and mobility
When it was evident that the level of immigration had a distinct effect on the level of
attendance that as far as possible it was necessary to isolate what demographic indicators might
explain lower levels of attendance. Through this analysis that these appear to fall into through
three broad groups. These are issues of cultural similarity, linguistic difference and region of
birth. In addition it was felt that mobility should also be examined to see whether it had a distinct
impact on the level of attendance.
It was possible from this study to see that the level of attendance was similar for people
from Australia and English speaking countries. This is in contrast to those from non-English
speaking countries who have higher levels of attendance. A person who comes from a Non-
English background also has a higher level of attendance than one who come from an English
speaking background. This would suggest that those migrants from cultures similar to Australia
and who speak English are more likely to take on the attendance patterns of those who are
Australian born. However, as Price82 has suggested those from culturally and linguistically
different backgrounds are more likely to sustain communities which support their ethnic identity.
It appears that these patterns of attendance are not changed as a result of mobility. Indeed
when the whole population is examined in 1966 and 1991 it is possible to see that the level of
attendance is only marginally higher for those who have lived in a place for over 10 years. Given
81 Rolheiser(1998) Seeking Spirituality, Hodder & Stroughton, London 31-37
174
that greater numbers of people who have shorter periods of residence in their current place it
appears that this does not affect the level of overall attendance. In fact it appears once again that
it is a generational factor with lower levels of attendance at younger ages which better explains
the lower levels of attendance. This would indicate that when a person moves from one location
to another they are most likely to sustain previous patterns of attendance. Thus the migration
process of itself does not have an adverse effect on the levels of attendance.
What does appear to be significant is a second generation effect which notes a lower level
of attendance among those who come from a Non-English speaking background who were born
in Australia compared to those from a similar background but were born overseas. This may
suggest that where the birthplace of a parent and a child differ there may be a likelihood that the
child is more likely to adopt the resident cultural attitudes towards attendance at religious
services in preference to the attitude of the parent. However, this theory cannot be conclusively
proven by this research and would need to be examined further.
9.5 Issues of changes in marital status
What became clear from this study are the strong connections that exist between a
person’s marital status and their pattern of religious attendance. What stands out clearly are three
factors which affect the level of attendance. The first indicates that marriages between people of
similar affiliation leads to higher levels of attendance whereas marriages between people of
different affiliations indicate lower levels of attendance. This would indicate that mixed
marriages between peoples of different affiliations is a significant factor in lowering levels of
attendance. The second is that relationships which occur prior to or after the first marriage
between two people also indicate lower levels of attendance among those who are in de-facto
82 Price, (1991) Religion and Ancestry in Australia: Changes over the Generations: 1986, Australian Immigration Research Centre, Canberra 36-37
175

relationships and those who are divorced and remarried. Also, increasing number of marriages
are performed by civil celebrants.
The study of these changes in patterns of attendance indicates an issue that seem worthy
of further study. It would appear that where people form relationships show higher levels of
attendance this occurs within the context of people with similar affiliation. This would indicate
that the formation of relationships and the attendance of a religious attendance reaffirm the
pattern of behaviour expected by a religious group. However, where the pattern of formation
occurs outside of the context of people sharing similar beliefs or patterns of behaviour approved
by the religious group this results in lower levels of attendance. What is of particular interest is
the extent to which the religious group provides the context in which people establish that
relationship and the degree of influence they have in maintaining the expected pattern of
behaviour. It would appear that religious groups with high levels of attendance are more likely to
maintain the expected pattern of behaviour while those which have lower levels of attendance are
less likely to maintain those patterns of behaviour.
9.6 Avenues for future research
As with all areas of research it is quite easy to become distracted by unanswered
questions and the wealth of data that is available to the researcher. When this project was
engaged it sought to examine what might explain the changing levels of attendance over the
period between 1966 and 1996. This is obviously a period of significant demographic and social
change. It is against this backdrop that the study of religious attendance has sought to understand
how these changes have affected the practice of religion. As such all religions have encountered
and experienced a period of profound change not only in their institutional composition but also
176

in how they relate to their own members and the world as a whole. Given the speed of this
change and the dramatic changes facing each successive generation each religious institution has
struggled to understand the changing times in which it now lives. The changing patterns of
religious attendance are but one sign that the religious activity of those who belong to religious
groups has changed. This issue is not limited to Australia but it would appear that Australia is in
a unique position to explore the global changes in the nature of religion.
The reason why Australia would appear to be in such a significant position in terms of
such study as this one is partially due to the availability of Census material gathered on a regular
and timely basis which includes information on religious affiliation. The fact that these data from
earlier censuses have now also been computerised makes it possible to trace back important
issues which in the past would not have been possible. It appears evident that the work initiated
by Price83 in trying to examine the ethnic composition and the retention of affiliation would be
one significant work which needs to be continued. This could also be linked with the linguistic
issues which were raised earlier and may identify more clearly the differences of changing
patterns of affiliation based on residential, linguistic, cultural, racial and generational issues.
It is evident that a more complete study of changes in religious affiliation between
censuses needs to be undertaken. While broad religious groups were used in analysing changes
in cohort groups between censuses it was difficult to isolate whether these changes were due to
migration or conversion. One way of arriving at the level of conversion for those born in
Australian may be arrived at by comparing religious affiliation in each census period for this
group by birthplace. This would allow for a closer examination of how the religious affiliation
patterns of those who are born in Australia has changed over time.
83 Price, (1991) Religion and Ancestry in Australia: Changes over the Generations: 1986, Australian Immigration Research Centre, Canberra 36-37
177

Linked with this issue would be a better understanding of the review of the levels of
affiliation of those arriving from different parts of the world and whether the levels of religious
affiliation have changed in a similar manner to other Australians. This could be arrived at by
determining the age and sex of the respondent by period of residence in Australia and religious
affiliation. As part of such a study it appears that the composition of the No Religion group needs
to be examined more closely. This would allow researchers to examine whether this group has a
static demographic pattern or one which is more dynamic in its composition as was suggested by
the data from the Australian Family Formation Project.
There are also signs that the Churches are taking the issue of religious change more
seriously as they have sought through the National Church Life Survey, conducted among the
Anglican and Protestant churches in 1991 and 1996, and in the Catholic Church Life Survey,
conducted in 1996, to profile the age composition, practices and beliefs of their respective
congregations. Such tools provide valuable insight into the changing nature of religion and how
those who regularly participate in religious services are affected by these changes. However, it
would also seem apparent that available Church records on life stage measures might also
provide a useful measure in explaining the changing levels of religious activity within the
community.
Lastly, while regular headcounts conducted by churches are useful for the institutions
involved they make comparison between religious groups difficult due to when they are taken
and who they include in the count. A possible solution to this issue would be for each religious
group to conduct the level of attendance at major feasts. In the case of Christian churches this
would be at Christmas or Easter. This may well give an understanding of religious practice
which is more comparable between religions whereas the frequency of religious practice gives an
understanding about the level of orthodoxy within a religious group.
178

However, some questions remain and these will need to be examined further. As Hughes
and Blombery84 pointed out, in an age of greater mobility there is likely to be a greater diversity
of choices that a person is called upon to make. Religion is but one among many. Where it would
have been considered central in the past it is now part of the milieu which underscores the
personality and life of a person who may be influenced by different issues in life. What is clear is
that profound changes have affected and are still affecting the lives of each generation. These
changes have tended to be reflected more greatly among the younger generation who have been
called upon to address these issues. It appears evident that a project which sought to record the
personal religious histories of young people over time would be an especially useful instrument
to measure religious change. What would seem to be apparent in such a study would be to isolate
measures which determine issues of personal autonomy compared with life issues relating to
commitment and the common good. In addition it would be extremely useful to undertake a
mapping exercise which not only sought to measure locations of activities but also the competing
interests which may occupy the time of younger people. If it is thought that mobility and
association are primary issues behind changes in levels of attendance and religious activity then
these would appear crucial to issues of religious organisation.
As with all projects these would be limited by time and money. However, it appears
evident that much of the data to understanding changing patterns of affiliation and attendance are
already available. What appears needed are the researchers and institutes to develop this research
further.
9.7 Concluding remarks
The period from 1966 to 1996 has seen a move away from institutions as places which
invest people with religious meaning in their lives. This may be, as Mol suggests, a result of
84 Hughes and Blombery (1990) Patterns of Faith in Australian Churches, CRA, Melbourne 141
179
personal autonomy which has divorced people who consider religion as an important part of their
lives from the institutions which have sought to encapsulate that religious meaning. This
separation from religious institutions has resulted in religious meaning becoming a more solitary
affair and has led to greater diversity of religious interest especially among younger people. This
can be evidenced not only by the decline of religious attendance among the younger age groups
but also the increasing level of books and other forms of media which seek to address spiritual
issues. It seems that in the case of young people it is a search to find a religion which is authentic
and which encapsulates their quest for meaning. Thus this period has been a time of great
change as people seek to discover who it is they are called to be for themselves and for others. In
such a search religious attendance becomes a less well-defined indicator of religious involvement
and religious affiliation becomes a more useful tool.
As was stated earlier frequent religious attendance is a sign of orthodoxy and not
necessarily a sign of spiritual growth. If religious organisations retain attendance as a sign of
orthodoxy then it is vital that this search for spiritual meaning is not subsumed by the
institutional needs of the religious organisation. Thus religious organisations should not act as
collection points for those who may have a passing interest in spiritual issues but fellow
travellers who seek to address the spiritual issues that people encounter in life.
The second point which was touched upon by Hughes and Blombery85 noted that the
geographical localities of where people shop, work, live, socialise and go to church are no longer
necessarily the same. It appears that in such a change the nexus which once saw these activities
linked closely within a community are now much looser and less likely to overlap each other. In
Church activities the parish no longer forms the centre of a person’s religious life and indeed
their religious activities might be covered by different religious institutions within the same
religious group. This means that whereas once it was the parish which provided the central
180

meeting point to engage all these activities a person might belong to a number of different
religious groups or activities which seek to address their religious needs. This may in part
explain the differences in levels of attendance recorded by headcounts and those captured by
social science surveys.
As a result it is quite possible that pastoral models of church which focus solely on
parish activity will not fulfil all of a person’s spiritual and religious needs. Thus while a parish is
geared to meet issues of managing life transition such as baptism, confirmation, marriage,
sickness, and death they might deal with other issues of spiritual transition where issues of
marriage and child rearing are deferred. It is clear that in some cases these tasks have been taken
on by educational, social care and retreat centres which are designed to address these particular
issues. It is also evident that many support groups seek to help people through specific spiritual
issues related to trauma, addiction and poverty. This may be the result of better provision of
counselling by government and non government organisations which offer a broader range of
alternatives to help a person through these crises. Thus parishes are not the only institutions
which provide help to those in need and it would appear that people may seek other institutions
who can help them through issues of spirituality which can respond to their personal need.
It appears that the changing patterns of attendance and affiliation have been affected by a
change in the behaviour of young people. Where a young person’s attendance is lower this
appears to be related to the lower level of the importance of religion in a person’s life. This
appears to have occurred for a number of reasons. Part of the change appears to be related to
issues of relationships between young people. Contraception may have allowed young women to
defer issues of marriage and child rearing to concentrate on higher levels of participation in
further education and/or participation in the paid workforce. This deferment of commitment has
tended to lead to the adoption among some young people of attitudes which do not see sexual
85 Hughes and Blombery (1990) Patterns of Faith in Australian Churches, CRA, Melbourne 141
181

relationships as being confined solely to marriage and this has led to the adoption of de-facto
relationships as a valid form of cohabitation. This adoption of alternative forms of partnering is
less likely to bring a young person into contact with a religious group which would not see these
relationships as approved modes of behaviour. Thus there is a greater likelihood that where a
young person enters into such a relationship their attendance is also likely to be lower. Change
in marital patterns either due to divorce or by the death of a partner also appears to affect the
levels of attendance of males and females. Among males this appears to result in lower levels of
attendance. However, it is also possible that in older age groups women find their caring and
nurturing roles are valued and this leads to the maintenance of regular attendance at religious
services which support them in those roles.
These changes have been reflected in the different attendance patterns of each of the
religious groups. Among Catholics this has seen an increasing level of lapsation among young
people. The Anglican and Uniting/Presbyterian groups have seen maintenance of attendance
patterns but an increasing level of apostasy among young people. The Other Christian group has
shown that while they maintain high levels of attendance among young people, there is also a
high level of turnover of those who are affiliated. This results in attendance levels not being
maintained at high levels for long periods of time. It appears, therefore, that changes in
attendance become much more sensitive to the religious issues confronting young people. While
those in older age groups are prepared to retain attendance patterns for the whole of their life the
same does not appear true of younger age groups.
However, it does appear that many young people still retain an affiliation to a religious
group but do not attend on a regular basis. This change in behaviour has caused religious groups
to question how they may better relate to issues affecting young people. The central question is
how does a religious group address issues of faith in the context of changing patterns of
relationships. While religious groups are well able to nurture marriages and children it is less
182

clear how they will be affected by a situation where an increasing number of people are
partnered outside of or prior to marriage and may also be childless. Parallel to this question is the
question of how religious groups sustain their communities when they increasingly rely on those
in the older age groups to maintain congregations. In this light the study of lower levels of
attendance cannot be viewed simply as a life cycle change but it does represent a fundamental
shift in how people enter into relationships with each other and how those relationships are
sustained over their lives. Thus Churches cannot just ride out the storm in the hope that one day
all will be well and that young people will return to the pews. There is a need to examine how
people entering into these relationships relate to the churches and how they are able to sustain
their spiritual lives. The churches in turn need to examine how their teaching is presented in a
way which is not seen as imposing a moral code upon others but is able to nurture relationships
which are faithful, life giving and open to the nurture of children.
183
Bibliography
Archer, K.(1968) Official Year Book of The Commonwealth of Australia, Number 54, Commonwealth Bureau of Census and Statistics, Canberra
Argyle, M and Beit Hallahmi (1985)
The Social Psychology of Religion, Routledge and Kegan Paul, London
Australian Bureau of Statistics, (1976) Catalogue of 1976 Census Tables (Final), Australian Bureau of Statistics, Canberra
Australian Bureau of Statistics, (1976) Marriages 1976, Canberra Australian Bureau of Statistics, (1986) Marriages 1986, Canberra Australian Bureau of Statistics, (1993) Marriages 1993, Canberra Australian Bureau of Statistics, (1996) Marriages 1996, Canberra Australian Government Actuary(1980)
Australian Life Tables 1975-1977, Australian Bureau of Statistics, Canberra
Australian Government Actuary(1985)
Australian Life Tables 1980-1982, Australian Bureau of Statistics, Canberra
Australian Government Actuary(1991)
Australian Life Tables 1985-1987, Australian Bureau of Statistics, Canberra
Australian Government Actuary(1995)
Australian Life Tables 1990-1992, Australian Bureau of Statistics, Canberra
Australian Institute of Family Studies,(1984)
Family Formation Study-Stage 1, 1980-81-Study Description, Social Science Data Archives, Australian National University, Canberra
184

Bausch, W. (1997) The Parish of the Next Millennium, Twenty Third Publications, Mystic, Connecticut
Bean, C. (1995) National Social Science Survey 1989-1990: Family and Lifestyle, Social
Science Data Archives, Australian National University, Canberra, Study Description D861
Beckford, J. (1989) Religion and Advanced Industrial Society, Unwin Hyman, London Bentley, P. (1988) Australian Religious Studies: A Bibliography of Post Graduates 1922-
1986, National Catholic Research Council, Bedford Park, South Australia Bentley, P., Blombery, T., and Hughes, P. (1990)
A Yearbook for Australian Churches 1991, Christian Research Association, Hawthorn, Victoria
Bentley, P., Blombery, T., and Hughes, P. (1991)
A Yearbook for Australian Churches 1992, Christian Research Association, Hawthorn, Victoria
Bentley,. And Hughes, P. (1996)
A Yearbook for Australian Churches 1997, Christian Research Association, Hawthorn, Victoria
Bentley, P., Blombery, T., and Hughes, P. (1992)
Faith without the Church?, Christian Research Association, Hawthorn, Victoria
Bentley, P. and Hughes, P. (1996)
The Uniting Church in Australia, Australian Government Printing Service, Canberra
Bentley, P. and Hughes, P. (1998)
Australian Life and Christian Faith: Facts and Figures, Christian Research Association, Hawthorn, Victoria
Birch, C. (1993) Regaining Compassion for Humanity and Nature, New South Wales University Press, Sydney Black, A. and Glasner, P. (1983) Practice and Belief, Allen and Unwin, Sydney Black, A. (1991) Religion in Australia, Allen and Unwin, Sydney Blombery, T. and Hughes, P. (1993) Faith Alive: An Australian Picture, Christian Research Association, Hawthorn, Victoria
185
Blombery, T. (1996) The Anglicans in Australia, Australian Government Publishing Service, Canberra Bouma, G. (1981) “The Changing Australian Religious Mosaic: Implications for Anglicans”
in St. Mark’s Review, September 1981,Number 107, 9-13 Bouma, G. (1992) Religion: Meaning, Transcendence and Community in Australia,
Longman Cheshire, Melbourne Bouma, G. (Ed.) (1997)
Many Religions, All Australian, Christian Research Association, Hawthorn, Victoria Breward, I. (1993) A History of Australian Churches, Allen and Unwin, St. Leonard’s, Sydney Brownlee,H. (1994) Employment Report: Spatial Aspects of Employment in Australian Cities,
Australian Institute of Family Studies, Melbourne Britt, M. (1988) In Search of New Wine Skins, Collins Dove, Melbourne Brown, R. (1984) The Churches the Apostles Left Behind, Paulist Press, New York Burke, D. and Hughes, P. (1996) The Presbyterians in Australia, Australian Government Publishing Service, Canberra Bureau of Immigration Research (1990)
Community Profiles 1991 Census Yugoslavia Born, Australian Government Publishing Service, Canberra
Bureau of Immigration Research (1991)
Community Profiles 1991 Census Netherlands Born, Australian Government Publishing Service, Canberra
Bureau of Immigration and Population Research (1994)
Community Profiles 1991 Census Malta Born, Australian Government Publishing Service, Canberra
Bureau of Immigration and Population Research (1994)
Community Profiles 1991 Census New Zealand Born, Australian Government Publishing Service, Canberra
Bureau of Immigration and Population Research (1994)
Community Profiles 1991 Census China Born, Australian Government Publishing Service, Canberra
186
Bureau of Immigration and Population Research (1994) Community Profiles 1991 Census South Africa Born, Australian Government Publishing Service, Canberra
Bureau of Immigration and Population Research (1994)
Community Profiles 1991 Census Germany Born, Australian Government Publishing Service, Canberra
Bureau of Immigration and Population Research (1994)
Community Profiles 1991 Census Malaysia Born, Australian Government Publishing Service, Canberra
Bureau of Immigration and Population Research (1994)
Community Profiles 1991 Census Philippines Born, Australian Government Publishing Service, Canberra
Bureau of Immigration and Population Research (1994)
Community Profiles 1991 Census Lebanon Born, Australian Government Publishing Service, Canberra
Bureau of Immigration and Population Research (1994)
Community Profiles 1991 Census Italy Born, Australian Government Publishing Service, Canberra
Bureau of Immigration and Population Research (1994)
Community Profiles 1991 Census Singapore Born, Australian Government Publishing Service, Canberra
Bureau of Immigration and Population Research (1994)
Community Profiles 1991 Census Greece Born, Australian Government Publishing Service, Canberra
Bureau of Immigration and Population Research (1995)
Community Profiles 1991 Census Cambodia Born, Australian Government Publishing Service, Canberra
Bureau of Immigration, Multicultural and Population Research (1995)
Community Profiles 1991 Census United States of America Born, Australian Government Publishing Service, Canberra
Bureau of Immigration, Multicultural and Population Research (1995)
Community Profiles 1991 Census Egypt Born, Australian Government Publishing Service, Canberra
Bureau of Immigration, Multicultural and Population Research (1995)
Community Profiles 1991 Census Ireland Born, Australian Government Publishing Service, Canberra
187

Bureau of Immigration, Multicultural and Population Research (1995) Community Profiles 1991 Census Hong Kong Born, Australian Government Publishing Service, Canberra
Bureau of Immigration, Multicultural and Population Research (1995)
Community Profiles 1991 Census Sri Lanka Born, Australian Government Publishing Service, Canberra
Bureau of Immigration, Multicultural and Population Research (1995)
Community Profiles 1991 Census Korea Born, Australian Government Publishing Service, Canberra
Bureau of Immigration, Multicultural and Population Research (1995)
Community Profiles 1991 Census Chile Born, Australian Government Publishing Service, Canberra
Bureau of Immigration, Multicultural and Population Research (1995)
Community Profiles 1991 Census Turkey Born, Australian Government Publishing Service, Canberra
Bureau of Immigration, Multicultural and Population Research (1995)
Community Profiles 1991 Census Fiji Born, Australian Government Publishing Service, Canberra
Bureau of Immigration, Multicultural and Population Research (1995)
Community Profiles 1991 Census India Born, Australian Government Publishing Service, Canberra
Bureau of Immigration, Multicultural and Population Research (1995)
Community Profiles 1991 Census Indonesia Born, Australian Government Publishing Service, Canberra
Bureau of Immigration, Multicultural and Population Research (1996)
Community Profiles 1991 Census Overseas Born, Australian Government Publishing Service, Canberra
Bureau of Immigration, Multicultural and Population Research (1995)
Community Profiles 1991 Census Australia Born, Australian Government Publishing Service, Canberra
Byrne, B. (1990) Inheriting the Earth, St. Paul Publications, Sydney Caffin, S. (1965) Australian Life Tables 1960-1962, Commonwealth Bureau of Census and
Statistics, Canberra Caffin, S. (1973) Australian Life Tables 1965-1967, Commonwealth Bureau of Census and
Statistics, Canberra
188

Caffin, S. (1976) Australian Life Tables 1970-1972, Commonwealth Bureau of Census and Statistics, Canberra
Cameron, J. (1989) Nuclear Catholics and Other Essays, William B. Eerdmans Publishing
Company, Grand Rapids, Michigan Cameron, R. (1981)
Catalogue of 1981 Census Tables (Final Edition), Australian Bureau of Statistics, Canberra
Caplow, T. (1998) “The Case of the Phantom Episcopalians” in American Sociological
Review, 32, 112-113 Castles, I. (1986)
Catalogue of 1986 Census Tables (Edition 1), Australian Bureau of Statistics, Canberra
Castles, I. (1989) 1991 Census of Population and Housing: Content and Procedures,
Australian Bureau of Statistics, Canberra Castles, I. (1986) 1991 Census Directory of Classifications, Australian Bureau of Statistics,
Canberra Castles, I. (1991) Census86-Religion in Australia. Australian Bureau of Statistics, Canberra Castles, I. (1992) Census of Population and Housing Forms 1911 to 1991, Australian
Bureau of Statistics, Canberra Castles, I. (1994) Projection of the Populations of Australia, States and Territories 1993-
2041, Australian Bureau of Statistics, Canberra Castles, I.(1994) Australian Social Trends 1994, Australian Bureau of Statistics, Canberra Castles, I. (1994) How Australians Use Their Time, Australian Bureau of Statistics
Canberra Chaves, M. (1989) “Secularization and Religious Revival: Evidence from U.S. Church
Attendance Rates, 1972 1986.,” in Journal for Scientific Study of Religion 28, 464-477
Chaves, M. (1991) “Family Structure and Protestant Church Attendance: The Sociological
Basis of Cohort and Age Effects.,” in Journal for Scientific Study of Religion, 30, 501-514
Commonwealth Bureau of Census and Statistics, (1961)
Census of the Commonwealth of Australia, 30th June 1961, Tabulations, Commonwealth Bureau of Census and Statistics, Canberra
189

Commonwealth Bureau of Census and Statistics, (1966) 1966 Census of Population and Housing: Catalogue of Census Tabulations, Commonwealth Bureau of Census and Statistics, Canberra
Commonwealth Bureau of Census and Statistics, (1966) Marriages 1966, Canberra Currie, R., Gilbert, A. and Horsley, L.(1977)
Churches and Chruchgoers: Patterns of Church Growth in the British Isles Since 1700, Clarendon Press, Oxford
Davidson, J., Williams, A., Lamanna, R., Weigert, K. Whalen, W. Wittberg, P. (1997) The Search for Common Ground: What Unites and Divides Catholic Americans, Our Sunday Visitor Publishing Division, Huntingdon, Indiana Department of Immigration and Multicultural Affairs (2000)
Community Profiles 1996 Census China Born , Australian Government, Publishing Service, Canberra
Department of Immigration and Multicultural Affairs (2000)
Community Profiles 1996 Census Croatia Born , Australian Government, Publishing Service, Canberra
Department of Immigration and Multicultural Affairs (2000) Community Profiles 1996 Census Germany Born , Australian Government, Publishing Service, Canberra
Department of Immigration and Multicultural Affairs (2000)
Community Profiles 1996 Census Greece Born , Australian Government, Publishing Service, Canberra
Department of Immigration and Multicultural Affairs (2000)
Community Profiles 1996 Census Hong Kong Born , Australian Government, Publishing Service, Canberra
Department of Immigration and Multicultural Affairs (2000)
Community Profiles 1996 Census Ireland Born , Australian Government, Publishing Service, Canberra
Department of Immigration and Multicultural Affairs (2000)
Community Profiles 1996 Census India Born , Australian Government, Publishing Service, Canberra
Department of Immigration and Multicultural Affairs (2000)
Community Profiles 1996 Census Italy Born , Australian Government, Publishing Service, Canberra
190
Department of Immigration and Multicultural Affairs (2000) Community Profiles 1996 Census Lebanon Born , Australian Government, Publishing Service, Canberra
Department of Immigration and Multicultural Affairs (2000)
Community Profiles 1996 Census Malaysia Born , Australian Government, Publishing Service, Canberra
Department of Immigration and Multicultural Affairs (2000)
Community Profiles 1996 Census Malta Born , Australian Government, Publishing Service, Canberra
Department of Immigration and Multicultural Affairs (2000)
Community Profiles 1996 Census New Zealand Born , Australian Government, Publishing Service, Canberra
Department of Immigration and Multicultural Affairs (2000)
Community Profiles 1996 Census Netherlands Born , Australian Government, Publishing Service, Canberra
Department of Immigration and Multicultural Affairs (2000) Community Profiles 1996 Census Philippines Born , Australian Government, Publishing Service, Canberra
Department of Immigration and Multicultural Affairs (2000)
Community Profiles 1996 Census Poland Born , Australian Government, Publishing Service, Canberra
Department of Immigration and Multicultural Affairs (2000)
Community Profiles 1996 Census South Africa Born , Australian Government, Publishing Service, Canberra
Department of Immigration and Multicultural Affairs (2000)
Community Profiles 1996 Census Sri Lanka Born , Australian Government, Publishing Service, Canberra
Department of Immigration and Multicultural Affairs (2000)
Community Profiles 1996 Census United Kingdom Born , Australian Government, Publishing Service, Canberra
Department of Immigration and Multicultural Affairs (2000)
Community Profiles 1996 Census United States of America Born, Australian Government, Publishing Service, Canberra
Department of Immigration and Multicultural Affairs (2000)
Community Profiles 1996 Census Viet Nam Born , Australian Government, Publishing Service, Canberra
191

Dixon. R. (1996) The Catholics in Australia, Australian Government Publishing Service, Canberra
Dulles, A. (1974) Models of the Church, Gill and Macmillan, Dublin Duquin, L. (1997) Could You Ever Come Back to the Catholic Church?, Alba House,
New York Encel, S. (1970) “Religious Behaviour”, in Australian Society, edited by Davies, T. and Encel, S., 2nd Edition, F.W. Cheshire, Melbourne Edgar,D. (1985) Family Formation Study, Stage 1, 1980-81, [machine readable data File]. Principal Investigator D.E.Edgar, Institute of Family Studies; data collected by Reark Research Pty. Ltd. Melbourne: Institute of Family Studies [producer] 1982. Canberra: Social Science Data
Archives, The Australian National University [distributor], 1985. 2 data files (106848 physical records) + accompanying user’s guide 105p)
Firebaugh, G. and Harley, B. (1991)
“Trends in U.S. Church Attendance: Secularization and Revival, or Merely Lifecycle Effects?” in Journal for the Scientific Study of Religion, 30, 487-500
Flannery,A.(1975) Vatican 2: The Conciliar and Post Conciliar Documents, Dominican
Publications, Dublin Flynn, M. (1979) Catholic Schools and the Communication of Faith, St Paul’s, Sydney Flynn, M. (1993) The Culture of Catholic Schools, St Paul’s, Sydney Friedkin, N.(1998) A Structural Theory of Social Influence, Cambridge University Press,
Cambridge Gerth, H.H. and Wright Mills, C. (1947) From Max Weber: Essays in Sociology, Kegan Paul, Trench, Trubner & Co. Ltd. London Giddens, A. (1993) Sociology, 2nd Edition, Polity Press, Cambridge Gill, R. (1989) Competing Convictions, SCM Press, London Gillman, I. (1988) Many Faiths, One Nation, William Collins, Sydney Godley, S. and Hughes, P (1996) . The Eastern Orthodox in Australia, Australian Government Publishing
Service, Canberra
192

Goot, M.(1987) “Public Opinion” in Australian Historical Statistics, edited by W. Vamplew, Fairfax, Syme & Weldon, Sydney
Graetz, B. and McAllister, I. (1988) Dimensions of Australian Society, Macmillan Company, Melbourne Greeley, A. (1982) Religion: A Secular Theory, The Free Press, New York Greeley, A.(1989) Religious Change in America, Harvard University Press, Cambridge Greeley, A. (1990) The Catholic Myth: The Behavior and Beliefs of American Catholics, Simon and Schuster, New York Greeley, A. (1996) Religion as Poetry, Transaction Publishers, New Brunswick Grierson, D. (1984) Transforming A People of God, The Joint Board of Christian Education
Of Australia and New Zealand, Melbourne Hadaway, C.K., Marler, P., and Chaves, M. (1993),
“What the Polls Don’t Show: A Closer Look at U.S. Church Attendance,” in American Sociological Review, 58, 741-752
Hadaway, C.K., Marler, P., and Chaves, M. (1998),
“Overreporting Church Attendance in America: Evidence that Demands the Same Verdict” in American Sociological Review, 32, 122-130
Han, G.(1994) Social Sources of Church Growth, Lantham, New York Harris, M.(1996) Proclaim Jubilee! A Spirituality for the Twenty-First Century,
Westminster John Knox Press, Louisville, Kentucky Hegy, P. (Ed.) (1993) The Church in the Nineties: Its Legacy, Its Future, The Liturgical Press
Collegeville, Minnesota Heney, D. (1998) Motivating Your Parish to Change, Resources Publications Inc., San Jose,
California Hill, C. (1990) Mystery of Life: A Theology of Church, Collins Dove, Melbourne Hogan, A., (1997) Being Catholic Today: What Kind of Person Should I Be?, Harper Collins
Blackburn, Victoria Hogan, M. (1979) “Australian Secularists: The Disavowal of Denominational Allegiance” in
Journal for the Scientific Study of Religion, 18, 4, 390-404 Hout, M. and Greeley, A. (1998) “What Church Officials Reports Don’t Show: Another Look at Church Attendance Data” in American Sociological Review, 32,113-119
193

Hughes, P. and Blomberry, T. (1990) Patterns of Faith in Australian Churches, Christian Research Association, Hawthorn, Victoria
Hughes, P. (1993) Religion: A View from the Australian Census, Christian Research
Association, Hawthorn, Victoria Hughes, P., Thompson, C., Pryor, R., and Bouma, G. (1995) Believe it or Not, Christian Research Association, Hawthorn, Victoria Hughes, P. (1996) The Baptists in Australia, Australian Government Publishing Service, Canberra Hughes, P. (1996) The Pentecostals in Australia, Australian Government Publishing Service,
Canberra Hughes, P. (1997) Religion in Australia: Facts and Figures, Christian Research Association,
Hawthorn, Victoria Humphreys, R and Ward,R.( 1995)
Religious Bodies in Australia, 3rd Edition, New Melbourne Press, Melbourne
Hynd,D.(1984) Australian Christianity in Outline, Lancer, Sydney Kaldor, P. (1987) Who Goes Where? Who Doesn’t Care, Lancer, Sydney Kaldor, P., Bellamy, J., Correy, M., and Powell, R. (1992) First Look in the Mirror, Lancer, Sydney Kaldor, P., Bellamy, J., Powell, R., Correy, M., and Castle, K. (1994)
Winds of Change: The Experience of Change in a Changing Australia,Lancer, Sydney
Kaldor, P., Bellamy, J., More, S. Powell, R., Correy, M., and Castle, K. (1995)
Mission under the Microscope: Keys to Effective and Sustainable Mission, Openbook Publishers, Adelaide
Kaldor, P., Powell, R., Bellamy, J., Castle, K., Correy, M., Moore, S. (1995)
View from the Pews: Australian Church Attenders Speak Out, Openbook Publishers, Adelaide
Kaldor, P., Bellamy, J. Powell, R., Hughes, B., and Castle, K., (1997) Shaping a Future: Characteristics of Vital Congregations, Openbook Publishers, Adelaide
194

Kaldor, P., Bellamy, J. Powell, R., Hughes, B., and Castle, K., (1999) Build My Church: Trends and Possibilities for Australian Churches, Openbook Publishers, Adelaide
Kelba, G. (1986) The People Parish: A Model of Church where People Flourish, Ave Maria Press, Notre Dame, Indiana Kelley, J et al.(1995) International Social Survey Programme, Religion, Australia 1991
(Computer File), Canberra: Social Science Data Archives, The Australian National University
Kerkhofs, J.(1999) ‘Europe Needs Therapy’ in The Tablet, 24th July 1999, 1016-1017 Leavy, C., Hetherton, M., Britt, M., O’Neill, R. (1992) Sponsoring Faith in Adolescence, E.J. Dwyer, Sydney Lennan, R. (Ed.) (1995)
Redefining the Church: Vision and Practice, E.J.Dwyer, Sydney Lyons, E. (1987) Partnership in Parish: A Vision for Parish Life, Mission and Ministry, The Columba Press, Dublin McGuire, M. (1992) Religion: The Social Context, Wadsworth Publishing Company, Belmont,
California McKinney, M. (1987) Sharing Wisdom: A Process for Group Decision Making, Tabor Publishing, Allen Texas McLennan, W. (1996) 1996 Census of Population and Housing: How Australia takes a Census,
Australian Bureau of Statistics, Canberra McLennan, W.(1996) Year Book, 1996, Number 77, Australian Bureau of Statistics, Canberra McLennan, W.(1996) Australian Standard Classification of Religious Groups, Australian Bureau
of Statistics, Canberra McLennan, W.(1997) Selected Social and Housing Characteristics, Australia, Australian Bureau of Statistics, Canberra Madden, R.. (1996) 1996 Census of Population and Housing; ABS views of Census
Classifications, Australian Bureau of Statistics, Canberra Mason, M. (Ed.) (1982)
Religion in Australian Life: A Bibliography of Social Research, The Australian Association for the Study of Religions and the National Catholic Research Council, Bedford Park, South Australia
195

Mason,M. (1985) ‘The Future of the Australian Church’ An unpublished paper presented to The Redemptorist Pastoral Seminar, September 28th-29th, 1985
Millikan, D. (1981) “Why are the Churches Losing Numbers” in St. Mark’s Review,
September 1981,Number 107, 14-20 Mol, J.J. (Hans) (1967) Religion in Australia, 1966, [machine readable data file], Data collected
by D.C.Stretton. Canberra: Hans Mol, The Australian National University [producer], 1967. Canberra: Social Science Data Archives, The Australian National University [distributor], 1984. 1 data file (2602 records) + accompanying user’s guide. (24p)
Mol, J.J. (Hans) (1969)
Christianity in Chains, Nelson, New York Mol, J.J. (Hans) (1971)
Religion in Australia: A Sociological Investigation, Allen and Unwin, Melbourne
Mol, J.J (Hans. (1983)
Meaning and Place, An Introduction to the Social Scientific Study of Religion, Pilgrim Press, New York
Mol, J.J. (Hans) (1985)
The Faith of Australians, George, Allen & Unwin, Sydney Morwood, M. (1998) Tomorrow’s Catholic: Understanding God and Jesus in a New
Millennium, Spectrum Publications, Melbourne Murdock, S. and Ellis,D.(1991)
Applied demography: An Introduction to Basic Concepts, Methods, and Data, Westview Press, Boulder
National Goals and Directions Inc. (1988)
Visions for Australia: Looking Towards 2000 AD, the People of Australia Have their Say., National Goals and Directions Inc. Sydney
O’Halloren, J. (1992) Signs of Hope: Developing Small Christian Communities, Orbis Books
MaryKnoll, New York O’Leary, D. (1998) Passion for the Possible: A Spirituality of Hope for the New Millennium
The Columba Press, Dublin O’Neill, J.(1966) Population: Single Characteristics Volume 1, Part 7 Religion, Commonwealth Bureau of Census and Statistics, Canberra O’Neill, J.(1971) Catalogue of 1971 Census Tabulations, Commonwealth Bureau of Census
and Statistics, Canberra
196
Phillips, W.W.(1987) “Religion” in Australian Historical Statistics, edited by W. Vamplew,
Fairfax, Syme & Weldon, Sydney Pickering, W.S.F. (1975)
Durkheim on Religion: A Selection of Readings with Bibliographies Routledge & Kegan Paul, London Pilarczyk, D. (1992) The Parish where God’s People Live, Paulist Press, New York Ploch, D. and Hastings, D. (1994)
“Graphic Presentation of Church Attendance Using General Social Survey Data.,” in Journal for the Scientific Study of Religion, 33, 16-33
Porter, P. (1998) Making Good Parishes Better: Working with Wisdom, MSI Publications,
Essendon, Victoria Presser, S. and Stinson, L. (1998) “Data Collection Mode and Social Desirability Bias in Self-Reported Religious Attendance”, in American Sociological Review, 32 137-145 Price, C. (1981) “Religions and The Census” in St. Mark’s Review, September 1981, Number 107, 2-8 Price, C. (1991) Religion and Ancestry in Australia, Changes over the Generations, Australian Immigration Research Council, Deakin Ramsey, A.M. (1965) Sacred and the Secular, The Holland Lectures for 1964, Longmans, London Rausch, T. (1996) Catholicism at the Dawn of the Third Millennium, The Liturgical Press,
Collegeville, Minnesota Regele, M., and Schulz, M. (1995) Death of the Church, Zondervan Publishing House, Grand Rapids, Michigan Richter, P. and Francis, L. (1998)
Gone but not Forgotten: Church Leaving and Returning, Darton, Longman And Todd, London
Rolheiser, R.(1998) Seeking Spirituality, Hodder & Stroughton, London Roy, P. (1981) Building Christian Communities for Justice, Paulist Press, New York
197

Rubenstein, W. (1996) Judaism in Australia, Australian Government Publishing Service,
Canberra Schild, M. and Hughes, P. (1996)
The Lutherans in Australia, Australian Government Publishing Service, Canberra
Schoenherr, R. & Young, L. (1993) Full Pews and Empty Altars, The University of Wisconsin Press, Wisconsin Smith, T. (1998) ‘A Review of Church Attendance Measures” in American Sociological Review, 32, 131-136 Tolhurst, J. (1988) The Church…A Communion: In the Preaching and Thought of
John Henry Newman, Fowler Wright Books, Leominster, Herefordshire
Whitehead, E. and Whitehead, J. (1992) Community of Faith: Crafting Christian Communities Today, Twenty Third Publications, Mystic, Connecticut Whitley,O.(1964) Religious Behavior: Where Sociology and Religion Meet, Prentice-Hall,
Englewood Cliffs, New Jersey Woodberry, R. (1998) “When Surveys Lie and People Tell the Truth: How Surveys Oversample
Church Attenders.,” in American Sociological Review, 32, 119-122 Wuthnow R. (1994) God and Mammon in America, The Free Press, New York Wuthnow, R. (1997) The Crisis in the Churches: Spiritual Malaise, Fiscal Woe, Oxford University Press, Oxford Yinger,J. Milton(1971)
The Scientific Study of Religion, Macmillan, New York
198