red state, blue state, rich state, poor state - why ...gelman/presentations/redbluetalkubc.pdf ·...
TRANSCRIPT
1/54
Geography, Income, and VotersExplanations and Implications
Election 2008: What Really Happened?
Red State, Blue State, Rich State, Poor StateWhy Americans Vote the Way They Do
Andrew Gelman
Dept of Statistics and Dept of Political Science, Columbia University
8 June 2009
Andrew Gelman Red State, Blue State, Rich State, Poor State
2/54
Geography, Income, and VotersExplanations and Implications
Election 2008: What Really Happened?
The Book
Andrew Gelman Red State, Blue State, Rich State, Poor State 2/54

3/54
Geography, Income, and VotersExplanations and Implications
Election 2008: What Really Happened?
Polarization: The Red and the Blue
Andrew Gelman Red State, Blue State, Rich State, Poor State 3/54

4/54
Geography, Income, and VotersExplanations and Implications
Election 2008: What Really Happened?
Polarization: The Haves and Have-Nots
Andrew Gelman Red State, Blue State, Rich State, Poor State 4/54
5/54
Geography, Income, and VotersExplanations and Implications
Election 2008: What Really Happened?
The ParadoxJournalists Get It Wrong (and Right)
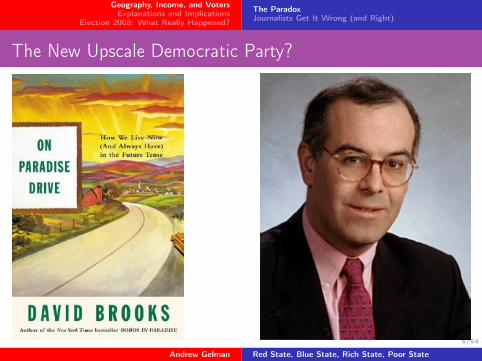
The New Upscale Democratic Party?
Andrew Gelman Red State, Blue State, Rich State, Poor State 5/54

6/54
Geography, Income, and VotersExplanations and Implications
Election 2008: What Really Happened?
The ParadoxJournalists Get It Wrong (and Right)
Red and Blue States
2004 election
Andrew Gelman Red State, Blue State, Rich State, Poor State 6/54

7/54
Geography, Income, and VotersExplanations and Implications
Election 2008: What Really Happened?
The ParadoxJournalists Get It Wrong (and Right)
Rich States are More Democratic . . .
Average income within state
Vot
e sh
are
for
Geo
rge
Bus
h
AL AK
AZAR
CA
CO
CTDE
FL
GA
HI
ID
IL
IN
IA
KS
KYLA
MEMD
MA
MI MN
MS
MO
MT
NE
NVNH
NJ
NM
NY
NC
ND
OH
OK
ORPA
RI
SCSD
TN
TX
UT
VT
VA
WA
WV
WI
WY
$20,000 $30,000
30%
50%
70%
Republican vote by state in 2004
Andrew Gelman Red State, Blue State, Rich State, Poor State 7/54

8/54
Geography, Income, and VotersExplanations and Implications
Election 2008: What Really Happened?
The ParadoxJournalists Get It Wrong (and Right)
. . . But Rich People are More Republican!
Vot
e sh
are
for
Bus
h
0 $100,000 $200,000
30%
50%
70%
Individual income
Bush vote in 2004 by income 2006 House exit polls
Income
Rep
ublic
an v
ote
shar
e
low middle high
30%
50%
70%
Northeast
Midwest
South
West
Andrew Gelman Red State, Blue State, Rich State, Poor State 8/54

9/54
Geography, Income, and VotersExplanations and Implications
Election 2008: What Really Happened?
The ParadoxJournalists Get It Wrong (and Right)
David Brooks and Maryland
I “Like upscale areas everywhere, fromSilicon Valley to Chicago’s NorthShore to suburban Connecticut,Montgomery County supportedthe Democratic ticket by a marginof 63 percent to 34 percent.”
I “In Red America churches areeverywhere. In Blue AmericaThai restaurants are everywhere.In Red America they have QVC,the Pro Bowlers Tour, and hunting.In Blue America we have NPR,Doris Kearns Goodwin, and sociallyconscious investing.”
Median household income within county
Vot
e sh
are
for
Geo
rge
Bus
h
$20,000 $40,000 $60,000 $80,000
0%25
%50
%75
%10
0%
Montgomery
Baltimore
Income and voting in Maryland counties
Andrew Gelman Red State, Blue State, Rich State, Poor State 9/54
10/54
Geography, Income, and VotersExplanations and Implications
Election 2008: What Really Happened?
The ParadoxJournalists Get It Wrong (and Right)
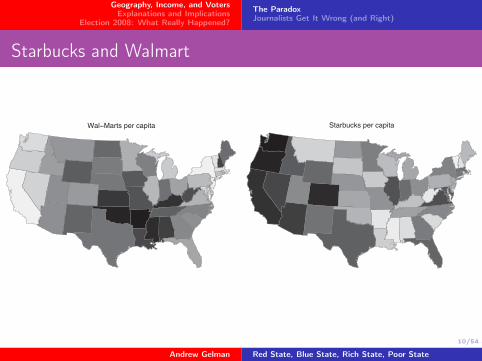
Starbucks and Walmart
Wal−Marts per capita Starbucks per capita
Andrew Gelman Red State, Blue State, Rich State, Poor State 10/54
11/54
Geography, Income, and VotersExplanations and Implications
Election 2008: What Really Happened?
The ParadoxJournalists Get It Wrong (and Right)
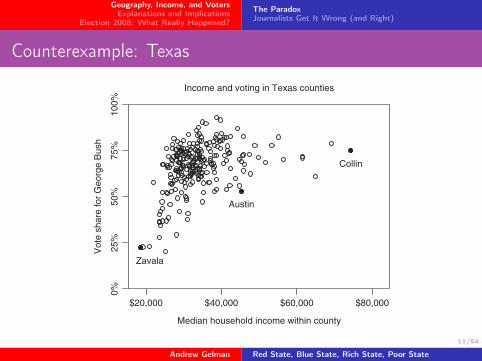
Counterexample: Texas
Median household income within county
Vot
e sh
are
for
Geo
rge
Bus
h
$20,000 $40,000 $60,000 $80,000
0%25
%50
%75
%10
0%
Collin
Zavala
Austin
Income and voting in Texas counties
Andrew Gelman Red State, Blue State, Rich State, Poor State 11/54
12/54
Geography, Income, and VotersExplanations and Implications
Election 2008: What Really Happened?
The ParadoxJournalists Get It Wrong (and Right)
The Key to the Answer: Context Matters
I How wealthy you are is associated with how you vote (andthink)
I But how much it does depends on where you live — contextmatters
I In some states the rich are very different from the poor but notin other states
I Texas and Maryland
Andrew Gelman Red State, Blue State, Rich State, Poor State 12/54

13/54
Geography, Income, and VotersExplanations and Implications
Election 2008: What Really Happened?
The ParadoxJournalists Get It Wrong (and Right)
Anna Karenina and the Paradox Resolved
Voter's income
Pro
babi
lity
of v
otin
g fo
r M
cCai
n
(poor) (rich)
25%
50%
75%
Conn.
(poor) (rich)
25%
50%
75%
Ohio
(poor) (rich)
25%
50%
75% Miss.
McCain vote by income in a poor, middle−income, and rich state
Andrew Gelman Red State, Blue State, Rich State, Poor State 13/54

14/54
Geography, Income, and VotersExplanations and Implications
Election 2008: What Really Happened?
The ParadoxJournalists Get It Wrong (and Right)
What if Only X Voted?
Andrew Gelman Red State, Blue State, Rich State, Poor State 14/54

15/54
Geography, Income, and VotersExplanations and Implications
Election 2008: What Really Happened?
The ParadoxJournalists Get It Wrong (and Right)
How Some Journalists See the Country
I “One of the Republican Party’s major successes over the lastfew decades has been to persuade many of the working poorto vote for tax breaks for billionaires.” — Nicholas Kristof,New York Times columnist
I “Who are the trustfunders? People with enough money not tohave to work for a living, or not to have to work very hard.These people tend to be very liberal politically. . . . ” —Michael Barone, author of the Almanac of American Politics
Andrew Gelman Red State, Blue State, Rich State, Poor State 15/54

16/54
Geography, Income, and VotersExplanations and Implications
Election 2008: What Really Happened?
The ParadoxJournalists Get It Wrong (and Right)
The New Working-Class Republicans?
Andrew Gelman Red State, Blue State, Rich State, Poor State 16/54
17/54
Geography, Income, and VotersExplanations and Implications
Election 2008: What Really Happened?
The ParadoxJournalists Get It Wrong (and Right)
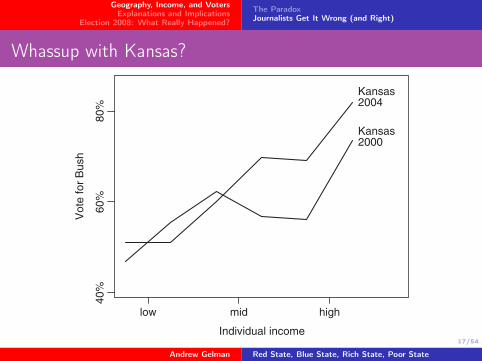
Whassup with Kansas?
Individual income
Vot
e fo
r B
ush
low mid high
40%
60%
80%
2000
2004
Kansas
Kansas
Andrew Gelman Red State, Blue State, Rich State, Poor State 17/54

18/54
Geography, Income, and VotersExplanations and Implications
Election 2008: What Really Happened?
The ParadoxJournalists Get It Wrong (and Right)
Pauline Kael and Availability Bias
I “I can’t believe Nixon won. I don’tknow anybody who voted for him.”— attributed to Pauline Kael,movie critic for the New Yorker
I Availability bias: the tendency togeneralize based on nearbyinformation
Andrew Gelman Red State, Blue State, Rich State, Poor State 18/54
19/54
Geography, Income, and VotersExplanations and Implications
Election 2008: What Really Happened?
The ParadoxJournalists Get It Wrong (and Right)
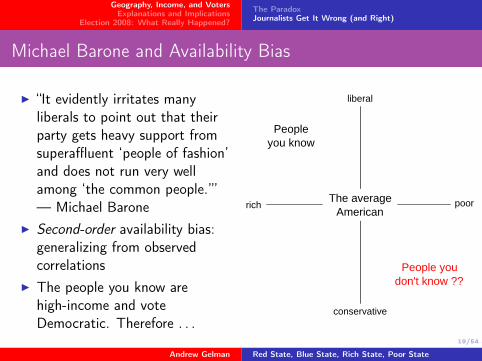
Michael Barone and Availability Bias
I “It evidently irritates manyliberals to point out that theirparty gets heavy support fromsuperaffluent ‘people of fashion’and does not run very wellamong ‘the common people.’”— Michael Barone
I Second-order availability bias:generalizing from observedcorrelations
I The people you know arehigh-income and voteDemocratic. Therefore . . .
liberal
conservative
poorrich
Peopleyou know
The averageAmerican
People youdon't know ??
Andrew Gelman Red State, Blue State, Rich State, Poor State 19/54

20/54
Geography, Income, and VotersExplanations and Implications
Election 2008: What Really Happened?
The ParadoxJournalists Get It Wrong (and Right)
Polarization is real
Ideological Position
(liberal) (conservative)
Entire U.S. Voters House
Senate
Andrew Gelman Red State, Blue State, Rich State, Poor State 20/54

21/54
Geography, Income, and VotersExplanations and Implications
Election 2008: What Really Happened?
ExplanationsOpiate of the ElitesSupplementary Data
30 Years Ago, Things Were Different
1976 election
Average income within state
Vot
e sh
are
for
Ger
ald
For
d
AL
AZ
AR
CA
CO
CT
DEFL
GA
HI
ID
ILIN
IA
KS
KYLA
ME
MD
MA
MI
MN
MS MO
MT
NE
NV
NH
NJNM
NYNC
NDOHOK OR
PA
RISC
SD
TN
TX
UT
VT
VAWA
WV
WI
WY
$15,000 $20,00030
%50
%70
%
Republican vote by state in 1976
Andrew Gelman Red State, Blue State, Rich State, Poor State 21/54

22/54
Geography, Income, and VotersExplanations and Implications
Election 2008: What Really Happened?
ExplanationsOpiate of the ElitesSupplementary Data
Incomplete Explanations for the Change in State Vote
I Is it rich people who are changing?I No. We showed that in the beginning.
I Is it race?I Mostly no. Excluding blacks from the analysis diminishes the
effects we see only partly.I Is it the South?
I No. We see the effects in the South and outside of it.I Is it inequality?
I No. Interstate income inequality has changed little, andintrastate income inequality is more tied to immigration trends.
Andrew Gelman Red State, Blue State, Rich State, Poor State 22/54
23/54
Geography, Income, and VotersExplanations and Implications
Election 2008: What Really Happened?
ExplanationsOpiate of the ElitesSupplementary Data
Our Explanation I
I The poor are similar in Red and Blue America, but the rich aredifferent.
I We’ve looked at voting.I Now look at attitudes on economic and social issues.
Andrew Gelman Red State, Blue State, Rich State, Poor State 23/54

24/54
Geography, Income, and VotersExplanations and Implications
Election 2008: What Really Happened?
ExplanationsOpiate of the ElitesSupplementary Data
Economic and Social Attitudes of Rich and PoorAverage ideologies of different groups of voters
Ave
rag
e s
core
on
so
cia
l is
su
es
lib
era
lm
ode
rate
con
se
rvative
Poor voters
Middle
Rich voters
Democratic States
Poor votersMiddle
Rich voters
Battleground States
Poor voters
Middle
Rich voters
Republican States
Average score on economic issues liberal moderate conservative
Andrew Gelman Red State, Blue State, Rich State, Poor State 24/54
25/54
Geography, Income, and VotersExplanations and Implications
Election 2008: What Really Happened?
ExplanationsOpiate of the ElitesSupplementary Data
Our Explanation II
I Voters haven’t changed within states—and states haven’tchanged much either, but parties have.
I Parties are more polarized than they’ve ever been.I Democratic and Republican voters are (slightly) more
ideologically distinctI Positions by elites are more uniform than they’ve been in the
past. The end of Rockefeller Republicans and Blue DogDemocrats.
I Wealthy people in rich, blue states are conflicted in their partychoice; hence the flat slope. Wealthy people in poor, red statesare not conflicted in their party choice; hence the high slope.
Andrew Gelman Red State, Blue State, Rich State, Poor State 25/54

26/54
Geography, Income, and VotersExplanations and Implications
Election 2008: What Really Happened?
ExplanationsOpiate of the ElitesSupplementary Data
Culture Wars and Polarization
I “Sometimes I think this countrywould be better off if we could justsaw off the Eastern Seaboard andlet it float out to sea.” — BarryGoldwater
I “People, I just want to say, youknow, can we all get along?” —Rodney King
Andrew Gelman Red State, Blue State, Rich State, Poor State 26/54

27/54
Geography, Income, and VotersExplanations and Implications
Election 2008: What Really Happened?
ExplanationsOpiate of the ElitesSupplementary Data
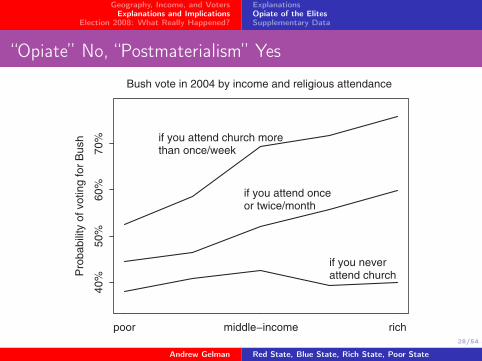
“Opiate of the Masses” vs. “Postmaterialism”
I “I don’t know that atheists should be considered citizens, norshould they be considered patriots. This is one nation underGod.” — George H. W. Bush
I “Very few of us . . . could name even five NASCAR drivers,although stock-car races are the best-attended sporting eventsin the country.” — David Brooks
I Two theories:I Opiate of the masses: Rich people vote their interests, poor
people vote “Gods, guns, and gays.”I Postmaterialism: Poor people vote based on economics, rich
people have the luxury to vote on social issues.
Andrew Gelman Red State, Blue State, Rich State, Poor State 27/54
28/54
Geography, Income, and VotersExplanations and Implications
Election 2008: What Really Happened?
ExplanationsOpiate of the ElitesSupplementary Data
“Opiate” No, “Postmaterialism” YesP
roba
bilit
y of
vot
ing
for
Bus
h
poor middle−income rich
40%
50%
60%
70% if you attend church more
than once/week
if you attend onceor twice/month
if you neverattend church
Bush vote in 2004 by income and religious attendance
Andrew Gelman Red State, Blue State, Rich State, Poor State 28/54
29/54
Geography, Income, and VotersExplanations and Implications
Election 2008: What Really Happened?
ExplanationsOpiate of the ElitesSupplementary Data
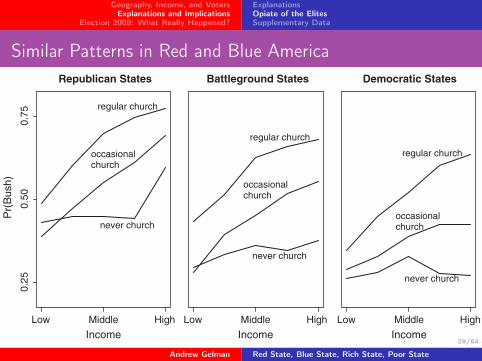
Similar Patterns in Red and Blue AmericaRepublican States
Income
Pr(
Bus
h)
Low Middle High
IncomeLow Middle High
IncomeLow Middle High
0.25
0.50
0.75
never church
occasionalchurch
regular church
Battleground States
never church
occasionalchurch
regular church
Democratic States
never church
occasionalchurch
regular church
Andrew Gelman Red State, Blue State, Rich State, Poor State 29/54

30/54
Geography, Income, and VotersExplanations and Implications
Election 2008: What Really Happened?
ExplanationsOpiate of the ElitesSupplementary Data
Economic/Social Ideology and Income/Relig Attend, by StateW
ithin
−st
ate
corr
elat
ion
Economic ideology and income
−0.
10.
00.
10.
2 AL
AZ
AR
CACOCT
DEFL
GA
ID ILINIAKSKY
LA
ME MDMA
MI MN
MS
MOMT
NE
NV NH
NM
NY
NCNDOH
OK
ORPARI
SCSDTN TXUT
VTVAWA
WVWIWY
State income
With
in−
stat
e co
rrel
atio
n
$25,000 $35,000
Social ideology and income
−0.
10.
00.
10.
2
AL
AZ
AR
CACO
CT
DEFL
GAID
IL
INIAKSKY
LA
MEMD
MA
MIMN
MS
MOMT NE
NVNH
NM
NY
NCND OHOK
ORPARI
SCSDTNTX
UT
VT VAWA
WV
WIWY
Economic ideology and religious attendance
ALAZ ARCACOCT
DEFLGA
IDIL INIA KSKYLA
ME
MDMA MI
MNMSMO
MTNE
NVNH NMNY NCNDOH OK
ORPARI
SCSDTNTXUT
VT
VA
WA WVWIWY
State religious attendance
2.5 3.0 3.5
Social ideology and religious attendance
AL
AZ
AR
CACOCT DEFL
GAID
IL INIA KSKYLA
MEMDMA MIMN
MS
MO
MT
NENVNH NMNY
NCNDOH OK
ORPARI
SCSDTNTXUT
VT
VAWA
WVWIWY
Andrew Gelman Red State, Blue State, Rich State, Poor State 30/54
31/54
Geography, Income, and VotersExplanations and Implications
Election 2008: What Really Happened?
ExplanationsOpiate of the ElitesSupplementary Data
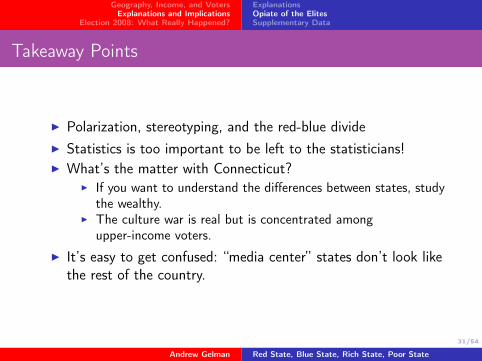
Takeaway Points
I Polarization, stereotyping, and the red-blue divideI Statistics is too important to be left to the statisticians!I What’s the matter with Connecticut?
I If you want to understand the differences between states, studythe wealthy.
I The culture war is real but is concentrated amongupper-income voters.
I It’s easy to get confused: “media center” states don’t look likethe rest of the country.
Andrew Gelman Red State, Blue State, Rich State, Poor State 31/54

32/54
Geography, Income, and VotersExplanations and Implications
Election 2008: What Really Happened?
ExplanationsOpiate of the ElitesSupplementary Data
End—Time for Your Questions
Andrew Gelman Red State, Blue State, Rich State, Poor State 32/54

33/54
Geography, Income, and VotersExplanations and Implications
Election 2008: What Really Happened?
ExplanationsOpiate of the ElitesSupplementary Data
Putting It Together
Rich−state, poor−state gap in Republican voteamong poor, middle−income, and rich voters
Rep
ublic
an v
ote
in p
oor
stat
es, m
inus
Rep
ublic
an v
ote
in r
ich
stat
es
1952−1968 1972−1988 1992−2004
0%10
%20
%
High−
inco
me
vote
rs
Middle−income vo
ters
Low−income voters
Andrew Gelman Red State, Blue State, Rich State, Poor State 33/54

34/54
Geography, Income, and VotersExplanations and Implications
Election 2008: What Really Happened?
ExplanationsOpiate of the ElitesSupplementary Data
Race Explains Half the Pattern
Whites only: Rich−state, poor−state gap in Republican vote among poor, middle−income, and rich voters
Rep
ublic
an v
ote
in p
oor
stat
es, m
inus
Rep
ublic
an v
ote
in r
ich
stat
es
1952−1968 1972−1988 1992−2004
0%10
%20
%
High−
inco
me
white
vot
ers
Middle−
incom
e whit
e vote
rs
Low−income white voters
Andrew Gelman Red State, Blue State, Rich State, Poor State 34/54
35/54
Geography, Income, and VotersExplanations and Implications
Election 2008: What Really Happened?
ExplanationsOpiate of the ElitesSupplementary Data
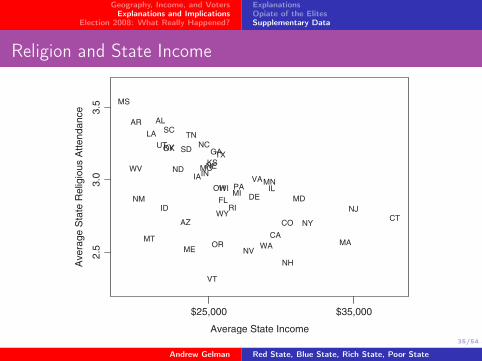
Religion and State Income
Average State Income
Ave
rage
Sta
te R
elig
ious
Atte
ndan
ce
$25,000 $35,000
2.5
3.0
3.5
AL
AZ
AR
CA
COCT
DEFL
GA
ID
IL
INIA
KS
KY
LA
ME
MD
MA
MIMN
MS
MO
MT
NE
NV
NH
NJNM
NY
NC
ND
OH
OK
OR
PA
RI
SC
SD
TN
TXUT
VT
VA
WA
WV
WI
WY
Andrew Gelman Red State, Blue State, Rich State, Poor State 35/54

36/54
Geography, Income, and VotersExplanations and Implications
Election 2008: What Really Happened?
ExplanationsOpiate of the ElitesSupplementary Data
Inequality in the States
States with high and low income inequality
Andrew Gelman Red State, Blue State, Rich State, Poor State 36/54

37/54
Geography, Income, and VotersExplanations and Implications
Election 2008: What Really Happened?
ExplanationsOpiate of the ElitesSupplementary Data
Polarized Parties: Foreign Policy
2003 2004 2005 2006
0%25
%50
%75
%10
0%
Republicans
Democrats
Independents
Partisan disagreement over the Iraq warP
erce
ntag
e su
ppor
ting
the
war
Andrew Gelman Red State, Blue State, Rich State, Poor State 37/54
38/54
Geography, Income, and VotersExplanations and Implications
Election 2008: What Really Happened?
ExplanationsOpiate of the ElitesSupplementary Data
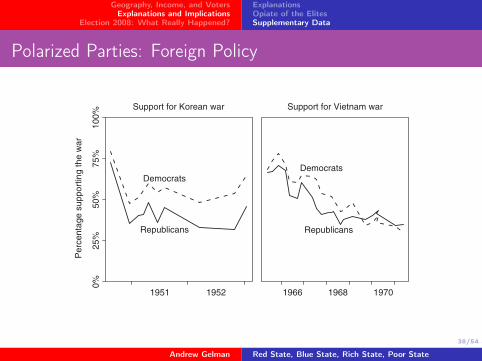
Polarized Parties: Foreign Policy
1951 1952
0%25
%50
%75
%10
0%
Republicans
Democrats
Support for Korean war
1966 1968 1970
Republicans
Democrats
Support for Vietnam war
Per
cent
age
supp
ortin
g th
e w
ar
Andrew Gelman Red State, Blue State, Rich State, Poor State 38/54
39/54
Geography, Income, and VotersExplanations and Implications
Election 2008: What Really Happened?
ExplanationsOpiate of the ElitesSupplementary Data
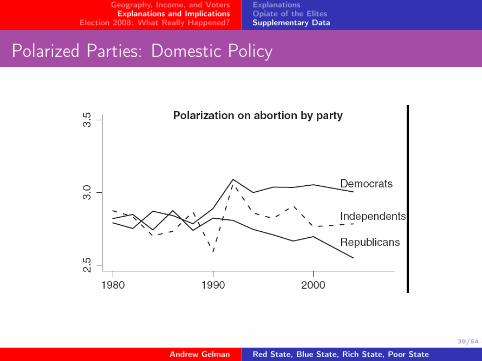
Polarized Parties: Domestic Policy
Andrew Gelman Red State, Blue State, Rich State, Poor State 39/54

40/54
Geography, Income, and VotersExplanations and Implications
Election 2008: What Really Happened?
ExplanationsOpiate of the ElitesSupplementary Data
Polarization in Red, Purple, and Blue States
Republicanstates Voters
House
Senate
Battlegroundstates
Voters
HouseSenate
Ideological Position
(liberal) (conservative)
Democraticstates
Voters
House
Senate
Andrew Gelman Red State, Blue State, Rich State, Poor State 40/54

41/54
Geography, Income, and VotersExplanations and Implications
Election 2008: What Really Happened?
ExplanationsOpiate of the ElitesSupplementary Data
Other Countries: Income and Voting
025
%
Australia
Hong Kong
Israel
Japan
South Korea
New Zealand
Taiwan
Asia and Oceania
025
%
Bulgaria
Czech
Hungary
PolandRomania
RussiaUkraine
BelgiumFrance
GermanyItalyNetherlands
PortugalSlovenia
Spain
Switzerland
Denmark
Finland
Iceland
Ireland
Norway
Sweden
United Kingdom
Europe
GDP per capita
0 20,000 40,000
025
%
Brazil
CanadaChileMexico
Peru
United States
North and South America
Con
serv
ativ
e vo
te s
hare
am
ong
rich,
min
us c
onse
rvat
ive
vote
sha
re a
mon
g po
or
Andrew Gelman Red State, Blue State, Rich State, Poor State 41/54

42/54
Geography, Income, and VotersExplanations and Implications
Election 2008: What Really Happened?
ExplanationsOpiate of the ElitesSupplementary Data
Other Countries: Income, Religion, and VotingUkraine Bulgaria Russia Romania Brazil
Poland Hungary Czech Mexico Slovenia
Portugal Korea New Zealand Israel Italy
Belgium Australia France Germany Netherlands
Britain Ireland Sweden Hong Kong Denmark
Iceland Switzerland Norway United States Japan
−25
%0
25%
−25
%0
25%
−25
%0
25%
−25
%0
25%
−25
%0
25%
Poor Rich
−25
%0
25%
Poor Rich Poor Rich Poor Rich Poor Rich
Co
nse
rva
tive
vo
te,
com
pa
red
to
na
tion
al a
vera
ge
Andrew Gelman Red State, Blue State, Rich State, Poor State 42/54

43/54
Geography, Income, and VotersExplanations and Implications
Election 2008: What Really Happened?
Election ReturnsDemographicsCongressional Elections
Election 2008: What Really Happened?
I National election returnsI State-by-state election returnsI Race, age, incomeI Pre-election pollsI Congressional elections
Andrew Gelman Red State, Blue State, Rich State, Poor State 43/54
44/54
Geography, Income, and VotersExplanations and Implications
Election 2008: What Really Happened?
Election ReturnsDemographicsCongressional Elections
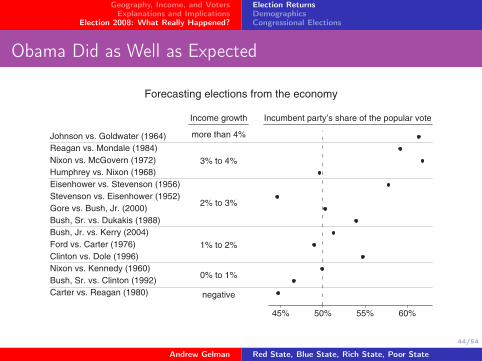
Obama Did as Well as Expected
Forecasting elections from the economy
Carter vs. Reagan (1980)Bush, Sr. vs. Clinton (1992)Nixon vs. Kennedy (1960)Clinton vs. Dole (1996)Ford vs. Carter (1976)Bush, Jr. vs. Kerry (2004)Bush, Sr. vs. Dukakis (1988)Gore vs. Bush, Jr. (2000)Stevenson vs. Eisenhower (1952)Eisenhower vs. Stevenson (1956)Humphrey vs. Nixon (1968)Nixon vs. McGovern (1972)Reagan vs. Mondale (1984)Johnson vs. Goldwater (1964)
45% 50% 55% 60%
Incumbent party’s share of the popular voteIncome growth
more than 4%
3% to 4%
2% to 3%
1% to 2%
0% to 1%
negative
Andrew Gelman Red State, Blue State, Rich State, Poor State 44/54

45/54
Geography, Income, and VotersExplanations and Implications
Election 2008: What Really Happened?
Election ReturnsDemographicsCongressional Elections
The Polls Did Well
Andrew Gelman Red State, Blue State, Rich State, Poor State 45/54

46/54
Geography, Income, and VotersExplanations and Implications
Election 2008: What Really Happened?
Election ReturnsDemographicsCongressional Elections
National Partisan Swing
Andrew Gelman Red State, Blue State, Rich State, Poor State 46/54

47/54
Geography, Income, and VotersExplanations and Implications
Election 2008: What Really Happened?
Election ReturnsDemographicsCongressional Elections
Swings are More National Than Before
Andrew Gelman Red State, Blue State, Rich State, Poor State 47/54

48/54
Geography, Income, and VotersExplanations and Implications
Election 2008: What Really Happened?
Election ReturnsDemographicsCongressional Elections
Whites and Minorities
Andrew Gelman Red State, Blue State, Rich State, Poor State 48/54

49/54
Geography, Income, and VotersExplanations and Implications
Election 2008: What Really Happened?
Election ReturnsDemographicsCongressional Elections
Young and Old
Andrew Gelman Red State, Blue State, Rich State, Poor State 49/54
50/54
Geography, Income, and VotersExplanations and Implications
Election 2008: What Really Happened?
Election ReturnsDemographicsCongressional Elections
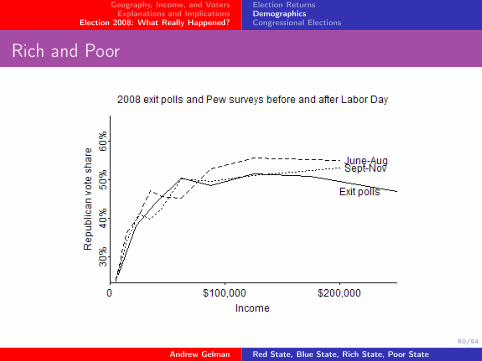
Rich and Poor
Andrew Gelman Red State, Blue State, Rich State, Poor State 50/54

51/54
Geography, Income, and VotersExplanations and Implications
Election 2008: What Really Happened?
Election ReturnsDemographicsCongressional Elections
Rich and Poor, by State
Andrew Gelman Red State, Blue State, Rich State, Poor State 51/54

52/54
Geography, Income, and VotersExplanations and Implications
Election 2008: What Really Happened?
Election ReturnsDemographicsCongressional Elections
Religious and Secular
Andrew Gelman Red State, Blue State, Rich State, Poor State 52/54
53/54
Geography, Income, and VotersExplanations and Implications
Election 2008: What Really Happened?
Election ReturnsDemographicsCongressional Elections
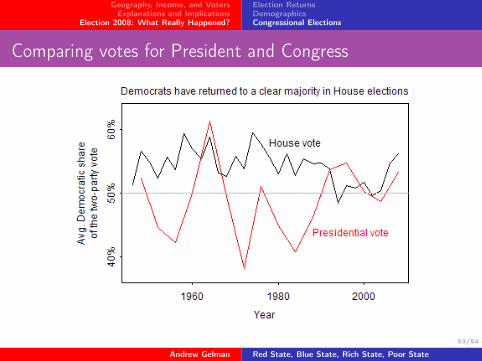
Comparing votes for President and Congress
Andrew Gelman Red State, Blue State, Rich State, Poor State 53/54
54/54
Geography, Income, and VotersExplanations and Implications
Election 2008: What Really Happened?
Election ReturnsDemographicsCongressional Elections
Further Questions?
Andrew Gelman Red State, Blue State, Rich State, Poor State 54/54