reliance industries q1fy16 - india...
TRANSCRIPT

Sector: Oil & Gas
Sector view: Neutral
Sensex: 28,420
52 Week h/l (Rs): 1043 / 796
Market cap (Rscr) : 331,782
6m Avg vol (‘000Nos): 3,785
Bloomberg code: RIL IS
BSE code: 500325
NSE code: RELIANCE
FV (Rs): 28,420
Price as on July 24, 2015
Share price trend
50
70
90
110
130
Jul‐14 Nov‐14 Mar‐15 Jul‐15
RELIANCE Sensex
Share holding pattern (%) Dec‐14 Mar‐15 Jun‐15
Promoters 45.2 45.2 45.2
Institutions 30.9 31.4 31.7
Others 23.9 23.4 23.1
Change in Estimates Rating Target
Rating: BUYTarget (2‐year): Rs1,300
CMP: Rs1,025
Upside: 26.8%
Result Update
Reliance Industries Ltd
Q1 FY16
July 27, 2015
Research Analyst: Prayesh Jain
This report is published by IIFL ‘India Private Clients’ research desk. IIFL has other business units with independent research teams separated by 'Chinese walls' catering to different sets of customers having varying objectives, risk profiles, investment horizon, etc. The views and opinions expressed in this document may at times be contrary in terms of rating, target prices, estimates and views on sectors and markets.
Revenues at Rs. 65,817cr, lower by 31.7% yoy driven by sharp fall in crude oil prices causing weak refining and petchem segment sales
OPM improves by 633bps yoy but falls 126bps qoq; yoy increase was led by 462bps and 423bps rise in petchem and refining segment EBIT margins respectively, sequential fall was led by 134bps fall in refining EBIT margins
GRMs at US$10.4/bbl was higher than expectations, GRMs saw 19.5% yoy and 3% qoq increase and was substantially higher than the benchmarks
Shale gas revenues and EBIDTA declined qoq owing to fall in gas prices
PAT at Rs. 6,318cr was higher than our estimates owing to better than expected refining and petchem segment performance
Cut FY16 estimates but we maintain BUY rating with 2‐year price target of Rs1,300
Result table (standalone) (Rs . cr) Q1 FY16 Q1 FY15 % yoy Q4 FY15 % qoq
Net sales 65,817 96,351 (31.7) 56,043 17.4
Material costs (47,073) (78,846) (40.3) (37,370) 26.0
Purchases (1,300) (1,716) (24.2) (1,731) (24.9)
Personnel costs (1,217) (929) 31.0 (993) 22.6
Other overheads (6,920) (7,330) (5.6) (7,320) (5.5)
Operating profit 9,307 7,530 23.6 8,629 7.9
OPM (%) 14.1 7.8 633 bps 15.4 ‐126 bps
Depreciation (2,265) (2,024) 11.9 (2,132) 6.2
Interest (597) (324) 84.3 (404) 47.8
Other income 1,818 2,046 (11.1) 2,133 (14.8)
PBT 8,263 7,228 14.3 8,226 0.4
Tax (1,945) (1,579) 23.2 (1,983) (1.9)
Effective tax rate (%) 23.5 21.8 24.1
Adjusted PAT 6,318 5,649 11.8 6,243 1.2
Adj. PAT margin (%) 9.6 5.9 374 bps 11.1 ‐154 bps
Ann. EPS (Rs) 78.1 69.9 11.7 77.2 1.2
Source: Company, India Infoline Research
Segmental performance Revenues (Rs. cr) Q1 FY16 Q1 FY15 % yoy Q4 FY15 % qoq
Petrochemical 19,552 23,715 (17.6) 20,056 (2.5)
Refining 61,358 90,998 (32.6) 48,639 26.1
Oil and gas 1,200 1,557 (22.9) 1,223 (1.9)
EBIT margins (%) Q1 FY16 Q1 FY15 bps yoy Q4 FY15 bps qoq
Petrochemical 12.6 7.9 462 10.6 199
Refining 8.4 4.1 423 9.7 (134)
Oil and gas 6.9 31.3 (2,436) 13.4 (649)
Revenue contribution (%) Q1 FY16 Q1 FY15 bps yoy Q4 FY15 bps qoq
Petrochemical 23.8 20.4 339 28.5 (478)
Refining 74.5 78.1 (359) 69.2 535
Oil and gas 1.5 1.3 12 1.7 (28)
EBIT contribution (%) Q1 FY16 Q1 FY15 bps yoy Q4 FY15 bps qoq
Petrochemical 31.7 30.4 132 29.7 200
Refining 66.4 60.9 549 66.2 15
Oil and gas 1.1 7.9 (679) 2.3 (123)
Source: Company, India Infoline Research

Reliance Industries (Q1 FY16)
2
E&P segment KG‐D6 gas production remained flat on a qoq basis during Q1 FY16 but represented a fall of 13.1mmscmd. The production averaged 11.5mmscmd as compared to 13.2mmscmd in Q1 FY15. While crude oil production at the Panna‐Mukta fields produced 1.56 million barrels of crude oil and 16.7 BCF of natural gas in Q1 FY16 – a reduction of 24% yoy and 8% yoy respectively. The decrease was owing to natural decline, well integrity issues and planned shutdown coupled with temporary shut‐in of flowing wells due to rig based work‐over activities. Tapti fields produced 0.04 million barrels of condensate and 1.88 BCF of natural gas in Q1 FY16 – reduction of 39% yoy and 58% yoy respectively. The decrease is due to natural decline and water loading of wells. Revenues from the segment (standalone) were lower by 22.9% yoy owing to fall in production, steep fall in crude oil prices and were offset by higher gas prices and rupee depreciation. EBIT margins for the segment were at 6.9% as compared to 31.3% in Q1 FY15 and 13.4% in Q4 FY15. Post the declaration of higher gas prices from November 01, 2014 the company has been accounting for higher gas prices in the books and the difference between the new and the old prices are shown as receivables. Going ahead, the company has planned to arrest the decline in production but awaits key approvals from the government including budget approvals for capital expenditure.
Trend in KG‐D6 gas production Trend EBIT margins of E&P segment
0
10
20
30
40
50
60
Q1 FY12
Q2 FY12
Q3 FY12
Q4 FY12
Q1 FY13
Q2 FY13
Q3 FY13
Q4 FY13
Q1 FY14
Q2 FY14
Q3 FY14
Q4 FY14
Q1 FY15
Q2 FY15
Q3 FY15
Q4 FY15
Q1 FY16
KG‐D6 productionmmscmd
0.0%
5.0%
10.0%
15.0%
20.0%
25.0%
30.0%
35.0%
40.0%
45.0%
50.0%
0
200
400
600
800
1,000
1,200
1,400
1,600
1,800
Q1 FY12
Q2 FY12
Q3 FY12
Q4 FY12
Q1 FY13
Q2 FY13
Q3 FY13
Q4 FY13
Q1 FY14
Q2 FY14
Q3 FY14
Q4 FY14
Q1 FY15
Q2 FY15
Q3 FY15
Q4 FY15
Q1 FY16
EBIT EBIT Margin
Rs. cr
Source: Company, India Infoline Research
Update on E&P fields KG‐D6 3rd compressor of the OTBC project was commissioned in Q1 FY16. . Post commissioning of all the
compressors, OT arrival pressure has reduced as planned. Substitute well B7 in D1‐D3 field was successfully completed and put to production. In continuation of work‐over activities currently rig is performing side track activity in well A1 in D1 D3 field. DST in other satellite discoveries – As per new DST policy, JV has opted to conduct DST for discovery D29 &
D30 and decided to relinquish discovery D31. DST has to be conducted within 12 months from 29th April 2015. Post which the Declaration of
Commerciality has to be filed within three months and then within 200 days a field development plan has to be submitted. Considering these, the management is hopeful of commencing production from SAT/OSAT fields from end of FY17 and NEC‐25 in FY18/19.
Panna Mukta Completion of MA‐MB and MB‐PPA pipeline restored production from Mukta‐A field after a span of 2 years. 4 wells worked over in FY15 were activated on completion of gas‐lift riser replacement work at PB platform. Mukta‐B field development: PMT JV completed installation of facilities and drilling of 1 well out of the 6
wells planned. Production is expected from early 2Q FY16.

Reliance Industries (Q1 FY16)
3
CB‐10 8 discoveries – expected submission of FDP to MC in Q2 FY16 Phase II exploration – land acquisition for exploratory well sites in progress A small oil discovery made recently CBM RIL is nearing completion of its Phase‐1 development activities and it is expected to start first gas production by H2 FY16. The Phase‐1 comprises of drilling and completion of 229 wells, 2 Gas Gathering Station (GGS) and 8 Water gathering stations with associated pipelines. Mechanical completion of GGS‐11 is finished and ready for start‐up of production by end Q2 FY16. The status of other activities that have been undertaken for facilitating fist gas: Land Acquisition: Completed for Phase‐1 well‐sites and facilities. Drilling and completion of ~140 well‐site completed. 80 KM of infield pipeline laying work completed. In GGS 12, construction activities and installation of equipment is nearing completion. Shahdol‐Phulpur Gas Pipeline: Land acquisition has been completed for all critical installations. RoU for 300 km out of 302 km has been handed over to pipeline construction contractors. 3 out of 4 river crossings are completed. Compressor station installation and other construction work is in progress. Update on shale gas assets For Q1 FY16, RIL’s revenues and EBIDTA from shale gas business were at US$141mn and US$86mn
While production volumes were flat yoy, revenues were lower by 48% yoy owing to 48% yoy fall in realizations
Capex for the quarter was at US$275mn taking the cumulative investments to over US$8.4bn across all JVs Trend in RIL’s revenue and EBIDTA from Shale gas Trend in number of wells drilled
0
50
100
150
200
250
0
50
100
150
200
250
300
Q3 FY14
Q4 FY14
Q1 FY15
Q2 FY15
Q3 FY15
Q4 FY15
Q1 FY16
Revenue EBIDTA
US$ mn US$ mn
0
200
400
600
800
1,000
1,200
Q4 FY12
Q1 FY13
Q2 FY13
Q3 FY13
Q4 FY13
Q1 FY14
Q2 FY14
Q3 FY14
Q4 FY14
Q1 FY15
Q2 FY15
Q3 FY15
Q4 FY15
Q1 FY16
Nof wells drilled Producing wells
Nos
Source: Company, India Infoline Research

Reliance Industries (Q1 FY16)
4
Status of individual shale gas assets Pioneer JV
Carrizo JV
Chevron JV
Source: Company
Key trends indicate improved in operating costs, Sale of EFS Midstream completed
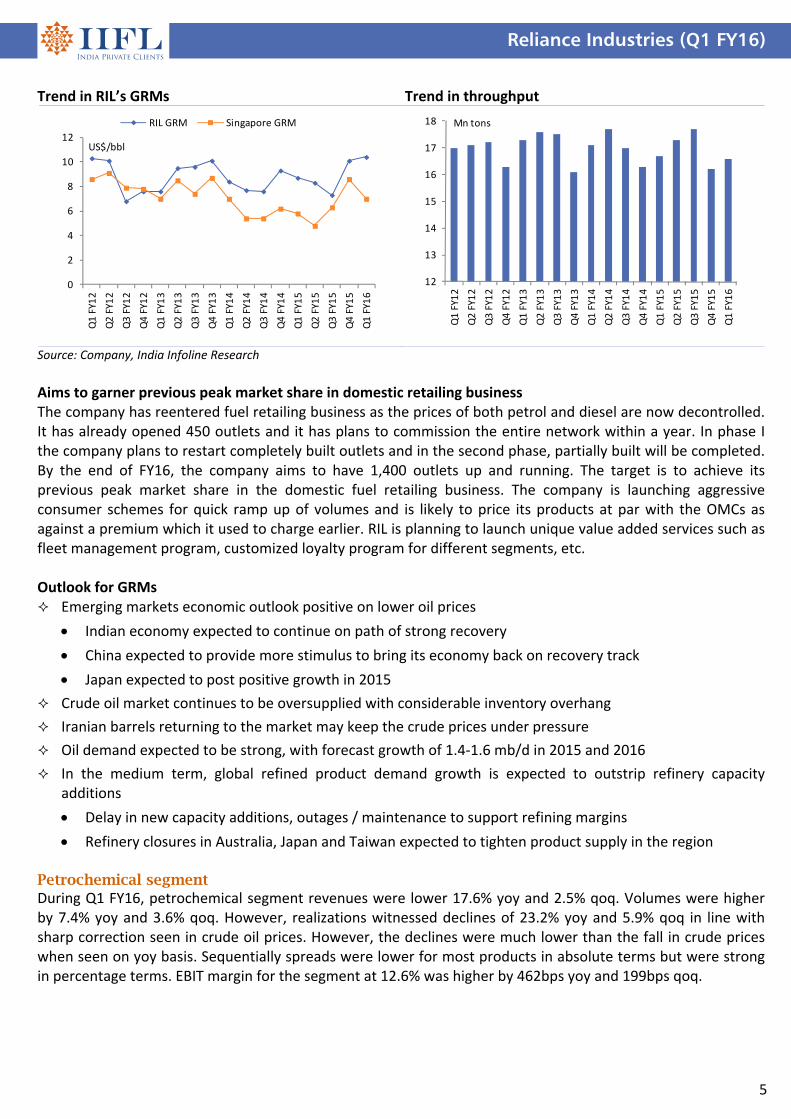
RIL completed the sale of its entire 49.9% interest in EFS Midstream LLC (“EFS”) to an affiliate of Enterprise Product Partners for cash considerations of US$1,073mn. Enterprise is a leading midstream operator and will continue to provide all midstream services to the Reliance‐Pioneer upstream joint development in the Eagle Ford Shale. The transaction was closed on July 8, 2015 and is effective July 1, 2015. While the company has monetized the asset, it has retained some flexibility as Enterprise has agreed to invest further US$270mn in case of requirement of further ramp up. The declining trend in well costs continued; Unit drilling cost dropped by 13% as compared to CY14 in both Pioneer & Chevron JV whereas unit completion cost was lower by 22% and 21% respectively. All JVs have taken steps to renegotiate services contracts in current price environment. Absolute and unit opex came out lower sequentially across all JVs. Refining segment RIL reported GRMs of US$10.4/bbl in Q1 FY16 as against US$8.7/bbl in Q1 FY15 and US$10.1/bbl in Q4 FY15. The GRMs were higher than our estimates. Benchmark Singapore GRMS were lower on a sequential basis as recovery in few product prices was lower than crude oil prices particularly so of fuel oil. The key drivers for strong performance of RIL vis‐à‐vis benchmarks were strong gasoline cracks, low energy cost and favorable crude oil differential Revenue for the segment was lower by 32.6% yoy owing to lower product prices. EBIT margins for the segment were at 8.4%, more than doubled on yoy basis but declined 134bps qoq.
Reliance Industries (Q1 FY16)
5
Trend in RIL’s GRMs Trend in throughput
0
2
4
6
8
10
12
Q1 FY12
Q2 FY12
Q3 FY12
Q4 FY12
Q1 FY13
Q2 FY13
Q3 FY13
Q4 FY13
Q1 FY14
Q2 FY14
Q3 FY14
Q4 FY14
Q1 FY15
Q2 FY15
Q3 FY15
Q4 FY15
Q1 FY16
RIL GRM Singapore GRM
US$/bbl
12
13
14
15
16
17
18
Q1 FY12
Q2 FY12
Q3 FY12
Q4 FY12
Q1 FY13
Q2 FY13
Q3 FY13
Q4 FY13
Q1 FY14
Q2 FY14
Q3 FY14
Q4 FY14
Q1 FY15
Q2 FY15
Q3 FY15
Q4 FY15
Q1 FY16
Mn tons
Source: Company, India Infoline Research
Aims to garner previous peak market share in domestic retailing business The company has reentered fuel retailing business as the prices of both petrol and diesel are now decontrolled. It has already opened 450 outlets and it has plans to commission the entire network within a year. In phase I the company plans to restart completely built outlets and in the second phase, partially built will be completed. By the end of FY16, the company aims to have 1,400 outlets up and running. The target is to achieve its previous peak market share in the domestic fuel retailing business. The company is launching aggressive consumer schemes for quick ramp up of volumes and is likely to price its products at par with the OMCs as against a premium which it used to charge earlier. RIL is planning to launch unique value added services such as fleet management program, customized loyalty program for different segments, etc. Outlook for GRMs Emerging markets economic outlook positive on lower oil prices
Indian economy expected to continue on path of strong recovery
China expected to provide more stimulus to bring its economy back on recovery track
Japan expected to post positive growth in 2015
Crude oil market continues to be oversupplied with considerable inventory overhang
Iranian barrels returning to the market may keep the crude prices under pressure
Oil demand expected to be strong, with forecast growth of 1.4‐1.6 mb/d in 2015 and 2016
In the medium term, global refined product demand growth is expected to outstrip refinery capacity additions
Delay in new capacity additions, outages / maintenance to support refining margins
Refinery closures in Australia, Japan and Taiwan expected to tighten product supply in the region
Petrochemical segment During Q1 FY16, petrochemical segment revenues were lower 17.6% yoy and 2.5% qoq. Volumes were higher by 7.4% yoy and 3.6% qoq. However, realizations witnessed declines of 23.2% yoy and 5.9% qoq in line with sharp correction seen in crude oil prices. However, the declines were much lower than the fall in crude prices when seen on yoy basis. Sequentially spreads were lower for most products in absolute terms but were strong in percentage terms. EBIT margin for the segment at 12.6% was higher by 462bps yoy and 199bps qoq.

Reliance Industries (Q1 FY16)
6
Trend in petrochemical prices
60
70
80
90
100
110
120
Q1 FY12
Q3 FY12
Q1 FY13
Q3 FY13
Q1 FY14
Q3 FY14
Q1 FY15
Q3 FY15
Q1 FY16
PE PP
Rs/kg
405060708090
100110120
Q1 FY12
Q3 FY12
Q1 FY13
Q3 FY13
Q1 FY14
Q3 FY14
Q1 FY15
Q3 FY15
Q1 FY16
POY PSF
Rs/kg
30354045505560657075
Q1 FY12
Q3 FY12
Q1 FY13
Q3 FY13
Q1 FY14
Q3 FY14
Q1 FY15
Q3 FY15
Q1 FY16
PTA MEG
Rs/kg
Source: Company
Trend in petrochemical deltas
300
400
500
600
700
800
900
Q1 FY12
Q3 FY12
Q1 FY13
Q3 FY13
Q1 FY14
Q3 FY14
Q1 FY15
Q3 FY15
Q1 FY16
HDPE‐NaphthaUS$/ton
0
100
200
300
400Q1 FY12
Q3 FY12
Q1 FY13
Q3 FY13
Q1 FY14
Q3 FY14
Q1 FY15
Q3 FY15
Q1 FY16
PP‐PropyleneUS$/ton
350
400
450
500
550
600
650
Q1 FY12
Q3 FY12
Q1 FY13
Q3 FY13
Q1 FY14
Q3 FY14
Q1 FY15
Q3 FY15
Q1 FY16
PVC‐EDCUS$/ton
Source: Company
0
100
200
300
400
500
Q1 FY12
Q3 FY12
Q1 FY13
Q3 FY13
Q1 FY14
Q3 FY14
Q1 FY15
Q3 FY15
Q1 FY16
PSF‐PTA‐MEGUS$/ton
50
100
150
200
250
300
Q1 FY12
Q3 FY12
Q1 FY13
Q3 FY13
Q1 FY14
Q3 FY14
Q1 FY15
Q3 FY15
Q1 FY16
PET‐PTA‐MEGUS$/ton
0
500
1,000
1,500
2,000
Q1 FY13
Q2 FY13
Q3 FY13
Q4 FY13
Q1 FY14
Q2 FY14
Q3 FY14
Q4 FY14
Q1 FY15
Q2 FY15
Q3 FY15
Q4 FY15
Q1 FY16
PBR‐BDUS$/ton
Source: Company
Petchem revenues fall on lower realizations EBIT margins for petchem improve sequentially
‐30%
‐20%
‐10%
0%
10%
20%
30%
40%
50%
0
5,000
10,000
15,000
20,000
25,000
30,000
Q1 FY12
Q2 FY12
Q3 FY12
Q4 FY12
Q1 FY13
Q2 FY13
Q3 FY13
Q4 FY13
Q1 FY14
Q2 FY14
Q3 FY14
Q4 FY14
Q1 FY15
Q2 FY15
Q3 FY15
Q4 FY15
Q1 FY16
Revenues yoy growth
Rs. cr
0.0%
2.0%
4.0%
6.0%
8.0%
10.0%
12.0%
14.0%
0
500
1,000
1,500
2,000
2,500
3,000
Q1 FY12
Q2 FY12
Q3 FY12
Q4 FY12
Q1 FY13
Q2 FY13
Q3 FY13
Q4 FY13
Q1 FY14
Q2 FY14
Q3 FY14
Q4 FY14
Q1 FY15
Q2 FY15
Q3 FY15
Q4 FY15
Q1 FY16
EBIT EBIT Margins
Rs. cr
Source: Company, India Infoline Research

Reliance Industries (Q1 FY16)
7
Polymer Outlook
Ethylene and propylene dynamics to change with fewer cracker turnarounds and supply ease
Sustained lower oil prices will continue to improve competitiveness of Asian polymer producers
Delays in incremental Chinese capacity likely to support margins going forward
Domestic demand is likely to remain strong across all major end users
Elastomers Outlook Operating rates are expected to remain range bound with PBR capacity additions slowing down
Global demand expected to grow by 3% to 3.5MMT in FY16
Demand in India is expected to grow by 8%in FY16 (2x global growth)
Global SBR demand supply balance likely to improve with marginal capacity adds
Global SBR demand is expected to grow 3% to 5.5MMT in FY16
Indian SBR market is estimated to grow by 8% in FY16 to 260kTA
Polyester chain outlook Economic growth in US and EU, and crude oil stability would drive overall textile demand
Polyester to grow 1.6x of all other fibres during the current decade
Make in India campaign to benefit the Indian textile industry to establish itself as a larger player in the global arena
PX industry to witness slower capacity growth than expected aiding industry balance
PTA consolidations to continue, integrated players to enjoy scale economics
MEG markets would continue to be tight
Consolidated results – weak shale gas performance impacts profitability Financial results (Rs m) Q1 FY16 Q1 FY15 % yoy Q4 FY15 % qoq
Net sales 77,130 104,640 (26.3) 67,470 14.3
Material costs (48,651) (79,829) (39.1) (39,868) 22.0
Purchases (7,271) (5,308) 37.0 (6,817) 6.7
Personnel costs (1,976) (1,480) 33.5 (1,659) 19.1
Other overheads (9,055) (9,034) 0.2 (9,258) (2.2)
Operating profit 10,177 8,989 13.2 9,868 3.1
OPM (%) 13.2 8.6 460 bps 14.6 ‐143 bps
Depreciation (3,041) (2,782) 9.3 (2,787) 9.1
Interest (902) (505) 78.6 (677) 33.2
Other income 1,832 1,974 (7.2) 2,172 (15.7)
PBT 8,066 7,676 5.1 8,576 (5.9)
Tax (1,929) (1,765) 9.3 (2,080) (7.3)
Effective tax rate (%) 23.9 23.0 24.3
Other provisions / minority etc 85 46 84.8 (115) (173.9)
Adjusted PAT 6,222 5,957 4.4 6,381 (2.5)
Adj. PAT margin (%) 8.1 5.7 237 bps 9.5 ‐139 bps
Reported PAT 6,222 5,957 4.4 6,381 (2.5)
Ann. EPS (Rs) 76.9 73.7 4.4 78.9 (2.5) Source: Company, India Infoline Research
Reliance Industries (Q1 FY16)
8
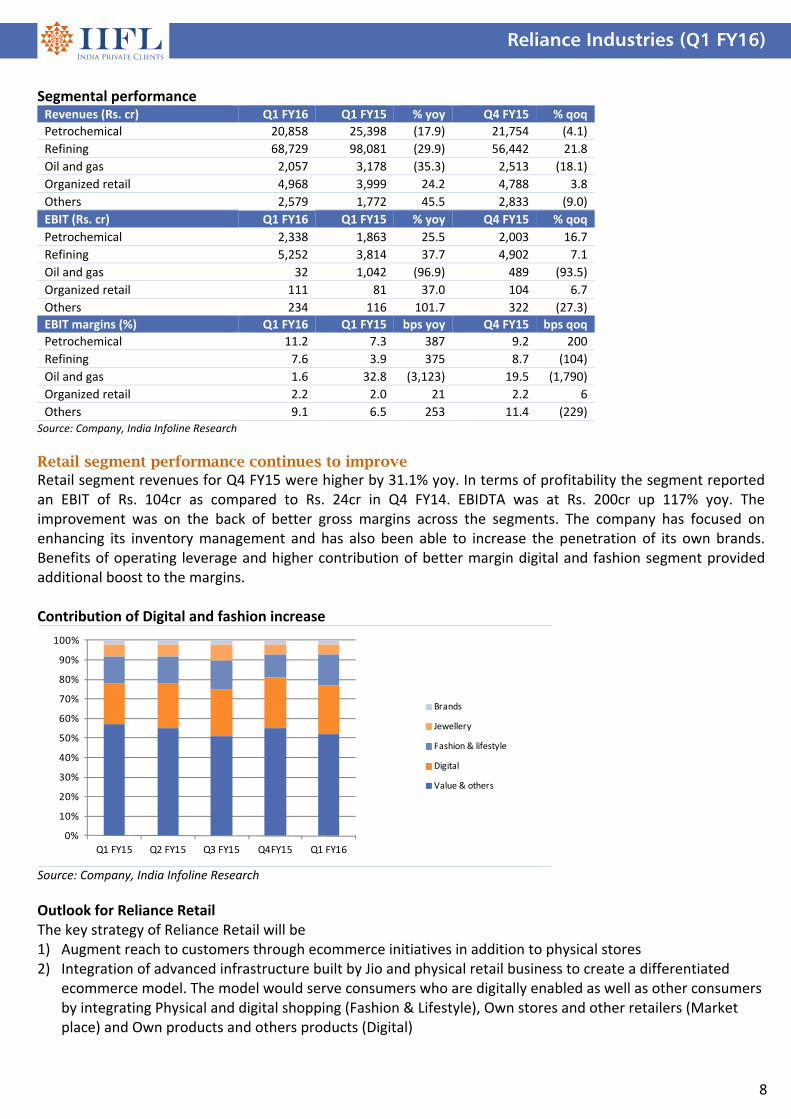
Segmental performance Revenues (Rs. cr) Q1 FY16 Q1 FY15 % yoy Q4 FY15 % qoq
Petrochemical 20,858 25,398 (17.9) 21,754 (4.1)
Refining 68,729 98,081 (29.9) 56,442 21.8
Oil and gas 2,057 3,178 (35.3) 2,513 (18.1)
Organized retail 4,968 3,999 24.2 4,788 3.8
Others 2,579 1,772 45.5 2,833 (9.0)
EBIT (Rs. cr) Q1 FY16 Q1 FY15 % yoy Q4 FY15 % qoq
Petrochemical 2,338 1,863 25.5 2,003 16.7
Refining 5,252 3,814 37.7 4,902 7.1
Oil and gas 32 1,042 (96.9) 489 (93.5)
Organized retail 111 81 37.0 104 6.7
Others 234 116 101.7 322 (27.3)
EBIT margins (%) Q1 FY16 Q1 FY15 bps yoy Q4 FY15 bps qoq
Petrochemical 11.2 7.3 387 9.2 200
Refining 7.6 3.9 375 8.7 (104)
Oil and gas 1.6 32.8 (3,123) 19.5 (1,790)
Organized retail 2.2 2.0 21 2.2 6
Others 9.1 6.5 253 11.4 (229) Source: Company, India Infoline Research
Retail segment performance continues to improve Retail segment revenues for Q4 FY15 were higher by 31.1% yoy. In terms of profitability the segment reported an EBIT of Rs. 104cr as compared to Rs. 24cr in Q4 FY14. EBIDTA was at Rs. 200cr up 117% yoy. The improvement was on the back of better gross margins across the segments. The company has focused on enhancing its inventory management and has also been able to increase the penetration of its own brands. Benefits of operating leverage and higher contribution of better margin digital and fashion segment provided additional boost to the margins. Contribution of Digital and fashion increase
0%
10%
20%
30%
40%
50%
60%
70%
80%
90%
100%
Q1 FY15 Q2 FY15 Q3 FY15 Q4FY15 Q1 FY16
Brands
Jewellery
Fashion & lifestyle
Digital
Value & others
Source: Company, India Infoline Research
Outlook for Reliance Retail The key strategy of Reliance Retail will be 1) Augment reach to customers through ecommerce initiatives in addition to physical stores 2) Integration of advanced infrastructure built by Jio and physical retail business to create a differentiated
ecommerce model. The model would serve consumers who are digitally enabled as well as other consumers by integrating Physical and digital shopping (Fashion & Lifestyle), Own stores and other retailers (Market place) and Own products and others products (Digital)
Reliance Industries (Q1 FY16)
9
Reliance Jio – vast service offerings at ARPUs similar to incumbent players The company provided details for its telecom operations which is slated to launch in December 2015. The company sees large potential in the domestic market due to under‐penetration of high speed data services. The company with its in house inventory along with asset light efficient technology plans to offer wide array of services at ARPUs similar to existing players. Even a Rs4,000 handset would be able to access 4G with ease. Considering the experience of China Mobile in the launch of 4G, Reliance Jio is hopeful of large market share gains. With regards to VoLTE the company sees no issues as it has its own application for the same. It has built a strong infrastructure for launch Pan India spectrum footprint with Eight circles with spectrum in all three bands and 20 out of 22 circles have
at least one of 800MHz or 1800MHz spectrum alongside spectrum in 2300MHz band
Network of nearly 250,000 route km of fiber optics, Fiber footprint to be doubled over the next 3 years
Over 75,000 eNodeB at launch across the country
0.65mn sq ft of data center capacity across three locations to be operational by launch and will be expanded to over 1.5mn sq ft in the next 3 years
Jio will have direct physical presence through over 1,000 Jio Centers across the country
Distribution network will include 0.5 million connectivity outlets and 1mn additional recharge outlets at launch
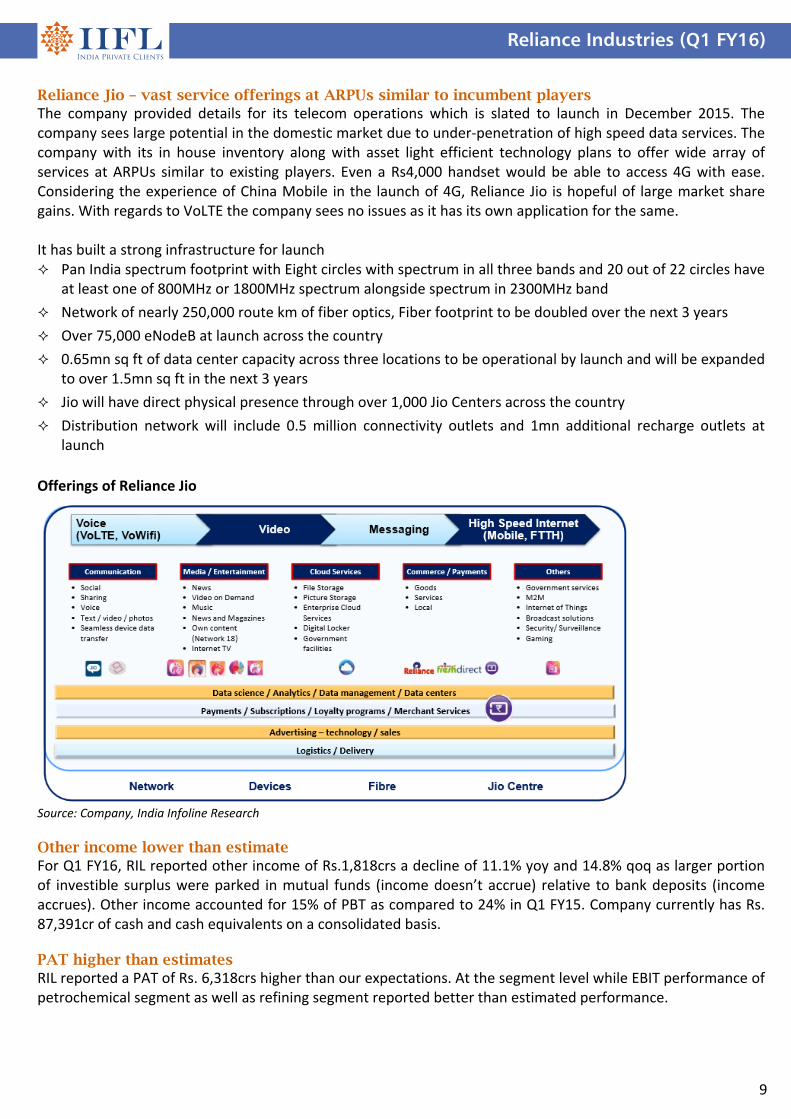
Offerings of Reliance Jio
Source: Company, India Infoline Research
Other income lower than estimate For Q1 FY16, RIL reported other income of Rs.1,818crs a decline of 11.1% yoy and 14.8% qoq as larger portion of investible surplus were parked in mutual funds (income doesn’t accrue) relative to bank deposits (income accrues). Other income accounted for 15% of PBT as compared to 24% in Q1 FY15. Company currently has Rs. 87,391cr of cash and cash equivalents on a consolidated basis. PAT higher than estimates RIL reported a PAT of Rs. 6,318crs higher than our expectations. At the segment level while EBIT performance of petrochemical segment as well as refining segment reported better than estimated performance.

Reliance Industries (Q1 FY16)
10
Maintain BUY Over the past few years RIL has underperformed the broader market rally. One of the prime reasons for the same has been a weak performance of its E&P segment plagued by falling gas production and bureaucratic issues. Over the next three years, we believe, these core businesses will drive a strong 25% CAGR in standalone EBIDTA on the back of commencement of large scale projects ‐ off gas cracker and petcoke gasification. The petcoke gasification project whereby RIL is investing US$4bn is expected to commence operations in FY17. Commencement of this project will allow RIL to replace expensive RLNG with gas produced from petcoke leading to incremental US$2/bbl GRM (management guidance of US$2.5/bbl). Off gas cracker will provide a consistent low cost supply of feedstock to the petrochemical plants where RIL is increasing its capacity. While the global environment has been moderately improving form GRMs and petrochemical spreads, RIL will outperform the benchmarks by a significant margin. The E&P segment, which has gone through its share of trials and tribulations, is likely to see a revival in fortunes with gas price hike, moderate increase in production at KG‐D6, commencement of production at new fields and possible exploration upsides from current exploration activities. Shale gas on the other hand will continue to show robust growth in revenues and profitability as both volumes and gas prices head north. While Telecom business might achieve EBIDTA breakeven in three years considering its asset light model, Retail business will show improved trend in profitability. We are cutting our estimates to factor in lower crude oil prices. However, P/E valuations of 9.7x on FY17E earnings is much below RIL’s historical average and we believe a re‐rating is due given strong earnings growth profile in the coming years. We maintain BUY with a 2‐year price target of Rs1,300.
Other income surges as % of PBT Cash balance declines sequentially due to capex
0.0%
2.0%
4.0%
6.0%
8.0%
10.0%
12.0%
14.0%
0
500
1,000
1,500
2,000
2,500
3,000
Q1 FY12
Q2 FY12
Q3 FY12
Q4 FY12
Q1 FY13
Q2 FY13
Q3 FY13
Q4 FY13
Q1 FY14
Q2 FY14
Q3 FY14
Q4 FY14
Q1 FY15
Q2 FY15
Q3 FY15
Q4 FY15
Q1 FY16
EBIT EBIT Margins
Rs. cr
0
10,000
20,000
30,000
40,000
50,000
60,000
70,000
80,000
90,000
100,000
Q4 FY12
Q1 FY13
Q2 FY13
Q3 FY13
Q4 FY13
Q1 FY14
Q2 FY14
Q3 FY14
Q4 FY14
Q1 FY15
Q2 FY15
Q3 FY15
Q4 FY15
Q1 FY16
CashRs. cr
Source: Company, India Infoline Research
Reliance Industries (Q1 FY16)
11
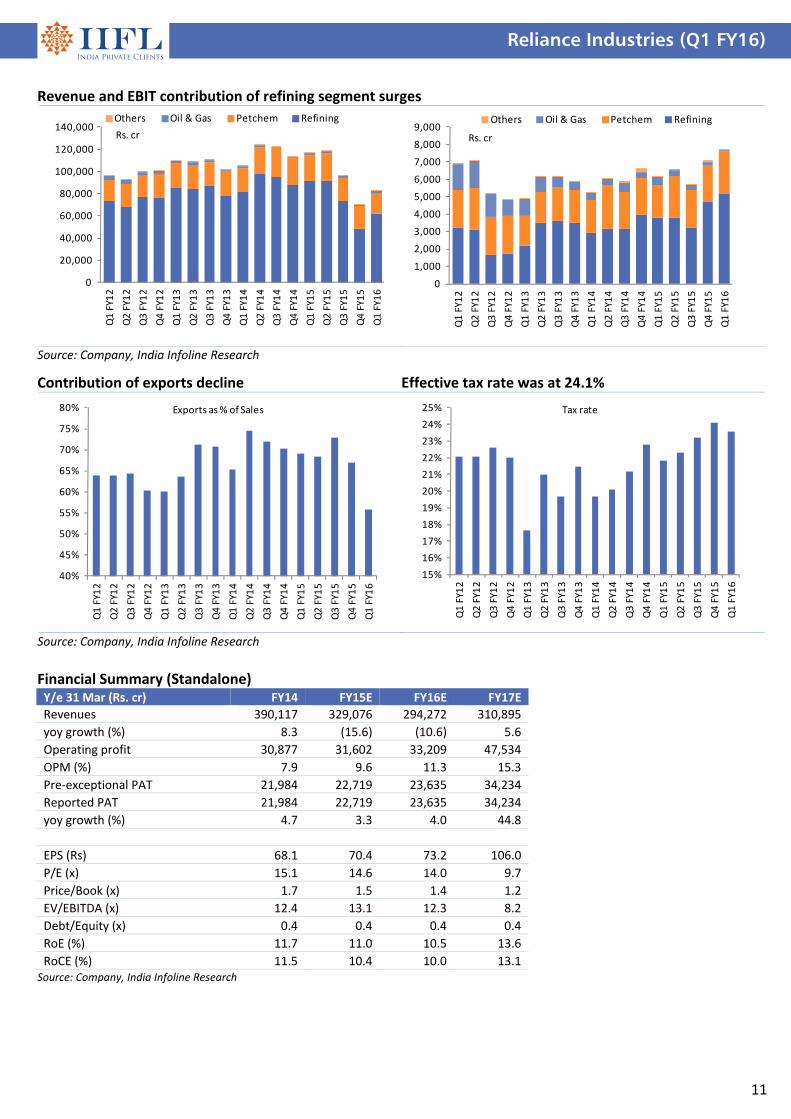
Revenue and EBIT contribution of refining segment surges
0
20,000
40,000
60,000
80,000
100,000
120,000
140,000
Q1 FY12
Q2 FY12
Q3 FY12
Q4 FY12
Q1 FY13
Q2 FY13
Q3 FY13
Q4 FY13
Q1 FY14
Q2 FY14
Q3 FY14
Q4 FY14
Q1 FY15
Q2 FY15
Q3 FY15
Q4 FY15
Q1 FY16
Others Oil & Gas Petchem Refining
Rs. cr
0
1,000
2,000
3,000
4,000
5,000
6,000
7,000
8,000
9,000
Q1 FY12
Q2 FY12
Q3 FY12
Q4 FY12
Q1 FY13
Q2 FY13
Q3 FY13
Q4 FY13
Q1 FY14
Q2 FY14
Q3 FY14
Q4 FY14
Q1 FY15
Q2 FY15
Q3 FY15
Q4 FY15
Q1 FY16
Others Oil & Gas Petchem Refining
Rs. cr
Source: Company, India Infoline Research
Contribution of exports decline Effective tax rate was at 24.1%
40%
45%
50%
55%
60%
65%
70%
75%
80%
Q1 FY12
Q2 FY12
Q3 FY12
Q4 FY12
Q1 FY13
Q2 FY13
Q3 FY13
Q4 FY13
Q1 FY14
Q2 FY14
Q3 FY14
Q4 FY14
Q1 FY15
Q2 FY15
Q3 FY15
Q4 FY15
Q1 FY16
Exports as % of Sales
15%
16%
17%
18%
19%
20%
21%
22%
23%
24%
25%
Q1 FY12
Q2 FY12
Q3 FY12
Q4 FY12
Q1 FY13
Q2 FY13
Q3 FY13
Q4 FY13
Q1 FY14
Q2 FY14
Q3 FY14
Q4 FY14
Q1 FY15
Q2 FY15
Q3 FY15
Q4 FY15
Q1 FY16
Tax rate
Source: Company, India Infoline Research
Financial Summary (Standalone) Y/e 31 Mar (Rs. cr) FY14 FY15E FY16E FY17E
Revenues 390,117 329,076 294,272 310,895
yoy growth (%) 8.3 (15.6) (10.6) 5.6
Operating profit 30,877 31,602 33,209 47,534
OPM (%) 7.9 9.6 11.3 15.3
Pre‐exceptional PAT 21,984 22,719 23,635 34,234
Reported PAT 21,984 22,719 23,635 34,234
yoy growth (%) 4.7 3.3 4.0 44.8
EPS (Rs) 68.1 70.4 73.2 106.0
P/E (x) 15.1 14.6 14.0 9.7
Price/Book (x) 1.7 1.5 1.4 1.2
EV/EBITDA (x) 12.4 13.1 12.3 8.2
Debt/Equity (x) 0.4 0.4 0.4 0.4
RoE (%) 11.7 11.0 10.5 13.6
RoCE (%) 11.5 10.4 10.0 13.1 Source: Company, India Infoline Research

‘Best Broker of the Year’ – by Zee Business for contribution to brokingNirmal Jain, Chairman, IIFL, received the award for The Best Broker of the Year (for contribution to broking in India) at India's Best Market Analyst Awards 2014 organised by the Zee Business in Mumbai. The award was presented by the guest of Honour Amit Shah, president of the Bharatiya Janata Party and Piyush Goel, Minister of state with independent charge for power, coal new and renewable energy.
'Best Equity Broker of the Year' – Bloomberg UTV, 2011IIFL was awarded the 'Best Equity Broker of the Year' at the recently held Bloomberg UTV Financial Leadership Award, 2011. The award presented by the Hon'ble Finance Minister of India, Shri Pranab Mukherjee. The Bloomberg UTV Financial Leadership Awards acknowledge the extraordinary contribution of India's financial leaders and visionaries from January 2010 to January 2011.
'Best Broker in India' – Finance Asia, 2011IIFL has been awarded the 'Best Broker in India' by Finance Asia. The award is the result of Finance Asia's annual quest for the best financial services firms across Asia, which culminated in the Country Awards 2011
Other awards
2012BEST BROKING HOUSE WITH
GLOBAL PRESENCE
2009, 2012 & 2013BEST MARKET
ANALYSTBEST BROKERAGE,
INDIAMOST IMPROVED,
INDIABEST BROKER,
INDIA
2009FASTEST GROWING
LARGE BROKING HOUSE
Recommendation parameters for fundamental reports:
Buy – Absolute return of over +15%
Accumulate – Absolute return between 0% to +15%
Reduce – Absolute return between 0% to ‐10%
Sell – Absolute return below ‐10%
Call Failure ‐ In case of a Buy report, if the stock falls 20% below the recommended price on a closing basis, unless otherwise specified by the analyst; or, in case of a Sell report, if the stock rises 20% above the recommended price on a closing basis, unless otherwise specified by the analyst
India Infoline Group (hereinafter referred as IIFL) is engaged in diversified financial services business including equity broking, DP services, merchant banking, portfolio management services, distribution of Mutual Fund, insurance products and other investment products and also loans and finance business. India Infoline Ltd (“hereinafter referred as IIL”) is a part of the IIFL and is a member of the National Stock Exchange of India Limited (“NSE”) and the BSE Limited (“BSE”). IIL is also a Depository Participant registered with NSDL & CDSL, a SEBI registered merchant banker and a SEBI registered portfolio manager. IIL is a large broking house catering to retail, HNI and institutional clients. It operates through its branches and authorised persons and sub‐brokers spread across the country and the clients are provided online trading through internet and offline trading through branches and Customer Care. Terms & Conditions and Other Disclosures:‐ a) This research report (“Report”) is for the personal information of the authorised recipient(s) and is not for public distribution and should not be
reproduced or redistributed to any other person or in any form without IIL’s prior permission. The information provided in the Report is from publicly available data, which we believe, are reliable. While reasonable endeavors have been made to present reliable data in the Report so far as it relates to current and historical information, but IIL does not guarantee the accuracy or completeness of the data in the Report. Accordingly, IIL or any of its connected persons including its directors or subsidiaries or associates or employees shall not be in any way responsible for any loss or damage that may arise to any person from any inadvertent error in the information contained, views and opinions expressed in this publication.
b) Past performance should not be taken as an indication or guarantee of future performance, and no representation or warranty, express or implied, is
made regarding future performance. Information, opinions and estimates contained in this report reflect a judgment of its original date of publication by IIFL and are subject to change without notice. The price, value of and income from any of the securities or financial instruments mentioned in this report can fall as well as rise. The value of securities and financial instruments is subject to exchange rate fluctuation that may have a positive or adverse effect on the price or income of such securities or financial instruments.
c) The Report also includes analysis and views of our research team. The Report is purely for information purposes and does not construe to be
investment recommendation/advice or an offer or solicitation of an offer to buy/sell any securities. The opinions expressed in the Report are our current opinions as of the date of the Report and may be subject to change from time to time without notice. IIL or any persons connected with it do not accept any liability arising from the use of this document.
d) Investors should not solely rely on the information contained in this Report and must make investment decisions based on their own investment
objectives, judgment, risk profile and financial position. The recipients of this Report may take professional advice before acting on this information.

e) IIL has other business segments / divisions with independent research teams separated by 'chinese walls' catering to different sets of customers having varying objectives, risk profiles, investment horizon, etc and therefore, may at times have, different and contrary views on stocks, sectors and markets.
f) This report is not directed or intended for distribution to, or use by, any person or entity who is a citizen or resident of or located in any locality, state,
country or other jurisdiction, where such distribution, publication, availability or use would be contrary to local law, regulation or which would subject IIL and its affiliates to any registration or licensing requirement within such jurisdiction. The securities described herein may or may not be eligible for sale in all jurisdictions or to certain category of investors. Persons in whose possession this Report may come are required to inform themselves of and to observe such restrictions.
g) As IIL along with its associates, are engaged in various financial services business and so might have financial, business or other interests in other entities
including the subject company/ies mentioned in this Report. However, IIL encourages independence in preparation of research report and strives to minimize conflict in preparation of research report. IIL and its associates did not receive any compensation or other benefits from the subject company/ies mentioned in the Report or from a third party in connection with preparation of the Report. Accordingly, IIL and its associates do not have any material conflict of interest at the time of publication of this Report.
h) As IIL and its associates are engaged in various financial services business, it might have:‐
(a) received any compensation (except in connection with the preparation of this Report) from the subject company in the past twelve months; (b) managed or co‐managed public offering of securities for the subject company in the past twelve months; (c) received any compensation for investment banking or merchant banking or brokerage services from the subject company in the past twelve months; (d) received any compensation for products or services other than investment banking or merchant banking or brokerage services from the subject company in the past twelve months; (e) engaged in market making activity for the subject company.
i) IIL and its associates collectively do not own (in their proprietary position) 1% or more of the equity securities of the subject company/ies mentioned in the report as of the last day of the month preceding the publication of the research report.
j) The Research Analyst/s engaged in preparation of this Report or his/her relative
(a) does not have any financial interests in the subject company/ies mentioned in this report; (b) does not own 1% or more of the equity securities of the subject company mentioned in the report as of the last day of the month preceding the publication of the research report; (c) does not have any other material conflict of interest at the time of publication of the research report.
k) The Research Analyst/s engaged in preparation of this Report:‐ (a) has not received any compensation from the subject company in the past twelve months; (b) has not managed or co‐managed public offering of securities for the subject company in the past twelve months; (c) has not received any compensation for investment banking or merchant banking or brokerage services from the subject company in the past twelve months; (d) has not received any compensation for products or services other than investment banking or merchant banking or brokerage services from the subject company in the past twelve months; (e) has not received any compensation or other benefits from the subject company or third party in connection with the research report; (f) has not served as an officer, director or employee of the subject company; (g) is not engaged in market making activity for the subject company.
We submit that no material disciplinary action has been taken on IIL by any regulatory authority impacting Equity Research Analysis. A graph of daily closing prices of securities is available at http://www.nseindia.com/ChartApp/install/charts/mainpage.jsp, www.bseindia.com and http://economictimes.indiatimes.com/markets/stocks/stock‐quotes. (Choose a company from the list on the browser and select the “three years” period in the price chart).
Published in 2015. © India Infoline Ltd 2015 India Infoline Limited (Formerly “India Infoline Distribution Company Limited”), CIN No.: U99999MH1996PLC132983, Corporate Office – IIFL Centre, Kamala City, Senapati Bapat Marg, Lower Parel, Mumbai – 400013 Tel: (91‐22) 4249 9000 .Fax: (91‐22) 40609049, Regd. Office – IIFL House, Sun Infotech Park, Road No. 16V, Plot No. B‐23, MIDC, Thane Industrial Area, Wagle Estate, Thane – 400604 Tel: (91‐22) 25806650. Fax: (91‐22) 25806654 E‐mail: [email protected] Website: www.indiainfoline.com, Refer www.indiainfoline.com for detail of Associates. National Stock Exchange of India Ltd. SEBI Regn. No. : INB231097537/ INF231097537/ INE231097537, Bombay Stock Exchange Ltd. SEBI Regn. No.:INB011097533/ INF011097533/ BSE‐Currency, MCX Stock Exchange Ltd. SEBI Regn. No.: INB261097530/ INF261097530/ INE261097537, United Stock Exchange Ltd. SEBI Regn. No.: INE271097532, PMS SEBI Regn. No. INP000002213, IA SEBI Regn. No. INA000000623, SEBI RA Regn.: INH000000248
For Research related queries, write to: Amar Ambani, Head of Research at [email protected] For Sales and Account related information, write to customer care: [email protected] or call on 91‐22 4007 1000