reliability of safety management methods: diagnosis · economic appraisal in the reliability of...
TRANSCRIPT
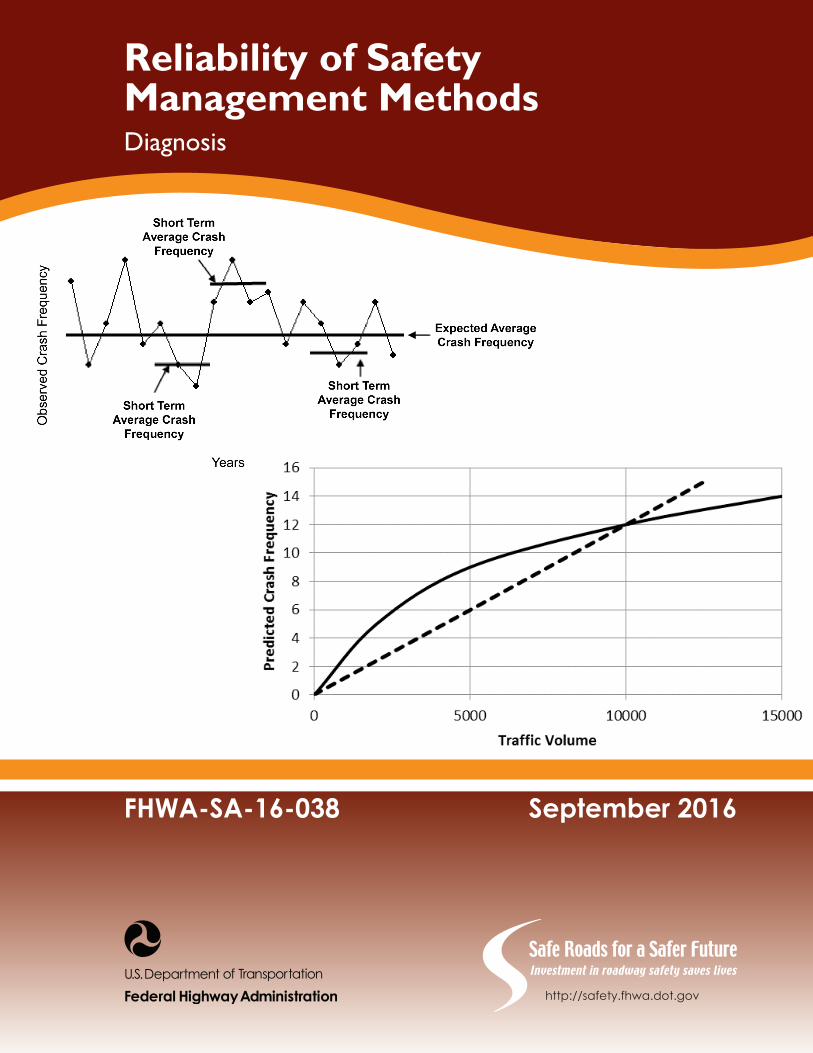
Reliability of Safety Management Methods Diagnosis
FHWA-SA-16-038 September 2016
http://safety.fhwa.dot.gov

RELIABILITY OF SAFETY MANAGEMENT METHODS: DIAGNOSIS
NOTICE
This document is disseminated under the sponsorship of the U.S. Department of Transportation in the interest of information exchange. The U.S. Government assumes no liability for the use of the information contained in this document. This report does not constitute a standard, specification, or regulation.
The U.S. Government does not endorse products or manufacturers. Trademarks or manufacturers' names appear in this report only because they are considered essential to the objective of the document.
QUALITY ASSURANCE STATEMENT
The Federal Highway Administration (FHWA) provides high-quality information to serve Government, industry, and the public in a manner that promotes public understanding. Standards and policies are used to ensure and maximize the quality, objectivity, utility, and integrity of its information. FHWA periodically reviews quality issues and adjusts its programs and processes to ensure continuous quality improvement.
ii
1. Report No.
FHWA-SA-16-038 2. Government Accession No. 3. Recipient's Catalog No.
4. Title and Subtitle Reliability of Safety Management Methods: Diagnosis
5. Report Date September 2016
6. Performing Organization Code
7. Author(s) Raghavan Srinivasan, Geni Bahar, and Frank Gross
8. Performing Organization Report No.
9. Performing Organization Name and Address VHB
8300 Boone Boulevard Suite 700
Vienna, VA 22182
10. Work Unit No.
11. Contract or Grant No.DTFH61-10-D-00022-T-13005
12. Sponsoring Agency Name and Address Federal Highway Administration Office of Safety
1200 New Jersey Ave., SE Washington, DC 20590
13. Type of Report and Period Final Report, March 2015 – September 2016
14. Sponsoring Agency CodeFHWA
15. Supplementary Notes The Contracting Officer’s Task Manager (COTM) was Stuart Thompson.
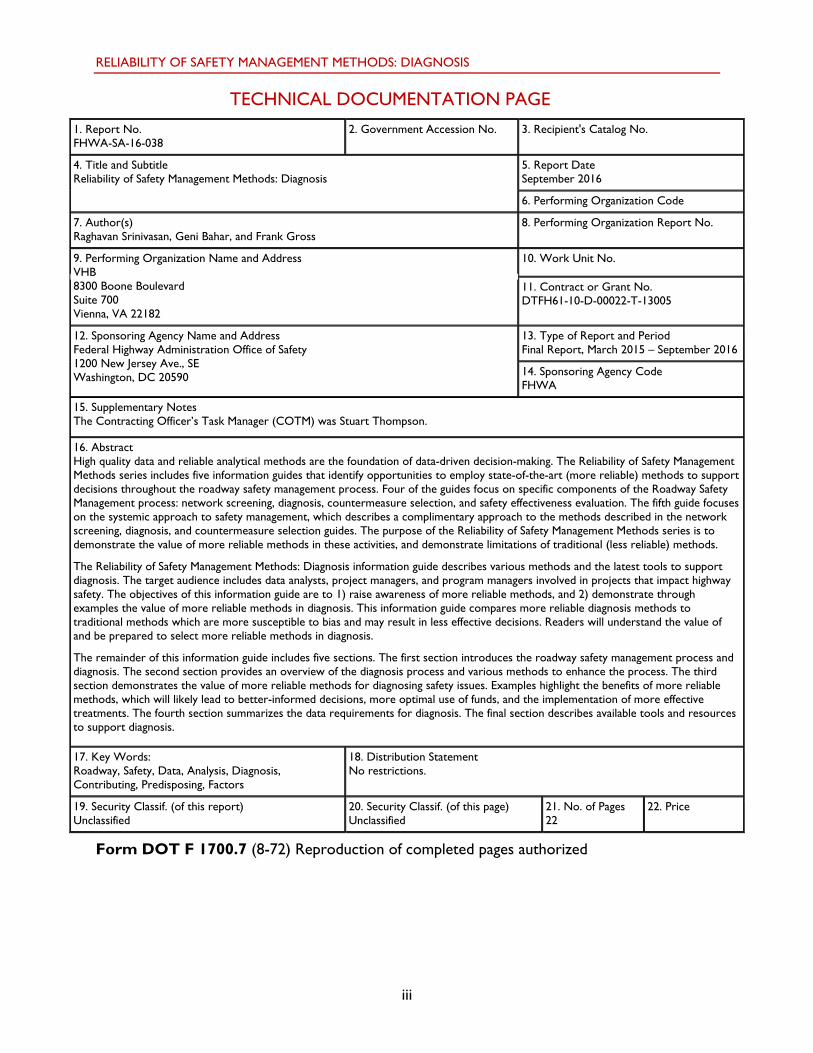
16. Abstract High quality data and reliable analytical methods are the foundation of data-driven decision-making. The Reliability of Safety Management
Methods series includes five information guides that identify opportunities to employ state-of-the-art (more reliable) methods to support decisions throughout the roadway safety management process. Four of the guides focus on specific components of the Roadway Safety
Management process: network screening, diagnosis, countermeasure selection, and safety effectiveness evaluation. The fifth guide focuses on the systemic approach to safety management, which describes a complimentary approach to the methods described in the network
screening, diagnosis, and countermeasure selection guides. The purpose of the Reliability of Safety Management Methods series is to demonstrate the value of more reliable methods in these activities, and demonstrate limitations of traditional (less reliable) methods.
The Reliability of Safety Management Methods: Diagnosis information guide describes various methods and the latest tools to support diagnosis. The target audience includes data analysts, project managers, and program managers involved in projects that impact highway
safety. The objectives of this information guide are to 1) raise awareness of more reliable methods, and 2) demonstrate through examples the value of more reliable methods in diagnosis. This information guide compares more reliable diagnosis methods to
traditional methods which are more susceptible to bias and may result in less effective decisions. Readers will understand the value of and be prepared to select more reliable methods in diagnosis.
The remainder of this information guide includes five sections. The first section introduces the roadway safety management process and diagnosis. The second section provides an overview of the diagnosis process and various methods to enhance the process. The third
section demonstrates the value of more reliable methods for diagnosing safety issues. Examples highlight the benefits of more reliable methods, which will likely lead to better-informed decisions, more optimal use of funds, and the implementation of more effective
treatments. The fourth section summarizes the data requirements for diagnosis. The final section describes available tools and resources to support diagnosis.
17. Key Words:Roadway, Safety, Data, Contributing, Predisposing, Factors
Analysis, Diagnosis,
18. Distribution Statement No restrictions.
19. Security Classif. (of this report) Unclassified
20. Security Classif. (of this page) Unclassified
21. No. of Pages 22
22. Price
Form DOT F 1700.7 (8-72) Reproduction of completed pages authorized
RELIABILITY OF SAFETY MANAGEMENT METHODS: DIAGNOSIS
TECHNICAL DOCUMENTATION PAGE
iii

RELIABILITY OF SAFETY MANAGEMENT METHODS: DIAGNOSIS
ACKNOWLEDGMENTS
The project team would like to thank the following individuals who served as members on the Technical Working Group for this effort.
Technical Working Group
Stuart Thompson, FHWA Office of Safety
Ray Krammes, FHWA Office of Safety
Yanira Rivera, FHWA Office of Safety
Karen Scurry, FHWA Office of Safety
Craig Thor, FHWA Office of Safety Research and Development
iv
RELIABILITY OF SAFETY MANAGEMENT METHODS: DIAGNOSIS
TABLE OF CONTENTS
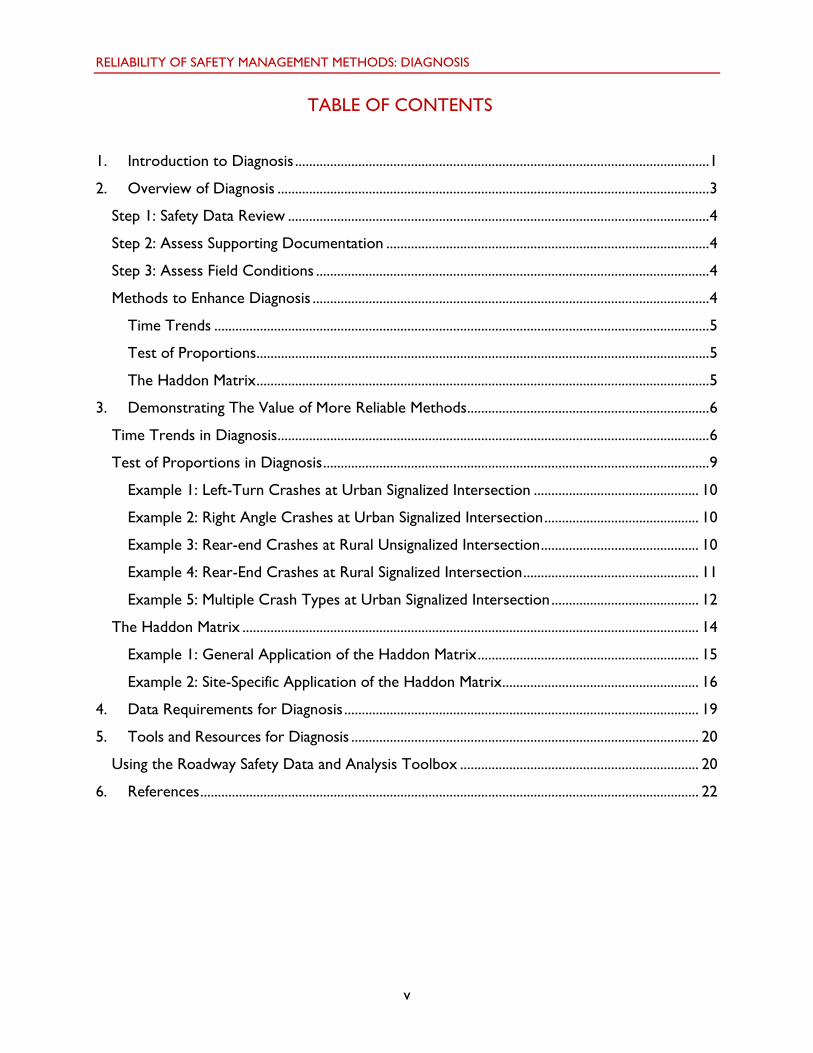
1. Introduction to Diagnosis ...................................................................................................................... 1
2. Overview of Diagnosis ........................................................................................................................... 3
Step 1: Safety Data Review ........................................................................................................................ 4
Step 2: Assess Supporting Documentation ............................................................................................ 4
Step 3: Assess Field Conditions ................................................................................................................ 4
Methods to Enhance Diagnosis ................................................................................................................. 4
Time Trends ............................................................................................................................................. 5
Test of Proportions ................................................................................................................................. 5
The Haddon Matrix ................................................................................................................................. 5
3. Demonstrating The Value of More Reliable Methods ..................................................................... 6
Time Trends in Diagnosis ........................................................................................................................... 6
Test of Proportions in Diagnosis .............................................................................................................. 9
Example 1: Left-Turn Crashes at Urban Signalized Intersection ............................................... 10
Example 2: Right Angle Crashes at Urban Signalized Intersection ............................................ 10
Example 3: Rear-end Crashes at Rural Unsignalized Intersection ............................................. 10
Example 4: Rear-End Crashes at Rural Signalized Intersection .................................................. 11
Example 5: Multiple Crash Types at Urban Signalized Intersection .......................................... 12
The Haddon Matrix .................................................................................................................................. 14
Example 1: General Application of the Haddon Matrix ............................................................... 15
Example 2: Site-Specific Application of the Haddon Matrix ........................................................ 16
4. Data Requirements for Diagnosis ..................................................................................................... 19
5. Tools and Resources for Diagnosis ................................................................................................... 20
Using the Roadway Safety Data and Analysis Toolbox .................................................................... 20
6. References .............................................................................................................................................. 22
v
RELIABILITY OF SAFETY MANAGEMENT METHODS: DIAGNOSIS
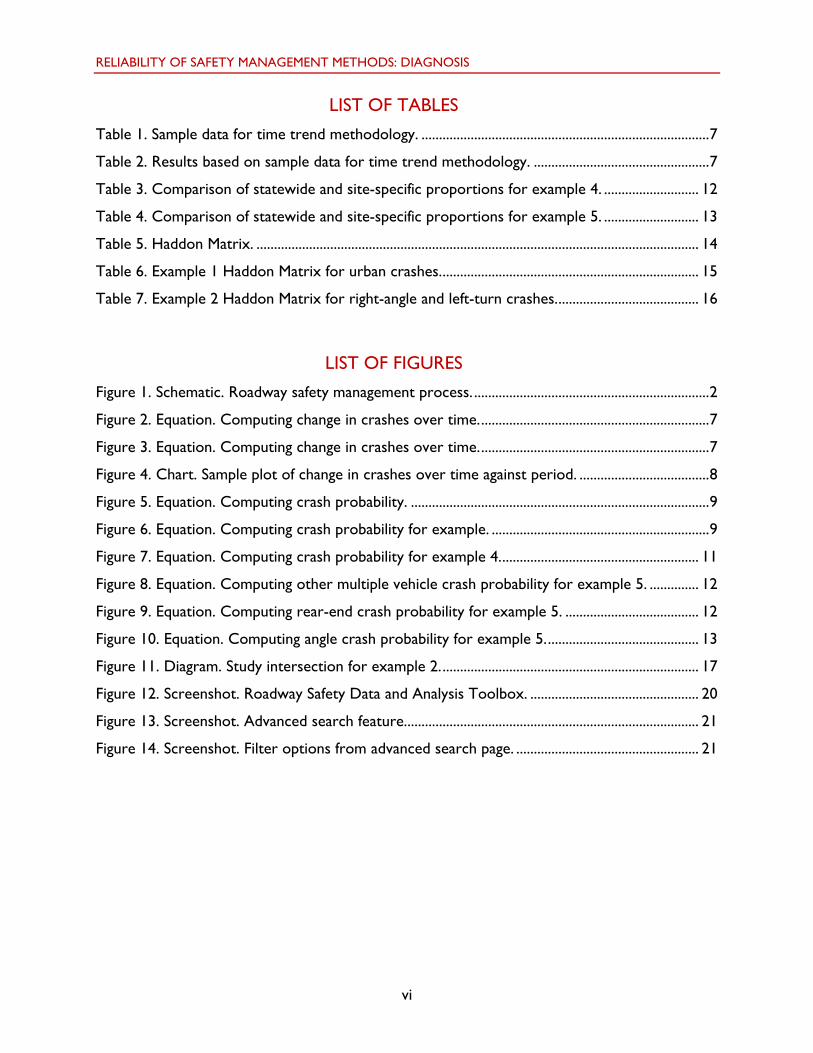
LIST OF TABLES
Table 1. Sample data for time trend methodology. .................................................................................. 7
Table 2. Results based on sample data for time trend methodology. .................................................. 7
Table 3. Comparison of statewide and site-specific proportions for example 4. ........................... 12
Table 4. Comparison of statewide and site-specific proportions for example 5. ........................... 13
Table 5. Haddon Matrix. .............................................................................................................................. 14
Table 6. Example 1 Haddon Matrix for urban crashes. ......................................................................... 15
Table 7. Example 2 Haddon Matrix for right-angle and left-turn crashes. ........................................ 16
LIST OF FIGURES
Figure 1. Schematic. Roadway safety management process. ................................................................... 2
Figure 2. Equation. Computing change in crashes over time. ................................................................. 7
Figure 3. Equation. Computing change in crashes over time. ................................................................. 7
Figure 4. Chart. Sample plot of change in crashes over time against period. ..................................... 8
Figure 5. Equation. Computing crash probability. ..................................................................................... 9
Figure 6. Equation. Computing crash probability for example. .............................................................. 9
Figure 7. Equation. Computing crash probability for example 4. ........................................................ 11
Figure 8. Equation. Computing other multiple vehicle crash probability for example 5. .............. 12
Figure 9. Equation. Computing rear-end crash probability for example 5. ...................................... 12
Figure 10. Equation. Computing angle crash probability for example 5. ........................................... 13
Figure 11. Diagram. Study intersection for example 2. ......................................................................... 17
Figure 12. Screenshot. Roadway Safety Data and Analysis Toolbox. ................................................ 20
Figure 13. Screenshot. Advanced search feature. ................................................................................... 21
Figure 14. Screenshot. Filter options from advanced search page. .................................................... 21
vi
RELIABILITY OF SAFETY MANAGEMENT METHODS: DIAGNOSIS
AASHTO American Association of State Highway and Transportation Officials
EMS Emergency medical services
FHWA Federal Highway Administration
HSIP Highway Safety Improvement Program
NCHRP National Cooperative Highway Research Program
RSA Road safety audit
LIST OF ACRONYMS
vii
RELIABILITY OF SAFETY MANAGEMENT METHODS: DIAGNOSIS
PREFACE
High quality data and reliable analytical methods are the foundation of data-driven decision-making. The Reliability of Safety Management Methods series includes five information guides that identify opportunities to employ state-of-the-art (more reliable) methods to support decisions throughout the roadway safety management process. Four of the guides focus on specific components of the Roadway Safety Management process: network screening, diagnosis, countermeasure selection, and safety effectiveness evaluation. The fifth guide focuses on the systemic approach to safety management, which describes a complimentary approach to the methods described in the network screening, diagnosis, and countermeasure selection guides. The purpose of the Reliability of Safety Management Methods series is to demonstrate the value of more reliable methods in these activities, and demonstrate limitations of traditional (less reliable) methods.
The Reliability of Safety Management Methods: Diagnosis information guide describes various methods and the latest tools to support diagnosis. The target audience includes data analysts, project managers, and program managers involved in projects that impact highway safety. The objectives of this information guide are to 1) raise awareness of more reliable methods, and 2) demonstrate through examples the value of more reliable methods in diagnosis. This information guide compares more reliable diagnosis methods to traditional methods which are more susceptible to bias and may result in less effective decisions. Readers will understand the value of and be prepared to select more reliable methods in diagnosis.
The remainder of this information guide includes five sections. The first section introduces the roadway safety management process and diagnosis. The second section provides an overview of the diagnosis process and various methods to enhance the process. The third section demonstrates the value of more reliable methods for diagnosing sa fety issues. Examples highlight the benefits of more reliable methods, which will likely lead to better-informed decisions, more optimal use of funds, and the implementation of more effective treatments. The fourth section summarizes the data requirements for diagnosis. The final section describes available tools and resources to support diagnosis.
viii
RELIABILITY OF SAFETY MANAGEMENT METHODS: DIAGNOSIS
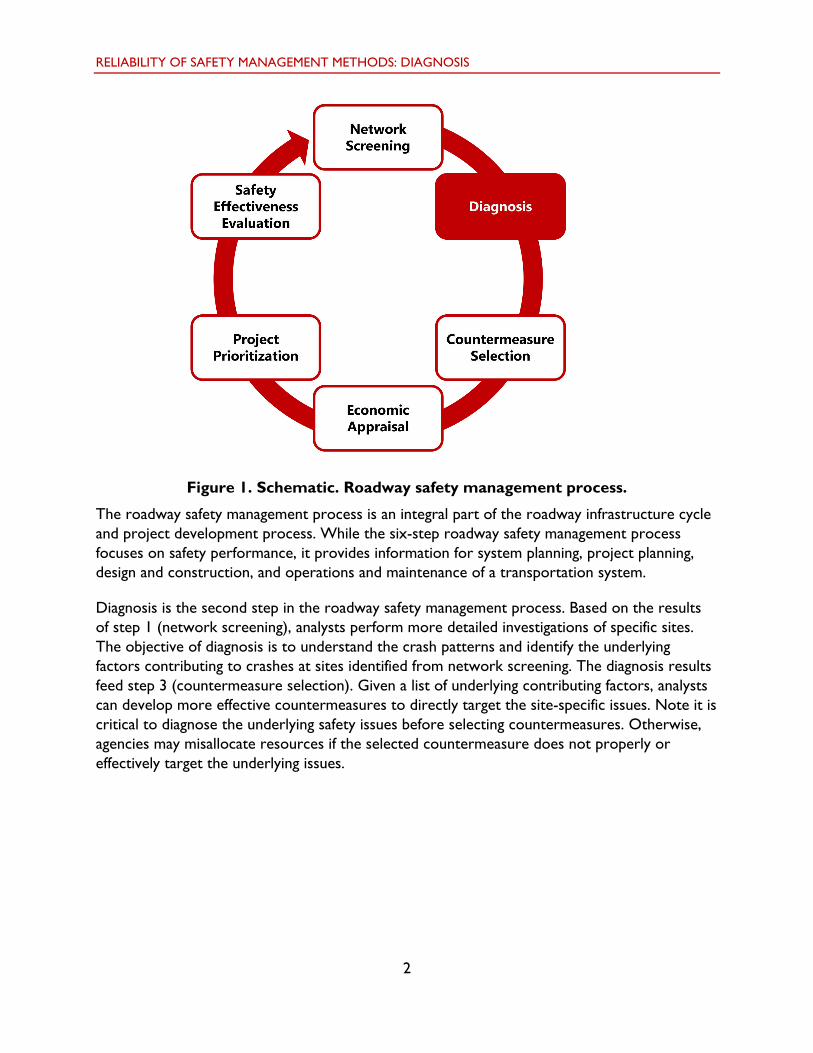
1. INTRODUCTION TO DIAGNOSISThe roadway safety management process is a six-step process as shown in Figure 1 and outlined in the Highway Safety Manual (HSM).(1) The objectives of this process are as follows.
1. Network Screening: Identify locations that could benefit from treatments to improvesafety performance (i.e., reduce crash frequency and severity). Refer to the Reliability ofSafety Management Methods: Network Screening for further discussion of networkscreening and related methods.(2)
2. Diagnosis: Understand collision patterns and crash contributing factors. Agenciesidentify crash trends and patterns based on past reported crashes, assess the crashtypes and severity levels, and study other elements that characterize the crashes, theenvironment, the behaviors of drivers and other road users, the emergency services,and infrastructure elements such as road geometry and traffic control devices. Theresult of diagnosis is a list of contributing factors associated with historical and potentialfuture crashes. Refer to the next sections of this information guide for furtherinformation and considerations related to diagnosis.
3. Countermeasure Selection: Develop appropriate countermeasures to target crashcontributing factors and reduce crash frequency and severity at identified locations. Thecountermeasures should directly target the crash contributing factors, and may includeengineering, education, enforcement, and EMS-related measures (i.e., the 4E approach).Refer to Reliability of Safety Management Methods: Countermeasure Selection forfurther information and considerations related to countermeasure selection.(3)
4. Economic Appraisal: Estimate the economic benefit and cost associated with aparticular countermeasure or set of countermeasures. There is not a separate guide foreconomic appraisal in the Reliability of Safety Management Methods series because itinvolves policy-level decisions such as appropriate crash costs, discount rates, selectedeconomic method, and non-monetary local considerations. Refer to chapter 7 of theHighway Safety Manual for further information and considerations related to economicappraisal.(1)
5. Project Prioritization: Develop a prioritized and optimal list of projects to improvethe safety performance (i.e., reduce crash frequency and severity) of the road network,considering available resources. There is not a separate guide for project prioritizationin the Reliability of Safety Management Methods series because it involves policy-leveldecisions such as overall agency goals. Refer to chapter 8 of the Highway Safety Manualfor further information and considerations related to project prioritization.(1)
6. Safety Effectiveness Evaluation: Evaluate how a particular treatment (or group oftreatments) has affected the safety performance (crash frequency and severity) of thetreated locations and the system. Refer to the Reliability of Safety ManagementMethods: Safety Effectiveness Evaluation for further discussion of evaluation and relatedmethods.(4)
1
RELIABILITY OF SAFETY MANAGEMENT METHODS: DIAGNOSIS
2
Figure 1. Schematic. Roadway safety management process.
The roadway safety management process is an integral part of the roadway infrastructure cycle and project development process. While the six-step roadway safety management process focuses on safety performance, it provides information for system planning, project planning, design and construction, and operations and maintenance of a transportation system.
Diagnosis is the second step in the roadway safety management process. Based on the results of step 1 (network screening), analysts perform more detailed investigations of specific sites. The objective of diagnosis is to understand the crash patterns and identify the underlying factors contributing to crashes at sites identified from network screening. The diagnosis results feed step 3 (countermeasure selection). Given a list of underlying contributing factors, analysts can develop more effective countermeasures to directly target the site-specific issues. Note it is critical to diagnose the underlying safety issues before selecting countermeasures. Otherwise, agencies may misallocate resources if the selected countermeasure does not properly or effectively target the underlying issues.

RELIABILITY OF SAFETY MANAGEMENT METHODS: DIAGNOSIS
2. OVERVIEW OF DIAGNOSISDiagnosis is the second step in the roadway safety management process, following network screening. Diagnosis is the process of further investigating the sites or high-level safety issues identified from network screening. The intent of diagnosis is to understand the crash patterns and identify the underlying factors contributing to crashes at specific sites. Diagnosis can also help to identify potential safety issues that have not yet manifested in crashes.
Diagnosis involves a review of site-specific crash history, traffic operations, and general site conditions. This includes a desktop data analysis as well as a field visit to observe road user behaviors and site conditions not observable from the office. It is useful to conduct a field review under multiple conditions (e.g., day and night, peak and off-peak travel times, dry and wet) to investigate potential crash contributing factors identified from the crash history. It is also useful to engage a multidisciplinary team to perform the diagnosis and subsequent countermeasure selection. Note the following benefits of using a multidisciplinary team to diagnose issues and select countermeasures:
• Combined team experience: As opposed to a single traffic engineer or highwaydesigner diagnosing a given site, a multidisciplinary team provides their combinedexperience. Depending on the focus of the investigation, it may be useful to includeteam members with experience in highway design, traffic operations, transportationplanning, human factors, pedestrian and bicycle safety, law enforcement, and otherspecialized areas as needed (e.g., commercial motor vehicles).
• Limited influence of personal bias: Personal professional experience and judgmentare critical for all aspects of safety management, including the diagnosis of safety issues.Based on professional experience, a person can identify potential underlying safety issuesand select appropriate countermeasures to address or mitigate each issue. Whileexperience is important, an individual is limited to their personal professionalexperience, and the results of a single-person diagnosis are susceptible to personal biasand experience that may be relatively limited. A multidisciplinary team provides theprofessional experience of multiple people with different backgrounds and perspectives.
• Multidisciplinary issues and countermeasures: Crash contributing factors includeissues related to the person, the roadway, and the vehicle. Further, there are oftenmultiple contributing factors related to a given crash. As such, it is critical to identify thevarious contributing factors and develop targeted countermeasures which may includeengineering, education, enforcement, and emergency medical services (EMS) efforts.
The HSM suggests the following three-step process for conducting site diagnosis.(1) For further discussion of the diagnosis process, including detailed prompts, refer to the HSM and FHWA’s Road Safety Audit Guidelines.(5)
1. Safety data review.2. Assess supporting documentation.3. Assess field conditions.
3
RELIABILITY OF SAFETY MANAGEMENT METHODS: DIAGNOSIS
STEP 1: SAFETY DATA REVIEW
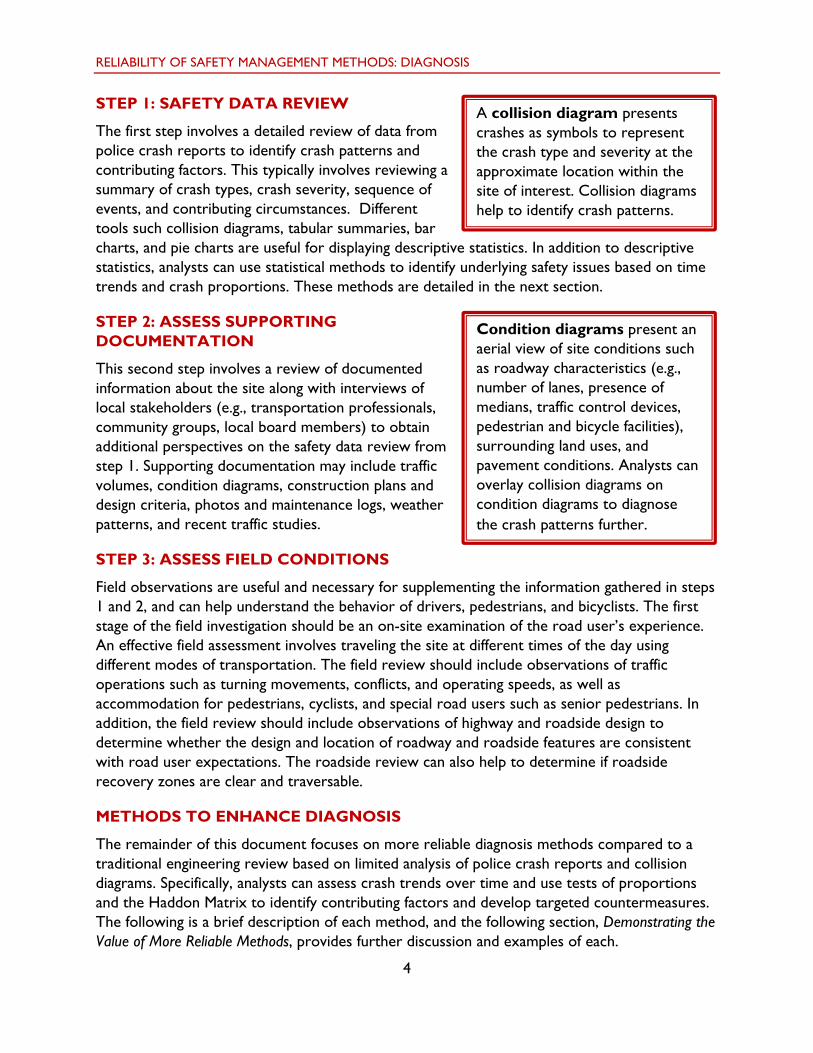
The first step involves a detailed review of data from police crash reports to identify crash patterns and contributing factors. This typically involves reviewing a summary of crash types, crash severity, sequence of events, and contributing circumstances. Different tools such collision diagrams, tabular summaries, bar charts, and pie charts are useful for displaying descriptive statistics. In addition to descriptive statistics, analysts can use statistical methods to identify underlying safety issues based on time trends and crash proportions. These methods are detailed in the next section.
A collision diagram presents crashes as symbols to represent the crash type and severity at the approximate location within the site of interest. Collision diagrams help to identify crash patterns.
STEP 2: ASSESS SUPPORTING DOCUMENTATION
This second step involves a review of documented information about the site along with interviews of local stakeholders (e.g., transportation professionals, community groups, local board members) to obtain additional perspectives on the safety data review from step 1. Supporting documentation may include traffic volumes, condition diagrams, construction plans and design criteria, photos and maintenance logs, weather patterns, and recent traffic studies.
Condition diagrams present an aerial view of site conditions such as roadway characteristics (e.g., number of lanes, presence of medians, traffic control devices, pedestrian and bicycle facilities), surrounding land uses, and pavement conditions. Analysts can overlay collision diagrams on condition diagrams to diagnose the crash patterns further.
STEP 3: ASSESS FIELD CONDITIONS
Field observations are useful and necessary for supplementing the information gathered in steps 1 and 2, and can help understand the behavior of drivers, pedestrians, and bicyclists. The first stage of the field investigation should be an on-site examination of the road user’s experience. An effective field assessment involves traveling the site at different times of the day using different modes of transportation. The field review should include observations of traffic operations such as turning movements, conflicts, and operating speeds, as well as accommodation for pedestrians, cyclists, and special road users such as senior pedestrians. In addition, the field review should include observations of highway and roadside design to determine whether the design and location of roadway and roadside features are consistent with road user expectations. The roadside review can also help to determine if roadside recovery zones are clear and traversable.
METHODS TO ENHANCE DIAGNOSIS
The remainder of this document focuses on more reliable diagnosis methods compared to a traditional engineering review based on limited analysis of police crash reports and collision diagrams. Specifically, analysts can assess crash trends over time and use tests of proportions and the Haddon Matrix to identify contributing factors and develop targeted countermeasures. The following is a brief description of each method, and the following section, Demonstrating the Value of More Reliable Methods, provides further discussion and examples of each.
4
RELIABILITY OF SAFETY MANAGEMENT METHODS: DIAGNOSIS
Time Trends
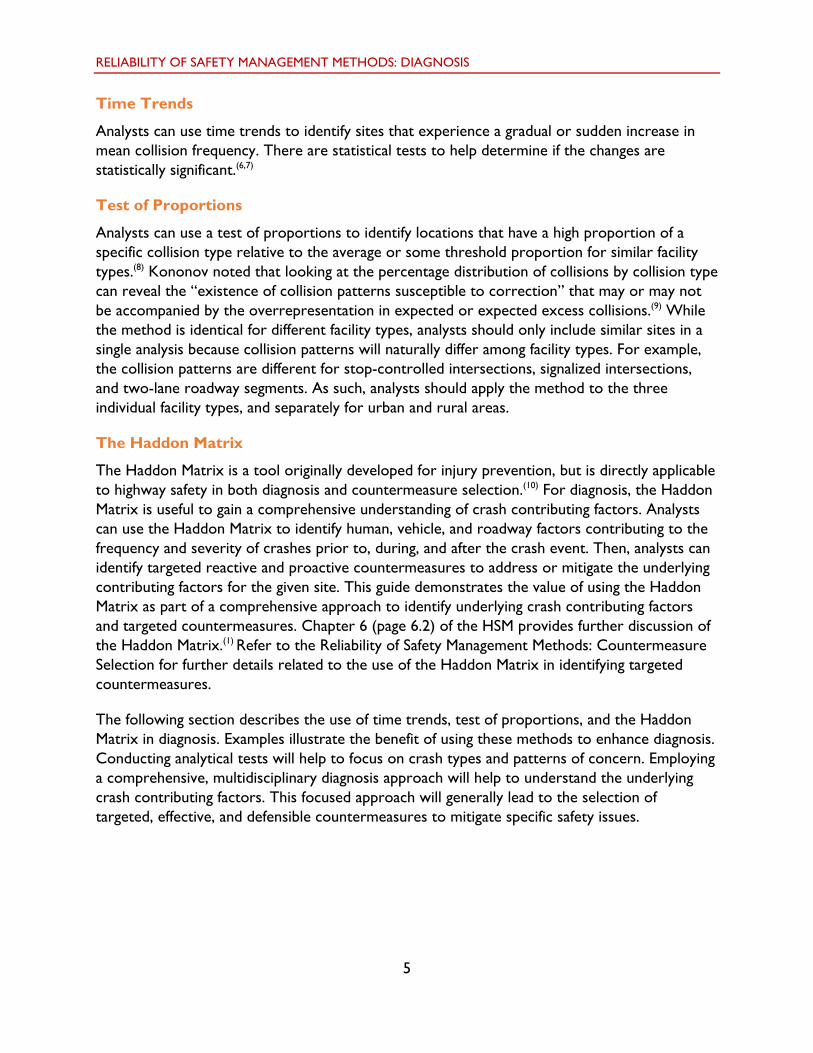
Analysts can use time trends to identify sites that experience a gradual or sudden increase in mean collision frequency. There are statistical tests to help determine if the changes are statistically significant.(6,7)
Test of Proportions
Analysts can use a test of proportions to identify locations that have a high proportion of a specific collision type relative to the average or some threshold proportion for similar facility types.(8) Kononov noted that looking at the percentage distribution of collisions by collision type can reveal the “existence of collision patterns susceptible to correction” that may or may not be accompanied by the overrepresentation in expected or expected excess collisions.(9) While the method is identical for different facility types, analysts should only include similar sites in a single analysis because collision patterns will naturally differ among facility types. For example, the collision patterns are different for stop-controlled intersections, signalized intersections, and two-lane roadway segments. As such, analysts should apply the method to the three individual facility types, and separately for urban and rural areas.
The Haddon Matrix
The Haddon Matrix is a tool originally developed for injury prevention, but is directly applicable to highway safety in both diagnosis and countermeasure selection.(10) For diagnosis, the Haddon Matrix is useful to gain a comprehensive understanding of crash contributing factors. Analysts can use the Haddon Matrix to identify human, vehicle, and roadway factors contributing to the frequency and severity of crashes prior to, during, and after the crash event. Then, analysts can identify targeted reactive and proactive countermeasures to address or mitigate the underlying contributing factors for the given site. This guide demonstrates the value of using the Haddon Matrix as part of a comprehensive approach to identify underlying crash contributing factors and targeted countermeasures. Chapter 6 (page 6.2) of the HSM provides further discussion of the Haddon Matrix.(1) Refer to the Reliability of Safety Management Methods: Countermeasure Selection for further details related to the use of the Haddon Matrix in identifying targeted countermeasures.
The following section describes the use of time trends, test of proportions, and the Haddon Matrix in diagnosis. Examples illustrate the benefit of using these methods to enhance diagnosis. Conducting analytical tests will help to focus on crash types and patterns of concern. Employing a comprehensive, multidisciplinary diagnosis approach will help to understand the underlying crash contributing factors. This focused approach will generally lead to the selection of targeted, effective, and defensible countermeasures to mitigate specific safety issues.
5
RELIABILITY OF SAFETY MANAGEMENT METHODS: DIAGNOSIS
3. DEMONSTRATING THE VALUE OF MORE RELIABLE METHODS
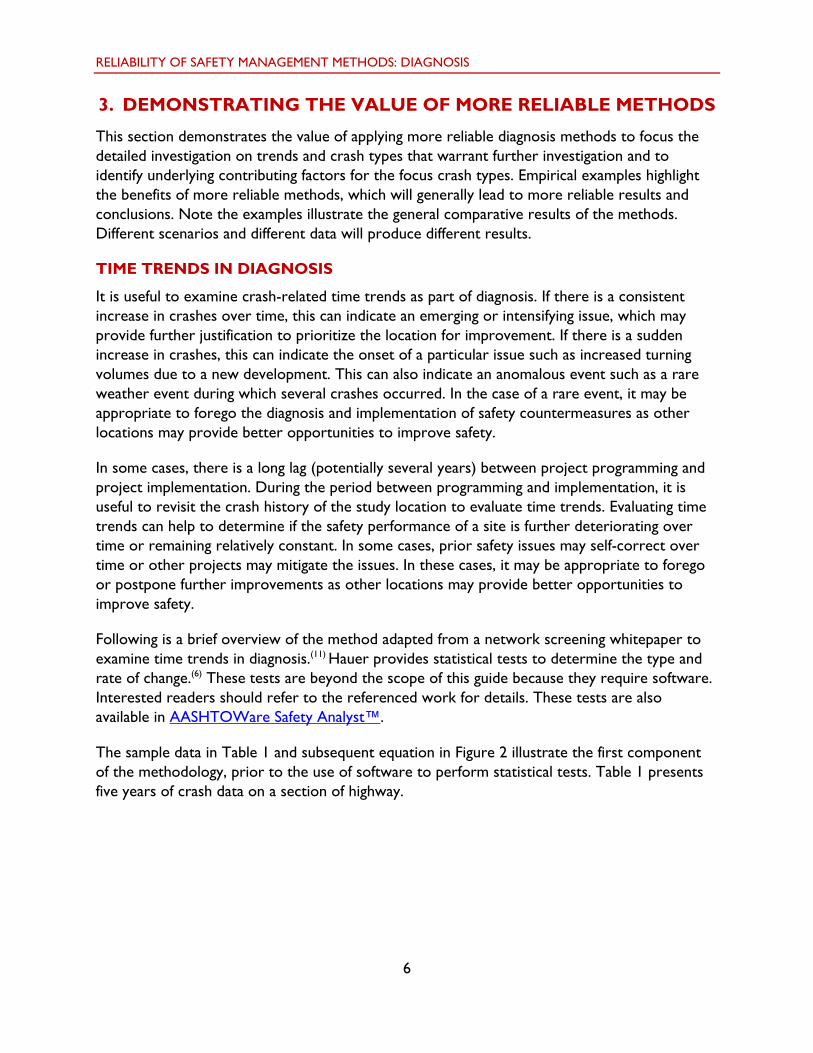
This section demonstrates the value of applying more reliable diagnosis methods to focus the detailed investigation on trends and crash types that warrant further investigation and to identify underlying contributing factors for the focus crash types. Empirical examples highlight the benefits of more reliable methods, which will generally lead to more reliable results and conclusions. Note the examples illustrate the general comparative results of the methods. Different scenarios and different data will produce different results.
TIME TRENDS I N DIAGNOSIS
It is useful to examine crash-related time trends as part of diagnosis. If there is a consistent increase in crashes over time, this can indicate an emerging or intensifying issue, which may provide further justification to prioritize the location for improvement. If there is a sudden increase in crashes, this can indicate the onset of a particular issue such as increased turning volumes due to a new development. This can also indicate an anomalous event such as a rare weather event during which several crashes occurred. In the case of a rare event, it may be appropriate to forego the diagnosis and implementation of safety countermeasures as other locations may provide better opportunities to improve safety.
In some cases, there is a long lag (potentially several years) between project programming and project implementation. During the period between programming and implementation, it is useful to revisit the crash history of the study location to evaluate time trends. Evaluating time trends can help to determine if the safety performance of a site is further deteriorating over time or remaining relatively constant. In some cases, prior safety issues may self-correct over time or other projects may mitigate the issues. In these cases, it may be appropriate to forego or postpone further improvements as other locations may provide better opportunities to improve safety.
Following is a brief overview of the method adapted from a network screening whitepaper to examine time trends in diagnosis.(11) Hauer provides statistical tests to determine the type and rate of change.(6) These tests are beyond the scope of this guide because they require software. Interested readers should refer to the referenced work for details. These tests are also available in AASHTOWare Safety Analyst™.
The sample data in Table 1 and subsequent equation in Figure 2 illustrate the first component of the methodology, prior to the use of software to perform statistical tests. Table 1 presents five years of crash data on a section of highway.
6
RELIABILITY OF SAFETY MANAGEMENT METHODS: DIAGNOSIS
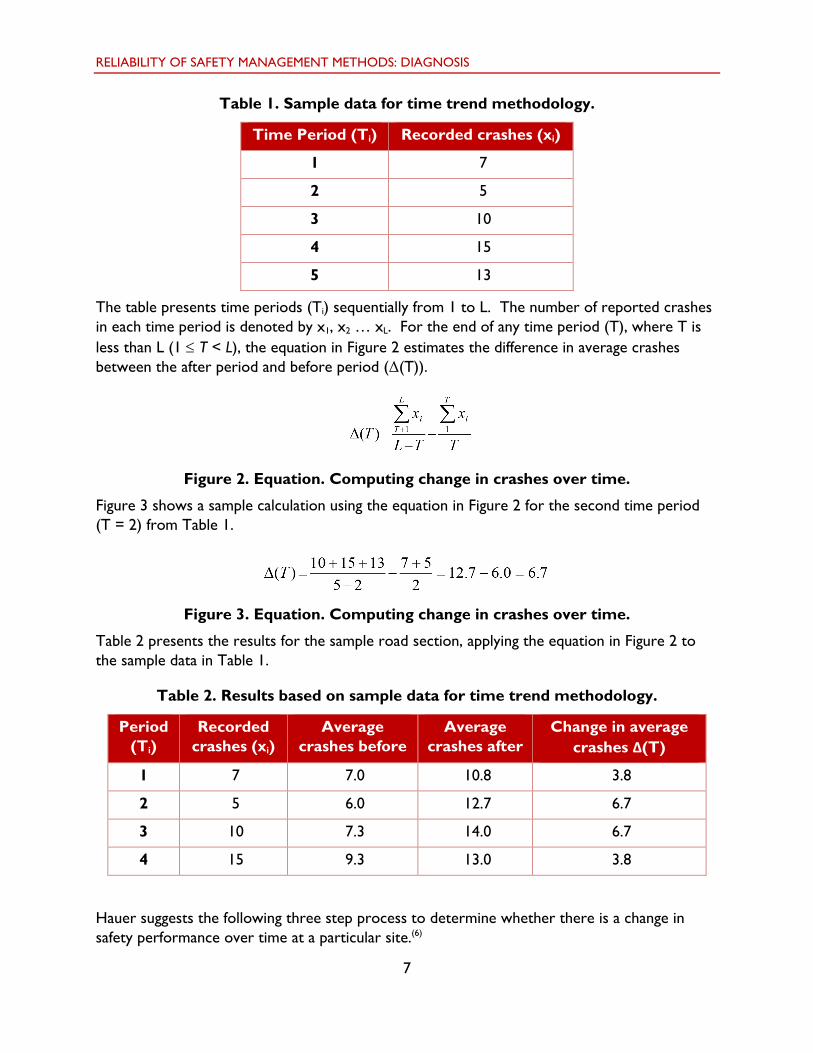
Table 1. Sample data for time trend methodology.
Time Period (Ti) Recorded crashes (xi)
1 7
2 5
3 10
4 15
5 13
The table presents time periods (Ti) sequentially from 1 to L. The number of reported crashes in each time period is denoted by x1, x2 … xL. For the end of any time period (T), where T is less than L (1 ≤ T < L), the equation in Figure 2 estimates the difference in average crashes between the after period and before period (Δ(T)).
Figure 2. Equation. Computing change in crashes over time.
Figure 3 shows a sample calculation using the equation in Figure 2 for the second time period (T = 2) from Table 1.
Figure 3. Equation. Computing change in crashes over time.
Table 2 presents the results for the sample road section, applying the equation in Figure 2 to the sample data in Table 1.
Table 2. Results based on sample data for time trend methodology.
Period (Ti)
Recorded crashes (xi)
Average crashes before
Average crashes after
Change in average crashes Δ(T)
1 7 7.0 10.8 3.8
2 5 6.0 12.7 6.7
3 10 7.3 14.0 6.7
4 15 9.3 13.0 3.8
Hauer suggests the following three step process to determine whether there is a change in safety performance over time at a particular site.(6)
7
RELIABILITY OF SAFETY MANAGEMENT METHODS: DIAGNOSIS
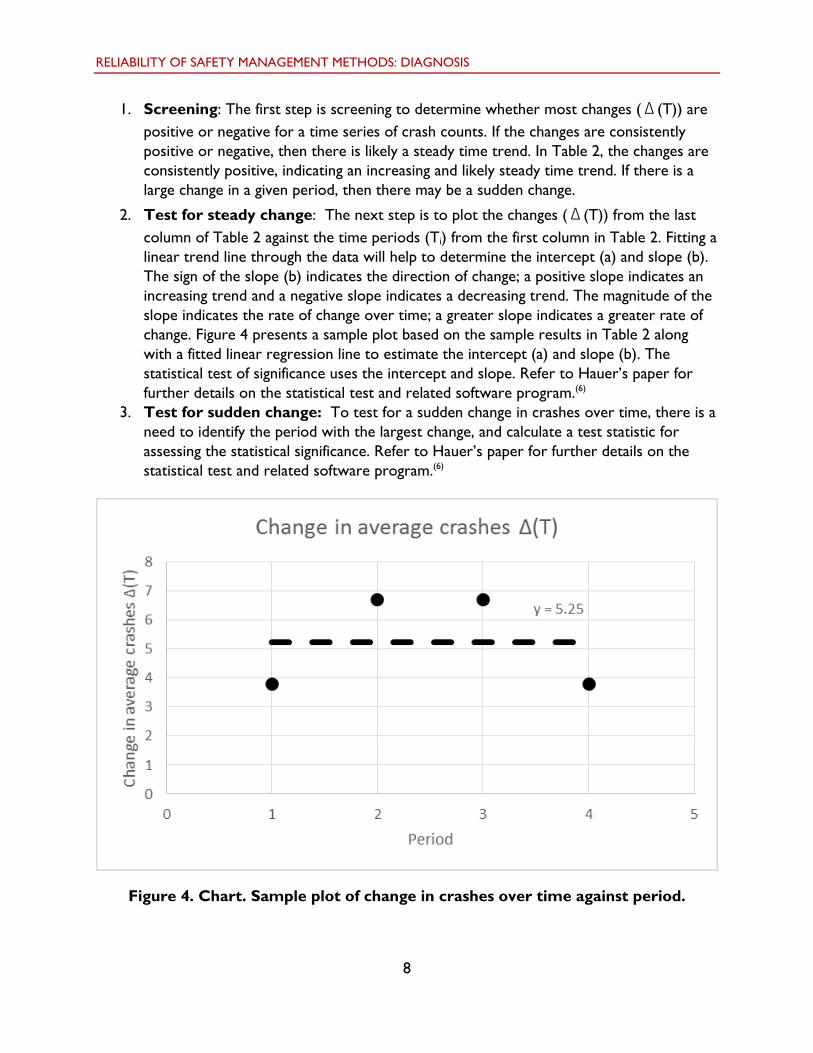
1. Screening: The first step is screening to determine whether most changes (Δ(T)) arepositive or negative for a time series of crash counts. If the changes are consistentlypositive or negative, then there is likely a steady time trend. In Table 2, the changes areconsistently positive, indicating an increasing and likely steady time trend. If there is alarge change in a given period, then there may be a sudden change.
2. Test for steady change: The next step is to plot the changes (Δ(T)) from the lastcolumn of Table 2 against the time periods (Ti) from the first column in Table 2. Fitting alinear trend line through the data will help to determine the intercept (a) and slope (b).The sign of the slope (b) indicates the direction of change; a positive slope indicates anincreasing trend and a negative slope indicates a decreasing trend. The magnitude of theslope indicates the rate of change over time; a greater slope indicates a greater rate ofchange. Figure 4 presents a sample plot based on the sample results in Table 2 alongwith a fitted linear regression line to estimate the intercept (a) and slope (b). Thestatistical test of significance uses the intercept and slope. Refer to Hauer’s paper forfurther details on the statistical test and related software program.(6)
3. Test for sudden change: To test for a sudden change in crashes over time, there is aneed to identify the period with the largest change, and calculate a test statistic forassessing the statistical significance. Refer to Hauer’s paper for further details on thestatistical test and related software program.(6)
Figure 4. Chart. Sample plot of change in crashes over time against period.
8
RELIABILITY OF SAFETY MANAGEMENT METHODS: DIAGNOSIS
TEST OF PROPORTIONS IN DIAGNOSIS
While many network screening measures identify locations with potential for safety improvement, they do not provide any insight into the nature of the crash occurrence. Heydecker and Wu initially proposed a test of proportions to identify locations that have a high proportion of a specific collision type relative to the average or some threshold proportion for similar facility types.(8) Analysts can use the test of proportions in diagnosis to identify crash types warranting further investigation based on the recognition of crash patterns.
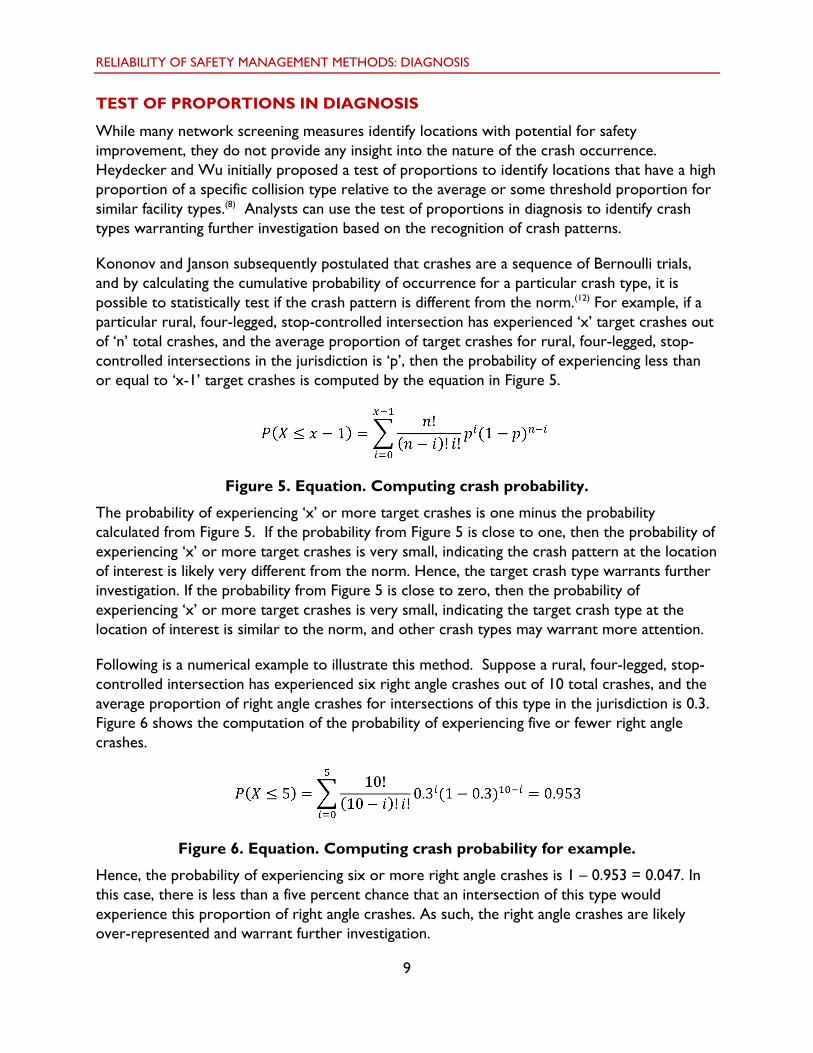
Kononov and Janson subsequently postulated that crashes are a sequence of Bernoulli trials, and by calculating the cumulative probability of occurrence for a particular crash type, it is possible to statistically test if the crash pattern is different from the norm.(12) For example, if a particular rural, four-legged, stop-controlled intersection has experienced ‘x’ target crashes out of ‘n’ total crashes, and the average proportion of target crashes for rural, four-legged, stop-controlled intersections in the jurisdiction is ‘p’, then the probability of experiencing less than or equal to ‘x-1’ target crashes is computed by the equation in Figure 5.
9
Figure 5. Equation. Computing crash probability.
The probability of experiencing ‘x’ or more target crashes is one minus the probability calculated from Figure 5. If the probability from Figure 5 is close to one, then the probability of experiencing ‘x’ or more target crashes is very small, indicating the crash pattern at the location of interest is likely very different from the norm. Hence, the target crash type warrants further investigation. If the probability from Figure 5 is close to zero, then the probability of experiencing ‘x’ or more target crashes is very small, indicating the target crash type at the location of interest is similar to the norm, and other crash types may warrant more attention.
Following is a numerical example to illustrate this method. Suppose a rural, four-legged, stop-controlled intersection has experienced six right angle crashes out of 10 total crashes, and the average proportion of right angle crashes for intersections of this type in the jurisdiction is 0.3. Figure 6 shows the computation of the probability of experiencing five or fewer right angle crashes.
Figure 6. Equation. Computing crash probability for example.
Hence, the probability of experiencing six or more right angle crashes is 1 – 0.953 = 0.047. In this case, there is less than a five percent chance that an intersection of this type would experience this proportion of right angle crashes. As such, the right angle crashes are likely over-represented and warrant further investigation.
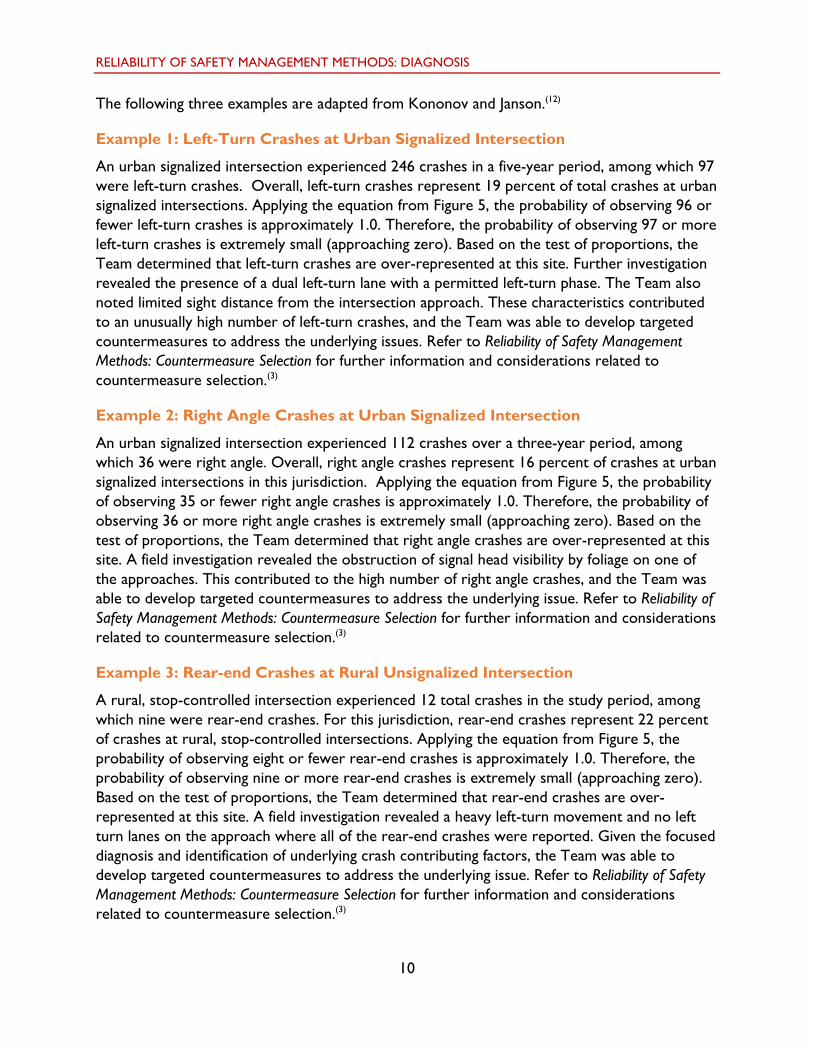
The following three examples are adapted from Kononov and Janson.(12)
Example 1: Left-Turn Crashes at Urban Signalized Intersection
An urban signalized intersection experienced 246 crashes in a five-year period, among which 97 were left-turn crashes. Overall, left-turn crashes represent 19 percent of total crashes at urban signalized intersections. Applying the equation from Figure 5, the probability of observing 96 or fewer left-turn crashes is approximately 1.0. Therefore, the probability of observing 97 or more left-turn crashes is extremely small (approaching zero). Based on the test of proportions, the Team determined that left-turn crashes are over-represented at this site. Further investigation revealed the presence of a dual left-turn lane with a permitted left-turn phase. The Team also noted limited sight distance from the intersection approach. These characteristics contributed to an unusually high number of left-turn crashes, and the Team was able to develop targeted countermeasures to address the underlying issues. Refer to Reliability of Safety Management Methods: Countermeasure Selection for further information and considerations related to countermeasure selection.(3)
Example 2: Right Angle Crashes at Urban Signalized Intersection
RELIABILITY OF SAFETY MANAGEMENT METHODS: DIAGNOSIS
An urban signalized intersection experienced 112 crashes over a three-year period, among which 36 were right angle. Overall, right angle crashes represent 16 percent of crashes at urban signalized intersections in this jurisdiction. Applying the equation from Figure 5, the probability of observing 35 or fewer right angle crashes is approximately 1.0. Therefore, the probability of observing 36 or more right angle crashes is extremely small (approaching zero). Based on the test of proportions, the Team determined that right angle crashes are over-represented at this site. A field investigation revealed the obstruction of signal head visibility by foliage on one of the approaches. This contributed to the high number of right angle crashes, and the Team was able to develop targeted countermeasures to address the underlying issue. Refer to Reliability of Safety Management Methods: Countermeasure Selection for further information and considerations related to countermeasure selection.(3)
Example 3: Rear-end Crashes at Rural Unsignalized Intersection
A rural, stop-controlled intersection experienced 12 total crashes in the study period, among which nine were rear-end crashes. For this jurisdiction, rear-end crashes represent 22 percent of crashes at rural, stop-controlled intersections. Applying the equation from Figure 5, the probability of observing eight or fewer rear-end crashes is approximately 1.0. Therefore, the probability of observing nine or more rear-end crashes is extremely small (approaching zero). Based on the test of proportions, the Team determined that rear-end crashes are over-represented at this site. A field investigation revealed a heavy left-turn movement and no left turn lanes on the approach where all of the rear-end crashes were reported. Given the focused diagnosis and identification of underlying crash contributing factors, the Team was able to develop targeted countermeasures to address the underlying issue. Refer to Reliability of Safety Management Methods: Countermeasure Selection for further information and considerations related to countermeasure selection.(3)
10

RELIABILITY OF SAFETY MANAGEMENT METHODS: DIAGNOSIS
These examples illustrate the application of the test of proportions to determine whether a given crash pattern at a particular location is different from the norm. Specifically, this method provides a statistically valid approach to determine which crash types and locations should be the focus of further investigation. This reduces the potential to misallocate resources to investigate and mitigate apparent safety issues that may not warrant treatment. Note the test of proportions is available in the network screening module in AASHTOWare Safety Analyst™.
The following two examples are from a comprehensive analysis of intersections in New Hampshire. Gross et al. performed a network screening to identify intersections with potential for improvement.(13) Subsequently, the study team diagnosed potential safety issues using collision diagrams, tests of proportions, general crash summaries, and aerial images. The two examples focus on the use of the test of proportions to focus the diagnosis.
Example 4: Rear-End Crashes at Rural Signalized Intersection
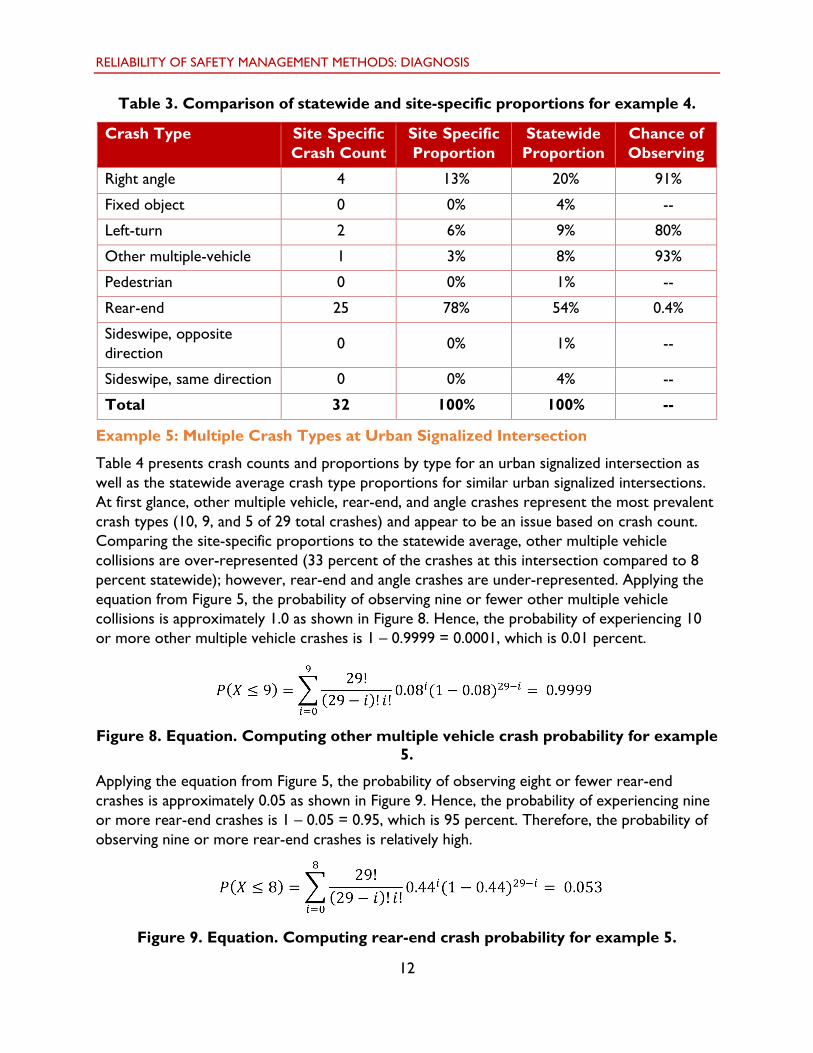
Table 3 presents crash counts and proportions by crash type for a rural signalized intersection as well as the statewide average crash type proportions for similar rural signalized intersections. At first glance, rear-end crashes represent the most prevalent crash type (25 of 32 crashes) and appear to be an issue based on crash count. Comparing the site-specific proportions to the statewide average, rear-end crashes are over-represented (78 percent of the crashes at this intersection compared to 54 percent statewide). Applying the equation from Figure 5, the probability of observing 24 or fewer rear-end crashes is approximately 1.0 as shown in Figure 7. Therefore, the probability of observing 25 or more rear-end crashes is extremely small (approaching zero).
11
Figure 7. Equation. Computing crash probability for example 4.
Hence, the probability of experiencing 25 or more rear-end crashes is 1 – 0.996 = 0.004, which is less than 0.5 percent. Applying the equation from Figure 5, the last column of Table 3 presents the probability for each crash type. In this case, the crash type with the largest proportion (rear-end crashes) is also significantly higher than the statewide average and likely correctable. There is a high chance of observing the actual proportion of other crash types: 91 percent for right angle, 80 percent for left-turn, and 93 percent for other multiple-vehicle crashes. As such, there may be less opportunity to address right angle, left-turn, and other multiple-vehicle crashes.
Further investigation provided insights into specific problems leading to rear-end crashes at this location. During diagnosis, the team focused on potential contributing factors to rear-end crashes. They observed short turn lanes and heavy traffic volumes on two approaches, which contribute to spillover and the potential for rear-end crashes. To target the underlying issue, the team suggested extending the existing turn lanes to reduce spillover. Refer to Reliability of Safety Management Methods: Countermeasure Selection for further information and considerations related to countermeasure selection.(3)
-
-
RELIABILITY OF SAFETY MANAGEMENT METHODS: DIAGNOSIS
Table 3. Comparison of statewide and site-specific proportions for example 4.
Crash Type Site Specific Crash Count
Site Specific Proportion
Statewide Proportion
Chance of Observing
Right angle 4 13% 20% 91%
Fixed object 0 0% 4% --
Left-turn 2 6% 9% 80%
Other multiple-vehicle 1 3% 8% 93%
Pedestrian 0 0% 1% --
Rear-end 25 78% 54% 0.4%
Sideswipe, opposite direction
0 0% 1% --
Sideswipe, same direction 0 0% 4% --
Total 32 100% 100% --
Example 5: Multiple Crash Types at Urban Signalized Intersection
Table 4 presents crash counts and proportions by type for an urban signalized intersection as well as the statewide average crash type proportions for similar urban signalized intersections. At first glance, other multiple vehicle, rear-end, and angle crashes represent the most prevalent crash types (10, 9, and 5 of 29 total crashes) and appear to be an issue based on crash count. Comparing the site-specific proportions to the statewide average, other multiple vehicle collisions are over-represented (33 percent of the crashes at this intersection compared to 8 percent statewide); however, rear-end and angle crashes are under-represented. Applying the equation from Figure 5, the probability of observing nine or fewer other multiple vehicle collisions is approximately 1.0 as shown in Figure 8. Hence, the probability of experiencing 10 or more other multiple vehicle crashes is 1 – 0.9999 = 0.0001, which is 0.01 percent.
Figure 8. Equation. Computing other multiple vehicle crash probability for example 5.
Applying the equation from Figure 5, the probability of observing eight or fewer rear-end crashes is approximately 0.05 as shown in Figure 9. Hence, the probability of experiencing nine or more rear-end crashes is 1 – 0.05 = 0.95, which is 95 percent. Therefore, the probability of observing nine or more rear-end crashes is relatively high.
12
Figure 9. Equation. Computing rear-end crash probability for example 5.

-
-
RELIABILITY OF SAFETY MANAGEMENT METHODS: DIAGNOSIS
Applying the equation from Figure 5, the probability of observing four or fewer angle crashes is approximately 0.08 as shown in Figure 10. Hence, the probability of experiencing five or more angle crashes is 1 – 0.08 = 0.92, which is 92 percent. Therefore, the probability of observing five or more angle crashes is relatively high.
Figure 10. Equation. Computing angle crash probability for example 5.
Applying the equation from Figure 5, the last column of Table 4 presents the probability for each crash type. In this case, the crash type with the largest proportion (other multiple vehicle collisions) is also significantly higher than the statewide average and likely correctable. The crash types with the second and third highest proportions (rear-end and angle crashes) represent less potential for improvement. Specifically, the proportions of rear-end and angle crashes are substantially lower than the statewide average. As such, it may be difficult for an agency to address or mitigate rear-end and angle crashes with measures common to other urban signalized intersections in the State.
Further investigation provided insights into specific problems leading to other multiple vehicle collisions at this location. During diagnosis, the team focused on potential contributing factors to other multiple vehicle crashes. They observed multiple driveways in close proximity to the intersection, which may contribute to other multiple vehicle crashes. To target the underlying issue, the team suggested access management strategies to eliminate and consolidate access points near the intersection. Refer to Reliability of Safety Management Methods: Countermeasure Selection for further information and considerations related to countermeasure selection.(3)
Table 4. Comparison of statewide and site-specific proportions for example 5.
Crash Type Site Specific Crash Count
Site Specific Proportion
Statewide Proportion
Chance of Observing
Right angle 5 17% 27% 92% Bicyclist 0 0% 1% --Fixed object 3 10% 3% 6%
Left-turn 0 0% 9% --Other multiple-vehicle 10 33% 8% 0.01% Pedestrian 0 0% 1% --Rear-end 9 30% 44% 95% Sideswipe, opposite direction
0 0% 2% --
Sideswipe, same direction 2 7% 5% 43% Total 29 100% 100% --
13

RELIABILITY OF SAFETY MANAGEMENT METHODS: DIAGNOSIS
THE HADDON MATRIX
The Haddon Matrix is a comprehensive tool to identify suitable and effective countermeasures to mitigate a substantiated safety issue. During step 2 of the safety management process (diagnosis), the multidisciplinary analysis team (namely, the Team) reviews past crash data in conjunction with attributes of the road users, adjacent land use, geometry, and traffic operations of the study location. This includes the identification of target crash types and crash contributing factors, which provides the foundation for the identification and selection of appropriate countermeasures.
The Haddon Matrix supports a comprehensive approach to understanding crash contributing factors as shown in Table 5. The Team would complete the Haddon Matrix for each target crash type identified during diagnosis. Following the completion of the Haddon Matrix, the Team can identify potential countermeasures to directly target underlying contributing factors.
The Haddon Matrix i s comprised of nine cells to identify human, vehicle, and roadway factors contributing to the target crash type or severity outcome before, during, and after the crash. Examples of human factors include distraction, fatigue, and seat belt use. Examples of vehicle factors include worn brakes, headrest design, and airbag operation. Examples of roadway factors include wet pavement, snow-limiting visibility, signal coordination, and steep grade.
Using the Haddon Matrix will help you identify underlying crash contributing factors and select more targeted countermeasures. You may opt for less effective countermeasures if you do not consider the site-specific and multiple factors that contributed to past crashes or may contribute to future crashes.
Table 5. Haddon Matrix.
Period Human Factors
Vehicle Factors
Roadway Factors
Before (causes of hazardous situation)
During (causes of crash severity)
After (factors of crash outcome)
The contributing factors originate from careful review of police crash reports and summary data (e.g., collision diagrams), review of design drawings and traffic operations, and observations during field investigations. The following is an example application of the Haddon Matrix.
14

Example 1: General Application of the Haddon Matrix
RELIABILITY OF SAFETY MANAGEMENT METHODS: DIAGNOSIS
The following is an example application of the Haddon Matrix adapted from the Highway Safety Improvement Program (HSIP) Manual.(14)
The Haddon Matrix in Table 6 represents a set of crashes in an urban area. The upper-left cell identifies potential human contributing factors prior to the crash. As shown in the example table, poor vision, slow reaction time, alcohol consumption, speeding, and risk taking are all potential human contributing factors that exist prior to the crash. Given these factors, the Team can develop targeted mitigation measures to address human factors and behavior. Similarly, the upper-right cell identifies potential roadway contributing factors prior to the crash. Examples include narrow shoulders, limited pavement markings, and poorly-timed signals. Given these factors, the Team can develop targeted engineering measures to reduce the likelihood of a crash. In the periods during and after the crash, there are opportunities to reduce the crash severity. The matrix in its entirety presents a range of potential issues that agencies can address through a variety of countermeasures, including education, enforcement, engineering, and emergency response solutions (the 4Es of safety).
Table 6. Example 1 Haddon Matrix for urban crashes.
Period Human Factors
Vehicle Factors
Roadway Factors
Before (causes of hazardous situation)
Poor vision, slow reaction time, alcohol, speeding, risk taking
Failed brakes, missing lights, lack of warning systems
Narrow shoulders, limited pavement markings, poorly-timed signals
During (causes of crash severity)
Failure to use occupant restraints
Malfunctioning safety belts, poorly engineered air bags
Non-breakaway sign supports
After (factors of crash outcome)
Age (high susceptibility), alcohol
Poorly designed fuel tanks
Poor emergency communication systems
15
Example 2: Site-Specific Application of the Haddon Matrix
RELIABILITY OF SAFETY MANAGEMENT METHODS: DIAGNOSIS
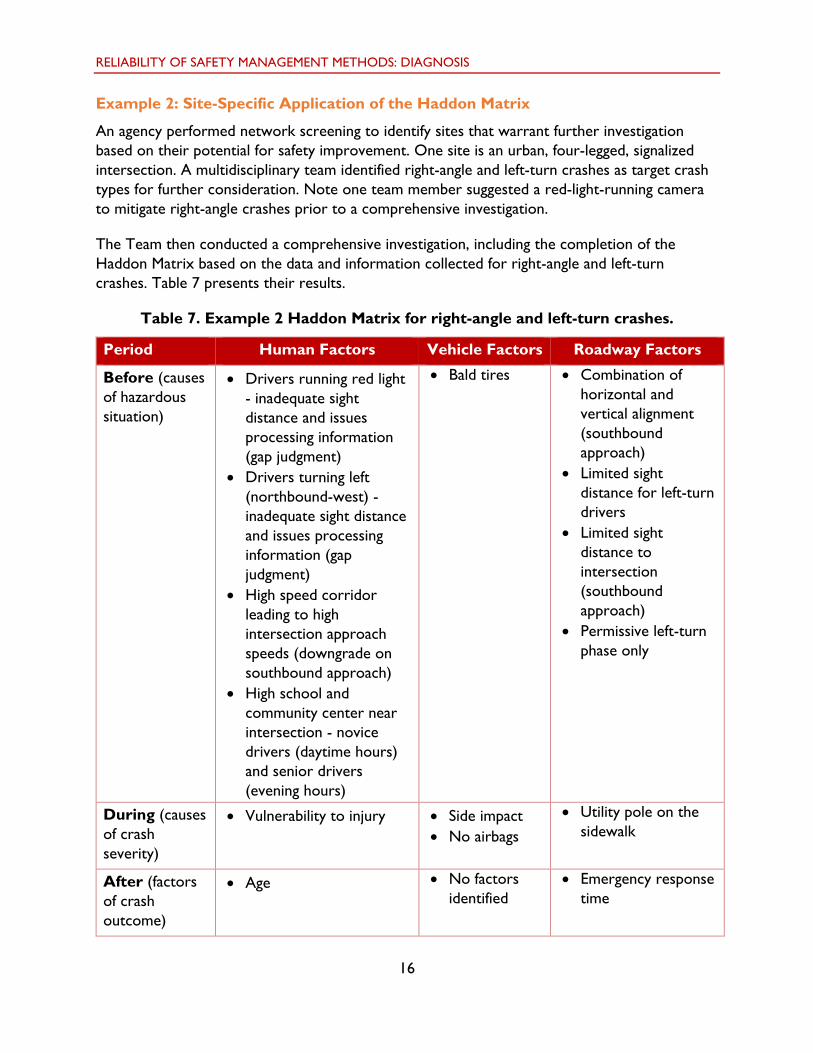
An agency performed network screening to identify sites that warrant further investigation based on their potential for safety improvement. One site is an urban, four-legged, signalized intersection. A multidisciplinary team identified right-angle and left-turn crashes as target crash types for further consideration. Note one team member suggested a red-light-running camera to mitigate right-angle crashes prior to a comprehensive investigation.
The Team then conducted a comprehensive investigation, including the completion of the Haddon Matrix based on the data and information collected for right-angle and left-turn crashes. Table 7 presents their results.
Table 7. Example 2 Haddon Matrix for right-angle and left-turn crashes.
Period Human Factors Vehicle Factors Roadway Factors
Before (causes • Drivers running red light • Bald tires • Combination ofof hazardous - inadequate sight horizontal andsituation) distance and issues
processing information(gap judgment)
• Drivers turning left(northbound-west) -inadequate sight distanceand issues processinginformation (gapjudgment)
• High speed corridorleading to highintersection approachspeeds (downgrade onsouthbound approach)
• High school andcommunity center nearintersection - novicedrivers (daytime hours)and senior drivers(evening hours)
vertical alignment(southboundapproach)
• Limited sightdistance for left-turndrivers
• Limited sightdistance tointersection(southboundapproach)
• Permissive left-turnphase only
During (causes of crash severity)
• Vulnerability to injury • Side impact• No airbags
• Utility pole on thesidewalk
After (factors of crash outcome)
• Age • No factorsidentified
• Emergency responsetime
16
RELIABILITY OF SAFETY MANAGEMENT METHODS: DIAGNOSIS
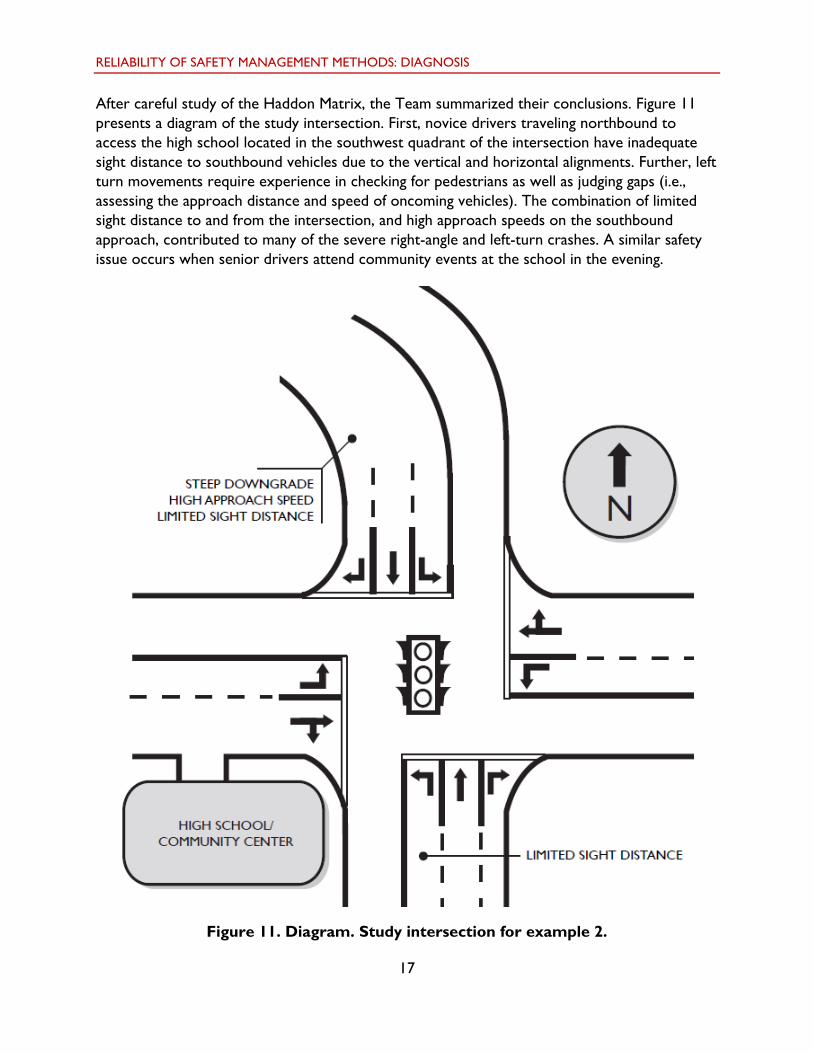
After careful study of the Haddon Matrix, the Team summarized their conclusions. Figure 11 presents a diagram of the study intersection. First, novice drivers traveling northbound to access the high school located in the southwest quadrant of the intersection have inadequate sight distance to southbound vehicles due to the vertical and horizontal alignments. Further, left turn movements require experience in checking for pedestrians as well as judging gaps (i.e., assessing the approach distance and speed of oncoming vehicles). The combination of limited sight distance to and from the intersection, and high approach speeds on the southbound approach, contributed to many of the severe right-angle and left-turn crashes. A similar safety issue occurs when senior drivers attend community events at the school in the evening.
Figure 11. Diagram. Study intersection for example 2.
17
RELIABILITY OF SAFETY MANAGEMENT METHODS: DIAGNOSIS
Based on the identified target crash types and crash contributing factors, the Team identified the following infrastructure-related countermeasures for further consideration. Note a comprehensive diagnosis leads to the identification of potential countermeasures to target the underlying crash contributing factors. There is still a need to employ countermeasure selection methods to determine the most appropriate countermeasure(s). Refer to Reliability of Safety Management Methods: Countermeasure Selection for further information and considerations related to countermeasure selection.(3)
• Signal phase modification (short-term): Modify the permissive left-turn phase to aprotected left-turn phase and install a nearside supplemental traffic signal head forsouthbound drivers approaching the intersection. Note there is a dedicated left-turnlane on all approaches.
• Advance warning flashers (short-term): Install an advance warning sign (‘signalahead’ or ‘be prepared to stop’) with continuous flashers on the southbound approach.
• Roundabout (long-term): Convert the signalized intersection to a two-lane modernroundabout with additional alignment improvements to the north leg of the intersection.
In comparison, the Team determined a red-light-running camera system is not suitable for this intersection. Without a comprehensive diagnosis, the agency would have spent approximately $75,000 to install a red-light camera system, which is not likely to mitigate the target crashes in this particular scenario. From the comprehensive review, the Team identified limited sight distance and high approach speeds as factors contributing to right-angle crashes, not driver disobedience. Therefore, red-light cameras would not have treated the target crash type as demonstrated by the comprehensive and holistic method using the Haddon Matrix. In conclusion, preventing the installation of red-light cameras at this location demonstrates the value of using the Haddon Matrix to conduct a more comprehensive and reliable site diagnosis.
18
RELIABILITY OF SAFETY MANAGEMENT METHODS: DIAGNOSIS
4. DATA REQUIREMENTS FOR DIAGNOSIS
The following is a brief overview of the data requirements for diagnosis using the more reliable state-of-the-art methods described in this information guide.
• Crash Data: three to five years of police crash reports for the study location. Reviewof individual crash reports to identify contributing factors as reported by the police.Tools such as collision diagrams, summary tables, and charts are useful to review thecrash data. This information supports the completion of the Haddon Matrix for eachtarget crash type.
• Traffic Data: three to five years of traffic volume data for the study location. Thisinformation supports the analysis of changes in traffic volume over time. Turningmovement counts, peak hour counts, and directional splits help to assess potentialsafety issues related to traffic operations. Reviewing past traffic analysis reports, landuse, and information on future developments can help to understand future trends intraffic operations and help to identify potential future safety issues related to operations.
• Roadway Data (Site Conditions): identify the site characteristics, including trafficcontrol and design elements. A preliminary desktop review of the site using aerialimages and video or photo logs can support a more efficient field investigation. Toolssuch as condition diagrams are useful to summarize the roadway data.
• Field Observations: observe and identify traffic operations, adjacent land use, roaduser demographics, and road user behaviors. This information supports the completionof the Haddon Matrix for each target crash type.
19

RELIABILITY OF SAFETY MANAGEMENT METHODS: DIAGNOSIS
5. TOOLS AND RESOURCES FOR DIAGNOSIS
Tools and resources are available to support diagnosis, including guides and software. Some guides provide a discussion of the overall diagnosis process, while other tools relate to specific components of the process or specific safety issues. For example, tools such as the National Cooperative Highway Research Program (NCHRP) Report 500 series can help users identify common contributing factors for a given safety issue. The FHWA Road Safety Audit (RSA) website and related tools can help users conduct a comprehensive, multidisciplinary diagnosis.
The FHWA Roadway Safety Data and Analysis Toolbox is a web-based repository of safety data and analysis tools. Use the Toolbox to identify an appropriate tool for your diagnosis needs. A Primer is available to understand the overall scope and functionality of the Toolbox as well as the roles, responsibilities, and tasks supported by tools in the Toolbox.
USING THE ROADWAY SAFETY DATA AND ANALYSIS TOOLBOX
There are two primary options for searching the Toolbox. The first is a predefined query using the four large icons in the upper right of Figure 12 (Manage, Analyze, Collect, and Research). The second is an advanced search option where users can search keywords and apply filters to customize their search as shown in the lower left of Figure 12.
Figure 12. Screenshot. Roadway Safety Data and Analysis Toolbox.
The following is a brief demonstration of the stepwise process to identify an appropriate tool to support diagnosis.
1. Click the ‘Advanced Search’ icon, highlighted in the lower left of Figure 12. 2. From the advanced search page (Figure 13), leave the keyword blank and click the
search button. This r eturns a list of all tools in the Toolbox.
20
RELIABILITY OF SAFETY MANAGEMENT METHODS: DIAGNOSIS
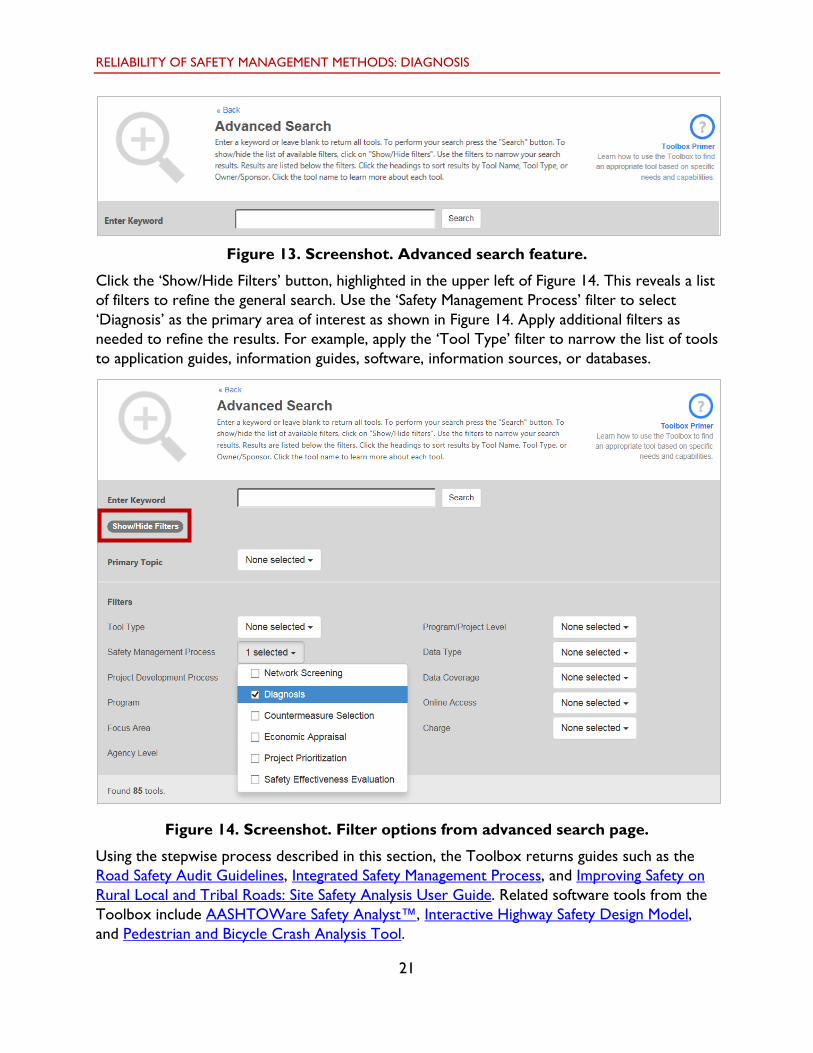
Figure 13. Screenshot. Advanced search feature.
Click the ‘Show/Hide Filters’ button, highlighted in the upper left of Figure 14. This reveals a list of filters to refine the general search. Use the ‘Safety Management Process’ filter to select ‘Diagnosis’ as the primary area of interest as shown in Figure 14. Apply additional filters as needed to refine the results. For example, apply the ‘Tool Type’ filter to narrow the list of tools to application guides, information guides, software, information sources, or databases.
Figure 14. Screenshot. Filter options from advanced search page.
Using the stepwise process described in this section, the Toolbox returns guides such as the Road Safety Audit Guidelines, Integrated Safety Management Process, and Improving Safety on Rural Local and Tribal Roads: Site Safety Analysis User Guide. Related software tools from the Toolbox include AASHTOWare Safety Analyst™, Interactive Highway Safety Design Model, and Pedestrian and Bicycle Crash Analysis Tool.
21

RELIABILITY OF SAFETY MANAGEMENT METHODS: DIAGNOSIS
6. REFERENCES
1. American Association of State Highway and Transportation Officials (AASHTO), Highway Safety Manual, First Edition, Washington, DC, 2010.
2. Srinivasan, R., F. Gross, B. Lan, and G. Bahar. Reliability of Safety Management Methods: Network Screening, Report No. FHWA-SA-16-037, Federal Highway Administration,Washington, D.C., October 2016.
3. Bahar, G., R. Srinivasan, and F. Gross. Reliability of Safety Management Methods: Countermeasure Selection, Report No. FHWA-SA-16-039, Federal Highway Administration, Washington, D.C., August 2016.
4. Srinivasan, R., F. Gross, and G. Bahar. Reliability of Safety Management Methods: Safety Effectiveness Evaluation, Report No. FHWA-SA-16-040, Federal Highway Administration,Washington, D.C., March 2016.
5. Federal Highway Administration, FHWA Road Safety Audit Guidelines, Publication FHWA-SA-06-06, February 2005.
6. Hauer, E. (1996a), Detection of Safety Deterioration in a Series of Accident Counts.Transportation Research Record 1542, 38-43.
7. Hauer, E. (1996b), Statistical Test of the Difference between Expected Accident Frequencies, Transportation Research Record 1542, 24-29.
8. Heydecker, B. J., and J. Wu (1991), Using the Information in Road Accident RecordsProc., 19th PTRC Summer Annual Meeting, London.
9. Kononov, J. (2002), Identifying Locations with Potential for Collision Reductions: Use ofDirect Diagnostics and Pattern Recognition Methodologies, Transportation ResearchRecord 1784, pp. 153-158.
10. Haddon, W., Jr. (1972). A logical framework for categorizing highway safety phenomenaand activity. Journal of Trauma 12: 193–207.
11. AASHTOWare Safety Analyst™. Software Tools for Safety Management of Specific Highway Sites: White Paper for Module 1—Network Screening, August 2010. Accessed September 19, 2016 from: http://www.safetyanalyst.org/whitepapers/module1.pdf
12. Kononov, J. and B.N. Janson (2002), Diagnostic Methodology for the Detection of Safety Problems at Intersections, Transportation Research Record 1784, pp. 51-56, 2002.
13. Gross, F., T. Harmon, M. Albee, S. Himes, R. Srinivasan, D. Carter, and M. Dugas.Evaluation of Four Network Screening Performance Measures, Report No. FHWA-SA-16-103, Federal Highway Administration, Washington, D.C., October 2016.
14. Herbel, S., Laing, L., and McGovern, C. (2010), Highway Safety Improvement Program (HSIP) Manual, Report FHWA-SA-09-029, Federal Highway Administration.
22
For More Information: Stuart Thompson [email protected] 202-366-8090
Federal Highway Administration Office of Safety 1200 New Jersey Avenue SE Washington, DC 20590 http://safety.fhwa.dot.gov/
Publication # FHWA-SA-16-038