relationships among the pennsylvania system of … reports and...humrro report no. fr-04-26...
TRANSCRIPT
HumRRO Report No FR-04-26
Relationships Among the Pennsylvania System of School Assessment (PSSA) Scores SAT Scores and Self-Reported High School Grades for the Classes of 2002 and 2003
Milton E Koger Arthur A Thacker Emily R Dickinson
Human Resources Research Organization (HumRRO) 950 Breckenridge Lane Suite 170 Louisville KY 40207 Phone (502) 721-9045 FAX (502) 721-9983
Prepared for Central Susquehanna Intermediate Unit PO Box 213 Lewisburg PA 17837
Abstract
As part of Pennsylvaniarsquos examination of the Pennsylvania System of School Assessment (PSSA) Human Resources Research Organization (HumRRO) examined whether PSSA scores are appropriately related to other measures of educational achievement by investigating the relationship between studentsrsquo performance on PSSA SAT and student-reported grade-point average and course grades obtained from the SATrsquos Student Descriptive Questionnaire (SDQ) Additionally student demographic information obtained from the PSSA database was used to examine demographic groups of interest as designated by the No Child Left Behind (NCLB) Act of 2001 However because students self-select to take the SAT as part of their college application process the student population examined in this report consists predominantly of the higher achieving students (about the upper two-thirds) attending public schools in Pennsylvania
The data presented in this report suggest the following main points
bull Students who do well on any of the assessments tend to do well on all of the assessmentsmdashPSSA SAT GPA or course grades
bull When schoolsrsquo means are calculated using only the SAT-taking population of students schools with high scores on SAT also have high PSSA scores GPA and course grades are also related to both PSSA and SAT although not as strongly as the relationship between the PSSA and SAT
PSSA exhibits strong convergent validity coefficients Correlations are very high between PSSA and SAT PSSA is positively correlated with other measures of student achievement including course grades and GPA Gains on PSSA are reflective of changes on SAT at the school level All these data provide strong evidence in support of PSSA as a valid measure of student achievement
There are however a few clarifications and qualifications to these general conclusions but none that diminish the basic findings These clarifications and qualifications include the following
Changes in scores Both mean PSSA and SAT scores experienced an increase Changes between the two assessments are positively correlated Schools that have gained on one assessment tend to have also gained on the other assessment However the same relationship is also true for those schools that have decreased
PSSA and SAT are tied to different content domains use differently formatted items and were designed to serve very different purposes However it is clear from the data that students who tend to perform well on the PSSA can also be expected to perform well on the SAT and vice-versa It is clear from the data that schools that perform well on one test can be expected to perform well on the other It is also clear that schools that improve on one test can be expected to improve on the other
Discriminant validity At both the student level and the school level the different assessments of mathematics achievement are more highly related to each other than to assessments of other subjects Students with high mathematics scores on one assessment will tend to do well on all other assessments but that tendency is most pronounced for other mathematics assessments The same holds for school scores There is a similar differentiation on
HumRRO ii April 2004
readingverbal assessments at both the student and school level but not as pronounced as in mathematics
GPA shows positive relationships with both PSSA and SAT assessments at the student and school level but not as pronounced as the relationship between the two assessments This is interpreted as being due to differences in schoolsrsquo grading practices Grading practices apparently differ sufficiently to reduce school-level associations with PSSA and SAT scores
Neither gender race socioeconomic status nor limited English proficiency appear to influence the PSSA scores any more than would be expected based on observed differences for SAT scores In other words PSSA items are not injecting any unexpected gender racialethnic socioeconomic status or limited English proficiency bias
HumRRO iii April 2004
Relationships Among the Pennsylvania System of School Assessment (PSSA) Scores SAT Scores and Self-Reported High School Grades for the Classes of
2002 and 2003
Table of Contents
Introduction1 Description of Data 2
Descriptive Statistics3 PSSA3 SAT Data 4
Matching Data5 Relationships Among Measures of Student-Level Performance 7
Correlations8 Illustration of Relationships10
SAT Verbal Score Versus PSSA Performance Level in Reading 11 PSSA Reading Scale Score Versus SAT Verbal Score by Quintile 12 SAT Math Score Versus PSSA Performance Level in Math14 PSSA Math Scale Score versus SAT Math Score by Quintile 16 PSSA Reading Scale Score Versus SAT Reported Average Grade in English18 PSSA Math Scale Score Versus SAT Reported Average Grade in Math20 PSSA Scale Scores Versus SAT Reported Grade-Point Average 22
Differences in Performance for Demographic Groupings27 Gender Differences 27 Ethnic or Racial Differences30 Economically Disadvantaged Differences33 Annual Family Income Differences35 Parent Educational Differences37 Limited English Proficiency Differences40
School-Level Scores 42 Average Within-Year School-Level Correlations 43 Pooled Within-School Correlations 47
Summary and Conclusion 53 References 55
List of Tables
Table 1 Summary Data from PSSA 2001 3 Table 2 Summary Data from 2002 PSSA 4 Table 3 Summary Data from 2003 PSSA 4 Table 4 Summary Data from SAT for 2001 through 2003 5 Table 5 Percentage of Students Retained in File Merge for Graduation Years 2003 and 2002 6 Table 6 SAT Descriptive Statistics for Graduating Classes of 2002 and 2003 with Matched
Unmatched and All Pennsylvania Public School Students 7 Table 7 PSSA Descriptive Statistics for Graduating Classes of 2002 and 2003 with Matched
Students Unmatched Students and All Pennsylvania Students 7
HumRRO iv April 2004
Table 8 PSSA SAT and Course Grade Correlations for Students in the Class of 2002 9 Table 9 PSSA SAT and Course Grades Correlations for Students in the Class of 2003 9 Table 10 PSSA SAT and Course Grades Correlations Averaged for the Classes of 2002 and
2003 10 Table 11 Changes in Mean Scale Scores Across Graduation Years 10 Table 12 Gender differences for PSSA (unmatched state data) 28 Table 13 Gender differences for Class of 2002 matched sample (2001 PSSA and 2002 SAT) 28 Table 14 Gender differences for class of 2003 matched sample ( 2001 PSSA and 2002 SAT) 29 Table 15 Regressions Results Showing the Adjusted Strength of Gender on Predicting 2001
PSSA 11th Grade Scale Scores Based on 2002 SAT Scores 29 Table 16 Regressions Results Showing the Adjusted Strength of Gender on Predicting 2002
PSSA 11th Grade Scale Scores Based on 2003 SAT Scores 29 Table 17 Ethnicity differences for PSSA (unmatched state data) 30 Table 18 Ethnicity differences for the class of 2002 matched sample (2001 PSSA 11th Grade and
2002 SAT) 31 Table 19 Ethnicity differences for the class of 2003 for matched sample (2002 PSSA 11th Grade
and 2003 SAT) 32 Table 20 Regressions Results Showing the Adjusted Strength of Being Black on Predicting 2001
PSSA 11th Grade Scale Scores Based on 2002 SAT Scores 32 Table 21 Regressions Results Showing the Adjusted Strength of Being Black on Predicting 2002
PSSA 11th Grade Scale Scores Based on 2003 SAT Scores 33 Table 22 Regressions Results Showing the Adjusted Strength of Being HispanicLatino on
Predicting 2001 PSSA 11th Grade Scale Scores Based on 2002 SAT Scores 33 Table 23 Regressions Results Showing the Adjusted Strength of Being HispanicLatino on
Predicting 2002 PSSA 11th Grade Scale Scores Based on 2003 SAT Scores 33 Table 24 Differences for Economically Disadvantaged Students for PSSA (unmatched state
data) 34 Table 25 Differences for economically disadvantaged students for matched sample for the class
of 2002 (2001 PSSA 11th Grade and 2002 SAT) 34 Table 26 Differences for economically disadvantaged students for matched sample for the class
of 2003 (2002 PSSA 11th Grade and 2003 SAT) 35 Table 27 Regressions Results Showing the Adjusted Strength of Being Economically
Disadvantaged on Predicting 2001 PSSA 11th Grade Scale Scores Based on 2002 SAT Scores 35
Table 28 Regressions Results Showing the Adjusted Strength of Being Economically Disadvantaged on Predicting 2002 PSSA 11th Grade Scale Scores Based on 2003 SAT Scores 35
Table 29 Annual family income differences for matched sample for the class of 2002 (2001 PSSA 11th Grade and 2002 SAT) 36
Table 30 Annual family income differences for matched sample for the class of 2003 (2002 PSSA 11th Grade and 2003 SAT) 37
Table 31 Mothers education level differences for matched sample for the class of 2002 (2001 PSSA 11th Grade and 2002 SAT) 38
Table 32 Mothers education level differences for matched sample for the class of 2003 (2002 PSSA 11th Grade and 2003 SAT) 38
HumRRO v April 2004
Table 33 Fathers education level differences for matched sample for the class of 2002 (2001 PSSA 11th Grade and 2002 SAT) 39
Table 34 Fathers education level differences for matched sample for the class of 2003 (2002
Table 35 Limited English Proficiency differences for 11th Grade PSSA (unmatched state data)40
Table 37 Limited English Proficiency differences for matched sample for class of 2003 (2002
Table 45 School-Level PSSA SAT and Course Grades Correlation Averages for the Class of
Table 46 Difference in mean school-level SAT Verbal and PSSA Reading scores from the class of 2002 and class of 2003 (Minimum of 10 students taking the SAT and merging with
Table 47 Correlation of difference in school-level mean SAT Verbal score and PSSA Reading
Table 48 Difference in mean school-level SAT Math and PSSA Math scores from the class of 2002 and class of 2003 (Minimum of 10 students taking the SAT and merging with PSSA
Table 49 Correlation of difference in school-level mean SAT Math score and PSSA Math score
Table 53 Differences Between Student-Level Correlations and Pooled Within-School
Table 54 Differences Between SAT and PSSA Components for Student-Level Correlations and
Table 55 Internal Differences between SAT and PSSA Components for Student-Level Correlations and Pooled Within-School Correlations Averaged for the Classes of 2002 and
PSSA 11th Grade and 2003 SAT) 39
Table 36 Limited English Proficiency differences for matched sample class of 2002 (2001 PSSA 11th Grade and 2002 SAT) 40
PSSA 11th Grade and 2003 SAT) 41 Table 38 Regressions Results Showing the Adjusted Strength of Being Limited English
Proficient on Predicting 2001 PSSA 11th Grade Scale Scores Based on 2002 SAT Scores 41 Table 39 Regressions Results Showing the Adjusted Strength of Being Limited English
Proficient on Predicting 2002 PSSA 11th Grade Scale Scores Based on 2003 SAT Scores 41 Table 40 PSSA School-Level Descriptive Statistics for the Classes of 2002 and 2003 42 Table 41 SAT School-Level Descriptive Statistics for the Classes of 2002 and 2003 42 Table 42 School-Level Descriptive Statistics GPA and Course Grades for the Classes of 2002
and 2003 43 Table 43 School-Level PSSA SAT and Course Grade Correlations for the Class of 2002 44 Table 44 School-Level PSSA SAT and Course Grades Correlations for the Class of 2003 44
2002 and 2003 45
PSSA file at a school) 45
score between the class of 2002 and the class of 2003 45
file at a school) 46
between the class of 2002 and the class of 2003 47 Table 50 Pooled Within-School Correlation for the Class of 2002 49 Table 51 Pooled Within-School Correlation for the Class of 2003 49 Table 52 Pooled Within-School Correlation Averaged for Graduation Years 2002 and 2003 50
Correlations Averaged for the Classes of 2002 and 2003 51
Pooled Within-School Correlations Averaged for the Classes of 2002 and 2003 52
2003 53
List of Figures
Figure 1 Student-level relationship between 2002SAT Verbal score and 2001 PSSA 11th Grade Reading Performance Level for the class of 2002 11
HumRRO vi April 2004
Figure 2 Student-level relationship between 2003 SAT Verbal score and 2002 PSSA 11th Grade Reading Performance Level for the class of 2003 12
Figure 3 Student-level relationship between 2001 PSSA Reading scale scores and 2002 SAT Verbal scores divided into quintiles for the class of 2002 13
Figure 4 Student-level relationship between 2002 PSSA 11th Grade Reading scale scores and 2003 SAT Verbal score divided into quintiles for the class of 2003 14
Figure 5 Student-level relationship between 2002 SAT Math score and 2001 PSSA 11th Grade Math Performance Level for the class of 2002 15
Figure 6 Student-level relationship between SAT Math score and PSSA performance level for the class of 2003 16
Figure 7 Student-level relationship between 2001 PSSA 11th Grade Math scale score and 2002 SAT Math score divided into quintiles for the class of 2002 17
Figure 8 Student-level relationship between 2002 PSSA 11th Grade Math scale scores and 2003 SAT Math scores divided into quintiles for the class of 2003 18
Figure 9 Student-level relationship between 2001 PSSA 11th Grade Reading Scale Score and student reported average English grade on the Student Descriptive Questionnaire (SDQ) of the SAT for the class of 2002 19
Figure 10 Student-level relationship between 2002 PSSA 11th Grade Reading Scale Score and student-reported English grade on the SAT Student Descriptive Questionnaire (SDQ) for the class of 2003 20
Figure 11 Student-level relationship between 2001 PSSA 11th Grade Math Scale Score and student-reported Math grade in the Student Descriptive Questionnaire (SDQ) of the SAT for the class of 2002 21
Figure 12 Student-level relationship between 2002 PSSA 11th Grade Math Scale Score and student-reported average Math grade in the SAT Student Descriptive Questionnaire (SDQ) for the class of 2003 22
Figure 13 Student-level relationship between 2001 PSSA 11th Grade Reading scale score and student-reported grade-point average (GPA) from the SATrsquos Student Descriptive Questionnaire (SDQ) for the class of 2002 23
Figure 14 Student-level relationship between 2002 PSSA 11th Grade Reading scale score and student-reported grade-point average (GPA) from the SATrsquos Student Descriptive Questionnaire (SDQ) for the class of 2003 24
Figure 15 Student-level relationship between 2001 PSSA 11th Grade Math scale score and student-reported grade-point average (GPA) from the SATrsquos Student Descriptive Questionnaire (SDQ) for the class of 2002 25
Figure 16 Student-level relationship between 2001 PSSA 11th Grade Math scale score and student-reported grade-point average (GPA) from the SATrsquos Student Descriptive Questionnaire (SDQ) for the class of 2002 26
Figure 17 Scatterplot of difference in school-level SAT Verbal mean scores and school-level PSSA 11th Grade Reading mean scores between the Class of 2002 and Class of 2003 46
Figure 18 Scatterplot of differences in school-level mean SAT Math Score and school-level mean PSSA Math Scores between the Class of 2002 and Class of 2003 47
Figure 19 Extreme hypothetical illustration of how mean differences among schools on PSSA or SAT scores that are not mirrored by differences in GPA can impact correlations (Ellipses represent students scores within each school) 48
HumRRO vii April 2004
Figure 20 Extreme hypothetical illustration of how mean differences among schools on PSSA scores that are not mirrored by differences on SAT scores can impact correlations (Ellipses represent students scores within each school) 52
Figure 21 Exaggerated illustration of how mean differences among schools can increase overall correlations (Ellipses represent students scores within each school) 53
HumRRO viii April 2004
Relationships Among the Pennsylvania System of School Assessment (PSSA) Scores SAT Scores and Self-Reported High School Grades for the Classes of
2002 and 2003
Introduction As part of Pennsylvaniarsquos System of School Assessment (PSSA) students in Grades 5 8
and 11 take tests in reading and mathematics Students in Grades 6 9 and 11 are assessed in writing The annual PSSA is a standards-based criterion-referenced assessment used to measure a studentrsquos attainment of academic standards while also determining the degree to which school programs enable students to attain proficiency standards PSSA results are produced at student and school levels Student scores which are provided to their respective schools can be used diagnostically to identify students in need of additional educational opportunities School scores are provided for schools and districts to use for curriculum and instruction improvement discussions and planning (wwwpdestatepausa_and_tsite)
PSSA tests studentsrsquo abilities in relation to academic standards adopted in 1999 The standards identify what students should know and be able to do within each subject area at each designated grade level PSSA test items are linked to the standards and PSSA scores are used to stratify student performance within the standards Students receive designations of Below Basic Basic Proficient or Advanced depending on how they score in each tested subject These proficiency levels are determined using cut scores on the PSSA measurement scale Cut scores were determined using the Bookmark (Lewis Mitzel amp Green 1996) and Borderline Groups (Livingston amp Zieky 1978) standards-setting procedures
Because PSSA serves as an assessment for individual students and for schools it is configured using common and matrix items Common items are administered to all students and are used to create all student-level measures Matrix items are administered by form such that each student only takes a portion of the matrix items There are typically 10-12 matrix forms spiraled within classrooms to ensure that a random and representative sample of students receives each form The matrix items add to the overall content coverage of the PSSA and allow for better diagnostic data to be produced at school and district levels
In addition to the PSSA many students also take the SAT test as a requirement for admission to Pennsylvania colleges and universities SAT is designed to be predictive of college performance Most Pennsylvania students who plan to attend college take the SAT 1 version of the test which includes a verbal and a mathematics component Both PSSA and SAT test data includes student demographic information allowing students to be matched by name and date of birth and allowing the examination of test performance in relation to various demographic factors
The quality of an assessment is typically characterized by its reliability and validity The usual measure of reliability is an indication of how similar a studentrsquos scores on an assessment would be if student took the test multiple times or test-retest reliability Reliability is largely concerned with the consistency of an assessment Reliability coefficients are provided in the PSSA technical manuals produced by Data Recognition Corporation (DRC) each year (Mead amp Melby 2002 Mead amp Melby 2003 and Mead Smith amp Swanlund 2003) PSSA test-retest reliabilities ranged from 093 to 094 for math and from 092 to 094 for reading for the full set of items (common + matrix) in 2002 They were slightly lower for the common items only 092 for
HumRRO 1 April 2004
math for all grades and ranging from 088 to 091 for reading (Estimates were very similar in 2001 and 2003) This reduction in reliability for the common items reflects that reliability statistics are influenced to a great extent by test length The common section of the PSSA ranges from a minimum of 60 score points (for Grade 5 reading) to 80 or more score points (for all other gradesubjects) This relatively large number of items helps account for PSSArsquos very high reliability estimates
So we know that according to traditional reliability statistics PSSA is a reliable measurement instrument This report is concerned with the validity of the PSSA Simply put does the PSSA measure what it purports to measure This is not as simple a question as it seems One way of investigating validity is to compute convergent validity coefficients Convergent validity coefficients are measures of the relationship between two separate tests of student ability for the same subject matter They are correlations between studentsrsquo performance on the two tests Often convergent validity statistics are used to ensure that multiple forms from a single assessment are measuring essentially equivalent content When convergent validity coefficients are calculated for that purpose higher correlations are considered better than lower correlations When we correlate PSSA scores with scores from SAT however the interpretation of the coefficients requires additional explanation
PSSA tests student ability related to content that is specific to Pennsylvania The academic standards outline the content that Pennsylvania has collectively decided is essential for students in its public schools The extent to which another test measures content that is different from Pennsylvaniarsquos will limit the strength of the correlation between the two assessments In fact if the correlation were very high it would raise questions as to whether the two assessments were measuring anything different at all and consequently whether both are necessary PSSA is composed of multiple-choice and performance-task items If another test uses only multiple-choice items there may be method differences that reduce the strength of the correlations as well Still all the tests analyzed as part of this research report scores for recognizable subjects such as mathematics and reading We expect student scores on the various tests to be related We are left looking for what Hoffman (1998) refers to as ldquoGoldilocksrdquo correlations Correlations between PSSA and SAT should fall in the not-too-high and not-too-low category
Comparisons between PSSA and other tests can also provide insights into performance of various identified groups of interest The federal No Child Left Behind (NCLB) Act of 2001 (NCLB 2004) requires that each state measure the proficiency of its students as well as reduce gaps between traditionally lower-performing groups and their higher-performing peers NCLB requires that states reduce gaps associated with race socioeconomic status language and disability Comparisons of group performance on PSSA can determine if there is differential impact a necessary but insufficient condition for bias associated with the assessment This report examines gender race language and socioeconomic status for differential impact Due to inconsistencies in the manner in which students with disabilities are treated when taking the assessments disability is not considered
Description of Data Student-level PSSA files from the administrations in 2001 2002 and 2003 were provided
by DRC HumRRO downloaded the data from a secure file transfer protocol (FTP) site Files included student responses and scores for reading and mathematics as well as demographic information Files also identified students by name school and district In most cases student
HumRRO 2 April 2004
birthdates were also included in the files No student-level records were shared with the Pennsylvania Department of Education (PDE) Files included student-level identifiers for the expressed purpose of matching PSSA results with results from other assessments Once matching was complete student names and birthdates were purged from all working files All PSSA files were provided as text files Text files were converted to SAS databases prior to analyses or merging with other files
College Board provided state-level SAT data from administrations conducted in 2001 2002 and 2003 College Board provided only data from students enrolled in public schools Private school students are not considered under the jurisdiction of the Pennsylvania Department of Education so identifiers were not available for those students even if their schools opted to take the PSSA Consequently the number of students and mean scores reported in this study do not match the numbers and means provided on College Boardrsquos web site for Pennsylvania
Descriptive Statistics
PSSA
Tables 1-3 present a summary of the data included in the PSSA files Statistics represent scale scores for reading and mathematics and are the same scale scores reported to students They are based only on the common set of items to which all students respond The number of cases presented in the first column is the total number of students in the file Not all of those students had data in the scale-score fields so n-counts are smaller than the number of cases Scale score minimums were limited to 700 for 2002 and 2003
Table 1 Summary Data from PSSA 2001
Grade Mathematics (Non-Missing)
Reading (Non-Missing)
Grade 5 N 142858 142810 (Cases = 145440) Mean 131142 131214
SD 19065 20268 Minimum 595 381 Maximum 2212 2506 Grade 8 N 139322 139073 (Cases = 143119) Mean 131046 130456
SD 20035 21006 Minimum 373 100 Maximum 2201 2214 Grade 11 N 116137 115566 (Cases = 122332) Mean 130411 129687
SD 22057 21757 Minimum 100 100 Maximum 2481 2088
HumRRO 3 April 2004
Table 2 Summary Data from 2002 PSSA
Grade Mathematics (Non-Missing)
Reading (Non-Missing)
Grade 5 N 143159 143046 (Cases =145688) Mean 131519 131639
SD 20832 20513 Minimum 700 700 Maximum 2409 2630 Grade 8 N 141910 141801 (Cases =146127) Mean 131578 130970
SD 19962 21887 Minimum 700 700 Maximum 2293 2345 Grade 11 N 123550 123234 (Cases =129475) Mean 131447 131286
SD 22829 21513 Minimum 700 700 Maximum 2437 2362
Table 3 Summary Data from 2003 PSSA
Grade Level Mathematics (Non-Missing)
Reading (Non-Missing)
Grade 5 N 141402 141530 (Cases =143502) Mean 133813 133160
SD 20798 22459 Minimum 700 700 Maximum 2325 2444 Grade 8 N 144964 145302 (Cases =148760) Mean 131992 133697
SD 20904 22705 Minimum 719 700 Maximum 2228 2666 Grade 11 N 126941 127427 (Cases =133168) Mean 131478 131561
SD 21478 23539 Minimum 700 700 Maximum 2238 2355
SAT Data
Table 4 contains descriptive statistics for SAT data College Board provided SAT data for 2001 2002 and 2003 Note that the number of students taking the SAT is considerably fewer than those taking the Grade 11 PSSA Students typically take the SAT in preparation for post-
HumRRO 4 April 2004
secondary education Students with no plans for continuing their education past high school may not take the SAT The minimum and maximum scores on SAT for both verbal and mathematics tests was 200 and 800 respectively for all years
Table 4 Summary Data from SAT for 2001 through 2003 SAT Year Verbal Mathematics
2001 N Mean SD
75696 49734 10350
75696 49918 10961
2002 N Mean SD
76924 49468 10408
76924 50006 11073
2003 N Mean SD
79149 49732 10325
79149 50296 11020
Matching Data
All comparison test data had to be matched to PSSA data in order to perform correlations and other calculations The SAT data provided by the College Board consisted of separate annual data files for Pennsylvania public school students graduating from 2001 to 2003 PSSA data files consisted of data files for 11th grade students from 2001 to 2003 SAT data files were merged with PSSA data files to produce data files for students graduating in 2003 (2003 SAT file merged with 2002 PSSA 11th grade file) and 2002 (2002 SAT file merged with the 2001 PSSA 11th grade file)
Rules were established to ensure the consistency of merging data Each merge attempt resulted in three filesmdashsuccessfully merged student data unmerged students from File 1 and unmerged students from File 2 Each successive merge attempt was made using only students from the unmerged files The successfully merged data was then appended to create the final working files
The data file for students graduating in 2003 was obtained by exactly matching student names and birthdates in the two files This was done in four merge cycles For the first cycle we merged on exact matches of student last name first name middle initial and birth date For the second cycle we merged on student last name first name and birth date For the third cycle we merged on last name first name truncated to the first four letters and birth date For the fourth cycle we merged on last name truncated to the first four letters first name truncated to the first four letters and birth date
Because of an apparent error in the birth date for one of the files for students graduating in 2002 birth date could not be used As a result we merged files for this class in two cycles For the first cycle we merged on last name first name and middle initial For the second cycle we merged on last name and first name A more detailed explanation of this is found in the following paragraph
Table 5 presents the proportion of students retained in the final PSSASAT data set reported by graduation year Following the final merge cycle slightly more than 90 of the original cases in the SAT data file were retained The successful merging of the files was
HumRRO 5 April 2004
hampered by inconsistent reporting of studentsrsquo names across the tests Student or coding errorsdifferences created inconsistencies between the two tests (eg O BRIEN versus OrsquoBRIEN or TOM versus THOMAS) Additionally missing birth date or invalid birth date (eg 13th month 32nd day of 2001 for a 2003 high school graduate) by a student or in the coding process on one of the tests may also have caused a portion of studentsrsquo files not to merge Also of note is the fact that the 2001 and 2002 PSSA files were missing more than 10000 birth dates in the two files combined Additionally for the PSSA 2002 and the SAT 2003 data files there appeared to be an error in the birth date file that resulted in virtually no matches between the files when birth date was included As a result the two files went through only two merge cycles which did not include birth date
Table 5 Percentage of Students Retained in File Merge for Graduation Years 2003 and 2002 Students Percent
Year Merge Cycle in SAT of SAT File File
Beginning File 79095 100
1st Merge (last name first name middle initial birth date 60044 759
2003 2nd Merge (last name first name birth date) 69416 878
3rd Merge (last name truncated first name birth date) 70831 896
4th Merge (truncated last name truncated first name birth date) 71511 904
Beginning File 76925 100
2002 1st Merge (last name first name middle initial) 60317 7841
2nd Merge (last name first name) 69325 9012 Note For 2002 there was a discrepancy in the birth date information between the 2001 PSSA data file for 11th graders and the 2002 SAT data file As a result birth date information could not be used in conducting the merge for that year
An additional analysis was conducted to verify that students retained in the final data set did not differ significantly on SAT scores from those whose data failed to merge Table 6 presents the means standard deviations and numbers of cases for matched and all Pennsylvania public school students for 2002 and 2003 Mean scores in 2003 for students whose data were merged were approximately 30 scale score points higher than mean scores for all students and about 30 points higher than for unmerged students The mean for merged students was about 26 scale score points higher than the mean for all students in 2002 for both tests The difference in means between merged students and unmerged students also was about 30 points in 2002 Data includes students attending public schools in Pennsylvania only While this difference is a concern it is consistent between the two years Correlations also were conducted on each cycle during the merge to check that correlations were approximately the same from cycle to cycle Correlations remained approximately the same for each merge cycle Results of these checks are not contained in this report
HumRRO 6 April 2004
Table 6 SAT Descriptive Statistics for Graduating Classes of 2002 and 2003 with Matched Unmatched and All Pennsylvania Public School Students
Graduating Class of 2002 Graduating Class of 2003
Matched Unmatched Total Matched Unmatched Total
Verbal Mean
SD
N
49731 47068 49468
10266 11348 10408
69325 7600 76925
50033 46892 49732
10182 11191 10325
71511 7584 79095
Math Mean
SD
N
50267 47619 50006
10943 11930 11073
69325 7600 76925
50604 47392 50296
10908 11633 11020
71511 7584 79095 Note Student data are for students attending public schools in Pennsylvania only No private school student data is included
An additional analysis was conducted to compare PSSA scores between students whose data matched whose data failed to match and with the total file Table 7 presents the means standard deviations and numbers of cases for Pennsylvania public school students for 2002 and 2003 As expected the mean scores for merged students for both tests in both years are higher than for unmerged student scores and the state total Students taking the SAT are generally college-bound students (the merged file) and typically score higher than non-college-bound students (most of the students in the unmerged file) on academically-oriented assessments Since the total file is the combination of the two filesmdashmerged and unmergedmdashthe total file mean should fall between the means for the two files
Table 7 PSSA Descriptive Statistics for Graduating Classes of 2002 and 2003 with Matched Students Unmatched Students and All Pennsylvania Students
Graduating Class of 2002 (11th Grade PSSA for 2001)
Graduating Class of 2003 (11th Grade PSSA for 2002)
Matched Unmatched Total Matched Unmatched Total
Reading Mean
SD
N
138250 117432 129689
17902 20903 21756
68039 47523 115562
140630 118618 131287
16856 20645 21513
70926 52306 123232
Math Mean
SD
N
139283 117796 130413
20078 18275 22057
68189 47943 116132
141479 117902 131448
20626 18192 22828
70981 52566 123547
Relationships Among Measures of Student-Level Performance This section presents relationships among PSSA and other measures of student
performancemdashSAT scores grade-point average (GPA) and course gradesmdashby examining correlations among the measures and graphical portrayals of the relationships GPAs and course
HumRRO 7 April 2004
grades were obtained from the optional Student Descriptive Questionnaire (SDQ) which students are asked to complete as part of the SAT assessment process HumRRO had specifically requested certain demographic information obtained by the SDQ when we requested the SAT data files The use of self-reported data undoubtedly involves some inaccuracies However Cassady (2001) found studentsrsquo self-reported grades to be a reliable measure of actual grades
Correlations1
Pearson correlations were calculated for the PSSA-SAT merged files for both graduating classes The tables differentiate between the correlations among the content areas within each of the different assessments from the correlations between the different kinds of assessments (Campbell amp Fiske 1959) thus allowing for the examination of the following relationships
bull The same content area within different achievement measures or convergent validity coefficients (Campbell amp Fiske 1959) (These correlations are in bold and underlined)
bull Different content areas within the same achievement measures (These correlations are in italics)
bull Different content areas within different achievement measures (These correlations are in bold but not underlined)
In correlation tables of this type the expectation is for the highest correlations to be between different measures of the same content Then because of similarities in test-taking strategies or other method effects the next highest correlations are typically those between different content but measured by the same method of assessment Correlations between different content areas within different measures should be the lowest in the table
As the tables show correlations are positive and above 030 This means that students who do well on any one measure of any content also tend to do well on all measures and in all content areas In a recent study of school-level assessment scores Sicoly (2002) discussed the existence of a general cognitive factor that ldquocuts across content areasrdquo If such a ldquog-factorrdquo exists then it would be expected that students with high ability would score well on any test regardless of the content Correlations presented in these tables suggest that Pennsylvania students who exhibit high ability in one content area can be expected to perform well in other content areas
The results are shown in Table 8 for the Class of 2002 Table 9 for the Class of 2003 and Table 10 for the two-year averaged2 correlation for PSSA SAT GPA and course grades The correlations for both 2002 and 2003 and the two-year average show a strong correlation between the math and readingverbal component on each assessment (r = 0686 for PSSA and r = 0737 for SAT for the two-year average) and between the math components on the two assessments and the readingverbal assessments on the two assessments (r = 0856 for math and r = 0742 for readingverbal for the two years averaged)
Correlations for student-reported scores tended to be lower than correlations between the two assessments Correlations between PSSA and SAT to student-reported GPAs were lower but were still approximately 05 (r = 0501 for PSSA reading r = 0539 for PSSA math r = 0491 for SAT verbal and r = 0525 for SAT math) Correlations between GPA and both English
1 Given the extremely large sample sizes tests of statistical significance are irrelevant All reported relationships are statistically significant that is unlikely to be due to chance Therefore the report focuses on interpretation of the results
2 The technical r to z correction was used to obtain the averaged correlations
HumRRO 8 April 2004
and math course grades were high (r = 0708 for English and r = 0669 for math) Correlations for student-reported course grades and the matching component of the two assessments were also fairly high English was approximately 045 and math was approximately 0530 (r = 0443 for English course grades to PSSA reading r = 0446 for English course grades to SAT verbal r = 0534 for math course grades to PSSA math and r = 0529 for math course grades to SAT math for the two-year average) The lower correlations between course grades and the two assessments can be partially attributed to differences in courses taken and grading practices from teacher to teacher and school to school
Table 8 PSSA SAT and Course Grade Correlations for Students in the Class of 2002 PSSA SAT Course Grades
Variable Reading Math Verbal Math GPA (Total) English Math
ReadingPSSA
Math
1000
0678 1000
Verbal SAT
Math
0704 0685
0593 0846
1000
0735 1000
GPA
English Course
Grades Math
0501 0539
0443 0399
0361 0528
0491 0525
0447 0390
0354 0527
1000
0708 1000
0669 0449 1000
Table 9 PSSA SAT and Course Grades Correlations for Students in the Class of 2003 PSSA SAT Course Grades
Variable Reading Math Verbal Math GPA (Total) English Math
ReadingPSSA
Math
1000
0694 1000
Verbal SAT
Math
0775 0694
0663 0865
1000
0739 1000
GPA
English Course
Grades Math
0520 0553
0455 0406
0380 0540
0496 0535
0444 0396
0363 0531
1000
0704 1000
0672 0454 1000
HumRRO 9 April 2004
2003 Table 10 PSSA SAT and Course Grades Correlations Averaged for the Classes of 2002 and
PSSA SAT Course Grades
Variable Reading Math Verbal Math GPA (Total) English Math
ReadingPSSA
Math
1000
0686 1000
Verbal SAT
Math
0742 0690
0629 0856
1000
0737 1000
GPA
English Course
Grades Math
0511 0546
0449 0403
0371 0534
0494 0530
0446 0393
0359 0529
1000
0706 1000
0671 0452 1000
Table 11 shows that student performance on both the SAT and PSSA increased from the Class of 2002 to the Class of 2003 For the SAT the increase was 302 scale score points for the verbal portion of the assessment and 337 scale score points for the math portion of the assessment For the PSSA the increase was 2380 scale score points for the verbal portion of the assessment and 2196 scale score points for the math portion of the assessment
Table 11 Changes in Mean Scale Scores Across Graduation Years Mean Scores Class of 2002
Mean Scores Class of 2003
Mean Score Difference
SAT Verbal Math
49731 50267
50033 50604
+302 +337
PSSA Reading Math
138250 139283
140630 141479
+2380 +2196
Illustration of Relationships
Figure 1 through Figure 16 present box plots that illustrate relationships between PSSA scores and other measures of student achievement These graphs further illustrate the strong correlations between the two tests in both subject areas and other measures of student performance Data are presented separately for the Classes of 2002 and 2003 The boxes and whiskers in each plot represent the distribution of scores versus the varying levels of the corresponding grouping of scores or performance measures (GPA or student course grades) Each box represents 50 of the students within each of the categories along the X-axis The median is represented by the line in the box The whiskers represent the spread of the distribution of students calculated at 15 times the length of the box This spread should include approximately 993 of all students for the given category Sample sizes within each category along the X-axis are noted
HumRRO 10 April 2004
SAT Verbal Score Versus PSSA Performance Level in Reading
Figure 1 and Figure 2 show the relationship between the SAT Verbal score on the y-axis and the 11th Grade PSSA Reading Performance Level on the x-axis for the Classes of 2002 and 2003 The graph shows a distinct stair-step especially for the Basic to Advanced levels for both classes The number of students in each level also indicates that more of the higher-achieving students on the PSSA are taking the SAT than are lower-achieving students
Outliers are hidden Extreme values are hidden
PSSA Performance Levels 1 - Below Basic 2 - Basic 3 - Proficient 4 - Advanced
1 2 3 4
2001 PSSA 11th Grade Reading Performance Level
200
300
400
500
600
700
800
2002
SA
T V
erba
l Sco
re
n=34825
n=10808 n=8020
n=15672
Figure 1 Student-level relationship between 2002 SAT Verbal score and 2001 PSSA 11th grade reading performance level for the Class of 2002
HumRRO 11 April 2004
Outliers are hidden Extreme values are hidden
1 2 3 4
2002 PSSA 11th Grade Reading Performance Level
200
300
400
500
600
700
800
2003
SA
T V
erba
l Sco
re
n=11539
n=5121
n=37823
n=17028 PSSA Performance Level 1 - Below Basic 2 - Basic 3 - Proficient 4 - Advanced
Figure 2 Student-level relationship between 2003 SAT verbal score and 2002 PSSA 11th grade reading performance level for the Class of 2003
PSSA Reading Scale Score Versus SAT Verbal Score by Quintile
Figure 3 and Figure 4 show the relationship between the PSSA reading scale score on the y-axis and the SAT verbal score by quintile on the x-axis for the Classes of 2002 and 2003 The graph shows a distinct stair-step for each quintile in both grades Two sets of cut scores are also illustrated on the graphs The graphrsquos legend lists the cut scores for each quintile The cut scores were chosen to place approximately 20 of the students taking the SAT in each quintile Because of the number of students with a score equal to the cut score the number of students in each quintile is not the same The cut points for each quintile therefore vary slightly between the two classes The second set of cut scores is represented by the lines that have been added to show the 11th grade PSSA reading performance levels This illustrates that most students in the top four quintiles or top 80 of those students taking the SAT are performing at the Proficient or Advanced level on the 11th grade PSSA reading assessment
HumRRO 12 April 2004
2001
PSS
A 1
1th
Gra
de R
eadi
ng S
cale
Sco
re
2000
1800
1600
1400
1200
1000
800
Outliers are hidden Extreme values are hidden
n=13209
n=13432
n=14286
n=13847
n=13265
1 2 3 4 5
2002 SAT Verbal Scores Divided into Quintiles
Advanced
Proficient
Basic
Below Basic
2002 SAT Verbal Quintiles 1 - Less than 420 2 - 420 to 480 3 - 480 to 520 4 - 520 to 580 5 - Greater than 580
Figure 3 Student-level relationship between 2001 PSSA reading scale scores and 2002 SAT verbal scores divided into quintiles for the Class of 2002
HumRRO 13 April 2004
Outliers are hidden Extreme values are hidden
1 2 3 4 5
2003 SAT Verbal Scores Divided Into Quintiles
800
1000
1200
1400
1600
1800
2000
2002
PSS
A 1
1th
Gra
de R
eadi
ng S
cale
Sco
re
n=13969
n=14502 n=13838
n=14314 n=14303
2003 SAT Verbal Quintiles 1 - Less than 420 2 - 420 to 480 3 - 480 to 520 4 - 520 to 580 5 - Greater than 580
Advanced
Proficient
Basic
Below Basic
Figure 4 Student-level relationship between 2002 PSSA 11th grade reading scale scores and 2003 SAT verbal score divided into quintiles for the Class of 2003
SAT Math Score Versus PSSA Performance Level in Math
Figure 5 and Figure 6 show the relationship between the SAT math score on the y-axis and the 11th grade PSSA math performance level on the x-axis for the Classes of 2002 and 2003 The graph shows a distinct stair-step for all levels in both grades The number of students in each level also indicates that more of the higher-achieving students are taking the SAT than are lower-achieving students
HumRRO 14 April 2004
Outliers are hidden Extreme values are hidden
PSSA Performance Levels 1 - Below Basic 2 - Basic 3 - Proficient 4 - Advanced
1 2 3 4
2001 PSSA 11th Grade Math Performance Level
200
300
400
500
600
700
800
2002
SA
T M
ath
Scor
e
n=20950
n=22786 n=14102
n=11487
Figure 5 Student-level relationship between 2002 SAT math score and 2001 PSSA 11th grade math performance level for the Class of 2002
HumRRO 15 April 2004
Outliers are hidden Extreme values are hidden
PSSA Performance Level 1 - Below Basic 2 - Basic 3 - Proficient 4 - Advanced
1 2 3 4
2002 PSSA 11th Grade Math Performance Level
200
300
400
500
600
700
800
2003
SA
T M
ath
Scor
e
n=13459
n=24205
n=24580
n=9267
Figure 6 Student-level relationship between 2003 SAT math score and 2002 PSSA 11th grade math performance level for the Class of 2003
PSSA Math Scale Score versus SAT Math Score by Quintile
Figure 7 and Figure 8 show the relationship between the 11th grade PSSA math scale score on the y-axis and the SAT math score by quintile on the x-axis for the Classes of 2002 and 2003 The graph shows a distinct stair-step for each quintile in both grades Two sets of cut scores are also illustrated on the graph The graphrsquos legend lists the cut scores for each quintile The cut scores were chosen to place approximately 20 of the students taking the SAT in each quintile Because of the number of students with a score equal to the cut score the number of students in each quintile is not the same The cut points for each quintile therefore vary slightly between the two classes The second set of cut scores is represented by the lines that have been added to show the for 11th grade PSSA math performance levels This figure clearly illustrates that more than 75 of students in the each of the top three quintiles or top 60 of those students taking the SAT are performing at the Proficient or Advanced level on the 11th Grade PSSA math assessment Additionally more than 75 of students taking the SAT in the top quintile and more than 50 of students in the second quintile are scoring in the Advanced performance level on the 11th grade PSSA math assessment
HumRRO 16 April 2004
Outliers are hidden Extreme values are hidden
1 2 3 4 5
2002 SAT Math Scores Divided into Quintiles
800
1000
1200
1400
1600
1800
2000
2001
PSS
A 1
1th
Gra
de M
ath
Scal
e Sc
ore
n=14834
n=13952
n=12271
n=13117
n=14015
Advanced
Proficient
Basic
Below Basic
2002 SAT Math Score Quintiles 1 - Less than 410 2 - 410 to 470 3 - 470 to 530 4 - 530 to 600 5 - Above 600
Figure 7 Student-level relationship between 2001 PSSA 11th grade math scale score and 2002 SAT math score divided into quintiles for the Class of 2002
HumRRO 17 April 2004
Outliers are hidden Extreme values are hidden
1 2 3 4 5
2003 SAT Math Scores Divided Into Quintiles
800
1000
1200
1400
1600
1800
2000
2002
PSS
A 1
1th
Gra
de M
ath
Scal
e Sc
ore
n=13337
n=14780
n=15184
n=14494
n=13186
2003 SAT Math Quintiles 1 - Below 410 2 - 410 to 480 3 - 480 to 530 4 - 530 to 600 5 - Above 600
Advanced
Proficient
Basic
Below Basic
Figure 8 Student-level relationship between 2002 PSSA 11th grade math scale scores and 2003 SAT math scores divided into quintiles for the Class of 2003
PSSA Reading Scale Score Versus SAT Reported Average Grade in English
Figure 9 and Figure 10 illustrate the relationship between the PSSA Reading scale scores and the grades students reported in the optional Student Descriptive Questionnaire (SDQ) portion of the SAT The SDQ asked students to report their average grade in English The available responses to this question were 0 ndash Failing 1 ndash Passing 2 ndash Fair 3 ndash Good or 4 ndash Excellent The category ldquoNo responserdquo indicates that the student did not respond to the question In 2002 8305 students did not respond to the English question In 2003 6170 students did not respond In 2002 13 students responded that their average English grade was ldquoFailingrdquo In 2003 6 students had this answer Students who did not respond and those who responded that their average grade was ldquoFailingrdquo were not included in the graphs As can be seen in Figure 10 scale scores in PSSA Reading tend to be higher for students reporting better performance in English coursework The preponderance of students reporting either a ldquoGoodrdquo or an ldquoExcellentrdquo English average scored in the Proficient or Advanced PSSA performance levels Additionally almost 90 of the students reported having either a ldquoGoodrdquo or ldquoExcellentrdquo average in English courses As previously noted self-reported data undoubtedly involves some inaccuracies however Cassady (2001) found studentsrsquo self-reported grades to be a reliable measure of actual grades
HumRRO 18 April 2004
2001
PSS
A 1
1th
Gra
de R
eadi
ng S
cale
Sco
re
2000
1800
1600
1400
1200
1000
800
600
Outliers are hidden Extreme values are hidden
n=27359
n=6538
n=23685
n=244
1 2 3 4
Student-Reported Average Grade for English on SAT Student Descriptive Questionnaire
Advanced
Proficient
Basic
Below Basic
Average Grade 1 - Passing 2 - Fair 3 - Good 4 - Excellent
Figure 9 Student-level relationship between 2001 PSSA 11th grade reading scale score and student-reported average English course grades on the Student Descriptive Questionnaire (SDQ) of the SAT for the Class of 2002
HumRRO 19 April 2004
Outliers are hidden Extreme values are hidden
1 2 3 4
Student-Reported Average Grade for English on SAT Student Descriptive Questionnaire
600
800
1000
1200
1400
1600
1800
2000
2200
2400
2002
PSS
A 1
1th
Gra
de R
eadi
ng S
cale
Sco
re
n=6065 n=26317 n=23397 n=249 Average Grade 1 - Passing 2 - Fair 3 - Good 4 - Excellent
Advanced
Proficient
Basic
Below Basic
Figure 10 Student-level relationship between 2002 PSSA 11th grade reading scale score and student-reported English course grades on the SAT Student Descriptive Questionnaire (SDQ) for the Class of 2003
PSSA Math Scale Score Versus SAT Reported Average Grade in Math
Figure 11 and Figure 12 illustrate the relationship between the PSSA 11th grade math scale scores and the grades students reported in the optional Student Descriptive Questionnaire (SDQ) portion of the SAT which students are asked to complete as part of registering for the SAT The SDQ asked students to report their average grade in math The available responses to this question were 0 ndash Failing 1 ndash Passing 2 ndash Fair 3 ndash Good or 4 ndash Excellent The category ldquoNo responserdquo indicates that the student did not respond to the question In 2002 8523 students did not respond to the math average grade question In 2003 6316 students did not respond In 2002 41 students responded that their average math grade was ldquoFailingrdquo In 2003 47 students had this answer Students who did not respond and those who responded that their average grade was ldquoFailingrdquo were not included in the graphs
HumRRO 20 April 2004
2001
PSS
A 1
1th
Gra
deM
ath
Scal
e Sc
ore 2000
1800
1600
1400
1200
1000
800
600
Outliers are hidden Extreme values are hidden
n=19993
n=11254 n=25509
n=970
1 2 3 4
Student-Reported Average Grade for Math on SAT Student Descriptive Questionnaire
Advanced
Proficient
Basic
Below Basic
Average Grade 1 - Passing 2 - Fair 3 - Good 4 - Excellent
Figure 11 Student-level relationship between 2001 PSSA 11th grade math scale score and student-reported average math course grades in the Student Descriptive Questionnaire (SDQ) of the SAT for the Class of 2002
HumRRO 21 April 2004
Outliers are hidden Extreme values are hidden
1 2 3 4
Student-Reported Average Grade for Math on SAT Student Descriptive Questionnaire
600
800
1000
1200
1400
1600
1800
2000
2002
PSS
A 1
1th
Gra
de M
ath
Scal
e Sc
ore
n=10370 n=24674
n=19835
n=1003
Advanced
Proficient
Basic
Below Basic
Average Grade 1 - Passing 2 - Fair 3 - Good 4 - Excellent
Figure 12 Student-level relationship between 2002 PSSA 11th grade math scale score and student-reported average math course grade in the SAT Student Descriptive Questionnaire (SDQ) for the Class of 2003
PSSA Scale Scores Versus SAT Reported Grade-Point Average
Figure 13 through Figure 16 illustrate relationships between PSSA scale scores and overall grade-point averages (GPAs) The GPAs are from the SATrsquos SDQ Students were asked to provide their GPA on a basic 4-point scale with pluses and minuses around each point (A+ = 43 A = 40 A- = 37 etc) Approximately 87 (60283 of 69325) of students in the Class of 2002 completed the GPA question in the SDQ and 83 (59258 of 71511) of students in the Class of 2003 completed the question The mean student-reported GPA was 333 (SD = 064) for the Class of 2002 and 335 (SD = 063) for the Class of 2003 The correlation for the 2001 PSSA 11th grade reading component with the 2002 GPA was 0501 For the 2001 PSSA 11th grade math component the correlation was 0539 For the 2002 PSSA the correlations were 0520 in Reading and 0553 in Math The box-plots for PSSA scale scores to GPA for both years and both tests performed as expectedmdashlower scores for lower GPAs and higher scores for higher GPAs Note that the median and boxes align fairly well with the appropriate performance levelsmdashA students in the Advanced and Proficient level B students generally in the Proficient level C students in the low Proficient and Basic levels and D students in the Basic level Note also that the number of students decreases sharply when the student-reported GPA drops below 30
HumRRO 22 April 2004
Outliers are hidden Extreme values are hidden
Advanced
Proficient
Basic
Below Basic
10 13 17 20 23 27 30 33 37 40 43
Student-reported GPA (4-point scale) on the 2002 SAT Student Descriptive Questionnaire (SDQ)
800
1000
1200
1400
1600
1800
2000
2001
PSS
A 1
1th
Gra
de R
eadi
ng S
cale
Sco
re
n=10261
n=5370 n=11810
n=11101 n=9668
n=4624
n=2381 n=3352
n=520 n=40
n=96
Figure 13 Student-level relationship between 2001 PSSA 11th grade reading scale score and student-reported grade-point average (GPA) from the SATrsquos Student Descriptive Questionnaire (SDQ) for the Class of 2002
HumRRO 23 April 2004
Outliers are hidden Extreme values are hidden
10 13 17 20 23 27 30 33 37 40 43 Student-reported GPA (4-point scale) on the 2003 SAT Student Descriptive Questionnaire (SDQ)
800
1000
1200
1400
1600
1800
2000
2002
PSS
A 1
1th
Gra
de R
eadi
ng S
cale
Sco
re
n=3304
n=10358
n=5089
n=11480
n=11507
n=9773
n=4602
n=2084 n=97 n=496 n=27
Advanced
Proficient
Basic
Below Basic
Figure 14 Student-level relationship between 2002 PSSA 11th Grade reading scale score and student-reported grade-point average (GPA) from the SATrsquos Student Descriptive Questionnaire (SDQ) for the Class of 2003
HumRRO 24 April 2004
Outliers are hidden Extreme values are hidden
10 13 17 20 23 27 30 33 37 40 43 Student-reported GPA (4-point scale) on the 2002 SAT Student Descriptive Questionnaire (SDQ)
800
1000
1200
1400
1600
1800
2000
2001
PSS
A 1
1th
Gra
de M
ath
Scal
e Sc
ore
n=10280
n=5391 n=11831
n=11123 n=9672
n=4635
n=2393 n=3377
n=526 n=42
n=97
Advanced
Proficient
Basic
Below Basic
Figure 15 Student-level relationship between 2001 PSSA 11th grade math scale score and student-reported grade-point average (GPA) from the SATrsquos Student Descriptive Questionnaire (SDQ) for the Class of 2002
HumRRO 25 April 2004
Outliers are hidden Extreme values are hidden
10 13 17 20 23 27 30 33 37 40 43 Student-reported GPA (4-point scale) on the 2003 SAT Student Descriptive Questionnaire (SDQ)
800
1000
1200
1400
1600
1800
2000
2002
PSS
A 1
1th
Gra
de M
ath
Scal
e Sc
ore
n=3319
n=10364
n=5091
n=11480
n=11514
n=9777
n=4600
n=2085 n=98
n=496
n=27
Advanced
Proficient
Basic
Below Basic
Figure 16 Student-level relationship between 2001 PSSA 11th grade math scale score and student-reported grade-point average (GPA) from the SATrsquos Student Descriptive Questionnaire (SDQ) for the class of 2002
HumRRO 26 April 2004
Differences in Performance for Demographic Groupings
Analyses were conducted to compare performance on the PSSA and SAT among students from varying backgrounds Average test performance tends to differ for students of differing genders ethnic groups and various measures associated with socioeconomic status The important question for judging bias on the PSSA is not whether specific groups show mean differences but whether those differences are larger for the PSSA than the differences observed on other measures of student achievement
Differences between measures of achievement can be captured in several ways This report will present two measures of mean differences First effect size statistics will be calculated for the differences between major categories of students (Coe 2002) The magnitude of the effect size statistics is less important than the difference between the effect sizes for PSSA compared to the other measures However measuring the magnitude of the gaps for NCLB-defined groups is instructive and important since all states are expected to make progress toward closing those gaps (No Child Left Behind 2004)
Effect size statistics can be interpreted as the average percentile standing of the average treated (or experimental) participant relative to the average untreated (or control) participant An effect size of 00 indicates that the mean of the treated group is at the 50th percentile of the control group An effect size of 08 indicates that the mean of the treated group is at the 79th
percentile of the control group An effect size of 17 indicates that the mean of the treated group is at the 955th percentile of the control group Cohen (1988) hesitantly defined effect sizes as ldquosmall d=2rdquo ldquomedium d=5rdquo and ldquolarge d=8rdquo He went on to caution against offering conventional operational definitions such as these in the diverse field of behavioral science
The second measure used to capture differences between measures of achievement was regression analysis Regression analysis was used to examine the extent to which PSSA differences in performance for various demographic groupings are similar to those found in SAT scores For each of the demographic groupings we calculated a regression equation to predict PSSA scores based on the matching SAT content score A second equation was created which added the specific demographic characteristic of interest If PSSA scores exhibit greater differences based on that demographic characteristic that characteristic will have a significant weight and there will be a meaningful increase in the prediction of the PSSA component score
Gender Differences
Table 12 presents performance means for males and females for the PSSA only This table provides information from the larger state population to use in comparison with the matched PSSA and SAT sample data The SAT-taking population can be expected to post higher means For all gender tables data is coded such that positive numbers indicate higher mean scores for males negative numbers indicate higher mean scores for females For the full population of PSSA takers the pattern of performance between males and females is consistent Males outscore females but only to a very small degree on the PSSA mathematics test for all three included years Females outscored males to a higher but still small degree on the PSSA reading test The differences between years are small and inconsistent This table shows that the gap in performance for both PSSA mathematics and reading between males and females is small and has not changed dramatically between 2001 and 2003
HumRRO 27 April 2004
Table 12 Gender Differences for PSSA (Unmatched State Data) Mean Scale Standard Number of Effect Size Year Subject Gender Score Deviation Cases d
Mathematics Male 130954 22870 56380
2001 Reading Female
Male Female
130288 127107 132719
21170 22731 20167
55496 56091 55280
0030
-0261 Mathematics Male 132475 23813 60777
2002 Reading Female
Male Female
130679 129478 133443
21694 22536 20034
59849 60686 59636
0079
-0186 Mathematics Male 132555 22198 63542
2003 Reading Female
Male 130434 129308
20680 24674
61849 63840
0099
Female 133974 22003 62020 -0200
Table 13 and Table 14 present data for the matched sample of students taking both PSSA and SAT by gender Scale scores for both assessments as well as studentsrsquo self-reported GPA are included in the tables The numbers of males versus females in the state student population is similar typically with a few more males than females per grade However many more females take the SAT tests suggesting that more females than males aspire to attend college Males outscored females by a small margin on the PSSA and the SAT mathematics tests This finding is consistent with scoring patterns on SAT and ACT reported by Willingham and Cole (1997) They suggest that as a rule females tend to avoid taking mathematics and science classes In an apparent inconsistency females outscored males on PSSA reading but not on SAT verbal Scores for SAT verbal were nearly identical for males and females Willingham and Cole found gender differences favoring females in writing skills The PSSArsquos performance-task items add a writing component that was not present in the SAT for the Classes of 2002 and 2003 However SAT will include a student-written essay beginning in spring 2005 This study found that females tended to have higher self-reported GPAs than males
Table 13 Gender Differences for Class of 2002 Matched Sample (2001 PSSA and 2002 SAT) Performance Standard Number of Effect SizeSubject Gender MeanMeasure Deviation Cases d
Mathematics Male 141925 20536 29403
PSSA Reading Female
Male Female
137503 137162 139420
19408 18761 16921
36530 29345 36451
0221
-0126 Mathematics Male 52273 11076 29787
SAT Verbal Female
Male 48821 50081
10527 10333
37042 29787
0319
Female 49582 10126 37042 0049
GPA Male Female
3243 3404
656
609 25323 32857 -0255
HumRRO 28 April 2004
Table 14 Gender Differences for Class of 2003 Matched Sample (2001 PSSA and 2002 SAT) Performance Mean Standard Number Effect Size Subject GenderMeasure Score Deviation of Cases d
Mathematics Male 145023 21049 31338
PSSA Reading Female
Male Female
138650 140570 140715
19790 17318 16427
38459 31328 38418
0312
-0009 Mathematics Male 52596 11067 31557
SAT Verbal Female
Male 48997 50524
10490 10235
38745 31557
0327
Female 49623 10097 38745 0089 Male 3265 653 25387GPA Female 3415 600 32925 -0239
Table 15 and Table 16 show regression results for adding gender as a predictor variable to the model for estimating PSSA scores based on SAT scores For both PSSA reading and math the regression weights for gender are negligible and the changes in R-square are essentially nonexistent Gender is coded such that the positive weight means that females tend to have higher reading and math scores than would be expected from gender differences in SAT verbal
Table 15 Regressions Results Showing the Adjusted Strength of Gender on Predicting 2001 PSSA 11th Grade Scale Scores Based on 2002 SAT Scores Standardized Coefficient
PSSA Component SAT Control Gender R2 Change in R2
due to Gender Reading 0704 0495 Reading 0706 +0081 0502 +0006 Math 0847 0717 Math 0851 +0025 0717 +0001
Table 16 Regressions Results Showing the Adjusted Strength of Gender on Predicting 2002 PSSA 11th Grade Scale Scores Based on 2003 SAT Scores Standardized Coefficient
PSSA Component SAT Control Gender R2 Change in R2
due to Gender Reading 0775 0601 Reading 0777 +0038 0602 +0001 Math 0865 0749 Math 0863 -0012 0749 0000
HumRRO 29 April 2004
Ethnic or Racial Differences
Table 17 presents performance means for the four major ethnic or racial groups3 (White Black HispanicLatino and Asian) for the PSSA only For these analyses the racialethnic categories reported with the PSSA data were used It should be noted that starting in 2003 the reported racialethnic categories were changed from those reported in 2001 and 2002 In 2003 the category of ldquoMixedrdquo was no longer included As a result those students previously selecting ldquoMixedrdquo were forced to select one of the other categories For the full population of PSSA takers the pattern of performance between these four groups is fairly consistent In mathematics Asians outscore all groups Whites outscore HispanicsLatinos and Blacks and HispanicsLatinos score between Blacks and Whites For Reading Asians and Whites score approximately the same and Blacks score almost one standard deviation lower than Whites However the score for HispanicsLatinos has shown a decrease over the three years of approximately 30 points This decrease has dropped the HispanicLatino group to below the mean Black group score The number of HispanicLatinos taking the PSSA has increased approximately 40 Blacks approximately 65 and Whites approximately 10 during that time as well
Table 17 EthnicRacial Differences for PSSA (Unmatched State Data) Hispanic Year Subject Measure White Black AsianLatino
2001
Mathematics
Reading
Mean SD
N Effect Size
Mean SD
N Effect Size
132481 21525 92185
131644 21066 91964
113596 17093 8274 0972
115158 20393 8117 0795
116757 18873 2954 0777
117025 21104 2924 0693
140820 24657 2489 -0360
132927 21707 2470 -0060
2002
Mathematics
Reading
Mean SD
N Effect Size
Mean SD
N Effect Size
133935 22098 97659
133917 20351 97428
114090 17626 10783 0993
114887 20070 10715 0942
116438 19041 3534 0848
116193 21155 3535 0854
143430 26757 2659 -0387
133711 22914 2655 0010
2003
Mathematics
Reading
Mean SD
N Effect Size
Mean SD
N
134059 20863
104064
134488 22411
104271
114619 16132 13669 1042
114796 21940 13871 0888
116389 17473 4106 0903
114052 22848 4158 0903
142013 23662 2865 -0357
134943 24743 2866 -0019
3 The racialethnic analyses were limited to these four groups because of the limited number of students in the other groups
HumRRO 30 April 2004
Table 18 and Table 19 present data for the matched sample of students taking both PSSA and SAT by ethnicity Scale scores for both assessments as well as studentsrsquo self-reported GPA are included in the tables In 2002 Asians (726) took the SAT tests at a much higher rate than any other group followed by Whites (608) Blacks (419) and HispanicsLatinos (364) The order remained the same in 2003 although all groups but Asians had a slightly lower percentage in 2002 than in 2003 This suggests that more Asians and Whites aspire to attend college than do Blacks or HispanicLatinos Scores on the PSSA SAT and GPA show the same order for the matched sample as for the total state sample for the PSSA Comparing the effect size for the PSSA versus the effect size for the SAT shows that the effect size for most groups in the Class of 2002 and components is approximately the same for the PSSA and the SAT The largest difference for Blacks is between the PSSA reading and the SAT verbal components (PSSA reading ndash 0883 and SAT verbal ndash 1011) Note also that the effect size for GPA is approximately half the effect size for the PSSA and SAT for Blacks and Hispanics However for Asians the GPA effect size is more similar to the effect size for math than it is for the SAT verbal or PSSA reading components
Table 18 EthnicRacial Differences for the Class of 2002 Matched Sample (2001 PSSA 11th
Grade and 2002 SAT) Performance Hispanic Subject Measure White Black AsianMeasure Latino
PSSA
Mathematics
Reading
Mean SD
N Effect Size
Mean SD
N Effect Size
140809 19272 56063
139658 17004 56017
120809 17759 3735 1079
123658 19180 3678 0883
128529 19483 1076 0634
129112 19199 1064 0582
146256 22812 1808 -0258
138040 19183 1807 0089
SAT
Mathematics
Verbal
Mean SD
N Effect Size
Mean SD
N Effect Size
51041 10409 56693
50476 9670
56693
40286 10268 3872 1040
40619 9836 3872 1011
44332 11082 1096 0624
44378 10964 1096 0590
54820 13077 1838 -0320 49547 13308 1838 0080
GPA
Mean SD
N Effect Size
3364 0621
49617
2940 0667 3337 0658
3126 0640 871
0377
3491 0615 1616 -0205
HumRRO 31 April 2004
Table 19 EthnicRacial Differences for the Class of 2003 for Matched Sample (2002 PSSA 11th
Grade and 2003 SAT) Performance HispanicSubject Measure White Black AsianMeasure Latino
Mean 142999 122766 129030 150221
Mathematics SD N
19659 59076
18097 4516
19834 1178
24869 1951
PSSA Effect Size Mean 142157
1071 125012
0707 129610
-0322 139776
Reading SD N
15746 59038
17622 4500
18763 1184
20264 1951
Effect Size 1026 0724 0131 Mean 51440 39999 43626 55739
Mathematics SD N
10295 59443
9997 4573
10967 1206
12831 1970
SAT Effect Size Mean 50834
1128 40568
0735 43851
-0370 50166
Verbal SD N
9539 59443
9913 4573
10745 1206
13163 1970
Effect Size 1055 0687 0058 Mean 3385 2933 3175 3538
GPA Mathematics SD N
0610 49511
0666 3799
0641 935
0595 1608
Effect Size 0708 0336 -0254
Table 20 through Table 23 show regression results for adding raceethnicity (White versus Black and White versus HispanicLatino) as a predictor variable to the model for estimating PSSA scores based on SAT scores For both PSSA reading and math the regression weights for raceethnicity are negligible and the changes in R-square are essentially nonexistent Raceethnicity is coded such that the negative weight means that Blacks or HispanicsLatinos tend to have lower reading and math scores than would be expected from ethnicity differences in SAT verbal
Table 20 Regressions Results Showing the Adjusted Strength of Being Black on Predicting 2001 PSSA 11th Grade Scale Scores Based on 2002 SAT Scores Standardized Coefficient
PSSA Component SAT
Control Black R2 Change in R2
due to being Black
Reading 0699 0489 Reading 0686 -0059 0493 +0003 Math 0843 0711 Math 0833 -043 0713 +0002
HumRRO 32 April 2004
Table 21 Regressions Results Showing the Adjusted Strength of Being Black on Predicting 2002 PSSA 11th Grade Scale Scores Based on 2003 SAT Scores Standardized Coefficient
PSSA Component SAT
Control Black R2 Change in R2
due to being Black
Reading 0769 0591 Reading 0750 -0068 0595 0004 Math 0863 0745 Math 0857 -0021 0746 0000
Table 22 Regressions Results Showing the Adjusted Strength of Being HispanicLatino on Predicting 2001 PSSA 11th Grade Scale Scores Based on 2002 SAT Scores Standardized Coefficient
PSSA Component SAT
Control HispanicLatino R2 Change in R2
due to being HispanicLatino
Reading 0687 0472 Reading 0685 -0026 0473 +0001 Math 0837 0700 Math 0836 -0014 0700 0000
Table 23 Regressions Results Showing the Adjusted Strength of Being HispanicLatino on Predicting 2002 PSSA 11th Grade Scale Scores Based on 2003 SAT Scores Standardized Coefficient
PSSA Component SAT
Control HispanicLatino R2 Change in R2
due to being HispanicLatino
Reading 0754 0568 Reading 0050 -0034 0569 +0001 Math 0857 0735 Math 0856 -0009 0735 0000
Economically Disadvantaged Differences
Table 24 presents performance means for those students identified as economically disadvantaged for the PSSA only This table provides information from the larger state population to use in comparison with the matched PSSA and SAT sample data The SAT-taking population can be expected to post higher means For the full population of PSSA takers the pattern of performance between males and females is consistent Noneconomically disadvantaged students outscore economically disadvantaged student to a large degree on all components and all years except 2001 when it was a medium degree The number of students identified more than doubled between 2001 and 2002 and increased an additional 40 in 2003
HumRRO 33 April 2004
Table 24 Differences for Economically Disadvantaged Students for PSSA (Unmatched State Data)
Year Subject Economically Disadvantaged
Mean Scale Score
Standard Deviation
Number of Cases
Effect Size d
2001 Mathematics
Reading
Yes No Yes No
118647 131377 118918 130564
18977 22014 21142 21570
8805 107332 8702
106864
0619
0545
2002 Mathematics
Reading
Yes No Yes No
116604 133857 116380 133704
18913 22497 20914 20617
17253 106297 17199 106035
0830
0834 Yes 118211 17997 24022Mathematics No 134575 21063 102919 08352003 Yes 116747 22817 24290Reading No 135050 22319 103137 0811
Table 25 Differences for Economically Disadvantaged Students for Matched Sample for the Class of 2002 (2001 PSSA 11th Grade and 2002 SAT)
Performance Economically Mean Standard Number Effect Measure Subject Disadvantaged Score Deviation of Cases Size
d
PSSA Mathematics
Reading
Yes No Yes No
130598 139668 131768 138535
18830 20044 18336 17829
2893 65296 2863 65176
0466
0374
SAT Mathematics
Verbal
Yes No Yes No
45185 50491 44694 49953
10399 10912 10131 10215
2926 66399 2926 66399
0498
0517
GPA Yes No
3195 3334
0661 0636
2561 57722 0214
HumRRO 34 April 2004
Table 26 Differences for Economically Disadvantaged Students for Matched Sample for the Class of 2003 (2002 PSSA 11th Grade and 2003 SAT) Performance
Measure Subject Economically Disadvantaged
Mean Score
Standard Deviation
Number of Cases
Effect Size d
PSSA Mathematics
Reading
Yes No Yes No
127741 142707 128169 141742
19474 20278 18498 16243
5822 65159 5812 65114
0753
0780
SAT Mathematics
Verbal
Yes No Yes No
42412 51341 42100 50748
10746 10616 10491 9845
5907 65604 5907 65604
0836
0850 Yes 3116 0680 4854GPA No 3369 0620 54404 0389
Table 27 Regressions Results Showing the Adjusted Strength of Being Economically Disadvantaged on Predicting 2001 PSSA 11th Grade Scale Scores Based on 2002 SAT Scores Standardized Coefficient
Change in R2
SAT Economically due to beingPSSA Component R2 Control Disadvantaged Economically
Disadvantaged Reading 0704 0495 Reading 0703 -0004 0495 0000 Math 0846 0715 Math 0845 -0009 0715 0000
Table 28 Regressions Results Showing the Adjusted Strength of Being Economically Disadvantaged on Predicting 2002 PSSA 11th Grade Scale Scores Based on 2003 SAT Scores Standardized Coefficient
SAT Change in R2
PSSA Component Control Economically Disadvantaged R2 due to being
Economically Disadvantaged
Reading 0775 0601 Reading 0765 -044 0602 0002 Math 0865 0749 Math 0864 -0005 0749 0000
Annual Family Income Differences
Camara and Schmidt (1999) point out that family income is related to performance on tests such as the SAT I They also point out that this finding is not unique to the SAT I or college admissions tests Terenzini Cabrera and Bernal (2001) also examined various differences in educational outcomes associated with varying levels of socioeconomic status (SES) This report
HumRRO 35 April 2004
examines differences associated with family income in this section The following section shows differences in student performance related to parental education level Terenzini Cabrera and Bernal (2001) and Camara and Schmidt (1999) point out differences between income wealth and SES
Because annual family income data comes from the SDQ of the SAT only matched student data can be presented showing relationships with family income Table 29 (Class of 2002) and Table 30 (Class of 2003) show student performance on the PSSA SAT and GPA versus four levels of family income As the table clearly shows student scores increase on all performance measures as income goes up However the effect size for GPA is about half of the effect size for either of the assessments The effect size for the PSSA is similar although slightly less than the effect size for the SAT for both components and both years
Table 29 Annual Family Income Differences for Matched Sample for the Class of 2002 (2001 PSSA 11th Grade and 2002 SAT)
Income Level Performance Subject MeasureMeasure $25000 to $40000 tolt $25000 gt $70000$40000 $70000
PSSA
Math
Reading
Mean SD
N Effect Size
Mean SD
N Effect Size
129900 19108 6658
131011 18466 6594
135381 18361 8709 -0293
136210 17165 8693 -0292
139702 18899 16365 -0516
138848 17110 16348 -0440
145045 20032 14902 -0774
142093 16921 14867 -0626
SAT
Math
Verbal
Mean SD
N Effect Size
Mean SD
N Effect Size
44665 10594 6822
44469 10177 6822
47766 10013 8856 -0301 47619 9546 8856 -0319
50272 10136 16549 -0541 49796 9485
16549 -0542
53816 10580 15122 -0864 52825 9815
15122 -0836
GPA
Mean SD
N Effect Size
3173 0656 6596
3262 0636 8607 -0138
3344 0631 16141 -0266
3412 0628
14726 -0372
HumRRO 36 April 2004
Table 30 Annual Family Income Differences for Matched Sample for the Class of 2003 (2002 PSSA 11th Grade and 2003 SAT)
Income Level Performance Subject MeasureMeasure $25000 - $40000 -lt $25000 gt $70000$40000 $70000
Mean 131577 136393 140924 147093
Math SD N
19401 6230
19051 7958
19319 14963
20560 14295
PSSA Effect Size Mean 132698
-0250 137311
-0483 140572
-0776 144569
Reading SD N
17576 6232
16201 7948
15919 14958
15965 14284
Effect Size -0273 -0470 -0707 Mean 44871 47689 50075 53965
Math SD N
10562 6304
10140 8010
10089 15045
10567 14388
SAT Effect Size Mean 44793
-0272 47581
-0504 49653
-0861 52905
Verbal SD N
10345 6304
9578 8010
9354 15045
9689 14388
Effect Size -0280 -0493 -0809 Mean 3188 3279 3357 3428
GPA SD N
0652 6115
0642 7832
0623 14659
0617 14000
Effect Size -0141 -0265 -0378
Parent Educational Differences
Camara and Schmidt (1999) also looked at the impact of parent education on student performance in standardized testing Their study showed that parental education is related to performance on the SAT I Higher parental education is associated with higher scores on the SAT I Table 31 and Table 32 show the means standard deviations number of students and effect size for various levels of student-reported motherrsquos education for the PSSA SAT and GPA The analyses indicate that the effect size for both assessments and GPA are larger as the motherrsquos educational level increases The effect size for PSSA is not as large as the effect size for SAT The effect size for GPA is about half of the effect size for PSSA or SAT Table 33 and Table 34 provide the same information regarding the fatherrsquos education level The results follow the same pattern as that for motherrsquos education level
HumRRO 37 April 2004
Table 31 Mothers Education Level Differences for Matched Sample for the Class of 2002 (2001 PSSA 11th Grade and 2002 SAT)
Subject Measure lt High School
High School
Some College
BABS Degree
Graduate Degree
Mean 128855 135908 138212 145789 148095
Math SD N
18785 2196
18542 18737
19161 16804
19982 12094
20688 6259
PSSA Effect Size Mean 129039
-378 135883
-0493 137803
-0873 143360
-0974 144735
Reading SD N
17886 2189
17134 18696
17441 16762
16733 12078
16981 6245
Effect Size -0377 -0495 -0883 -0985 Mean 43795 48049 49574 54133 55639
Math SD N
10476 2247
10021 18986
10429 17075
10547 12291
10924 6357
SAT Effect Size Mean 42614
-0415 47405
-0553 49277
-0983 53512
-1107 55072
Verbal SD N
99852247
929118986
963517075
9856 12291
10300 6357
Effect Size -0497 -0679 -1099 -1228 Mean 3142 3267 3289 3456 3504 SD 0653 0630 0640 0618 0601 GPA N 2145 18341 16424 11914 6150
Effect Size -0195 -0227 -0494 -0577
Table 32 Mothers Education Level Differences for Matched Sample for the Class of 2003 (2002 PSSA 11th Grade and 2003 SAT)
lt High High Some BABS GraduateSubject Measure School School College Degree Degree Mean 129723 137323 140038 148027 150140 SD 19513 18746 19865 20474 22494 Math N 2072 17801 16646 11406 5961
Effect Size -0397 -0524 -0915 -0970PSSA Mean 129022 137751 139799 145748 147071 SD 18092 16042 16241 15951 16272 Reading N 2066 17787 16638 11406 5954
Effect Size -0511 -0627 -0981 -1059 Mean 43631 48106 49738 54411 55641
Math SD N
10494 2095
10046 17922
10387 16756
10467 11496
11305 5992
SAT Effect Size Mean 42549
-0436 47592
-0585 49432
-1029 53618
-1101 55050
Verbal SD N
10124 2095
925417922
954716756
9795 11496
10522 5992
Effect Size -0520 -0700 -1111 -1211 Mean 3148 3285 3307 3475 3510
GPA SD N
0646 2003
0622 17344
0636 16134
0608 11088
0599 5797
Effect Size -0216 -0248 -0521 -0581
HumRRO 38 April 2004
Table 33 Fathers Education Level Differences for Matched Sample for the Class of 2002 (2001 PSSA 11th Grade and 2002 SAT)
Subject Measure lt High School
High School
Some College
BABS Degree
Graduate Degree
Mean 128908 135041 138368 144843 150072
Math SD N
18443 2850
18251 17616
18721 14573
19645 12461
20736 7835
PSSA Effect Size Mean 129571
-0334 135453
-0509 137985
-0836 142352
-1079 145994
Reading SD N
18191 2289
17066 17558
17291 14539
16798 12454
16661 7838
Effect Size -0333 -0474 -0730 -0942 Mean 43958 47510 49626 53651 56759
Math SD N
10229 2915
992617845
10116 14800
10368 12636
10727 7980
SAT Effect Size Mean 43245
-0352 47058
-0557 49210
-0941 52830
-122 56114
Verbal SD N
97782915
921217845
947514800
9571 12636
10128 7980
Effect Size -0401 -0620 -0991 -1293 Mean 3136 3247 3301 3432 3548 SD 0637 0634 0633 0618 0594 GPA N 2784 17269 14263 12198 7723
Effect Size -0175 -0260 -0472 -0669
Table 34 Fathers Education Level Differences for Matched Sample for the Class of 2003 (2002 PSSA 11th Grade and 2003 SAT)
lt High High Some BABS GraduateSubject Measure School School College Degree Degree Mean 131197 136533 140022 147183 152503 SD 19107 18733 19163 20247 22047 Math N 2766 16981 14422 11633 7272
Effect Size -0282 -0461 -0812 -1033PSSA Mean 130955 137222 140037 144765 148752 SD 17715 15901 15980 15990 16014 Reading N 2761 16968 14412 11629 7265
Effect Size -0372 -0538 -0818 -1054 Mean 44505 47569 49772 53911 57115
Math SD N
10230 2803
9938 17087
10023 14508
10352 11709
11009 7314
SAT Effect Size Mean 43701
-0304 47224
-0520 49499
-0914 52920
-1187 56296
Verbal SD N
9887 2803
919517087
931014508
9580 11709
10294 7314
Effect Size -0369 -0604 -0947 -1248 Mean 3139 3272 3316 3454 3558
GPA SD N
0639 2696
0624 16545
0632 14014
0606 11281
0582 7046
Effect Size -0211 -0279 -0506 -0686
HumRRO 39 April 2004
Limited English Proficiency Differences
Students identified as having limited English proficiency (LEP) would be expected to have more difficulty taking a test in English than those not identified As a result of these difficulties LEP students would be expected to have lower scores than non-LEP students Table 36 shows the mean standard deviation number of students and the effect size for the entire state on the PSSA in 2001 and 2002 As expected LEP students have lower scores than non-LEP students on both components and effect sizes are generally large However the math component effect size is only about half of the effect size for reading
Table 35 Limited English Proficiency Differences for 11th Grade PSSA (Unmatched State Data) Limited EffectMean Scale Standard NumberYear Subject English Size Score Deviation of CasesProficiency d
Yes 115312 18977 492Math No 130476 22047 115645 07372001 Yes 106216 15338 473Reading No 129784 21727 115093 1253 Yes 116560 20254 844Math No 131550 22812 122706 06952002 Yes 102618 16138 840Reading No 131483 21413 122394 1522
Table 36 and Table 37 show the mean standard deviation number of cases and effect size for the matched sample of students in the Classes of 2002 and 2003 The effect sizes are similar to those in the state sample for the PSSA and SATmdashvery larger in verbalreading and medium in math The effect size is slightly larger for PSSA than SAT in math but slightly smaller for PSSA than SAT in readingverbal However the GPA for LEP students is actually slightly higher than the GPA for non-LEP students
Table 36 Limited English Proficiency Differences for Matched Sample for the Class of 2002 (2001 PSSA 11th Grade and 2002 SAT)
LimitedPerformance Standard Number Effect Size Subject English Mean ScoreMeasure Deviation of Cases dProficiency Yes 125974 19661 134Math No 139310 20070 68055 0671PSSA Yes 113745 14649 132Reading No 138297 17876 67907 1502 Yes 42860 13045 136Math No 50282 10934 69189 0617SAT Yes 33353 9807 136Verbal No 49764 10241 69189 1637 Yes 3393 0617 111GPA No 3328 0637 60172 -0104
HumRRO 40 April 2004
Table 37 Limited English Proficiency Differences for Matched Sample for the Class of 2003 (2002 PSSA 11th Grade and 2003 SAT)
LimitedPerformance Mean Standard Number Effect Size Subject EnglishMeasure Score Deviation of Cases dProficiency Yes 126815 20257 289Mathematics No 141539 20607 70692 0721PSSA Yes 109386 15855 288Reading No 140757 16741 70638 1924 Yes 41564 12159 291Mathematics No 50641 10887 71220 0787SAT Yes 32526 8775 291Verbal No 50105 10126 71220 1855 Yes 3358 585 226GPA No 3348 629 59032 -0008
The regression analyses results (Table 38 and Table 39) show that there are negligible changes in R square for predicting PSSA from SAT scores when adding LEP to the equation for both reading and math for both classes
Table 38 Regressions Results Showing the Adjusted Strength of Being Limited English Proficient on Predicting 2001 PSSA 11th Grade Scale Scores Based on 2002 SAT Scores
Standardized Coefficient Change in R2
SAT Limited English due toPSSA Component R2 Control Proficiency Limited English
Proficiency Reading 0704 0495 Reading 0703 -0011 0495 0000
Math 0846 0715 Math 0845 -0004 0715 0000
Table 39 Regressions Results Showing the Adjusted Strength of Being Limited English Proficient on Predicting 2002 PSSA 11th Grade Scale Scores Based on 2003 SAT Scores
Standardized Coefficient Change in R2
PSSA Component SAT Control
Limited English Proficiency R2 due to
Limited English Proficiency
Reading 0775 0601 Reading 0771 -0033 0602 +0001
Math 0865 0749 Math 0865 0000 0749 0000
HumRRO 41 April 2004
School-Level Scores Means were calculated by school for all scale scores and grade indicators to analyze
school-level results School-level descriptive statistics are presented for the Classes of 2002 and 2003 for the PSSA (Table 40) SAT (Table 41) and GPA and course grades (Table 42) Only schools with at least 10 students with merged PSSA and SAT scores are included in the analyses School-level means showed an increase on both tests both test components GPA and course grades from the Class of 2002 to the Class of 2003 The change in scoring procedures from the 2001 PSSA to the 2002 PSSA (instituting a minimum score of 700 for the 2002 PSSA) is problematic However there were only 9 students in this college-bound sample in the Class of 2003 who scored a 700 on the 2002 PSSA reading component and no students who scored a 700 on the math component The change in course grades was extremely small
Table 40 PSSA School-Level Descriptive Statistics for the Classes of 2002 and 2003 Subject Measure Class of 2002 Class of 2003 Reading Mean 136973 139316
SD 7435 7088 N 586 586
Math Mean 136966 139333 SD 8335 8496
N 586 586 Limited to schools with at least 10 students with merged PSSA and SAT scores
Table 41 SAT School-Level Descriptive Statistics for the Classes of 2002 and 2003 Subject Measure Class of 2002 Class of 2003 Verbal Mean 48578 48907
SD 4207 4251 N 586 586
Math Mean 48847 49159 SD 4500 4601
N 586 586 Limited to schools with at least 10 students with merged PSSA and SAT scores
HumRRO 42 April 2004
Table 42 School-Level Descriptive Statistics GPA and Course Grades for the Classes of 2002 and 2003
Subject Measure Class of 2002 Class of 2003 GPA Mean 334 346
SD 019 019 N 586 586
English Mean SD
329 020
331 021
N 586 586 Math Mean 311 312
SD 021 022 N 586 586
Limited to schools with at least 10 students with merged PSSA and SAT scores
Average Within-Year School-Level Correlations
Table 43 and Table 44 present correlations among these school-level scores Table 45 presents correlations for the average across the two years4 As Hoffman (1998) pointed out there is a tendency for correlations among school scores to be higher than correlations among student-level scores (Class of 2002 - Table 8 Class of 2003 - Table 9 and average for the Classes of 2002 and 2003 - Table 10) This is the case except for those correlations involving GPA and course-grades (except for PSSA reading to math course grade and GPA to English course grade where school-level correlations are higher)
As Hoffman (1998) pointed out the lower school-level correlations for GPA suggests that grading scales are not equivalent across schools There is a tendency for different schools to grade differently As a result at the school level of analysis there is a weaker relationship between GPA and either PSSA or ACT scores When studentsrsquo scores are averaged at the school level observed differences are related not only to differing levels of student achievement but to the particular schoolrsquos grading practices However the school-level relationship between GPA and course grades remains strong for both PSSA and SAT
4 Average correlations were technically corrected with Fisherrsquos r to z transformations
HumRRO 43 April 2004
Table 43 School-Level PSSA SAT and Course Grade Correlations for the Class of 2002 PSSA SAT Course Grades
Variable Reading Math Verbal Math GPA (Total) English Math
ReadingPSSA
Math
1000
0861 1000
Verbal SAT
Math
0818 0883
0773 0935
1000
0941 1000
GPA
English Course
Grades Math
0413 0393
0411 0391
0423 0454
0371 0376
0359 0362
0416 0450
1000
0778 1000
0719 0542 1000 Limited to schools with at least 10 students with merged PSSA and SAT scores
Table 44 School-Level PSSA SAT and Course Grades Correlations for the Class of 2003 PSSA SAT Course Grades
Variable Reading Math Verbal Math GPA (Total) English Math
ReadingPSSA
Math
1000
0870 1000
Verbal SAT
Math
0905 0849
0868 0915
1000
0943 1000
GPA
English Course
Grades Math
0491 0443
0442 0394
0501 0489
0439 0425
0402 0394
0484 0486
1000
0780 1000
0784 0615 1000 Limited to schools with at least 10 students with merged PSSA and SAT scores
HumRRO 44 April 2004
Table 45 School-Level PSSA SAT and Course Grades Correlation Averages for the Class of 2002 and 2003
PSSA SAT Course Grades
Variable Reading Math Verbal Math GPA (Total) English Math
ReadingPSSA
Math
1000
0866 1000
Verbal SAT
Math
0868 0867
0826 0926
1000
0942 1000
GPA
English Course
Grades Math
0453 0418
0427 0393
0463 0472
0406 0401
0381 0378
0451 0468
1000
0779 1000
0753 0580 1000 Limited to schools with at least 10 students with merged PSSA and SAT scores
Table 46 shows that the mean school-level scores for both PSSA 11th grade reading and SAT verbal components of each assessment increased from the Class of 2002 to the Class of 2003 For the SAT the mean school-level change on the verbal component was +330 scale score points For the PSSA the mean school-level scale score change on the 11th grade reading component was +2343 scale score points Table 47 shows the fairly strong relationship between the differences in mean school-level scores on the SAT verbal component and the PSSA reading component for the Classes of 2002 and 2003 This relationship is graphically portrayed in Figure 17 Table 48 Table 49 and Figure 18 show the same information for the math components of the PSSA and SAT As would be expected the relationship between the math components is stronger than for the readingverbal components
Table 46 Difference in Mean School-Level SAT Verbal and PSSA Reading Scores From the Classes of 2002 and 2003
Difference in Mean School-Level Score From the Standard Number ofMeanClass of 2002 and Class of 2003 Deviation Schools SAT Verbal +330 1673 586
PSSA Reading +2343 4660 586 Limited to schools with at least 10 students with merged PSSA and SAT scores
Table 47 Correlation of Difference in School-Level Mean SAT Verbal Score and PSSA Reading Score Between the Classes of 2002 and 2003
Difference in Mean School-Level Score From the SAT PSSA Class of 2002 and Class of 2003 Verbal Reading
SAT Verbal 1
PSSA Reading 462 1
HumRRO 45 April 2004
-200 -100 0 100 200
Difference in School-Level PSSA Reading Mean Score between the Class of 2002 and Class of 2003
-100
-50
0
50
100
Diff
eren
ce in
Sch
ool-L
evel
SA
T V
erba
l Mea
n Sc
ore
betw
een
Cla
ss o
f 200
2 an
d C
lass
of 2
003
$
$$
$
$
$
$$
$
$$
$
$
$
$
$
$
$
$$
$
$
$
$
$
$
$
$
$
$
$
$
$
$$
$
$
$
$
$
$
$
$
$
$ $
$$
$
$
$
$
$
$
$
$$
$
$$
$ $
$$$ $$
$
$
$
$
$
$
$
$
$
$
$
$
$
$$
$
$
$
$$
$$
$$$
$
$$
$
$
$$
$$
$
$
$
$
$
$
$
$
$
$$$
$$$
$
$
$
$
$
$$
$$
$
$$
$
$
$
$
$
$
$
$
$
$
$
$
$
$
$
$
$
$ $
$$
$
$$$ $$
$
$$$
$$
$
$
$
$
$
$
$
$$
$$
$
$
$
$
$
$
$
$
$
$$
$$
$
$$
$
$
$$
$
$
$
$$
$
$$
$
$$
$
$
$
$
$
$
$
$
$
$
$$
$
$$
$$
$
$$$$
$$
$$
$
$$
$
$
$
$
$$
$
$
$
$$
$
$ $$$
$
$ $$
$
$
$
$$
$
$$
$
$
$
$ $$$
$$
$$
$
$ $
$
$
$$
$
$
$
$
$
$
$$
$
$
$ $
$
$
$
$
$$
$
$
$$
$
$
$
$ $$
$
$
$ $
$$
$
$
$
$
$
$
$
$
$
$
$$
$
$
$$ $
$
$
$
$$
$
$
$$ $
$
$
$
$
$
$
$
$
$
$
$
$
$ $
$
$$
$
$$
$
$
$
$
$
$$
$
$
$
$
$
$
$
$
$$
$
$$
$
$
$$$ $
$
$
$$
$$
$
$$
$
$
$ $$ $
$ $
$$
$
$
$$$$
$
$$$
$
$$
$
$
$
$ $
$
$
$
$
$ $$
$
$
$
$
$
$ $
$ $ $
$
$
$
$
$$
$
$
$
$
$
$
$
$ $
$
$$
$
$$ $
$
$
$
$
$
$
$
$ $
$$
$
$
$
$
$
$
$
$$
$
$$
$
$
$
$
$$
$
$
$
$$
$$
$
$
$ $$$
$
$
$
$
$
$
$$$$
$
$$
$
$
$$
$
$$
$
$
$
$$$
$
$$
$
$
$
$
$$
$$
$
$
$
$$
$
$$
$$
$$
$
$
$
$
$$
$
$
$
$$
$
$
$
$
$
$$
$
$
$
$
$$
$
$
$
$
$
$
$$
$$
Figure 17 Scatterplot of difference in school-level SAT verbal mean scores and school-level PSSA 11th grade reading mean scores between the Class of 2002 and Class of 2003
Table 48 Difference in Mean School-Level SAT Math and PSSA Math Scores From the Class of 2002 and Class of 2003
Difference in Mean School-Level Math Score From the Class of 2002 and Class of 2003 Mean Standard
Deviation Number of
Schools
SAT +313 1842 586
PSSA +2367 4687 586 Limited to schools with at least 10 students with merged PSSA and SAT scores
HumRRO 46 April 2004
Table 49 Correlation of Difference in School-Level Mean SAT Math Score and PSSA Math Score Between the Classes of 2002 and 2003
Difference in Mean School-Level Math Score From the Class of 2002 and Class of 2003 SAT PSSA
SAT 1
PSSA 644 1
-200 -100 0 100 200
Difference in School-Level PSSA Math Mean Scale Score between the Class of 2002 and Class of 2003
-100
-50
0
50
100
Diff
eren
ce i
n Sc
hool
-Lev
el S
AT
Mat
h M
ean
Scor
e
betw
e en
the
Clas
s of
200
2 an
d Cl
ass
of 2
003
$
$$ $
$
$$
$
$$
$
$
$$
$
$
$$ $$
$
$
$
$
$
$
$
$
$$$
$
$
$$$
$
$
$
$
$
$
$$
$
$
$
$
$
$
$
$
$$$ $
$
$$
$
$
$
$
$$ $$
$$
$
$
$
$
$
$
$
$$
$
$$
$
$$
$
$
$
$
$ $$$
$
$
$
$
$
$
$
$$
$
$
$
$$
$
$
$
$
$
$ $
$$
$
$
$
$$
$
$$
$
$
$
$
$
$
$
$
$
$$
$
$$
$$
$
$
$
$
$
$$
$
$
$$
$
$
$
$$
$
$
$
$
$
$
$
$
$
$
$
$
$
$
$
$
$$
$
$
$$ $
$
$
$
$
$$
$
$
$
$
$
$
$
$
$
$
$
$
$
$
$
$
$
$
$$
$
$
$
$
$
$
$
$
$
$
$$
$
$
$
$
$$$
$
$
$
$
$
$
$ $$
$
$
$
$
$$
$
$
$
$
$
$$$
$
$
$$$
$
$
$
$
$$
$
$
$$
$
$
$$$
$
$
$
$
$
$
$$$
$
$
$
$
$$
$
$
$
$
$
$
$
$ $
$
$
$
$
$
$
$
$
$
$
$
$
$
$
$
$
$
$
$
$
$
$$$$
$$
$$
$
$$$
$$
$
$$
$
$
$
$
$
$
$
$$
$
$$
$
$
$
$
$
$$
$
$
$
$
$
$$
$
$$
$
$
$$
$
$
$
$
$
$
$
$
$
$
$ $
$
$
$
$
$$
$
$$$ $
$
$
$
$
$
$ $
$$
$
$$
$
$
$$
$ $
$$
$
$
$
$
$
$
$
$
$
$
$
$$
$
$
$
$
$
$
$
$ $
$$
$
$
$
$
$$ $
$
$$
$
$$
$$
$
$
$
$
$
$
$
$
$
$
$$
$
$$
$
$
$$
$
$
$
$
$$
$$
$$$
$$
$
$
$
$$
$
$$
$
$$
$
$
$
$
$
$
$
$
$
$
$
$
$ $$
$
$
$
$
$$
$
$
$
$$
$
$
$
$
$$
$
$$$$
$
$
$
$$$ $
$
$$
$
$
$
$
$
$$
$
$
$$
$$
$ $ $
$
$
$
$
$$
$
$$
$$
$
$
$
$$
$
$
$
$$
$
$
$
$
$
$
$
$$
$
$
$$
$
$
$
Figure 18 Scatterplot of differences in school-level mean SAT math score and school-level mean PSSA math scores between the Classes of 2002 and 2003
Pooled Within-School Correlations
The above discussion alluded to school-level factors such as differences in grading practices which may be impacting observed correlations Figure 19 depicts an extreme version of such a situation Schools A B and C are clearly different in where their students lie with respect to PSSA or SAT scores but they are identical in terms of the grades their students
HumRRO 47 April 2004
receive Also within each school there is a relationship between grades and either PSSA scores or SAT scores However if a correlation were calculated using students from all schools without regard to school-level characteristics it would be zero
School A
School B PSSA or SAT Scores
School C
Grade Point Average (GPA)
Figure 19 Extreme hypothetical illustration of how mean differences among schools on PSSA or SAT scores that are not mirrored by differences in GPA can impact correlations (Ellipses represent students scores within each school)
Pooled within-school correlations are used to estimate relationships between measures calculated within schools and then averaged across all schools These pooled within-school correlations were calculated for each of the two years of data (Table 50 for the Class of 2002 and Table 51 for the Class of 2003) and then averaged across the two years (Table 52)5 The resulting average pooled within-school correlations are presented in Table 52
5 Again the technical r to z correction was used
HumRRO 48 April 2004
Table 50 Pooled Within-School Correlation for the Class of 2002 PSSA SAT Course Grades
Variable Reading Math Verbal Math GPA (Total) English Math
ReadingPSSA
Math
1000
0648 1000
Verbal SAT
Math
0693 0650
0569 0832
1000
0695 1000
GPA
English Course
Grades Math
0528 0573
0461 0412
0361 0542
0516 0559
0465 0402
0349 0541
1000
0703 1000
0668 0443 1000 Limited to schools with at least 10 students with merged PSSA and SAT scores
Table 51 Pooled Within-School Correlation for the Class of 2003 PSSA SAT Course Grades
Variable Reading Math Verbal Math GPA (Total) English Math
ReadingPSSA
Math
1000
0702 1000
Verbal SAT
Math
0757 0629
0666 0857
1000
0662 1000
GPA
English Course
Grades Math
0512 0564
0457 0405
0350 0541
0534 0679
0466 0414
0369 0548
1000
0698 1000
0667 0443 1000 Limited to schools with at least 10 students with merged PSSA and SAT scores
HumRRO 49 April 2004
Table 52 Pooled Within-School Correlation Averaged for Classes of 2002 and 2003 PSSA SAT Course Grades
Variable Reading Math Verbal Math GPA (Total) English Math
ReadingPSSA
Math
1000
0676 1000
Verbal SAT
Math
0727 0640
0620 0845
1000
0679 1000
GPA
English Course
Grades Math
0520 0569
0459 0409
0356 0542
0525 0569
0466 0408
0359 0546
1000
0701 1000
0668 0443 1000 Limited to schools with at least 10 students with merged PSSA and SAT scores
If differences between schoolsrsquo grading procedures are substantial and if within schools students with higher grades also have higher PSSA scores then the correlations in Table 52 will be higher than student correlations in Table 10 (student-level correlations averaged for the Classes of 2002 and 2003) The difference between the GPA correlations in Table 10 and Table 52 however are only marginally different (see Table 53) In nearly all cases the within-school correlations are higher However the range is relatively smallmdash0009 to 0039 for GPA 0176 to 0219 for English course grades and 0147 to 0237 for math course grades Thus grading differences among schools do appear to exist but the effect is small for studentsrsquo GPA but larger for both English and math course grades especially when compared to the matching assessment component (ie English course grade to PSSA reading and SAT verbal math course grade to PSSA math and SAT math)
HumRRO 50 April 2004
Table 53 Differences Between Student-Level Correlations and Pooled Within-School Correlations Averaged for the Classes of 2002 and 2003
GPA or Course Grade to Student-Level Pooled Within- Difference in Assessment Correlations School Correlations Correlations
GPA to PSSA Reading 0511 0520 0009
GPA to PSSA Math 0546 0569 0023
GPA to SAT Verbal 0494 0525 0031
GPA to SAT Math 0530 0569 0039
English to PSSA Reading 0240 0459 0219
English to PSSA Math 0226 0409 0183
English to SAT Verbal 0256 0466 0210
English to SAT Math 0232 0408 0176
Math to PSSA Reading 0202 0356 0154
Math to PSSA Math 0305 0542 0237
Math to SAT Verbal 0212 0359 0147
Math to SAT Math 0313 0546 0233
Comparison of the correlations in Table 52 to Table 10 can also be used to test a hypothesis about the relationship between PSSA and SAT performance It is suggested above that some schools might be working more successfully toward improving PSSA performance than others Again if these efforts are only tangentially affecting SAT scores then we might expect mean differences among schools on PSSA scores that are not mirrored by differences on SAT Within schools however we can still expect students who do better on PSSA to also have a tendency to do better on SAT Figure 20 provides an extreme illustration of this potential effect Comparing correlations between PSSA and SAT from Table 52 to Table 10 reveals no such trend (see Table 54) The differences are all small (-0020 to +0009) suggesting that there are no significant differences among schools in the average PSSA scores of their students that are not mirrored by differences in studentsrsquo SAT scores This conclusion is consistent with the earlier conclusion from the individual level data That is no strong methodological differences in skills requirements are evidenced
HumRRO 51 April 2004
SAT Scores
School A School B School C
PSSA Scale Scores
Figure 20 Extreme hypothetical illustration of how mean differences among schools on PSSA scores that are not mirrored by differences on SAT scores can impact correlations (Ellipses represent students scores within each school)
Table 54 Differences Between SAT and PSSA Components for Student-Level Correlations and Pooled Within-School Correlations Averaged for the Classes of 2002 and 2003
GPA or Course Grade to Student-Level Pooled Within- Difference in Assessment Correlations School Correlations Correlations
PSSA Reading to SAT Verbal 0742 0727 -0015
PSSA Reading to SAT Math 0690 0640 -0020
PSSA Math to SAT Verbal 0629 0620 +0009
PSSA Math to SAT Math 0856 0845 -0009
A third comparison can also be made with the pooled within-school correlations This concerns the intercorrelations within each assessment format The pooled within-school PSSA intercorrelation (Table 52) shows a very slight decrease from student-level PSSA correlations (Table 10) while the pooled within-school SAT intercorrelation (Table 52) shows a larger increase from the student-level SAT intercorrelations (Table 10) It is possible that this is due to an increased homogeneity for the pooled within-school results However Figure 21 presents an exaggerated illustration of another manner in which this difference might be obtained This pattern would yield higher correlations for all students than for students within a school and a higher correlation of school-level scores (school-level PSSA intercorrelation is 0866 school-level SAT intercorrelation is 0942 [both from Table 45]) than for student-level scores (student-level PSSA is 0686 student-level SAT intercorrelation is 0737 [both from Table 10]) Although small (see Table 55) this is the pattern of differences in correlations obtained for both PSSA intercorrelations and for SAT intercorrelations Note that the difference between the PSSA components is smaller than the difference between the SAT components The obtained pattern
HumRRO 52 April 2004
like that in Figure 21 but much less exaggerated could result from differences between schools in the population of their students from differences in instruction that impact PSSA and SAT test scores or both
Content
Area B School A
School B
School C
Content Area A
Figure 21 Exaggerated illustration of how mean differences among schools can increase overall correlations (Ellipses represent students scores within each school)
Table 55 Internal Differences between SAT and PSSA Components for Student-Level Correlations and Pooled Within-School Correlations Averaged for the Classes of 2002 and 2003
GPA or Course Grade to Student-Level Pooled With- Difference in Assessment Correlations School Correlations Correlations
PSSA Reading to PSSA Math 0686 0676 -0010
SAT Verbal to SAT Math 0737 0845 0108
Summary and Conclusion The purpose of this report is to explore the validity questions ldquoAre PSSA scores
appropriately related to other measures of educational achievementrdquo
The data presented in this report suggest the following main points
bull Students who do well on any of the assessments tend to do well on all of the assessmentsmdashPSSA SAT GPA or course grades
bull When schoolsrsquo means are calculated using only the SAT-taking population of students schools with high scores on SAT also have high PSSA scores GPA and course grades are also related to both PSSA and SAT although not as strongly as the relationship between the PSSA and SAT
HumRRO 53 April 2004
PSSA exhibits strong convergent validity coefficients Correlations are very high between PSSA and SAT PSSA is positively correlated with other measures of student achievement including course grades and GPA Gains on PSSA are reflective of changes on SAT at the school level All these data provide strong evidence in support of PSSA as a valid measure of student achievement
There are however a few clarifications and qualifications to these general conclusions but none that diminish the basic findings These clarifications and qualifications include the following
Changes in scores Both mean PSSA and SAT scores experienced an increase Changes between the two assessments are positively correlated Schools that have gained on one assessment tend to have also gained on the other assessment However the same relationship is also true for those schools that have decreased
PSSA and SAT are tied to different content domains use differently formatted items and were designed to serve very different purposes However it is clear from the data that students who tend to perform well on the PSSA can also be expected to perform well on the SAT and vice-versa It is clear from the data that schools that perform well on one test can be expected to perform well on the other It is also clear that schools that improve on one test can be expected to improve on the other
Discriminant validity At the student level and the school level the different assessments of mathematics achievement are more highly related to each other than to assessments of other subjects Students with high mathematics scores on one assessment will tend to do well on all other assessments but that tendency is most pronounced for other mathematics assessments The same holds for school scores There is a similar differentiation on readingverbal assessments at both the student and school level but not as pronounced as in mathematics
GPA shows positive relationships with both PSSA and SAT assessments at the student and school level but not as pronounced as the relationship between the two assessments This is interpreted as being due to differences in schoolsrsquo grading practices Grading practices apparently differ sufficiently to reduce school-level associations with PSSA and SAT scores
Neither gender race socioeconomic status nor limited English proficiency appear to influence the PSSA scores any more than would be expected based on observed differences for SAT scores In other words PSSA items are not injecting any unexpected gender racialethnic socioeconomic status or limited English proficiency bias
HumRRO 54 April 2004
References
Camara WJ amp Schmidt AE (1999) Group differences in standardized testing and social stratification (College Board Report No 99-5) New York College Entrance Examination Board
Campbell D T amp Fiske D W (1959) Convergent and discriminant validation by the multitrait-multimethod matrix Psychological Bulletin 56(2) 81-105
Cassady JC (2001) Self-reported GPA and SAT A Methodological Note Practical Assessment Research amp Evaluation 7(12)
Coe Robert (2002) Itrsquos the effect size stupid What effect size is and why itrsquos important Paper presented at the Annual Conference of the British Educational Research Association University of Exeter England Retrieved from httpwwwleedsacukeducoldocuments00002182htm
Cohen J (1988) Statistical power analysis for the behavioral sciences (2nd ed) Hillsdale NJ Erlbaum
Hoffman R G (1998) Relationships among Kentuckyrsquos open-response assessments ACT scores and studentsrsquo self-reported high school grades (HumRRO Report FR-WATSD-98-27) Radcliff KY Human Resources Research Organization
Lewis DM Mitzel HC amp Green DR (1996) Standard setting A bookmark approach Symposium presented at the Council of Chief State School Officers Conference on Large ndashScale Assessment Phoenix AZ
Livingston SA amp Zieky MJ (1978) Manual for setting standards on the Basic Skills Assessment Test Princeton NJ Educational Testing Service
Mead R amp Melby K (2003 February) Technical analysis Pennsylvania System of School Assessment 2003 reading and mathematics PSSA Data Recognition Corporation
Mead R amp Melby K (2002 April) Technical analysis Pennsylvania System of School Assessment 2001 reading and mathematics PSSA Data Recognition Corporation
Mead R Smith RM amp Swanlund A (2003) Technical analysis 2003 Pennsylvania System of School Assessment mathematics and reading Data Recognition Corporation
NCLB (2004) httpwwwedgovnclblandingjtml
Sicoly Fiore (2002) What do school-level scores from large-scale assessments really measure Educational Measurement Issues and Practice 21(4) 17-26
Terenzini PT Cabrera AF amp Bernal EM (2001) Swimming against the tide The poor in American higher education (Research Report No 2001-1) New York College Entrance Examination Board
Willingham WW amp Cole NS (1997) Gender and Fair Assessment Hillsdale NJ Erlbaum
HumRRO 55 April 2004
HumRROKDE April 2003

Relationships Among the Pennsylvania System of School Assessment (PSSA) Scores SAT Scores and Self-Reported High School Grades for the Classes of
2002 and 2003
Table of Contents
Introduction1 Description of Data 2
Descriptive Statistics3 PSSA3 SAT Data 4
Matching Data5 Relationships Among Measures of Student-Level Performance 7
Correlations8 Illustration of Relationships10
SAT Verbal Score Versus PSSA Performance Level in Reading 11 PSSA Reading Scale Score Versus SAT Verbal Score by Quintile 12 SAT Math Score Versus PSSA Performance Level in Math14 PSSA Math Scale Score versus SAT Math Score by Quintile 16 PSSA Reading Scale Score Versus SAT Reported Average Grade in English18 PSSA Math Scale Score Versus SAT Reported Average Grade in Math20 PSSA Scale Scores Versus SAT Reported Grade-Point Average 22
Differences in Performance for Demographic Groupings27 Gender Differences 27 Ethnic or Racial Differences30 Economically Disadvantaged Differences33 Annual Family Income Differences35 Parent Educational Differences37 Limited English Proficiency Differences40
School-Level Scores 42 Average Within-Year School-Level Correlations 43 Pooled Within-School Correlations 47
Summary and Conclusion 53 References 55
List of Tables
Table 1 Summary Data from PSSA 2001 3 Table 2 Summary Data from 2002 PSSA 4 Table 3 Summary Data from 2003 PSSA 4 Table 4 Summary Data from SAT for 2001 through 2003 5 Table 5 Percentage of Students Retained in File Merge for Graduation Years 2003 and 2002 6 Table 6 SAT Descriptive Statistics for Graduating Classes of 2002 and 2003 with Matched
Unmatched and All Pennsylvania Public School Students 7 Table 7 PSSA Descriptive Statistics for Graduating Classes of 2002 and 2003 with Matched
Students Unmatched Students and All Pennsylvania Students 7
HumRRO iv April 2004
Table 8 PSSA SAT and Course Grade Correlations for Students in the Class of 2002 9 Table 9 PSSA SAT and Course Grades Correlations for Students in the Class of 2003 9 Table 10 PSSA SAT and Course Grades Correlations Averaged for the Classes of 2002 and
2003 10 Table 11 Changes in Mean Scale Scores Across Graduation Years 10 Table 12 Gender differences for PSSA (unmatched state data) 28 Table 13 Gender differences for Class of 2002 matched sample (2001 PSSA and 2002 SAT) 28 Table 14 Gender differences for class of 2003 matched sample ( 2001 PSSA and 2002 SAT) 29 Table 15 Regressions Results Showing the Adjusted Strength of Gender on Predicting 2001
PSSA 11th Grade Scale Scores Based on 2002 SAT Scores 29 Table 16 Regressions Results Showing the Adjusted Strength of Gender on Predicting 2002
PSSA 11th Grade Scale Scores Based on 2003 SAT Scores 29 Table 17 Ethnicity differences for PSSA (unmatched state data) 30 Table 18 Ethnicity differences for the class of 2002 matched sample (2001 PSSA 11th Grade and
2002 SAT) 31 Table 19 Ethnicity differences for the class of 2003 for matched sample (2002 PSSA 11th Grade
and 2003 SAT) 32 Table 20 Regressions Results Showing the Adjusted Strength of Being Black on Predicting 2001
PSSA 11th Grade Scale Scores Based on 2002 SAT Scores 32 Table 21 Regressions Results Showing the Adjusted Strength of Being Black on Predicting 2002
PSSA 11th Grade Scale Scores Based on 2003 SAT Scores 33 Table 22 Regressions Results Showing the Adjusted Strength of Being HispanicLatino on
Predicting 2001 PSSA 11th Grade Scale Scores Based on 2002 SAT Scores 33 Table 23 Regressions Results Showing the Adjusted Strength of Being HispanicLatino on
Predicting 2002 PSSA 11th Grade Scale Scores Based on 2003 SAT Scores 33 Table 24 Differences for Economically Disadvantaged Students for PSSA (unmatched state
data) 34 Table 25 Differences for economically disadvantaged students for matched sample for the class
of 2002 (2001 PSSA 11th Grade and 2002 SAT) 34 Table 26 Differences for economically disadvantaged students for matched sample for the class
of 2003 (2002 PSSA 11th Grade and 2003 SAT) 35 Table 27 Regressions Results Showing the Adjusted Strength of Being Economically
Disadvantaged on Predicting 2001 PSSA 11th Grade Scale Scores Based on 2002 SAT Scores 35
Table 28 Regressions Results Showing the Adjusted Strength of Being Economically Disadvantaged on Predicting 2002 PSSA 11th Grade Scale Scores Based on 2003 SAT Scores 35
Table 29 Annual family income differences for matched sample for the class of 2002 (2001 PSSA 11th Grade and 2002 SAT) 36
Table 30 Annual family income differences for matched sample for the class of 2003 (2002 PSSA 11th Grade and 2003 SAT) 37
Table 31 Mothers education level differences for matched sample for the class of 2002 (2001 PSSA 11th Grade and 2002 SAT) 38
Table 32 Mothers education level differences for matched sample for the class of 2003 (2002 PSSA 11th Grade and 2003 SAT) 38
HumRRO v April 2004
Table 33 Fathers education level differences for matched sample for the class of 2002 (2001 PSSA 11th Grade and 2002 SAT) 39
Table 34 Fathers education level differences for matched sample for the class of 2003 (2002
Table 35 Limited English Proficiency differences for 11th Grade PSSA (unmatched state data)40
Table 37 Limited English Proficiency differences for matched sample for class of 2003 (2002
Table 45 School-Level PSSA SAT and Course Grades Correlation Averages for the Class of
Table 46 Difference in mean school-level SAT Verbal and PSSA Reading scores from the class of 2002 and class of 2003 (Minimum of 10 students taking the SAT and merging with
Table 47 Correlation of difference in school-level mean SAT Verbal score and PSSA Reading
Table 48 Difference in mean school-level SAT Math and PSSA Math scores from the class of 2002 and class of 2003 (Minimum of 10 students taking the SAT and merging with PSSA
Table 49 Correlation of difference in school-level mean SAT Math score and PSSA Math score
Table 53 Differences Between Student-Level Correlations and Pooled Within-School
Table 54 Differences Between SAT and PSSA Components for Student-Level Correlations and
Table 55 Internal Differences between SAT and PSSA Components for Student-Level Correlations and Pooled Within-School Correlations Averaged for the Classes of 2002 and
PSSA 11th Grade and 2003 SAT) 39
Table 36 Limited English Proficiency differences for matched sample class of 2002 (2001 PSSA 11th Grade and 2002 SAT) 40
PSSA 11th Grade and 2003 SAT) 41 Table 38 Regressions Results Showing the Adjusted Strength of Being Limited English
Proficient on Predicting 2001 PSSA 11th Grade Scale Scores Based on 2002 SAT Scores 41 Table 39 Regressions Results Showing the Adjusted Strength of Being Limited English
Proficient on Predicting 2002 PSSA 11th Grade Scale Scores Based on 2003 SAT Scores 41 Table 40 PSSA School-Level Descriptive Statistics for the Classes of 2002 and 2003 42 Table 41 SAT School-Level Descriptive Statistics for the Classes of 2002 and 2003 42 Table 42 School-Level Descriptive Statistics GPA and Course Grades for the Classes of 2002
and 2003 43 Table 43 School-Level PSSA SAT and Course Grade Correlations for the Class of 2002 44 Table 44 School-Level PSSA SAT and Course Grades Correlations for the Class of 2003 44
2002 and 2003 45
PSSA file at a school) 45
score between the class of 2002 and the class of 2003 45
file at a school) 46
between the class of 2002 and the class of 2003 47 Table 50 Pooled Within-School Correlation for the Class of 2002 49 Table 51 Pooled Within-School Correlation for the Class of 2003 49 Table 52 Pooled Within-School Correlation Averaged for Graduation Years 2002 and 2003 50
Correlations Averaged for the Classes of 2002 and 2003 51
Pooled Within-School Correlations Averaged for the Classes of 2002 and 2003 52
2003 53
List of Figures
Figure 1 Student-level relationship between 2002SAT Verbal score and 2001 PSSA 11th Grade Reading Performance Level for the class of 2002 11
HumRRO vi April 2004
Figure 2 Student-level relationship between 2003 SAT Verbal score and 2002 PSSA 11th Grade Reading Performance Level for the class of 2003 12
Figure 3 Student-level relationship between 2001 PSSA Reading scale scores and 2002 SAT Verbal scores divided into quintiles for the class of 2002 13
Figure 4 Student-level relationship between 2002 PSSA 11th Grade Reading scale scores and 2003 SAT Verbal score divided into quintiles for the class of 2003 14
Figure 5 Student-level relationship between 2002 SAT Math score and 2001 PSSA 11th Grade Math Performance Level for the class of 2002 15
Figure 6 Student-level relationship between SAT Math score and PSSA performance level for the class of 2003 16
Figure 7 Student-level relationship between 2001 PSSA 11th Grade Math scale score and 2002 SAT Math score divided into quintiles for the class of 2002 17
Figure 8 Student-level relationship between 2002 PSSA 11th Grade Math scale scores and 2003 SAT Math scores divided into quintiles for the class of 2003 18
Figure 9 Student-level relationship between 2001 PSSA 11th Grade Reading Scale Score and student reported average English grade on the Student Descriptive Questionnaire (SDQ) of the SAT for the class of 2002 19
Figure 10 Student-level relationship between 2002 PSSA 11th Grade Reading Scale Score and student-reported English grade on the SAT Student Descriptive Questionnaire (SDQ) for the class of 2003 20
Figure 11 Student-level relationship between 2001 PSSA 11th Grade Math Scale Score and student-reported Math grade in the Student Descriptive Questionnaire (SDQ) of the SAT for the class of 2002 21
Figure 12 Student-level relationship between 2002 PSSA 11th Grade Math Scale Score and student-reported average Math grade in the SAT Student Descriptive Questionnaire (SDQ) for the class of 2003 22
Figure 13 Student-level relationship between 2001 PSSA 11th Grade Reading scale score and student-reported grade-point average (GPA) from the SATrsquos Student Descriptive Questionnaire (SDQ) for the class of 2002 23
Figure 14 Student-level relationship between 2002 PSSA 11th Grade Reading scale score and student-reported grade-point average (GPA) from the SATrsquos Student Descriptive Questionnaire (SDQ) for the class of 2003 24
Figure 15 Student-level relationship between 2001 PSSA 11th Grade Math scale score and student-reported grade-point average (GPA) from the SATrsquos Student Descriptive Questionnaire (SDQ) for the class of 2002 25
Figure 16 Student-level relationship between 2001 PSSA 11th Grade Math scale score and student-reported grade-point average (GPA) from the SATrsquos Student Descriptive Questionnaire (SDQ) for the class of 2002 26
Figure 17 Scatterplot of difference in school-level SAT Verbal mean scores and school-level PSSA 11th Grade Reading mean scores between the Class of 2002 and Class of 2003 46
Figure 18 Scatterplot of differences in school-level mean SAT Math Score and school-level mean PSSA Math Scores between the Class of 2002 and Class of 2003 47
Figure 19 Extreme hypothetical illustration of how mean differences among schools on PSSA or SAT scores that are not mirrored by differences in GPA can impact correlations (Ellipses represent students scores within each school) 48
HumRRO vii April 2004
Figure 20 Extreme hypothetical illustration of how mean differences among schools on PSSA scores that are not mirrored by differences on SAT scores can impact correlations (Ellipses represent students scores within each school) 52
Figure 21 Exaggerated illustration of how mean differences among schools can increase overall correlations (Ellipses represent students scores within each school) 53
HumRRO viii April 2004
Relationships Among the Pennsylvania System of School Assessment (PSSA) Scores SAT Scores and Self-Reported High School Grades for the Classes of
2002 and 2003
Introduction As part of Pennsylvaniarsquos System of School Assessment (PSSA) students in Grades 5 8
and 11 take tests in reading and mathematics Students in Grades 6 9 and 11 are assessed in writing The annual PSSA is a standards-based criterion-referenced assessment used to measure a studentrsquos attainment of academic standards while also determining the degree to which school programs enable students to attain proficiency standards PSSA results are produced at student and school levels Student scores which are provided to their respective schools can be used diagnostically to identify students in need of additional educational opportunities School scores are provided for schools and districts to use for curriculum and instruction improvement discussions and planning (wwwpdestatepausa_and_tsite)
PSSA tests studentsrsquo abilities in relation to academic standards adopted in 1999 The standards identify what students should know and be able to do within each subject area at each designated grade level PSSA test items are linked to the standards and PSSA scores are used to stratify student performance within the standards Students receive designations of Below Basic Basic Proficient or Advanced depending on how they score in each tested subject These proficiency levels are determined using cut scores on the PSSA measurement scale Cut scores were determined using the Bookmark (Lewis Mitzel amp Green 1996) and Borderline Groups (Livingston amp Zieky 1978) standards-setting procedures
Because PSSA serves as an assessment for individual students and for schools it is configured using common and matrix items Common items are administered to all students and are used to create all student-level measures Matrix items are administered by form such that each student only takes a portion of the matrix items There are typically 10-12 matrix forms spiraled within classrooms to ensure that a random and representative sample of students receives each form The matrix items add to the overall content coverage of the PSSA and allow for better diagnostic data to be produced at school and district levels
In addition to the PSSA many students also take the SAT test as a requirement for admission to Pennsylvania colleges and universities SAT is designed to be predictive of college performance Most Pennsylvania students who plan to attend college take the SAT 1 version of the test which includes a verbal and a mathematics component Both PSSA and SAT test data includes student demographic information allowing students to be matched by name and date of birth and allowing the examination of test performance in relation to various demographic factors
The quality of an assessment is typically characterized by its reliability and validity The usual measure of reliability is an indication of how similar a studentrsquos scores on an assessment would be if student took the test multiple times or test-retest reliability Reliability is largely concerned with the consistency of an assessment Reliability coefficients are provided in the PSSA technical manuals produced by Data Recognition Corporation (DRC) each year (Mead amp Melby 2002 Mead amp Melby 2003 and Mead Smith amp Swanlund 2003) PSSA test-retest reliabilities ranged from 093 to 094 for math and from 092 to 094 for reading for the full set of items (common + matrix) in 2002 They were slightly lower for the common items only 092 for
HumRRO 1 April 2004
math for all grades and ranging from 088 to 091 for reading (Estimates were very similar in 2001 and 2003) This reduction in reliability for the common items reflects that reliability statistics are influenced to a great extent by test length The common section of the PSSA ranges from a minimum of 60 score points (for Grade 5 reading) to 80 or more score points (for all other gradesubjects) This relatively large number of items helps account for PSSArsquos very high reliability estimates
So we know that according to traditional reliability statistics PSSA is a reliable measurement instrument This report is concerned with the validity of the PSSA Simply put does the PSSA measure what it purports to measure This is not as simple a question as it seems One way of investigating validity is to compute convergent validity coefficients Convergent validity coefficients are measures of the relationship between two separate tests of student ability for the same subject matter They are correlations between studentsrsquo performance on the two tests Often convergent validity statistics are used to ensure that multiple forms from a single assessment are measuring essentially equivalent content When convergent validity coefficients are calculated for that purpose higher correlations are considered better than lower correlations When we correlate PSSA scores with scores from SAT however the interpretation of the coefficients requires additional explanation
PSSA tests student ability related to content that is specific to Pennsylvania The academic standards outline the content that Pennsylvania has collectively decided is essential for students in its public schools The extent to which another test measures content that is different from Pennsylvaniarsquos will limit the strength of the correlation between the two assessments In fact if the correlation were very high it would raise questions as to whether the two assessments were measuring anything different at all and consequently whether both are necessary PSSA is composed of multiple-choice and performance-task items If another test uses only multiple-choice items there may be method differences that reduce the strength of the correlations as well Still all the tests analyzed as part of this research report scores for recognizable subjects such as mathematics and reading We expect student scores on the various tests to be related We are left looking for what Hoffman (1998) refers to as ldquoGoldilocksrdquo correlations Correlations between PSSA and SAT should fall in the not-too-high and not-too-low category
Comparisons between PSSA and other tests can also provide insights into performance of various identified groups of interest The federal No Child Left Behind (NCLB) Act of 2001 (NCLB 2004) requires that each state measure the proficiency of its students as well as reduce gaps between traditionally lower-performing groups and their higher-performing peers NCLB requires that states reduce gaps associated with race socioeconomic status language and disability Comparisons of group performance on PSSA can determine if there is differential impact a necessary but insufficient condition for bias associated with the assessment This report examines gender race language and socioeconomic status for differential impact Due to inconsistencies in the manner in which students with disabilities are treated when taking the assessments disability is not considered
Description of Data Student-level PSSA files from the administrations in 2001 2002 and 2003 were provided
by DRC HumRRO downloaded the data from a secure file transfer protocol (FTP) site Files included student responses and scores for reading and mathematics as well as demographic information Files also identified students by name school and district In most cases student
HumRRO 2 April 2004
birthdates were also included in the files No student-level records were shared with the Pennsylvania Department of Education (PDE) Files included student-level identifiers for the expressed purpose of matching PSSA results with results from other assessments Once matching was complete student names and birthdates were purged from all working files All PSSA files were provided as text files Text files were converted to SAS databases prior to analyses or merging with other files
College Board provided state-level SAT data from administrations conducted in 2001 2002 and 2003 College Board provided only data from students enrolled in public schools Private school students are not considered under the jurisdiction of the Pennsylvania Department of Education so identifiers were not available for those students even if their schools opted to take the PSSA Consequently the number of students and mean scores reported in this study do not match the numbers and means provided on College Boardrsquos web site for Pennsylvania
Descriptive Statistics
PSSA
Tables 1-3 present a summary of the data included in the PSSA files Statistics represent scale scores for reading and mathematics and are the same scale scores reported to students They are based only on the common set of items to which all students respond The number of cases presented in the first column is the total number of students in the file Not all of those students had data in the scale-score fields so n-counts are smaller than the number of cases Scale score minimums were limited to 700 for 2002 and 2003
Table 1 Summary Data from PSSA 2001
Grade Mathematics (Non-Missing)
Reading (Non-Missing)
Grade 5 N 142858 142810 (Cases = 145440) Mean 131142 131214
SD 19065 20268 Minimum 595 381 Maximum 2212 2506 Grade 8 N 139322 139073 (Cases = 143119) Mean 131046 130456
SD 20035 21006 Minimum 373 100 Maximum 2201 2214 Grade 11 N 116137 115566 (Cases = 122332) Mean 130411 129687
SD 22057 21757 Minimum 100 100 Maximum 2481 2088
HumRRO 3 April 2004
Table 2 Summary Data from 2002 PSSA
Grade Mathematics (Non-Missing)
Reading (Non-Missing)
Grade 5 N 143159 143046 (Cases =145688) Mean 131519 131639
SD 20832 20513 Minimum 700 700 Maximum 2409 2630 Grade 8 N 141910 141801 (Cases =146127) Mean 131578 130970
SD 19962 21887 Minimum 700 700 Maximum 2293 2345 Grade 11 N 123550 123234 (Cases =129475) Mean 131447 131286
SD 22829 21513 Minimum 700 700 Maximum 2437 2362
Table 3 Summary Data from 2003 PSSA
Grade Level Mathematics (Non-Missing)
Reading (Non-Missing)
Grade 5 N 141402 141530 (Cases =143502) Mean 133813 133160
SD 20798 22459 Minimum 700 700 Maximum 2325 2444 Grade 8 N 144964 145302 (Cases =148760) Mean 131992 133697
SD 20904 22705 Minimum 719 700 Maximum 2228 2666 Grade 11 N 126941 127427 (Cases =133168) Mean 131478 131561
SD 21478 23539 Minimum 700 700 Maximum 2238 2355
SAT Data
Table 4 contains descriptive statistics for SAT data College Board provided SAT data for 2001 2002 and 2003 Note that the number of students taking the SAT is considerably fewer than those taking the Grade 11 PSSA Students typically take the SAT in preparation for post-
HumRRO 4 April 2004
secondary education Students with no plans for continuing their education past high school may not take the SAT The minimum and maximum scores on SAT for both verbal and mathematics tests was 200 and 800 respectively for all years
Table 4 Summary Data from SAT for 2001 through 2003 SAT Year Verbal Mathematics
2001 N Mean SD
75696 49734 10350
75696 49918 10961
2002 N Mean SD
76924 49468 10408
76924 50006 11073
2003 N Mean SD
79149 49732 10325
79149 50296 11020
Matching Data
All comparison test data had to be matched to PSSA data in order to perform correlations and other calculations The SAT data provided by the College Board consisted of separate annual data files for Pennsylvania public school students graduating from 2001 to 2003 PSSA data files consisted of data files for 11th grade students from 2001 to 2003 SAT data files were merged with PSSA data files to produce data files for students graduating in 2003 (2003 SAT file merged with 2002 PSSA 11th grade file) and 2002 (2002 SAT file merged with the 2001 PSSA 11th grade file)
Rules were established to ensure the consistency of merging data Each merge attempt resulted in three filesmdashsuccessfully merged student data unmerged students from File 1 and unmerged students from File 2 Each successive merge attempt was made using only students from the unmerged files The successfully merged data was then appended to create the final working files
The data file for students graduating in 2003 was obtained by exactly matching student names and birthdates in the two files This was done in four merge cycles For the first cycle we merged on exact matches of student last name first name middle initial and birth date For the second cycle we merged on student last name first name and birth date For the third cycle we merged on last name first name truncated to the first four letters and birth date For the fourth cycle we merged on last name truncated to the first four letters first name truncated to the first four letters and birth date
Because of an apparent error in the birth date for one of the files for students graduating in 2002 birth date could not be used As a result we merged files for this class in two cycles For the first cycle we merged on last name first name and middle initial For the second cycle we merged on last name and first name A more detailed explanation of this is found in the following paragraph
Table 5 presents the proportion of students retained in the final PSSASAT data set reported by graduation year Following the final merge cycle slightly more than 90 of the original cases in the SAT data file were retained The successful merging of the files was
HumRRO 5 April 2004
hampered by inconsistent reporting of studentsrsquo names across the tests Student or coding errorsdifferences created inconsistencies between the two tests (eg O BRIEN versus OrsquoBRIEN or TOM versus THOMAS) Additionally missing birth date or invalid birth date (eg 13th month 32nd day of 2001 for a 2003 high school graduate) by a student or in the coding process on one of the tests may also have caused a portion of studentsrsquo files not to merge Also of note is the fact that the 2001 and 2002 PSSA files were missing more than 10000 birth dates in the two files combined Additionally for the PSSA 2002 and the SAT 2003 data files there appeared to be an error in the birth date file that resulted in virtually no matches between the files when birth date was included As a result the two files went through only two merge cycles which did not include birth date
Table 5 Percentage of Students Retained in File Merge for Graduation Years 2003 and 2002 Students Percent
Year Merge Cycle in SAT of SAT File File
Beginning File 79095 100
1st Merge (last name first name middle initial birth date 60044 759
2003 2nd Merge (last name first name birth date) 69416 878
3rd Merge (last name truncated first name birth date) 70831 896
4th Merge (truncated last name truncated first name birth date) 71511 904
Beginning File 76925 100
2002 1st Merge (last name first name middle initial) 60317 7841
2nd Merge (last name first name) 69325 9012 Note For 2002 there was a discrepancy in the birth date information between the 2001 PSSA data file for 11th graders and the 2002 SAT data file As a result birth date information could not be used in conducting the merge for that year
An additional analysis was conducted to verify that students retained in the final data set did not differ significantly on SAT scores from those whose data failed to merge Table 6 presents the means standard deviations and numbers of cases for matched and all Pennsylvania public school students for 2002 and 2003 Mean scores in 2003 for students whose data were merged were approximately 30 scale score points higher than mean scores for all students and about 30 points higher than for unmerged students The mean for merged students was about 26 scale score points higher than the mean for all students in 2002 for both tests The difference in means between merged students and unmerged students also was about 30 points in 2002 Data includes students attending public schools in Pennsylvania only While this difference is a concern it is consistent between the two years Correlations also were conducted on each cycle during the merge to check that correlations were approximately the same from cycle to cycle Correlations remained approximately the same for each merge cycle Results of these checks are not contained in this report
HumRRO 6 April 2004
Table 6 SAT Descriptive Statistics for Graduating Classes of 2002 and 2003 with Matched Unmatched and All Pennsylvania Public School Students
Graduating Class of 2002 Graduating Class of 2003
Matched Unmatched Total Matched Unmatched Total
Verbal Mean
SD
N
49731 47068 49468
10266 11348 10408
69325 7600 76925
50033 46892 49732
10182 11191 10325
71511 7584 79095
Math Mean
SD
N
50267 47619 50006
10943 11930 11073
69325 7600 76925
50604 47392 50296
10908 11633 11020
71511 7584 79095 Note Student data are for students attending public schools in Pennsylvania only No private school student data is included
An additional analysis was conducted to compare PSSA scores between students whose data matched whose data failed to match and with the total file Table 7 presents the means standard deviations and numbers of cases for Pennsylvania public school students for 2002 and 2003 As expected the mean scores for merged students for both tests in both years are higher than for unmerged student scores and the state total Students taking the SAT are generally college-bound students (the merged file) and typically score higher than non-college-bound students (most of the students in the unmerged file) on academically-oriented assessments Since the total file is the combination of the two filesmdashmerged and unmergedmdashthe total file mean should fall between the means for the two files
Table 7 PSSA Descriptive Statistics for Graduating Classes of 2002 and 2003 with Matched Students Unmatched Students and All Pennsylvania Students
Graduating Class of 2002 (11th Grade PSSA for 2001)
Graduating Class of 2003 (11th Grade PSSA for 2002)
Matched Unmatched Total Matched Unmatched Total
Reading Mean
SD
N
138250 117432 129689
17902 20903 21756
68039 47523 115562
140630 118618 131287
16856 20645 21513
70926 52306 123232
Math Mean
SD
N
139283 117796 130413
20078 18275 22057
68189 47943 116132
141479 117902 131448
20626 18192 22828
70981 52566 123547
Relationships Among Measures of Student-Level Performance This section presents relationships among PSSA and other measures of student
performancemdashSAT scores grade-point average (GPA) and course gradesmdashby examining correlations among the measures and graphical portrayals of the relationships GPAs and course
HumRRO 7 April 2004
grades were obtained from the optional Student Descriptive Questionnaire (SDQ) which students are asked to complete as part of the SAT assessment process HumRRO had specifically requested certain demographic information obtained by the SDQ when we requested the SAT data files The use of self-reported data undoubtedly involves some inaccuracies However Cassady (2001) found studentsrsquo self-reported grades to be a reliable measure of actual grades
Correlations1
Pearson correlations were calculated for the PSSA-SAT merged files for both graduating classes The tables differentiate between the correlations among the content areas within each of the different assessments from the correlations between the different kinds of assessments (Campbell amp Fiske 1959) thus allowing for the examination of the following relationships
bull The same content area within different achievement measures or convergent validity coefficients (Campbell amp Fiske 1959) (These correlations are in bold and underlined)
bull Different content areas within the same achievement measures (These correlations are in italics)
bull Different content areas within different achievement measures (These correlations are in bold but not underlined)
In correlation tables of this type the expectation is for the highest correlations to be between different measures of the same content Then because of similarities in test-taking strategies or other method effects the next highest correlations are typically those between different content but measured by the same method of assessment Correlations between different content areas within different measures should be the lowest in the table
As the tables show correlations are positive and above 030 This means that students who do well on any one measure of any content also tend to do well on all measures and in all content areas In a recent study of school-level assessment scores Sicoly (2002) discussed the existence of a general cognitive factor that ldquocuts across content areasrdquo If such a ldquog-factorrdquo exists then it would be expected that students with high ability would score well on any test regardless of the content Correlations presented in these tables suggest that Pennsylvania students who exhibit high ability in one content area can be expected to perform well in other content areas
The results are shown in Table 8 for the Class of 2002 Table 9 for the Class of 2003 and Table 10 for the two-year averaged2 correlation for PSSA SAT GPA and course grades The correlations for both 2002 and 2003 and the two-year average show a strong correlation between the math and readingverbal component on each assessment (r = 0686 for PSSA and r = 0737 for SAT for the two-year average) and between the math components on the two assessments and the readingverbal assessments on the two assessments (r = 0856 for math and r = 0742 for readingverbal for the two years averaged)
Correlations for student-reported scores tended to be lower than correlations between the two assessments Correlations between PSSA and SAT to student-reported GPAs were lower but were still approximately 05 (r = 0501 for PSSA reading r = 0539 for PSSA math r = 0491 for SAT verbal and r = 0525 for SAT math) Correlations between GPA and both English
1 Given the extremely large sample sizes tests of statistical significance are irrelevant All reported relationships are statistically significant that is unlikely to be due to chance Therefore the report focuses on interpretation of the results
2 The technical r to z correction was used to obtain the averaged correlations
HumRRO 8 April 2004
and math course grades were high (r = 0708 for English and r = 0669 for math) Correlations for student-reported course grades and the matching component of the two assessments were also fairly high English was approximately 045 and math was approximately 0530 (r = 0443 for English course grades to PSSA reading r = 0446 for English course grades to SAT verbal r = 0534 for math course grades to PSSA math and r = 0529 for math course grades to SAT math for the two-year average) The lower correlations between course grades and the two assessments can be partially attributed to differences in courses taken and grading practices from teacher to teacher and school to school
Table 8 PSSA SAT and Course Grade Correlations for Students in the Class of 2002 PSSA SAT Course Grades
Variable Reading Math Verbal Math GPA (Total) English Math
ReadingPSSA
Math
1000
0678 1000
Verbal SAT
Math
0704 0685
0593 0846
1000
0735 1000
GPA
English Course
Grades Math
0501 0539
0443 0399
0361 0528
0491 0525
0447 0390
0354 0527
1000
0708 1000
0669 0449 1000
Table 9 PSSA SAT and Course Grades Correlations for Students in the Class of 2003 PSSA SAT Course Grades
Variable Reading Math Verbal Math GPA (Total) English Math
ReadingPSSA
Math
1000
0694 1000
Verbal SAT
Math
0775 0694
0663 0865
1000
0739 1000
GPA
English Course
Grades Math
0520 0553
0455 0406
0380 0540
0496 0535
0444 0396
0363 0531
1000
0704 1000
0672 0454 1000
HumRRO 9 April 2004
2003 Table 10 PSSA SAT and Course Grades Correlations Averaged for the Classes of 2002 and
PSSA SAT Course Grades
Variable Reading Math Verbal Math GPA (Total) English Math
ReadingPSSA
Math
1000
0686 1000
Verbal SAT
Math
0742 0690
0629 0856
1000
0737 1000
GPA
English Course
Grades Math
0511 0546
0449 0403
0371 0534
0494 0530
0446 0393
0359 0529
1000
0706 1000
0671 0452 1000
Table 11 shows that student performance on both the SAT and PSSA increased from the Class of 2002 to the Class of 2003 For the SAT the increase was 302 scale score points for the verbal portion of the assessment and 337 scale score points for the math portion of the assessment For the PSSA the increase was 2380 scale score points for the verbal portion of the assessment and 2196 scale score points for the math portion of the assessment
Table 11 Changes in Mean Scale Scores Across Graduation Years Mean Scores Class of 2002
Mean Scores Class of 2003
Mean Score Difference
SAT Verbal Math
49731 50267
50033 50604
+302 +337
PSSA Reading Math
138250 139283
140630 141479
+2380 +2196
Illustration of Relationships
Figure 1 through Figure 16 present box plots that illustrate relationships between PSSA scores and other measures of student achievement These graphs further illustrate the strong correlations between the two tests in both subject areas and other measures of student performance Data are presented separately for the Classes of 2002 and 2003 The boxes and whiskers in each plot represent the distribution of scores versus the varying levels of the corresponding grouping of scores or performance measures (GPA or student course grades) Each box represents 50 of the students within each of the categories along the X-axis The median is represented by the line in the box The whiskers represent the spread of the distribution of students calculated at 15 times the length of the box This spread should include approximately 993 of all students for the given category Sample sizes within each category along the X-axis are noted
HumRRO 10 April 2004
SAT Verbal Score Versus PSSA Performance Level in Reading
Figure 1 and Figure 2 show the relationship between the SAT Verbal score on the y-axis and the 11th Grade PSSA Reading Performance Level on the x-axis for the Classes of 2002 and 2003 The graph shows a distinct stair-step especially for the Basic to Advanced levels for both classes The number of students in each level also indicates that more of the higher-achieving students on the PSSA are taking the SAT than are lower-achieving students
Outliers are hidden Extreme values are hidden
PSSA Performance Levels 1 - Below Basic 2 - Basic 3 - Proficient 4 - Advanced
1 2 3 4
2001 PSSA 11th Grade Reading Performance Level
200
300
400
500
600
700
800
2002
SA
T V
erba
l Sco
re
n=34825
n=10808 n=8020
n=15672
Figure 1 Student-level relationship between 2002 SAT Verbal score and 2001 PSSA 11th grade reading performance level for the Class of 2002
HumRRO 11 April 2004
Outliers are hidden Extreme values are hidden
1 2 3 4
2002 PSSA 11th Grade Reading Performance Level
200
300
400
500
600
700
800
2003
SA
T V
erba
l Sco
re
n=11539
n=5121
n=37823
n=17028 PSSA Performance Level 1 - Below Basic 2 - Basic 3 - Proficient 4 - Advanced
Figure 2 Student-level relationship between 2003 SAT verbal score and 2002 PSSA 11th grade reading performance level for the Class of 2003
PSSA Reading Scale Score Versus SAT Verbal Score by Quintile
Figure 3 and Figure 4 show the relationship between the PSSA reading scale score on the y-axis and the SAT verbal score by quintile on the x-axis for the Classes of 2002 and 2003 The graph shows a distinct stair-step for each quintile in both grades Two sets of cut scores are also illustrated on the graphs The graphrsquos legend lists the cut scores for each quintile The cut scores were chosen to place approximately 20 of the students taking the SAT in each quintile Because of the number of students with a score equal to the cut score the number of students in each quintile is not the same The cut points for each quintile therefore vary slightly between the two classes The second set of cut scores is represented by the lines that have been added to show the 11th grade PSSA reading performance levels This illustrates that most students in the top four quintiles or top 80 of those students taking the SAT are performing at the Proficient or Advanced level on the 11th grade PSSA reading assessment
HumRRO 12 April 2004
2001
PSS
A 1
1th
Gra
de R
eadi
ng S
cale
Sco
re
2000
1800
1600
1400
1200
1000
800
Outliers are hidden Extreme values are hidden
n=13209
n=13432
n=14286
n=13847
n=13265
1 2 3 4 5
2002 SAT Verbal Scores Divided into Quintiles
Advanced
Proficient
Basic
Below Basic
2002 SAT Verbal Quintiles 1 - Less than 420 2 - 420 to 480 3 - 480 to 520 4 - 520 to 580 5 - Greater than 580
Figure 3 Student-level relationship between 2001 PSSA reading scale scores and 2002 SAT verbal scores divided into quintiles for the Class of 2002
HumRRO 13 April 2004
Outliers are hidden Extreme values are hidden
1 2 3 4 5
2003 SAT Verbal Scores Divided Into Quintiles
800
1000
1200
1400
1600
1800
2000
2002
PSS
A 1
1th
Gra
de R
eadi
ng S
cale
Sco
re
n=13969
n=14502 n=13838
n=14314 n=14303
2003 SAT Verbal Quintiles 1 - Less than 420 2 - 420 to 480 3 - 480 to 520 4 - 520 to 580 5 - Greater than 580
Advanced
Proficient
Basic
Below Basic
Figure 4 Student-level relationship between 2002 PSSA 11th grade reading scale scores and 2003 SAT verbal score divided into quintiles for the Class of 2003
SAT Math Score Versus PSSA Performance Level in Math
Figure 5 and Figure 6 show the relationship between the SAT math score on the y-axis and the 11th grade PSSA math performance level on the x-axis for the Classes of 2002 and 2003 The graph shows a distinct stair-step for all levels in both grades The number of students in each level also indicates that more of the higher-achieving students are taking the SAT than are lower-achieving students
HumRRO 14 April 2004
Outliers are hidden Extreme values are hidden
PSSA Performance Levels 1 - Below Basic 2 - Basic 3 - Proficient 4 - Advanced
1 2 3 4
2001 PSSA 11th Grade Math Performance Level
200
300
400
500
600
700
800
2002
SA
T M
ath
Scor
e
n=20950
n=22786 n=14102
n=11487
Figure 5 Student-level relationship between 2002 SAT math score and 2001 PSSA 11th grade math performance level for the Class of 2002
HumRRO 15 April 2004
Outliers are hidden Extreme values are hidden
PSSA Performance Level 1 - Below Basic 2 - Basic 3 - Proficient 4 - Advanced
1 2 3 4
2002 PSSA 11th Grade Math Performance Level
200
300
400
500
600
700
800
2003
SA
T M
ath
Scor
e
n=13459
n=24205
n=24580
n=9267
Figure 6 Student-level relationship between 2003 SAT math score and 2002 PSSA 11th grade math performance level for the Class of 2003
PSSA Math Scale Score versus SAT Math Score by Quintile
Figure 7 and Figure 8 show the relationship between the 11th grade PSSA math scale score on the y-axis and the SAT math score by quintile on the x-axis for the Classes of 2002 and 2003 The graph shows a distinct stair-step for each quintile in both grades Two sets of cut scores are also illustrated on the graph The graphrsquos legend lists the cut scores for each quintile The cut scores were chosen to place approximately 20 of the students taking the SAT in each quintile Because of the number of students with a score equal to the cut score the number of students in each quintile is not the same The cut points for each quintile therefore vary slightly between the two classes The second set of cut scores is represented by the lines that have been added to show the for 11th grade PSSA math performance levels This figure clearly illustrates that more than 75 of students in the each of the top three quintiles or top 60 of those students taking the SAT are performing at the Proficient or Advanced level on the 11th Grade PSSA math assessment Additionally more than 75 of students taking the SAT in the top quintile and more than 50 of students in the second quintile are scoring in the Advanced performance level on the 11th grade PSSA math assessment
HumRRO 16 April 2004
Outliers are hidden Extreme values are hidden
1 2 3 4 5
2002 SAT Math Scores Divided into Quintiles
800
1000
1200
1400
1600
1800
2000
2001
PSS
A 1
1th
Gra
de M
ath
Scal
e Sc
ore
n=14834
n=13952
n=12271
n=13117
n=14015
Advanced
Proficient
Basic
Below Basic
2002 SAT Math Score Quintiles 1 - Less than 410 2 - 410 to 470 3 - 470 to 530 4 - 530 to 600 5 - Above 600
Figure 7 Student-level relationship between 2001 PSSA 11th grade math scale score and 2002 SAT math score divided into quintiles for the Class of 2002
HumRRO 17 April 2004
Outliers are hidden Extreme values are hidden
1 2 3 4 5
2003 SAT Math Scores Divided Into Quintiles
800
1000
1200
1400
1600
1800
2000
2002
PSS
A 1
1th
Gra
de M
ath
Scal
e Sc
ore
n=13337
n=14780
n=15184
n=14494
n=13186
2003 SAT Math Quintiles 1 - Below 410 2 - 410 to 480 3 - 480 to 530 4 - 530 to 600 5 - Above 600
Advanced
Proficient
Basic
Below Basic
Figure 8 Student-level relationship between 2002 PSSA 11th grade math scale scores and 2003 SAT math scores divided into quintiles for the Class of 2003
PSSA Reading Scale Score Versus SAT Reported Average Grade in English
Figure 9 and Figure 10 illustrate the relationship between the PSSA Reading scale scores and the grades students reported in the optional Student Descriptive Questionnaire (SDQ) portion of the SAT The SDQ asked students to report their average grade in English The available responses to this question were 0 ndash Failing 1 ndash Passing 2 ndash Fair 3 ndash Good or 4 ndash Excellent The category ldquoNo responserdquo indicates that the student did not respond to the question In 2002 8305 students did not respond to the English question In 2003 6170 students did not respond In 2002 13 students responded that their average English grade was ldquoFailingrdquo In 2003 6 students had this answer Students who did not respond and those who responded that their average grade was ldquoFailingrdquo were not included in the graphs As can be seen in Figure 10 scale scores in PSSA Reading tend to be higher for students reporting better performance in English coursework The preponderance of students reporting either a ldquoGoodrdquo or an ldquoExcellentrdquo English average scored in the Proficient or Advanced PSSA performance levels Additionally almost 90 of the students reported having either a ldquoGoodrdquo or ldquoExcellentrdquo average in English courses As previously noted self-reported data undoubtedly involves some inaccuracies however Cassady (2001) found studentsrsquo self-reported grades to be a reliable measure of actual grades
HumRRO 18 April 2004
2001
PSS
A 1
1th
Gra
de R
eadi
ng S
cale
Sco
re
2000
1800
1600
1400
1200
1000
800
600
Outliers are hidden Extreme values are hidden
n=27359
n=6538
n=23685
n=244
1 2 3 4
Student-Reported Average Grade for English on SAT Student Descriptive Questionnaire
Advanced
Proficient
Basic
Below Basic
Average Grade 1 - Passing 2 - Fair 3 - Good 4 - Excellent
Figure 9 Student-level relationship between 2001 PSSA 11th grade reading scale score and student-reported average English course grades on the Student Descriptive Questionnaire (SDQ) of the SAT for the Class of 2002
HumRRO 19 April 2004
Outliers are hidden Extreme values are hidden
1 2 3 4
Student-Reported Average Grade for English on SAT Student Descriptive Questionnaire
600
800
1000
1200
1400
1600
1800
2000
2200
2400
2002
PSS
A 1
1th
Gra
de R
eadi
ng S
cale
Sco
re
n=6065 n=26317 n=23397 n=249 Average Grade 1 - Passing 2 - Fair 3 - Good 4 - Excellent
Advanced
Proficient
Basic
Below Basic
Figure 10 Student-level relationship between 2002 PSSA 11th grade reading scale score and student-reported English course grades on the SAT Student Descriptive Questionnaire (SDQ) for the Class of 2003
PSSA Math Scale Score Versus SAT Reported Average Grade in Math
Figure 11 and Figure 12 illustrate the relationship between the PSSA 11th grade math scale scores and the grades students reported in the optional Student Descriptive Questionnaire (SDQ) portion of the SAT which students are asked to complete as part of registering for the SAT The SDQ asked students to report their average grade in math The available responses to this question were 0 ndash Failing 1 ndash Passing 2 ndash Fair 3 ndash Good or 4 ndash Excellent The category ldquoNo responserdquo indicates that the student did not respond to the question In 2002 8523 students did not respond to the math average grade question In 2003 6316 students did not respond In 2002 41 students responded that their average math grade was ldquoFailingrdquo In 2003 47 students had this answer Students who did not respond and those who responded that their average grade was ldquoFailingrdquo were not included in the graphs
HumRRO 20 April 2004
2001
PSS
A 1
1th
Gra
deM
ath
Scal
e Sc
ore 2000
1800
1600
1400
1200
1000
800
600
Outliers are hidden Extreme values are hidden
n=19993
n=11254 n=25509
n=970
1 2 3 4
Student-Reported Average Grade for Math on SAT Student Descriptive Questionnaire
Advanced
Proficient
Basic
Below Basic
Average Grade 1 - Passing 2 - Fair 3 - Good 4 - Excellent
Figure 11 Student-level relationship between 2001 PSSA 11th grade math scale score and student-reported average math course grades in the Student Descriptive Questionnaire (SDQ) of the SAT for the Class of 2002
HumRRO 21 April 2004
Outliers are hidden Extreme values are hidden
1 2 3 4
Student-Reported Average Grade for Math on SAT Student Descriptive Questionnaire
600
800
1000
1200
1400
1600
1800
2000
2002
PSS
A 1
1th
Gra
de M
ath
Scal
e Sc
ore
n=10370 n=24674
n=19835
n=1003
Advanced
Proficient
Basic
Below Basic
Average Grade 1 - Passing 2 - Fair 3 - Good 4 - Excellent
Figure 12 Student-level relationship between 2002 PSSA 11th grade math scale score and student-reported average math course grade in the SAT Student Descriptive Questionnaire (SDQ) for the Class of 2003
PSSA Scale Scores Versus SAT Reported Grade-Point Average
Figure 13 through Figure 16 illustrate relationships between PSSA scale scores and overall grade-point averages (GPAs) The GPAs are from the SATrsquos SDQ Students were asked to provide their GPA on a basic 4-point scale with pluses and minuses around each point (A+ = 43 A = 40 A- = 37 etc) Approximately 87 (60283 of 69325) of students in the Class of 2002 completed the GPA question in the SDQ and 83 (59258 of 71511) of students in the Class of 2003 completed the question The mean student-reported GPA was 333 (SD = 064) for the Class of 2002 and 335 (SD = 063) for the Class of 2003 The correlation for the 2001 PSSA 11th grade reading component with the 2002 GPA was 0501 For the 2001 PSSA 11th grade math component the correlation was 0539 For the 2002 PSSA the correlations were 0520 in Reading and 0553 in Math The box-plots for PSSA scale scores to GPA for both years and both tests performed as expectedmdashlower scores for lower GPAs and higher scores for higher GPAs Note that the median and boxes align fairly well with the appropriate performance levelsmdashA students in the Advanced and Proficient level B students generally in the Proficient level C students in the low Proficient and Basic levels and D students in the Basic level Note also that the number of students decreases sharply when the student-reported GPA drops below 30
HumRRO 22 April 2004
Outliers are hidden Extreme values are hidden
Advanced
Proficient
Basic
Below Basic
10 13 17 20 23 27 30 33 37 40 43
Student-reported GPA (4-point scale) on the 2002 SAT Student Descriptive Questionnaire (SDQ)
800
1000
1200
1400
1600
1800
2000
2001
PSS
A 1
1th
Gra
de R
eadi
ng S
cale
Sco
re
n=10261
n=5370 n=11810
n=11101 n=9668
n=4624
n=2381 n=3352
n=520 n=40
n=96
Figure 13 Student-level relationship between 2001 PSSA 11th grade reading scale score and student-reported grade-point average (GPA) from the SATrsquos Student Descriptive Questionnaire (SDQ) for the Class of 2002
HumRRO 23 April 2004
Outliers are hidden Extreme values are hidden
10 13 17 20 23 27 30 33 37 40 43 Student-reported GPA (4-point scale) on the 2003 SAT Student Descriptive Questionnaire (SDQ)
800
1000
1200
1400
1600
1800
2000
2002
PSS
A 1
1th
Gra
de R
eadi
ng S
cale
Sco
re
n=3304
n=10358
n=5089
n=11480
n=11507
n=9773
n=4602
n=2084 n=97 n=496 n=27
Advanced
Proficient
Basic
Below Basic
Figure 14 Student-level relationship between 2002 PSSA 11th Grade reading scale score and student-reported grade-point average (GPA) from the SATrsquos Student Descriptive Questionnaire (SDQ) for the Class of 2003
HumRRO 24 April 2004
Outliers are hidden Extreme values are hidden
10 13 17 20 23 27 30 33 37 40 43 Student-reported GPA (4-point scale) on the 2002 SAT Student Descriptive Questionnaire (SDQ)
800
1000
1200
1400
1600
1800
2000
2001
PSS
A 1
1th
Gra
de M
ath
Scal
e Sc
ore
n=10280
n=5391 n=11831
n=11123 n=9672
n=4635
n=2393 n=3377
n=526 n=42
n=97
Advanced
Proficient
Basic
Below Basic
Figure 15 Student-level relationship between 2001 PSSA 11th grade math scale score and student-reported grade-point average (GPA) from the SATrsquos Student Descriptive Questionnaire (SDQ) for the Class of 2002
HumRRO 25 April 2004
Outliers are hidden Extreme values are hidden
10 13 17 20 23 27 30 33 37 40 43 Student-reported GPA (4-point scale) on the 2003 SAT Student Descriptive Questionnaire (SDQ)
800
1000
1200
1400
1600
1800
2000
2002
PSS
A 1
1th
Gra
de M
ath
Scal
e Sc
ore
n=3319
n=10364
n=5091
n=11480
n=11514
n=9777
n=4600
n=2085 n=98
n=496
n=27
Advanced
Proficient
Basic
Below Basic
Figure 16 Student-level relationship between 2001 PSSA 11th grade math scale score and student-reported grade-point average (GPA) from the SATrsquos Student Descriptive Questionnaire (SDQ) for the class of 2002
HumRRO 26 April 2004
Differences in Performance for Demographic Groupings
Analyses were conducted to compare performance on the PSSA and SAT among students from varying backgrounds Average test performance tends to differ for students of differing genders ethnic groups and various measures associated with socioeconomic status The important question for judging bias on the PSSA is not whether specific groups show mean differences but whether those differences are larger for the PSSA than the differences observed on other measures of student achievement
Differences between measures of achievement can be captured in several ways This report will present two measures of mean differences First effect size statistics will be calculated for the differences between major categories of students (Coe 2002) The magnitude of the effect size statistics is less important than the difference between the effect sizes for PSSA compared to the other measures However measuring the magnitude of the gaps for NCLB-defined groups is instructive and important since all states are expected to make progress toward closing those gaps (No Child Left Behind 2004)
Effect size statistics can be interpreted as the average percentile standing of the average treated (or experimental) participant relative to the average untreated (or control) participant An effect size of 00 indicates that the mean of the treated group is at the 50th percentile of the control group An effect size of 08 indicates that the mean of the treated group is at the 79th
percentile of the control group An effect size of 17 indicates that the mean of the treated group is at the 955th percentile of the control group Cohen (1988) hesitantly defined effect sizes as ldquosmall d=2rdquo ldquomedium d=5rdquo and ldquolarge d=8rdquo He went on to caution against offering conventional operational definitions such as these in the diverse field of behavioral science
The second measure used to capture differences between measures of achievement was regression analysis Regression analysis was used to examine the extent to which PSSA differences in performance for various demographic groupings are similar to those found in SAT scores For each of the demographic groupings we calculated a regression equation to predict PSSA scores based on the matching SAT content score A second equation was created which added the specific demographic characteristic of interest If PSSA scores exhibit greater differences based on that demographic characteristic that characteristic will have a significant weight and there will be a meaningful increase in the prediction of the PSSA component score
Gender Differences
Table 12 presents performance means for males and females for the PSSA only This table provides information from the larger state population to use in comparison with the matched PSSA and SAT sample data The SAT-taking population can be expected to post higher means For all gender tables data is coded such that positive numbers indicate higher mean scores for males negative numbers indicate higher mean scores for females For the full population of PSSA takers the pattern of performance between males and females is consistent Males outscore females but only to a very small degree on the PSSA mathematics test for all three included years Females outscored males to a higher but still small degree on the PSSA reading test The differences between years are small and inconsistent This table shows that the gap in performance for both PSSA mathematics and reading between males and females is small and has not changed dramatically between 2001 and 2003
HumRRO 27 April 2004
Table 12 Gender Differences for PSSA (Unmatched State Data) Mean Scale Standard Number of Effect Size Year Subject Gender Score Deviation Cases d
Mathematics Male 130954 22870 56380
2001 Reading Female
Male Female
130288 127107 132719
21170 22731 20167
55496 56091 55280
0030
-0261 Mathematics Male 132475 23813 60777
2002 Reading Female
Male Female
130679 129478 133443
21694 22536 20034
59849 60686 59636
0079
-0186 Mathematics Male 132555 22198 63542
2003 Reading Female
Male 130434 129308
20680 24674
61849 63840
0099
Female 133974 22003 62020 -0200
Table 13 and Table 14 present data for the matched sample of students taking both PSSA and SAT by gender Scale scores for both assessments as well as studentsrsquo self-reported GPA are included in the tables The numbers of males versus females in the state student population is similar typically with a few more males than females per grade However many more females take the SAT tests suggesting that more females than males aspire to attend college Males outscored females by a small margin on the PSSA and the SAT mathematics tests This finding is consistent with scoring patterns on SAT and ACT reported by Willingham and Cole (1997) They suggest that as a rule females tend to avoid taking mathematics and science classes In an apparent inconsistency females outscored males on PSSA reading but not on SAT verbal Scores for SAT verbal were nearly identical for males and females Willingham and Cole found gender differences favoring females in writing skills The PSSArsquos performance-task items add a writing component that was not present in the SAT for the Classes of 2002 and 2003 However SAT will include a student-written essay beginning in spring 2005 This study found that females tended to have higher self-reported GPAs than males
Table 13 Gender Differences for Class of 2002 Matched Sample (2001 PSSA and 2002 SAT) Performance Standard Number of Effect SizeSubject Gender MeanMeasure Deviation Cases d
Mathematics Male 141925 20536 29403
PSSA Reading Female
Male Female
137503 137162 139420
19408 18761 16921
36530 29345 36451
0221
-0126 Mathematics Male 52273 11076 29787
SAT Verbal Female
Male 48821 50081
10527 10333
37042 29787
0319
Female 49582 10126 37042 0049
GPA Male Female
3243 3404
656
609 25323 32857 -0255
HumRRO 28 April 2004
Table 14 Gender Differences for Class of 2003 Matched Sample (2001 PSSA and 2002 SAT) Performance Mean Standard Number Effect Size Subject GenderMeasure Score Deviation of Cases d
Mathematics Male 145023 21049 31338
PSSA Reading Female
Male Female
138650 140570 140715
19790 17318 16427
38459 31328 38418
0312
-0009 Mathematics Male 52596 11067 31557
SAT Verbal Female
Male 48997 50524
10490 10235
38745 31557
0327
Female 49623 10097 38745 0089 Male 3265 653 25387GPA Female 3415 600 32925 -0239
Table 15 and Table 16 show regression results for adding gender as a predictor variable to the model for estimating PSSA scores based on SAT scores For both PSSA reading and math the regression weights for gender are negligible and the changes in R-square are essentially nonexistent Gender is coded such that the positive weight means that females tend to have higher reading and math scores than would be expected from gender differences in SAT verbal
Table 15 Regressions Results Showing the Adjusted Strength of Gender on Predicting 2001 PSSA 11th Grade Scale Scores Based on 2002 SAT Scores Standardized Coefficient
PSSA Component SAT Control Gender R2 Change in R2
due to Gender Reading 0704 0495 Reading 0706 +0081 0502 +0006 Math 0847 0717 Math 0851 +0025 0717 +0001
Table 16 Regressions Results Showing the Adjusted Strength of Gender on Predicting 2002 PSSA 11th Grade Scale Scores Based on 2003 SAT Scores Standardized Coefficient
PSSA Component SAT Control Gender R2 Change in R2
due to Gender Reading 0775 0601 Reading 0777 +0038 0602 +0001 Math 0865 0749 Math 0863 -0012 0749 0000
HumRRO 29 April 2004
Ethnic or Racial Differences
Table 17 presents performance means for the four major ethnic or racial groups3 (White Black HispanicLatino and Asian) for the PSSA only For these analyses the racialethnic categories reported with the PSSA data were used It should be noted that starting in 2003 the reported racialethnic categories were changed from those reported in 2001 and 2002 In 2003 the category of ldquoMixedrdquo was no longer included As a result those students previously selecting ldquoMixedrdquo were forced to select one of the other categories For the full population of PSSA takers the pattern of performance between these four groups is fairly consistent In mathematics Asians outscore all groups Whites outscore HispanicsLatinos and Blacks and HispanicsLatinos score between Blacks and Whites For Reading Asians and Whites score approximately the same and Blacks score almost one standard deviation lower than Whites However the score for HispanicsLatinos has shown a decrease over the three years of approximately 30 points This decrease has dropped the HispanicLatino group to below the mean Black group score The number of HispanicLatinos taking the PSSA has increased approximately 40 Blacks approximately 65 and Whites approximately 10 during that time as well
Table 17 EthnicRacial Differences for PSSA (Unmatched State Data) Hispanic Year Subject Measure White Black AsianLatino
2001
Mathematics
Reading
Mean SD
N Effect Size
Mean SD
N Effect Size
132481 21525 92185
131644 21066 91964
113596 17093 8274 0972
115158 20393 8117 0795
116757 18873 2954 0777
117025 21104 2924 0693
140820 24657 2489 -0360
132927 21707 2470 -0060
2002
Mathematics
Reading
Mean SD
N Effect Size
Mean SD
N Effect Size
133935 22098 97659
133917 20351 97428
114090 17626 10783 0993
114887 20070 10715 0942
116438 19041 3534 0848
116193 21155 3535 0854
143430 26757 2659 -0387
133711 22914 2655 0010
2003
Mathematics
Reading
Mean SD
N Effect Size
Mean SD
N
134059 20863
104064
134488 22411
104271
114619 16132 13669 1042
114796 21940 13871 0888
116389 17473 4106 0903
114052 22848 4158 0903
142013 23662 2865 -0357
134943 24743 2866 -0019
3 The racialethnic analyses were limited to these four groups because of the limited number of students in the other groups
HumRRO 30 April 2004
Table 18 and Table 19 present data for the matched sample of students taking both PSSA and SAT by ethnicity Scale scores for both assessments as well as studentsrsquo self-reported GPA are included in the tables In 2002 Asians (726) took the SAT tests at a much higher rate than any other group followed by Whites (608) Blacks (419) and HispanicsLatinos (364) The order remained the same in 2003 although all groups but Asians had a slightly lower percentage in 2002 than in 2003 This suggests that more Asians and Whites aspire to attend college than do Blacks or HispanicLatinos Scores on the PSSA SAT and GPA show the same order for the matched sample as for the total state sample for the PSSA Comparing the effect size for the PSSA versus the effect size for the SAT shows that the effect size for most groups in the Class of 2002 and components is approximately the same for the PSSA and the SAT The largest difference for Blacks is between the PSSA reading and the SAT verbal components (PSSA reading ndash 0883 and SAT verbal ndash 1011) Note also that the effect size for GPA is approximately half the effect size for the PSSA and SAT for Blacks and Hispanics However for Asians the GPA effect size is more similar to the effect size for math than it is for the SAT verbal or PSSA reading components
Table 18 EthnicRacial Differences for the Class of 2002 Matched Sample (2001 PSSA 11th
Grade and 2002 SAT) Performance Hispanic Subject Measure White Black AsianMeasure Latino
PSSA
Mathematics
Reading
Mean SD
N Effect Size
Mean SD
N Effect Size
140809 19272 56063
139658 17004 56017
120809 17759 3735 1079
123658 19180 3678 0883
128529 19483 1076 0634
129112 19199 1064 0582
146256 22812 1808 -0258
138040 19183 1807 0089
SAT
Mathematics
Verbal
Mean SD
N Effect Size
Mean SD
N Effect Size
51041 10409 56693
50476 9670
56693
40286 10268 3872 1040
40619 9836 3872 1011
44332 11082 1096 0624
44378 10964 1096 0590
54820 13077 1838 -0320 49547 13308 1838 0080
GPA
Mean SD
N Effect Size
3364 0621
49617
2940 0667 3337 0658
3126 0640 871
0377
3491 0615 1616 -0205
HumRRO 31 April 2004
Table 19 EthnicRacial Differences for the Class of 2003 for Matched Sample (2002 PSSA 11th
Grade and 2003 SAT) Performance HispanicSubject Measure White Black AsianMeasure Latino
Mean 142999 122766 129030 150221
Mathematics SD N
19659 59076
18097 4516
19834 1178
24869 1951
PSSA Effect Size Mean 142157
1071 125012
0707 129610
-0322 139776
Reading SD N
15746 59038
17622 4500
18763 1184
20264 1951
Effect Size 1026 0724 0131 Mean 51440 39999 43626 55739
Mathematics SD N
10295 59443
9997 4573
10967 1206
12831 1970
SAT Effect Size Mean 50834
1128 40568
0735 43851
-0370 50166
Verbal SD N
9539 59443
9913 4573
10745 1206
13163 1970
Effect Size 1055 0687 0058 Mean 3385 2933 3175 3538
GPA Mathematics SD N
0610 49511
0666 3799
0641 935
0595 1608
Effect Size 0708 0336 -0254
Table 20 through Table 23 show regression results for adding raceethnicity (White versus Black and White versus HispanicLatino) as a predictor variable to the model for estimating PSSA scores based on SAT scores For both PSSA reading and math the regression weights for raceethnicity are negligible and the changes in R-square are essentially nonexistent Raceethnicity is coded such that the negative weight means that Blacks or HispanicsLatinos tend to have lower reading and math scores than would be expected from ethnicity differences in SAT verbal
Table 20 Regressions Results Showing the Adjusted Strength of Being Black on Predicting 2001 PSSA 11th Grade Scale Scores Based on 2002 SAT Scores Standardized Coefficient
PSSA Component SAT
Control Black R2 Change in R2
due to being Black
Reading 0699 0489 Reading 0686 -0059 0493 +0003 Math 0843 0711 Math 0833 -043 0713 +0002
HumRRO 32 April 2004
Table 21 Regressions Results Showing the Adjusted Strength of Being Black on Predicting 2002 PSSA 11th Grade Scale Scores Based on 2003 SAT Scores Standardized Coefficient
PSSA Component SAT
Control Black R2 Change in R2
due to being Black
Reading 0769 0591 Reading 0750 -0068 0595 0004 Math 0863 0745 Math 0857 -0021 0746 0000
Table 22 Regressions Results Showing the Adjusted Strength of Being HispanicLatino on Predicting 2001 PSSA 11th Grade Scale Scores Based on 2002 SAT Scores Standardized Coefficient
PSSA Component SAT
Control HispanicLatino R2 Change in R2
due to being HispanicLatino
Reading 0687 0472 Reading 0685 -0026 0473 +0001 Math 0837 0700 Math 0836 -0014 0700 0000
Table 23 Regressions Results Showing the Adjusted Strength of Being HispanicLatino on Predicting 2002 PSSA 11th Grade Scale Scores Based on 2003 SAT Scores Standardized Coefficient
PSSA Component SAT
Control HispanicLatino R2 Change in R2
due to being HispanicLatino
Reading 0754 0568 Reading 0050 -0034 0569 +0001 Math 0857 0735 Math 0856 -0009 0735 0000
Economically Disadvantaged Differences
Table 24 presents performance means for those students identified as economically disadvantaged for the PSSA only This table provides information from the larger state population to use in comparison with the matched PSSA and SAT sample data The SAT-taking population can be expected to post higher means For the full population of PSSA takers the pattern of performance between males and females is consistent Noneconomically disadvantaged students outscore economically disadvantaged student to a large degree on all components and all years except 2001 when it was a medium degree The number of students identified more than doubled between 2001 and 2002 and increased an additional 40 in 2003
HumRRO 33 April 2004
Table 24 Differences for Economically Disadvantaged Students for PSSA (Unmatched State Data)
Year Subject Economically Disadvantaged
Mean Scale Score
Standard Deviation
Number of Cases
Effect Size d
2001 Mathematics
Reading
Yes No Yes No
118647 131377 118918 130564
18977 22014 21142 21570
8805 107332 8702
106864
0619
0545
2002 Mathematics
Reading
Yes No Yes No
116604 133857 116380 133704
18913 22497 20914 20617
17253 106297 17199 106035
0830
0834 Yes 118211 17997 24022Mathematics No 134575 21063 102919 08352003 Yes 116747 22817 24290Reading No 135050 22319 103137 0811
Table 25 Differences for Economically Disadvantaged Students for Matched Sample for the Class of 2002 (2001 PSSA 11th Grade and 2002 SAT)
Performance Economically Mean Standard Number Effect Measure Subject Disadvantaged Score Deviation of Cases Size
d
PSSA Mathematics
Reading
Yes No Yes No
130598 139668 131768 138535
18830 20044 18336 17829
2893 65296 2863 65176
0466
0374
SAT Mathematics
Verbal
Yes No Yes No
45185 50491 44694 49953
10399 10912 10131 10215
2926 66399 2926 66399
0498
0517
GPA Yes No
3195 3334
0661 0636
2561 57722 0214
HumRRO 34 April 2004
Table 26 Differences for Economically Disadvantaged Students for Matched Sample for the Class of 2003 (2002 PSSA 11th Grade and 2003 SAT) Performance
Measure Subject Economically Disadvantaged
Mean Score
Standard Deviation
Number of Cases
Effect Size d
PSSA Mathematics
Reading
Yes No Yes No
127741 142707 128169 141742
19474 20278 18498 16243
5822 65159 5812 65114
0753
0780
SAT Mathematics
Verbal
Yes No Yes No
42412 51341 42100 50748
10746 10616 10491 9845
5907 65604 5907 65604
0836
0850 Yes 3116 0680 4854GPA No 3369 0620 54404 0389
Table 27 Regressions Results Showing the Adjusted Strength of Being Economically Disadvantaged on Predicting 2001 PSSA 11th Grade Scale Scores Based on 2002 SAT Scores Standardized Coefficient
Change in R2
SAT Economically due to beingPSSA Component R2 Control Disadvantaged Economically
Disadvantaged Reading 0704 0495 Reading 0703 -0004 0495 0000 Math 0846 0715 Math 0845 -0009 0715 0000
Table 28 Regressions Results Showing the Adjusted Strength of Being Economically Disadvantaged on Predicting 2002 PSSA 11th Grade Scale Scores Based on 2003 SAT Scores Standardized Coefficient
SAT Change in R2
PSSA Component Control Economically Disadvantaged R2 due to being
Economically Disadvantaged
Reading 0775 0601 Reading 0765 -044 0602 0002 Math 0865 0749 Math 0864 -0005 0749 0000
Annual Family Income Differences
Camara and Schmidt (1999) point out that family income is related to performance on tests such as the SAT I They also point out that this finding is not unique to the SAT I or college admissions tests Terenzini Cabrera and Bernal (2001) also examined various differences in educational outcomes associated with varying levels of socioeconomic status (SES) This report
HumRRO 35 April 2004
examines differences associated with family income in this section The following section shows differences in student performance related to parental education level Terenzini Cabrera and Bernal (2001) and Camara and Schmidt (1999) point out differences between income wealth and SES
Because annual family income data comes from the SDQ of the SAT only matched student data can be presented showing relationships with family income Table 29 (Class of 2002) and Table 30 (Class of 2003) show student performance on the PSSA SAT and GPA versus four levels of family income As the table clearly shows student scores increase on all performance measures as income goes up However the effect size for GPA is about half of the effect size for either of the assessments The effect size for the PSSA is similar although slightly less than the effect size for the SAT for both components and both years
Table 29 Annual Family Income Differences for Matched Sample for the Class of 2002 (2001 PSSA 11th Grade and 2002 SAT)
Income Level Performance Subject MeasureMeasure $25000 to $40000 tolt $25000 gt $70000$40000 $70000
PSSA
Math
Reading
Mean SD
N Effect Size
Mean SD
N Effect Size
129900 19108 6658
131011 18466 6594
135381 18361 8709 -0293
136210 17165 8693 -0292
139702 18899 16365 -0516
138848 17110 16348 -0440
145045 20032 14902 -0774
142093 16921 14867 -0626
SAT
Math
Verbal
Mean SD
N Effect Size
Mean SD
N Effect Size
44665 10594 6822
44469 10177 6822
47766 10013 8856 -0301 47619 9546 8856 -0319
50272 10136 16549 -0541 49796 9485
16549 -0542
53816 10580 15122 -0864 52825 9815
15122 -0836
GPA
Mean SD
N Effect Size
3173 0656 6596
3262 0636 8607 -0138
3344 0631 16141 -0266
3412 0628
14726 -0372
HumRRO 36 April 2004
Table 30 Annual Family Income Differences for Matched Sample for the Class of 2003 (2002 PSSA 11th Grade and 2003 SAT)
Income Level Performance Subject MeasureMeasure $25000 - $40000 -lt $25000 gt $70000$40000 $70000
Mean 131577 136393 140924 147093
Math SD N
19401 6230
19051 7958
19319 14963
20560 14295
PSSA Effect Size Mean 132698
-0250 137311
-0483 140572
-0776 144569
Reading SD N
17576 6232
16201 7948
15919 14958
15965 14284
Effect Size -0273 -0470 -0707 Mean 44871 47689 50075 53965
Math SD N
10562 6304
10140 8010
10089 15045
10567 14388
SAT Effect Size Mean 44793
-0272 47581
-0504 49653
-0861 52905
Verbal SD N
10345 6304
9578 8010
9354 15045
9689 14388
Effect Size -0280 -0493 -0809 Mean 3188 3279 3357 3428
GPA SD N
0652 6115
0642 7832
0623 14659
0617 14000
Effect Size -0141 -0265 -0378
Parent Educational Differences
Camara and Schmidt (1999) also looked at the impact of parent education on student performance in standardized testing Their study showed that parental education is related to performance on the SAT I Higher parental education is associated with higher scores on the SAT I Table 31 and Table 32 show the means standard deviations number of students and effect size for various levels of student-reported motherrsquos education for the PSSA SAT and GPA The analyses indicate that the effect size for both assessments and GPA are larger as the motherrsquos educational level increases The effect size for PSSA is not as large as the effect size for SAT The effect size for GPA is about half of the effect size for PSSA or SAT Table 33 and Table 34 provide the same information regarding the fatherrsquos education level The results follow the same pattern as that for motherrsquos education level
HumRRO 37 April 2004
Table 31 Mothers Education Level Differences for Matched Sample for the Class of 2002 (2001 PSSA 11th Grade and 2002 SAT)
Subject Measure lt High School
High School
Some College
BABS Degree
Graduate Degree
Mean 128855 135908 138212 145789 148095
Math SD N
18785 2196
18542 18737
19161 16804
19982 12094
20688 6259
PSSA Effect Size Mean 129039
-378 135883
-0493 137803
-0873 143360
-0974 144735
Reading SD N
17886 2189
17134 18696
17441 16762
16733 12078
16981 6245
Effect Size -0377 -0495 -0883 -0985 Mean 43795 48049 49574 54133 55639
Math SD N
10476 2247
10021 18986
10429 17075
10547 12291
10924 6357
SAT Effect Size Mean 42614
-0415 47405
-0553 49277
-0983 53512
-1107 55072
Verbal SD N
99852247
929118986
963517075
9856 12291
10300 6357
Effect Size -0497 -0679 -1099 -1228 Mean 3142 3267 3289 3456 3504 SD 0653 0630 0640 0618 0601 GPA N 2145 18341 16424 11914 6150
Effect Size -0195 -0227 -0494 -0577
Table 32 Mothers Education Level Differences for Matched Sample for the Class of 2003 (2002 PSSA 11th Grade and 2003 SAT)
lt High High Some BABS GraduateSubject Measure School School College Degree Degree Mean 129723 137323 140038 148027 150140 SD 19513 18746 19865 20474 22494 Math N 2072 17801 16646 11406 5961
Effect Size -0397 -0524 -0915 -0970PSSA Mean 129022 137751 139799 145748 147071 SD 18092 16042 16241 15951 16272 Reading N 2066 17787 16638 11406 5954
Effect Size -0511 -0627 -0981 -1059 Mean 43631 48106 49738 54411 55641
Math SD N
10494 2095
10046 17922
10387 16756
10467 11496
11305 5992
SAT Effect Size Mean 42549
-0436 47592
-0585 49432
-1029 53618
-1101 55050
Verbal SD N
10124 2095
925417922
954716756
9795 11496
10522 5992
Effect Size -0520 -0700 -1111 -1211 Mean 3148 3285 3307 3475 3510
GPA SD N
0646 2003
0622 17344
0636 16134
0608 11088
0599 5797
Effect Size -0216 -0248 -0521 -0581
HumRRO 38 April 2004
Table 33 Fathers Education Level Differences for Matched Sample for the Class of 2002 (2001 PSSA 11th Grade and 2002 SAT)
Subject Measure lt High School
High School
Some College
BABS Degree
Graduate Degree
Mean 128908 135041 138368 144843 150072
Math SD N
18443 2850
18251 17616
18721 14573
19645 12461
20736 7835
PSSA Effect Size Mean 129571
-0334 135453
-0509 137985
-0836 142352
-1079 145994
Reading SD N
18191 2289
17066 17558
17291 14539
16798 12454
16661 7838
Effect Size -0333 -0474 -0730 -0942 Mean 43958 47510 49626 53651 56759
Math SD N
10229 2915
992617845
10116 14800
10368 12636
10727 7980
SAT Effect Size Mean 43245
-0352 47058
-0557 49210
-0941 52830
-122 56114
Verbal SD N
97782915
921217845
947514800
9571 12636
10128 7980
Effect Size -0401 -0620 -0991 -1293 Mean 3136 3247 3301 3432 3548 SD 0637 0634 0633 0618 0594 GPA N 2784 17269 14263 12198 7723
Effect Size -0175 -0260 -0472 -0669
Table 34 Fathers Education Level Differences for Matched Sample for the Class of 2003 (2002 PSSA 11th Grade and 2003 SAT)
lt High High Some BABS GraduateSubject Measure School School College Degree Degree Mean 131197 136533 140022 147183 152503 SD 19107 18733 19163 20247 22047 Math N 2766 16981 14422 11633 7272
Effect Size -0282 -0461 -0812 -1033PSSA Mean 130955 137222 140037 144765 148752 SD 17715 15901 15980 15990 16014 Reading N 2761 16968 14412 11629 7265
Effect Size -0372 -0538 -0818 -1054 Mean 44505 47569 49772 53911 57115
Math SD N
10230 2803
9938 17087
10023 14508
10352 11709
11009 7314
SAT Effect Size Mean 43701
-0304 47224
-0520 49499
-0914 52920
-1187 56296
Verbal SD N
9887 2803
919517087
931014508
9580 11709
10294 7314
Effect Size -0369 -0604 -0947 -1248 Mean 3139 3272 3316 3454 3558
GPA SD N
0639 2696
0624 16545
0632 14014
0606 11281
0582 7046
Effect Size -0211 -0279 -0506 -0686
HumRRO 39 April 2004
Limited English Proficiency Differences
Students identified as having limited English proficiency (LEP) would be expected to have more difficulty taking a test in English than those not identified As a result of these difficulties LEP students would be expected to have lower scores than non-LEP students Table 36 shows the mean standard deviation number of students and the effect size for the entire state on the PSSA in 2001 and 2002 As expected LEP students have lower scores than non-LEP students on both components and effect sizes are generally large However the math component effect size is only about half of the effect size for reading
Table 35 Limited English Proficiency Differences for 11th Grade PSSA (Unmatched State Data) Limited EffectMean Scale Standard NumberYear Subject English Size Score Deviation of CasesProficiency d
Yes 115312 18977 492Math No 130476 22047 115645 07372001 Yes 106216 15338 473Reading No 129784 21727 115093 1253 Yes 116560 20254 844Math No 131550 22812 122706 06952002 Yes 102618 16138 840Reading No 131483 21413 122394 1522
Table 36 and Table 37 show the mean standard deviation number of cases and effect size for the matched sample of students in the Classes of 2002 and 2003 The effect sizes are similar to those in the state sample for the PSSA and SATmdashvery larger in verbalreading and medium in math The effect size is slightly larger for PSSA than SAT in math but slightly smaller for PSSA than SAT in readingverbal However the GPA for LEP students is actually slightly higher than the GPA for non-LEP students
Table 36 Limited English Proficiency Differences for Matched Sample for the Class of 2002 (2001 PSSA 11th Grade and 2002 SAT)
LimitedPerformance Standard Number Effect Size Subject English Mean ScoreMeasure Deviation of Cases dProficiency Yes 125974 19661 134Math No 139310 20070 68055 0671PSSA Yes 113745 14649 132Reading No 138297 17876 67907 1502 Yes 42860 13045 136Math No 50282 10934 69189 0617SAT Yes 33353 9807 136Verbal No 49764 10241 69189 1637 Yes 3393 0617 111GPA No 3328 0637 60172 -0104
HumRRO 40 April 2004
Table 37 Limited English Proficiency Differences for Matched Sample for the Class of 2003 (2002 PSSA 11th Grade and 2003 SAT)
LimitedPerformance Mean Standard Number Effect Size Subject EnglishMeasure Score Deviation of Cases dProficiency Yes 126815 20257 289Mathematics No 141539 20607 70692 0721PSSA Yes 109386 15855 288Reading No 140757 16741 70638 1924 Yes 41564 12159 291Mathematics No 50641 10887 71220 0787SAT Yes 32526 8775 291Verbal No 50105 10126 71220 1855 Yes 3358 585 226GPA No 3348 629 59032 -0008
The regression analyses results (Table 38 and Table 39) show that there are negligible changes in R square for predicting PSSA from SAT scores when adding LEP to the equation for both reading and math for both classes
Table 38 Regressions Results Showing the Adjusted Strength of Being Limited English Proficient on Predicting 2001 PSSA 11th Grade Scale Scores Based on 2002 SAT Scores
Standardized Coefficient Change in R2
SAT Limited English due toPSSA Component R2 Control Proficiency Limited English
Proficiency Reading 0704 0495 Reading 0703 -0011 0495 0000
Math 0846 0715 Math 0845 -0004 0715 0000
Table 39 Regressions Results Showing the Adjusted Strength of Being Limited English Proficient on Predicting 2002 PSSA 11th Grade Scale Scores Based on 2003 SAT Scores
Standardized Coefficient Change in R2
PSSA Component SAT Control
Limited English Proficiency R2 due to
Limited English Proficiency
Reading 0775 0601 Reading 0771 -0033 0602 +0001
Math 0865 0749 Math 0865 0000 0749 0000
HumRRO 41 April 2004
School-Level Scores Means were calculated by school for all scale scores and grade indicators to analyze
school-level results School-level descriptive statistics are presented for the Classes of 2002 and 2003 for the PSSA (Table 40) SAT (Table 41) and GPA and course grades (Table 42) Only schools with at least 10 students with merged PSSA and SAT scores are included in the analyses School-level means showed an increase on both tests both test components GPA and course grades from the Class of 2002 to the Class of 2003 The change in scoring procedures from the 2001 PSSA to the 2002 PSSA (instituting a minimum score of 700 for the 2002 PSSA) is problematic However there were only 9 students in this college-bound sample in the Class of 2003 who scored a 700 on the 2002 PSSA reading component and no students who scored a 700 on the math component The change in course grades was extremely small
Table 40 PSSA School-Level Descriptive Statistics for the Classes of 2002 and 2003 Subject Measure Class of 2002 Class of 2003 Reading Mean 136973 139316
SD 7435 7088 N 586 586
Math Mean 136966 139333 SD 8335 8496
N 586 586 Limited to schools with at least 10 students with merged PSSA and SAT scores
Table 41 SAT School-Level Descriptive Statistics for the Classes of 2002 and 2003 Subject Measure Class of 2002 Class of 2003 Verbal Mean 48578 48907
SD 4207 4251 N 586 586
Math Mean 48847 49159 SD 4500 4601
N 586 586 Limited to schools with at least 10 students with merged PSSA and SAT scores
HumRRO 42 April 2004
Table 42 School-Level Descriptive Statistics GPA and Course Grades for the Classes of 2002 and 2003
Subject Measure Class of 2002 Class of 2003 GPA Mean 334 346
SD 019 019 N 586 586
English Mean SD
329 020
331 021
N 586 586 Math Mean 311 312
SD 021 022 N 586 586
Limited to schools with at least 10 students with merged PSSA and SAT scores
Average Within-Year School-Level Correlations
Table 43 and Table 44 present correlations among these school-level scores Table 45 presents correlations for the average across the two years4 As Hoffman (1998) pointed out there is a tendency for correlations among school scores to be higher than correlations among student-level scores (Class of 2002 - Table 8 Class of 2003 - Table 9 and average for the Classes of 2002 and 2003 - Table 10) This is the case except for those correlations involving GPA and course-grades (except for PSSA reading to math course grade and GPA to English course grade where school-level correlations are higher)
As Hoffman (1998) pointed out the lower school-level correlations for GPA suggests that grading scales are not equivalent across schools There is a tendency for different schools to grade differently As a result at the school level of analysis there is a weaker relationship between GPA and either PSSA or ACT scores When studentsrsquo scores are averaged at the school level observed differences are related not only to differing levels of student achievement but to the particular schoolrsquos grading practices However the school-level relationship between GPA and course grades remains strong for both PSSA and SAT
4 Average correlations were technically corrected with Fisherrsquos r to z transformations
HumRRO 43 April 2004
Table 43 School-Level PSSA SAT and Course Grade Correlations for the Class of 2002 PSSA SAT Course Grades
Variable Reading Math Verbal Math GPA (Total) English Math
ReadingPSSA
Math
1000
0861 1000
Verbal SAT
Math
0818 0883
0773 0935
1000
0941 1000
GPA
English Course
Grades Math
0413 0393
0411 0391
0423 0454
0371 0376
0359 0362
0416 0450
1000
0778 1000
0719 0542 1000 Limited to schools with at least 10 students with merged PSSA and SAT scores
Table 44 School-Level PSSA SAT and Course Grades Correlations for the Class of 2003 PSSA SAT Course Grades
Variable Reading Math Verbal Math GPA (Total) English Math
ReadingPSSA
Math
1000
0870 1000
Verbal SAT
Math
0905 0849
0868 0915
1000
0943 1000
GPA
English Course
Grades Math
0491 0443
0442 0394
0501 0489
0439 0425
0402 0394
0484 0486
1000
0780 1000
0784 0615 1000 Limited to schools with at least 10 students with merged PSSA and SAT scores
HumRRO 44 April 2004
Table 45 School-Level PSSA SAT and Course Grades Correlation Averages for the Class of 2002 and 2003
PSSA SAT Course Grades
Variable Reading Math Verbal Math GPA (Total) English Math
ReadingPSSA
Math
1000
0866 1000
Verbal SAT
Math
0868 0867
0826 0926
1000
0942 1000
GPA
English Course
Grades Math
0453 0418
0427 0393
0463 0472
0406 0401
0381 0378
0451 0468
1000
0779 1000
0753 0580 1000 Limited to schools with at least 10 students with merged PSSA and SAT scores
Table 46 shows that the mean school-level scores for both PSSA 11th grade reading and SAT verbal components of each assessment increased from the Class of 2002 to the Class of 2003 For the SAT the mean school-level change on the verbal component was +330 scale score points For the PSSA the mean school-level scale score change on the 11th grade reading component was +2343 scale score points Table 47 shows the fairly strong relationship between the differences in mean school-level scores on the SAT verbal component and the PSSA reading component for the Classes of 2002 and 2003 This relationship is graphically portrayed in Figure 17 Table 48 Table 49 and Figure 18 show the same information for the math components of the PSSA and SAT As would be expected the relationship between the math components is stronger than for the readingverbal components
Table 46 Difference in Mean School-Level SAT Verbal and PSSA Reading Scores From the Classes of 2002 and 2003
Difference in Mean School-Level Score From the Standard Number ofMeanClass of 2002 and Class of 2003 Deviation Schools SAT Verbal +330 1673 586
PSSA Reading +2343 4660 586 Limited to schools with at least 10 students with merged PSSA and SAT scores
Table 47 Correlation of Difference in School-Level Mean SAT Verbal Score and PSSA Reading Score Between the Classes of 2002 and 2003
Difference in Mean School-Level Score From the SAT PSSA Class of 2002 and Class of 2003 Verbal Reading
SAT Verbal 1
PSSA Reading 462 1
HumRRO 45 April 2004
-200 -100 0 100 200
Difference in School-Level PSSA Reading Mean Score between the Class of 2002 and Class of 2003
-100
-50
0
50
100
Diff
eren
ce in
Sch
ool-L
evel
SA
T V
erba
l Mea
n Sc
ore
betw
een
Cla
ss o
f 200
2 an
d C
lass
of 2
003
$
$$
$
$
$
$$
$
$$
$
$
$
$
$
$
$
$$
$
$
$
$
$
$
$
$
$
$
$
$
$
$$
$
$
$
$
$
$
$
$
$
$ $
$$
$
$
$
$
$
$
$
$$
$
$$
$ $
$$$ $$
$
$
$
$
$
$
$
$
$
$
$
$
$
$$
$
$
$
$$
$$
$$$
$
$$
$
$
$$
$$
$
$
$
$
$
$
$
$
$
$$$
$$$
$
$
$
$
$
$$
$$
$
$$
$
$
$
$
$
$
$
$
$
$
$
$
$
$
$
$
$
$ $
$$
$
$$$ $$
$
$$$
$$
$
$
$
$
$
$
$
$$
$$
$
$
$
$
$
$
$
$
$
$$
$$
$
$$
$
$
$$
$
$
$
$$
$
$$
$
$$
$
$
$
$
$
$
$
$
$
$
$$
$
$$
$$
$
$$$$
$$
$$
$
$$
$
$
$
$
$$
$
$
$
$$
$
$ $$$
$
$ $$
$
$
$
$$
$
$$
$
$
$
$ $$$
$$
$$
$
$ $
$
$
$$
$
$
$
$
$
$
$$
$
$
$ $
$
$
$
$
$$
$
$
$$
$
$
$
$ $$
$
$
$ $
$$
$
$
$
$
$
$
$
$
$
$
$$
$
$
$$ $
$
$
$
$$
$
$
$$ $
$
$
$
$
$
$
$
$
$
$
$
$
$ $
$
$$
$
$$
$
$
$
$
$
$$
$
$
$
$
$
$
$
$
$$
$
$$
$
$
$$$ $
$
$
$$
$$
$
$$
$
$
$ $$ $
$ $
$$
$
$
$$$$
$
$$$
$
$$
$
$
$
$ $
$
$
$
$
$ $$
$
$
$
$
$
$ $
$ $ $
$
$
$
$
$$
$
$
$
$
$
$
$
$ $
$
$$
$
$$ $
$
$
$
$
$
$
$
$ $
$$
$
$
$
$
$
$
$
$$
$
$$
$
$
$
$
$$
$
$
$
$$
$$
$
$
$ $$$
$
$
$
$
$
$
$$$$
$
$$
$
$
$$
$
$$
$
$
$
$$$
$
$$
$
$
$
$
$$
$$
$
$
$
$$
$
$$
$$
$$
$
$
$
$
$$
$
$
$
$$
$
$
$
$
$
$$
$
$
$
$
$$
$
$
$
$
$
$
$$
$$
Figure 17 Scatterplot of difference in school-level SAT verbal mean scores and school-level PSSA 11th grade reading mean scores between the Class of 2002 and Class of 2003
Table 48 Difference in Mean School-Level SAT Math and PSSA Math Scores From the Class of 2002 and Class of 2003
Difference in Mean School-Level Math Score From the Class of 2002 and Class of 2003 Mean Standard
Deviation Number of
Schools
SAT +313 1842 586
PSSA +2367 4687 586 Limited to schools with at least 10 students with merged PSSA and SAT scores
HumRRO 46 April 2004
Table 49 Correlation of Difference in School-Level Mean SAT Math Score and PSSA Math Score Between the Classes of 2002 and 2003
Difference in Mean School-Level Math Score From the Class of 2002 and Class of 2003 SAT PSSA
SAT 1
PSSA 644 1
-200 -100 0 100 200
Difference in School-Level PSSA Math Mean Scale Score between the Class of 2002 and Class of 2003
-100
-50
0
50
100
Diff
eren
ce i
n Sc
hool
-Lev
el S
AT
Mat
h M
ean
Scor
e
betw
e en
the
Clas
s of
200
2 an
d Cl
ass
of 2
003
$
$$ $
$
$$
$
$$
$
$
$$
$
$
$$ $$
$
$
$
$
$
$
$
$
$$$
$
$
$$$
$
$
$
$
$
$
$$
$
$
$
$
$
$
$
$
$$$ $
$
$$
$
$
$
$
$$ $$
$$
$
$
$
$
$
$
$
$$
$
$$
$
$$
$
$
$
$
$ $$$
$
$
$
$
$
$
$
$$
$
$
$
$$
$
$
$
$
$
$ $
$$
$
$
$
$$
$
$$
$
$
$
$
$
$
$
$
$
$$
$
$$
$$
$
$
$
$
$
$$
$
$
$$
$
$
$
$$
$
$
$
$
$
$
$
$
$
$
$
$
$
$
$
$
$$
$
$
$$ $
$
$
$
$
$$
$
$
$
$
$
$
$
$
$
$
$
$
$
$
$
$
$
$
$$
$
$
$
$
$
$
$
$
$
$
$$
$
$
$
$
$$$
$
$
$
$
$
$
$ $$
$
$
$
$
$$
$
$
$
$
$
$$$
$
$
$$$
$
$
$
$
$$
$
$
$$
$
$
$$$
$
$
$
$
$
$
$$$
$
$
$
$
$$
$
$
$
$
$
$
$
$ $
$
$
$
$
$
$
$
$
$
$
$
$
$
$
$
$
$
$
$
$
$
$$$$
$$
$$
$
$$$
$$
$
$$
$
$
$
$
$
$
$
$$
$
$$
$
$
$
$
$
$$
$
$
$
$
$
$$
$
$$
$
$
$$
$
$
$
$
$
$
$
$
$
$
$ $
$
$
$
$
$$
$
$$$ $
$
$
$
$
$
$ $
$$
$
$$
$
$
$$
$ $
$$
$
$
$
$
$
$
$
$
$
$
$
$$
$
$
$
$
$
$
$
$ $
$$
$
$
$
$
$$ $
$
$$
$
$$
$$
$
$
$
$
$
$
$
$
$
$
$$
$
$$
$
$
$$
$
$
$
$
$$
$$
$$$
$$
$
$
$
$$
$
$$
$
$$
$
$
$
$
$
$
$
$
$
$
$
$
$ $$
$
$
$
$
$$
$
$
$
$$
$
$
$
$
$$
$
$$$$
$
$
$
$$$ $
$
$$
$
$
$
$
$
$$
$
$
$$
$$
$ $ $
$
$
$
$
$$
$
$$
$$
$
$
$
$$
$
$
$
$$
$
$
$
$
$
$
$
$$
$
$
$$
$
$
$
Figure 18 Scatterplot of differences in school-level mean SAT math score and school-level mean PSSA math scores between the Classes of 2002 and 2003
Pooled Within-School Correlations
The above discussion alluded to school-level factors such as differences in grading practices which may be impacting observed correlations Figure 19 depicts an extreme version of such a situation Schools A B and C are clearly different in where their students lie with respect to PSSA or SAT scores but they are identical in terms of the grades their students
HumRRO 47 April 2004
receive Also within each school there is a relationship between grades and either PSSA scores or SAT scores However if a correlation were calculated using students from all schools without regard to school-level characteristics it would be zero
School A
School B PSSA or SAT Scores
School C
Grade Point Average (GPA)
Figure 19 Extreme hypothetical illustration of how mean differences among schools on PSSA or SAT scores that are not mirrored by differences in GPA can impact correlations (Ellipses represent students scores within each school)
Pooled within-school correlations are used to estimate relationships between measures calculated within schools and then averaged across all schools These pooled within-school correlations were calculated for each of the two years of data (Table 50 for the Class of 2002 and Table 51 for the Class of 2003) and then averaged across the two years (Table 52)5 The resulting average pooled within-school correlations are presented in Table 52
5 Again the technical r to z correction was used
HumRRO 48 April 2004
Table 50 Pooled Within-School Correlation for the Class of 2002 PSSA SAT Course Grades
Variable Reading Math Verbal Math GPA (Total) English Math
ReadingPSSA
Math
1000
0648 1000
Verbal SAT
Math
0693 0650
0569 0832
1000
0695 1000
GPA
English Course
Grades Math
0528 0573
0461 0412
0361 0542
0516 0559
0465 0402
0349 0541
1000
0703 1000
0668 0443 1000 Limited to schools with at least 10 students with merged PSSA and SAT scores
Table 51 Pooled Within-School Correlation for the Class of 2003 PSSA SAT Course Grades
Variable Reading Math Verbal Math GPA (Total) English Math
ReadingPSSA
Math
1000
0702 1000
Verbal SAT
Math
0757 0629
0666 0857
1000
0662 1000
GPA
English Course
Grades Math
0512 0564
0457 0405
0350 0541
0534 0679
0466 0414
0369 0548
1000
0698 1000
0667 0443 1000 Limited to schools with at least 10 students with merged PSSA and SAT scores
HumRRO 49 April 2004
Table 52 Pooled Within-School Correlation Averaged for Classes of 2002 and 2003 PSSA SAT Course Grades
Variable Reading Math Verbal Math GPA (Total) English Math
ReadingPSSA
Math
1000
0676 1000
Verbal SAT
Math
0727 0640
0620 0845
1000
0679 1000
GPA
English Course
Grades Math
0520 0569
0459 0409
0356 0542
0525 0569
0466 0408
0359 0546
1000
0701 1000
0668 0443 1000 Limited to schools with at least 10 students with merged PSSA and SAT scores
If differences between schoolsrsquo grading procedures are substantial and if within schools students with higher grades also have higher PSSA scores then the correlations in Table 52 will be higher than student correlations in Table 10 (student-level correlations averaged for the Classes of 2002 and 2003) The difference between the GPA correlations in Table 10 and Table 52 however are only marginally different (see Table 53) In nearly all cases the within-school correlations are higher However the range is relatively smallmdash0009 to 0039 for GPA 0176 to 0219 for English course grades and 0147 to 0237 for math course grades Thus grading differences among schools do appear to exist but the effect is small for studentsrsquo GPA but larger for both English and math course grades especially when compared to the matching assessment component (ie English course grade to PSSA reading and SAT verbal math course grade to PSSA math and SAT math)
HumRRO 50 April 2004
Table 53 Differences Between Student-Level Correlations and Pooled Within-School Correlations Averaged for the Classes of 2002 and 2003
GPA or Course Grade to Student-Level Pooled Within- Difference in Assessment Correlations School Correlations Correlations
GPA to PSSA Reading 0511 0520 0009
GPA to PSSA Math 0546 0569 0023
GPA to SAT Verbal 0494 0525 0031
GPA to SAT Math 0530 0569 0039
English to PSSA Reading 0240 0459 0219
English to PSSA Math 0226 0409 0183
English to SAT Verbal 0256 0466 0210
English to SAT Math 0232 0408 0176
Math to PSSA Reading 0202 0356 0154
Math to PSSA Math 0305 0542 0237
Math to SAT Verbal 0212 0359 0147
Math to SAT Math 0313 0546 0233
Comparison of the correlations in Table 52 to Table 10 can also be used to test a hypothesis about the relationship between PSSA and SAT performance It is suggested above that some schools might be working more successfully toward improving PSSA performance than others Again if these efforts are only tangentially affecting SAT scores then we might expect mean differences among schools on PSSA scores that are not mirrored by differences on SAT Within schools however we can still expect students who do better on PSSA to also have a tendency to do better on SAT Figure 20 provides an extreme illustration of this potential effect Comparing correlations between PSSA and SAT from Table 52 to Table 10 reveals no such trend (see Table 54) The differences are all small (-0020 to +0009) suggesting that there are no significant differences among schools in the average PSSA scores of their students that are not mirrored by differences in studentsrsquo SAT scores This conclusion is consistent with the earlier conclusion from the individual level data That is no strong methodological differences in skills requirements are evidenced
HumRRO 51 April 2004
SAT Scores
School A School B School C
PSSA Scale Scores
Figure 20 Extreme hypothetical illustration of how mean differences among schools on PSSA scores that are not mirrored by differences on SAT scores can impact correlations (Ellipses represent students scores within each school)
Table 54 Differences Between SAT and PSSA Components for Student-Level Correlations and Pooled Within-School Correlations Averaged for the Classes of 2002 and 2003
GPA or Course Grade to Student-Level Pooled Within- Difference in Assessment Correlations School Correlations Correlations
PSSA Reading to SAT Verbal 0742 0727 -0015
PSSA Reading to SAT Math 0690 0640 -0020
PSSA Math to SAT Verbal 0629 0620 +0009
PSSA Math to SAT Math 0856 0845 -0009
A third comparison can also be made with the pooled within-school correlations This concerns the intercorrelations within each assessment format The pooled within-school PSSA intercorrelation (Table 52) shows a very slight decrease from student-level PSSA correlations (Table 10) while the pooled within-school SAT intercorrelation (Table 52) shows a larger increase from the student-level SAT intercorrelations (Table 10) It is possible that this is due to an increased homogeneity for the pooled within-school results However Figure 21 presents an exaggerated illustration of another manner in which this difference might be obtained This pattern would yield higher correlations for all students than for students within a school and a higher correlation of school-level scores (school-level PSSA intercorrelation is 0866 school-level SAT intercorrelation is 0942 [both from Table 45]) than for student-level scores (student-level PSSA is 0686 student-level SAT intercorrelation is 0737 [both from Table 10]) Although small (see Table 55) this is the pattern of differences in correlations obtained for both PSSA intercorrelations and for SAT intercorrelations Note that the difference between the PSSA components is smaller than the difference between the SAT components The obtained pattern
HumRRO 52 April 2004
like that in Figure 21 but much less exaggerated could result from differences between schools in the population of their students from differences in instruction that impact PSSA and SAT test scores or both
Content
Area B School A
School B
School C
Content Area A
Figure 21 Exaggerated illustration of how mean differences among schools can increase overall correlations (Ellipses represent students scores within each school)
Table 55 Internal Differences between SAT and PSSA Components for Student-Level Correlations and Pooled Within-School Correlations Averaged for the Classes of 2002 and 2003
GPA or Course Grade to Student-Level Pooled With- Difference in Assessment Correlations School Correlations Correlations
PSSA Reading to PSSA Math 0686 0676 -0010
SAT Verbal to SAT Math 0737 0845 0108
Summary and Conclusion The purpose of this report is to explore the validity questions ldquoAre PSSA scores
appropriately related to other measures of educational achievementrdquo
The data presented in this report suggest the following main points
bull Students who do well on any of the assessments tend to do well on all of the assessmentsmdashPSSA SAT GPA or course grades
bull When schoolsrsquo means are calculated using only the SAT-taking population of students schools with high scores on SAT also have high PSSA scores GPA and course grades are also related to both PSSA and SAT although not as strongly as the relationship between the PSSA and SAT
HumRRO 53 April 2004
PSSA exhibits strong convergent validity coefficients Correlations are very high between PSSA and SAT PSSA is positively correlated with other measures of student achievement including course grades and GPA Gains on PSSA are reflective of changes on SAT at the school level All these data provide strong evidence in support of PSSA as a valid measure of student achievement
There are however a few clarifications and qualifications to these general conclusions but none that diminish the basic findings These clarifications and qualifications include the following
Changes in scores Both mean PSSA and SAT scores experienced an increase Changes between the two assessments are positively correlated Schools that have gained on one assessment tend to have also gained on the other assessment However the same relationship is also true for those schools that have decreased
PSSA and SAT are tied to different content domains use differently formatted items and were designed to serve very different purposes However it is clear from the data that students who tend to perform well on the PSSA can also be expected to perform well on the SAT and vice-versa It is clear from the data that schools that perform well on one test can be expected to perform well on the other It is also clear that schools that improve on one test can be expected to improve on the other
Discriminant validity At the student level and the school level the different assessments of mathematics achievement are more highly related to each other than to assessments of other subjects Students with high mathematics scores on one assessment will tend to do well on all other assessments but that tendency is most pronounced for other mathematics assessments The same holds for school scores There is a similar differentiation on readingverbal assessments at both the student and school level but not as pronounced as in mathematics
GPA shows positive relationships with both PSSA and SAT assessments at the student and school level but not as pronounced as the relationship between the two assessments This is interpreted as being due to differences in schoolsrsquo grading practices Grading practices apparently differ sufficiently to reduce school-level associations with PSSA and SAT scores
Neither gender race socioeconomic status nor limited English proficiency appear to influence the PSSA scores any more than would be expected based on observed differences for SAT scores In other words PSSA items are not injecting any unexpected gender racialethnic socioeconomic status or limited English proficiency bias
HumRRO 54 April 2004
References
Camara WJ amp Schmidt AE (1999) Group differences in standardized testing and social stratification (College Board Report No 99-5) New York College Entrance Examination Board
Campbell D T amp Fiske D W (1959) Convergent and discriminant validation by the multitrait-multimethod matrix Psychological Bulletin 56(2) 81-105
Cassady JC (2001) Self-reported GPA and SAT A Methodological Note Practical Assessment Research amp Evaluation 7(12)
Coe Robert (2002) Itrsquos the effect size stupid What effect size is and why itrsquos important Paper presented at the Annual Conference of the British Educational Research Association University of Exeter England Retrieved from httpwwwleedsacukeducoldocuments00002182htm
Cohen J (1988) Statistical power analysis for the behavioral sciences (2nd ed) Hillsdale NJ Erlbaum
Hoffman R G (1998) Relationships among Kentuckyrsquos open-response assessments ACT scores and studentsrsquo self-reported high school grades (HumRRO Report FR-WATSD-98-27) Radcliff KY Human Resources Research Organization
Lewis DM Mitzel HC amp Green DR (1996) Standard setting A bookmark approach Symposium presented at the Council of Chief State School Officers Conference on Large ndashScale Assessment Phoenix AZ
Livingston SA amp Zieky MJ (1978) Manual for setting standards on the Basic Skills Assessment Test Princeton NJ Educational Testing Service
Mead R amp Melby K (2003 February) Technical analysis Pennsylvania System of School Assessment 2003 reading and mathematics PSSA Data Recognition Corporation
Mead R amp Melby K (2002 April) Technical analysis Pennsylvania System of School Assessment 2001 reading and mathematics PSSA Data Recognition Corporation
Mead R Smith RM amp Swanlund A (2003) Technical analysis 2003 Pennsylvania System of School Assessment mathematics and reading Data Recognition Corporation
NCLB (2004) httpwwwedgovnclblandingjtml
Sicoly Fiore (2002) What do school-level scores from large-scale assessments really measure Educational Measurement Issues and Practice 21(4) 17-26
Terenzini PT Cabrera AF amp Bernal EM (2001) Swimming against the tide The poor in American higher education (Research Report No 2001-1) New York College Entrance Examination Board
Willingham WW amp Cole NS (1997) Gender and Fair Assessment Hillsdale NJ Erlbaum
HumRRO 55 April 2004
HumRROKDE April 2003
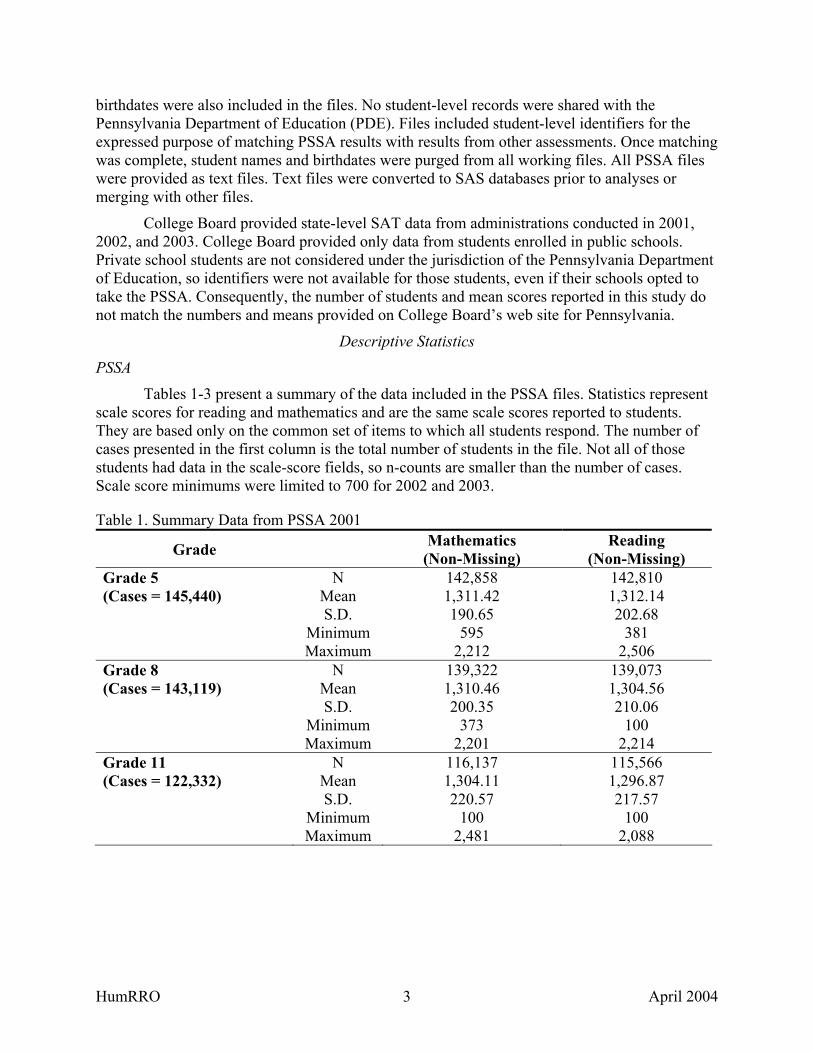
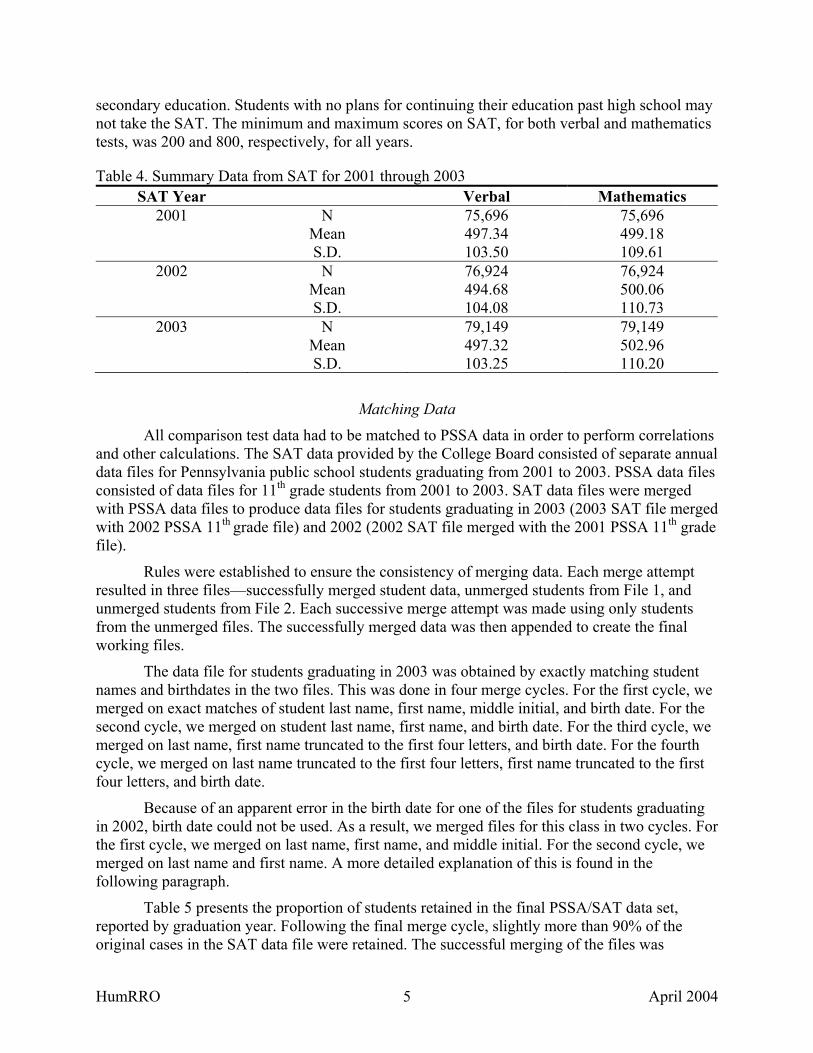
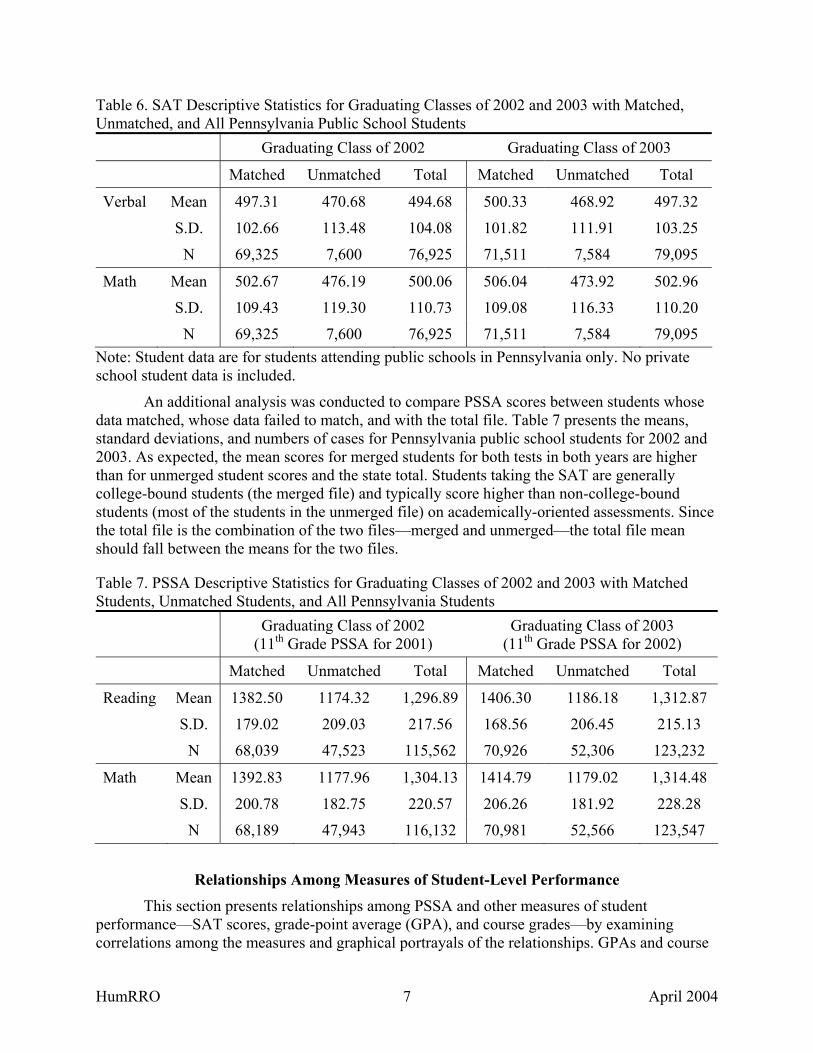

Outliers are hidden Extreme values are hidden
1 2 3 4
2002 PSSA 11th Grade Reading Performance Level
200
300
400
500
600
700
800
2003
SA
T V
erba
l Sco
re
n=11539
n=5121
n=37823
n=17028 PSSA Performance Level 1 - Below Basic 2 - Basic 3 - Proficient 4 - Advanced
Figure 2 Student-level relationship between 2003 SAT verbal score and 2002 PSSA 11th grade reading performance level for the Class of 2003
PSSA Reading Scale Score Versus SAT Verbal Score by Quintile
Figure 3 and Figure 4 show the relationship between the PSSA reading scale score on the y-axis and the SAT verbal score by quintile on the x-axis for the Classes of 2002 and 2003 The graph shows a distinct stair-step for each quintile in both grades Two sets of cut scores are also illustrated on the graphs The graphrsquos legend lists the cut scores for each quintile The cut scores were chosen to place approximately 20 of the students taking the SAT in each quintile Because of the number of students with a score equal to the cut score the number of students in each quintile is not the same The cut points for each quintile therefore vary slightly between the two classes The second set of cut scores is represented by the lines that have been added to show the 11th grade PSSA reading performance levels This illustrates that most students in the top four quintiles or top 80 of those students taking the SAT are performing at the Proficient or Advanced level on the 11th grade PSSA reading assessment
HumRRO 12 April 2004
2001
PSS
A 1
1th
Gra
de R
eadi
ng S
cale
Sco
re
2000
1800
1600
1400
1200
1000
800
Outliers are hidden Extreme values are hidden
n=13209
n=13432
n=14286
n=13847
n=13265
1 2 3 4 5
2002 SAT Verbal Scores Divided into Quintiles
Advanced
Proficient
Basic
Below Basic
2002 SAT Verbal Quintiles 1 - Less than 420 2 - 420 to 480 3 - 480 to 520 4 - 520 to 580 5 - Greater than 580
Figure 3 Student-level relationship between 2001 PSSA reading scale scores and 2002 SAT verbal scores divided into quintiles for the Class of 2002
HumRRO 13 April 2004
Outliers are hidden Extreme values are hidden
1 2 3 4 5
2003 SAT Verbal Scores Divided Into Quintiles
800
1000
1200
1400
1600
1800
2000
2002
PSS
A 1
1th
Gra
de R
eadi
ng S
cale
Sco
re
n=13969
n=14502 n=13838
n=14314 n=14303
2003 SAT Verbal Quintiles 1 - Less than 420 2 - 420 to 480 3 - 480 to 520 4 - 520 to 580 5 - Greater than 580
Advanced
Proficient
Basic
Below Basic
Figure 4 Student-level relationship between 2002 PSSA 11th grade reading scale scores and 2003 SAT verbal score divided into quintiles for the Class of 2003
SAT Math Score Versus PSSA Performance Level in Math
Figure 5 and Figure 6 show the relationship between the SAT math score on the y-axis and the 11th grade PSSA math performance level on the x-axis for the Classes of 2002 and 2003 The graph shows a distinct stair-step for all levels in both grades The number of students in each level also indicates that more of the higher-achieving students are taking the SAT than are lower-achieving students
HumRRO 14 April 2004
Outliers are hidden Extreme values are hidden
PSSA Performance Levels 1 - Below Basic 2 - Basic 3 - Proficient 4 - Advanced
1 2 3 4
2001 PSSA 11th Grade Math Performance Level
200
300
400
500
600
700
800
2002
SA
T M
ath
Scor
e
n=20950
n=22786 n=14102
n=11487
Figure 5 Student-level relationship between 2002 SAT math score and 2001 PSSA 11th grade math performance level for the Class of 2002
HumRRO 15 April 2004
Outliers are hidden Extreme values are hidden
PSSA Performance Level 1 - Below Basic 2 - Basic 3 - Proficient 4 - Advanced
1 2 3 4
2002 PSSA 11th Grade Math Performance Level
200
300
400
500
600
700
800
2003
SA
T M
ath
Scor
e
n=13459
n=24205
n=24580
n=9267
Figure 6 Student-level relationship between 2003 SAT math score and 2002 PSSA 11th grade math performance level for the Class of 2003
PSSA Math Scale Score versus SAT Math Score by Quintile
Figure 7 and Figure 8 show the relationship between the 11th grade PSSA math scale score on the y-axis and the SAT math score by quintile on the x-axis for the Classes of 2002 and 2003 The graph shows a distinct stair-step for each quintile in both grades Two sets of cut scores are also illustrated on the graph The graphrsquos legend lists the cut scores for each quintile The cut scores were chosen to place approximately 20 of the students taking the SAT in each quintile Because of the number of students with a score equal to the cut score the number of students in each quintile is not the same The cut points for each quintile therefore vary slightly between the two classes The second set of cut scores is represented by the lines that have been added to show the for 11th grade PSSA math performance levels This figure clearly illustrates that more than 75 of students in the each of the top three quintiles or top 60 of those students taking the SAT are performing at the Proficient or Advanced level on the 11th Grade PSSA math assessment Additionally more than 75 of students taking the SAT in the top quintile and more than 50 of students in the second quintile are scoring in the Advanced performance level on the 11th grade PSSA math assessment
HumRRO 16 April 2004
Outliers are hidden Extreme values are hidden
1 2 3 4 5
2002 SAT Math Scores Divided into Quintiles
800
1000
1200
1400
1600
1800
2000
2001
PSS
A 1
1th
Gra
de M
ath
Scal
e Sc
ore
n=14834
n=13952
n=12271
n=13117
n=14015
Advanced
Proficient
Basic
Below Basic
2002 SAT Math Score Quintiles 1 - Less than 410 2 - 410 to 470 3 - 470 to 530 4 - 530 to 600 5 - Above 600
Figure 7 Student-level relationship between 2001 PSSA 11th grade math scale score and 2002 SAT math score divided into quintiles for the Class of 2002
HumRRO 17 April 2004
Outliers are hidden Extreme values are hidden
1 2 3 4 5
2003 SAT Math Scores Divided Into Quintiles
800
1000
1200
1400
1600
1800
2000
2002
PSS
A 1
1th
Gra
de M
ath
Scal
e Sc
ore
n=13337
n=14780
n=15184
n=14494
n=13186
2003 SAT Math Quintiles 1 - Below 410 2 - 410 to 480 3 - 480 to 530 4 - 530 to 600 5 - Above 600
Advanced
Proficient
Basic
Below Basic
Figure 8 Student-level relationship between 2002 PSSA 11th grade math scale scores and 2003 SAT math scores divided into quintiles for the Class of 2003
PSSA Reading Scale Score Versus SAT Reported Average Grade in English
Figure 9 and Figure 10 illustrate the relationship between the PSSA Reading scale scores and the grades students reported in the optional Student Descriptive Questionnaire (SDQ) portion of the SAT The SDQ asked students to report their average grade in English The available responses to this question were 0 ndash Failing 1 ndash Passing 2 ndash Fair 3 ndash Good or 4 ndash Excellent The category ldquoNo responserdquo indicates that the student did not respond to the question In 2002 8305 students did not respond to the English question In 2003 6170 students did not respond In 2002 13 students responded that their average English grade was ldquoFailingrdquo In 2003 6 students had this answer Students who did not respond and those who responded that their average grade was ldquoFailingrdquo were not included in the graphs As can be seen in Figure 10 scale scores in PSSA Reading tend to be higher for students reporting better performance in English coursework The preponderance of students reporting either a ldquoGoodrdquo or an ldquoExcellentrdquo English average scored in the Proficient or Advanced PSSA performance levels Additionally almost 90 of the students reported having either a ldquoGoodrdquo or ldquoExcellentrdquo average in English courses As previously noted self-reported data undoubtedly involves some inaccuracies however Cassady (2001) found studentsrsquo self-reported grades to be a reliable measure of actual grades
HumRRO 18 April 2004
2001
PSS
A 1
1th
Gra
de R
eadi
ng S
cale
Sco
re
2000
1800
1600
1400
1200
1000
800
600
Outliers are hidden Extreme values are hidden
n=27359
n=6538
n=23685
n=244
1 2 3 4
Student-Reported Average Grade for English on SAT Student Descriptive Questionnaire
Advanced
Proficient
Basic
Below Basic
Average Grade 1 - Passing 2 - Fair 3 - Good 4 - Excellent
Figure 9 Student-level relationship between 2001 PSSA 11th grade reading scale score and student-reported average English course grades on the Student Descriptive Questionnaire (SDQ) of the SAT for the Class of 2002
HumRRO 19 April 2004
Outliers are hidden Extreme values are hidden
1 2 3 4
Student-Reported Average Grade for English on SAT Student Descriptive Questionnaire
600
800
1000
1200
1400
1600
1800
2000
2200
2400
2002
PSS
A 1
1th
Gra
de R
eadi
ng S
cale
Sco
re
n=6065 n=26317 n=23397 n=249 Average Grade 1 - Passing 2 - Fair 3 - Good 4 - Excellent
Advanced
Proficient
Basic
Below Basic
Figure 10 Student-level relationship between 2002 PSSA 11th grade reading scale score and student-reported English course grades on the SAT Student Descriptive Questionnaire (SDQ) for the Class of 2003
PSSA Math Scale Score Versus SAT Reported Average Grade in Math
Figure 11 and Figure 12 illustrate the relationship between the PSSA 11th grade math scale scores and the grades students reported in the optional Student Descriptive Questionnaire (SDQ) portion of the SAT which students are asked to complete as part of registering for the SAT The SDQ asked students to report their average grade in math The available responses to this question were 0 ndash Failing 1 ndash Passing 2 ndash Fair 3 ndash Good or 4 ndash Excellent The category ldquoNo responserdquo indicates that the student did not respond to the question In 2002 8523 students did not respond to the math average grade question In 2003 6316 students did not respond In 2002 41 students responded that their average math grade was ldquoFailingrdquo In 2003 47 students had this answer Students who did not respond and those who responded that their average grade was ldquoFailingrdquo were not included in the graphs
HumRRO 20 April 2004
2001
PSS
A 1
1th
Gra
deM
ath
Scal
e Sc
ore 2000
1800
1600
1400
1200
1000
800
600
Outliers are hidden Extreme values are hidden
n=19993
n=11254 n=25509
n=970
1 2 3 4
Student-Reported Average Grade for Math on SAT Student Descriptive Questionnaire
Advanced
Proficient
Basic
Below Basic
Average Grade 1 - Passing 2 - Fair 3 - Good 4 - Excellent
Figure 11 Student-level relationship between 2001 PSSA 11th grade math scale score and student-reported average math course grades in the Student Descriptive Questionnaire (SDQ) of the SAT for the Class of 2002
HumRRO 21 April 2004
Outliers are hidden Extreme values are hidden
1 2 3 4
Student-Reported Average Grade for Math on SAT Student Descriptive Questionnaire
600
800
1000
1200
1400
1600
1800
2000
2002
PSS
A 1
1th
Gra
de M
ath
Scal
e Sc
ore
n=10370 n=24674
n=19835
n=1003
Advanced
Proficient
Basic
Below Basic
Average Grade 1 - Passing 2 - Fair 3 - Good 4 - Excellent
Figure 12 Student-level relationship between 2002 PSSA 11th grade math scale score and student-reported average math course grade in the SAT Student Descriptive Questionnaire (SDQ) for the Class of 2003
PSSA Scale Scores Versus SAT Reported Grade-Point Average
Figure 13 through Figure 16 illustrate relationships between PSSA scale scores and overall grade-point averages (GPAs) The GPAs are from the SATrsquos SDQ Students were asked to provide their GPA on a basic 4-point scale with pluses and minuses around each point (A+ = 43 A = 40 A- = 37 etc) Approximately 87 (60283 of 69325) of students in the Class of 2002 completed the GPA question in the SDQ and 83 (59258 of 71511) of students in the Class of 2003 completed the question The mean student-reported GPA was 333 (SD = 064) for the Class of 2002 and 335 (SD = 063) for the Class of 2003 The correlation for the 2001 PSSA 11th grade reading component with the 2002 GPA was 0501 For the 2001 PSSA 11th grade math component the correlation was 0539 For the 2002 PSSA the correlations were 0520 in Reading and 0553 in Math The box-plots for PSSA scale scores to GPA for both years and both tests performed as expectedmdashlower scores for lower GPAs and higher scores for higher GPAs Note that the median and boxes align fairly well with the appropriate performance levelsmdashA students in the Advanced and Proficient level B students generally in the Proficient level C students in the low Proficient and Basic levels and D students in the Basic level Note also that the number of students decreases sharply when the student-reported GPA drops below 30
HumRRO 22 April 2004
Outliers are hidden Extreme values are hidden
Advanced
Proficient
Basic
Below Basic
10 13 17 20 23 27 30 33 37 40 43
Student-reported GPA (4-point scale) on the 2002 SAT Student Descriptive Questionnaire (SDQ)
800
1000
1200
1400
1600
1800
2000
2001
PSS
A 1
1th
Gra
de R
eadi
ng S
cale
Sco
re
n=10261
n=5370 n=11810
n=11101 n=9668
n=4624
n=2381 n=3352
n=520 n=40
n=96
Figure 13 Student-level relationship between 2001 PSSA 11th grade reading scale score and student-reported grade-point average (GPA) from the SATrsquos Student Descriptive Questionnaire (SDQ) for the Class of 2002
HumRRO 23 April 2004
Outliers are hidden Extreme values are hidden
10 13 17 20 23 27 30 33 37 40 43 Student-reported GPA (4-point scale) on the 2003 SAT Student Descriptive Questionnaire (SDQ)
800
1000
1200
1400
1600
1800
2000
2002
PSS
A 1
1th
Gra
de R
eadi
ng S
cale
Sco
re
n=3304
n=10358
n=5089
n=11480
n=11507
n=9773
n=4602
n=2084 n=97 n=496 n=27
Advanced
Proficient
Basic
Below Basic
Figure 14 Student-level relationship between 2002 PSSA 11th Grade reading scale score and student-reported grade-point average (GPA) from the SATrsquos Student Descriptive Questionnaire (SDQ) for the Class of 2003
HumRRO 24 April 2004
Outliers are hidden Extreme values are hidden
10 13 17 20 23 27 30 33 37 40 43 Student-reported GPA (4-point scale) on the 2002 SAT Student Descriptive Questionnaire (SDQ)
800
1000
1200
1400
1600
1800
2000
2001
PSS
A 1
1th
Gra
de M
ath
Scal
e Sc
ore
n=10280
n=5391 n=11831
n=11123 n=9672
n=4635
n=2393 n=3377
n=526 n=42
n=97
Advanced
Proficient
Basic
Below Basic
Figure 15 Student-level relationship between 2001 PSSA 11th grade math scale score and student-reported grade-point average (GPA) from the SATrsquos Student Descriptive Questionnaire (SDQ) for the Class of 2002
HumRRO 25 April 2004
Outliers are hidden Extreme values are hidden
10 13 17 20 23 27 30 33 37 40 43 Student-reported GPA (4-point scale) on the 2003 SAT Student Descriptive Questionnaire (SDQ)
800
1000
1200
1400
1600
1800
2000
2002
PSS
A 1
1th
Gra
de M
ath
Scal
e Sc
ore
n=3319
n=10364
n=5091
n=11480
n=11514
n=9777
n=4600
n=2085 n=98
n=496
n=27
Advanced
Proficient
Basic
Below Basic
Figure 16 Student-level relationship between 2001 PSSA 11th grade math scale score and student-reported grade-point average (GPA) from the SATrsquos Student Descriptive Questionnaire (SDQ) for the class of 2002
HumRRO 26 April 2004
Differences in Performance for Demographic Groupings
Analyses were conducted to compare performance on the PSSA and SAT among students from varying backgrounds Average test performance tends to differ for students of differing genders ethnic groups and various measures associated with socioeconomic status The important question for judging bias on the PSSA is not whether specific groups show mean differences but whether those differences are larger for the PSSA than the differences observed on other measures of student achievement
Differences between measures of achievement can be captured in several ways This report will present two measures of mean differences First effect size statistics will be calculated for the differences between major categories of students (Coe 2002) The magnitude of the effect size statistics is less important than the difference between the effect sizes for PSSA compared to the other measures However measuring the magnitude of the gaps for NCLB-defined groups is instructive and important since all states are expected to make progress toward closing those gaps (No Child Left Behind 2004)
Effect size statistics can be interpreted as the average percentile standing of the average treated (or experimental) participant relative to the average untreated (or control) participant An effect size of 00 indicates that the mean of the treated group is at the 50th percentile of the control group An effect size of 08 indicates that the mean of the treated group is at the 79th
percentile of the control group An effect size of 17 indicates that the mean of the treated group is at the 955th percentile of the control group Cohen (1988) hesitantly defined effect sizes as ldquosmall d=2rdquo ldquomedium d=5rdquo and ldquolarge d=8rdquo He went on to caution against offering conventional operational definitions such as these in the diverse field of behavioral science
The second measure used to capture differences between measures of achievement was regression analysis Regression analysis was used to examine the extent to which PSSA differences in performance for various demographic groupings are similar to those found in SAT scores For each of the demographic groupings we calculated a regression equation to predict PSSA scores based on the matching SAT content score A second equation was created which added the specific demographic characteristic of interest If PSSA scores exhibit greater differences based on that demographic characteristic that characteristic will have a significant weight and there will be a meaningful increase in the prediction of the PSSA component score
Gender Differences
Table 12 presents performance means for males and females for the PSSA only This table provides information from the larger state population to use in comparison with the matched PSSA and SAT sample data The SAT-taking population can be expected to post higher means For all gender tables data is coded such that positive numbers indicate higher mean scores for males negative numbers indicate higher mean scores for females For the full population of PSSA takers the pattern of performance between males and females is consistent Males outscore females but only to a very small degree on the PSSA mathematics test for all three included years Females outscored males to a higher but still small degree on the PSSA reading test The differences between years are small and inconsistent This table shows that the gap in performance for both PSSA mathematics and reading between males and females is small and has not changed dramatically between 2001 and 2003
HumRRO 27 April 2004
Table 12 Gender Differences for PSSA (Unmatched State Data) Mean Scale Standard Number of Effect Size Year Subject Gender Score Deviation Cases d
Mathematics Male 130954 22870 56380
2001 Reading Female
Male Female
130288 127107 132719
21170 22731 20167
55496 56091 55280
0030
-0261 Mathematics Male 132475 23813 60777
2002 Reading Female
Male Female
130679 129478 133443
21694 22536 20034
59849 60686 59636
0079
-0186 Mathematics Male 132555 22198 63542
2003 Reading Female
Male 130434 129308
20680 24674
61849 63840
0099
Female 133974 22003 62020 -0200
Table 13 and Table 14 present data for the matched sample of students taking both PSSA and SAT by gender Scale scores for both assessments as well as studentsrsquo self-reported GPA are included in the tables The numbers of males versus females in the state student population is similar typically with a few more males than females per grade However many more females take the SAT tests suggesting that more females than males aspire to attend college Males outscored females by a small margin on the PSSA and the SAT mathematics tests This finding is consistent with scoring patterns on SAT and ACT reported by Willingham and Cole (1997) They suggest that as a rule females tend to avoid taking mathematics and science classes In an apparent inconsistency females outscored males on PSSA reading but not on SAT verbal Scores for SAT verbal were nearly identical for males and females Willingham and Cole found gender differences favoring females in writing skills The PSSArsquos performance-task items add a writing component that was not present in the SAT for the Classes of 2002 and 2003 However SAT will include a student-written essay beginning in spring 2005 This study found that females tended to have higher self-reported GPAs than males
Table 13 Gender Differences for Class of 2002 Matched Sample (2001 PSSA and 2002 SAT) Performance Standard Number of Effect SizeSubject Gender MeanMeasure Deviation Cases d
Mathematics Male 141925 20536 29403
PSSA Reading Female
Male Female
137503 137162 139420
19408 18761 16921
36530 29345 36451
0221
-0126 Mathematics Male 52273 11076 29787
SAT Verbal Female
Male 48821 50081
10527 10333
37042 29787
0319
Female 49582 10126 37042 0049
GPA Male Female
3243 3404
656
609 25323 32857 -0255
HumRRO 28 April 2004
Table 14 Gender Differences for Class of 2003 Matched Sample (2001 PSSA and 2002 SAT) Performance Mean Standard Number Effect Size Subject GenderMeasure Score Deviation of Cases d
Mathematics Male 145023 21049 31338
PSSA Reading Female
Male Female
138650 140570 140715
19790 17318 16427
38459 31328 38418
0312
-0009 Mathematics Male 52596 11067 31557
SAT Verbal Female
Male 48997 50524
10490 10235
38745 31557
0327
Female 49623 10097 38745 0089 Male 3265 653 25387GPA Female 3415 600 32925 -0239
Table 15 and Table 16 show regression results for adding gender as a predictor variable to the model for estimating PSSA scores based on SAT scores For both PSSA reading and math the regression weights for gender are negligible and the changes in R-square are essentially nonexistent Gender is coded such that the positive weight means that females tend to have higher reading and math scores than would be expected from gender differences in SAT verbal
Table 15 Regressions Results Showing the Adjusted Strength of Gender on Predicting 2001 PSSA 11th Grade Scale Scores Based on 2002 SAT Scores Standardized Coefficient
PSSA Component SAT Control Gender R2 Change in R2
due to Gender Reading 0704 0495 Reading 0706 +0081 0502 +0006 Math 0847 0717 Math 0851 +0025 0717 +0001
Table 16 Regressions Results Showing the Adjusted Strength of Gender on Predicting 2002 PSSA 11th Grade Scale Scores Based on 2003 SAT Scores Standardized Coefficient
PSSA Component SAT Control Gender R2 Change in R2
due to Gender Reading 0775 0601 Reading 0777 +0038 0602 +0001 Math 0865 0749 Math 0863 -0012 0749 0000
HumRRO 29 April 2004
Ethnic or Racial Differences
Table 17 presents performance means for the four major ethnic or racial groups3 (White Black HispanicLatino and Asian) for the PSSA only For these analyses the racialethnic categories reported with the PSSA data were used It should be noted that starting in 2003 the reported racialethnic categories were changed from those reported in 2001 and 2002 In 2003 the category of ldquoMixedrdquo was no longer included As a result those students previously selecting ldquoMixedrdquo were forced to select one of the other categories For the full population of PSSA takers the pattern of performance between these four groups is fairly consistent In mathematics Asians outscore all groups Whites outscore HispanicsLatinos and Blacks and HispanicsLatinos score between Blacks and Whites For Reading Asians and Whites score approximately the same and Blacks score almost one standard deviation lower than Whites However the score for HispanicsLatinos has shown a decrease over the three years of approximately 30 points This decrease has dropped the HispanicLatino group to below the mean Black group score The number of HispanicLatinos taking the PSSA has increased approximately 40 Blacks approximately 65 and Whites approximately 10 during that time as well
Table 17 EthnicRacial Differences for PSSA (Unmatched State Data) Hispanic Year Subject Measure White Black AsianLatino
2001
Mathematics
Reading
Mean SD
N Effect Size
Mean SD
N Effect Size
132481 21525 92185
131644 21066 91964
113596 17093 8274 0972
115158 20393 8117 0795
116757 18873 2954 0777
117025 21104 2924 0693
140820 24657 2489 -0360
132927 21707 2470 -0060
2002
Mathematics
Reading
Mean SD
N Effect Size
Mean SD
N Effect Size
133935 22098 97659
133917 20351 97428
114090 17626 10783 0993
114887 20070 10715 0942
116438 19041 3534 0848
116193 21155 3535 0854
143430 26757 2659 -0387
133711 22914 2655 0010
2003
Mathematics
Reading
Mean SD
N Effect Size
Mean SD
N
134059 20863
104064
134488 22411
104271
114619 16132 13669 1042
114796 21940 13871 0888
116389 17473 4106 0903
114052 22848 4158 0903
142013 23662 2865 -0357
134943 24743 2866 -0019
3 The racialethnic analyses were limited to these four groups because of the limited number of students in the other groups
HumRRO 30 April 2004
Table 18 and Table 19 present data for the matched sample of students taking both PSSA and SAT by ethnicity Scale scores for both assessments as well as studentsrsquo self-reported GPA are included in the tables In 2002 Asians (726) took the SAT tests at a much higher rate than any other group followed by Whites (608) Blacks (419) and HispanicsLatinos (364) The order remained the same in 2003 although all groups but Asians had a slightly lower percentage in 2002 than in 2003 This suggests that more Asians and Whites aspire to attend college than do Blacks or HispanicLatinos Scores on the PSSA SAT and GPA show the same order for the matched sample as for the total state sample for the PSSA Comparing the effect size for the PSSA versus the effect size for the SAT shows that the effect size for most groups in the Class of 2002 and components is approximately the same for the PSSA and the SAT The largest difference for Blacks is between the PSSA reading and the SAT verbal components (PSSA reading ndash 0883 and SAT verbal ndash 1011) Note also that the effect size for GPA is approximately half the effect size for the PSSA and SAT for Blacks and Hispanics However for Asians the GPA effect size is more similar to the effect size for math than it is for the SAT verbal or PSSA reading components
Table 18 EthnicRacial Differences for the Class of 2002 Matched Sample (2001 PSSA 11th
Grade and 2002 SAT) Performance Hispanic Subject Measure White Black AsianMeasure Latino
PSSA
Mathematics
Reading
Mean SD
N Effect Size
Mean SD
N Effect Size
140809 19272 56063
139658 17004 56017
120809 17759 3735 1079
123658 19180 3678 0883
128529 19483 1076 0634
129112 19199 1064 0582
146256 22812 1808 -0258
138040 19183 1807 0089
SAT
Mathematics
Verbal
Mean SD
N Effect Size
Mean SD
N Effect Size
51041 10409 56693
50476 9670
56693
40286 10268 3872 1040
40619 9836 3872 1011
44332 11082 1096 0624
44378 10964 1096 0590
54820 13077 1838 -0320 49547 13308 1838 0080
GPA
Mean SD
N Effect Size
3364 0621
49617
2940 0667 3337 0658
3126 0640 871
0377
3491 0615 1616 -0205
HumRRO 31 April 2004
Table 19 EthnicRacial Differences for the Class of 2003 for Matched Sample (2002 PSSA 11th
Grade and 2003 SAT) Performance HispanicSubject Measure White Black AsianMeasure Latino
Mean 142999 122766 129030 150221
Mathematics SD N
19659 59076
18097 4516
19834 1178
24869 1951
PSSA Effect Size Mean 142157
1071 125012
0707 129610
-0322 139776
Reading SD N
15746 59038
17622 4500
18763 1184
20264 1951
Effect Size 1026 0724 0131 Mean 51440 39999 43626 55739
Mathematics SD N
10295 59443
9997 4573
10967 1206
12831 1970
SAT Effect Size Mean 50834
1128 40568
0735 43851
-0370 50166
Verbal SD N
9539 59443
9913 4573
10745 1206
13163 1970
Effect Size 1055 0687 0058 Mean 3385 2933 3175 3538
GPA Mathematics SD N
0610 49511
0666 3799
0641 935
0595 1608
Effect Size 0708 0336 -0254
Table 20 through Table 23 show regression results for adding raceethnicity (White versus Black and White versus HispanicLatino) as a predictor variable to the model for estimating PSSA scores based on SAT scores For both PSSA reading and math the regression weights for raceethnicity are negligible and the changes in R-square are essentially nonexistent Raceethnicity is coded such that the negative weight means that Blacks or HispanicsLatinos tend to have lower reading and math scores than would be expected from ethnicity differences in SAT verbal
Table 20 Regressions Results Showing the Adjusted Strength of Being Black on Predicting 2001 PSSA 11th Grade Scale Scores Based on 2002 SAT Scores Standardized Coefficient
PSSA Component SAT
Control Black R2 Change in R2
due to being Black
Reading 0699 0489 Reading 0686 -0059 0493 +0003 Math 0843 0711 Math 0833 -043 0713 +0002
HumRRO 32 April 2004
Table 21 Regressions Results Showing the Adjusted Strength of Being Black on Predicting 2002 PSSA 11th Grade Scale Scores Based on 2003 SAT Scores Standardized Coefficient
PSSA Component SAT
Control Black R2 Change in R2
due to being Black
Reading 0769 0591 Reading 0750 -0068 0595 0004 Math 0863 0745 Math 0857 -0021 0746 0000
Table 22 Regressions Results Showing the Adjusted Strength of Being HispanicLatino on Predicting 2001 PSSA 11th Grade Scale Scores Based on 2002 SAT Scores Standardized Coefficient
PSSA Component SAT
Control HispanicLatino R2 Change in R2
due to being HispanicLatino
Reading 0687 0472 Reading 0685 -0026 0473 +0001 Math 0837 0700 Math 0836 -0014 0700 0000
Table 23 Regressions Results Showing the Adjusted Strength of Being HispanicLatino on Predicting 2002 PSSA 11th Grade Scale Scores Based on 2003 SAT Scores Standardized Coefficient
PSSA Component SAT
Control HispanicLatino R2 Change in R2
due to being HispanicLatino
Reading 0754 0568 Reading 0050 -0034 0569 +0001 Math 0857 0735 Math 0856 -0009 0735 0000
Economically Disadvantaged Differences
Table 24 presents performance means for those students identified as economically disadvantaged for the PSSA only This table provides information from the larger state population to use in comparison with the matched PSSA and SAT sample data The SAT-taking population can be expected to post higher means For the full population of PSSA takers the pattern of performance between males and females is consistent Noneconomically disadvantaged students outscore economically disadvantaged student to a large degree on all components and all years except 2001 when it was a medium degree The number of students identified more than doubled between 2001 and 2002 and increased an additional 40 in 2003
HumRRO 33 April 2004
Table 24 Differences for Economically Disadvantaged Students for PSSA (Unmatched State Data)
Year Subject Economically Disadvantaged
Mean Scale Score
Standard Deviation
Number of Cases
Effect Size d
2001 Mathematics
Reading
Yes No Yes No
118647 131377 118918 130564
18977 22014 21142 21570
8805 107332 8702
106864
0619
0545
2002 Mathematics
Reading
Yes No Yes No
116604 133857 116380 133704
18913 22497 20914 20617
17253 106297 17199 106035
0830
0834 Yes 118211 17997 24022Mathematics No 134575 21063 102919 08352003 Yes 116747 22817 24290Reading No 135050 22319 103137 0811
Table 25 Differences for Economically Disadvantaged Students for Matched Sample for the Class of 2002 (2001 PSSA 11th Grade and 2002 SAT)
Performance Economically Mean Standard Number Effect Measure Subject Disadvantaged Score Deviation of Cases Size
d
PSSA Mathematics
Reading
Yes No Yes No
130598 139668 131768 138535
18830 20044 18336 17829
2893 65296 2863 65176
0466
0374
SAT Mathematics
Verbal
Yes No Yes No
45185 50491 44694 49953
10399 10912 10131 10215
2926 66399 2926 66399
0498
0517
GPA Yes No
3195 3334
0661 0636
2561 57722 0214
HumRRO 34 April 2004
Table 26 Differences for Economically Disadvantaged Students for Matched Sample for the Class of 2003 (2002 PSSA 11th Grade and 2003 SAT) Performance
Measure Subject Economically Disadvantaged
Mean Score
Standard Deviation
Number of Cases
Effect Size d
PSSA Mathematics
Reading
Yes No Yes No
127741 142707 128169 141742
19474 20278 18498 16243
5822 65159 5812 65114
0753
0780
SAT Mathematics
Verbal
Yes No Yes No
42412 51341 42100 50748
10746 10616 10491 9845
5907 65604 5907 65604
0836
0850 Yes 3116 0680 4854GPA No 3369 0620 54404 0389
Table 27 Regressions Results Showing the Adjusted Strength of Being Economically Disadvantaged on Predicting 2001 PSSA 11th Grade Scale Scores Based on 2002 SAT Scores Standardized Coefficient
Change in R2
SAT Economically due to beingPSSA Component R2 Control Disadvantaged Economically
Disadvantaged Reading 0704 0495 Reading 0703 -0004 0495 0000 Math 0846 0715 Math 0845 -0009 0715 0000
Table 28 Regressions Results Showing the Adjusted Strength of Being Economically Disadvantaged on Predicting 2002 PSSA 11th Grade Scale Scores Based on 2003 SAT Scores Standardized Coefficient
SAT Change in R2
PSSA Component Control Economically Disadvantaged R2 due to being
Economically Disadvantaged
Reading 0775 0601 Reading 0765 -044 0602 0002 Math 0865 0749 Math 0864 -0005 0749 0000
Annual Family Income Differences
Camara and Schmidt (1999) point out that family income is related to performance on tests such as the SAT I They also point out that this finding is not unique to the SAT I or college admissions tests Terenzini Cabrera and Bernal (2001) also examined various differences in educational outcomes associated with varying levels of socioeconomic status (SES) This report
HumRRO 35 April 2004
examines differences associated with family income in this section The following section shows differences in student performance related to parental education level Terenzini Cabrera and Bernal (2001) and Camara and Schmidt (1999) point out differences between income wealth and SES
Because annual family income data comes from the SDQ of the SAT only matched student data can be presented showing relationships with family income Table 29 (Class of 2002) and Table 30 (Class of 2003) show student performance on the PSSA SAT and GPA versus four levels of family income As the table clearly shows student scores increase on all performance measures as income goes up However the effect size for GPA is about half of the effect size for either of the assessments The effect size for the PSSA is similar although slightly less than the effect size for the SAT for both components and both years
Table 29 Annual Family Income Differences for Matched Sample for the Class of 2002 (2001 PSSA 11th Grade and 2002 SAT)
Income Level Performance Subject MeasureMeasure $25000 to $40000 tolt $25000 gt $70000$40000 $70000
PSSA
Math
Reading
Mean SD
N Effect Size
Mean SD
N Effect Size
129900 19108 6658
131011 18466 6594
135381 18361 8709 -0293
136210 17165 8693 -0292
139702 18899 16365 -0516
138848 17110 16348 -0440
145045 20032 14902 -0774
142093 16921 14867 -0626
SAT
Math
Verbal
Mean SD
N Effect Size
Mean SD
N Effect Size
44665 10594 6822
44469 10177 6822
47766 10013 8856 -0301 47619 9546 8856 -0319
50272 10136 16549 -0541 49796 9485
16549 -0542
53816 10580 15122 -0864 52825 9815
15122 -0836
GPA
Mean SD
N Effect Size
3173 0656 6596
3262 0636 8607 -0138
3344 0631 16141 -0266
3412 0628
14726 -0372
HumRRO 36 April 2004
Table 30 Annual Family Income Differences for Matched Sample for the Class of 2003 (2002 PSSA 11th Grade and 2003 SAT)
Income Level Performance Subject MeasureMeasure $25000 - $40000 -lt $25000 gt $70000$40000 $70000
Mean 131577 136393 140924 147093
Math SD N
19401 6230
19051 7958
19319 14963
20560 14295
PSSA Effect Size Mean 132698
-0250 137311
-0483 140572
-0776 144569
Reading SD N
17576 6232
16201 7948
15919 14958
15965 14284
Effect Size -0273 -0470 -0707 Mean 44871 47689 50075 53965
Math SD N
10562 6304
10140 8010
10089 15045
10567 14388
SAT Effect Size Mean 44793
-0272 47581
-0504 49653
-0861 52905
Verbal SD N
10345 6304
9578 8010
9354 15045
9689 14388
Effect Size -0280 -0493 -0809 Mean 3188 3279 3357 3428
GPA SD N
0652 6115
0642 7832
0623 14659
0617 14000
Effect Size -0141 -0265 -0378
Parent Educational Differences
Camara and Schmidt (1999) also looked at the impact of parent education on student performance in standardized testing Their study showed that parental education is related to performance on the SAT I Higher parental education is associated with higher scores on the SAT I Table 31 and Table 32 show the means standard deviations number of students and effect size for various levels of student-reported motherrsquos education for the PSSA SAT and GPA The analyses indicate that the effect size for both assessments and GPA are larger as the motherrsquos educational level increases The effect size for PSSA is not as large as the effect size for SAT The effect size for GPA is about half of the effect size for PSSA or SAT Table 33 and Table 34 provide the same information regarding the fatherrsquos education level The results follow the same pattern as that for motherrsquos education level
HumRRO 37 April 2004
Table 31 Mothers Education Level Differences for Matched Sample for the Class of 2002 (2001 PSSA 11th Grade and 2002 SAT)
Subject Measure lt High School
High School
Some College
BABS Degree
Graduate Degree
Mean 128855 135908 138212 145789 148095
Math SD N
18785 2196
18542 18737
19161 16804
19982 12094
20688 6259
PSSA Effect Size Mean 129039
-378 135883
-0493 137803
-0873 143360
-0974 144735
Reading SD N
17886 2189
17134 18696
17441 16762
16733 12078
16981 6245
Effect Size -0377 -0495 -0883 -0985 Mean 43795 48049 49574 54133 55639
Math SD N
10476 2247
10021 18986
10429 17075
10547 12291
10924 6357
SAT Effect Size Mean 42614
-0415 47405
-0553 49277
-0983 53512
-1107 55072
Verbal SD N
99852247
929118986
963517075
9856 12291
10300 6357
Effect Size -0497 -0679 -1099 -1228 Mean 3142 3267 3289 3456 3504 SD 0653 0630 0640 0618 0601 GPA N 2145 18341 16424 11914 6150
Effect Size -0195 -0227 -0494 -0577
Table 32 Mothers Education Level Differences for Matched Sample for the Class of 2003 (2002 PSSA 11th Grade and 2003 SAT)
lt High High Some BABS GraduateSubject Measure School School College Degree Degree Mean 129723 137323 140038 148027 150140 SD 19513 18746 19865 20474 22494 Math N 2072 17801 16646 11406 5961
Effect Size -0397 -0524 -0915 -0970PSSA Mean 129022 137751 139799 145748 147071 SD 18092 16042 16241 15951 16272 Reading N 2066 17787 16638 11406 5954
Effect Size -0511 -0627 -0981 -1059 Mean 43631 48106 49738 54411 55641
Math SD N
10494 2095
10046 17922
10387 16756
10467 11496
11305 5992
SAT Effect Size Mean 42549
-0436 47592
-0585 49432
-1029 53618
-1101 55050
Verbal SD N
10124 2095
925417922
954716756
9795 11496
10522 5992
Effect Size -0520 -0700 -1111 -1211 Mean 3148 3285 3307 3475 3510
GPA SD N
0646 2003
0622 17344
0636 16134
0608 11088
0599 5797
Effect Size -0216 -0248 -0521 -0581
HumRRO 38 April 2004
Table 33 Fathers Education Level Differences for Matched Sample for the Class of 2002 (2001 PSSA 11th Grade and 2002 SAT)
Subject Measure lt High School
High School
Some College
BABS Degree
Graduate Degree
Mean 128908 135041 138368 144843 150072
Math SD N
18443 2850
18251 17616
18721 14573
19645 12461
20736 7835
PSSA Effect Size Mean 129571
-0334 135453
-0509 137985
-0836 142352
-1079 145994
Reading SD N
18191 2289
17066 17558
17291 14539
16798 12454
16661 7838
Effect Size -0333 -0474 -0730 -0942 Mean 43958 47510 49626 53651 56759
Math SD N
10229 2915
992617845
10116 14800
10368 12636
10727 7980
SAT Effect Size Mean 43245
-0352 47058
-0557 49210
-0941 52830
-122 56114
Verbal SD N
97782915
921217845
947514800
9571 12636
10128 7980
Effect Size -0401 -0620 -0991 -1293 Mean 3136 3247 3301 3432 3548 SD 0637 0634 0633 0618 0594 GPA N 2784 17269 14263 12198 7723
Effect Size -0175 -0260 -0472 -0669
Table 34 Fathers Education Level Differences for Matched Sample for the Class of 2003 (2002 PSSA 11th Grade and 2003 SAT)
lt High High Some BABS GraduateSubject Measure School School College Degree Degree Mean 131197 136533 140022 147183 152503 SD 19107 18733 19163 20247 22047 Math N 2766 16981 14422 11633 7272
Effect Size -0282 -0461 -0812 -1033PSSA Mean 130955 137222 140037 144765 148752 SD 17715 15901 15980 15990 16014 Reading N 2761 16968 14412 11629 7265
Effect Size -0372 -0538 -0818 -1054 Mean 44505 47569 49772 53911 57115
Math SD N
10230 2803
9938 17087
10023 14508
10352 11709
11009 7314
SAT Effect Size Mean 43701
-0304 47224
-0520 49499
-0914 52920
-1187 56296
Verbal SD N
9887 2803
919517087
931014508
9580 11709
10294 7314
Effect Size -0369 -0604 -0947 -1248 Mean 3139 3272 3316 3454 3558
GPA SD N
0639 2696
0624 16545
0632 14014
0606 11281
0582 7046
Effect Size -0211 -0279 -0506 -0686
HumRRO 39 April 2004
Limited English Proficiency Differences
Students identified as having limited English proficiency (LEP) would be expected to have more difficulty taking a test in English than those not identified As a result of these difficulties LEP students would be expected to have lower scores than non-LEP students Table 36 shows the mean standard deviation number of students and the effect size for the entire state on the PSSA in 2001 and 2002 As expected LEP students have lower scores than non-LEP students on both components and effect sizes are generally large However the math component effect size is only about half of the effect size for reading
Table 35 Limited English Proficiency Differences for 11th Grade PSSA (Unmatched State Data) Limited EffectMean Scale Standard NumberYear Subject English Size Score Deviation of CasesProficiency d
Yes 115312 18977 492Math No 130476 22047 115645 07372001 Yes 106216 15338 473Reading No 129784 21727 115093 1253 Yes 116560 20254 844Math No 131550 22812 122706 06952002 Yes 102618 16138 840Reading No 131483 21413 122394 1522
Table 36 and Table 37 show the mean standard deviation number of cases and effect size for the matched sample of students in the Classes of 2002 and 2003 The effect sizes are similar to those in the state sample for the PSSA and SATmdashvery larger in verbalreading and medium in math The effect size is slightly larger for PSSA than SAT in math but slightly smaller for PSSA than SAT in readingverbal However the GPA for LEP students is actually slightly higher than the GPA for non-LEP students
Table 36 Limited English Proficiency Differences for Matched Sample for the Class of 2002 (2001 PSSA 11th Grade and 2002 SAT)
LimitedPerformance Standard Number Effect Size Subject English Mean ScoreMeasure Deviation of Cases dProficiency Yes 125974 19661 134Math No 139310 20070 68055 0671PSSA Yes 113745 14649 132Reading No 138297 17876 67907 1502 Yes 42860 13045 136Math No 50282 10934 69189 0617SAT Yes 33353 9807 136Verbal No 49764 10241 69189 1637 Yes 3393 0617 111GPA No 3328 0637 60172 -0104
HumRRO 40 April 2004
Table 37 Limited English Proficiency Differences for Matched Sample for the Class of 2003 (2002 PSSA 11th Grade and 2003 SAT)
LimitedPerformance Mean Standard Number Effect Size Subject EnglishMeasure Score Deviation of Cases dProficiency Yes 126815 20257 289Mathematics No 141539 20607 70692 0721PSSA Yes 109386 15855 288Reading No 140757 16741 70638 1924 Yes 41564 12159 291Mathematics No 50641 10887 71220 0787SAT Yes 32526 8775 291Verbal No 50105 10126 71220 1855 Yes 3358 585 226GPA No 3348 629 59032 -0008
The regression analyses results (Table 38 and Table 39) show that there are negligible changes in R square for predicting PSSA from SAT scores when adding LEP to the equation for both reading and math for both classes
Table 38 Regressions Results Showing the Adjusted Strength of Being Limited English Proficient on Predicting 2001 PSSA 11th Grade Scale Scores Based on 2002 SAT Scores
Standardized Coefficient Change in R2
SAT Limited English due toPSSA Component R2 Control Proficiency Limited English
Proficiency Reading 0704 0495 Reading 0703 -0011 0495 0000
Math 0846 0715 Math 0845 -0004 0715 0000
Table 39 Regressions Results Showing the Adjusted Strength of Being Limited English Proficient on Predicting 2002 PSSA 11th Grade Scale Scores Based on 2003 SAT Scores
Standardized Coefficient Change in R2
PSSA Component SAT Control
Limited English Proficiency R2 due to
Limited English Proficiency
Reading 0775 0601 Reading 0771 -0033 0602 +0001
Math 0865 0749 Math 0865 0000 0749 0000
HumRRO 41 April 2004
School-Level Scores Means were calculated by school for all scale scores and grade indicators to analyze
school-level results School-level descriptive statistics are presented for the Classes of 2002 and 2003 for the PSSA (Table 40) SAT (Table 41) and GPA and course grades (Table 42) Only schools with at least 10 students with merged PSSA and SAT scores are included in the analyses School-level means showed an increase on both tests both test components GPA and course grades from the Class of 2002 to the Class of 2003 The change in scoring procedures from the 2001 PSSA to the 2002 PSSA (instituting a minimum score of 700 for the 2002 PSSA) is problematic However there were only 9 students in this college-bound sample in the Class of 2003 who scored a 700 on the 2002 PSSA reading component and no students who scored a 700 on the math component The change in course grades was extremely small
Table 40 PSSA School-Level Descriptive Statistics for the Classes of 2002 and 2003 Subject Measure Class of 2002 Class of 2003 Reading Mean 136973 139316
SD 7435 7088 N 586 586
Math Mean 136966 139333 SD 8335 8496
N 586 586 Limited to schools with at least 10 students with merged PSSA and SAT scores
Table 41 SAT School-Level Descriptive Statistics for the Classes of 2002 and 2003 Subject Measure Class of 2002 Class of 2003 Verbal Mean 48578 48907
SD 4207 4251 N 586 586
Math Mean 48847 49159 SD 4500 4601
N 586 586 Limited to schools with at least 10 students with merged PSSA and SAT scores
HumRRO 42 April 2004
Table 42 School-Level Descriptive Statistics GPA and Course Grades for the Classes of 2002 and 2003
Subject Measure Class of 2002 Class of 2003 GPA Mean 334 346
SD 019 019 N 586 586
English Mean SD
329 020
331 021
N 586 586 Math Mean 311 312
SD 021 022 N 586 586
Limited to schools with at least 10 students with merged PSSA and SAT scores
Average Within-Year School-Level Correlations
Table 43 and Table 44 present correlations among these school-level scores Table 45 presents correlations for the average across the two years4 As Hoffman (1998) pointed out there is a tendency for correlations among school scores to be higher than correlations among student-level scores (Class of 2002 - Table 8 Class of 2003 - Table 9 and average for the Classes of 2002 and 2003 - Table 10) This is the case except for those correlations involving GPA and course-grades (except for PSSA reading to math course grade and GPA to English course grade where school-level correlations are higher)
As Hoffman (1998) pointed out the lower school-level correlations for GPA suggests that grading scales are not equivalent across schools There is a tendency for different schools to grade differently As a result at the school level of analysis there is a weaker relationship between GPA and either PSSA or ACT scores When studentsrsquo scores are averaged at the school level observed differences are related not only to differing levels of student achievement but to the particular schoolrsquos grading practices However the school-level relationship between GPA and course grades remains strong for both PSSA and SAT
4 Average correlations were technically corrected with Fisherrsquos r to z transformations
HumRRO 43 April 2004
Table 43 School-Level PSSA SAT and Course Grade Correlations for the Class of 2002 PSSA SAT Course Grades
Variable Reading Math Verbal Math GPA (Total) English Math
ReadingPSSA
Math
1000
0861 1000
Verbal SAT
Math
0818 0883
0773 0935
1000
0941 1000
GPA
English Course
Grades Math
0413 0393
0411 0391
0423 0454
0371 0376
0359 0362
0416 0450
1000
0778 1000
0719 0542 1000 Limited to schools with at least 10 students with merged PSSA and SAT scores
Table 44 School-Level PSSA SAT and Course Grades Correlations for the Class of 2003 PSSA SAT Course Grades
Variable Reading Math Verbal Math GPA (Total) English Math
ReadingPSSA
Math
1000
0870 1000
Verbal SAT
Math
0905 0849
0868 0915
1000
0943 1000
GPA
English Course
Grades Math
0491 0443
0442 0394
0501 0489
0439 0425
0402 0394
0484 0486
1000
0780 1000
0784 0615 1000 Limited to schools with at least 10 students with merged PSSA and SAT scores
HumRRO 44 April 2004
Table 45 School-Level PSSA SAT and Course Grades Correlation Averages for the Class of 2002 and 2003
PSSA SAT Course Grades
Variable Reading Math Verbal Math GPA (Total) English Math
ReadingPSSA
Math
1000
0866 1000
Verbal SAT
Math
0868 0867
0826 0926
1000
0942 1000
GPA
English Course
Grades Math
0453 0418
0427 0393
0463 0472
0406 0401
0381 0378
0451 0468
1000
0779 1000
0753 0580 1000 Limited to schools with at least 10 students with merged PSSA and SAT scores
Table 46 shows that the mean school-level scores for both PSSA 11th grade reading and SAT verbal components of each assessment increased from the Class of 2002 to the Class of 2003 For the SAT the mean school-level change on the verbal component was +330 scale score points For the PSSA the mean school-level scale score change on the 11th grade reading component was +2343 scale score points Table 47 shows the fairly strong relationship between the differences in mean school-level scores on the SAT verbal component and the PSSA reading component for the Classes of 2002 and 2003 This relationship is graphically portrayed in Figure 17 Table 48 Table 49 and Figure 18 show the same information for the math components of the PSSA and SAT As would be expected the relationship between the math components is stronger than for the readingverbal components
Table 46 Difference in Mean School-Level SAT Verbal and PSSA Reading Scores From the Classes of 2002 and 2003
Difference in Mean School-Level Score From the Standard Number ofMeanClass of 2002 and Class of 2003 Deviation Schools SAT Verbal +330 1673 586
PSSA Reading +2343 4660 586 Limited to schools with at least 10 students with merged PSSA and SAT scores
Table 47 Correlation of Difference in School-Level Mean SAT Verbal Score and PSSA Reading Score Between the Classes of 2002 and 2003
Difference in Mean School-Level Score From the SAT PSSA Class of 2002 and Class of 2003 Verbal Reading
SAT Verbal 1
PSSA Reading 462 1
HumRRO 45 April 2004
-200 -100 0 100 200
Difference in School-Level PSSA Reading Mean Score between the Class of 2002 and Class of 2003
-100
-50
0
50
100
Diff
eren
ce in
Sch
ool-L
evel
SA
T V
erba
l Mea
n Sc
ore
betw
een
Cla
ss o
f 200
2 an
d C
lass
of 2
003
$
$$
$
$
$
$$
$
$$
$
$
$
$
$
$
$
$$
$
$
$
$
$
$
$
$
$
$
$
$
$
$$
$
$
$
$
$
$
$
$
$
$ $
$$
$
$
$
$
$
$
$
$$
$
$$
$ $
$$$ $$
$
$
$
$
$
$
$
$
$
$
$
$
$
$$
$
$
$
$$
$$
$$$
$
$$
$
$
$$
$$
$
$
$
$
$
$
$
$
$
$$$
$$$
$
$
$
$
$
$$
$$
$
$$
$
$
$
$
$
$
$
$
$
$
$
$
$
$
$
$
$
$ $
$$
$
$$$ $$
$
$$$
$$
$
$
$
$
$
$
$
$$
$$
$
$
$
$
$
$
$
$
$
$$
$$
$
$$
$
$
$$
$
$
$
$$
$
$$
$
$$
$
$
$
$
$
$
$
$
$
$
$$
$
$$
$$
$
$$$$
$$
$$
$
$$
$
$
$
$
$$
$
$
$
$$
$
$ $$$
$
$ $$
$
$
$
$$
$
$$
$
$
$
$ $$$
$$
$$
$
$ $
$
$
$$
$
$
$
$
$
$
$$
$
$
$ $
$
$
$
$
$$
$
$
$$
$
$
$
$ $$
$
$
$ $
$$
$
$
$
$
$
$
$
$
$
$
$$
$
$
$$ $
$
$
$
$$
$
$
$$ $
$
$
$
$
$
$
$
$
$
$
$
$
$ $
$
$$
$
$$
$
$
$
$
$
$$
$
$
$
$
$
$
$
$
$$
$
$$
$
$
$$$ $
$
$
$$
$$
$
$$
$
$
$ $$ $
$ $
$$
$
$
$$$$
$
$$$
$
$$
$
$
$
$ $
$
$
$
$
$ $$
$
$
$
$
$
$ $
$ $ $
$
$
$
$
$$
$
$
$
$
$
$
$
$ $
$
$$
$
$$ $
$
$
$
$
$
$
$
$ $
$$
$
$
$
$
$
$
$
$$
$
$$
$
$
$
$
$$
$
$
$
$$
$$
$
$
$ $$$
$
$
$
$
$
$
$$$$
$
$$
$
$
$$
$
$$
$
$
$
$$$
$
$$
$
$
$
$
$$
$$
$
$
$
$$
$
$$
$$
$$
$
$
$
$
$$
$
$
$
$$
$
$
$
$
$
$$
$
$
$
$
$$
$
$
$
$
$
$
$$
$$
Figure 17 Scatterplot of difference in school-level SAT verbal mean scores and school-level PSSA 11th grade reading mean scores between the Class of 2002 and Class of 2003
Table 48 Difference in Mean School-Level SAT Math and PSSA Math Scores From the Class of 2002 and Class of 2003
Difference in Mean School-Level Math Score From the Class of 2002 and Class of 2003 Mean Standard
Deviation Number of
Schools
SAT +313 1842 586
PSSA +2367 4687 586 Limited to schools with at least 10 students with merged PSSA and SAT scores
HumRRO 46 April 2004
Table 49 Correlation of Difference in School-Level Mean SAT Math Score and PSSA Math Score Between the Classes of 2002 and 2003
Difference in Mean School-Level Math Score From the Class of 2002 and Class of 2003 SAT PSSA
SAT 1
PSSA 644 1
-200 -100 0 100 200
Difference in School-Level PSSA Math Mean Scale Score between the Class of 2002 and Class of 2003
-100
-50
0
50
100
Diff
eren
ce i
n Sc
hool
-Lev
el S
AT
Mat
h M
ean
Scor
e
betw
e en
the
Clas
s of
200
2 an
d Cl
ass
of 2
003
$
$$ $
$
$$
$
$$
$
$
$$
$
$
$$ $$
$
$
$
$
$
$
$
$
$$$
$
$
$$$
$
$
$
$
$
$
$$
$
$
$
$
$
$
$
$
$$$ $
$
$$
$
$
$
$
$$ $$
$$
$
$
$
$
$
$
$
$$
$
$$
$
$$
$
$
$
$
$ $$$
$
$
$
$
$
$
$
$$
$
$
$
$$
$
$
$
$
$
$ $
$$
$
$
$
$$
$
$$
$
$
$
$
$
$
$
$
$
$$
$
$$
$$
$
$
$
$
$
$$
$
$
$$
$
$
$
$$
$
$
$
$
$
$
$
$
$
$
$
$
$
$
$
$
$$
$
$
$$ $
$
$
$
$
$$
$
$
$
$
$
$
$
$
$
$
$
$
$
$
$
$
$
$
$$
$
$
$
$
$
$
$
$
$
$
$$
$
$
$
$
$$$
$
$
$
$
$
$
$ $$
$
$
$
$
$$
$
$
$
$
$
$$$
$
$
$$$
$
$
$
$
$$
$
$
$$
$
$
$$$
$
$
$
$
$
$
$$$
$
$
$
$
$$
$
$
$
$
$
$
$
$ $
$
$
$
$
$
$
$
$
$
$
$
$
$
$
$
$
$
$
$
$
$
$$$$
$$
$$
$
$$$
$$
$
$$
$
$
$
$
$
$
$
$$
$
$$
$
$
$
$
$
$$
$
$
$
$
$
$$
$
$$
$
$
$$
$
$
$
$
$
$
$
$
$
$
$ $
$
$
$
$
$$
$
$$$ $
$
$
$
$
$
$ $
$$
$
$$
$
$
$$
$ $
$$
$
$
$
$
$
$
$
$
$
$
$
$$
$
$
$
$
$
$
$
$ $
$$
$
$
$
$
$$ $
$
$$
$
$$
$$
$
$
$
$
$
$
$
$
$
$
$$
$
$$
$
$
$$
$
$
$
$
$$
$$
$$$
$$
$
$
$
$$
$
$$
$
$$
$
$
$
$
$
$
$
$
$
$
$
$
$ $$
$
$
$
$
$$
$
$
$
$$
$
$
$
$
$$
$
$$$$
$
$
$
$$$ $
$
$$
$
$
$
$
$
$$
$
$
$$
$$
$ $ $
$
$
$
$
$$
$
$$
$$
$
$
$
$$
$
$
$
$$
$
$
$
$
$
$
$
$$
$
$
$$
$
$
$
Figure 18 Scatterplot of differences in school-level mean SAT math score and school-level mean PSSA math scores between the Classes of 2002 and 2003
Pooled Within-School Correlations
The above discussion alluded to school-level factors such as differences in grading practices which may be impacting observed correlations Figure 19 depicts an extreme version of such a situation Schools A B and C are clearly different in where their students lie with respect to PSSA or SAT scores but they are identical in terms of the grades their students
HumRRO 47 April 2004
receive Also within each school there is a relationship between grades and either PSSA scores or SAT scores However if a correlation were calculated using students from all schools without regard to school-level characteristics it would be zero
School A
School B PSSA or SAT Scores
School C
Grade Point Average (GPA)
Figure 19 Extreme hypothetical illustration of how mean differences among schools on PSSA or SAT scores that are not mirrored by differences in GPA can impact correlations (Ellipses represent students scores within each school)
Pooled within-school correlations are used to estimate relationships between measures calculated within schools and then averaged across all schools These pooled within-school correlations were calculated for each of the two years of data (Table 50 for the Class of 2002 and Table 51 for the Class of 2003) and then averaged across the two years (Table 52)5 The resulting average pooled within-school correlations are presented in Table 52
5 Again the technical r to z correction was used
HumRRO 48 April 2004
Table 50 Pooled Within-School Correlation for the Class of 2002 PSSA SAT Course Grades
Variable Reading Math Verbal Math GPA (Total) English Math
ReadingPSSA
Math
1000
0648 1000
Verbal SAT
Math
0693 0650
0569 0832
1000
0695 1000
GPA
English Course
Grades Math
0528 0573
0461 0412
0361 0542
0516 0559
0465 0402
0349 0541
1000
0703 1000
0668 0443 1000 Limited to schools with at least 10 students with merged PSSA and SAT scores
Table 51 Pooled Within-School Correlation for the Class of 2003 PSSA SAT Course Grades
Variable Reading Math Verbal Math GPA (Total) English Math
ReadingPSSA
Math
1000
0702 1000
Verbal SAT
Math
0757 0629
0666 0857
1000
0662 1000
GPA
English Course
Grades Math
0512 0564
0457 0405
0350 0541
0534 0679
0466 0414
0369 0548
1000
0698 1000
0667 0443 1000 Limited to schools with at least 10 students with merged PSSA and SAT scores
HumRRO 49 April 2004
Table 52 Pooled Within-School Correlation Averaged for Classes of 2002 and 2003 PSSA SAT Course Grades
Variable Reading Math Verbal Math GPA (Total) English Math
ReadingPSSA
Math
1000
0676 1000
Verbal SAT
Math
0727 0640
0620 0845
1000
0679 1000
GPA
English Course
Grades Math
0520 0569
0459 0409
0356 0542
0525 0569
0466 0408
0359 0546
1000
0701 1000
0668 0443 1000 Limited to schools with at least 10 students with merged PSSA and SAT scores
If differences between schoolsrsquo grading procedures are substantial and if within schools students with higher grades also have higher PSSA scores then the correlations in Table 52 will be higher than student correlations in Table 10 (student-level correlations averaged for the Classes of 2002 and 2003) The difference between the GPA correlations in Table 10 and Table 52 however are only marginally different (see Table 53) In nearly all cases the within-school correlations are higher However the range is relatively smallmdash0009 to 0039 for GPA 0176 to 0219 for English course grades and 0147 to 0237 for math course grades Thus grading differences among schools do appear to exist but the effect is small for studentsrsquo GPA but larger for both English and math course grades especially when compared to the matching assessment component (ie English course grade to PSSA reading and SAT verbal math course grade to PSSA math and SAT math)
HumRRO 50 April 2004
Table 53 Differences Between Student-Level Correlations and Pooled Within-School Correlations Averaged for the Classes of 2002 and 2003
GPA or Course Grade to Student-Level Pooled Within- Difference in Assessment Correlations School Correlations Correlations
GPA to PSSA Reading 0511 0520 0009
GPA to PSSA Math 0546 0569 0023
GPA to SAT Verbal 0494 0525 0031
GPA to SAT Math 0530 0569 0039
English to PSSA Reading 0240 0459 0219
English to PSSA Math 0226 0409 0183
English to SAT Verbal 0256 0466 0210
English to SAT Math 0232 0408 0176
Math to PSSA Reading 0202 0356 0154
Math to PSSA Math 0305 0542 0237
Math to SAT Verbal 0212 0359 0147
Math to SAT Math 0313 0546 0233
Comparison of the correlations in Table 52 to Table 10 can also be used to test a hypothesis about the relationship between PSSA and SAT performance It is suggested above that some schools might be working more successfully toward improving PSSA performance than others Again if these efforts are only tangentially affecting SAT scores then we might expect mean differences among schools on PSSA scores that are not mirrored by differences on SAT Within schools however we can still expect students who do better on PSSA to also have a tendency to do better on SAT Figure 20 provides an extreme illustration of this potential effect Comparing correlations between PSSA and SAT from Table 52 to Table 10 reveals no such trend (see Table 54) The differences are all small (-0020 to +0009) suggesting that there are no significant differences among schools in the average PSSA scores of their students that are not mirrored by differences in studentsrsquo SAT scores This conclusion is consistent with the earlier conclusion from the individual level data That is no strong methodological differences in skills requirements are evidenced
HumRRO 51 April 2004
SAT Scores
School A School B School C
PSSA Scale Scores
Figure 20 Extreme hypothetical illustration of how mean differences among schools on PSSA scores that are not mirrored by differences on SAT scores can impact correlations (Ellipses represent students scores within each school)
Table 54 Differences Between SAT and PSSA Components for Student-Level Correlations and Pooled Within-School Correlations Averaged for the Classes of 2002 and 2003
GPA or Course Grade to Student-Level Pooled Within- Difference in Assessment Correlations School Correlations Correlations
PSSA Reading to SAT Verbal 0742 0727 -0015
PSSA Reading to SAT Math 0690 0640 -0020
PSSA Math to SAT Verbal 0629 0620 +0009
PSSA Math to SAT Math 0856 0845 -0009
A third comparison can also be made with the pooled within-school correlations This concerns the intercorrelations within each assessment format The pooled within-school PSSA intercorrelation (Table 52) shows a very slight decrease from student-level PSSA correlations (Table 10) while the pooled within-school SAT intercorrelation (Table 52) shows a larger increase from the student-level SAT intercorrelations (Table 10) It is possible that this is due to an increased homogeneity for the pooled within-school results However Figure 21 presents an exaggerated illustration of another manner in which this difference might be obtained This pattern would yield higher correlations for all students than for students within a school and a higher correlation of school-level scores (school-level PSSA intercorrelation is 0866 school-level SAT intercorrelation is 0942 [both from Table 45]) than for student-level scores (student-level PSSA is 0686 student-level SAT intercorrelation is 0737 [both from Table 10]) Although small (see Table 55) this is the pattern of differences in correlations obtained for both PSSA intercorrelations and for SAT intercorrelations Note that the difference between the PSSA components is smaller than the difference between the SAT components The obtained pattern
HumRRO 52 April 2004
like that in Figure 21 but much less exaggerated could result from differences between schools in the population of their students from differences in instruction that impact PSSA and SAT test scores or both
Content
Area B School A
School B
School C
Content Area A
Figure 21 Exaggerated illustration of how mean differences among schools can increase overall correlations (Ellipses represent students scores within each school)
Table 55 Internal Differences between SAT and PSSA Components for Student-Level Correlations and Pooled Within-School Correlations Averaged for the Classes of 2002 and 2003
GPA or Course Grade to Student-Level Pooled With- Difference in Assessment Correlations School Correlations Correlations
PSSA Reading to PSSA Math 0686 0676 -0010
SAT Verbal to SAT Math 0737 0845 0108
Summary and Conclusion The purpose of this report is to explore the validity questions ldquoAre PSSA scores
appropriately related to other measures of educational achievementrdquo
The data presented in this report suggest the following main points
bull Students who do well on any of the assessments tend to do well on all of the assessmentsmdashPSSA SAT GPA or course grades
bull When schoolsrsquo means are calculated using only the SAT-taking population of students schools with high scores on SAT also have high PSSA scores GPA and course grades are also related to both PSSA and SAT although not as strongly as the relationship between the PSSA and SAT
HumRRO 53 April 2004
PSSA exhibits strong convergent validity coefficients Correlations are very high between PSSA and SAT PSSA is positively correlated with other measures of student achievement including course grades and GPA Gains on PSSA are reflective of changes on SAT at the school level All these data provide strong evidence in support of PSSA as a valid measure of student achievement
There are however a few clarifications and qualifications to these general conclusions but none that diminish the basic findings These clarifications and qualifications include the following
Changes in scores Both mean PSSA and SAT scores experienced an increase Changes between the two assessments are positively correlated Schools that have gained on one assessment tend to have also gained on the other assessment However the same relationship is also true for those schools that have decreased
PSSA and SAT are tied to different content domains use differently formatted items and were designed to serve very different purposes However it is clear from the data that students who tend to perform well on the PSSA can also be expected to perform well on the SAT and vice-versa It is clear from the data that schools that perform well on one test can be expected to perform well on the other It is also clear that schools that improve on one test can be expected to improve on the other
Discriminant validity At the student level and the school level the different assessments of mathematics achievement are more highly related to each other than to assessments of other subjects Students with high mathematics scores on one assessment will tend to do well on all other assessments but that tendency is most pronounced for other mathematics assessments The same holds for school scores There is a similar differentiation on readingverbal assessments at both the student and school level but not as pronounced as in mathematics
GPA shows positive relationships with both PSSA and SAT assessments at the student and school level but not as pronounced as the relationship between the two assessments This is interpreted as being due to differences in schoolsrsquo grading practices Grading practices apparently differ sufficiently to reduce school-level associations with PSSA and SAT scores
Neither gender race socioeconomic status nor limited English proficiency appear to influence the PSSA scores any more than would be expected based on observed differences for SAT scores In other words PSSA items are not injecting any unexpected gender racialethnic socioeconomic status or limited English proficiency bias
HumRRO 54 April 2004
References
Camara WJ amp Schmidt AE (1999) Group differences in standardized testing and social stratification (College Board Report No 99-5) New York College Entrance Examination Board
Campbell D T amp Fiske D W (1959) Convergent and discriminant validation by the multitrait-multimethod matrix Psychological Bulletin 56(2) 81-105
Cassady JC (2001) Self-reported GPA and SAT A Methodological Note Practical Assessment Research amp Evaluation 7(12)
Coe Robert (2002) Itrsquos the effect size stupid What effect size is and why itrsquos important Paper presented at the Annual Conference of the British Educational Research Association University of Exeter England Retrieved from httpwwwleedsacukeducoldocuments00002182htm
Cohen J (1988) Statistical power analysis for the behavioral sciences (2nd ed) Hillsdale NJ Erlbaum
Hoffman R G (1998) Relationships among Kentuckyrsquos open-response assessments ACT scores and studentsrsquo self-reported high school grades (HumRRO Report FR-WATSD-98-27) Radcliff KY Human Resources Research Organization
Lewis DM Mitzel HC amp Green DR (1996) Standard setting A bookmark approach Symposium presented at the Council of Chief State School Officers Conference on Large ndashScale Assessment Phoenix AZ
Livingston SA amp Zieky MJ (1978) Manual for setting standards on the Basic Skills Assessment Test Princeton NJ Educational Testing Service
Mead R amp Melby K (2003 February) Technical analysis Pennsylvania System of School Assessment 2003 reading and mathematics PSSA Data Recognition Corporation
Mead R amp Melby K (2002 April) Technical analysis Pennsylvania System of School Assessment 2001 reading and mathematics PSSA Data Recognition Corporation
Mead R Smith RM amp Swanlund A (2003) Technical analysis 2003 Pennsylvania System of School Assessment mathematics and reading Data Recognition Corporation
NCLB (2004) httpwwwedgovnclblandingjtml
Sicoly Fiore (2002) What do school-level scores from large-scale assessments really measure Educational Measurement Issues and Practice 21(4) 17-26
Terenzini PT Cabrera AF amp Bernal EM (2001) Swimming against the tide The poor in American higher education (Research Report No 2001-1) New York College Entrance Examination Board
Willingham WW amp Cole NS (1997) Gender and Fair Assessment Hillsdale NJ Erlbaum
HumRRO 55 April 2004
HumRROKDE April 2003

2001
PSS
A 1
1th
Gra
de R
eadi
ng S
cale
Sco
re
2000
1800
1600
1400
1200
1000
800
Outliers are hidden Extreme values are hidden
n=13209
n=13432
n=14286
n=13847
n=13265
1 2 3 4 5
2002 SAT Verbal Scores Divided into Quintiles
Advanced
Proficient
Basic
Below Basic
2002 SAT Verbal Quintiles 1 - Less than 420 2 - 420 to 480 3 - 480 to 520 4 - 520 to 580 5 - Greater than 580
Figure 3 Student-level relationship between 2001 PSSA reading scale scores and 2002 SAT verbal scores divided into quintiles for the Class of 2002
HumRRO 13 April 2004
Outliers are hidden Extreme values are hidden
1 2 3 4 5
2003 SAT Verbal Scores Divided Into Quintiles
800
1000
1200
1400
1600
1800
2000
2002
PSS
A 1
1th
Gra
de R
eadi
ng S
cale
Sco
re
n=13969
n=14502 n=13838
n=14314 n=14303
2003 SAT Verbal Quintiles 1 - Less than 420 2 - 420 to 480 3 - 480 to 520 4 - 520 to 580 5 - Greater than 580
Advanced
Proficient
Basic
Below Basic
Figure 4 Student-level relationship between 2002 PSSA 11th grade reading scale scores and 2003 SAT verbal score divided into quintiles for the Class of 2003
SAT Math Score Versus PSSA Performance Level in Math
Figure 5 and Figure 6 show the relationship between the SAT math score on the y-axis and the 11th grade PSSA math performance level on the x-axis for the Classes of 2002 and 2003 The graph shows a distinct stair-step for all levels in both grades The number of students in each level also indicates that more of the higher-achieving students are taking the SAT than are lower-achieving students
HumRRO 14 April 2004
Outliers are hidden Extreme values are hidden
PSSA Performance Levels 1 - Below Basic 2 - Basic 3 - Proficient 4 - Advanced
1 2 3 4
2001 PSSA 11th Grade Math Performance Level
200
300
400
500
600
700
800
2002
SA
T M
ath
Scor
e
n=20950
n=22786 n=14102
n=11487
Figure 5 Student-level relationship between 2002 SAT math score and 2001 PSSA 11th grade math performance level for the Class of 2002
HumRRO 15 April 2004
Outliers are hidden Extreme values are hidden
PSSA Performance Level 1 - Below Basic 2 - Basic 3 - Proficient 4 - Advanced
1 2 3 4
2002 PSSA 11th Grade Math Performance Level
200
300
400
500
600
700
800
2003
SA
T M
ath
Scor
e
n=13459
n=24205
n=24580
n=9267
Figure 6 Student-level relationship between 2003 SAT math score and 2002 PSSA 11th grade math performance level for the Class of 2003
PSSA Math Scale Score versus SAT Math Score by Quintile
Figure 7 and Figure 8 show the relationship between the 11th grade PSSA math scale score on the y-axis and the SAT math score by quintile on the x-axis for the Classes of 2002 and 2003 The graph shows a distinct stair-step for each quintile in both grades Two sets of cut scores are also illustrated on the graph The graphrsquos legend lists the cut scores for each quintile The cut scores were chosen to place approximately 20 of the students taking the SAT in each quintile Because of the number of students with a score equal to the cut score the number of students in each quintile is not the same The cut points for each quintile therefore vary slightly between the two classes The second set of cut scores is represented by the lines that have been added to show the for 11th grade PSSA math performance levels This figure clearly illustrates that more than 75 of students in the each of the top three quintiles or top 60 of those students taking the SAT are performing at the Proficient or Advanced level on the 11th Grade PSSA math assessment Additionally more than 75 of students taking the SAT in the top quintile and more than 50 of students in the second quintile are scoring in the Advanced performance level on the 11th grade PSSA math assessment
HumRRO 16 April 2004
Outliers are hidden Extreme values are hidden
1 2 3 4 5
2002 SAT Math Scores Divided into Quintiles
800
1000
1200
1400
1600
1800
2000
2001
PSS
A 1
1th
Gra
de M
ath
Scal
e Sc
ore
n=14834
n=13952
n=12271
n=13117
n=14015
Advanced
Proficient
Basic
Below Basic
2002 SAT Math Score Quintiles 1 - Less than 410 2 - 410 to 470 3 - 470 to 530 4 - 530 to 600 5 - Above 600
Figure 7 Student-level relationship between 2001 PSSA 11th grade math scale score and 2002 SAT math score divided into quintiles for the Class of 2002
HumRRO 17 April 2004
Outliers are hidden Extreme values are hidden
1 2 3 4 5
2003 SAT Math Scores Divided Into Quintiles
800
1000
1200
1400
1600
1800
2000
2002
PSS
A 1
1th
Gra
de M
ath
Scal
e Sc
ore
n=13337
n=14780
n=15184
n=14494
n=13186
2003 SAT Math Quintiles 1 - Below 410 2 - 410 to 480 3 - 480 to 530 4 - 530 to 600 5 - Above 600
Advanced
Proficient
Basic
Below Basic
Figure 8 Student-level relationship between 2002 PSSA 11th grade math scale scores and 2003 SAT math scores divided into quintiles for the Class of 2003
PSSA Reading Scale Score Versus SAT Reported Average Grade in English
Figure 9 and Figure 10 illustrate the relationship between the PSSA Reading scale scores and the grades students reported in the optional Student Descriptive Questionnaire (SDQ) portion of the SAT The SDQ asked students to report their average grade in English The available responses to this question were 0 ndash Failing 1 ndash Passing 2 ndash Fair 3 ndash Good or 4 ndash Excellent The category ldquoNo responserdquo indicates that the student did not respond to the question In 2002 8305 students did not respond to the English question In 2003 6170 students did not respond In 2002 13 students responded that their average English grade was ldquoFailingrdquo In 2003 6 students had this answer Students who did not respond and those who responded that their average grade was ldquoFailingrdquo were not included in the graphs As can be seen in Figure 10 scale scores in PSSA Reading tend to be higher for students reporting better performance in English coursework The preponderance of students reporting either a ldquoGoodrdquo or an ldquoExcellentrdquo English average scored in the Proficient or Advanced PSSA performance levels Additionally almost 90 of the students reported having either a ldquoGoodrdquo or ldquoExcellentrdquo average in English courses As previously noted self-reported data undoubtedly involves some inaccuracies however Cassady (2001) found studentsrsquo self-reported grades to be a reliable measure of actual grades
HumRRO 18 April 2004
2001
PSS
A 1
1th
Gra
de R
eadi
ng S
cale
Sco
re
2000
1800
1600
1400
1200
1000
800
600
Outliers are hidden Extreme values are hidden
n=27359
n=6538
n=23685
n=244
1 2 3 4
Student-Reported Average Grade for English on SAT Student Descriptive Questionnaire
Advanced
Proficient
Basic
Below Basic
Average Grade 1 - Passing 2 - Fair 3 - Good 4 - Excellent
Figure 9 Student-level relationship between 2001 PSSA 11th grade reading scale score and student-reported average English course grades on the Student Descriptive Questionnaire (SDQ) of the SAT for the Class of 2002
HumRRO 19 April 2004
Outliers are hidden Extreme values are hidden
1 2 3 4
Student-Reported Average Grade for English on SAT Student Descriptive Questionnaire
600
800
1000
1200
1400
1600
1800
2000
2200
2400
2002
PSS
A 1
1th
Gra
de R
eadi
ng S
cale
Sco
re
n=6065 n=26317 n=23397 n=249 Average Grade 1 - Passing 2 - Fair 3 - Good 4 - Excellent
Advanced
Proficient
Basic
Below Basic
Figure 10 Student-level relationship between 2002 PSSA 11th grade reading scale score and student-reported English course grades on the SAT Student Descriptive Questionnaire (SDQ) for the Class of 2003
PSSA Math Scale Score Versus SAT Reported Average Grade in Math
Figure 11 and Figure 12 illustrate the relationship between the PSSA 11th grade math scale scores and the grades students reported in the optional Student Descriptive Questionnaire (SDQ) portion of the SAT which students are asked to complete as part of registering for the SAT The SDQ asked students to report their average grade in math The available responses to this question were 0 ndash Failing 1 ndash Passing 2 ndash Fair 3 ndash Good or 4 ndash Excellent The category ldquoNo responserdquo indicates that the student did not respond to the question In 2002 8523 students did not respond to the math average grade question In 2003 6316 students did not respond In 2002 41 students responded that their average math grade was ldquoFailingrdquo In 2003 47 students had this answer Students who did not respond and those who responded that their average grade was ldquoFailingrdquo were not included in the graphs
HumRRO 20 April 2004
2001
PSS
A 1
1th
Gra
deM
ath
Scal
e Sc
ore 2000
1800
1600
1400
1200
1000
800
600
Outliers are hidden Extreme values are hidden
n=19993
n=11254 n=25509
n=970
1 2 3 4
Student-Reported Average Grade for Math on SAT Student Descriptive Questionnaire
Advanced
Proficient
Basic
Below Basic
Average Grade 1 - Passing 2 - Fair 3 - Good 4 - Excellent
Figure 11 Student-level relationship between 2001 PSSA 11th grade math scale score and student-reported average math course grades in the Student Descriptive Questionnaire (SDQ) of the SAT for the Class of 2002
HumRRO 21 April 2004
Outliers are hidden Extreme values are hidden
1 2 3 4
Student-Reported Average Grade for Math on SAT Student Descriptive Questionnaire
600
800
1000
1200
1400
1600
1800
2000
2002
PSS
A 1
1th
Gra
de M
ath
Scal
e Sc
ore
n=10370 n=24674
n=19835
n=1003
Advanced
Proficient
Basic
Below Basic
Average Grade 1 - Passing 2 - Fair 3 - Good 4 - Excellent
Figure 12 Student-level relationship between 2002 PSSA 11th grade math scale score and student-reported average math course grade in the SAT Student Descriptive Questionnaire (SDQ) for the Class of 2003
PSSA Scale Scores Versus SAT Reported Grade-Point Average
Figure 13 through Figure 16 illustrate relationships between PSSA scale scores and overall grade-point averages (GPAs) The GPAs are from the SATrsquos SDQ Students were asked to provide their GPA on a basic 4-point scale with pluses and minuses around each point (A+ = 43 A = 40 A- = 37 etc) Approximately 87 (60283 of 69325) of students in the Class of 2002 completed the GPA question in the SDQ and 83 (59258 of 71511) of students in the Class of 2003 completed the question The mean student-reported GPA was 333 (SD = 064) for the Class of 2002 and 335 (SD = 063) for the Class of 2003 The correlation for the 2001 PSSA 11th grade reading component with the 2002 GPA was 0501 For the 2001 PSSA 11th grade math component the correlation was 0539 For the 2002 PSSA the correlations were 0520 in Reading and 0553 in Math The box-plots for PSSA scale scores to GPA for both years and both tests performed as expectedmdashlower scores for lower GPAs and higher scores for higher GPAs Note that the median and boxes align fairly well with the appropriate performance levelsmdashA students in the Advanced and Proficient level B students generally in the Proficient level C students in the low Proficient and Basic levels and D students in the Basic level Note also that the number of students decreases sharply when the student-reported GPA drops below 30
HumRRO 22 April 2004
Outliers are hidden Extreme values are hidden
Advanced
Proficient
Basic
Below Basic
10 13 17 20 23 27 30 33 37 40 43
Student-reported GPA (4-point scale) on the 2002 SAT Student Descriptive Questionnaire (SDQ)
800
1000
1200
1400
1600
1800
2000
2001
PSS
A 1
1th
Gra
de R
eadi
ng S
cale
Sco
re
n=10261
n=5370 n=11810
n=11101 n=9668
n=4624
n=2381 n=3352
n=520 n=40
n=96
Figure 13 Student-level relationship between 2001 PSSA 11th grade reading scale score and student-reported grade-point average (GPA) from the SATrsquos Student Descriptive Questionnaire (SDQ) for the Class of 2002
HumRRO 23 April 2004
Outliers are hidden Extreme values are hidden
10 13 17 20 23 27 30 33 37 40 43 Student-reported GPA (4-point scale) on the 2003 SAT Student Descriptive Questionnaire (SDQ)
800
1000
1200
1400
1600
1800
2000
2002
PSS
A 1
1th
Gra
de R
eadi
ng S
cale
Sco
re
n=3304
n=10358
n=5089
n=11480
n=11507
n=9773
n=4602
n=2084 n=97 n=496 n=27
Advanced
Proficient
Basic
Below Basic
Figure 14 Student-level relationship between 2002 PSSA 11th Grade reading scale score and student-reported grade-point average (GPA) from the SATrsquos Student Descriptive Questionnaire (SDQ) for the Class of 2003
HumRRO 24 April 2004
Outliers are hidden Extreme values are hidden
10 13 17 20 23 27 30 33 37 40 43 Student-reported GPA (4-point scale) on the 2002 SAT Student Descriptive Questionnaire (SDQ)
800
1000
1200
1400
1600
1800
2000
2001
PSS
A 1
1th
Gra
de M
ath
Scal
e Sc
ore
n=10280
n=5391 n=11831
n=11123 n=9672
n=4635
n=2393 n=3377
n=526 n=42
n=97
Advanced
Proficient
Basic
Below Basic
Figure 15 Student-level relationship between 2001 PSSA 11th grade math scale score and student-reported grade-point average (GPA) from the SATrsquos Student Descriptive Questionnaire (SDQ) for the Class of 2002
HumRRO 25 April 2004
Outliers are hidden Extreme values are hidden
10 13 17 20 23 27 30 33 37 40 43 Student-reported GPA (4-point scale) on the 2003 SAT Student Descriptive Questionnaire (SDQ)
800
1000
1200
1400
1600
1800
2000
2002
PSS
A 1
1th
Gra
de M
ath
Scal
e Sc
ore
n=3319
n=10364
n=5091
n=11480
n=11514
n=9777
n=4600
n=2085 n=98
n=496
n=27
Advanced
Proficient
Basic
Below Basic
Figure 16 Student-level relationship between 2001 PSSA 11th grade math scale score and student-reported grade-point average (GPA) from the SATrsquos Student Descriptive Questionnaire (SDQ) for the class of 2002
HumRRO 26 April 2004
Differences in Performance for Demographic Groupings
Analyses were conducted to compare performance on the PSSA and SAT among students from varying backgrounds Average test performance tends to differ for students of differing genders ethnic groups and various measures associated with socioeconomic status The important question for judging bias on the PSSA is not whether specific groups show mean differences but whether those differences are larger for the PSSA than the differences observed on other measures of student achievement
Differences between measures of achievement can be captured in several ways This report will present two measures of mean differences First effect size statistics will be calculated for the differences between major categories of students (Coe 2002) The magnitude of the effect size statistics is less important than the difference between the effect sizes for PSSA compared to the other measures However measuring the magnitude of the gaps for NCLB-defined groups is instructive and important since all states are expected to make progress toward closing those gaps (No Child Left Behind 2004)
Effect size statistics can be interpreted as the average percentile standing of the average treated (or experimental) participant relative to the average untreated (or control) participant An effect size of 00 indicates that the mean of the treated group is at the 50th percentile of the control group An effect size of 08 indicates that the mean of the treated group is at the 79th
percentile of the control group An effect size of 17 indicates that the mean of the treated group is at the 955th percentile of the control group Cohen (1988) hesitantly defined effect sizes as ldquosmall d=2rdquo ldquomedium d=5rdquo and ldquolarge d=8rdquo He went on to caution against offering conventional operational definitions such as these in the diverse field of behavioral science
The second measure used to capture differences between measures of achievement was regression analysis Regression analysis was used to examine the extent to which PSSA differences in performance for various demographic groupings are similar to those found in SAT scores For each of the demographic groupings we calculated a regression equation to predict PSSA scores based on the matching SAT content score A second equation was created which added the specific demographic characteristic of interest If PSSA scores exhibit greater differences based on that demographic characteristic that characteristic will have a significant weight and there will be a meaningful increase in the prediction of the PSSA component score
Gender Differences
Table 12 presents performance means for males and females for the PSSA only This table provides information from the larger state population to use in comparison with the matched PSSA and SAT sample data The SAT-taking population can be expected to post higher means For all gender tables data is coded such that positive numbers indicate higher mean scores for males negative numbers indicate higher mean scores for females For the full population of PSSA takers the pattern of performance between males and females is consistent Males outscore females but only to a very small degree on the PSSA mathematics test for all three included years Females outscored males to a higher but still small degree on the PSSA reading test The differences between years are small and inconsistent This table shows that the gap in performance for both PSSA mathematics and reading between males and females is small and has not changed dramatically between 2001 and 2003
HumRRO 27 April 2004
Table 12 Gender Differences for PSSA (Unmatched State Data) Mean Scale Standard Number of Effect Size Year Subject Gender Score Deviation Cases d
Mathematics Male 130954 22870 56380
2001 Reading Female
Male Female
130288 127107 132719
21170 22731 20167
55496 56091 55280
0030
-0261 Mathematics Male 132475 23813 60777
2002 Reading Female
Male Female
130679 129478 133443
21694 22536 20034
59849 60686 59636
0079
-0186 Mathematics Male 132555 22198 63542
2003 Reading Female
Male 130434 129308
20680 24674
61849 63840
0099
Female 133974 22003 62020 -0200
Table 13 and Table 14 present data for the matched sample of students taking both PSSA and SAT by gender Scale scores for both assessments as well as studentsrsquo self-reported GPA are included in the tables The numbers of males versus females in the state student population is similar typically with a few more males than females per grade However many more females take the SAT tests suggesting that more females than males aspire to attend college Males outscored females by a small margin on the PSSA and the SAT mathematics tests This finding is consistent with scoring patterns on SAT and ACT reported by Willingham and Cole (1997) They suggest that as a rule females tend to avoid taking mathematics and science classes In an apparent inconsistency females outscored males on PSSA reading but not on SAT verbal Scores for SAT verbal were nearly identical for males and females Willingham and Cole found gender differences favoring females in writing skills The PSSArsquos performance-task items add a writing component that was not present in the SAT for the Classes of 2002 and 2003 However SAT will include a student-written essay beginning in spring 2005 This study found that females tended to have higher self-reported GPAs than males
Table 13 Gender Differences for Class of 2002 Matched Sample (2001 PSSA and 2002 SAT) Performance Standard Number of Effect SizeSubject Gender MeanMeasure Deviation Cases d
Mathematics Male 141925 20536 29403
PSSA Reading Female
Male Female
137503 137162 139420
19408 18761 16921
36530 29345 36451
0221
-0126 Mathematics Male 52273 11076 29787
SAT Verbal Female
Male 48821 50081
10527 10333
37042 29787
0319
Female 49582 10126 37042 0049
GPA Male Female
3243 3404
656
609 25323 32857 -0255
HumRRO 28 April 2004
Table 14 Gender Differences for Class of 2003 Matched Sample (2001 PSSA and 2002 SAT) Performance Mean Standard Number Effect Size Subject GenderMeasure Score Deviation of Cases d
Mathematics Male 145023 21049 31338
PSSA Reading Female
Male Female
138650 140570 140715
19790 17318 16427
38459 31328 38418
0312
-0009 Mathematics Male 52596 11067 31557
SAT Verbal Female
Male 48997 50524
10490 10235
38745 31557
0327
Female 49623 10097 38745 0089 Male 3265 653 25387GPA Female 3415 600 32925 -0239
Table 15 and Table 16 show regression results for adding gender as a predictor variable to the model for estimating PSSA scores based on SAT scores For both PSSA reading and math the regression weights for gender are negligible and the changes in R-square are essentially nonexistent Gender is coded such that the positive weight means that females tend to have higher reading and math scores than would be expected from gender differences in SAT verbal
Table 15 Regressions Results Showing the Adjusted Strength of Gender on Predicting 2001 PSSA 11th Grade Scale Scores Based on 2002 SAT Scores Standardized Coefficient
PSSA Component SAT Control Gender R2 Change in R2
due to Gender Reading 0704 0495 Reading 0706 +0081 0502 +0006 Math 0847 0717 Math 0851 +0025 0717 +0001
Table 16 Regressions Results Showing the Adjusted Strength of Gender on Predicting 2002 PSSA 11th Grade Scale Scores Based on 2003 SAT Scores Standardized Coefficient
PSSA Component SAT Control Gender R2 Change in R2
due to Gender Reading 0775 0601 Reading 0777 +0038 0602 +0001 Math 0865 0749 Math 0863 -0012 0749 0000
HumRRO 29 April 2004
Ethnic or Racial Differences
Table 17 presents performance means for the four major ethnic or racial groups3 (White Black HispanicLatino and Asian) for the PSSA only For these analyses the racialethnic categories reported with the PSSA data were used It should be noted that starting in 2003 the reported racialethnic categories were changed from those reported in 2001 and 2002 In 2003 the category of ldquoMixedrdquo was no longer included As a result those students previously selecting ldquoMixedrdquo were forced to select one of the other categories For the full population of PSSA takers the pattern of performance between these four groups is fairly consistent In mathematics Asians outscore all groups Whites outscore HispanicsLatinos and Blacks and HispanicsLatinos score between Blacks and Whites For Reading Asians and Whites score approximately the same and Blacks score almost one standard deviation lower than Whites However the score for HispanicsLatinos has shown a decrease over the three years of approximately 30 points This decrease has dropped the HispanicLatino group to below the mean Black group score The number of HispanicLatinos taking the PSSA has increased approximately 40 Blacks approximately 65 and Whites approximately 10 during that time as well
Table 17 EthnicRacial Differences for PSSA (Unmatched State Data) Hispanic Year Subject Measure White Black AsianLatino
2001
Mathematics
Reading
Mean SD
N Effect Size
Mean SD
N Effect Size
132481 21525 92185
131644 21066 91964
113596 17093 8274 0972
115158 20393 8117 0795
116757 18873 2954 0777
117025 21104 2924 0693
140820 24657 2489 -0360
132927 21707 2470 -0060
2002
Mathematics
Reading
Mean SD
N Effect Size
Mean SD
N Effect Size
133935 22098 97659
133917 20351 97428
114090 17626 10783 0993
114887 20070 10715 0942
116438 19041 3534 0848
116193 21155 3535 0854
143430 26757 2659 -0387
133711 22914 2655 0010
2003
Mathematics
Reading
Mean SD
N Effect Size
Mean SD
N
134059 20863
104064
134488 22411
104271
114619 16132 13669 1042
114796 21940 13871 0888
116389 17473 4106 0903
114052 22848 4158 0903
142013 23662 2865 -0357
134943 24743 2866 -0019
3 The racialethnic analyses were limited to these four groups because of the limited number of students in the other groups
HumRRO 30 April 2004
Table 18 and Table 19 present data for the matched sample of students taking both PSSA and SAT by ethnicity Scale scores for both assessments as well as studentsrsquo self-reported GPA are included in the tables In 2002 Asians (726) took the SAT tests at a much higher rate than any other group followed by Whites (608) Blacks (419) and HispanicsLatinos (364) The order remained the same in 2003 although all groups but Asians had a slightly lower percentage in 2002 than in 2003 This suggests that more Asians and Whites aspire to attend college than do Blacks or HispanicLatinos Scores on the PSSA SAT and GPA show the same order for the matched sample as for the total state sample for the PSSA Comparing the effect size for the PSSA versus the effect size for the SAT shows that the effect size for most groups in the Class of 2002 and components is approximately the same for the PSSA and the SAT The largest difference for Blacks is between the PSSA reading and the SAT verbal components (PSSA reading ndash 0883 and SAT verbal ndash 1011) Note also that the effect size for GPA is approximately half the effect size for the PSSA and SAT for Blacks and Hispanics However for Asians the GPA effect size is more similar to the effect size for math than it is for the SAT verbal or PSSA reading components
Table 18 EthnicRacial Differences for the Class of 2002 Matched Sample (2001 PSSA 11th
Grade and 2002 SAT) Performance Hispanic Subject Measure White Black AsianMeasure Latino
PSSA
Mathematics
Reading
Mean SD
N Effect Size
Mean SD
N Effect Size
140809 19272 56063
139658 17004 56017
120809 17759 3735 1079
123658 19180 3678 0883
128529 19483 1076 0634
129112 19199 1064 0582
146256 22812 1808 -0258
138040 19183 1807 0089
SAT
Mathematics
Verbal
Mean SD
N Effect Size
Mean SD
N Effect Size
51041 10409 56693
50476 9670
56693
40286 10268 3872 1040
40619 9836 3872 1011
44332 11082 1096 0624
44378 10964 1096 0590
54820 13077 1838 -0320 49547 13308 1838 0080
GPA
Mean SD
N Effect Size
3364 0621
49617
2940 0667 3337 0658
3126 0640 871
0377
3491 0615 1616 -0205
HumRRO 31 April 2004
Table 19 EthnicRacial Differences for the Class of 2003 for Matched Sample (2002 PSSA 11th
Grade and 2003 SAT) Performance HispanicSubject Measure White Black AsianMeasure Latino
Mean 142999 122766 129030 150221
Mathematics SD N
19659 59076
18097 4516
19834 1178
24869 1951
PSSA Effect Size Mean 142157
1071 125012
0707 129610
-0322 139776
Reading SD N
15746 59038
17622 4500
18763 1184
20264 1951
Effect Size 1026 0724 0131 Mean 51440 39999 43626 55739
Mathematics SD N
10295 59443
9997 4573
10967 1206
12831 1970
SAT Effect Size Mean 50834
1128 40568
0735 43851
-0370 50166
Verbal SD N
9539 59443
9913 4573
10745 1206
13163 1970
Effect Size 1055 0687 0058 Mean 3385 2933 3175 3538
GPA Mathematics SD N
0610 49511
0666 3799
0641 935
0595 1608
Effect Size 0708 0336 -0254
Table 20 through Table 23 show regression results for adding raceethnicity (White versus Black and White versus HispanicLatino) as a predictor variable to the model for estimating PSSA scores based on SAT scores For both PSSA reading and math the regression weights for raceethnicity are negligible and the changes in R-square are essentially nonexistent Raceethnicity is coded such that the negative weight means that Blacks or HispanicsLatinos tend to have lower reading and math scores than would be expected from ethnicity differences in SAT verbal
Table 20 Regressions Results Showing the Adjusted Strength of Being Black on Predicting 2001 PSSA 11th Grade Scale Scores Based on 2002 SAT Scores Standardized Coefficient
PSSA Component SAT
Control Black R2 Change in R2
due to being Black
Reading 0699 0489 Reading 0686 -0059 0493 +0003 Math 0843 0711 Math 0833 -043 0713 +0002
HumRRO 32 April 2004
Table 21 Regressions Results Showing the Adjusted Strength of Being Black on Predicting 2002 PSSA 11th Grade Scale Scores Based on 2003 SAT Scores Standardized Coefficient
PSSA Component SAT
Control Black R2 Change in R2
due to being Black
Reading 0769 0591 Reading 0750 -0068 0595 0004 Math 0863 0745 Math 0857 -0021 0746 0000
Table 22 Regressions Results Showing the Adjusted Strength of Being HispanicLatino on Predicting 2001 PSSA 11th Grade Scale Scores Based on 2002 SAT Scores Standardized Coefficient
PSSA Component SAT
Control HispanicLatino R2 Change in R2
due to being HispanicLatino
Reading 0687 0472 Reading 0685 -0026 0473 +0001 Math 0837 0700 Math 0836 -0014 0700 0000
Table 23 Regressions Results Showing the Adjusted Strength of Being HispanicLatino on Predicting 2002 PSSA 11th Grade Scale Scores Based on 2003 SAT Scores Standardized Coefficient
PSSA Component SAT
Control HispanicLatino R2 Change in R2
due to being HispanicLatino
Reading 0754 0568 Reading 0050 -0034 0569 +0001 Math 0857 0735 Math 0856 -0009 0735 0000
Economically Disadvantaged Differences
Table 24 presents performance means for those students identified as economically disadvantaged for the PSSA only This table provides information from the larger state population to use in comparison with the matched PSSA and SAT sample data The SAT-taking population can be expected to post higher means For the full population of PSSA takers the pattern of performance between males and females is consistent Noneconomically disadvantaged students outscore economically disadvantaged student to a large degree on all components and all years except 2001 when it was a medium degree The number of students identified more than doubled between 2001 and 2002 and increased an additional 40 in 2003
HumRRO 33 April 2004
Table 24 Differences for Economically Disadvantaged Students for PSSA (Unmatched State Data)
Year Subject Economically Disadvantaged
Mean Scale Score
Standard Deviation
Number of Cases
Effect Size d
2001 Mathematics
Reading
Yes No Yes No
118647 131377 118918 130564
18977 22014 21142 21570
8805 107332 8702
106864
0619
0545
2002 Mathematics
Reading
Yes No Yes No
116604 133857 116380 133704
18913 22497 20914 20617
17253 106297 17199 106035
0830
0834 Yes 118211 17997 24022Mathematics No 134575 21063 102919 08352003 Yes 116747 22817 24290Reading No 135050 22319 103137 0811
Table 25 Differences for Economically Disadvantaged Students for Matched Sample for the Class of 2002 (2001 PSSA 11th Grade and 2002 SAT)
Performance Economically Mean Standard Number Effect Measure Subject Disadvantaged Score Deviation of Cases Size
d
PSSA Mathematics
Reading
Yes No Yes No
130598 139668 131768 138535
18830 20044 18336 17829
2893 65296 2863 65176
0466
0374
SAT Mathematics
Verbal
Yes No Yes No
45185 50491 44694 49953
10399 10912 10131 10215
2926 66399 2926 66399
0498
0517
GPA Yes No
3195 3334
0661 0636
2561 57722 0214
HumRRO 34 April 2004
Table 26 Differences for Economically Disadvantaged Students for Matched Sample for the Class of 2003 (2002 PSSA 11th Grade and 2003 SAT) Performance
Measure Subject Economically Disadvantaged
Mean Score
Standard Deviation
Number of Cases
Effect Size d
PSSA Mathematics
Reading
Yes No Yes No
127741 142707 128169 141742
19474 20278 18498 16243
5822 65159 5812 65114
0753
0780
SAT Mathematics
Verbal
Yes No Yes No
42412 51341 42100 50748
10746 10616 10491 9845
5907 65604 5907 65604
0836
0850 Yes 3116 0680 4854GPA No 3369 0620 54404 0389
Table 27 Regressions Results Showing the Adjusted Strength of Being Economically Disadvantaged on Predicting 2001 PSSA 11th Grade Scale Scores Based on 2002 SAT Scores Standardized Coefficient
Change in R2
SAT Economically due to beingPSSA Component R2 Control Disadvantaged Economically
Disadvantaged Reading 0704 0495 Reading 0703 -0004 0495 0000 Math 0846 0715 Math 0845 -0009 0715 0000
Table 28 Regressions Results Showing the Adjusted Strength of Being Economically Disadvantaged on Predicting 2002 PSSA 11th Grade Scale Scores Based on 2003 SAT Scores Standardized Coefficient
SAT Change in R2
PSSA Component Control Economically Disadvantaged R2 due to being
Economically Disadvantaged
Reading 0775 0601 Reading 0765 -044 0602 0002 Math 0865 0749 Math 0864 -0005 0749 0000
Annual Family Income Differences
Camara and Schmidt (1999) point out that family income is related to performance on tests such as the SAT I They also point out that this finding is not unique to the SAT I or college admissions tests Terenzini Cabrera and Bernal (2001) also examined various differences in educational outcomes associated with varying levels of socioeconomic status (SES) This report
HumRRO 35 April 2004
examines differences associated with family income in this section The following section shows differences in student performance related to parental education level Terenzini Cabrera and Bernal (2001) and Camara and Schmidt (1999) point out differences between income wealth and SES
Because annual family income data comes from the SDQ of the SAT only matched student data can be presented showing relationships with family income Table 29 (Class of 2002) and Table 30 (Class of 2003) show student performance on the PSSA SAT and GPA versus four levels of family income As the table clearly shows student scores increase on all performance measures as income goes up However the effect size for GPA is about half of the effect size for either of the assessments The effect size for the PSSA is similar although slightly less than the effect size for the SAT for both components and both years
Table 29 Annual Family Income Differences for Matched Sample for the Class of 2002 (2001 PSSA 11th Grade and 2002 SAT)
Income Level Performance Subject MeasureMeasure $25000 to $40000 tolt $25000 gt $70000$40000 $70000
PSSA
Math
Reading
Mean SD
N Effect Size
Mean SD
N Effect Size
129900 19108 6658
131011 18466 6594
135381 18361 8709 -0293
136210 17165 8693 -0292
139702 18899 16365 -0516
138848 17110 16348 -0440
145045 20032 14902 -0774
142093 16921 14867 -0626
SAT
Math
Verbal
Mean SD
N Effect Size
Mean SD
N Effect Size
44665 10594 6822
44469 10177 6822
47766 10013 8856 -0301 47619 9546 8856 -0319
50272 10136 16549 -0541 49796 9485
16549 -0542
53816 10580 15122 -0864 52825 9815
15122 -0836
GPA
Mean SD
N Effect Size
3173 0656 6596
3262 0636 8607 -0138
3344 0631 16141 -0266
3412 0628
14726 -0372
HumRRO 36 April 2004
Table 30 Annual Family Income Differences for Matched Sample for the Class of 2003 (2002 PSSA 11th Grade and 2003 SAT)
Income Level Performance Subject MeasureMeasure $25000 - $40000 -lt $25000 gt $70000$40000 $70000
Mean 131577 136393 140924 147093
Math SD N
19401 6230
19051 7958
19319 14963
20560 14295
PSSA Effect Size Mean 132698
-0250 137311
-0483 140572
-0776 144569
Reading SD N
17576 6232
16201 7948
15919 14958
15965 14284
Effect Size -0273 -0470 -0707 Mean 44871 47689 50075 53965
Math SD N
10562 6304
10140 8010
10089 15045
10567 14388
SAT Effect Size Mean 44793
-0272 47581
-0504 49653
-0861 52905
Verbal SD N
10345 6304
9578 8010
9354 15045
9689 14388
Effect Size -0280 -0493 -0809 Mean 3188 3279 3357 3428
GPA SD N
0652 6115
0642 7832
0623 14659
0617 14000
Effect Size -0141 -0265 -0378
Parent Educational Differences
Camara and Schmidt (1999) also looked at the impact of parent education on student performance in standardized testing Their study showed that parental education is related to performance on the SAT I Higher parental education is associated with higher scores on the SAT I Table 31 and Table 32 show the means standard deviations number of students and effect size for various levels of student-reported motherrsquos education for the PSSA SAT and GPA The analyses indicate that the effect size for both assessments and GPA are larger as the motherrsquos educational level increases The effect size for PSSA is not as large as the effect size for SAT The effect size for GPA is about half of the effect size for PSSA or SAT Table 33 and Table 34 provide the same information regarding the fatherrsquos education level The results follow the same pattern as that for motherrsquos education level
HumRRO 37 April 2004
Table 31 Mothers Education Level Differences for Matched Sample for the Class of 2002 (2001 PSSA 11th Grade and 2002 SAT)
Subject Measure lt High School
High School
Some College
BABS Degree
Graduate Degree
Mean 128855 135908 138212 145789 148095
Math SD N
18785 2196
18542 18737
19161 16804
19982 12094
20688 6259
PSSA Effect Size Mean 129039
-378 135883
-0493 137803
-0873 143360
-0974 144735
Reading SD N
17886 2189
17134 18696
17441 16762
16733 12078
16981 6245
Effect Size -0377 -0495 -0883 -0985 Mean 43795 48049 49574 54133 55639
Math SD N
10476 2247
10021 18986
10429 17075
10547 12291
10924 6357
SAT Effect Size Mean 42614
-0415 47405
-0553 49277
-0983 53512
-1107 55072
Verbal SD N
99852247
929118986
963517075
9856 12291
10300 6357
Effect Size -0497 -0679 -1099 -1228 Mean 3142 3267 3289 3456 3504 SD 0653 0630 0640 0618 0601 GPA N 2145 18341 16424 11914 6150
Effect Size -0195 -0227 -0494 -0577
Table 32 Mothers Education Level Differences for Matched Sample for the Class of 2003 (2002 PSSA 11th Grade and 2003 SAT)
lt High High Some BABS GraduateSubject Measure School School College Degree Degree Mean 129723 137323 140038 148027 150140 SD 19513 18746 19865 20474 22494 Math N 2072 17801 16646 11406 5961
Effect Size -0397 -0524 -0915 -0970PSSA Mean 129022 137751 139799 145748 147071 SD 18092 16042 16241 15951 16272 Reading N 2066 17787 16638 11406 5954
Effect Size -0511 -0627 -0981 -1059 Mean 43631 48106 49738 54411 55641
Math SD N
10494 2095
10046 17922
10387 16756
10467 11496
11305 5992
SAT Effect Size Mean 42549
-0436 47592
-0585 49432
-1029 53618
-1101 55050
Verbal SD N
10124 2095
925417922
954716756
9795 11496
10522 5992
Effect Size -0520 -0700 -1111 -1211 Mean 3148 3285 3307 3475 3510
GPA SD N
0646 2003
0622 17344
0636 16134
0608 11088
0599 5797
Effect Size -0216 -0248 -0521 -0581
HumRRO 38 April 2004
Table 33 Fathers Education Level Differences for Matched Sample for the Class of 2002 (2001 PSSA 11th Grade and 2002 SAT)
Subject Measure lt High School
High School
Some College
BABS Degree
Graduate Degree
Mean 128908 135041 138368 144843 150072
Math SD N
18443 2850
18251 17616
18721 14573
19645 12461
20736 7835
PSSA Effect Size Mean 129571
-0334 135453
-0509 137985
-0836 142352
-1079 145994
Reading SD N
18191 2289
17066 17558
17291 14539
16798 12454
16661 7838
Effect Size -0333 -0474 -0730 -0942 Mean 43958 47510 49626 53651 56759
Math SD N
10229 2915
992617845
10116 14800
10368 12636
10727 7980
SAT Effect Size Mean 43245
-0352 47058
-0557 49210
-0941 52830
-122 56114
Verbal SD N
97782915
921217845
947514800
9571 12636
10128 7980
Effect Size -0401 -0620 -0991 -1293 Mean 3136 3247 3301 3432 3548 SD 0637 0634 0633 0618 0594 GPA N 2784 17269 14263 12198 7723
Effect Size -0175 -0260 -0472 -0669
Table 34 Fathers Education Level Differences for Matched Sample for the Class of 2003 (2002 PSSA 11th Grade and 2003 SAT)
lt High High Some BABS GraduateSubject Measure School School College Degree Degree Mean 131197 136533 140022 147183 152503 SD 19107 18733 19163 20247 22047 Math N 2766 16981 14422 11633 7272
Effect Size -0282 -0461 -0812 -1033PSSA Mean 130955 137222 140037 144765 148752 SD 17715 15901 15980 15990 16014 Reading N 2761 16968 14412 11629 7265
Effect Size -0372 -0538 -0818 -1054 Mean 44505 47569 49772 53911 57115
Math SD N
10230 2803
9938 17087
10023 14508
10352 11709
11009 7314
SAT Effect Size Mean 43701
-0304 47224
-0520 49499
-0914 52920
-1187 56296
Verbal SD N
9887 2803
919517087
931014508
9580 11709
10294 7314
Effect Size -0369 -0604 -0947 -1248 Mean 3139 3272 3316 3454 3558
GPA SD N
0639 2696
0624 16545
0632 14014
0606 11281
0582 7046
Effect Size -0211 -0279 -0506 -0686
HumRRO 39 April 2004
Limited English Proficiency Differences
Students identified as having limited English proficiency (LEP) would be expected to have more difficulty taking a test in English than those not identified As a result of these difficulties LEP students would be expected to have lower scores than non-LEP students Table 36 shows the mean standard deviation number of students and the effect size for the entire state on the PSSA in 2001 and 2002 As expected LEP students have lower scores than non-LEP students on both components and effect sizes are generally large However the math component effect size is only about half of the effect size for reading
Table 35 Limited English Proficiency Differences for 11th Grade PSSA (Unmatched State Data) Limited EffectMean Scale Standard NumberYear Subject English Size Score Deviation of CasesProficiency d
Yes 115312 18977 492Math No 130476 22047 115645 07372001 Yes 106216 15338 473Reading No 129784 21727 115093 1253 Yes 116560 20254 844Math No 131550 22812 122706 06952002 Yes 102618 16138 840Reading No 131483 21413 122394 1522
Table 36 and Table 37 show the mean standard deviation number of cases and effect size for the matched sample of students in the Classes of 2002 and 2003 The effect sizes are similar to those in the state sample for the PSSA and SATmdashvery larger in verbalreading and medium in math The effect size is slightly larger for PSSA than SAT in math but slightly smaller for PSSA than SAT in readingverbal However the GPA for LEP students is actually slightly higher than the GPA for non-LEP students
Table 36 Limited English Proficiency Differences for Matched Sample for the Class of 2002 (2001 PSSA 11th Grade and 2002 SAT)
LimitedPerformance Standard Number Effect Size Subject English Mean ScoreMeasure Deviation of Cases dProficiency Yes 125974 19661 134Math No 139310 20070 68055 0671PSSA Yes 113745 14649 132Reading No 138297 17876 67907 1502 Yes 42860 13045 136Math No 50282 10934 69189 0617SAT Yes 33353 9807 136Verbal No 49764 10241 69189 1637 Yes 3393 0617 111GPA No 3328 0637 60172 -0104
HumRRO 40 April 2004
Table 37 Limited English Proficiency Differences for Matched Sample for the Class of 2003 (2002 PSSA 11th Grade and 2003 SAT)
LimitedPerformance Mean Standard Number Effect Size Subject EnglishMeasure Score Deviation of Cases dProficiency Yes 126815 20257 289Mathematics No 141539 20607 70692 0721PSSA Yes 109386 15855 288Reading No 140757 16741 70638 1924 Yes 41564 12159 291Mathematics No 50641 10887 71220 0787SAT Yes 32526 8775 291Verbal No 50105 10126 71220 1855 Yes 3358 585 226GPA No 3348 629 59032 -0008
The regression analyses results (Table 38 and Table 39) show that there are negligible changes in R square for predicting PSSA from SAT scores when adding LEP to the equation for both reading and math for both classes
Table 38 Regressions Results Showing the Adjusted Strength of Being Limited English Proficient on Predicting 2001 PSSA 11th Grade Scale Scores Based on 2002 SAT Scores
Standardized Coefficient Change in R2
SAT Limited English due toPSSA Component R2 Control Proficiency Limited English
Proficiency Reading 0704 0495 Reading 0703 -0011 0495 0000
Math 0846 0715 Math 0845 -0004 0715 0000
Table 39 Regressions Results Showing the Adjusted Strength of Being Limited English Proficient on Predicting 2002 PSSA 11th Grade Scale Scores Based on 2003 SAT Scores
Standardized Coefficient Change in R2
PSSA Component SAT Control
Limited English Proficiency R2 due to
Limited English Proficiency
Reading 0775 0601 Reading 0771 -0033 0602 +0001
Math 0865 0749 Math 0865 0000 0749 0000
HumRRO 41 April 2004
School-Level Scores Means were calculated by school for all scale scores and grade indicators to analyze
school-level results School-level descriptive statistics are presented for the Classes of 2002 and 2003 for the PSSA (Table 40) SAT (Table 41) and GPA and course grades (Table 42) Only schools with at least 10 students with merged PSSA and SAT scores are included in the analyses School-level means showed an increase on both tests both test components GPA and course grades from the Class of 2002 to the Class of 2003 The change in scoring procedures from the 2001 PSSA to the 2002 PSSA (instituting a minimum score of 700 for the 2002 PSSA) is problematic However there were only 9 students in this college-bound sample in the Class of 2003 who scored a 700 on the 2002 PSSA reading component and no students who scored a 700 on the math component The change in course grades was extremely small
Table 40 PSSA School-Level Descriptive Statistics for the Classes of 2002 and 2003 Subject Measure Class of 2002 Class of 2003 Reading Mean 136973 139316
SD 7435 7088 N 586 586
Math Mean 136966 139333 SD 8335 8496
N 586 586 Limited to schools with at least 10 students with merged PSSA and SAT scores
Table 41 SAT School-Level Descriptive Statistics for the Classes of 2002 and 2003 Subject Measure Class of 2002 Class of 2003 Verbal Mean 48578 48907
SD 4207 4251 N 586 586
Math Mean 48847 49159 SD 4500 4601
N 586 586 Limited to schools with at least 10 students with merged PSSA and SAT scores
HumRRO 42 April 2004
Table 42 School-Level Descriptive Statistics GPA and Course Grades for the Classes of 2002 and 2003
Subject Measure Class of 2002 Class of 2003 GPA Mean 334 346
SD 019 019 N 586 586
English Mean SD
329 020
331 021
N 586 586 Math Mean 311 312
SD 021 022 N 586 586
Limited to schools with at least 10 students with merged PSSA and SAT scores
Average Within-Year School-Level Correlations
Table 43 and Table 44 present correlations among these school-level scores Table 45 presents correlations for the average across the two years4 As Hoffman (1998) pointed out there is a tendency for correlations among school scores to be higher than correlations among student-level scores (Class of 2002 - Table 8 Class of 2003 - Table 9 and average for the Classes of 2002 and 2003 - Table 10) This is the case except for those correlations involving GPA and course-grades (except for PSSA reading to math course grade and GPA to English course grade where school-level correlations are higher)
As Hoffman (1998) pointed out the lower school-level correlations for GPA suggests that grading scales are not equivalent across schools There is a tendency for different schools to grade differently As a result at the school level of analysis there is a weaker relationship between GPA and either PSSA or ACT scores When studentsrsquo scores are averaged at the school level observed differences are related not only to differing levels of student achievement but to the particular schoolrsquos grading practices However the school-level relationship between GPA and course grades remains strong for both PSSA and SAT
4 Average correlations were technically corrected with Fisherrsquos r to z transformations
HumRRO 43 April 2004
Table 43 School-Level PSSA SAT and Course Grade Correlations for the Class of 2002 PSSA SAT Course Grades
Variable Reading Math Verbal Math GPA (Total) English Math
ReadingPSSA
Math
1000
0861 1000
Verbal SAT
Math
0818 0883
0773 0935
1000
0941 1000
GPA
English Course
Grades Math
0413 0393
0411 0391
0423 0454
0371 0376
0359 0362
0416 0450
1000
0778 1000
0719 0542 1000 Limited to schools with at least 10 students with merged PSSA and SAT scores
Table 44 School-Level PSSA SAT and Course Grades Correlations for the Class of 2003 PSSA SAT Course Grades
Variable Reading Math Verbal Math GPA (Total) English Math
ReadingPSSA
Math
1000
0870 1000
Verbal SAT
Math
0905 0849
0868 0915
1000
0943 1000
GPA
English Course
Grades Math
0491 0443
0442 0394
0501 0489
0439 0425
0402 0394
0484 0486
1000
0780 1000
0784 0615 1000 Limited to schools with at least 10 students with merged PSSA and SAT scores
HumRRO 44 April 2004
Table 45 School-Level PSSA SAT and Course Grades Correlation Averages for the Class of 2002 and 2003
PSSA SAT Course Grades
Variable Reading Math Verbal Math GPA (Total) English Math
ReadingPSSA
Math
1000
0866 1000
Verbal SAT
Math
0868 0867
0826 0926
1000
0942 1000
GPA
English Course
Grades Math
0453 0418
0427 0393
0463 0472
0406 0401
0381 0378
0451 0468
1000
0779 1000
0753 0580 1000 Limited to schools with at least 10 students with merged PSSA and SAT scores
Table 46 shows that the mean school-level scores for both PSSA 11th grade reading and SAT verbal components of each assessment increased from the Class of 2002 to the Class of 2003 For the SAT the mean school-level change on the verbal component was +330 scale score points For the PSSA the mean school-level scale score change on the 11th grade reading component was +2343 scale score points Table 47 shows the fairly strong relationship between the differences in mean school-level scores on the SAT verbal component and the PSSA reading component for the Classes of 2002 and 2003 This relationship is graphically portrayed in Figure 17 Table 48 Table 49 and Figure 18 show the same information for the math components of the PSSA and SAT As would be expected the relationship between the math components is stronger than for the readingverbal components
Table 46 Difference in Mean School-Level SAT Verbal and PSSA Reading Scores From the Classes of 2002 and 2003
Difference in Mean School-Level Score From the Standard Number ofMeanClass of 2002 and Class of 2003 Deviation Schools SAT Verbal +330 1673 586
PSSA Reading +2343 4660 586 Limited to schools with at least 10 students with merged PSSA and SAT scores
Table 47 Correlation of Difference in School-Level Mean SAT Verbal Score and PSSA Reading Score Between the Classes of 2002 and 2003
Difference in Mean School-Level Score From the SAT PSSA Class of 2002 and Class of 2003 Verbal Reading
SAT Verbal 1
PSSA Reading 462 1
HumRRO 45 April 2004
-200 -100 0 100 200
Difference in School-Level PSSA Reading Mean Score between the Class of 2002 and Class of 2003
-100
-50
0
50
100
Diff
eren
ce in
Sch
ool-L
evel
SA
T V
erba
l Mea
n Sc
ore
betw
een
Cla
ss o
f 200
2 an
d C
lass
of 2
003
$
$$
$
$
$
$$
$
$$
$
$
$
$
$
$
$
$$
$
$
$
$
$
$
$
$
$
$
$
$
$
$$
$
$
$
$
$
$
$
$
$
$ $
$$
$
$
$
$
$
$
$
$$
$
$$
$ $
$$$ $$
$
$
$
$
$
$
$
$
$
$
$
$
$
$$
$
$
$
$$
$$
$$$
$
$$
$
$
$$
$$
$
$
$
$
$
$
$
$
$
$$$
$$$
$
$
$
$
$
$$
$$
$
$$
$
$
$
$
$
$
$
$
$
$
$
$
$
$
$
$
$
$ $
$$
$
$$$ $$
$
$$$
$$
$
$
$
$
$
$
$
$$
$$
$
$
$
$
$
$
$
$
$
$$
$$
$
$$
$
$
$$
$
$
$
$$
$
$$
$
$$
$
$
$
$
$
$
$
$
$
$
$$
$
$$
$$
$
$$$$
$$
$$
$
$$
$
$
$
$
$$
$
$
$
$$
$
$ $$$
$
$ $$
$
$
$
$$
$
$$
$
$
$
$ $$$
$$
$$
$
$ $
$
$
$$
$
$
$
$
$
$
$$
$
$
$ $
$
$
$
$
$$
$
$
$$
$
$
$
$ $$
$
$
$ $
$$
$
$
$
$
$
$
$
$
$
$
$$
$
$
$$ $
$
$
$
$$
$
$
$$ $
$
$
$
$
$
$
$
$
$
$
$
$
$ $
$
$$
$
$$
$
$
$
$
$
$$
$
$
$
$
$
$
$
$
$$
$
$$
$
$
$$$ $
$
$
$$
$$
$
$$
$
$
$ $$ $
$ $
$$
$
$
$$$$
$
$$$
$
$$
$
$
$
$ $
$
$
$
$
$ $$
$
$
$
$
$
$ $
$ $ $
$
$
$
$
$$
$
$
$
$
$
$
$
$ $
$
$$
$
$$ $
$
$
$
$
$
$
$
$ $
$$
$
$
$
$
$
$
$
$$
$
$$
$
$
$
$
$$
$
$
$
$$
$$
$
$
$ $$$
$
$
$
$
$
$
$$$$
$
$$
$
$
$$
$
$$
$
$
$
$$$
$
$$
$
$
$
$
$$
$$
$
$
$
$$
$
$$
$$
$$
$
$
$
$
$$
$
$
$
$$
$
$
$
$
$
$$
$
$
$
$
$$
$
$
$
$
$
$
$$
$$
Figure 17 Scatterplot of difference in school-level SAT verbal mean scores and school-level PSSA 11th grade reading mean scores between the Class of 2002 and Class of 2003
Table 48 Difference in Mean School-Level SAT Math and PSSA Math Scores From the Class of 2002 and Class of 2003
Difference in Mean School-Level Math Score From the Class of 2002 and Class of 2003 Mean Standard
Deviation Number of
Schools
SAT +313 1842 586
PSSA +2367 4687 586 Limited to schools with at least 10 students with merged PSSA and SAT scores
HumRRO 46 April 2004
Table 49 Correlation of Difference in School-Level Mean SAT Math Score and PSSA Math Score Between the Classes of 2002 and 2003
Difference in Mean School-Level Math Score From the Class of 2002 and Class of 2003 SAT PSSA
SAT 1
PSSA 644 1
-200 -100 0 100 200
Difference in School-Level PSSA Math Mean Scale Score between the Class of 2002 and Class of 2003
-100
-50
0
50
100
Diff
eren
ce i
n Sc
hool
-Lev
el S
AT
Mat
h M
ean
Scor
e
betw
e en
the
Clas
s of
200
2 an
d Cl
ass
of 2
003
$
$$ $
$
$$
$
$$
$
$
$$
$
$
$$ $$
$
$
$
$
$
$
$
$
$$$
$
$
$$$
$
$
$
$
$
$
$$
$
$
$
$
$
$
$
$
$$$ $
$
$$
$
$
$
$
$$ $$
$$
$
$
$
$
$
$
$
$$
$
$$
$
$$
$
$
$
$
$ $$$
$
$
$
$
$
$
$
$$
$
$
$
$$
$
$
$
$
$
$ $
$$
$
$
$
$$
$
$$
$
$
$
$
$
$
$
$
$
$$
$
$$
$$
$
$
$
$
$
$$
$
$
$$
$
$
$
$$
$
$
$
$
$
$
$
$
$
$
$
$
$
$
$
$
$$
$
$
$$ $
$
$
$
$
$$
$
$
$
$
$
$
$
$
$
$
$
$
$
$
$
$
$
$
$$
$
$
$
$
$
$
$
$
$
$
$$
$
$
$
$
$$$
$
$
$
$
$
$
$ $$
$
$
$
$
$$
$
$
$
$
$
$$$
$
$
$$$
$
$
$
$
$$
$
$
$$
$
$
$$$
$
$
$
$
$
$
$$$
$
$
$
$
$$
$
$
$
$
$
$
$
$ $
$
$
$
$
$
$
$
$
$
$
$
$
$
$
$
$
$
$
$
$
$
$$$$
$$
$$
$
$$$
$$
$
$$
$
$
$
$
$
$
$
$$
$
$$
$
$
$
$
$
$$
$
$
$
$
$
$$
$
$$
$
$
$$
$
$
$
$
$
$
$
$
$
$
$ $
$
$
$
$
$$
$
$$$ $
$
$
$
$
$
$ $
$$
$
$$
$
$
$$
$ $
$$
$
$
$
$
$
$
$
$
$
$
$
$$
$
$
$
$
$
$
$
$ $
$$
$
$
$
$
$$ $
$
$$
$
$$
$$
$
$
$
$
$
$
$
$
$
$
$$
$
$$
$
$
$$
$
$
$
$
$$
$$
$$$
$$
$
$
$
$$
$
$$
$
$$
$
$
$
$
$
$
$
$
$
$
$
$
$ $$
$
$
$
$
$$
$
$
$
$$
$
$
$
$
$$
$
$$$$
$
$
$
$$$ $
$
$$
$
$
$
$
$
$$
$
$
$$
$$
$ $ $
$
$
$
$
$$
$
$$
$$
$
$
$
$$
$
$
$
$$
$
$
$
$
$
$
$
$$
$
$
$$
$
$
$
Figure 18 Scatterplot of differences in school-level mean SAT math score and school-level mean PSSA math scores between the Classes of 2002 and 2003
Pooled Within-School Correlations
The above discussion alluded to school-level factors such as differences in grading practices which may be impacting observed correlations Figure 19 depicts an extreme version of such a situation Schools A B and C are clearly different in where their students lie with respect to PSSA or SAT scores but they are identical in terms of the grades their students
HumRRO 47 April 2004
receive Also within each school there is a relationship between grades and either PSSA scores or SAT scores However if a correlation were calculated using students from all schools without regard to school-level characteristics it would be zero
School A
School B PSSA or SAT Scores
School C
Grade Point Average (GPA)
Figure 19 Extreme hypothetical illustration of how mean differences among schools on PSSA or SAT scores that are not mirrored by differences in GPA can impact correlations (Ellipses represent students scores within each school)
Pooled within-school correlations are used to estimate relationships between measures calculated within schools and then averaged across all schools These pooled within-school correlations were calculated for each of the two years of data (Table 50 for the Class of 2002 and Table 51 for the Class of 2003) and then averaged across the two years (Table 52)5 The resulting average pooled within-school correlations are presented in Table 52
5 Again the technical r to z correction was used
HumRRO 48 April 2004
Table 50 Pooled Within-School Correlation for the Class of 2002 PSSA SAT Course Grades
Variable Reading Math Verbal Math GPA (Total) English Math
ReadingPSSA
Math
1000
0648 1000
Verbal SAT
Math
0693 0650
0569 0832
1000
0695 1000
GPA
English Course
Grades Math
0528 0573
0461 0412
0361 0542
0516 0559
0465 0402
0349 0541
1000
0703 1000
0668 0443 1000 Limited to schools with at least 10 students with merged PSSA and SAT scores
Table 51 Pooled Within-School Correlation for the Class of 2003 PSSA SAT Course Grades
Variable Reading Math Verbal Math GPA (Total) English Math
ReadingPSSA
Math
1000
0702 1000
Verbal SAT
Math
0757 0629
0666 0857
1000
0662 1000
GPA
English Course
Grades Math
0512 0564
0457 0405
0350 0541
0534 0679
0466 0414
0369 0548
1000
0698 1000
0667 0443 1000 Limited to schools with at least 10 students with merged PSSA and SAT scores
HumRRO 49 April 2004
Table 52 Pooled Within-School Correlation Averaged for Classes of 2002 and 2003 PSSA SAT Course Grades
Variable Reading Math Verbal Math GPA (Total) English Math
ReadingPSSA
Math
1000
0676 1000
Verbal SAT
Math
0727 0640
0620 0845
1000
0679 1000
GPA
English Course
Grades Math
0520 0569
0459 0409
0356 0542
0525 0569
0466 0408
0359 0546
1000
0701 1000
0668 0443 1000 Limited to schools with at least 10 students with merged PSSA and SAT scores
If differences between schoolsrsquo grading procedures are substantial and if within schools students with higher grades also have higher PSSA scores then the correlations in Table 52 will be higher than student correlations in Table 10 (student-level correlations averaged for the Classes of 2002 and 2003) The difference between the GPA correlations in Table 10 and Table 52 however are only marginally different (see Table 53) In nearly all cases the within-school correlations are higher However the range is relatively smallmdash0009 to 0039 for GPA 0176 to 0219 for English course grades and 0147 to 0237 for math course grades Thus grading differences among schools do appear to exist but the effect is small for studentsrsquo GPA but larger for both English and math course grades especially when compared to the matching assessment component (ie English course grade to PSSA reading and SAT verbal math course grade to PSSA math and SAT math)
HumRRO 50 April 2004
Table 53 Differences Between Student-Level Correlations and Pooled Within-School Correlations Averaged for the Classes of 2002 and 2003
GPA or Course Grade to Student-Level Pooled Within- Difference in Assessment Correlations School Correlations Correlations
GPA to PSSA Reading 0511 0520 0009
GPA to PSSA Math 0546 0569 0023
GPA to SAT Verbal 0494 0525 0031
GPA to SAT Math 0530 0569 0039
English to PSSA Reading 0240 0459 0219
English to PSSA Math 0226 0409 0183
English to SAT Verbal 0256 0466 0210
English to SAT Math 0232 0408 0176
Math to PSSA Reading 0202 0356 0154
Math to PSSA Math 0305 0542 0237
Math to SAT Verbal 0212 0359 0147
Math to SAT Math 0313 0546 0233
Comparison of the correlations in Table 52 to Table 10 can also be used to test a hypothesis about the relationship between PSSA and SAT performance It is suggested above that some schools might be working more successfully toward improving PSSA performance than others Again if these efforts are only tangentially affecting SAT scores then we might expect mean differences among schools on PSSA scores that are not mirrored by differences on SAT Within schools however we can still expect students who do better on PSSA to also have a tendency to do better on SAT Figure 20 provides an extreme illustration of this potential effect Comparing correlations between PSSA and SAT from Table 52 to Table 10 reveals no such trend (see Table 54) The differences are all small (-0020 to +0009) suggesting that there are no significant differences among schools in the average PSSA scores of their students that are not mirrored by differences in studentsrsquo SAT scores This conclusion is consistent with the earlier conclusion from the individual level data That is no strong methodological differences in skills requirements are evidenced
HumRRO 51 April 2004
SAT Scores
School A School B School C
PSSA Scale Scores
Figure 20 Extreme hypothetical illustration of how mean differences among schools on PSSA scores that are not mirrored by differences on SAT scores can impact correlations (Ellipses represent students scores within each school)
Table 54 Differences Between SAT and PSSA Components for Student-Level Correlations and Pooled Within-School Correlations Averaged for the Classes of 2002 and 2003
GPA or Course Grade to Student-Level Pooled Within- Difference in Assessment Correlations School Correlations Correlations
PSSA Reading to SAT Verbal 0742 0727 -0015
PSSA Reading to SAT Math 0690 0640 -0020
PSSA Math to SAT Verbal 0629 0620 +0009
PSSA Math to SAT Math 0856 0845 -0009
A third comparison can also be made with the pooled within-school correlations This concerns the intercorrelations within each assessment format The pooled within-school PSSA intercorrelation (Table 52) shows a very slight decrease from student-level PSSA correlations (Table 10) while the pooled within-school SAT intercorrelation (Table 52) shows a larger increase from the student-level SAT intercorrelations (Table 10) It is possible that this is due to an increased homogeneity for the pooled within-school results However Figure 21 presents an exaggerated illustration of another manner in which this difference might be obtained This pattern would yield higher correlations for all students than for students within a school and a higher correlation of school-level scores (school-level PSSA intercorrelation is 0866 school-level SAT intercorrelation is 0942 [both from Table 45]) than for student-level scores (student-level PSSA is 0686 student-level SAT intercorrelation is 0737 [both from Table 10]) Although small (see Table 55) this is the pattern of differences in correlations obtained for both PSSA intercorrelations and for SAT intercorrelations Note that the difference between the PSSA components is smaller than the difference between the SAT components The obtained pattern
HumRRO 52 April 2004
like that in Figure 21 but much less exaggerated could result from differences between schools in the population of their students from differences in instruction that impact PSSA and SAT test scores or both
Content
Area B School A
School B
School C
Content Area A
Figure 21 Exaggerated illustration of how mean differences among schools can increase overall correlations (Ellipses represent students scores within each school)
Table 55 Internal Differences between SAT and PSSA Components for Student-Level Correlations and Pooled Within-School Correlations Averaged for the Classes of 2002 and 2003
GPA or Course Grade to Student-Level Pooled With- Difference in Assessment Correlations School Correlations Correlations
PSSA Reading to PSSA Math 0686 0676 -0010
SAT Verbal to SAT Math 0737 0845 0108
Summary and Conclusion The purpose of this report is to explore the validity questions ldquoAre PSSA scores
appropriately related to other measures of educational achievementrdquo
The data presented in this report suggest the following main points
bull Students who do well on any of the assessments tend to do well on all of the assessmentsmdashPSSA SAT GPA or course grades
bull When schoolsrsquo means are calculated using only the SAT-taking population of students schools with high scores on SAT also have high PSSA scores GPA and course grades are also related to both PSSA and SAT although not as strongly as the relationship between the PSSA and SAT
HumRRO 53 April 2004
PSSA exhibits strong convergent validity coefficients Correlations are very high between PSSA and SAT PSSA is positively correlated with other measures of student achievement including course grades and GPA Gains on PSSA are reflective of changes on SAT at the school level All these data provide strong evidence in support of PSSA as a valid measure of student achievement
There are however a few clarifications and qualifications to these general conclusions but none that diminish the basic findings These clarifications and qualifications include the following
Changes in scores Both mean PSSA and SAT scores experienced an increase Changes between the two assessments are positively correlated Schools that have gained on one assessment tend to have also gained on the other assessment However the same relationship is also true for those schools that have decreased
PSSA and SAT are tied to different content domains use differently formatted items and were designed to serve very different purposes However it is clear from the data that students who tend to perform well on the PSSA can also be expected to perform well on the SAT and vice-versa It is clear from the data that schools that perform well on one test can be expected to perform well on the other It is also clear that schools that improve on one test can be expected to improve on the other
Discriminant validity At the student level and the school level the different assessments of mathematics achievement are more highly related to each other than to assessments of other subjects Students with high mathematics scores on one assessment will tend to do well on all other assessments but that tendency is most pronounced for other mathematics assessments The same holds for school scores There is a similar differentiation on readingverbal assessments at both the student and school level but not as pronounced as in mathematics
GPA shows positive relationships with both PSSA and SAT assessments at the student and school level but not as pronounced as the relationship between the two assessments This is interpreted as being due to differences in schoolsrsquo grading practices Grading practices apparently differ sufficiently to reduce school-level associations with PSSA and SAT scores
Neither gender race socioeconomic status nor limited English proficiency appear to influence the PSSA scores any more than would be expected based on observed differences for SAT scores In other words PSSA items are not injecting any unexpected gender racialethnic socioeconomic status or limited English proficiency bias
HumRRO 54 April 2004
References
Camara WJ amp Schmidt AE (1999) Group differences in standardized testing and social stratification (College Board Report No 99-5) New York College Entrance Examination Board
Campbell D T amp Fiske D W (1959) Convergent and discriminant validation by the multitrait-multimethod matrix Psychological Bulletin 56(2) 81-105
Cassady JC (2001) Self-reported GPA and SAT A Methodological Note Practical Assessment Research amp Evaluation 7(12)
Coe Robert (2002) Itrsquos the effect size stupid What effect size is and why itrsquos important Paper presented at the Annual Conference of the British Educational Research Association University of Exeter England Retrieved from httpwwwleedsacukeducoldocuments00002182htm
Cohen J (1988) Statistical power analysis for the behavioral sciences (2nd ed) Hillsdale NJ Erlbaum
Hoffman R G (1998) Relationships among Kentuckyrsquos open-response assessments ACT scores and studentsrsquo self-reported high school grades (HumRRO Report FR-WATSD-98-27) Radcliff KY Human Resources Research Organization
Lewis DM Mitzel HC amp Green DR (1996) Standard setting A bookmark approach Symposium presented at the Council of Chief State School Officers Conference on Large ndashScale Assessment Phoenix AZ
Livingston SA amp Zieky MJ (1978) Manual for setting standards on the Basic Skills Assessment Test Princeton NJ Educational Testing Service
Mead R amp Melby K (2003 February) Technical analysis Pennsylvania System of School Assessment 2003 reading and mathematics PSSA Data Recognition Corporation
Mead R amp Melby K (2002 April) Technical analysis Pennsylvania System of School Assessment 2001 reading and mathematics PSSA Data Recognition Corporation
Mead R Smith RM amp Swanlund A (2003) Technical analysis 2003 Pennsylvania System of School Assessment mathematics and reading Data Recognition Corporation
NCLB (2004) httpwwwedgovnclblandingjtml
Sicoly Fiore (2002) What do school-level scores from large-scale assessments really measure Educational Measurement Issues and Practice 21(4) 17-26
Terenzini PT Cabrera AF amp Bernal EM (2001) Swimming against the tide The poor in American higher education (Research Report No 2001-1) New York College Entrance Examination Board
Willingham WW amp Cole NS (1997) Gender and Fair Assessment Hillsdale NJ Erlbaum
HumRRO 55 April 2004
HumRROKDE April 2003

Outliers are hidden Extreme values are hidden
1 2 3 4 5
2003 SAT Verbal Scores Divided Into Quintiles
800
1000
1200
1400
1600
1800
2000
2002
PSS
A 1
1th
Gra
de R
eadi
ng S
cale
Sco
re
n=13969
n=14502 n=13838
n=14314 n=14303
2003 SAT Verbal Quintiles 1 - Less than 420 2 - 420 to 480 3 - 480 to 520 4 - 520 to 580 5 - Greater than 580
Advanced
Proficient
Basic
Below Basic
Figure 4 Student-level relationship between 2002 PSSA 11th grade reading scale scores and 2003 SAT verbal score divided into quintiles for the Class of 2003
SAT Math Score Versus PSSA Performance Level in Math
Figure 5 and Figure 6 show the relationship between the SAT math score on the y-axis and the 11th grade PSSA math performance level on the x-axis for the Classes of 2002 and 2003 The graph shows a distinct stair-step for all levels in both grades The number of students in each level also indicates that more of the higher-achieving students are taking the SAT than are lower-achieving students
HumRRO 14 April 2004
Outliers are hidden Extreme values are hidden
PSSA Performance Levels 1 - Below Basic 2 - Basic 3 - Proficient 4 - Advanced
1 2 3 4
2001 PSSA 11th Grade Math Performance Level
200
300
400
500
600
700
800
2002
SA
T M
ath
Scor
e
n=20950
n=22786 n=14102
n=11487
Figure 5 Student-level relationship between 2002 SAT math score and 2001 PSSA 11th grade math performance level for the Class of 2002
HumRRO 15 April 2004
Outliers are hidden Extreme values are hidden
PSSA Performance Level 1 - Below Basic 2 - Basic 3 - Proficient 4 - Advanced
1 2 3 4
2002 PSSA 11th Grade Math Performance Level
200
300
400
500
600
700
800
2003
SA
T M
ath
Scor
e
n=13459
n=24205
n=24580
n=9267
Figure 6 Student-level relationship between 2003 SAT math score and 2002 PSSA 11th grade math performance level for the Class of 2003
PSSA Math Scale Score versus SAT Math Score by Quintile
Figure 7 and Figure 8 show the relationship between the 11th grade PSSA math scale score on the y-axis and the SAT math score by quintile on the x-axis for the Classes of 2002 and 2003 The graph shows a distinct stair-step for each quintile in both grades Two sets of cut scores are also illustrated on the graph The graphrsquos legend lists the cut scores for each quintile The cut scores were chosen to place approximately 20 of the students taking the SAT in each quintile Because of the number of students with a score equal to the cut score the number of students in each quintile is not the same The cut points for each quintile therefore vary slightly between the two classes The second set of cut scores is represented by the lines that have been added to show the for 11th grade PSSA math performance levels This figure clearly illustrates that more than 75 of students in the each of the top three quintiles or top 60 of those students taking the SAT are performing at the Proficient or Advanced level on the 11th Grade PSSA math assessment Additionally more than 75 of students taking the SAT in the top quintile and more than 50 of students in the second quintile are scoring in the Advanced performance level on the 11th grade PSSA math assessment
HumRRO 16 April 2004
Outliers are hidden Extreme values are hidden
1 2 3 4 5
2002 SAT Math Scores Divided into Quintiles
800
1000
1200
1400
1600
1800
2000
2001
PSS
A 1
1th
Gra
de M
ath
Scal
e Sc
ore
n=14834
n=13952
n=12271
n=13117
n=14015
Advanced
Proficient
Basic
Below Basic
2002 SAT Math Score Quintiles 1 - Less than 410 2 - 410 to 470 3 - 470 to 530 4 - 530 to 600 5 - Above 600
Figure 7 Student-level relationship between 2001 PSSA 11th grade math scale score and 2002 SAT math score divided into quintiles for the Class of 2002
HumRRO 17 April 2004
Outliers are hidden Extreme values are hidden
1 2 3 4 5
2003 SAT Math Scores Divided Into Quintiles
800
1000
1200
1400
1600
1800
2000
2002
PSS
A 1
1th
Gra
de M
ath
Scal
e Sc
ore
n=13337
n=14780
n=15184
n=14494
n=13186
2003 SAT Math Quintiles 1 - Below 410 2 - 410 to 480 3 - 480 to 530 4 - 530 to 600 5 - Above 600
Advanced
Proficient
Basic
Below Basic
Figure 8 Student-level relationship between 2002 PSSA 11th grade math scale scores and 2003 SAT math scores divided into quintiles for the Class of 2003
PSSA Reading Scale Score Versus SAT Reported Average Grade in English
Figure 9 and Figure 10 illustrate the relationship between the PSSA Reading scale scores and the grades students reported in the optional Student Descriptive Questionnaire (SDQ) portion of the SAT The SDQ asked students to report their average grade in English The available responses to this question were 0 ndash Failing 1 ndash Passing 2 ndash Fair 3 ndash Good or 4 ndash Excellent The category ldquoNo responserdquo indicates that the student did not respond to the question In 2002 8305 students did not respond to the English question In 2003 6170 students did not respond In 2002 13 students responded that their average English grade was ldquoFailingrdquo In 2003 6 students had this answer Students who did not respond and those who responded that their average grade was ldquoFailingrdquo were not included in the graphs As can be seen in Figure 10 scale scores in PSSA Reading tend to be higher for students reporting better performance in English coursework The preponderance of students reporting either a ldquoGoodrdquo or an ldquoExcellentrdquo English average scored in the Proficient or Advanced PSSA performance levels Additionally almost 90 of the students reported having either a ldquoGoodrdquo or ldquoExcellentrdquo average in English courses As previously noted self-reported data undoubtedly involves some inaccuracies however Cassady (2001) found studentsrsquo self-reported grades to be a reliable measure of actual grades
HumRRO 18 April 2004
2001
PSS
A 1
1th
Gra
de R
eadi
ng S
cale
Sco
re
2000
1800
1600
1400
1200
1000
800
600
Outliers are hidden Extreme values are hidden
n=27359
n=6538
n=23685
n=244
1 2 3 4
Student-Reported Average Grade for English on SAT Student Descriptive Questionnaire
Advanced
Proficient
Basic
Below Basic
Average Grade 1 - Passing 2 - Fair 3 - Good 4 - Excellent
Figure 9 Student-level relationship between 2001 PSSA 11th grade reading scale score and student-reported average English course grades on the Student Descriptive Questionnaire (SDQ) of the SAT for the Class of 2002
HumRRO 19 April 2004
Outliers are hidden Extreme values are hidden
1 2 3 4
Student-Reported Average Grade for English on SAT Student Descriptive Questionnaire
600
800
1000
1200
1400
1600
1800
2000
2200
2400
2002
PSS
A 1
1th
Gra
de R
eadi
ng S
cale
Sco
re
n=6065 n=26317 n=23397 n=249 Average Grade 1 - Passing 2 - Fair 3 - Good 4 - Excellent
Advanced
Proficient
Basic
Below Basic
Figure 10 Student-level relationship between 2002 PSSA 11th grade reading scale score and student-reported English course grades on the SAT Student Descriptive Questionnaire (SDQ) for the Class of 2003
PSSA Math Scale Score Versus SAT Reported Average Grade in Math
Figure 11 and Figure 12 illustrate the relationship between the PSSA 11th grade math scale scores and the grades students reported in the optional Student Descriptive Questionnaire (SDQ) portion of the SAT which students are asked to complete as part of registering for the SAT The SDQ asked students to report their average grade in math The available responses to this question were 0 ndash Failing 1 ndash Passing 2 ndash Fair 3 ndash Good or 4 ndash Excellent The category ldquoNo responserdquo indicates that the student did not respond to the question In 2002 8523 students did not respond to the math average grade question In 2003 6316 students did not respond In 2002 41 students responded that their average math grade was ldquoFailingrdquo In 2003 47 students had this answer Students who did not respond and those who responded that their average grade was ldquoFailingrdquo were not included in the graphs
HumRRO 20 April 2004
2001
PSS
A 1
1th
Gra
deM
ath
Scal
e Sc
ore 2000
1800
1600
1400
1200
1000
800
600
Outliers are hidden Extreme values are hidden
n=19993
n=11254 n=25509
n=970
1 2 3 4
Student-Reported Average Grade for Math on SAT Student Descriptive Questionnaire
Advanced
Proficient
Basic
Below Basic
Average Grade 1 - Passing 2 - Fair 3 - Good 4 - Excellent
Figure 11 Student-level relationship between 2001 PSSA 11th grade math scale score and student-reported average math course grades in the Student Descriptive Questionnaire (SDQ) of the SAT for the Class of 2002
HumRRO 21 April 2004
Outliers are hidden Extreme values are hidden
1 2 3 4
Student-Reported Average Grade for Math on SAT Student Descriptive Questionnaire
600
800
1000
1200
1400
1600
1800
2000
2002
PSS
A 1
1th
Gra
de M
ath
Scal
e Sc
ore
n=10370 n=24674
n=19835
n=1003
Advanced
Proficient
Basic
Below Basic
Average Grade 1 - Passing 2 - Fair 3 - Good 4 - Excellent
Figure 12 Student-level relationship between 2002 PSSA 11th grade math scale score and student-reported average math course grade in the SAT Student Descriptive Questionnaire (SDQ) for the Class of 2003
PSSA Scale Scores Versus SAT Reported Grade-Point Average
Figure 13 through Figure 16 illustrate relationships between PSSA scale scores and overall grade-point averages (GPAs) The GPAs are from the SATrsquos SDQ Students were asked to provide their GPA on a basic 4-point scale with pluses and minuses around each point (A+ = 43 A = 40 A- = 37 etc) Approximately 87 (60283 of 69325) of students in the Class of 2002 completed the GPA question in the SDQ and 83 (59258 of 71511) of students in the Class of 2003 completed the question The mean student-reported GPA was 333 (SD = 064) for the Class of 2002 and 335 (SD = 063) for the Class of 2003 The correlation for the 2001 PSSA 11th grade reading component with the 2002 GPA was 0501 For the 2001 PSSA 11th grade math component the correlation was 0539 For the 2002 PSSA the correlations were 0520 in Reading and 0553 in Math The box-plots for PSSA scale scores to GPA for both years and both tests performed as expectedmdashlower scores for lower GPAs and higher scores for higher GPAs Note that the median and boxes align fairly well with the appropriate performance levelsmdashA students in the Advanced and Proficient level B students generally in the Proficient level C students in the low Proficient and Basic levels and D students in the Basic level Note also that the number of students decreases sharply when the student-reported GPA drops below 30
HumRRO 22 April 2004
Outliers are hidden Extreme values are hidden
Advanced
Proficient
Basic
Below Basic
10 13 17 20 23 27 30 33 37 40 43
Student-reported GPA (4-point scale) on the 2002 SAT Student Descriptive Questionnaire (SDQ)
800
1000
1200
1400
1600
1800
2000
2001
PSS
A 1
1th
Gra
de R
eadi
ng S
cale
Sco
re
n=10261
n=5370 n=11810
n=11101 n=9668
n=4624
n=2381 n=3352
n=520 n=40
n=96
Figure 13 Student-level relationship between 2001 PSSA 11th grade reading scale score and student-reported grade-point average (GPA) from the SATrsquos Student Descriptive Questionnaire (SDQ) for the Class of 2002
HumRRO 23 April 2004
Outliers are hidden Extreme values are hidden
10 13 17 20 23 27 30 33 37 40 43 Student-reported GPA (4-point scale) on the 2003 SAT Student Descriptive Questionnaire (SDQ)
800
1000
1200
1400
1600
1800
2000
2002
PSS
A 1
1th
Gra
de R
eadi
ng S
cale
Sco
re
n=3304
n=10358
n=5089
n=11480
n=11507
n=9773
n=4602
n=2084 n=97 n=496 n=27
Advanced
Proficient
Basic
Below Basic
Figure 14 Student-level relationship between 2002 PSSA 11th Grade reading scale score and student-reported grade-point average (GPA) from the SATrsquos Student Descriptive Questionnaire (SDQ) for the Class of 2003
HumRRO 24 April 2004
Outliers are hidden Extreme values are hidden
10 13 17 20 23 27 30 33 37 40 43 Student-reported GPA (4-point scale) on the 2002 SAT Student Descriptive Questionnaire (SDQ)
800
1000
1200
1400
1600
1800
2000
2001
PSS
A 1
1th
Gra
de M
ath
Scal
e Sc
ore
n=10280
n=5391 n=11831
n=11123 n=9672
n=4635
n=2393 n=3377
n=526 n=42
n=97
Advanced
Proficient
Basic
Below Basic
Figure 15 Student-level relationship between 2001 PSSA 11th grade math scale score and student-reported grade-point average (GPA) from the SATrsquos Student Descriptive Questionnaire (SDQ) for the Class of 2002
HumRRO 25 April 2004
Outliers are hidden Extreme values are hidden
10 13 17 20 23 27 30 33 37 40 43 Student-reported GPA (4-point scale) on the 2003 SAT Student Descriptive Questionnaire (SDQ)
800
1000
1200
1400
1600
1800
2000
2002
PSS
A 1
1th
Gra
de M
ath
Scal
e Sc
ore
n=3319
n=10364
n=5091
n=11480
n=11514
n=9777
n=4600
n=2085 n=98
n=496
n=27
Advanced
Proficient
Basic
Below Basic
Figure 16 Student-level relationship between 2001 PSSA 11th grade math scale score and student-reported grade-point average (GPA) from the SATrsquos Student Descriptive Questionnaire (SDQ) for the class of 2002
HumRRO 26 April 2004
Differences in Performance for Demographic Groupings
Analyses were conducted to compare performance on the PSSA and SAT among students from varying backgrounds Average test performance tends to differ for students of differing genders ethnic groups and various measures associated with socioeconomic status The important question for judging bias on the PSSA is not whether specific groups show mean differences but whether those differences are larger for the PSSA than the differences observed on other measures of student achievement
Differences between measures of achievement can be captured in several ways This report will present two measures of mean differences First effect size statistics will be calculated for the differences between major categories of students (Coe 2002) The magnitude of the effect size statistics is less important than the difference between the effect sizes for PSSA compared to the other measures However measuring the magnitude of the gaps for NCLB-defined groups is instructive and important since all states are expected to make progress toward closing those gaps (No Child Left Behind 2004)
Effect size statistics can be interpreted as the average percentile standing of the average treated (or experimental) participant relative to the average untreated (or control) participant An effect size of 00 indicates that the mean of the treated group is at the 50th percentile of the control group An effect size of 08 indicates that the mean of the treated group is at the 79th
percentile of the control group An effect size of 17 indicates that the mean of the treated group is at the 955th percentile of the control group Cohen (1988) hesitantly defined effect sizes as ldquosmall d=2rdquo ldquomedium d=5rdquo and ldquolarge d=8rdquo He went on to caution against offering conventional operational definitions such as these in the diverse field of behavioral science
The second measure used to capture differences between measures of achievement was regression analysis Regression analysis was used to examine the extent to which PSSA differences in performance for various demographic groupings are similar to those found in SAT scores For each of the demographic groupings we calculated a regression equation to predict PSSA scores based on the matching SAT content score A second equation was created which added the specific demographic characteristic of interest If PSSA scores exhibit greater differences based on that demographic characteristic that characteristic will have a significant weight and there will be a meaningful increase in the prediction of the PSSA component score
Gender Differences
Table 12 presents performance means for males and females for the PSSA only This table provides information from the larger state population to use in comparison with the matched PSSA and SAT sample data The SAT-taking population can be expected to post higher means For all gender tables data is coded such that positive numbers indicate higher mean scores for males negative numbers indicate higher mean scores for females For the full population of PSSA takers the pattern of performance between males and females is consistent Males outscore females but only to a very small degree on the PSSA mathematics test for all three included years Females outscored males to a higher but still small degree on the PSSA reading test The differences between years are small and inconsistent This table shows that the gap in performance for both PSSA mathematics and reading between males and females is small and has not changed dramatically between 2001 and 2003
HumRRO 27 April 2004
Table 12 Gender Differences for PSSA (Unmatched State Data) Mean Scale Standard Number of Effect Size Year Subject Gender Score Deviation Cases d
Mathematics Male 130954 22870 56380
2001 Reading Female
Male Female
130288 127107 132719
21170 22731 20167
55496 56091 55280
0030
-0261 Mathematics Male 132475 23813 60777
2002 Reading Female
Male Female
130679 129478 133443
21694 22536 20034
59849 60686 59636
0079
-0186 Mathematics Male 132555 22198 63542
2003 Reading Female
Male 130434 129308
20680 24674
61849 63840
0099
Female 133974 22003 62020 -0200
Table 13 and Table 14 present data for the matched sample of students taking both PSSA and SAT by gender Scale scores for both assessments as well as studentsrsquo self-reported GPA are included in the tables The numbers of males versus females in the state student population is similar typically with a few more males than females per grade However many more females take the SAT tests suggesting that more females than males aspire to attend college Males outscored females by a small margin on the PSSA and the SAT mathematics tests This finding is consistent with scoring patterns on SAT and ACT reported by Willingham and Cole (1997) They suggest that as a rule females tend to avoid taking mathematics and science classes In an apparent inconsistency females outscored males on PSSA reading but not on SAT verbal Scores for SAT verbal were nearly identical for males and females Willingham and Cole found gender differences favoring females in writing skills The PSSArsquos performance-task items add a writing component that was not present in the SAT for the Classes of 2002 and 2003 However SAT will include a student-written essay beginning in spring 2005 This study found that females tended to have higher self-reported GPAs than males
Table 13 Gender Differences for Class of 2002 Matched Sample (2001 PSSA and 2002 SAT) Performance Standard Number of Effect SizeSubject Gender MeanMeasure Deviation Cases d
Mathematics Male 141925 20536 29403
PSSA Reading Female
Male Female
137503 137162 139420
19408 18761 16921
36530 29345 36451
0221
-0126 Mathematics Male 52273 11076 29787
SAT Verbal Female
Male 48821 50081
10527 10333
37042 29787
0319
Female 49582 10126 37042 0049
GPA Male Female
3243 3404
656
609 25323 32857 -0255
HumRRO 28 April 2004
Table 14 Gender Differences for Class of 2003 Matched Sample (2001 PSSA and 2002 SAT) Performance Mean Standard Number Effect Size Subject GenderMeasure Score Deviation of Cases d
Mathematics Male 145023 21049 31338
PSSA Reading Female
Male Female
138650 140570 140715
19790 17318 16427
38459 31328 38418
0312
-0009 Mathematics Male 52596 11067 31557
SAT Verbal Female
Male 48997 50524
10490 10235
38745 31557
0327
Female 49623 10097 38745 0089 Male 3265 653 25387GPA Female 3415 600 32925 -0239
Table 15 and Table 16 show regression results for adding gender as a predictor variable to the model for estimating PSSA scores based on SAT scores For both PSSA reading and math the regression weights for gender are negligible and the changes in R-square are essentially nonexistent Gender is coded such that the positive weight means that females tend to have higher reading and math scores than would be expected from gender differences in SAT verbal
Table 15 Regressions Results Showing the Adjusted Strength of Gender on Predicting 2001 PSSA 11th Grade Scale Scores Based on 2002 SAT Scores Standardized Coefficient
PSSA Component SAT Control Gender R2 Change in R2
due to Gender Reading 0704 0495 Reading 0706 +0081 0502 +0006 Math 0847 0717 Math 0851 +0025 0717 +0001
Table 16 Regressions Results Showing the Adjusted Strength of Gender on Predicting 2002 PSSA 11th Grade Scale Scores Based on 2003 SAT Scores Standardized Coefficient
PSSA Component SAT Control Gender R2 Change in R2
due to Gender Reading 0775 0601 Reading 0777 +0038 0602 +0001 Math 0865 0749 Math 0863 -0012 0749 0000
HumRRO 29 April 2004
Ethnic or Racial Differences
Table 17 presents performance means for the four major ethnic or racial groups3 (White Black HispanicLatino and Asian) for the PSSA only For these analyses the racialethnic categories reported with the PSSA data were used It should be noted that starting in 2003 the reported racialethnic categories were changed from those reported in 2001 and 2002 In 2003 the category of ldquoMixedrdquo was no longer included As a result those students previously selecting ldquoMixedrdquo were forced to select one of the other categories For the full population of PSSA takers the pattern of performance between these four groups is fairly consistent In mathematics Asians outscore all groups Whites outscore HispanicsLatinos and Blacks and HispanicsLatinos score between Blacks and Whites For Reading Asians and Whites score approximately the same and Blacks score almost one standard deviation lower than Whites However the score for HispanicsLatinos has shown a decrease over the three years of approximately 30 points This decrease has dropped the HispanicLatino group to below the mean Black group score The number of HispanicLatinos taking the PSSA has increased approximately 40 Blacks approximately 65 and Whites approximately 10 during that time as well
Table 17 EthnicRacial Differences for PSSA (Unmatched State Data) Hispanic Year Subject Measure White Black AsianLatino
2001
Mathematics
Reading
Mean SD
N Effect Size
Mean SD
N Effect Size
132481 21525 92185
131644 21066 91964
113596 17093 8274 0972
115158 20393 8117 0795
116757 18873 2954 0777
117025 21104 2924 0693
140820 24657 2489 -0360
132927 21707 2470 -0060
2002
Mathematics
Reading
Mean SD
N Effect Size
Mean SD
N Effect Size
133935 22098 97659
133917 20351 97428
114090 17626 10783 0993
114887 20070 10715 0942
116438 19041 3534 0848
116193 21155 3535 0854
143430 26757 2659 -0387
133711 22914 2655 0010
2003
Mathematics
Reading
Mean SD
N Effect Size
Mean SD
N
134059 20863
104064
134488 22411
104271
114619 16132 13669 1042
114796 21940 13871 0888
116389 17473 4106 0903
114052 22848 4158 0903
142013 23662 2865 -0357
134943 24743 2866 -0019
3 The racialethnic analyses were limited to these four groups because of the limited number of students in the other groups
HumRRO 30 April 2004
Table 18 and Table 19 present data for the matched sample of students taking both PSSA and SAT by ethnicity Scale scores for both assessments as well as studentsrsquo self-reported GPA are included in the tables In 2002 Asians (726) took the SAT tests at a much higher rate than any other group followed by Whites (608) Blacks (419) and HispanicsLatinos (364) The order remained the same in 2003 although all groups but Asians had a slightly lower percentage in 2002 than in 2003 This suggests that more Asians and Whites aspire to attend college than do Blacks or HispanicLatinos Scores on the PSSA SAT and GPA show the same order for the matched sample as for the total state sample for the PSSA Comparing the effect size for the PSSA versus the effect size for the SAT shows that the effect size for most groups in the Class of 2002 and components is approximately the same for the PSSA and the SAT The largest difference for Blacks is between the PSSA reading and the SAT verbal components (PSSA reading ndash 0883 and SAT verbal ndash 1011) Note also that the effect size for GPA is approximately half the effect size for the PSSA and SAT for Blacks and Hispanics However for Asians the GPA effect size is more similar to the effect size for math than it is for the SAT verbal or PSSA reading components
Table 18 EthnicRacial Differences for the Class of 2002 Matched Sample (2001 PSSA 11th
Grade and 2002 SAT) Performance Hispanic Subject Measure White Black AsianMeasure Latino
PSSA
Mathematics
Reading
Mean SD
N Effect Size
Mean SD
N Effect Size
140809 19272 56063
139658 17004 56017
120809 17759 3735 1079
123658 19180 3678 0883
128529 19483 1076 0634
129112 19199 1064 0582
146256 22812 1808 -0258
138040 19183 1807 0089
SAT
Mathematics
Verbal
Mean SD
N Effect Size
Mean SD
N Effect Size
51041 10409 56693
50476 9670
56693
40286 10268 3872 1040
40619 9836 3872 1011
44332 11082 1096 0624
44378 10964 1096 0590
54820 13077 1838 -0320 49547 13308 1838 0080
GPA
Mean SD
N Effect Size
3364 0621
49617
2940 0667 3337 0658
3126 0640 871
0377
3491 0615 1616 -0205
HumRRO 31 April 2004
Table 19 EthnicRacial Differences for the Class of 2003 for Matched Sample (2002 PSSA 11th
Grade and 2003 SAT) Performance HispanicSubject Measure White Black AsianMeasure Latino
Mean 142999 122766 129030 150221
Mathematics SD N
19659 59076
18097 4516
19834 1178
24869 1951
PSSA Effect Size Mean 142157
1071 125012
0707 129610
-0322 139776
Reading SD N
15746 59038
17622 4500
18763 1184
20264 1951
Effect Size 1026 0724 0131 Mean 51440 39999 43626 55739
Mathematics SD N
10295 59443
9997 4573
10967 1206
12831 1970
SAT Effect Size Mean 50834
1128 40568
0735 43851
-0370 50166
Verbal SD N
9539 59443
9913 4573
10745 1206
13163 1970
Effect Size 1055 0687 0058 Mean 3385 2933 3175 3538
GPA Mathematics SD N
0610 49511
0666 3799
0641 935
0595 1608
Effect Size 0708 0336 -0254
Table 20 through Table 23 show regression results for adding raceethnicity (White versus Black and White versus HispanicLatino) as a predictor variable to the model for estimating PSSA scores based on SAT scores For both PSSA reading and math the regression weights for raceethnicity are negligible and the changes in R-square are essentially nonexistent Raceethnicity is coded such that the negative weight means that Blacks or HispanicsLatinos tend to have lower reading and math scores than would be expected from ethnicity differences in SAT verbal
Table 20 Regressions Results Showing the Adjusted Strength of Being Black on Predicting 2001 PSSA 11th Grade Scale Scores Based on 2002 SAT Scores Standardized Coefficient
PSSA Component SAT
Control Black R2 Change in R2
due to being Black
Reading 0699 0489 Reading 0686 -0059 0493 +0003 Math 0843 0711 Math 0833 -043 0713 +0002
HumRRO 32 April 2004
Table 21 Regressions Results Showing the Adjusted Strength of Being Black on Predicting 2002 PSSA 11th Grade Scale Scores Based on 2003 SAT Scores Standardized Coefficient
PSSA Component SAT
Control Black R2 Change in R2
due to being Black
Reading 0769 0591 Reading 0750 -0068 0595 0004 Math 0863 0745 Math 0857 -0021 0746 0000
Table 22 Regressions Results Showing the Adjusted Strength of Being HispanicLatino on Predicting 2001 PSSA 11th Grade Scale Scores Based on 2002 SAT Scores Standardized Coefficient
PSSA Component SAT
Control HispanicLatino R2 Change in R2
due to being HispanicLatino
Reading 0687 0472 Reading 0685 -0026 0473 +0001 Math 0837 0700 Math 0836 -0014 0700 0000
Table 23 Regressions Results Showing the Adjusted Strength of Being HispanicLatino on Predicting 2002 PSSA 11th Grade Scale Scores Based on 2003 SAT Scores Standardized Coefficient
PSSA Component SAT
Control HispanicLatino R2 Change in R2
due to being HispanicLatino
Reading 0754 0568 Reading 0050 -0034 0569 +0001 Math 0857 0735 Math 0856 -0009 0735 0000
Economically Disadvantaged Differences
Table 24 presents performance means for those students identified as economically disadvantaged for the PSSA only This table provides information from the larger state population to use in comparison with the matched PSSA and SAT sample data The SAT-taking population can be expected to post higher means For the full population of PSSA takers the pattern of performance between males and females is consistent Noneconomically disadvantaged students outscore economically disadvantaged student to a large degree on all components and all years except 2001 when it was a medium degree The number of students identified more than doubled between 2001 and 2002 and increased an additional 40 in 2003
HumRRO 33 April 2004
Table 24 Differences for Economically Disadvantaged Students for PSSA (Unmatched State Data)
Year Subject Economically Disadvantaged
Mean Scale Score
Standard Deviation
Number of Cases
Effect Size d
2001 Mathematics
Reading
Yes No Yes No
118647 131377 118918 130564
18977 22014 21142 21570
8805 107332 8702
106864
0619
0545
2002 Mathematics
Reading
Yes No Yes No
116604 133857 116380 133704
18913 22497 20914 20617
17253 106297 17199 106035
0830
0834 Yes 118211 17997 24022Mathematics No 134575 21063 102919 08352003 Yes 116747 22817 24290Reading No 135050 22319 103137 0811
Table 25 Differences for Economically Disadvantaged Students for Matched Sample for the Class of 2002 (2001 PSSA 11th Grade and 2002 SAT)
Performance Economically Mean Standard Number Effect Measure Subject Disadvantaged Score Deviation of Cases Size
d
PSSA Mathematics
Reading
Yes No Yes No
130598 139668 131768 138535
18830 20044 18336 17829
2893 65296 2863 65176
0466
0374
SAT Mathematics
Verbal
Yes No Yes No
45185 50491 44694 49953
10399 10912 10131 10215
2926 66399 2926 66399
0498
0517
GPA Yes No
3195 3334
0661 0636
2561 57722 0214
HumRRO 34 April 2004
Table 26 Differences for Economically Disadvantaged Students for Matched Sample for the Class of 2003 (2002 PSSA 11th Grade and 2003 SAT) Performance
Measure Subject Economically Disadvantaged
Mean Score
Standard Deviation
Number of Cases
Effect Size d
PSSA Mathematics
Reading
Yes No Yes No
127741 142707 128169 141742
19474 20278 18498 16243
5822 65159 5812 65114
0753
0780
SAT Mathematics
Verbal
Yes No Yes No
42412 51341 42100 50748
10746 10616 10491 9845
5907 65604 5907 65604
0836
0850 Yes 3116 0680 4854GPA No 3369 0620 54404 0389
Table 27 Regressions Results Showing the Adjusted Strength of Being Economically Disadvantaged on Predicting 2001 PSSA 11th Grade Scale Scores Based on 2002 SAT Scores Standardized Coefficient
Change in R2
SAT Economically due to beingPSSA Component R2 Control Disadvantaged Economically
Disadvantaged Reading 0704 0495 Reading 0703 -0004 0495 0000 Math 0846 0715 Math 0845 -0009 0715 0000
Table 28 Regressions Results Showing the Adjusted Strength of Being Economically Disadvantaged on Predicting 2002 PSSA 11th Grade Scale Scores Based on 2003 SAT Scores Standardized Coefficient
SAT Change in R2
PSSA Component Control Economically Disadvantaged R2 due to being
Economically Disadvantaged
Reading 0775 0601 Reading 0765 -044 0602 0002 Math 0865 0749 Math 0864 -0005 0749 0000
Annual Family Income Differences
Camara and Schmidt (1999) point out that family income is related to performance on tests such as the SAT I They also point out that this finding is not unique to the SAT I or college admissions tests Terenzini Cabrera and Bernal (2001) also examined various differences in educational outcomes associated with varying levels of socioeconomic status (SES) This report
HumRRO 35 April 2004
examines differences associated with family income in this section The following section shows differences in student performance related to parental education level Terenzini Cabrera and Bernal (2001) and Camara and Schmidt (1999) point out differences between income wealth and SES
Because annual family income data comes from the SDQ of the SAT only matched student data can be presented showing relationships with family income Table 29 (Class of 2002) and Table 30 (Class of 2003) show student performance on the PSSA SAT and GPA versus four levels of family income As the table clearly shows student scores increase on all performance measures as income goes up However the effect size for GPA is about half of the effect size for either of the assessments The effect size for the PSSA is similar although slightly less than the effect size for the SAT for both components and both years
Table 29 Annual Family Income Differences for Matched Sample for the Class of 2002 (2001 PSSA 11th Grade and 2002 SAT)
Income Level Performance Subject MeasureMeasure $25000 to $40000 tolt $25000 gt $70000$40000 $70000
PSSA
Math
Reading
Mean SD
N Effect Size
Mean SD
N Effect Size
129900 19108 6658
131011 18466 6594
135381 18361 8709 -0293
136210 17165 8693 -0292
139702 18899 16365 -0516
138848 17110 16348 -0440
145045 20032 14902 -0774
142093 16921 14867 -0626
SAT
Math
Verbal
Mean SD
N Effect Size
Mean SD
N Effect Size
44665 10594 6822
44469 10177 6822
47766 10013 8856 -0301 47619 9546 8856 -0319
50272 10136 16549 -0541 49796 9485
16549 -0542
53816 10580 15122 -0864 52825 9815
15122 -0836
GPA
Mean SD
N Effect Size
3173 0656 6596
3262 0636 8607 -0138
3344 0631 16141 -0266
3412 0628
14726 -0372
HumRRO 36 April 2004
Table 30 Annual Family Income Differences for Matched Sample for the Class of 2003 (2002 PSSA 11th Grade and 2003 SAT)
Income Level Performance Subject MeasureMeasure $25000 - $40000 -lt $25000 gt $70000$40000 $70000
Mean 131577 136393 140924 147093
Math SD N
19401 6230
19051 7958
19319 14963
20560 14295
PSSA Effect Size Mean 132698
-0250 137311
-0483 140572
-0776 144569
Reading SD N
17576 6232
16201 7948
15919 14958
15965 14284
Effect Size -0273 -0470 -0707 Mean 44871 47689 50075 53965
Math SD N
10562 6304
10140 8010
10089 15045
10567 14388
SAT Effect Size Mean 44793
-0272 47581
-0504 49653
-0861 52905
Verbal SD N
10345 6304
9578 8010
9354 15045
9689 14388
Effect Size -0280 -0493 -0809 Mean 3188 3279 3357 3428
GPA SD N
0652 6115
0642 7832
0623 14659
0617 14000
Effect Size -0141 -0265 -0378
Parent Educational Differences
Camara and Schmidt (1999) also looked at the impact of parent education on student performance in standardized testing Their study showed that parental education is related to performance on the SAT I Higher parental education is associated with higher scores on the SAT I Table 31 and Table 32 show the means standard deviations number of students and effect size for various levels of student-reported motherrsquos education for the PSSA SAT and GPA The analyses indicate that the effect size for both assessments and GPA are larger as the motherrsquos educational level increases The effect size for PSSA is not as large as the effect size for SAT The effect size for GPA is about half of the effect size for PSSA or SAT Table 33 and Table 34 provide the same information regarding the fatherrsquos education level The results follow the same pattern as that for motherrsquos education level
HumRRO 37 April 2004
Table 31 Mothers Education Level Differences for Matched Sample for the Class of 2002 (2001 PSSA 11th Grade and 2002 SAT)
Subject Measure lt High School
High School
Some College
BABS Degree
Graduate Degree
Mean 128855 135908 138212 145789 148095
Math SD N
18785 2196
18542 18737
19161 16804
19982 12094
20688 6259
PSSA Effect Size Mean 129039
-378 135883
-0493 137803
-0873 143360
-0974 144735
Reading SD N
17886 2189
17134 18696
17441 16762
16733 12078
16981 6245
Effect Size -0377 -0495 -0883 -0985 Mean 43795 48049 49574 54133 55639
Math SD N
10476 2247
10021 18986
10429 17075
10547 12291
10924 6357
SAT Effect Size Mean 42614
-0415 47405
-0553 49277
-0983 53512
-1107 55072
Verbal SD N
99852247
929118986
963517075
9856 12291
10300 6357
Effect Size -0497 -0679 -1099 -1228 Mean 3142 3267 3289 3456 3504 SD 0653 0630 0640 0618 0601 GPA N 2145 18341 16424 11914 6150
Effect Size -0195 -0227 -0494 -0577
Table 32 Mothers Education Level Differences for Matched Sample for the Class of 2003 (2002 PSSA 11th Grade and 2003 SAT)
lt High High Some BABS GraduateSubject Measure School School College Degree Degree Mean 129723 137323 140038 148027 150140 SD 19513 18746 19865 20474 22494 Math N 2072 17801 16646 11406 5961
Effect Size -0397 -0524 -0915 -0970PSSA Mean 129022 137751 139799 145748 147071 SD 18092 16042 16241 15951 16272 Reading N 2066 17787 16638 11406 5954
Effect Size -0511 -0627 -0981 -1059 Mean 43631 48106 49738 54411 55641
Math SD N
10494 2095
10046 17922
10387 16756
10467 11496
11305 5992
SAT Effect Size Mean 42549
-0436 47592
-0585 49432
-1029 53618
-1101 55050
Verbal SD N
10124 2095
925417922
954716756
9795 11496
10522 5992
Effect Size -0520 -0700 -1111 -1211 Mean 3148 3285 3307 3475 3510
GPA SD N
0646 2003
0622 17344
0636 16134
0608 11088
0599 5797
Effect Size -0216 -0248 -0521 -0581
HumRRO 38 April 2004
Table 33 Fathers Education Level Differences for Matched Sample for the Class of 2002 (2001 PSSA 11th Grade and 2002 SAT)
Subject Measure lt High School
High School
Some College
BABS Degree
Graduate Degree
Mean 128908 135041 138368 144843 150072
Math SD N
18443 2850
18251 17616
18721 14573
19645 12461
20736 7835
PSSA Effect Size Mean 129571
-0334 135453
-0509 137985
-0836 142352
-1079 145994
Reading SD N
18191 2289
17066 17558
17291 14539
16798 12454
16661 7838
Effect Size -0333 -0474 -0730 -0942 Mean 43958 47510 49626 53651 56759
Math SD N
10229 2915
992617845
10116 14800
10368 12636
10727 7980
SAT Effect Size Mean 43245
-0352 47058
-0557 49210
-0941 52830
-122 56114
Verbal SD N
97782915
921217845
947514800
9571 12636
10128 7980
Effect Size -0401 -0620 -0991 -1293 Mean 3136 3247 3301 3432 3548 SD 0637 0634 0633 0618 0594 GPA N 2784 17269 14263 12198 7723
Effect Size -0175 -0260 -0472 -0669
Table 34 Fathers Education Level Differences for Matched Sample for the Class of 2003 (2002 PSSA 11th Grade and 2003 SAT)
lt High High Some BABS GraduateSubject Measure School School College Degree Degree Mean 131197 136533 140022 147183 152503 SD 19107 18733 19163 20247 22047 Math N 2766 16981 14422 11633 7272
Effect Size -0282 -0461 -0812 -1033PSSA Mean 130955 137222 140037 144765 148752 SD 17715 15901 15980 15990 16014 Reading N 2761 16968 14412 11629 7265
Effect Size -0372 -0538 -0818 -1054 Mean 44505 47569 49772 53911 57115
Math SD N
10230 2803
9938 17087
10023 14508
10352 11709
11009 7314
SAT Effect Size Mean 43701
-0304 47224
-0520 49499
-0914 52920
-1187 56296
Verbal SD N
9887 2803
919517087
931014508
9580 11709
10294 7314
Effect Size -0369 -0604 -0947 -1248 Mean 3139 3272 3316 3454 3558
GPA SD N
0639 2696
0624 16545
0632 14014
0606 11281
0582 7046
Effect Size -0211 -0279 -0506 -0686
HumRRO 39 April 2004
Limited English Proficiency Differences
Students identified as having limited English proficiency (LEP) would be expected to have more difficulty taking a test in English than those not identified As a result of these difficulties LEP students would be expected to have lower scores than non-LEP students Table 36 shows the mean standard deviation number of students and the effect size for the entire state on the PSSA in 2001 and 2002 As expected LEP students have lower scores than non-LEP students on both components and effect sizes are generally large However the math component effect size is only about half of the effect size for reading
Table 35 Limited English Proficiency Differences for 11th Grade PSSA (Unmatched State Data) Limited EffectMean Scale Standard NumberYear Subject English Size Score Deviation of CasesProficiency d
Yes 115312 18977 492Math No 130476 22047 115645 07372001 Yes 106216 15338 473Reading No 129784 21727 115093 1253 Yes 116560 20254 844Math No 131550 22812 122706 06952002 Yes 102618 16138 840Reading No 131483 21413 122394 1522
Table 36 and Table 37 show the mean standard deviation number of cases and effect size for the matched sample of students in the Classes of 2002 and 2003 The effect sizes are similar to those in the state sample for the PSSA and SATmdashvery larger in verbalreading and medium in math The effect size is slightly larger for PSSA than SAT in math but slightly smaller for PSSA than SAT in readingverbal However the GPA for LEP students is actually slightly higher than the GPA for non-LEP students
Table 36 Limited English Proficiency Differences for Matched Sample for the Class of 2002 (2001 PSSA 11th Grade and 2002 SAT)
LimitedPerformance Standard Number Effect Size Subject English Mean ScoreMeasure Deviation of Cases dProficiency Yes 125974 19661 134Math No 139310 20070 68055 0671PSSA Yes 113745 14649 132Reading No 138297 17876 67907 1502 Yes 42860 13045 136Math No 50282 10934 69189 0617SAT Yes 33353 9807 136Verbal No 49764 10241 69189 1637 Yes 3393 0617 111GPA No 3328 0637 60172 -0104
HumRRO 40 April 2004
Table 37 Limited English Proficiency Differences for Matched Sample for the Class of 2003 (2002 PSSA 11th Grade and 2003 SAT)
LimitedPerformance Mean Standard Number Effect Size Subject EnglishMeasure Score Deviation of Cases dProficiency Yes 126815 20257 289Mathematics No 141539 20607 70692 0721PSSA Yes 109386 15855 288Reading No 140757 16741 70638 1924 Yes 41564 12159 291Mathematics No 50641 10887 71220 0787SAT Yes 32526 8775 291Verbal No 50105 10126 71220 1855 Yes 3358 585 226GPA No 3348 629 59032 -0008
The regression analyses results (Table 38 and Table 39) show that there are negligible changes in R square for predicting PSSA from SAT scores when adding LEP to the equation for both reading and math for both classes
Table 38 Regressions Results Showing the Adjusted Strength of Being Limited English Proficient on Predicting 2001 PSSA 11th Grade Scale Scores Based on 2002 SAT Scores
Standardized Coefficient Change in R2
SAT Limited English due toPSSA Component R2 Control Proficiency Limited English
Proficiency Reading 0704 0495 Reading 0703 -0011 0495 0000
Math 0846 0715 Math 0845 -0004 0715 0000
Table 39 Regressions Results Showing the Adjusted Strength of Being Limited English Proficient on Predicting 2002 PSSA 11th Grade Scale Scores Based on 2003 SAT Scores
Standardized Coefficient Change in R2
PSSA Component SAT Control
Limited English Proficiency R2 due to
Limited English Proficiency
Reading 0775 0601 Reading 0771 -0033 0602 +0001
Math 0865 0749 Math 0865 0000 0749 0000
HumRRO 41 April 2004
School-Level Scores Means were calculated by school for all scale scores and grade indicators to analyze
school-level results School-level descriptive statistics are presented for the Classes of 2002 and 2003 for the PSSA (Table 40) SAT (Table 41) and GPA and course grades (Table 42) Only schools with at least 10 students with merged PSSA and SAT scores are included in the analyses School-level means showed an increase on both tests both test components GPA and course grades from the Class of 2002 to the Class of 2003 The change in scoring procedures from the 2001 PSSA to the 2002 PSSA (instituting a minimum score of 700 for the 2002 PSSA) is problematic However there were only 9 students in this college-bound sample in the Class of 2003 who scored a 700 on the 2002 PSSA reading component and no students who scored a 700 on the math component The change in course grades was extremely small
Table 40 PSSA School-Level Descriptive Statistics for the Classes of 2002 and 2003 Subject Measure Class of 2002 Class of 2003 Reading Mean 136973 139316
SD 7435 7088 N 586 586
Math Mean 136966 139333 SD 8335 8496
N 586 586 Limited to schools with at least 10 students with merged PSSA and SAT scores
Table 41 SAT School-Level Descriptive Statistics for the Classes of 2002 and 2003 Subject Measure Class of 2002 Class of 2003 Verbal Mean 48578 48907
SD 4207 4251 N 586 586
Math Mean 48847 49159 SD 4500 4601
N 586 586 Limited to schools with at least 10 students with merged PSSA and SAT scores
HumRRO 42 April 2004
Table 42 School-Level Descriptive Statistics GPA and Course Grades for the Classes of 2002 and 2003
Subject Measure Class of 2002 Class of 2003 GPA Mean 334 346
SD 019 019 N 586 586
English Mean SD
329 020
331 021
N 586 586 Math Mean 311 312
SD 021 022 N 586 586
Limited to schools with at least 10 students with merged PSSA and SAT scores
Average Within-Year School-Level Correlations
Table 43 and Table 44 present correlations among these school-level scores Table 45 presents correlations for the average across the two years4 As Hoffman (1998) pointed out there is a tendency for correlations among school scores to be higher than correlations among student-level scores (Class of 2002 - Table 8 Class of 2003 - Table 9 and average for the Classes of 2002 and 2003 - Table 10) This is the case except for those correlations involving GPA and course-grades (except for PSSA reading to math course grade and GPA to English course grade where school-level correlations are higher)
As Hoffman (1998) pointed out the lower school-level correlations for GPA suggests that grading scales are not equivalent across schools There is a tendency for different schools to grade differently As a result at the school level of analysis there is a weaker relationship between GPA and either PSSA or ACT scores When studentsrsquo scores are averaged at the school level observed differences are related not only to differing levels of student achievement but to the particular schoolrsquos grading practices However the school-level relationship between GPA and course grades remains strong for both PSSA and SAT
4 Average correlations were technically corrected with Fisherrsquos r to z transformations
HumRRO 43 April 2004
Table 43 School-Level PSSA SAT and Course Grade Correlations for the Class of 2002 PSSA SAT Course Grades
Variable Reading Math Verbal Math GPA (Total) English Math
ReadingPSSA
Math
1000
0861 1000
Verbal SAT
Math
0818 0883
0773 0935
1000
0941 1000
GPA
English Course
Grades Math
0413 0393
0411 0391
0423 0454
0371 0376
0359 0362
0416 0450
1000
0778 1000
0719 0542 1000 Limited to schools with at least 10 students with merged PSSA and SAT scores
Table 44 School-Level PSSA SAT and Course Grades Correlations for the Class of 2003 PSSA SAT Course Grades
Variable Reading Math Verbal Math GPA (Total) English Math
ReadingPSSA
Math
1000
0870 1000
Verbal SAT
Math
0905 0849
0868 0915
1000
0943 1000
GPA
English Course
Grades Math
0491 0443
0442 0394
0501 0489
0439 0425
0402 0394
0484 0486
1000
0780 1000
0784 0615 1000 Limited to schools with at least 10 students with merged PSSA and SAT scores
HumRRO 44 April 2004
Table 45 School-Level PSSA SAT and Course Grades Correlation Averages for the Class of 2002 and 2003
PSSA SAT Course Grades
Variable Reading Math Verbal Math GPA (Total) English Math
ReadingPSSA
Math
1000
0866 1000
Verbal SAT
Math
0868 0867
0826 0926
1000
0942 1000
GPA
English Course
Grades Math
0453 0418
0427 0393
0463 0472
0406 0401
0381 0378
0451 0468
1000
0779 1000
0753 0580 1000 Limited to schools with at least 10 students with merged PSSA and SAT scores
Table 46 shows that the mean school-level scores for both PSSA 11th grade reading and SAT verbal components of each assessment increased from the Class of 2002 to the Class of 2003 For the SAT the mean school-level change on the verbal component was +330 scale score points For the PSSA the mean school-level scale score change on the 11th grade reading component was +2343 scale score points Table 47 shows the fairly strong relationship between the differences in mean school-level scores on the SAT verbal component and the PSSA reading component for the Classes of 2002 and 2003 This relationship is graphically portrayed in Figure 17 Table 48 Table 49 and Figure 18 show the same information for the math components of the PSSA and SAT As would be expected the relationship between the math components is stronger than for the readingverbal components
Table 46 Difference in Mean School-Level SAT Verbal and PSSA Reading Scores From the Classes of 2002 and 2003
Difference in Mean School-Level Score From the Standard Number ofMeanClass of 2002 and Class of 2003 Deviation Schools SAT Verbal +330 1673 586
PSSA Reading +2343 4660 586 Limited to schools with at least 10 students with merged PSSA and SAT scores
Table 47 Correlation of Difference in School-Level Mean SAT Verbal Score and PSSA Reading Score Between the Classes of 2002 and 2003
Difference in Mean School-Level Score From the SAT PSSA Class of 2002 and Class of 2003 Verbal Reading
SAT Verbal 1
PSSA Reading 462 1
HumRRO 45 April 2004
-200 -100 0 100 200
Difference in School-Level PSSA Reading Mean Score between the Class of 2002 and Class of 2003
-100
-50
0
50
100
Diff
eren
ce in
Sch
ool-L
evel
SA
T V
erba
l Mea
n Sc
ore
betw
een
Cla
ss o
f 200
2 an
d C
lass
of 2
003
$
$$
$
$
$
$$
$
$$
$
$
$
$
$
$
$
$$
$
$
$
$
$
$
$
$
$
$
$
$
$
$$
$
$
$
$
$
$
$
$
$
$ $
$$
$
$
$
$
$
$
$
$$
$
$$
$ $
$$$ $$
$
$
$
$
$
$
$
$
$
$
$
$
$
$$
$
$
$
$$
$$
$$$
$
$$
$
$
$$
$$
$
$
$
$
$
$
$
$
$
$$$
$$$
$
$
$
$
$
$$
$$
$
$$
$
$
$
$
$
$
$
$
$
$
$
$
$
$
$
$
$
$ $
$$
$
$$$ $$
$
$$$
$$
$
$
$
$
$
$
$
$$
$$
$
$
$
$
$
$
$
$
$
$$
$$
$
$$
$
$
$$
$
$
$
$$
$
$$
$
$$
$
$
$
$
$
$
$
$
$
$
$$
$
$$
$$
$
$$$$
$$
$$
$
$$
$
$
$
$
$$
$
$
$
$$
$
$ $$$
$
$ $$
$
$
$
$$
$
$$
$
$
$
$ $$$
$$
$$
$
$ $
$
$
$$
$
$
$
$
$
$
$$
$
$
$ $
$
$
$
$
$$
$
$
$$
$
$
$
$ $$
$
$
$ $
$$
$
$
$
$
$
$
$
$
$
$
$$
$
$
$$ $
$
$
$
$$
$
$
$$ $
$
$
$
$
$
$
$
$
$
$
$
$
$ $
$
$$
$
$$
$
$
$
$
$
$$
$
$
$
$
$
$
$
$
$$
$
$$
$
$
$$$ $
$
$
$$
$$
$
$$
$
$
$ $$ $
$ $
$$
$
$
$$$$
$
$$$
$
$$
$
$
$
$ $
$
$
$
$
$ $$
$
$
$
$
$
$ $
$ $ $
$
$
$
$
$$
$
$
$
$
$
$
$
$ $
$
$$
$
$$ $
$
$
$
$
$
$
$
$ $
$$
$
$
$
$
$
$
$
$$
$
$$
$
$
$
$
$$
$
$
$
$$
$$
$
$
$ $$$
$
$
$
$
$
$
$$$$
$
$$
$
$
$$
$
$$
$
$
$
$$$
$
$$
$
$
$
$
$$
$$
$
$
$
$$
$
$$
$$
$$
$
$
$
$
$$
$
$
$
$$
$
$
$
$
$
$$
$
$
$
$
$$
$
$
$
$
$
$
$$
$$
Figure 17 Scatterplot of difference in school-level SAT verbal mean scores and school-level PSSA 11th grade reading mean scores between the Class of 2002 and Class of 2003
Table 48 Difference in Mean School-Level SAT Math and PSSA Math Scores From the Class of 2002 and Class of 2003
Difference in Mean School-Level Math Score From the Class of 2002 and Class of 2003 Mean Standard
Deviation Number of
Schools
SAT +313 1842 586
PSSA +2367 4687 586 Limited to schools with at least 10 students with merged PSSA and SAT scores
HumRRO 46 April 2004
Table 49 Correlation of Difference in School-Level Mean SAT Math Score and PSSA Math Score Between the Classes of 2002 and 2003
Difference in Mean School-Level Math Score From the Class of 2002 and Class of 2003 SAT PSSA
SAT 1
PSSA 644 1
-200 -100 0 100 200
Difference in School-Level PSSA Math Mean Scale Score between the Class of 2002 and Class of 2003
-100
-50
0
50
100
Diff
eren
ce i
n Sc
hool
-Lev
el S
AT
Mat
h M
ean
Scor
e
betw
e en
the
Clas
s of
200
2 an
d Cl
ass
of 2
003
$
$$ $
$
$$
$
$$
$
$
$$
$
$
$$ $$
$
$
$
$
$
$
$
$
$$$
$
$
$$$
$
$
$
$
$
$
$$
$
$
$
$
$
$
$
$
$$$ $
$
$$
$
$
$
$
$$ $$
$$
$
$
$
$
$
$
$
$$
$
$$
$
$$
$
$
$
$
$ $$$
$
$
$
$
$
$
$
$$
$
$
$
$$
$
$
$
$
$
$ $
$$
$
$
$
$$
$
$$
$
$
$
$
$
$
$
$
$
$$
$
$$
$$
$
$
$
$
$
$$
$
$
$$
$
$
$
$$
$
$
$
$
$
$
$
$
$
$
$
$
$
$
$
$
$$
$
$
$$ $
$
$
$
$
$$
$
$
$
$
$
$
$
$
$
$
$
$
$
$
$
$
$
$
$$
$
$
$
$
$
$
$
$
$
$
$$
$
$
$
$
$$$
$
$
$
$
$
$
$ $$
$
$
$
$
$$
$
$
$
$
$
$$$
$
$
$$$
$
$
$
$
$$
$
$
$$
$
$
$$$
$
$
$
$
$
$
$$$
$
$
$
$
$$
$
$
$
$
$
$
$
$ $
$
$
$
$
$
$
$
$
$
$
$
$
$
$
$
$
$
$
$
$
$
$$$$
$$
$$
$
$$$
$$
$
$$
$
$
$
$
$
$
$
$$
$
$$
$
$
$
$
$
$$
$
$
$
$
$
$$
$
$$
$
$
$$
$
$
$
$
$
$
$
$
$
$
$ $
$
$
$
$
$$
$
$$$ $
$
$
$
$
$
$ $
$$
$
$$
$
$
$$
$ $
$$
$
$
$
$
$
$
$
$
$
$
$
$$
$
$
$
$
$
$
$
$ $
$$
$
$
$
$
$$ $
$
$$
$
$$
$$
$
$
$
$
$
$
$
$
$
$
$$
$
$$
$
$
$$
$
$
$
$
$$
$$
$$$
$$
$
$
$
$$
$
$$
$
$$
$
$
$
$
$
$
$
$
$
$
$
$
$ $$
$
$
$
$
$$
$
$
$
$$
$
$
$
$
$$
$
$$$$
$
$
$
$$$ $
$
$$
$
$
$
$
$
$$
$
$
$$
$$
$ $ $
$
$
$
$
$$
$
$$
$$
$
$
$
$$
$
$
$
$$
$
$
$
$
$
$
$
$$
$
$
$$
$
$
$
Figure 18 Scatterplot of differences in school-level mean SAT math score and school-level mean PSSA math scores between the Classes of 2002 and 2003
Pooled Within-School Correlations
The above discussion alluded to school-level factors such as differences in grading practices which may be impacting observed correlations Figure 19 depicts an extreme version of such a situation Schools A B and C are clearly different in where their students lie with respect to PSSA or SAT scores but they are identical in terms of the grades their students
HumRRO 47 April 2004
receive Also within each school there is a relationship between grades and either PSSA scores or SAT scores However if a correlation were calculated using students from all schools without regard to school-level characteristics it would be zero
School A
School B PSSA or SAT Scores
School C
Grade Point Average (GPA)
Figure 19 Extreme hypothetical illustration of how mean differences among schools on PSSA or SAT scores that are not mirrored by differences in GPA can impact correlations (Ellipses represent students scores within each school)
Pooled within-school correlations are used to estimate relationships between measures calculated within schools and then averaged across all schools These pooled within-school correlations were calculated for each of the two years of data (Table 50 for the Class of 2002 and Table 51 for the Class of 2003) and then averaged across the two years (Table 52)5 The resulting average pooled within-school correlations are presented in Table 52
5 Again the technical r to z correction was used
HumRRO 48 April 2004
Table 50 Pooled Within-School Correlation for the Class of 2002 PSSA SAT Course Grades
Variable Reading Math Verbal Math GPA (Total) English Math
ReadingPSSA
Math
1000
0648 1000
Verbal SAT
Math
0693 0650
0569 0832
1000
0695 1000
GPA
English Course
Grades Math
0528 0573
0461 0412
0361 0542
0516 0559
0465 0402
0349 0541
1000
0703 1000
0668 0443 1000 Limited to schools with at least 10 students with merged PSSA and SAT scores
Table 51 Pooled Within-School Correlation for the Class of 2003 PSSA SAT Course Grades
Variable Reading Math Verbal Math GPA (Total) English Math
ReadingPSSA
Math
1000
0702 1000
Verbal SAT
Math
0757 0629
0666 0857
1000
0662 1000
GPA
English Course
Grades Math
0512 0564
0457 0405
0350 0541
0534 0679
0466 0414
0369 0548
1000
0698 1000
0667 0443 1000 Limited to schools with at least 10 students with merged PSSA and SAT scores
HumRRO 49 April 2004
Table 52 Pooled Within-School Correlation Averaged for Classes of 2002 and 2003 PSSA SAT Course Grades
Variable Reading Math Verbal Math GPA (Total) English Math
ReadingPSSA
Math
1000
0676 1000
Verbal SAT
Math
0727 0640
0620 0845
1000
0679 1000
GPA
English Course
Grades Math
0520 0569
0459 0409
0356 0542
0525 0569
0466 0408
0359 0546
1000
0701 1000
0668 0443 1000 Limited to schools with at least 10 students with merged PSSA and SAT scores
If differences between schoolsrsquo grading procedures are substantial and if within schools students with higher grades also have higher PSSA scores then the correlations in Table 52 will be higher than student correlations in Table 10 (student-level correlations averaged for the Classes of 2002 and 2003) The difference between the GPA correlations in Table 10 and Table 52 however are only marginally different (see Table 53) In nearly all cases the within-school correlations are higher However the range is relatively smallmdash0009 to 0039 for GPA 0176 to 0219 for English course grades and 0147 to 0237 for math course grades Thus grading differences among schools do appear to exist but the effect is small for studentsrsquo GPA but larger for both English and math course grades especially when compared to the matching assessment component (ie English course grade to PSSA reading and SAT verbal math course grade to PSSA math and SAT math)
HumRRO 50 April 2004
Table 53 Differences Between Student-Level Correlations and Pooled Within-School Correlations Averaged for the Classes of 2002 and 2003
GPA or Course Grade to Student-Level Pooled Within- Difference in Assessment Correlations School Correlations Correlations
GPA to PSSA Reading 0511 0520 0009
GPA to PSSA Math 0546 0569 0023
GPA to SAT Verbal 0494 0525 0031
GPA to SAT Math 0530 0569 0039
English to PSSA Reading 0240 0459 0219
English to PSSA Math 0226 0409 0183
English to SAT Verbal 0256 0466 0210
English to SAT Math 0232 0408 0176
Math to PSSA Reading 0202 0356 0154
Math to PSSA Math 0305 0542 0237
Math to SAT Verbal 0212 0359 0147
Math to SAT Math 0313 0546 0233
Comparison of the correlations in Table 52 to Table 10 can also be used to test a hypothesis about the relationship between PSSA and SAT performance It is suggested above that some schools might be working more successfully toward improving PSSA performance than others Again if these efforts are only tangentially affecting SAT scores then we might expect mean differences among schools on PSSA scores that are not mirrored by differences on SAT Within schools however we can still expect students who do better on PSSA to also have a tendency to do better on SAT Figure 20 provides an extreme illustration of this potential effect Comparing correlations between PSSA and SAT from Table 52 to Table 10 reveals no such trend (see Table 54) The differences are all small (-0020 to +0009) suggesting that there are no significant differences among schools in the average PSSA scores of their students that are not mirrored by differences in studentsrsquo SAT scores This conclusion is consistent with the earlier conclusion from the individual level data That is no strong methodological differences in skills requirements are evidenced
HumRRO 51 April 2004
SAT Scores
School A School B School C
PSSA Scale Scores
Figure 20 Extreme hypothetical illustration of how mean differences among schools on PSSA scores that are not mirrored by differences on SAT scores can impact correlations (Ellipses represent students scores within each school)
Table 54 Differences Between SAT and PSSA Components for Student-Level Correlations and Pooled Within-School Correlations Averaged for the Classes of 2002 and 2003
GPA or Course Grade to Student-Level Pooled Within- Difference in Assessment Correlations School Correlations Correlations
PSSA Reading to SAT Verbal 0742 0727 -0015
PSSA Reading to SAT Math 0690 0640 -0020
PSSA Math to SAT Verbal 0629 0620 +0009
PSSA Math to SAT Math 0856 0845 -0009
A third comparison can also be made with the pooled within-school correlations This concerns the intercorrelations within each assessment format The pooled within-school PSSA intercorrelation (Table 52) shows a very slight decrease from student-level PSSA correlations (Table 10) while the pooled within-school SAT intercorrelation (Table 52) shows a larger increase from the student-level SAT intercorrelations (Table 10) It is possible that this is due to an increased homogeneity for the pooled within-school results However Figure 21 presents an exaggerated illustration of another manner in which this difference might be obtained This pattern would yield higher correlations for all students than for students within a school and a higher correlation of school-level scores (school-level PSSA intercorrelation is 0866 school-level SAT intercorrelation is 0942 [both from Table 45]) than for student-level scores (student-level PSSA is 0686 student-level SAT intercorrelation is 0737 [both from Table 10]) Although small (see Table 55) this is the pattern of differences in correlations obtained for both PSSA intercorrelations and for SAT intercorrelations Note that the difference between the PSSA components is smaller than the difference between the SAT components The obtained pattern
HumRRO 52 April 2004
like that in Figure 21 but much less exaggerated could result from differences between schools in the population of their students from differences in instruction that impact PSSA and SAT test scores or both
Content
Area B School A
School B
School C
Content Area A
Figure 21 Exaggerated illustration of how mean differences among schools can increase overall correlations (Ellipses represent students scores within each school)
Table 55 Internal Differences between SAT and PSSA Components for Student-Level Correlations and Pooled Within-School Correlations Averaged for the Classes of 2002 and 2003
GPA or Course Grade to Student-Level Pooled With- Difference in Assessment Correlations School Correlations Correlations
PSSA Reading to PSSA Math 0686 0676 -0010
SAT Verbal to SAT Math 0737 0845 0108
Summary and Conclusion The purpose of this report is to explore the validity questions ldquoAre PSSA scores
appropriately related to other measures of educational achievementrdquo
The data presented in this report suggest the following main points
bull Students who do well on any of the assessments tend to do well on all of the assessmentsmdashPSSA SAT GPA or course grades
bull When schoolsrsquo means are calculated using only the SAT-taking population of students schools with high scores on SAT also have high PSSA scores GPA and course grades are also related to both PSSA and SAT although not as strongly as the relationship between the PSSA and SAT
HumRRO 53 April 2004
PSSA exhibits strong convergent validity coefficients Correlations are very high between PSSA and SAT PSSA is positively correlated with other measures of student achievement including course grades and GPA Gains on PSSA are reflective of changes on SAT at the school level All these data provide strong evidence in support of PSSA as a valid measure of student achievement
There are however a few clarifications and qualifications to these general conclusions but none that diminish the basic findings These clarifications and qualifications include the following
Changes in scores Both mean PSSA and SAT scores experienced an increase Changes between the two assessments are positively correlated Schools that have gained on one assessment tend to have also gained on the other assessment However the same relationship is also true for those schools that have decreased
PSSA and SAT are tied to different content domains use differently formatted items and were designed to serve very different purposes However it is clear from the data that students who tend to perform well on the PSSA can also be expected to perform well on the SAT and vice-versa It is clear from the data that schools that perform well on one test can be expected to perform well on the other It is also clear that schools that improve on one test can be expected to improve on the other
Discriminant validity At the student level and the school level the different assessments of mathematics achievement are more highly related to each other than to assessments of other subjects Students with high mathematics scores on one assessment will tend to do well on all other assessments but that tendency is most pronounced for other mathematics assessments The same holds for school scores There is a similar differentiation on readingverbal assessments at both the student and school level but not as pronounced as in mathematics
GPA shows positive relationships with both PSSA and SAT assessments at the student and school level but not as pronounced as the relationship between the two assessments This is interpreted as being due to differences in schoolsrsquo grading practices Grading practices apparently differ sufficiently to reduce school-level associations with PSSA and SAT scores
Neither gender race socioeconomic status nor limited English proficiency appear to influence the PSSA scores any more than would be expected based on observed differences for SAT scores In other words PSSA items are not injecting any unexpected gender racialethnic socioeconomic status or limited English proficiency bias
HumRRO 54 April 2004
References
Camara WJ amp Schmidt AE (1999) Group differences in standardized testing and social stratification (College Board Report No 99-5) New York College Entrance Examination Board
Campbell D T amp Fiske D W (1959) Convergent and discriminant validation by the multitrait-multimethod matrix Psychological Bulletin 56(2) 81-105
Cassady JC (2001) Self-reported GPA and SAT A Methodological Note Practical Assessment Research amp Evaluation 7(12)
Coe Robert (2002) Itrsquos the effect size stupid What effect size is and why itrsquos important Paper presented at the Annual Conference of the British Educational Research Association University of Exeter England Retrieved from httpwwwleedsacukeducoldocuments00002182htm
Cohen J (1988) Statistical power analysis for the behavioral sciences (2nd ed) Hillsdale NJ Erlbaum
Hoffman R G (1998) Relationships among Kentuckyrsquos open-response assessments ACT scores and studentsrsquo self-reported high school grades (HumRRO Report FR-WATSD-98-27) Radcliff KY Human Resources Research Organization
Lewis DM Mitzel HC amp Green DR (1996) Standard setting A bookmark approach Symposium presented at the Council of Chief State School Officers Conference on Large ndashScale Assessment Phoenix AZ
Livingston SA amp Zieky MJ (1978) Manual for setting standards on the Basic Skills Assessment Test Princeton NJ Educational Testing Service
Mead R amp Melby K (2003 February) Technical analysis Pennsylvania System of School Assessment 2003 reading and mathematics PSSA Data Recognition Corporation
Mead R amp Melby K (2002 April) Technical analysis Pennsylvania System of School Assessment 2001 reading and mathematics PSSA Data Recognition Corporation
Mead R Smith RM amp Swanlund A (2003) Technical analysis 2003 Pennsylvania System of School Assessment mathematics and reading Data Recognition Corporation
NCLB (2004) httpwwwedgovnclblandingjtml
Sicoly Fiore (2002) What do school-level scores from large-scale assessments really measure Educational Measurement Issues and Practice 21(4) 17-26
Terenzini PT Cabrera AF amp Bernal EM (2001) Swimming against the tide The poor in American higher education (Research Report No 2001-1) New York College Entrance Examination Board
Willingham WW amp Cole NS (1997) Gender and Fair Assessment Hillsdale NJ Erlbaum
HumRRO 55 April 2004
HumRROKDE April 2003

Outliers are hidden Extreme values are hidden
1 2 3 4 5
2003 SAT Math Scores Divided Into Quintiles
800
1000
1200
1400
1600
1800
2000
2002
PSS
A 1
1th
Gra
de M
ath
Scal
e Sc
ore
n=13337
n=14780
n=15184
n=14494
n=13186
2003 SAT Math Quintiles 1 - Below 410 2 - 410 to 480 3 - 480 to 530 4 - 530 to 600 5 - Above 600
Advanced
Proficient
Basic
Below Basic
Figure 8 Student-level relationship between 2002 PSSA 11th grade math scale scores and 2003 SAT math scores divided into quintiles for the Class of 2003
PSSA Reading Scale Score Versus SAT Reported Average Grade in English
Figure 9 and Figure 10 illustrate the relationship between the PSSA Reading scale scores and the grades students reported in the optional Student Descriptive Questionnaire (SDQ) portion of the SAT The SDQ asked students to report their average grade in English The available responses to this question were 0 ndash Failing 1 ndash Passing 2 ndash Fair 3 ndash Good or 4 ndash Excellent The category ldquoNo responserdquo indicates that the student did not respond to the question In 2002 8305 students did not respond to the English question In 2003 6170 students did not respond In 2002 13 students responded that their average English grade was ldquoFailingrdquo In 2003 6 students had this answer Students who did not respond and those who responded that their average grade was ldquoFailingrdquo were not included in the graphs As can be seen in Figure 10 scale scores in PSSA Reading tend to be higher for students reporting better performance in English coursework The preponderance of students reporting either a ldquoGoodrdquo or an ldquoExcellentrdquo English average scored in the Proficient or Advanced PSSA performance levels Additionally almost 90 of the students reported having either a ldquoGoodrdquo or ldquoExcellentrdquo average in English courses As previously noted self-reported data undoubtedly involves some inaccuracies however Cassady (2001) found studentsrsquo self-reported grades to be a reliable measure of actual grades
HumRRO 18 April 2004
2001
PSS
A 1
1th
Gra
de R
eadi
ng S
cale
Sco
re
2000
1800
1600
1400
1200
1000
800
600
Outliers are hidden Extreme values are hidden
n=27359
n=6538
n=23685
n=244
1 2 3 4
Student-Reported Average Grade for English on SAT Student Descriptive Questionnaire
Advanced
Proficient
Basic
Below Basic
Average Grade 1 - Passing 2 - Fair 3 - Good 4 - Excellent
Figure 9 Student-level relationship between 2001 PSSA 11th grade reading scale score and student-reported average English course grades on the Student Descriptive Questionnaire (SDQ) of the SAT for the Class of 2002
HumRRO 19 April 2004
Outliers are hidden Extreme values are hidden
1 2 3 4
Student-Reported Average Grade for English on SAT Student Descriptive Questionnaire
600
800
1000
1200
1400
1600
1800
2000
2200
2400
2002
PSS
A 1
1th
Gra
de R
eadi
ng S
cale
Sco
re
n=6065 n=26317 n=23397 n=249 Average Grade 1 - Passing 2 - Fair 3 - Good 4 - Excellent
Advanced
Proficient
Basic
Below Basic
Figure 10 Student-level relationship between 2002 PSSA 11th grade reading scale score and student-reported English course grades on the SAT Student Descriptive Questionnaire (SDQ) for the Class of 2003
PSSA Math Scale Score Versus SAT Reported Average Grade in Math
Figure 11 and Figure 12 illustrate the relationship between the PSSA 11th grade math scale scores and the grades students reported in the optional Student Descriptive Questionnaire (SDQ) portion of the SAT which students are asked to complete as part of registering for the SAT The SDQ asked students to report their average grade in math The available responses to this question were 0 ndash Failing 1 ndash Passing 2 ndash Fair 3 ndash Good or 4 ndash Excellent The category ldquoNo responserdquo indicates that the student did not respond to the question In 2002 8523 students did not respond to the math average grade question In 2003 6316 students did not respond In 2002 41 students responded that their average math grade was ldquoFailingrdquo In 2003 47 students had this answer Students who did not respond and those who responded that their average grade was ldquoFailingrdquo were not included in the graphs
HumRRO 20 April 2004
2001
PSS
A 1
1th
Gra
deM
ath
Scal
e Sc
ore 2000
1800
1600
1400
1200
1000
800
600
Outliers are hidden Extreme values are hidden
n=19993
n=11254 n=25509
n=970
1 2 3 4
Student-Reported Average Grade for Math on SAT Student Descriptive Questionnaire
Advanced
Proficient
Basic
Below Basic
Average Grade 1 - Passing 2 - Fair 3 - Good 4 - Excellent
Figure 11 Student-level relationship between 2001 PSSA 11th grade math scale score and student-reported average math course grades in the Student Descriptive Questionnaire (SDQ) of the SAT for the Class of 2002
HumRRO 21 April 2004
Outliers are hidden Extreme values are hidden
1 2 3 4
Student-Reported Average Grade for Math on SAT Student Descriptive Questionnaire
600
800
1000
1200
1400
1600
1800
2000
2002
PSS
A 1
1th
Gra
de M
ath
Scal
e Sc
ore
n=10370 n=24674
n=19835
n=1003
Advanced
Proficient
Basic
Below Basic
Average Grade 1 - Passing 2 - Fair 3 - Good 4 - Excellent
Figure 12 Student-level relationship between 2002 PSSA 11th grade math scale score and student-reported average math course grade in the SAT Student Descriptive Questionnaire (SDQ) for the Class of 2003
PSSA Scale Scores Versus SAT Reported Grade-Point Average
Figure 13 through Figure 16 illustrate relationships between PSSA scale scores and overall grade-point averages (GPAs) The GPAs are from the SATrsquos SDQ Students were asked to provide their GPA on a basic 4-point scale with pluses and minuses around each point (A+ = 43 A = 40 A- = 37 etc) Approximately 87 (60283 of 69325) of students in the Class of 2002 completed the GPA question in the SDQ and 83 (59258 of 71511) of students in the Class of 2003 completed the question The mean student-reported GPA was 333 (SD = 064) for the Class of 2002 and 335 (SD = 063) for the Class of 2003 The correlation for the 2001 PSSA 11th grade reading component with the 2002 GPA was 0501 For the 2001 PSSA 11th grade math component the correlation was 0539 For the 2002 PSSA the correlations were 0520 in Reading and 0553 in Math The box-plots for PSSA scale scores to GPA for both years and both tests performed as expectedmdashlower scores for lower GPAs and higher scores for higher GPAs Note that the median and boxes align fairly well with the appropriate performance levelsmdashA students in the Advanced and Proficient level B students generally in the Proficient level C students in the low Proficient and Basic levels and D students in the Basic level Note also that the number of students decreases sharply when the student-reported GPA drops below 30
HumRRO 22 April 2004
Outliers are hidden Extreme values are hidden
Advanced
Proficient
Basic
Below Basic
10 13 17 20 23 27 30 33 37 40 43
Student-reported GPA (4-point scale) on the 2002 SAT Student Descriptive Questionnaire (SDQ)
800
1000
1200
1400
1600
1800
2000
2001
PSS
A 1
1th
Gra
de R
eadi
ng S
cale
Sco
re
n=10261
n=5370 n=11810
n=11101 n=9668
n=4624
n=2381 n=3352
n=520 n=40
n=96
Figure 13 Student-level relationship between 2001 PSSA 11th grade reading scale score and student-reported grade-point average (GPA) from the SATrsquos Student Descriptive Questionnaire (SDQ) for the Class of 2002
HumRRO 23 April 2004
Outliers are hidden Extreme values are hidden
10 13 17 20 23 27 30 33 37 40 43 Student-reported GPA (4-point scale) on the 2003 SAT Student Descriptive Questionnaire (SDQ)
800
1000
1200
1400
1600
1800
2000
2002
PSS
A 1
1th
Gra
de R
eadi
ng S
cale
Sco
re
n=3304
n=10358
n=5089
n=11480
n=11507
n=9773
n=4602
n=2084 n=97 n=496 n=27
Advanced
Proficient
Basic
Below Basic
Figure 14 Student-level relationship between 2002 PSSA 11th Grade reading scale score and student-reported grade-point average (GPA) from the SATrsquos Student Descriptive Questionnaire (SDQ) for the Class of 2003
HumRRO 24 April 2004
Outliers are hidden Extreme values are hidden
10 13 17 20 23 27 30 33 37 40 43 Student-reported GPA (4-point scale) on the 2002 SAT Student Descriptive Questionnaire (SDQ)
800
1000
1200
1400
1600
1800
2000
2001
PSS
A 1
1th
Gra
de M
ath
Scal
e Sc
ore
n=10280
n=5391 n=11831
n=11123 n=9672
n=4635
n=2393 n=3377
n=526 n=42
n=97
Advanced
Proficient
Basic
Below Basic
Figure 15 Student-level relationship between 2001 PSSA 11th grade math scale score and student-reported grade-point average (GPA) from the SATrsquos Student Descriptive Questionnaire (SDQ) for the Class of 2002
HumRRO 25 April 2004
Outliers are hidden Extreme values are hidden
10 13 17 20 23 27 30 33 37 40 43 Student-reported GPA (4-point scale) on the 2003 SAT Student Descriptive Questionnaire (SDQ)
800
1000
1200
1400
1600
1800
2000
2002
PSS
A 1
1th
Gra
de M
ath
Scal
e Sc
ore
n=3319
n=10364
n=5091
n=11480
n=11514
n=9777
n=4600
n=2085 n=98
n=496
n=27
Advanced
Proficient
Basic
Below Basic
Figure 16 Student-level relationship between 2001 PSSA 11th grade math scale score and student-reported grade-point average (GPA) from the SATrsquos Student Descriptive Questionnaire (SDQ) for the class of 2002
HumRRO 26 April 2004
Differences in Performance for Demographic Groupings
Analyses were conducted to compare performance on the PSSA and SAT among students from varying backgrounds Average test performance tends to differ for students of differing genders ethnic groups and various measures associated with socioeconomic status The important question for judging bias on the PSSA is not whether specific groups show mean differences but whether those differences are larger for the PSSA than the differences observed on other measures of student achievement
Differences between measures of achievement can be captured in several ways This report will present two measures of mean differences First effect size statistics will be calculated for the differences between major categories of students (Coe 2002) The magnitude of the effect size statistics is less important than the difference between the effect sizes for PSSA compared to the other measures However measuring the magnitude of the gaps for NCLB-defined groups is instructive and important since all states are expected to make progress toward closing those gaps (No Child Left Behind 2004)
Effect size statistics can be interpreted as the average percentile standing of the average treated (or experimental) participant relative to the average untreated (or control) participant An effect size of 00 indicates that the mean of the treated group is at the 50th percentile of the control group An effect size of 08 indicates that the mean of the treated group is at the 79th
percentile of the control group An effect size of 17 indicates that the mean of the treated group is at the 955th percentile of the control group Cohen (1988) hesitantly defined effect sizes as ldquosmall d=2rdquo ldquomedium d=5rdquo and ldquolarge d=8rdquo He went on to caution against offering conventional operational definitions such as these in the diverse field of behavioral science
The second measure used to capture differences between measures of achievement was regression analysis Regression analysis was used to examine the extent to which PSSA differences in performance for various demographic groupings are similar to those found in SAT scores For each of the demographic groupings we calculated a regression equation to predict PSSA scores based on the matching SAT content score A second equation was created which added the specific demographic characteristic of interest If PSSA scores exhibit greater differences based on that demographic characteristic that characteristic will have a significant weight and there will be a meaningful increase in the prediction of the PSSA component score
Gender Differences
Table 12 presents performance means for males and females for the PSSA only This table provides information from the larger state population to use in comparison with the matched PSSA and SAT sample data The SAT-taking population can be expected to post higher means For all gender tables data is coded such that positive numbers indicate higher mean scores for males negative numbers indicate higher mean scores for females For the full population of PSSA takers the pattern of performance between males and females is consistent Males outscore females but only to a very small degree on the PSSA mathematics test for all three included years Females outscored males to a higher but still small degree on the PSSA reading test The differences between years are small and inconsistent This table shows that the gap in performance for both PSSA mathematics and reading between males and females is small and has not changed dramatically between 2001 and 2003
HumRRO 27 April 2004
Table 12 Gender Differences for PSSA (Unmatched State Data) Mean Scale Standard Number of Effect Size Year Subject Gender Score Deviation Cases d
Mathematics Male 130954 22870 56380
2001 Reading Female
Male Female
130288 127107 132719
21170 22731 20167
55496 56091 55280
0030
-0261 Mathematics Male 132475 23813 60777
2002 Reading Female
Male Female
130679 129478 133443
21694 22536 20034
59849 60686 59636
0079
-0186 Mathematics Male 132555 22198 63542
2003 Reading Female
Male 130434 129308
20680 24674
61849 63840
0099
Female 133974 22003 62020 -0200
Table 13 and Table 14 present data for the matched sample of students taking both PSSA and SAT by gender Scale scores for both assessments as well as studentsrsquo self-reported GPA are included in the tables The numbers of males versus females in the state student population is similar typically with a few more males than females per grade However many more females take the SAT tests suggesting that more females than males aspire to attend college Males outscored females by a small margin on the PSSA and the SAT mathematics tests This finding is consistent with scoring patterns on SAT and ACT reported by Willingham and Cole (1997) They suggest that as a rule females tend to avoid taking mathematics and science classes In an apparent inconsistency females outscored males on PSSA reading but not on SAT verbal Scores for SAT verbal were nearly identical for males and females Willingham and Cole found gender differences favoring females in writing skills The PSSArsquos performance-task items add a writing component that was not present in the SAT for the Classes of 2002 and 2003 However SAT will include a student-written essay beginning in spring 2005 This study found that females tended to have higher self-reported GPAs than males
Table 13 Gender Differences for Class of 2002 Matched Sample (2001 PSSA and 2002 SAT) Performance Standard Number of Effect SizeSubject Gender MeanMeasure Deviation Cases d
Mathematics Male 141925 20536 29403
PSSA Reading Female
Male Female
137503 137162 139420
19408 18761 16921
36530 29345 36451
0221
-0126 Mathematics Male 52273 11076 29787
SAT Verbal Female
Male 48821 50081
10527 10333
37042 29787
0319
Female 49582 10126 37042 0049
GPA Male Female
3243 3404
656
609 25323 32857 -0255
HumRRO 28 April 2004
Table 14 Gender Differences for Class of 2003 Matched Sample (2001 PSSA and 2002 SAT) Performance Mean Standard Number Effect Size Subject GenderMeasure Score Deviation of Cases d
Mathematics Male 145023 21049 31338
PSSA Reading Female
Male Female
138650 140570 140715
19790 17318 16427
38459 31328 38418
0312
-0009 Mathematics Male 52596 11067 31557
SAT Verbal Female
Male 48997 50524
10490 10235
38745 31557
0327
Female 49623 10097 38745 0089 Male 3265 653 25387GPA Female 3415 600 32925 -0239
Table 15 and Table 16 show regression results for adding gender as a predictor variable to the model for estimating PSSA scores based on SAT scores For both PSSA reading and math the regression weights for gender are negligible and the changes in R-square are essentially nonexistent Gender is coded such that the positive weight means that females tend to have higher reading and math scores than would be expected from gender differences in SAT verbal
Table 15 Regressions Results Showing the Adjusted Strength of Gender on Predicting 2001 PSSA 11th Grade Scale Scores Based on 2002 SAT Scores Standardized Coefficient
PSSA Component SAT Control Gender R2 Change in R2
due to Gender Reading 0704 0495 Reading 0706 +0081 0502 +0006 Math 0847 0717 Math 0851 +0025 0717 +0001
Table 16 Regressions Results Showing the Adjusted Strength of Gender on Predicting 2002 PSSA 11th Grade Scale Scores Based on 2003 SAT Scores Standardized Coefficient
PSSA Component SAT Control Gender R2 Change in R2
due to Gender Reading 0775 0601 Reading 0777 +0038 0602 +0001 Math 0865 0749 Math 0863 -0012 0749 0000
HumRRO 29 April 2004
Ethnic or Racial Differences
Table 17 presents performance means for the four major ethnic or racial groups3 (White Black HispanicLatino and Asian) for the PSSA only For these analyses the racialethnic categories reported with the PSSA data were used It should be noted that starting in 2003 the reported racialethnic categories were changed from those reported in 2001 and 2002 In 2003 the category of ldquoMixedrdquo was no longer included As a result those students previously selecting ldquoMixedrdquo were forced to select one of the other categories For the full population of PSSA takers the pattern of performance between these four groups is fairly consistent In mathematics Asians outscore all groups Whites outscore HispanicsLatinos and Blacks and HispanicsLatinos score between Blacks and Whites For Reading Asians and Whites score approximately the same and Blacks score almost one standard deviation lower than Whites However the score for HispanicsLatinos has shown a decrease over the three years of approximately 30 points This decrease has dropped the HispanicLatino group to below the mean Black group score The number of HispanicLatinos taking the PSSA has increased approximately 40 Blacks approximately 65 and Whites approximately 10 during that time as well
Table 17 EthnicRacial Differences for PSSA (Unmatched State Data) Hispanic Year Subject Measure White Black AsianLatino
2001
Mathematics
Reading
Mean SD
N Effect Size
Mean SD
N Effect Size
132481 21525 92185
131644 21066 91964
113596 17093 8274 0972
115158 20393 8117 0795
116757 18873 2954 0777
117025 21104 2924 0693
140820 24657 2489 -0360
132927 21707 2470 -0060
2002
Mathematics
Reading
Mean SD
N Effect Size
Mean SD
N Effect Size
133935 22098 97659
133917 20351 97428
114090 17626 10783 0993
114887 20070 10715 0942
116438 19041 3534 0848
116193 21155 3535 0854
143430 26757 2659 -0387
133711 22914 2655 0010
2003
Mathematics
Reading
Mean SD
N Effect Size
Mean SD
N
134059 20863
104064
134488 22411
104271
114619 16132 13669 1042
114796 21940 13871 0888
116389 17473 4106 0903
114052 22848 4158 0903
142013 23662 2865 -0357
134943 24743 2866 -0019
3 The racialethnic analyses were limited to these four groups because of the limited number of students in the other groups
HumRRO 30 April 2004
Table 18 and Table 19 present data for the matched sample of students taking both PSSA and SAT by ethnicity Scale scores for both assessments as well as studentsrsquo self-reported GPA are included in the tables In 2002 Asians (726) took the SAT tests at a much higher rate than any other group followed by Whites (608) Blacks (419) and HispanicsLatinos (364) The order remained the same in 2003 although all groups but Asians had a slightly lower percentage in 2002 than in 2003 This suggests that more Asians and Whites aspire to attend college than do Blacks or HispanicLatinos Scores on the PSSA SAT and GPA show the same order for the matched sample as for the total state sample for the PSSA Comparing the effect size for the PSSA versus the effect size for the SAT shows that the effect size for most groups in the Class of 2002 and components is approximately the same for the PSSA and the SAT The largest difference for Blacks is between the PSSA reading and the SAT verbal components (PSSA reading ndash 0883 and SAT verbal ndash 1011) Note also that the effect size for GPA is approximately half the effect size for the PSSA and SAT for Blacks and Hispanics However for Asians the GPA effect size is more similar to the effect size for math than it is for the SAT verbal or PSSA reading components
Table 18 EthnicRacial Differences for the Class of 2002 Matched Sample (2001 PSSA 11th
Grade and 2002 SAT) Performance Hispanic Subject Measure White Black AsianMeasure Latino
PSSA
Mathematics
Reading
Mean SD
N Effect Size
Mean SD
N Effect Size
140809 19272 56063
139658 17004 56017
120809 17759 3735 1079
123658 19180 3678 0883
128529 19483 1076 0634
129112 19199 1064 0582
146256 22812 1808 -0258
138040 19183 1807 0089
SAT
Mathematics
Verbal
Mean SD
N Effect Size
Mean SD
N Effect Size
51041 10409 56693
50476 9670
56693
40286 10268 3872 1040
40619 9836 3872 1011
44332 11082 1096 0624
44378 10964 1096 0590
54820 13077 1838 -0320 49547 13308 1838 0080
GPA
Mean SD
N Effect Size
3364 0621
49617
2940 0667 3337 0658
3126 0640 871
0377
3491 0615 1616 -0205
HumRRO 31 April 2004
Table 19 EthnicRacial Differences for the Class of 2003 for Matched Sample (2002 PSSA 11th
Grade and 2003 SAT) Performance HispanicSubject Measure White Black AsianMeasure Latino
Mean 142999 122766 129030 150221
Mathematics SD N
19659 59076
18097 4516
19834 1178
24869 1951
PSSA Effect Size Mean 142157
1071 125012
0707 129610
-0322 139776
Reading SD N
15746 59038
17622 4500
18763 1184
20264 1951
Effect Size 1026 0724 0131 Mean 51440 39999 43626 55739
Mathematics SD N
10295 59443
9997 4573
10967 1206
12831 1970
SAT Effect Size Mean 50834
1128 40568
0735 43851
-0370 50166
Verbal SD N
9539 59443
9913 4573
10745 1206
13163 1970
Effect Size 1055 0687 0058 Mean 3385 2933 3175 3538
GPA Mathematics SD N
0610 49511
0666 3799
0641 935
0595 1608
Effect Size 0708 0336 -0254
Table 20 through Table 23 show regression results for adding raceethnicity (White versus Black and White versus HispanicLatino) as a predictor variable to the model for estimating PSSA scores based on SAT scores For both PSSA reading and math the regression weights for raceethnicity are negligible and the changes in R-square are essentially nonexistent Raceethnicity is coded such that the negative weight means that Blacks or HispanicsLatinos tend to have lower reading and math scores than would be expected from ethnicity differences in SAT verbal
Table 20 Regressions Results Showing the Adjusted Strength of Being Black on Predicting 2001 PSSA 11th Grade Scale Scores Based on 2002 SAT Scores Standardized Coefficient
PSSA Component SAT
Control Black R2 Change in R2
due to being Black
Reading 0699 0489 Reading 0686 -0059 0493 +0003 Math 0843 0711 Math 0833 -043 0713 +0002
HumRRO 32 April 2004
Table 21 Regressions Results Showing the Adjusted Strength of Being Black on Predicting 2002 PSSA 11th Grade Scale Scores Based on 2003 SAT Scores Standardized Coefficient
PSSA Component SAT
Control Black R2 Change in R2
due to being Black
Reading 0769 0591 Reading 0750 -0068 0595 0004 Math 0863 0745 Math 0857 -0021 0746 0000
Table 22 Regressions Results Showing the Adjusted Strength of Being HispanicLatino on Predicting 2001 PSSA 11th Grade Scale Scores Based on 2002 SAT Scores Standardized Coefficient
PSSA Component SAT
Control HispanicLatino R2 Change in R2
due to being HispanicLatino
Reading 0687 0472 Reading 0685 -0026 0473 +0001 Math 0837 0700 Math 0836 -0014 0700 0000
Table 23 Regressions Results Showing the Adjusted Strength of Being HispanicLatino on Predicting 2002 PSSA 11th Grade Scale Scores Based on 2003 SAT Scores Standardized Coefficient
PSSA Component SAT
Control HispanicLatino R2 Change in R2
due to being HispanicLatino
Reading 0754 0568 Reading 0050 -0034 0569 +0001 Math 0857 0735 Math 0856 -0009 0735 0000
Economically Disadvantaged Differences
Table 24 presents performance means for those students identified as economically disadvantaged for the PSSA only This table provides information from the larger state population to use in comparison with the matched PSSA and SAT sample data The SAT-taking population can be expected to post higher means For the full population of PSSA takers the pattern of performance between males and females is consistent Noneconomically disadvantaged students outscore economically disadvantaged student to a large degree on all components and all years except 2001 when it was a medium degree The number of students identified more than doubled between 2001 and 2002 and increased an additional 40 in 2003
HumRRO 33 April 2004
Table 24 Differences for Economically Disadvantaged Students for PSSA (Unmatched State Data)
Year Subject Economically Disadvantaged
Mean Scale Score
Standard Deviation
Number of Cases
Effect Size d
2001 Mathematics
Reading
Yes No Yes No
118647 131377 118918 130564
18977 22014 21142 21570
8805 107332 8702
106864
0619
0545
2002 Mathematics
Reading
Yes No Yes No
116604 133857 116380 133704
18913 22497 20914 20617
17253 106297 17199 106035
0830
0834 Yes 118211 17997 24022Mathematics No 134575 21063 102919 08352003 Yes 116747 22817 24290Reading No 135050 22319 103137 0811
Table 25 Differences for Economically Disadvantaged Students for Matched Sample for the Class of 2002 (2001 PSSA 11th Grade and 2002 SAT)
Performance Economically Mean Standard Number Effect Measure Subject Disadvantaged Score Deviation of Cases Size
d
PSSA Mathematics
Reading
Yes No Yes No
130598 139668 131768 138535
18830 20044 18336 17829
2893 65296 2863 65176
0466
0374
SAT Mathematics
Verbal
Yes No Yes No
45185 50491 44694 49953
10399 10912 10131 10215
2926 66399 2926 66399
0498
0517
GPA Yes No
3195 3334
0661 0636
2561 57722 0214
HumRRO 34 April 2004
Table 26 Differences for Economically Disadvantaged Students for Matched Sample for the Class of 2003 (2002 PSSA 11th Grade and 2003 SAT) Performance
Measure Subject Economically Disadvantaged
Mean Score
Standard Deviation
Number of Cases
Effect Size d
PSSA Mathematics
Reading
Yes No Yes No
127741 142707 128169 141742
19474 20278 18498 16243
5822 65159 5812 65114
0753
0780
SAT Mathematics
Verbal
Yes No Yes No
42412 51341 42100 50748
10746 10616 10491 9845
5907 65604 5907 65604
0836
0850 Yes 3116 0680 4854GPA No 3369 0620 54404 0389
Table 27 Regressions Results Showing the Adjusted Strength of Being Economically Disadvantaged on Predicting 2001 PSSA 11th Grade Scale Scores Based on 2002 SAT Scores Standardized Coefficient
Change in R2
SAT Economically due to beingPSSA Component R2 Control Disadvantaged Economically
Disadvantaged Reading 0704 0495 Reading 0703 -0004 0495 0000 Math 0846 0715 Math 0845 -0009 0715 0000
Table 28 Regressions Results Showing the Adjusted Strength of Being Economically Disadvantaged on Predicting 2002 PSSA 11th Grade Scale Scores Based on 2003 SAT Scores Standardized Coefficient
SAT Change in R2
PSSA Component Control Economically Disadvantaged R2 due to being
Economically Disadvantaged
Reading 0775 0601 Reading 0765 -044 0602 0002 Math 0865 0749 Math 0864 -0005 0749 0000
Annual Family Income Differences
Camara and Schmidt (1999) point out that family income is related to performance on tests such as the SAT I They also point out that this finding is not unique to the SAT I or college admissions tests Terenzini Cabrera and Bernal (2001) also examined various differences in educational outcomes associated with varying levels of socioeconomic status (SES) This report
HumRRO 35 April 2004
examines differences associated with family income in this section The following section shows differences in student performance related to parental education level Terenzini Cabrera and Bernal (2001) and Camara and Schmidt (1999) point out differences between income wealth and SES
Because annual family income data comes from the SDQ of the SAT only matched student data can be presented showing relationships with family income Table 29 (Class of 2002) and Table 30 (Class of 2003) show student performance on the PSSA SAT and GPA versus four levels of family income As the table clearly shows student scores increase on all performance measures as income goes up However the effect size for GPA is about half of the effect size for either of the assessments The effect size for the PSSA is similar although slightly less than the effect size for the SAT for both components and both years
Table 29 Annual Family Income Differences for Matched Sample for the Class of 2002 (2001 PSSA 11th Grade and 2002 SAT)
Income Level Performance Subject MeasureMeasure $25000 to $40000 tolt $25000 gt $70000$40000 $70000
PSSA
Math
Reading
Mean SD
N Effect Size
Mean SD
N Effect Size
129900 19108 6658
131011 18466 6594
135381 18361 8709 -0293
136210 17165 8693 -0292
139702 18899 16365 -0516
138848 17110 16348 -0440
145045 20032 14902 -0774
142093 16921 14867 -0626
SAT
Math
Verbal
Mean SD
N Effect Size
Mean SD
N Effect Size
44665 10594 6822
44469 10177 6822
47766 10013 8856 -0301 47619 9546 8856 -0319
50272 10136 16549 -0541 49796 9485
16549 -0542
53816 10580 15122 -0864 52825 9815
15122 -0836
GPA
Mean SD
N Effect Size
3173 0656 6596
3262 0636 8607 -0138
3344 0631 16141 -0266
3412 0628
14726 -0372
HumRRO 36 April 2004
Table 30 Annual Family Income Differences for Matched Sample for the Class of 2003 (2002 PSSA 11th Grade and 2003 SAT)
Income Level Performance Subject MeasureMeasure $25000 - $40000 -lt $25000 gt $70000$40000 $70000
Mean 131577 136393 140924 147093
Math SD N
19401 6230
19051 7958
19319 14963
20560 14295
PSSA Effect Size Mean 132698
-0250 137311
-0483 140572
-0776 144569
Reading SD N
17576 6232
16201 7948
15919 14958
15965 14284
Effect Size -0273 -0470 -0707 Mean 44871 47689 50075 53965
Math SD N
10562 6304
10140 8010
10089 15045
10567 14388
SAT Effect Size Mean 44793
-0272 47581
-0504 49653
-0861 52905
Verbal SD N
10345 6304
9578 8010
9354 15045
9689 14388
Effect Size -0280 -0493 -0809 Mean 3188 3279 3357 3428
GPA SD N
0652 6115
0642 7832
0623 14659
0617 14000
Effect Size -0141 -0265 -0378
Parent Educational Differences
Camara and Schmidt (1999) also looked at the impact of parent education on student performance in standardized testing Their study showed that parental education is related to performance on the SAT I Higher parental education is associated with higher scores on the SAT I Table 31 and Table 32 show the means standard deviations number of students and effect size for various levels of student-reported motherrsquos education for the PSSA SAT and GPA The analyses indicate that the effect size for both assessments and GPA are larger as the motherrsquos educational level increases The effect size for PSSA is not as large as the effect size for SAT The effect size for GPA is about half of the effect size for PSSA or SAT Table 33 and Table 34 provide the same information regarding the fatherrsquos education level The results follow the same pattern as that for motherrsquos education level
HumRRO 37 April 2004
Table 31 Mothers Education Level Differences for Matched Sample for the Class of 2002 (2001 PSSA 11th Grade and 2002 SAT)
Subject Measure lt High School
High School
Some College
BABS Degree
Graduate Degree
Mean 128855 135908 138212 145789 148095
Math SD N
18785 2196
18542 18737
19161 16804
19982 12094
20688 6259
PSSA Effect Size Mean 129039
-378 135883
-0493 137803
-0873 143360
-0974 144735
Reading SD N
17886 2189
17134 18696
17441 16762
16733 12078
16981 6245
Effect Size -0377 -0495 -0883 -0985 Mean 43795 48049 49574 54133 55639
Math SD N
10476 2247
10021 18986
10429 17075
10547 12291
10924 6357
SAT Effect Size Mean 42614
-0415 47405
-0553 49277
-0983 53512
-1107 55072
Verbal SD N
99852247
929118986
963517075
9856 12291
10300 6357
Effect Size -0497 -0679 -1099 -1228 Mean 3142 3267 3289 3456 3504 SD 0653 0630 0640 0618 0601 GPA N 2145 18341 16424 11914 6150
Effect Size -0195 -0227 -0494 -0577
Table 32 Mothers Education Level Differences for Matched Sample for the Class of 2003 (2002 PSSA 11th Grade and 2003 SAT)
lt High High Some BABS GraduateSubject Measure School School College Degree Degree Mean 129723 137323 140038 148027 150140 SD 19513 18746 19865 20474 22494 Math N 2072 17801 16646 11406 5961
Effect Size -0397 -0524 -0915 -0970PSSA Mean 129022 137751 139799 145748 147071 SD 18092 16042 16241 15951 16272 Reading N 2066 17787 16638 11406 5954
Effect Size -0511 -0627 -0981 -1059 Mean 43631 48106 49738 54411 55641
Math SD N
10494 2095
10046 17922
10387 16756
10467 11496
11305 5992
SAT Effect Size Mean 42549
-0436 47592
-0585 49432
-1029 53618
-1101 55050
Verbal SD N
10124 2095
925417922
954716756
9795 11496
10522 5992
Effect Size -0520 -0700 -1111 -1211 Mean 3148 3285 3307 3475 3510
GPA SD N
0646 2003
0622 17344
0636 16134
0608 11088
0599 5797
Effect Size -0216 -0248 -0521 -0581
HumRRO 38 April 2004
Table 33 Fathers Education Level Differences for Matched Sample for the Class of 2002 (2001 PSSA 11th Grade and 2002 SAT)
Subject Measure lt High School
High School
Some College
BABS Degree
Graduate Degree
Mean 128908 135041 138368 144843 150072
Math SD N
18443 2850
18251 17616
18721 14573
19645 12461
20736 7835
PSSA Effect Size Mean 129571
-0334 135453
-0509 137985
-0836 142352
-1079 145994
Reading SD N
18191 2289
17066 17558
17291 14539
16798 12454
16661 7838
Effect Size -0333 -0474 -0730 -0942 Mean 43958 47510 49626 53651 56759
Math SD N
10229 2915
992617845
10116 14800
10368 12636
10727 7980
SAT Effect Size Mean 43245
-0352 47058
-0557 49210
-0941 52830
-122 56114
Verbal SD N
97782915
921217845
947514800
9571 12636
10128 7980
Effect Size -0401 -0620 -0991 -1293 Mean 3136 3247 3301 3432 3548 SD 0637 0634 0633 0618 0594 GPA N 2784 17269 14263 12198 7723
Effect Size -0175 -0260 -0472 -0669
Table 34 Fathers Education Level Differences for Matched Sample for the Class of 2003 (2002 PSSA 11th Grade and 2003 SAT)
lt High High Some BABS GraduateSubject Measure School School College Degree Degree Mean 131197 136533 140022 147183 152503 SD 19107 18733 19163 20247 22047 Math N 2766 16981 14422 11633 7272
Effect Size -0282 -0461 -0812 -1033PSSA Mean 130955 137222 140037 144765 148752 SD 17715 15901 15980 15990 16014 Reading N 2761 16968 14412 11629 7265
Effect Size -0372 -0538 -0818 -1054 Mean 44505 47569 49772 53911 57115
Math SD N
10230 2803
9938 17087
10023 14508
10352 11709
11009 7314
SAT Effect Size Mean 43701
-0304 47224
-0520 49499
-0914 52920
-1187 56296
Verbal SD N
9887 2803
919517087
931014508
9580 11709
10294 7314
Effect Size -0369 -0604 -0947 -1248 Mean 3139 3272 3316 3454 3558
GPA SD N
0639 2696
0624 16545
0632 14014
0606 11281
0582 7046
Effect Size -0211 -0279 -0506 -0686
HumRRO 39 April 2004
Limited English Proficiency Differences
Students identified as having limited English proficiency (LEP) would be expected to have more difficulty taking a test in English than those not identified As a result of these difficulties LEP students would be expected to have lower scores than non-LEP students Table 36 shows the mean standard deviation number of students and the effect size for the entire state on the PSSA in 2001 and 2002 As expected LEP students have lower scores than non-LEP students on both components and effect sizes are generally large However the math component effect size is only about half of the effect size for reading
Table 35 Limited English Proficiency Differences for 11th Grade PSSA (Unmatched State Data) Limited EffectMean Scale Standard NumberYear Subject English Size Score Deviation of CasesProficiency d
Yes 115312 18977 492Math No 130476 22047 115645 07372001 Yes 106216 15338 473Reading No 129784 21727 115093 1253 Yes 116560 20254 844Math No 131550 22812 122706 06952002 Yes 102618 16138 840Reading No 131483 21413 122394 1522
Table 36 and Table 37 show the mean standard deviation number of cases and effect size for the matched sample of students in the Classes of 2002 and 2003 The effect sizes are similar to those in the state sample for the PSSA and SATmdashvery larger in verbalreading and medium in math The effect size is slightly larger for PSSA than SAT in math but slightly smaller for PSSA than SAT in readingverbal However the GPA for LEP students is actually slightly higher than the GPA for non-LEP students
Table 36 Limited English Proficiency Differences for Matched Sample for the Class of 2002 (2001 PSSA 11th Grade and 2002 SAT)
LimitedPerformance Standard Number Effect Size Subject English Mean ScoreMeasure Deviation of Cases dProficiency Yes 125974 19661 134Math No 139310 20070 68055 0671PSSA Yes 113745 14649 132Reading No 138297 17876 67907 1502 Yes 42860 13045 136Math No 50282 10934 69189 0617SAT Yes 33353 9807 136Verbal No 49764 10241 69189 1637 Yes 3393 0617 111GPA No 3328 0637 60172 -0104
HumRRO 40 April 2004
Table 37 Limited English Proficiency Differences for Matched Sample for the Class of 2003 (2002 PSSA 11th Grade and 2003 SAT)
LimitedPerformance Mean Standard Number Effect Size Subject EnglishMeasure Score Deviation of Cases dProficiency Yes 126815 20257 289Mathematics No 141539 20607 70692 0721PSSA Yes 109386 15855 288Reading No 140757 16741 70638 1924 Yes 41564 12159 291Mathematics No 50641 10887 71220 0787SAT Yes 32526 8775 291Verbal No 50105 10126 71220 1855 Yes 3358 585 226GPA No 3348 629 59032 -0008
The regression analyses results (Table 38 and Table 39) show that there are negligible changes in R square for predicting PSSA from SAT scores when adding LEP to the equation for both reading and math for both classes
Table 38 Regressions Results Showing the Adjusted Strength of Being Limited English Proficient on Predicting 2001 PSSA 11th Grade Scale Scores Based on 2002 SAT Scores
Standardized Coefficient Change in R2
SAT Limited English due toPSSA Component R2 Control Proficiency Limited English
Proficiency Reading 0704 0495 Reading 0703 -0011 0495 0000
Math 0846 0715 Math 0845 -0004 0715 0000
Table 39 Regressions Results Showing the Adjusted Strength of Being Limited English Proficient on Predicting 2002 PSSA 11th Grade Scale Scores Based on 2003 SAT Scores
Standardized Coefficient Change in R2
PSSA Component SAT Control
Limited English Proficiency R2 due to
Limited English Proficiency
Reading 0775 0601 Reading 0771 -0033 0602 +0001
Math 0865 0749 Math 0865 0000 0749 0000
HumRRO 41 April 2004
School-Level Scores Means were calculated by school for all scale scores and grade indicators to analyze
school-level results School-level descriptive statistics are presented for the Classes of 2002 and 2003 for the PSSA (Table 40) SAT (Table 41) and GPA and course grades (Table 42) Only schools with at least 10 students with merged PSSA and SAT scores are included in the analyses School-level means showed an increase on both tests both test components GPA and course grades from the Class of 2002 to the Class of 2003 The change in scoring procedures from the 2001 PSSA to the 2002 PSSA (instituting a minimum score of 700 for the 2002 PSSA) is problematic However there were only 9 students in this college-bound sample in the Class of 2003 who scored a 700 on the 2002 PSSA reading component and no students who scored a 700 on the math component The change in course grades was extremely small
Table 40 PSSA School-Level Descriptive Statistics for the Classes of 2002 and 2003 Subject Measure Class of 2002 Class of 2003 Reading Mean 136973 139316
SD 7435 7088 N 586 586
Math Mean 136966 139333 SD 8335 8496
N 586 586 Limited to schools with at least 10 students with merged PSSA and SAT scores
Table 41 SAT School-Level Descriptive Statistics for the Classes of 2002 and 2003 Subject Measure Class of 2002 Class of 2003 Verbal Mean 48578 48907
SD 4207 4251 N 586 586
Math Mean 48847 49159 SD 4500 4601
N 586 586 Limited to schools with at least 10 students with merged PSSA and SAT scores
HumRRO 42 April 2004
Table 42 School-Level Descriptive Statistics GPA and Course Grades for the Classes of 2002 and 2003
Subject Measure Class of 2002 Class of 2003 GPA Mean 334 346
SD 019 019 N 586 586
English Mean SD
329 020
331 021
N 586 586 Math Mean 311 312
SD 021 022 N 586 586
Limited to schools with at least 10 students with merged PSSA and SAT scores
Average Within-Year School-Level Correlations
Table 43 and Table 44 present correlations among these school-level scores Table 45 presents correlations for the average across the two years4 As Hoffman (1998) pointed out there is a tendency for correlations among school scores to be higher than correlations among student-level scores (Class of 2002 - Table 8 Class of 2003 - Table 9 and average for the Classes of 2002 and 2003 - Table 10) This is the case except for those correlations involving GPA and course-grades (except for PSSA reading to math course grade and GPA to English course grade where school-level correlations are higher)
As Hoffman (1998) pointed out the lower school-level correlations for GPA suggests that grading scales are not equivalent across schools There is a tendency for different schools to grade differently As a result at the school level of analysis there is a weaker relationship between GPA and either PSSA or ACT scores When studentsrsquo scores are averaged at the school level observed differences are related not only to differing levels of student achievement but to the particular schoolrsquos grading practices However the school-level relationship between GPA and course grades remains strong for both PSSA and SAT
4 Average correlations were technically corrected with Fisherrsquos r to z transformations
HumRRO 43 April 2004
Table 43 School-Level PSSA SAT and Course Grade Correlations for the Class of 2002 PSSA SAT Course Grades
Variable Reading Math Verbal Math GPA (Total) English Math
ReadingPSSA
Math
1000
0861 1000
Verbal SAT
Math
0818 0883
0773 0935
1000
0941 1000
GPA
English Course
Grades Math
0413 0393
0411 0391
0423 0454
0371 0376
0359 0362
0416 0450
1000
0778 1000
0719 0542 1000 Limited to schools with at least 10 students with merged PSSA and SAT scores
Table 44 School-Level PSSA SAT and Course Grades Correlations for the Class of 2003 PSSA SAT Course Grades
Variable Reading Math Verbal Math GPA (Total) English Math
ReadingPSSA
Math
1000
0870 1000
Verbal SAT
Math
0905 0849
0868 0915
1000
0943 1000
GPA
English Course
Grades Math
0491 0443
0442 0394
0501 0489
0439 0425
0402 0394
0484 0486
1000
0780 1000
0784 0615 1000 Limited to schools with at least 10 students with merged PSSA and SAT scores
HumRRO 44 April 2004
Table 45 School-Level PSSA SAT and Course Grades Correlation Averages for the Class of 2002 and 2003
PSSA SAT Course Grades
Variable Reading Math Verbal Math GPA (Total) English Math
ReadingPSSA
Math
1000
0866 1000
Verbal SAT
Math
0868 0867
0826 0926
1000
0942 1000
GPA
English Course
Grades Math
0453 0418
0427 0393
0463 0472
0406 0401
0381 0378
0451 0468
1000
0779 1000
0753 0580 1000 Limited to schools with at least 10 students with merged PSSA and SAT scores
Table 46 shows that the mean school-level scores for both PSSA 11th grade reading and SAT verbal components of each assessment increased from the Class of 2002 to the Class of 2003 For the SAT the mean school-level change on the verbal component was +330 scale score points For the PSSA the mean school-level scale score change on the 11th grade reading component was +2343 scale score points Table 47 shows the fairly strong relationship between the differences in mean school-level scores on the SAT verbal component and the PSSA reading component for the Classes of 2002 and 2003 This relationship is graphically portrayed in Figure 17 Table 48 Table 49 and Figure 18 show the same information for the math components of the PSSA and SAT As would be expected the relationship between the math components is stronger than for the readingverbal components
Table 46 Difference in Mean School-Level SAT Verbal and PSSA Reading Scores From the Classes of 2002 and 2003
Difference in Mean School-Level Score From the Standard Number ofMeanClass of 2002 and Class of 2003 Deviation Schools SAT Verbal +330 1673 586
PSSA Reading +2343 4660 586 Limited to schools with at least 10 students with merged PSSA and SAT scores
Table 47 Correlation of Difference in School-Level Mean SAT Verbal Score and PSSA Reading Score Between the Classes of 2002 and 2003
Difference in Mean School-Level Score From the SAT PSSA Class of 2002 and Class of 2003 Verbal Reading
SAT Verbal 1
PSSA Reading 462 1
HumRRO 45 April 2004
-200 -100 0 100 200
Difference in School-Level PSSA Reading Mean Score between the Class of 2002 and Class of 2003
-100
-50
0
50
100
Diff
eren
ce in
Sch
ool-L
evel
SA
T V
erba
l Mea
n Sc
ore
betw
een
Cla
ss o
f 200
2 an
d C
lass
of 2
003
$
$$
$
$
$
$$
$
$$
$
$
$
$
$
$
$
$$
$
$
$
$
$
$
$
$
$
$
$
$
$
$$
$
$
$
$
$
$
$
$
$
$ $
$$
$
$
$
$
$
$
$
$$
$
$$
$ $
$$$ $$
$
$
$
$
$
$
$
$
$
$
$
$
$
$$
$
$
$
$$
$$
$$$
$
$$
$
$
$$
$$
$
$
$
$
$
$
$
$
$
$$$
$$$
$
$
$
$
$
$$
$$
$
$$
$
$
$
$
$
$
$
$
$
$
$
$
$
$
$
$
$
$ $
$$
$
$$$ $$
$
$$$
$$
$
$
$
$
$
$
$
$$
$$
$
$
$
$
$
$
$
$
$
$$
$$
$
$$
$
$
$$
$
$
$
$$
$
$$
$
$$
$
$
$
$
$
$
$
$
$
$
$$
$
$$
$$
$
$$$$
$$
$$
$
$$
$
$
$
$
$$
$
$
$
$$
$
$ $$$
$
$ $$
$
$
$
$$
$
$$
$
$
$
$ $$$
$$
$$
$
$ $
$
$
$$
$
$
$
$
$
$
$$
$
$
$ $
$
$
$
$
$$
$
$
$$
$
$
$
$ $$
$
$
$ $
$$
$
$
$
$
$
$
$
$
$
$
$$
$
$
$$ $
$
$
$
$$
$
$
$$ $
$
$
$
$
$
$
$
$
$
$
$
$
$ $
$
$$
$
$$
$
$
$
$
$
$$
$
$
$
$
$
$
$
$
$$
$
$$
$
$
$$$ $
$
$
$$
$$
$
$$
$
$
$ $$ $
$ $
$$
$
$
$$$$
$
$$$
$
$$
$
$
$
$ $
$
$
$
$
$ $$
$
$
$
$
$
$ $
$ $ $
$
$
$
$
$$
$
$
$
$
$
$
$
$ $
$
$$
$
$$ $
$
$
$
$
$
$
$
$ $
$$
$
$
$
$
$
$
$
$$
$
$$
$
$
$
$
$$
$
$
$
$$
$$
$
$
$ $$$
$
$
$
$
$
$
$$$$
$
$$
$
$
$$
$
$$
$
$
$
$$$
$
$$
$
$
$
$
$$
$$
$
$
$
$$
$
$$
$$
$$
$
$
$
$
$$
$
$
$
$$
$
$
$
$
$
$$
$
$
$
$
$$
$
$
$
$
$
$
$$
$$
Figure 17 Scatterplot of difference in school-level SAT verbal mean scores and school-level PSSA 11th grade reading mean scores between the Class of 2002 and Class of 2003
Table 48 Difference in Mean School-Level SAT Math and PSSA Math Scores From the Class of 2002 and Class of 2003
Difference in Mean School-Level Math Score From the Class of 2002 and Class of 2003 Mean Standard
Deviation Number of
Schools
SAT +313 1842 586
PSSA +2367 4687 586 Limited to schools with at least 10 students with merged PSSA and SAT scores
HumRRO 46 April 2004
Table 49 Correlation of Difference in School-Level Mean SAT Math Score and PSSA Math Score Between the Classes of 2002 and 2003
Difference in Mean School-Level Math Score From the Class of 2002 and Class of 2003 SAT PSSA
SAT 1
PSSA 644 1
-200 -100 0 100 200
Difference in School-Level PSSA Math Mean Scale Score between the Class of 2002 and Class of 2003
-100
-50
0
50
100
Diff
eren
ce i
n Sc
hool
-Lev
el S
AT
Mat
h M
ean
Scor
e
betw
e en
the
Clas
s of
200
2 an
d Cl
ass
of 2
003
$
$$ $
$
$$
$
$$
$
$
$$
$
$
$$ $$
$
$
$
$
$
$
$
$
$$$
$
$
$$$
$
$
$
$
$
$
$$
$
$
$
$
$
$
$
$
$$$ $
$
$$
$
$
$
$
$$ $$
$$
$
$
$
$
$
$
$
$$
$
$$
$
$$
$
$
$
$
$ $$$
$
$
$
$
$
$
$
$$
$
$
$
$$
$
$
$
$
$
$ $
$$
$
$
$
$$
$
$$
$
$
$
$
$
$
$
$
$
$$
$
$$
$$
$
$
$
$
$
$$
$
$
$$
$
$
$
$$
$
$
$
$
$
$
$
$
$
$
$
$
$
$
$
$
$$
$
$
$$ $
$
$
$
$
$$
$
$
$
$
$
$
$
$
$
$
$
$
$
$
$
$
$
$
$$
$
$
$
$
$
$
$
$
$
$
$$
$
$
$
$
$$$
$
$
$
$
$
$
$ $$
$
$
$
$
$$
$
$
$
$
$
$$$
$
$
$$$
$
$
$
$
$$
$
$
$$
$
$
$$$
$
$
$
$
$
$
$$$
$
$
$
$
$$
$
$
$
$
$
$
$
$ $
$
$
$
$
$
$
$
$
$
$
$
$
$
$
$
$
$
$
$
$
$
$$$$
$$
$$
$
$$$
$$
$
$$
$
$
$
$
$
$
$
$$
$
$$
$
$
$
$
$
$$
$
$
$
$
$
$$
$
$$
$
$
$$
$
$
$
$
$
$
$
$
$
$
$ $
$
$
$
$
$$
$
$$$ $
$
$
$
$
$
$ $
$$
$
$$
$
$
$$
$ $
$$
$
$
$
$
$
$
$
$
$
$
$
$$
$
$
$
$
$
$
$
$ $
$$
$
$
$
$
$$ $
$
$$
$
$$
$$
$
$
$
$
$
$
$
$
$
$
$$
$
$$
$
$
$$
$
$
$
$
$$
$$
$$$
$$
$
$
$
$$
$
$$
$
$$
$
$
$
$
$
$
$
$
$
$
$
$
$ $$
$
$
$
$
$$
$
$
$
$$
$
$
$
$
$$
$
$$$$
$
$
$
$$$ $
$
$$
$
$
$
$
$
$$
$
$
$$
$$
$ $ $
$
$
$
$
$$
$
$$
$$
$
$
$
$$
$
$
$
$$
$
$
$
$
$
$
$
$$
$
$
$$
$
$
$
Figure 18 Scatterplot of differences in school-level mean SAT math score and school-level mean PSSA math scores between the Classes of 2002 and 2003
Pooled Within-School Correlations
The above discussion alluded to school-level factors such as differences in grading practices which may be impacting observed correlations Figure 19 depicts an extreme version of such a situation Schools A B and C are clearly different in where their students lie with respect to PSSA or SAT scores but they are identical in terms of the grades their students
HumRRO 47 April 2004
receive Also within each school there is a relationship between grades and either PSSA scores or SAT scores However if a correlation were calculated using students from all schools without regard to school-level characteristics it would be zero
School A
School B PSSA or SAT Scores
School C
Grade Point Average (GPA)
Figure 19 Extreme hypothetical illustration of how mean differences among schools on PSSA or SAT scores that are not mirrored by differences in GPA can impact correlations (Ellipses represent students scores within each school)
Pooled within-school correlations are used to estimate relationships between measures calculated within schools and then averaged across all schools These pooled within-school correlations were calculated for each of the two years of data (Table 50 for the Class of 2002 and Table 51 for the Class of 2003) and then averaged across the two years (Table 52)5 The resulting average pooled within-school correlations are presented in Table 52
5 Again the technical r to z correction was used
HumRRO 48 April 2004
Table 50 Pooled Within-School Correlation for the Class of 2002 PSSA SAT Course Grades
Variable Reading Math Verbal Math GPA (Total) English Math
ReadingPSSA
Math
1000
0648 1000
Verbal SAT
Math
0693 0650
0569 0832
1000
0695 1000
GPA
English Course
Grades Math
0528 0573
0461 0412
0361 0542
0516 0559
0465 0402
0349 0541
1000
0703 1000
0668 0443 1000 Limited to schools with at least 10 students with merged PSSA and SAT scores
Table 51 Pooled Within-School Correlation for the Class of 2003 PSSA SAT Course Grades
Variable Reading Math Verbal Math GPA (Total) English Math
ReadingPSSA
Math
1000
0702 1000
Verbal SAT
Math
0757 0629
0666 0857
1000
0662 1000
GPA
English Course
Grades Math
0512 0564
0457 0405
0350 0541
0534 0679
0466 0414
0369 0548
1000
0698 1000
0667 0443 1000 Limited to schools with at least 10 students with merged PSSA and SAT scores
HumRRO 49 April 2004
Table 52 Pooled Within-School Correlation Averaged for Classes of 2002 and 2003 PSSA SAT Course Grades
Variable Reading Math Verbal Math GPA (Total) English Math
ReadingPSSA
Math
1000
0676 1000
Verbal SAT
Math
0727 0640
0620 0845
1000
0679 1000
GPA
English Course
Grades Math
0520 0569
0459 0409
0356 0542
0525 0569
0466 0408
0359 0546
1000
0701 1000
0668 0443 1000 Limited to schools with at least 10 students with merged PSSA and SAT scores
If differences between schoolsrsquo grading procedures are substantial and if within schools students with higher grades also have higher PSSA scores then the correlations in Table 52 will be higher than student correlations in Table 10 (student-level correlations averaged for the Classes of 2002 and 2003) The difference between the GPA correlations in Table 10 and Table 52 however are only marginally different (see Table 53) In nearly all cases the within-school correlations are higher However the range is relatively smallmdash0009 to 0039 for GPA 0176 to 0219 for English course grades and 0147 to 0237 for math course grades Thus grading differences among schools do appear to exist but the effect is small for studentsrsquo GPA but larger for both English and math course grades especially when compared to the matching assessment component (ie English course grade to PSSA reading and SAT verbal math course grade to PSSA math and SAT math)
HumRRO 50 April 2004
Table 53 Differences Between Student-Level Correlations and Pooled Within-School Correlations Averaged for the Classes of 2002 and 2003
GPA or Course Grade to Student-Level Pooled Within- Difference in Assessment Correlations School Correlations Correlations
GPA to PSSA Reading 0511 0520 0009
GPA to PSSA Math 0546 0569 0023
GPA to SAT Verbal 0494 0525 0031
GPA to SAT Math 0530 0569 0039
English to PSSA Reading 0240 0459 0219
English to PSSA Math 0226 0409 0183
English to SAT Verbal 0256 0466 0210
English to SAT Math 0232 0408 0176
Math to PSSA Reading 0202 0356 0154
Math to PSSA Math 0305 0542 0237
Math to SAT Verbal 0212 0359 0147
Math to SAT Math 0313 0546 0233
Comparison of the correlations in Table 52 to Table 10 can also be used to test a hypothesis about the relationship between PSSA and SAT performance It is suggested above that some schools might be working more successfully toward improving PSSA performance than others Again if these efforts are only tangentially affecting SAT scores then we might expect mean differences among schools on PSSA scores that are not mirrored by differences on SAT Within schools however we can still expect students who do better on PSSA to also have a tendency to do better on SAT Figure 20 provides an extreme illustration of this potential effect Comparing correlations between PSSA and SAT from Table 52 to Table 10 reveals no such trend (see Table 54) The differences are all small (-0020 to +0009) suggesting that there are no significant differences among schools in the average PSSA scores of their students that are not mirrored by differences in studentsrsquo SAT scores This conclusion is consistent with the earlier conclusion from the individual level data That is no strong methodological differences in skills requirements are evidenced
HumRRO 51 April 2004
SAT Scores
School A School B School C
PSSA Scale Scores
Figure 20 Extreme hypothetical illustration of how mean differences among schools on PSSA scores that are not mirrored by differences on SAT scores can impact correlations (Ellipses represent students scores within each school)
Table 54 Differences Between SAT and PSSA Components for Student-Level Correlations and Pooled Within-School Correlations Averaged for the Classes of 2002 and 2003
GPA or Course Grade to Student-Level Pooled Within- Difference in Assessment Correlations School Correlations Correlations
PSSA Reading to SAT Verbal 0742 0727 -0015
PSSA Reading to SAT Math 0690 0640 -0020
PSSA Math to SAT Verbal 0629 0620 +0009
PSSA Math to SAT Math 0856 0845 -0009
A third comparison can also be made with the pooled within-school correlations This concerns the intercorrelations within each assessment format The pooled within-school PSSA intercorrelation (Table 52) shows a very slight decrease from student-level PSSA correlations (Table 10) while the pooled within-school SAT intercorrelation (Table 52) shows a larger increase from the student-level SAT intercorrelations (Table 10) It is possible that this is due to an increased homogeneity for the pooled within-school results However Figure 21 presents an exaggerated illustration of another manner in which this difference might be obtained This pattern would yield higher correlations for all students than for students within a school and a higher correlation of school-level scores (school-level PSSA intercorrelation is 0866 school-level SAT intercorrelation is 0942 [both from Table 45]) than for student-level scores (student-level PSSA is 0686 student-level SAT intercorrelation is 0737 [both from Table 10]) Although small (see Table 55) this is the pattern of differences in correlations obtained for both PSSA intercorrelations and for SAT intercorrelations Note that the difference between the PSSA components is smaller than the difference between the SAT components The obtained pattern
HumRRO 52 April 2004
like that in Figure 21 but much less exaggerated could result from differences between schools in the population of their students from differences in instruction that impact PSSA and SAT test scores or both
Content
Area B School A
School B
School C
Content Area A
Figure 21 Exaggerated illustration of how mean differences among schools can increase overall correlations (Ellipses represent students scores within each school)
Table 55 Internal Differences between SAT and PSSA Components for Student-Level Correlations and Pooled Within-School Correlations Averaged for the Classes of 2002 and 2003
GPA or Course Grade to Student-Level Pooled With- Difference in Assessment Correlations School Correlations Correlations
PSSA Reading to PSSA Math 0686 0676 -0010
SAT Verbal to SAT Math 0737 0845 0108
Summary and Conclusion The purpose of this report is to explore the validity questions ldquoAre PSSA scores
appropriately related to other measures of educational achievementrdquo
The data presented in this report suggest the following main points
bull Students who do well on any of the assessments tend to do well on all of the assessmentsmdashPSSA SAT GPA or course grades
bull When schoolsrsquo means are calculated using only the SAT-taking population of students schools with high scores on SAT also have high PSSA scores GPA and course grades are also related to both PSSA and SAT although not as strongly as the relationship between the PSSA and SAT
HumRRO 53 April 2004
PSSA exhibits strong convergent validity coefficients Correlations are very high between PSSA and SAT PSSA is positively correlated with other measures of student achievement including course grades and GPA Gains on PSSA are reflective of changes on SAT at the school level All these data provide strong evidence in support of PSSA as a valid measure of student achievement
There are however a few clarifications and qualifications to these general conclusions but none that diminish the basic findings These clarifications and qualifications include the following
Changes in scores Both mean PSSA and SAT scores experienced an increase Changes between the two assessments are positively correlated Schools that have gained on one assessment tend to have also gained on the other assessment However the same relationship is also true for those schools that have decreased
PSSA and SAT are tied to different content domains use differently formatted items and were designed to serve very different purposes However it is clear from the data that students who tend to perform well on the PSSA can also be expected to perform well on the SAT and vice-versa It is clear from the data that schools that perform well on one test can be expected to perform well on the other It is also clear that schools that improve on one test can be expected to improve on the other
Discriminant validity At the student level and the school level the different assessments of mathematics achievement are more highly related to each other than to assessments of other subjects Students with high mathematics scores on one assessment will tend to do well on all other assessments but that tendency is most pronounced for other mathematics assessments The same holds for school scores There is a similar differentiation on readingverbal assessments at both the student and school level but not as pronounced as in mathematics
GPA shows positive relationships with both PSSA and SAT assessments at the student and school level but not as pronounced as the relationship between the two assessments This is interpreted as being due to differences in schoolsrsquo grading practices Grading practices apparently differ sufficiently to reduce school-level associations with PSSA and SAT scores
Neither gender race socioeconomic status nor limited English proficiency appear to influence the PSSA scores any more than would be expected based on observed differences for SAT scores In other words PSSA items are not injecting any unexpected gender racialethnic socioeconomic status or limited English proficiency bias
HumRRO 54 April 2004
References
Camara WJ amp Schmidt AE (1999) Group differences in standardized testing and social stratification (College Board Report No 99-5) New York College Entrance Examination Board
Campbell D T amp Fiske D W (1959) Convergent and discriminant validation by the multitrait-multimethod matrix Psychological Bulletin 56(2) 81-105
Cassady JC (2001) Self-reported GPA and SAT A Methodological Note Practical Assessment Research amp Evaluation 7(12)
Coe Robert (2002) Itrsquos the effect size stupid What effect size is and why itrsquos important Paper presented at the Annual Conference of the British Educational Research Association University of Exeter England Retrieved from httpwwwleedsacukeducoldocuments00002182htm
Cohen J (1988) Statistical power analysis for the behavioral sciences (2nd ed) Hillsdale NJ Erlbaum
Hoffman R G (1998) Relationships among Kentuckyrsquos open-response assessments ACT scores and studentsrsquo self-reported high school grades (HumRRO Report FR-WATSD-98-27) Radcliff KY Human Resources Research Organization
Lewis DM Mitzel HC amp Green DR (1996) Standard setting A bookmark approach Symposium presented at the Council of Chief State School Officers Conference on Large ndashScale Assessment Phoenix AZ
Livingston SA amp Zieky MJ (1978) Manual for setting standards on the Basic Skills Assessment Test Princeton NJ Educational Testing Service
Mead R amp Melby K (2003 February) Technical analysis Pennsylvania System of School Assessment 2003 reading and mathematics PSSA Data Recognition Corporation
Mead R amp Melby K (2002 April) Technical analysis Pennsylvania System of School Assessment 2001 reading and mathematics PSSA Data Recognition Corporation
Mead R Smith RM amp Swanlund A (2003) Technical analysis 2003 Pennsylvania System of School Assessment mathematics and reading Data Recognition Corporation
NCLB (2004) httpwwwedgovnclblandingjtml
Sicoly Fiore (2002) What do school-level scores from large-scale assessments really measure Educational Measurement Issues and Practice 21(4) 17-26
Terenzini PT Cabrera AF amp Bernal EM (2001) Swimming against the tide The poor in American higher education (Research Report No 2001-1) New York College Entrance Examination Board
Willingham WW amp Cole NS (1997) Gender and Fair Assessment Hillsdale NJ Erlbaum
HumRRO 55 April 2004
HumRROKDE April 2003

2001
PSS
A 1
1th
Gra
de R
eadi
ng S
cale
Sco
re
2000
1800
1600
1400
1200
1000
800
600
Outliers are hidden Extreme values are hidden
n=27359
n=6538
n=23685
n=244
1 2 3 4
Student-Reported Average Grade for English on SAT Student Descriptive Questionnaire
Advanced
Proficient
Basic
Below Basic
Average Grade 1 - Passing 2 - Fair 3 - Good 4 - Excellent
Figure 9 Student-level relationship between 2001 PSSA 11th grade reading scale score and student-reported average English course grades on the Student Descriptive Questionnaire (SDQ) of the SAT for the Class of 2002
HumRRO 19 April 2004
Outliers are hidden Extreme values are hidden
1 2 3 4
Student-Reported Average Grade for English on SAT Student Descriptive Questionnaire
600
800
1000
1200
1400
1600
1800
2000
2200
2400
2002
PSS
A 1
1th
Gra
de R
eadi
ng S
cale
Sco
re
n=6065 n=26317 n=23397 n=249 Average Grade 1 - Passing 2 - Fair 3 - Good 4 - Excellent
Advanced
Proficient
Basic
Below Basic
Figure 10 Student-level relationship between 2002 PSSA 11th grade reading scale score and student-reported English course grades on the SAT Student Descriptive Questionnaire (SDQ) for the Class of 2003
PSSA Math Scale Score Versus SAT Reported Average Grade in Math
Figure 11 and Figure 12 illustrate the relationship between the PSSA 11th grade math scale scores and the grades students reported in the optional Student Descriptive Questionnaire (SDQ) portion of the SAT which students are asked to complete as part of registering for the SAT The SDQ asked students to report their average grade in math The available responses to this question were 0 ndash Failing 1 ndash Passing 2 ndash Fair 3 ndash Good or 4 ndash Excellent The category ldquoNo responserdquo indicates that the student did not respond to the question In 2002 8523 students did not respond to the math average grade question In 2003 6316 students did not respond In 2002 41 students responded that their average math grade was ldquoFailingrdquo In 2003 47 students had this answer Students who did not respond and those who responded that their average grade was ldquoFailingrdquo were not included in the graphs
HumRRO 20 April 2004
2001
PSS
A 1
1th
Gra
deM
ath
Scal
e Sc
ore 2000
1800
1600
1400
1200
1000
800
600
Outliers are hidden Extreme values are hidden
n=19993
n=11254 n=25509
n=970
1 2 3 4
Student-Reported Average Grade for Math on SAT Student Descriptive Questionnaire
Advanced
Proficient
Basic
Below Basic
Average Grade 1 - Passing 2 - Fair 3 - Good 4 - Excellent
Figure 11 Student-level relationship between 2001 PSSA 11th grade math scale score and student-reported average math course grades in the Student Descriptive Questionnaire (SDQ) of the SAT for the Class of 2002
HumRRO 21 April 2004
Outliers are hidden Extreme values are hidden
1 2 3 4
Student-Reported Average Grade for Math on SAT Student Descriptive Questionnaire
600
800
1000
1200
1400
1600
1800
2000
2002
PSS
A 1
1th
Gra
de M
ath
Scal
e Sc
ore
n=10370 n=24674
n=19835
n=1003
Advanced
Proficient
Basic
Below Basic
Average Grade 1 - Passing 2 - Fair 3 - Good 4 - Excellent
Figure 12 Student-level relationship between 2002 PSSA 11th grade math scale score and student-reported average math course grade in the SAT Student Descriptive Questionnaire (SDQ) for the Class of 2003
PSSA Scale Scores Versus SAT Reported Grade-Point Average
Figure 13 through Figure 16 illustrate relationships between PSSA scale scores and overall grade-point averages (GPAs) The GPAs are from the SATrsquos SDQ Students were asked to provide their GPA on a basic 4-point scale with pluses and minuses around each point (A+ = 43 A = 40 A- = 37 etc) Approximately 87 (60283 of 69325) of students in the Class of 2002 completed the GPA question in the SDQ and 83 (59258 of 71511) of students in the Class of 2003 completed the question The mean student-reported GPA was 333 (SD = 064) for the Class of 2002 and 335 (SD = 063) for the Class of 2003 The correlation for the 2001 PSSA 11th grade reading component with the 2002 GPA was 0501 For the 2001 PSSA 11th grade math component the correlation was 0539 For the 2002 PSSA the correlations were 0520 in Reading and 0553 in Math The box-plots for PSSA scale scores to GPA for both years and both tests performed as expectedmdashlower scores for lower GPAs and higher scores for higher GPAs Note that the median and boxes align fairly well with the appropriate performance levelsmdashA students in the Advanced and Proficient level B students generally in the Proficient level C students in the low Proficient and Basic levels and D students in the Basic level Note also that the number of students decreases sharply when the student-reported GPA drops below 30
HumRRO 22 April 2004
Outliers are hidden Extreme values are hidden
Advanced
Proficient
Basic
Below Basic
10 13 17 20 23 27 30 33 37 40 43
Student-reported GPA (4-point scale) on the 2002 SAT Student Descriptive Questionnaire (SDQ)
800
1000
1200
1400
1600
1800
2000
2001
PSS
A 1
1th
Gra
de R
eadi
ng S
cale
Sco
re
n=10261
n=5370 n=11810
n=11101 n=9668
n=4624
n=2381 n=3352
n=520 n=40
n=96
Figure 13 Student-level relationship between 2001 PSSA 11th grade reading scale score and student-reported grade-point average (GPA) from the SATrsquos Student Descriptive Questionnaire (SDQ) for the Class of 2002
HumRRO 23 April 2004
Outliers are hidden Extreme values are hidden
10 13 17 20 23 27 30 33 37 40 43 Student-reported GPA (4-point scale) on the 2003 SAT Student Descriptive Questionnaire (SDQ)
800
1000
1200
1400
1600
1800
2000
2002
PSS
A 1
1th
Gra
de R
eadi
ng S
cale
Sco
re
n=3304
n=10358
n=5089
n=11480
n=11507
n=9773
n=4602
n=2084 n=97 n=496 n=27
Advanced
Proficient
Basic
Below Basic
Figure 14 Student-level relationship between 2002 PSSA 11th Grade reading scale score and student-reported grade-point average (GPA) from the SATrsquos Student Descriptive Questionnaire (SDQ) for the Class of 2003
HumRRO 24 April 2004
Outliers are hidden Extreme values are hidden
10 13 17 20 23 27 30 33 37 40 43 Student-reported GPA (4-point scale) on the 2002 SAT Student Descriptive Questionnaire (SDQ)
800
1000
1200
1400
1600
1800
2000
2001
PSS
A 1
1th
Gra
de M
ath
Scal
e Sc
ore
n=10280
n=5391 n=11831
n=11123 n=9672
n=4635
n=2393 n=3377
n=526 n=42
n=97
Advanced
Proficient
Basic
Below Basic
Figure 15 Student-level relationship between 2001 PSSA 11th grade math scale score and student-reported grade-point average (GPA) from the SATrsquos Student Descriptive Questionnaire (SDQ) for the Class of 2002
HumRRO 25 April 2004
Outliers are hidden Extreme values are hidden
10 13 17 20 23 27 30 33 37 40 43 Student-reported GPA (4-point scale) on the 2003 SAT Student Descriptive Questionnaire (SDQ)
800
1000
1200
1400
1600
1800
2000
2002
PSS
A 1
1th
Gra
de M
ath
Scal
e Sc
ore
n=3319
n=10364
n=5091
n=11480
n=11514
n=9777
n=4600
n=2085 n=98
n=496
n=27
Advanced
Proficient
Basic
Below Basic
Figure 16 Student-level relationship between 2001 PSSA 11th grade math scale score and student-reported grade-point average (GPA) from the SATrsquos Student Descriptive Questionnaire (SDQ) for the class of 2002
HumRRO 26 April 2004
Differences in Performance for Demographic Groupings
Analyses were conducted to compare performance on the PSSA and SAT among students from varying backgrounds Average test performance tends to differ for students of differing genders ethnic groups and various measures associated with socioeconomic status The important question for judging bias on the PSSA is not whether specific groups show mean differences but whether those differences are larger for the PSSA than the differences observed on other measures of student achievement
Differences between measures of achievement can be captured in several ways This report will present two measures of mean differences First effect size statistics will be calculated for the differences between major categories of students (Coe 2002) The magnitude of the effect size statistics is less important than the difference between the effect sizes for PSSA compared to the other measures However measuring the magnitude of the gaps for NCLB-defined groups is instructive and important since all states are expected to make progress toward closing those gaps (No Child Left Behind 2004)
Effect size statistics can be interpreted as the average percentile standing of the average treated (or experimental) participant relative to the average untreated (or control) participant An effect size of 00 indicates that the mean of the treated group is at the 50th percentile of the control group An effect size of 08 indicates that the mean of the treated group is at the 79th
percentile of the control group An effect size of 17 indicates that the mean of the treated group is at the 955th percentile of the control group Cohen (1988) hesitantly defined effect sizes as ldquosmall d=2rdquo ldquomedium d=5rdquo and ldquolarge d=8rdquo He went on to caution against offering conventional operational definitions such as these in the diverse field of behavioral science
The second measure used to capture differences between measures of achievement was regression analysis Regression analysis was used to examine the extent to which PSSA differences in performance for various demographic groupings are similar to those found in SAT scores For each of the demographic groupings we calculated a regression equation to predict PSSA scores based on the matching SAT content score A second equation was created which added the specific demographic characteristic of interest If PSSA scores exhibit greater differences based on that demographic characteristic that characteristic will have a significant weight and there will be a meaningful increase in the prediction of the PSSA component score
Gender Differences
Table 12 presents performance means for males and females for the PSSA only This table provides information from the larger state population to use in comparison with the matched PSSA and SAT sample data The SAT-taking population can be expected to post higher means For all gender tables data is coded such that positive numbers indicate higher mean scores for males negative numbers indicate higher mean scores for females For the full population of PSSA takers the pattern of performance between males and females is consistent Males outscore females but only to a very small degree on the PSSA mathematics test for all three included years Females outscored males to a higher but still small degree on the PSSA reading test The differences between years are small and inconsistent This table shows that the gap in performance for both PSSA mathematics and reading between males and females is small and has not changed dramatically between 2001 and 2003
HumRRO 27 April 2004
Table 12 Gender Differences for PSSA (Unmatched State Data) Mean Scale Standard Number of Effect Size Year Subject Gender Score Deviation Cases d
Mathematics Male 130954 22870 56380
2001 Reading Female
Male Female
130288 127107 132719
21170 22731 20167
55496 56091 55280
0030
-0261 Mathematics Male 132475 23813 60777
2002 Reading Female
Male Female
130679 129478 133443
21694 22536 20034
59849 60686 59636
0079
-0186 Mathematics Male 132555 22198 63542
2003 Reading Female
Male 130434 129308
20680 24674
61849 63840
0099
Female 133974 22003 62020 -0200
Table 13 and Table 14 present data for the matched sample of students taking both PSSA and SAT by gender Scale scores for both assessments as well as studentsrsquo self-reported GPA are included in the tables The numbers of males versus females in the state student population is similar typically with a few more males than females per grade However many more females take the SAT tests suggesting that more females than males aspire to attend college Males outscored females by a small margin on the PSSA and the SAT mathematics tests This finding is consistent with scoring patterns on SAT and ACT reported by Willingham and Cole (1997) They suggest that as a rule females tend to avoid taking mathematics and science classes In an apparent inconsistency females outscored males on PSSA reading but not on SAT verbal Scores for SAT verbal were nearly identical for males and females Willingham and Cole found gender differences favoring females in writing skills The PSSArsquos performance-task items add a writing component that was not present in the SAT for the Classes of 2002 and 2003 However SAT will include a student-written essay beginning in spring 2005 This study found that females tended to have higher self-reported GPAs than males
Table 13 Gender Differences for Class of 2002 Matched Sample (2001 PSSA and 2002 SAT) Performance Standard Number of Effect SizeSubject Gender MeanMeasure Deviation Cases d
Mathematics Male 141925 20536 29403
PSSA Reading Female
Male Female
137503 137162 139420
19408 18761 16921
36530 29345 36451
0221
-0126 Mathematics Male 52273 11076 29787
SAT Verbal Female
Male 48821 50081
10527 10333
37042 29787
0319
Female 49582 10126 37042 0049
GPA Male Female
3243 3404
656
609 25323 32857 -0255
HumRRO 28 April 2004
Table 14 Gender Differences for Class of 2003 Matched Sample (2001 PSSA and 2002 SAT) Performance Mean Standard Number Effect Size Subject GenderMeasure Score Deviation of Cases d
Mathematics Male 145023 21049 31338
PSSA Reading Female
Male Female
138650 140570 140715
19790 17318 16427
38459 31328 38418
0312
-0009 Mathematics Male 52596 11067 31557
SAT Verbal Female
Male 48997 50524
10490 10235
38745 31557
0327
Female 49623 10097 38745 0089 Male 3265 653 25387GPA Female 3415 600 32925 -0239
Table 15 and Table 16 show regression results for adding gender as a predictor variable to the model for estimating PSSA scores based on SAT scores For both PSSA reading and math the regression weights for gender are negligible and the changes in R-square are essentially nonexistent Gender is coded such that the positive weight means that females tend to have higher reading and math scores than would be expected from gender differences in SAT verbal
Table 15 Regressions Results Showing the Adjusted Strength of Gender on Predicting 2001 PSSA 11th Grade Scale Scores Based on 2002 SAT Scores Standardized Coefficient
PSSA Component SAT Control Gender R2 Change in R2
due to Gender Reading 0704 0495 Reading 0706 +0081 0502 +0006 Math 0847 0717 Math 0851 +0025 0717 +0001
Table 16 Regressions Results Showing the Adjusted Strength of Gender on Predicting 2002 PSSA 11th Grade Scale Scores Based on 2003 SAT Scores Standardized Coefficient
PSSA Component SAT Control Gender R2 Change in R2
due to Gender Reading 0775 0601 Reading 0777 +0038 0602 +0001 Math 0865 0749 Math 0863 -0012 0749 0000
HumRRO 29 April 2004
Ethnic or Racial Differences
Table 17 presents performance means for the four major ethnic or racial groups3 (White Black HispanicLatino and Asian) for the PSSA only For these analyses the racialethnic categories reported with the PSSA data were used It should be noted that starting in 2003 the reported racialethnic categories were changed from those reported in 2001 and 2002 In 2003 the category of ldquoMixedrdquo was no longer included As a result those students previously selecting ldquoMixedrdquo were forced to select one of the other categories For the full population of PSSA takers the pattern of performance between these four groups is fairly consistent In mathematics Asians outscore all groups Whites outscore HispanicsLatinos and Blacks and HispanicsLatinos score between Blacks and Whites For Reading Asians and Whites score approximately the same and Blacks score almost one standard deviation lower than Whites However the score for HispanicsLatinos has shown a decrease over the three years of approximately 30 points This decrease has dropped the HispanicLatino group to below the mean Black group score The number of HispanicLatinos taking the PSSA has increased approximately 40 Blacks approximately 65 and Whites approximately 10 during that time as well
Table 17 EthnicRacial Differences for PSSA (Unmatched State Data) Hispanic Year Subject Measure White Black AsianLatino
2001
Mathematics
Reading
Mean SD
N Effect Size
Mean SD
N Effect Size
132481 21525 92185
131644 21066 91964
113596 17093 8274 0972
115158 20393 8117 0795
116757 18873 2954 0777
117025 21104 2924 0693
140820 24657 2489 -0360
132927 21707 2470 -0060
2002
Mathematics
Reading
Mean SD
N Effect Size
Mean SD
N Effect Size
133935 22098 97659
133917 20351 97428
114090 17626 10783 0993
114887 20070 10715 0942
116438 19041 3534 0848
116193 21155 3535 0854
143430 26757 2659 -0387
133711 22914 2655 0010
2003
Mathematics
Reading
Mean SD
N Effect Size
Mean SD
N
134059 20863
104064
134488 22411
104271
114619 16132 13669 1042
114796 21940 13871 0888
116389 17473 4106 0903
114052 22848 4158 0903
142013 23662 2865 -0357
134943 24743 2866 -0019
3 The racialethnic analyses were limited to these four groups because of the limited number of students in the other groups
HumRRO 30 April 2004
Table 18 and Table 19 present data for the matched sample of students taking both PSSA and SAT by ethnicity Scale scores for both assessments as well as studentsrsquo self-reported GPA are included in the tables In 2002 Asians (726) took the SAT tests at a much higher rate than any other group followed by Whites (608) Blacks (419) and HispanicsLatinos (364) The order remained the same in 2003 although all groups but Asians had a slightly lower percentage in 2002 than in 2003 This suggests that more Asians and Whites aspire to attend college than do Blacks or HispanicLatinos Scores on the PSSA SAT and GPA show the same order for the matched sample as for the total state sample for the PSSA Comparing the effect size for the PSSA versus the effect size for the SAT shows that the effect size for most groups in the Class of 2002 and components is approximately the same for the PSSA and the SAT The largest difference for Blacks is between the PSSA reading and the SAT verbal components (PSSA reading ndash 0883 and SAT verbal ndash 1011) Note also that the effect size for GPA is approximately half the effect size for the PSSA and SAT for Blacks and Hispanics However for Asians the GPA effect size is more similar to the effect size for math than it is for the SAT verbal or PSSA reading components
Table 18 EthnicRacial Differences for the Class of 2002 Matched Sample (2001 PSSA 11th
Grade and 2002 SAT) Performance Hispanic Subject Measure White Black AsianMeasure Latino
PSSA
Mathematics
Reading
Mean SD
N Effect Size
Mean SD
N Effect Size
140809 19272 56063
139658 17004 56017
120809 17759 3735 1079
123658 19180 3678 0883
128529 19483 1076 0634
129112 19199 1064 0582
146256 22812 1808 -0258
138040 19183 1807 0089
SAT
Mathematics
Verbal
Mean SD
N Effect Size
Mean SD
N Effect Size
51041 10409 56693
50476 9670
56693
40286 10268 3872 1040
40619 9836 3872 1011
44332 11082 1096 0624
44378 10964 1096 0590
54820 13077 1838 -0320 49547 13308 1838 0080
GPA
Mean SD
N Effect Size
3364 0621
49617
2940 0667 3337 0658
3126 0640 871
0377
3491 0615 1616 -0205
HumRRO 31 April 2004
Table 19 EthnicRacial Differences for the Class of 2003 for Matched Sample (2002 PSSA 11th
Grade and 2003 SAT) Performance HispanicSubject Measure White Black AsianMeasure Latino
Mean 142999 122766 129030 150221
Mathematics SD N
19659 59076
18097 4516
19834 1178
24869 1951
PSSA Effect Size Mean 142157
1071 125012
0707 129610
-0322 139776
Reading SD N
15746 59038
17622 4500
18763 1184
20264 1951
Effect Size 1026 0724 0131 Mean 51440 39999 43626 55739
Mathematics SD N
10295 59443
9997 4573
10967 1206
12831 1970
SAT Effect Size Mean 50834
1128 40568
0735 43851
-0370 50166
Verbal SD N
9539 59443
9913 4573
10745 1206
13163 1970
Effect Size 1055 0687 0058 Mean 3385 2933 3175 3538
GPA Mathematics SD N
0610 49511
0666 3799
0641 935
0595 1608
Effect Size 0708 0336 -0254
Table 20 through Table 23 show regression results for adding raceethnicity (White versus Black and White versus HispanicLatino) as a predictor variable to the model for estimating PSSA scores based on SAT scores For both PSSA reading and math the regression weights for raceethnicity are negligible and the changes in R-square are essentially nonexistent Raceethnicity is coded such that the negative weight means that Blacks or HispanicsLatinos tend to have lower reading and math scores than would be expected from ethnicity differences in SAT verbal
Table 20 Regressions Results Showing the Adjusted Strength of Being Black on Predicting 2001 PSSA 11th Grade Scale Scores Based on 2002 SAT Scores Standardized Coefficient
PSSA Component SAT
Control Black R2 Change in R2
due to being Black
Reading 0699 0489 Reading 0686 -0059 0493 +0003 Math 0843 0711 Math 0833 -043 0713 +0002
HumRRO 32 April 2004
Table 21 Regressions Results Showing the Adjusted Strength of Being Black on Predicting 2002 PSSA 11th Grade Scale Scores Based on 2003 SAT Scores Standardized Coefficient
PSSA Component SAT
Control Black R2 Change in R2
due to being Black
Reading 0769 0591 Reading 0750 -0068 0595 0004 Math 0863 0745 Math 0857 -0021 0746 0000
Table 22 Regressions Results Showing the Adjusted Strength of Being HispanicLatino on Predicting 2001 PSSA 11th Grade Scale Scores Based on 2002 SAT Scores Standardized Coefficient
PSSA Component SAT
Control HispanicLatino R2 Change in R2
due to being HispanicLatino
Reading 0687 0472 Reading 0685 -0026 0473 +0001 Math 0837 0700 Math 0836 -0014 0700 0000
Table 23 Regressions Results Showing the Adjusted Strength of Being HispanicLatino on Predicting 2002 PSSA 11th Grade Scale Scores Based on 2003 SAT Scores Standardized Coefficient
PSSA Component SAT
Control HispanicLatino R2 Change in R2
due to being HispanicLatino
Reading 0754 0568 Reading 0050 -0034 0569 +0001 Math 0857 0735 Math 0856 -0009 0735 0000
Economically Disadvantaged Differences
Table 24 presents performance means for those students identified as economically disadvantaged for the PSSA only This table provides information from the larger state population to use in comparison with the matched PSSA and SAT sample data The SAT-taking population can be expected to post higher means For the full population of PSSA takers the pattern of performance between males and females is consistent Noneconomically disadvantaged students outscore economically disadvantaged student to a large degree on all components and all years except 2001 when it was a medium degree The number of students identified more than doubled between 2001 and 2002 and increased an additional 40 in 2003
HumRRO 33 April 2004
Table 24 Differences for Economically Disadvantaged Students for PSSA (Unmatched State Data)
Year Subject Economically Disadvantaged
Mean Scale Score
Standard Deviation
Number of Cases
Effect Size d
2001 Mathematics
Reading
Yes No Yes No
118647 131377 118918 130564
18977 22014 21142 21570
8805 107332 8702
106864
0619
0545
2002 Mathematics
Reading
Yes No Yes No
116604 133857 116380 133704
18913 22497 20914 20617
17253 106297 17199 106035
0830
0834 Yes 118211 17997 24022Mathematics No 134575 21063 102919 08352003 Yes 116747 22817 24290Reading No 135050 22319 103137 0811
Table 25 Differences for Economically Disadvantaged Students for Matched Sample for the Class of 2002 (2001 PSSA 11th Grade and 2002 SAT)
Performance Economically Mean Standard Number Effect Measure Subject Disadvantaged Score Deviation of Cases Size
d
PSSA Mathematics
Reading
Yes No Yes No
130598 139668 131768 138535
18830 20044 18336 17829
2893 65296 2863 65176
0466
0374
SAT Mathematics
Verbal
Yes No Yes No
45185 50491 44694 49953
10399 10912 10131 10215
2926 66399 2926 66399
0498
0517
GPA Yes No
3195 3334
0661 0636
2561 57722 0214
HumRRO 34 April 2004
Table 26 Differences for Economically Disadvantaged Students for Matched Sample for the Class of 2003 (2002 PSSA 11th Grade and 2003 SAT) Performance
Measure Subject Economically Disadvantaged
Mean Score
Standard Deviation
Number of Cases
Effect Size d
PSSA Mathematics
Reading
Yes No Yes No
127741 142707 128169 141742
19474 20278 18498 16243
5822 65159 5812 65114
0753
0780
SAT Mathematics
Verbal
Yes No Yes No
42412 51341 42100 50748
10746 10616 10491 9845
5907 65604 5907 65604
0836
0850 Yes 3116 0680 4854GPA No 3369 0620 54404 0389
Table 27 Regressions Results Showing the Adjusted Strength of Being Economically Disadvantaged on Predicting 2001 PSSA 11th Grade Scale Scores Based on 2002 SAT Scores Standardized Coefficient
Change in R2
SAT Economically due to beingPSSA Component R2 Control Disadvantaged Economically
Disadvantaged Reading 0704 0495 Reading 0703 -0004 0495 0000 Math 0846 0715 Math 0845 -0009 0715 0000
Table 28 Regressions Results Showing the Adjusted Strength of Being Economically Disadvantaged on Predicting 2002 PSSA 11th Grade Scale Scores Based on 2003 SAT Scores Standardized Coefficient
SAT Change in R2
PSSA Component Control Economically Disadvantaged R2 due to being
Economically Disadvantaged
Reading 0775 0601 Reading 0765 -044 0602 0002 Math 0865 0749 Math 0864 -0005 0749 0000
Annual Family Income Differences
Camara and Schmidt (1999) point out that family income is related to performance on tests such as the SAT I They also point out that this finding is not unique to the SAT I or college admissions tests Terenzini Cabrera and Bernal (2001) also examined various differences in educational outcomes associated with varying levels of socioeconomic status (SES) This report
HumRRO 35 April 2004
examines differences associated with family income in this section The following section shows differences in student performance related to parental education level Terenzini Cabrera and Bernal (2001) and Camara and Schmidt (1999) point out differences between income wealth and SES
Because annual family income data comes from the SDQ of the SAT only matched student data can be presented showing relationships with family income Table 29 (Class of 2002) and Table 30 (Class of 2003) show student performance on the PSSA SAT and GPA versus four levels of family income As the table clearly shows student scores increase on all performance measures as income goes up However the effect size for GPA is about half of the effect size for either of the assessments The effect size for the PSSA is similar although slightly less than the effect size for the SAT for both components and both years
Table 29 Annual Family Income Differences for Matched Sample for the Class of 2002 (2001 PSSA 11th Grade and 2002 SAT)
Income Level Performance Subject MeasureMeasure $25000 to $40000 tolt $25000 gt $70000$40000 $70000
PSSA
Math
Reading
Mean SD
N Effect Size
Mean SD
N Effect Size
129900 19108 6658
131011 18466 6594
135381 18361 8709 -0293
136210 17165 8693 -0292
139702 18899 16365 -0516
138848 17110 16348 -0440
145045 20032 14902 -0774
142093 16921 14867 -0626
SAT
Math
Verbal
Mean SD
N Effect Size
Mean SD
N Effect Size
44665 10594 6822
44469 10177 6822
47766 10013 8856 -0301 47619 9546 8856 -0319
50272 10136 16549 -0541 49796 9485
16549 -0542
53816 10580 15122 -0864 52825 9815
15122 -0836
GPA
Mean SD
N Effect Size
3173 0656 6596
3262 0636 8607 -0138
3344 0631 16141 -0266
3412 0628
14726 -0372
HumRRO 36 April 2004
Table 30 Annual Family Income Differences for Matched Sample for the Class of 2003 (2002 PSSA 11th Grade and 2003 SAT)
Income Level Performance Subject MeasureMeasure $25000 - $40000 -lt $25000 gt $70000$40000 $70000
Mean 131577 136393 140924 147093
Math SD N
19401 6230
19051 7958
19319 14963
20560 14295
PSSA Effect Size Mean 132698
-0250 137311
-0483 140572
-0776 144569
Reading SD N
17576 6232
16201 7948
15919 14958
15965 14284
Effect Size -0273 -0470 -0707 Mean 44871 47689 50075 53965
Math SD N
10562 6304
10140 8010
10089 15045
10567 14388
SAT Effect Size Mean 44793
-0272 47581
-0504 49653
-0861 52905
Verbal SD N
10345 6304
9578 8010
9354 15045
9689 14388
Effect Size -0280 -0493 -0809 Mean 3188 3279 3357 3428
GPA SD N
0652 6115
0642 7832
0623 14659
0617 14000
Effect Size -0141 -0265 -0378
Parent Educational Differences
Camara and Schmidt (1999) also looked at the impact of parent education on student performance in standardized testing Their study showed that parental education is related to performance on the SAT I Higher parental education is associated with higher scores on the SAT I Table 31 and Table 32 show the means standard deviations number of students and effect size for various levels of student-reported motherrsquos education for the PSSA SAT and GPA The analyses indicate that the effect size for both assessments and GPA are larger as the motherrsquos educational level increases The effect size for PSSA is not as large as the effect size for SAT The effect size for GPA is about half of the effect size for PSSA or SAT Table 33 and Table 34 provide the same information regarding the fatherrsquos education level The results follow the same pattern as that for motherrsquos education level
HumRRO 37 April 2004
Table 31 Mothers Education Level Differences for Matched Sample for the Class of 2002 (2001 PSSA 11th Grade and 2002 SAT)
Subject Measure lt High School
High School
Some College
BABS Degree
Graduate Degree
Mean 128855 135908 138212 145789 148095
Math SD N
18785 2196
18542 18737
19161 16804
19982 12094
20688 6259
PSSA Effect Size Mean 129039
-378 135883
-0493 137803
-0873 143360
-0974 144735
Reading SD N
17886 2189
17134 18696
17441 16762
16733 12078
16981 6245
Effect Size -0377 -0495 -0883 -0985 Mean 43795 48049 49574 54133 55639
Math SD N
10476 2247
10021 18986
10429 17075
10547 12291
10924 6357
SAT Effect Size Mean 42614
-0415 47405
-0553 49277
-0983 53512
-1107 55072
Verbal SD N
99852247
929118986
963517075
9856 12291
10300 6357
Effect Size -0497 -0679 -1099 -1228 Mean 3142 3267 3289 3456 3504 SD 0653 0630 0640 0618 0601 GPA N 2145 18341 16424 11914 6150
Effect Size -0195 -0227 -0494 -0577
Table 32 Mothers Education Level Differences for Matched Sample for the Class of 2003 (2002 PSSA 11th Grade and 2003 SAT)
lt High High Some BABS GraduateSubject Measure School School College Degree Degree Mean 129723 137323 140038 148027 150140 SD 19513 18746 19865 20474 22494 Math N 2072 17801 16646 11406 5961
Effect Size -0397 -0524 -0915 -0970PSSA Mean 129022 137751 139799 145748 147071 SD 18092 16042 16241 15951 16272 Reading N 2066 17787 16638 11406 5954
Effect Size -0511 -0627 -0981 -1059 Mean 43631 48106 49738 54411 55641
Math SD N
10494 2095
10046 17922
10387 16756
10467 11496
11305 5992
SAT Effect Size Mean 42549
-0436 47592
-0585 49432
-1029 53618
-1101 55050
Verbal SD N
10124 2095
925417922
954716756
9795 11496
10522 5992
Effect Size -0520 -0700 -1111 -1211 Mean 3148 3285 3307 3475 3510
GPA SD N
0646 2003
0622 17344
0636 16134
0608 11088
0599 5797
Effect Size -0216 -0248 -0521 -0581
HumRRO 38 April 2004
Table 33 Fathers Education Level Differences for Matched Sample for the Class of 2002 (2001 PSSA 11th Grade and 2002 SAT)
Subject Measure lt High School
High School
Some College
BABS Degree
Graduate Degree
Mean 128908 135041 138368 144843 150072
Math SD N
18443 2850
18251 17616
18721 14573
19645 12461
20736 7835
PSSA Effect Size Mean 129571
-0334 135453
-0509 137985
-0836 142352
-1079 145994
Reading SD N
18191 2289
17066 17558
17291 14539
16798 12454
16661 7838
Effect Size -0333 -0474 -0730 -0942 Mean 43958 47510 49626 53651 56759
Math SD N
10229 2915
992617845
10116 14800
10368 12636
10727 7980
SAT Effect Size Mean 43245
-0352 47058
-0557 49210
-0941 52830
-122 56114
Verbal SD N
97782915
921217845
947514800
9571 12636
10128 7980
Effect Size -0401 -0620 -0991 -1293 Mean 3136 3247 3301 3432 3548 SD 0637 0634 0633 0618 0594 GPA N 2784 17269 14263 12198 7723
Effect Size -0175 -0260 -0472 -0669
Table 34 Fathers Education Level Differences for Matched Sample for the Class of 2003 (2002 PSSA 11th Grade and 2003 SAT)
lt High High Some BABS GraduateSubject Measure School School College Degree Degree Mean 131197 136533 140022 147183 152503 SD 19107 18733 19163 20247 22047 Math N 2766 16981 14422 11633 7272
Effect Size -0282 -0461 -0812 -1033PSSA Mean 130955 137222 140037 144765 148752 SD 17715 15901 15980 15990 16014 Reading N 2761 16968 14412 11629 7265
Effect Size -0372 -0538 -0818 -1054 Mean 44505 47569 49772 53911 57115
Math SD N
10230 2803
9938 17087
10023 14508
10352 11709
11009 7314
SAT Effect Size Mean 43701
-0304 47224
-0520 49499
-0914 52920
-1187 56296
Verbal SD N
9887 2803
919517087
931014508
9580 11709
10294 7314
Effect Size -0369 -0604 -0947 -1248 Mean 3139 3272 3316 3454 3558
GPA SD N
0639 2696
0624 16545
0632 14014
0606 11281
0582 7046
Effect Size -0211 -0279 -0506 -0686
HumRRO 39 April 2004
Limited English Proficiency Differences
Students identified as having limited English proficiency (LEP) would be expected to have more difficulty taking a test in English than those not identified As a result of these difficulties LEP students would be expected to have lower scores than non-LEP students Table 36 shows the mean standard deviation number of students and the effect size for the entire state on the PSSA in 2001 and 2002 As expected LEP students have lower scores than non-LEP students on both components and effect sizes are generally large However the math component effect size is only about half of the effect size for reading
Table 35 Limited English Proficiency Differences for 11th Grade PSSA (Unmatched State Data) Limited EffectMean Scale Standard NumberYear Subject English Size Score Deviation of CasesProficiency d
Yes 115312 18977 492Math No 130476 22047 115645 07372001 Yes 106216 15338 473Reading No 129784 21727 115093 1253 Yes 116560 20254 844Math No 131550 22812 122706 06952002 Yes 102618 16138 840Reading No 131483 21413 122394 1522
Table 36 and Table 37 show the mean standard deviation number of cases and effect size for the matched sample of students in the Classes of 2002 and 2003 The effect sizes are similar to those in the state sample for the PSSA and SATmdashvery larger in verbalreading and medium in math The effect size is slightly larger for PSSA than SAT in math but slightly smaller for PSSA than SAT in readingverbal However the GPA for LEP students is actually slightly higher than the GPA for non-LEP students
Table 36 Limited English Proficiency Differences for Matched Sample for the Class of 2002 (2001 PSSA 11th Grade and 2002 SAT)
LimitedPerformance Standard Number Effect Size Subject English Mean ScoreMeasure Deviation of Cases dProficiency Yes 125974 19661 134Math No 139310 20070 68055 0671PSSA Yes 113745 14649 132Reading No 138297 17876 67907 1502 Yes 42860 13045 136Math No 50282 10934 69189 0617SAT Yes 33353 9807 136Verbal No 49764 10241 69189 1637 Yes 3393 0617 111GPA No 3328 0637 60172 -0104
HumRRO 40 April 2004
Table 37 Limited English Proficiency Differences for Matched Sample for the Class of 2003 (2002 PSSA 11th Grade and 2003 SAT)
LimitedPerformance Mean Standard Number Effect Size Subject EnglishMeasure Score Deviation of Cases dProficiency Yes 126815 20257 289Mathematics No 141539 20607 70692 0721PSSA Yes 109386 15855 288Reading No 140757 16741 70638 1924 Yes 41564 12159 291Mathematics No 50641 10887 71220 0787SAT Yes 32526 8775 291Verbal No 50105 10126 71220 1855 Yes 3358 585 226GPA No 3348 629 59032 -0008
The regression analyses results (Table 38 and Table 39) show that there are negligible changes in R square for predicting PSSA from SAT scores when adding LEP to the equation for both reading and math for both classes
Table 38 Regressions Results Showing the Adjusted Strength of Being Limited English Proficient on Predicting 2001 PSSA 11th Grade Scale Scores Based on 2002 SAT Scores
Standardized Coefficient Change in R2
SAT Limited English due toPSSA Component R2 Control Proficiency Limited English
Proficiency Reading 0704 0495 Reading 0703 -0011 0495 0000
Math 0846 0715 Math 0845 -0004 0715 0000
Table 39 Regressions Results Showing the Adjusted Strength of Being Limited English Proficient on Predicting 2002 PSSA 11th Grade Scale Scores Based on 2003 SAT Scores
Standardized Coefficient Change in R2
PSSA Component SAT Control
Limited English Proficiency R2 due to
Limited English Proficiency
Reading 0775 0601 Reading 0771 -0033 0602 +0001
Math 0865 0749 Math 0865 0000 0749 0000
HumRRO 41 April 2004
School-Level Scores Means were calculated by school for all scale scores and grade indicators to analyze
school-level results School-level descriptive statistics are presented for the Classes of 2002 and 2003 for the PSSA (Table 40) SAT (Table 41) and GPA and course grades (Table 42) Only schools with at least 10 students with merged PSSA and SAT scores are included in the analyses School-level means showed an increase on both tests both test components GPA and course grades from the Class of 2002 to the Class of 2003 The change in scoring procedures from the 2001 PSSA to the 2002 PSSA (instituting a minimum score of 700 for the 2002 PSSA) is problematic However there were only 9 students in this college-bound sample in the Class of 2003 who scored a 700 on the 2002 PSSA reading component and no students who scored a 700 on the math component The change in course grades was extremely small
Table 40 PSSA School-Level Descriptive Statistics for the Classes of 2002 and 2003 Subject Measure Class of 2002 Class of 2003 Reading Mean 136973 139316
SD 7435 7088 N 586 586
Math Mean 136966 139333 SD 8335 8496
N 586 586 Limited to schools with at least 10 students with merged PSSA and SAT scores
Table 41 SAT School-Level Descriptive Statistics for the Classes of 2002 and 2003 Subject Measure Class of 2002 Class of 2003 Verbal Mean 48578 48907
SD 4207 4251 N 586 586
Math Mean 48847 49159 SD 4500 4601
N 586 586 Limited to schools with at least 10 students with merged PSSA and SAT scores
HumRRO 42 April 2004
Table 42 School-Level Descriptive Statistics GPA and Course Grades for the Classes of 2002 and 2003
Subject Measure Class of 2002 Class of 2003 GPA Mean 334 346
SD 019 019 N 586 586
English Mean SD
329 020
331 021
N 586 586 Math Mean 311 312
SD 021 022 N 586 586
Limited to schools with at least 10 students with merged PSSA and SAT scores
Average Within-Year School-Level Correlations
Table 43 and Table 44 present correlations among these school-level scores Table 45 presents correlations for the average across the two years4 As Hoffman (1998) pointed out there is a tendency for correlations among school scores to be higher than correlations among student-level scores (Class of 2002 - Table 8 Class of 2003 - Table 9 and average for the Classes of 2002 and 2003 - Table 10) This is the case except for those correlations involving GPA and course-grades (except for PSSA reading to math course grade and GPA to English course grade where school-level correlations are higher)
As Hoffman (1998) pointed out the lower school-level correlations for GPA suggests that grading scales are not equivalent across schools There is a tendency for different schools to grade differently As a result at the school level of analysis there is a weaker relationship between GPA and either PSSA or ACT scores When studentsrsquo scores are averaged at the school level observed differences are related not only to differing levels of student achievement but to the particular schoolrsquos grading practices However the school-level relationship between GPA and course grades remains strong for both PSSA and SAT
4 Average correlations were technically corrected with Fisherrsquos r to z transformations
HumRRO 43 April 2004
Table 43 School-Level PSSA SAT and Course Grade Correlations for the Class of 2002 PSSA SAT Course Grades
Variable Reading Math Verbal Math GPA (Total) English Math
ReadingPSSA
Math
1000
0861 1000
Verbal SAT
Math
0818 0883
0773 0935
1000
0941 1000
GPA
English Course
Grades Math
0413 0393
0411 0391
0423 0454
0371 0376
0359 0362
0416 0450
1000
0778 1000
0719 0542 1000 Limited to schools with at least 10 students with merged PSSA and SAT scores
Table 44 School-Level PSSA SAT and Course Grades Correlations for the Class of 2003 PSSA SAT Course Grades
Variable Reading Math Verbal Math GPA (Total) English Math
ReadingPSSA
Math
1000
0870 1000
Verbal SAT
Math
0905 0849
0868 0915
1000
0943 1000
GPA
English Course
Grades Math
0491 0443
0442 0394
0501 0489
0439 0425
0402 0394
0484 0486
1000
0780 1000
0784 0615 1000 Limited to schools with at least 10 students with merged PSSA and SAT scores
HumRRO 44 April 2004
Table 45 School-Level PSSA SAT and Course Grades Correlation Averages for the Class of 2002 and 2003
PSSA SAT Course Grades
Variable Reading Math Verbal Math GPA (Total) English Math
ReadingPSSA
Math
1000
0866 1000
Verbal SAT
Math
0868 0867
0826 0926
1000
0942 1000
GPA
English Course
Grades Math
0453 0418
0427 0393
0463 0472
0406 0401
0381 0378
0451 0468
1000
0779 1000
0753 0580 1000 Limited to schools with at least 10 students with merged PSSA and SAT scores
Table 46 shows that the mean school-level scores for both PSSA 11th grade reading and SAT verbal components of each assessment increased from the Class of 2002 to the Class of 2003 For the SAT the mean school-level change on the verbal component was +330 scale score points For the PSSA the mean school-level scale score change on the 11th grade reading component was +2343 scale score points Table 47 shows the fairly strong relationship between the differences in mean school-level scores on the SAT verbal component and the PSSA reading component for the Classes of 2002 and 2003 This relationship is graphically portrayed in Figure 17 Table 48 Table 49 and Figure 18 show the same information for the math components of the PSSA and SAT As would be expected the relationship between the math components is stronger than for the readingverbal components
Table 46 Difference in Mean School-Level SAT Verbal and PSSA Reading Scores From the Classes of 2002 and 2003
Difference in Mean School-Level Score From the Standard Number ofMeanClass of 2002 and Class of 2003 Deviation Schools SAT Verbal +330 1673 586
PSSA Reading +2343 4660 586 Limited to schools with at least 10 students with merged PSSA and SAT scores
Table 47 Correlation of Difference in School-Level Mean SAT Verbal Score and PSSA Reading Score Between the Classes of 2002 and 2003
Difference in Mean School-Level Score From the SAT PSSA Class of 2002 and Class of 2003 Verbal Reading
SAT Verbal 1
PSSA Reading 462 1
HumRRO 45 April 2004
-200 -100 0 100 200
Difference in School-Level PSSA Reading Mean Score between the Class of 2002 and Class of 2003
-100
-50
0
50
100
Diff
eren
ce in
Sch
ool-L
evel
SA
T V
erba
l Mea
n Sc
ore
betw
een
Cla
ss o
f 200
2 an
d C
lass
of 2
003
$
$$
$
$
$
$$
$
$$
$
$
$
$
$
$
$
$$
$
$
$
$
$
$
$
$
$
$
$
$
$
$$
$
$
$
$
$
$
$
$
$
$ $
$$
$
$
$
$
$
$
$
$$
$
$$
$ $
$$$ $$
$
$
$
$
$
$
$
$
$
$
$
$
$
$$
$
$
$
$$
$$
$$$
$
$$
$
$
$$
$$
$
$
$
$
$
$
$
$
$
$$$
$$$
$
$
$
$
$
$$
$$
$
$$
$
$
$
$
$
$
$
$
$
$
$
$
$
$
$
$
$
$ $
$$
$
$$$ $$
$
$$$
$$
$
$
$
$
$
$
$
$$
$$
$
$
$
$
$
$
$
$
$
$$
$$
$
$$
$
$
$$
$
$
$
$$
$
$$
$
$$
$
$
$
$
$
$
$
$
$
$
$$
$
$$
$$
$
$$$$
$$
$$
$
$$
$
$
$
$
$$
$
$
$
$$
$
$ $$$
$
$ $$
$
$
$
$$
$
$$
$
$
$
$ $$$
$$
$$
$
$ $
$
$
$$
$
$
$
$
$
$
$$
$
$
$ $
$
$
$
$
$$
$
$
$$
$
$
$
$ $$
$
$
$ $
$$
$
$
$
$
$
$
$
$
$
$
$$
$
$
$$ $
$
$
$
$$
$
$
$$ $
$
$
$
$
$
$
$
$
$
$
$
$
$ $
$
$$
$
$$
$
$
$
$
$
$$
$
$
$
$
$
$
$
$
$$
$
$$
$
$
$$$ $
$
$
$$
$$
$
$$
$
$
$ $$ $
$ $
$$
$
$
$$$$
$
$$$
$
$$
$
$
$
$ $
$
$
$
$
$ $$
$
$
$
$
$
$ $
$ $ $
$
$
$
$
$$
$
$
$
$
$
$
$
$ $
$
$$
$
$$ $
$
$
$
$
$
$
$
$ $
$$
$
$
$
$
$
$
$
$$
$
$$
$
$
$
$
$$
$
$
$
$$
$$
$
$
$ $$$
$
$
$
$
$
$
$$$$
$
$$
$
$
$$
$
$$
$
$
$
$$$
$
$$
$
$
$
$
$$
$$
$
$
$
$$
$
$$
$$
$$
$
$
$
$
$$
$
$
$
$$
$
$
$
$
$
$$
$
$
$
$
$$
$
$
$
$
$
$
$$
$$
Figure 17 Scatterplot of difference in school-level SAT verbal mean scores and school-level PSSA 11th grade reading mean scores between the Class of 2002 and Class of 2003
Table 48 Difference in Mean School-Level SAT Math and PSSA Math Scores From the Class of 2002 and Class of 2003
Difference in Mean School-Level Math Score From the Class of 2002 and Class of 2003 Mean Standard
Deviation Number of
Schools
SAT +313 1842 586
PSSA +2367 4687 586 Limited to schools with at least 10 students with merged PSSA and SAT scores
HumRRO 46 April 2004
Table 49 Correlation of Difference in School-Level Mean SAT Math Score and PSSA Math Score Between the Classes of 2002 and 2003
Difference in Mean School-Level Math Score From the Class of 2002 and Class of 2003 SAT PSSA
SAT 1
PSSA 644 1
-200 -100 0 100 200
Difference in School-Level PSSA Math Mean Scale Score between the Class of 2002 and Class of 2003
-100
-50
0
50
100
Diff
eren
ce i
n Sc
hool
-Lev
el S
AT
Mat
h M
ean
Scor
e
betw
e en
the
Clas
s of
200
2 an
d Cl
ass
of 2
003
$
$$ $
$
$$
$
$$
$
$
$$
$
$
$$ $$
$
$
$
$
$
$
$
$
$$$
$
$
$$$
$
$
$
$
$
$
$$
$
$
$
$
$
$
$
$
$$$ $
$
$$
$
$
$
$
$$ $$
$$
$
$
$
$
$
$
$
$$
$
$$
$
$$
$
$
$
$
$ $$$
$
$
$
$
$
$
$
$$
$
$
$
$$
$
$
$
$
$
$ $
$$
$
$
$
$$
$
$$
$
$
$
$
$
$
$
$
$
$$
$
$$
$$
$
$
$
$
$
$$
$
$
$$
$
$
$
$$
$
$
$
$
$
$
$
$
$
$
$
$
$
$
$
$
$$
$
$
$$ $
$
$
$
$
$$
$
$
$
$
$
$
$
$
$
$
$
$
$
$
$
$
$
$
$$
$
$
$
$
$
$
$
$
$
$
$$
$
$
$
$
$$$
$
$
$
$
$
$
$ $$
$
$
$
$
$$
$
$
$
$
$
$$$
$
$
$$$
$
$
$
$
$$
$
$
$$
$
$
$$$
$
$
$
$
$
$
$$$
$
$
$
$
$$
$
$
$
$
$
$
$
$ $
$
$
$
$
$
$
$
$
$
$
$
$
$
$
$
$
$
$
$
$
$
$$$$
$$
$$
$
$$$
$$
$
$$
$
$
$
$
$
$
$
$$
$
$$
$
$
$
$
$
$$
$
$
$
$
$
$$
$
$$
$
$
$$
$
$
$
$
$
$
$
$
$
$
$ $
$
$
$
$
$$
$
$$$ $
$
$
$
$
$
$ $
$$
$
$$
$
$
$$
$ $
$$
$
$
$
$
$
$
$
$
$
$
$
$$
$
$
$
$
$
$
$
$ $
$$
$
$
$
$
$$ $
$
$$
$
$$
$$
$
$
$
$
$
$
$
$
$
$
$$
$
$$
$
$
$$
$
$
$
$
$$
$$
$$$
$$
$
$
$
$$
$
$$
$
$$
$
$
$
$
$
$
$
$
$
$
$
$
$ $$
$
$
$
$
$$
$
$
$
$$
$
$
$
$
$$
$
$$$$
$
$
$
$$$ $
$
$$
$
$
$
$
$
$$
$
$
$$
$$
$ $ $
$
$
$
$
$$
$
$$
$$
$
$
$
$$
$
$
$
$$
$
$
$
$
$
$
$
$$
$
$
$$
$
$
$
Figure 18 Scatterplot of differences in school-level mean SAT math score and school-level mean PSSA math scores between the Classes of 2002 and 2003
Pooled Within-School Correlations
The above discussion alluded to school-level factors such as differences in grading practices which may be impacting observed correlations Figure 19 depicts an extreme version of such a situation Schools A B and C are clearly different in where their students lie with respect to PSSA or SAT scores but they are identical in terms of the grades their students
HumRRO 47 April 2004
receive Also within each school there is a relationship between grades and either PSSA scores or SAT scores However if a correlation were calculated using students from all schools without regard to school-level characteristics it would be zero
School A
School B PSSA or SAT Scores
School C
Grade Point Average (GPA)
Figure 19 Extreme hypothetical illustration of how mean differences among schools on PSSA or SAT scores that are not mirrored by differences in GPA can impact correlations (Ellipses represent students scores within each school)
Pooled within-school correlations are used to estimate relationships between measures calculated within schools and then averaged across all schools These pooled within-school correlations were calculated for each of the two years of data (Table 50 for the Class of 2002 and Table 51 for the Class of 2003) and then averaged across the two years (Table 52)5 The resulting average pooled within-school correlations are presented in Table 52
5 Again the technical r to z correction was used
HumRRO 48 April 2004
Table 50 Pooled Within-School Correlation for the Class of 2002 PSSA SAT Course Grades
Variable Reading Math Verbal Math GPA (Total) English Math
ReadingPSSA
Math
1000
0648 1000
Verbal SAT
Math
0693 0650
0569 0832
1000
0695 1000
GPA
English Course
Grades Math
0528 0573
0461 0412
0361 0542
0516 0559
0465 0402
0349 0541
1000
0703 1000
0668 0443 1000 Limited to schools with at least 10 students with merged PSSA and SAT scores
Table 51 Pooled Within-School Correlation for the Class of 2003 PSSA SAT Course Grades
Variable Reading Math Verbal Math GPA (Total) English Math
ReadingPSSA
Math
1000
0702 1000
Verbal SAT
Math
0757 0629
0666 0857
1000
0662 1000
GPA
English Course
Grades Math
0512 0564
0457 0405
0350 0541
0534 0679
0466 0414
0369 0548
1000
0698 1000
0667 0443 1000 Limited to schools with at least 10 students with merged PSSA and SAT scores
HumRRO 49 April 2004
Table 52 Pooled Within-School Correlation Averaged for Classes of 2002 and 2003 PSSA SAT Course Grades
Variable Reading Math Verbal Math GPA (Total) English Math
ReadingPSSA
Math
1000
0676 1000
Verbal SAT
Math
0727 0640
0620 0845
1000
0679 1000
GPA
English Course
Grades Math
0520 0569
0459 0409
0356 0542
0525 0569
0466 0408
0359 0546
1000
0701 1000
0668 0443 1000 Limited to schools with at least 10 students with merged PSSA and SAT scores
If differences between schoolsrsquo grading procedures are substantial and if within schools students with higher grades also have higher PSSA scores then the correlations in Table 52 will be higher than student correlations in Table 10 (student-level correlations averaged for the Classes of 2002 and 2003) The difference between the GPA correlations in Table 10 and Table 52 however are only marginally different (see Table 53) In nearly all cases the within-school correlations are higher However the range is relatively smallmdash0009 to 0039 for GPA 0176 to 0219 for English course grades and 0147 to 0237 for math course grades Thus grading differences among schools do appear to exist but the effect is small for studentsrsquo GPA but larger for both English and math course grades especially when compared to the matching assessment component (ie English course grade to PSSA reading and SAT verbal math course grade to PSSA math and SAT math)
HumRRO 50 April 2004
Table 53 Differences Between Student-Level Correlations and Pooled Within-School Correlations Averaged for the Classes of 2002 and 2003
GPA or Course Grade to Student-Level Pooled Within- Difference in Assessment Correlations School Correlations Correlations
GPA to PSSA Reading 0511 0520 0009
GPA to PSSA Math 0546 0569 0023
GPA to SAT Verbal 0494 0525 0031
GPA to SAT Math 0530 0569 0039
English to PSSA Reading 0240 0459 0219
English to PSSA Math 0226 0409 0183
English to SAT Verbal 0256 0466 0210
English to SAT Math 0232 0408 0176
Math to PSSA Reading 0202 0356 0154
Math to PSSA Math 0305 0542 0237
Math to SAT Verbal 0212 0359 0147
Math to SAT Math 0313 0546 0233
Comparison of the correlations in Table 52 to Table 10 can also be used to test a hypothesis about the relationship between PSSA and SAT performance It is suggested above that some schools might be working more successfully toward improving PSSA performance than others Again if these efforts are only tangentially affecting SAT scores then we might expect mean differences among schools on PSSA scores that are not mirrored by differences on SAT Within schools however we can still expect students who do better on PSSA to also have a tendency to do better on SAT Figure 20 provides an extreme illustration of this potential effect Comparing correlations between PSSA and SAT from Table 52 to Table 10 reveals no such trend (see Table 54) The differences are all small (-0020 to +0009) suggesting that there are no significant differences among schools in the average PSSA scores of their students that are not mirrored by differences in studentsrsquo SAT scores This conclusion is consistent with the earlier conclusion from the individual level data That is no strong methodological differences in skills requirements are evidenced
HumRRO 51 April 2004
SAT Scores
School A School B School C
PSSA Scale Scores
Figure 20 Extreme hypothetical illustration of how mean differences among schools on PSSA scores that are not mirrored by differences on SAT scores can impact correlations (Ellipses represent students scores within each school)
Table 54 Differences Between SAT and PSSA Components for Student-Level Correlations and Pooled Within-School Correlations Averaged for the Classes of 2002 and 2003
GPA or Course Grade to Student-Level Pooled Within- Difference in Assessment Correlations School Correlations Correlations
PSSA Reading to SAT Verbal 0742 0727 -0015
PSSA Reading to SAT Math 0690 0640 -0020
PSSA Math to SAT Verbal 0629 0620 +0009
PSSA Math to SAT Math 0856 0845 -0009
A third comparison can also be made with the pooled within-school correlations This concerns the intercorrelations within each assessment format The pooled within-school PSSA intercorrelation (Table 52) shows a very slight decrease from student-level PSSA correlations (Table 10) while the pooled within-school SAT intercorrelation (Table 52) shows a larger increase from the student-level SAT intercorrelations (Table 10) It is possible that this is due to an increased homogeneity for the pooled within-school results However Figure 21 presents an exaggerated illustration of another manner in which this difference might be obtained This pattern would yield higher correlations for all students than for students within a school and a higher correlation of school-level scores (school-level PSSA intercorrelation is 0866 school-level SAT intercorrelation is 0942 [both from Table 45]) than for student-level scores (student-level PSSA is 0686 student-level SAT intercorrelation is 0737 [both from Table 10]) Although small (see Table 55) this is the pattern of differences in correlations obtained for both PSSA intercorrelations and for SAT intercorrelations Note that the difference between the PSSA components is smaller than the difference between the SAT components The obtained pattern
HumRRO 52 April 2004
like that in Figure 21 but much less exaggerated could result from differences between schools in the population of their students from differences in instruction that impact PSSA and SAT test scores or both
Content
Area B School A
School B
School C
Content Area A
Figure 21 Exaggerated illustration of how mean differences among schools can increase overall correlations (Ellipses represent students scores within each school)
Table 55 Internal Differences between SAT and PSSA Components for Student-Level Correlations and Pooled Within-School Correlations Averaged for the Classes of 2002 and 2003
GPA or Course Grade to Student-Level Pooled With- Difference in Assessment Correlations School Correlations Correlations
PSSA Reading to PSSA Math 0686 0676 -0010
SAT Verbal to SAT Math 0737 0845 0108
Summary and Conclusion The purpose of this report is to explore the validity questions ldquoAre PSSA scores
appropriately related to other measures of educational achievementrdquo
The data presented in this report suggest the following main points
bull Students who do well on any of the assessments tend to do well on all of the assessmentsmdashPSSA SAT GPA or course grades
bull When schoolsrsquo means are calculated using only the SAT-taking population of students schools with high scores on SAT also have high PSSA scores GPA and course grades are also related to both PSSA and SAT although not as strongly as the relationship between the PSSA and SAT
HumRRO 53 April 2004
PSSA exhibits strong convergent validity coefficients Correlations are very high between PSSA and SAT PSSA is positively correlated with other measures of student achievement including course grades and GPA Gains on PSSA are reflective of changes on SAT at the school level All these data provide strong evidence in support of PSSA as a valid measure of student achievement
There are however a few clarifications and qualifications to these general conclusions but none that diminish the basic findings These clarifications and qualifications include the following
Changes in scores Both mean PSSA and SAT scores experienced an increase Changes between the two assessments are positively correlated Schools that have gained on one assessment tend to have also gained on the other assessment However the same relationship is also true for those schools that have decreased
PSSA and SAT are tied to different content domains use differently formatted items and were designed to serve very different purposes However it is clear from the data that students who tend to perform well on the PSSA can also be expected to perform well on the SAT and vice-versa It is clear from the data that schools that perform well on one test can be expected to perform well on the other It is also clear that schools that improve on one test can be expected to improve on the other
Discriminant validity At the student level and the school level the different assessments of mathematics achievement are more highly related to each other than to assessments of other subjects Students with high mathematics scores on one assessment will tend to do well on all other assessments but that tendency is most pronounced for other mathematics assessments The same holds for school scores There is a similar differentiation on readingverbal assessments at both the student and school level but not as pronounced as in mathematics
GPA shows positive relationships with both PSSA and SAT assessments at the student and school level but not as pronounced as the relationship between the two assessments This is interpreted as being due to differences in schoolsrsquo grading practices Grading practices apparently differ sufficiently to reduce school-level associations with PSSA and SAT scores
Neither gender race socioeconomic status nor limited English proficiency appear to influence the PSSA scores any more than would be expected based on observed differences for SAT scores In other words PSSA items are not injecting any unexpected gender racialethnic socioeconomic status or limited English proficiency bias
HumRRO 54 April 2004
References
Camara WJ amp Schmidt AE (1999) Group differences in standardized testing and social stratification (College Board Report No 99-5) New York College Entrance Examination Board
Campbell D T amp Fiske D W (1959) Convergent and discriminant validation by the multitrait-multimethod matrix Psychological Bulletin 56(2) 81-105
Cassady JC (2001) Self-reported GPA and SAT A Methodological Note Practical Assessment Research amp Evaluation 7(12)
Coe Robert (2002) Itrsquos the effect size stupid What effect size is and why itrsquos important Paper presented at the Annual Conference of the British Educational Research Association University of Exeter England Retrieved from httpwwwleedsacukeducoldocuments00002182htm
Cohen J (1988) Statistical power analysis for the behavioral sciences (2nd ed) Hillsdale NJ Erlbaum
Hoffman R G (1998) Relationships among Kentuckyrsquos open-response assessments ACT scores and studentsrsquo self-reported high school grades (HumRRO Report FR-WATSD-98-27) Radcliff KY Human Resources Research Organization
Lewis DM Mitzel HC amp Green DR (1996) Standard setting A bookmark approach Symposium presented at the Council of Chief State School Officers Conference on Large ndashScale Assessment Phoenix AZ
Livingston SA amp Zieky MJ (1978) Manual for setting standards on the Basic Skills Assessment Test Princeton NJ Educational Testing Service
Mead R amp Melby K (2003 February) Technical analysis Pennsylvania System of School Assessment 2003 reading and mathematics PSSA Data Recognition Corporation
Mead R amp Melby K (2002 April) Technical analysis Pennsylvania System of School Assessment 2001 reading and mathematics PSSA Data Recognition Corporation
Mead R Smith RM amp Swanlund A (2003) Technical analysis 2003 Pennsylvania System of School Assessment mathematics and reading Data Recognition Corporation
NCLB (2004) httpwwwedgovnclblandingjtml
Sicoly Fiore (2002) What do school-level scores from large-scale assessments really measure Educational Measurement Issues and Practice 21(4) 17-26
Terenzini PT Cabrera AF amp Bernal EM (2001) Swimming against the tide The poor in American higher education (Research Report No 2001-1) New York College Entrance Examination Board
Willingham WW amp Cole NS (1997) Gender and Fair Assessment Hillsdale NJ Erlbaum
HumRRO 55 April 2004
HumRROKDE April 2003

Outliers are hidden Extreme values are hidden
1 2 3 4
Student-Reported Average Grade for English on SAT Student Descriptive Questionnaire
600
800
1000
1200
1400
1600
1800
2000
2200
2400
2002
PSS
A 1
1th
Gra
de R
eadi
ng S
cale
Sco
re
n=6065 n=26317 n=23397 n=249 Average Grade 1 - Passing 2 - Fair 3 - Good 4 - Excellent
Advanced
Proficient
Basic
Below Basic
Figure 10 Student-level relationship between 2002 PSSA 11th grade reading scale score and student-reported English course grades on the SAT Student Descriptive Questionnaire (SDQ) for the Class of 2003
PSSA Math Scale Score Versus SAT Reported Average Grade in Math
Figure 11 and Figure 12 illustrate the relationship between the PSSA 11th grade math scale scores and the grades students reported in the optional Student Descriptive Questionnaire (SDQ) portion of the SAT which students are asked to complete as part of registering for the SAT The SDQ asked students to report their average grade in math The available responses to this question were 0 ndash Failing 1 ndash Passing 2 ndash Fair 3 ndash Good or 4 ndash Excellent The category ldquoNo responserdquo indicates that the student did not respond to the question In 2002 8523 students did not respond to the math average grade question In 2003 6316 students did not respond In 2002 41 students responded that their average math grade was ldquoFailingrdquo In 2003 47 students had this answer Students who did not respond and those who responded that their average grade was ldquoFailingrdquo were not included in the graphs
HumRRO 20 April 2004
2001
PSS
A 1
1th
Gra
deM
ath
Scal
e Sc
ore 2000
1800
1600
1400
1200
1000
800
600
Outliers are hidden Extreme values are hidden
n=19993
n=11254 n=25509
n=970
1 2 3 4
Student-Reported Average Grade for Math on SAT Student Descriptive Questionnaire
Advanced
Proficient
Basic
Below Basic
Average Grade 1 - Passing 2 - Fair 3 - Good 4 - Excellent
Figure 11 Student-level relationship between 2001 PSSA 11th grade math scale score and student-reported average math course grades in the Student Descriptive Questionnaire (SDQ) of the SAT for the Class of 2002
HumRRO 21 April 2004
Outliers are hidden Extreme values are hidden
1 2 3 4
Student-Reported Average Grade for Math on SAT Student Descriptive Questionnaire
600
800
1000
1200
1400
1600
1800
2000
2002
PSS
A 1
1th
Gra
de M
ath
Scal
e Sc
ore
n=10370 n=24674
n=19835
n=1003
Advanced
Proficient
Basic
Below Basic
Average Grade 1 - Passing 2 - Fair 3 - Good 4 - Excellent
Figure 12 Student-level relationship between 2002 PSSA 11th grade math scale score and student-reported average math course grade in the SAT Student Descriptive Questionnaire (SDQ) for the Class of 2003
PSSA Scale Scores Versus SAT Reported Grade-Point Average
Figure 13 through Figure 16 illustrate relationships between PSSA scale scores and overall grade-point averages (GPAs) The GPAs are from the SATrsquos SDQ Students were asked to provide their GPA on a basic 4-point scale with pluses and minuses around each point (A+ = 43 A = 40 A- = 37 etc) Approximately 87 (60283 of 69325) of students in the Class of 2002 completed the GPA question in the SDQ and 83 (59258 of 71511) of students in the Class of 2003 completed the question The mean student-reported GPA was 333 (SD = 064) for the Class of 2002 and 335 (SD = 063) for the Class of 2003 The correlation for the 2001 PSSA 11th grade reading component with the 2002 GPA was 0501 For the 2001 PSSA 11th grade math component the correlation was 0539 For the 2002 PSSA the correlations were 0520 in Reading and 0553 in Math The box-plots for PSSA scale scores to GPA for both years and both tests performed as expectedmdashlower scores for lower GPAs and higher scores for higher GPAs Note that the median and boxes align fairly well with the appropriate performance levelsmdashA students in the Advanced and Proficient level B students generally in the Proficient level C students in the low Proficient and Basic levels and D students in the Basic level Note also that the number of students decreases sharply when the student-reported GPA drops below 30
HumRRO 22 April 2004
Outliers are hidden Extreme values are hidden
Advanced
Proficient
Basic
Below Basic
10 13 17 20 23 27 30 33 37 40 43
Student-reported GPA (4-point scale) on the 2002 SAT Student Descriptive Questionnaire (SDQ)
800
1000
1200
1400
1600
1800
2000
2001
PSS
A 1
1th
Gra
de R
eadi
ng S
cale
Sco
re
n=10261
n=5370 n=11810
n=11101 n=9668
n=4624
n=2381 n=3352
n=520 n=40
n=96
Figure 13 Student-level relationship between 2001 PSSA 11th grade reading scale score and student-reported grade-point average (GPA) from the SATrsquos Student Descriptive Questionnaire (SDQ) for the Class of 2002
HumRRO 23 April 2004
Outliers are hidden Extreme values are hidden
10 13 17 20 23 27 30 33 37 40 43 Student-reported GPA (4-point scale) on the 2003 SAT Student Descriptive Questionnaire (SDQ)
800
1000
1200
1400
1600
1800
2000
2002
PSS
A 1
1th
Gra
de R
eadi
ng S
cale
Sco
re
n=3304
n=10358
n=5089
n=11480
n=11507
n=9773
n=4602
n=2084 n=97 n=496 n=27
Advanced
Proficient
Basic
Below Basic
Figure 14 Student-level relationship between 2002 PSSA 11th Grade reading scale score and student-reported grade-point average (GPA) from the SATrsquos Student Descriptive Questionnaire (SDQ) for the Class of 2003
HumRRO 24 April 2004
Outliers are hidden Extreme values are hidden
10 13 17 20 23 27 30 33 37 40 43 Student-reported GPA (4-point scale) on the 2002 SAT Student Descriptive Questionnaire (SDQ)
800
1000
1200
1400
1600
1800
2000
2001
PSS
A 1
1th
Gra
de M
ath
Scal
e Sc
ore
n=10280
n=5391 n=11831
n=11123 n=9672
n=4635
n=2393 n=3377
n=526 n=42
n=97
Advanced
Proficient
Basic
Below Basic
Figure 15 Student-level relationship between 2001 PSSA 11th grade math scale score and student-reported grade-point average (GPA) from the SATrsquos Student Descriptive Questionnaire (SDQ) for the Class of 2002
HumRRO 25 April 2004
Outliers are hidden Extreme values are hidden
10 13 17 20 23 27 30 33 37 40 43 Student-reported GPA (4-point scale) on the 2003 SAT Student Descriptive Questionnaire (SDQ)
800
1000
1200
1400
1600
1800
2000
2002
PSS
A 1
1th
Gra
de M
ath
Scal
e Sc
ore
n=3319
n=10364
n=5091
n=11480
n=11514
n=9777
n=4600
n=2085 n=98
n=496
n=27
Advanced
Proficient
Basic
Below Basic
Figure 16 Student-level relationship between 2001 PSSA 11th grade math scale score and student-reported grade-point average (GPA) from the SATrsquos Student Descriptive Questionnaire (SDQ) for the class of 2002
HumRRO 26 April 2004
Differences in Performance for Demographic Groupings
Analyses were conducted to compare performance on the PSSA and SAT among students from varying backgrounds Average test performance tends to differ for students of differing genders ethnic groups and various measures associated with socioeconomic status The important question for judging bias on the PSSA is not whether specific groups show mean differences but whether those differences are larger for the PSSA than the differences observed on other measures of student achievement
Differences between measures of achievement can be captured in several ways This report will present two measures of mean differences First effect size statistics will be calculated for the differences between major categories of students (Coe 2002) The magnitude of the effect size statistics is less important than the difference between the effect sizes for PSSA compared to the other measures However measuring the magnitude of the gaps for NCLB-defined groups is instructive and important since all states are expected to make progress toward closing those gaps (No Child Left Behind 2004)
Effect size statistics can be interpreted as the average percentile standing of the average treated (or experimental) participant relative to the average untreated (or control) participant An effect size of 00 indicates that the mean of the treated group is at the 50th percentile of the control group An effect size of 08 indicates that the mean of the treated group is at the 79th
percentile of the control group An effect size of 17 indicates that the mean of the treated group is at the 955th percentile of the control group Cohen (1988) hesitantly defined effect sizes as ldquosmall d=2rdquo ldquomedium d=5rdquo and ldquolarge d=8rdquo He went on to caution against offering conventional operational definitions such as these in the diverse field of behavioral science
The second measure used to capture differences between measures of achievement was regression analysis Regression analysis was used to examine the extent to which PSSA differences in performance for various demographic groupings are similar to those found in SAT scores For each of the demographic groupings we calculated a regression equation to predict PSSA scores based on the matching SAT content score A second equation was created which added the specific demographic characteristic of interest If PSSA scores exhibit greater differences based on that demographic characteristic that characteristic will have a significant weight and there will be a meaningful increase in the prediction of the PSSA component score
Gender Differences
Table 12 presents performance means for males and females for the PSSA only This table provides information from the larger state population to use in comparison with the matched PSSA and SAT sample data The SAT-taking population can be expected to post higher means For all gender tables data is coded such that positive numbers indicate higher mean scores for males negative numbers indicate higher mean scores for females For the full population of PSSA takers the pattern of performance between males and females is consistent Males outscore females but only to a very small degree on the PSSA mathematics test for all three included years Females outscored males to a higher but still small degree on the PSSA reading test The differences between years are small and inconsistent This table shows that the gap in performance for both PSSA mathematics and reading between males and females is small and has not changed dramatically between 2001 and 2003
HumRRO 27 April 2004
Table 12 Gender Differences for PSSA (Unmatched State Data) Mean Scale Standard Number of Effect Size Year Subject Gender Score Deviation Cases d
Mathematics Male 130954 22870 56380
2001 Reading Female
Male Female
130288 127107 132719
21170 22731 20167
55496 56091 55280
0030
-0261 Mathematics Male 132475 23813 60777
2002 Reading Female
Male Female
130679 129478 133443
21694 22536 20034
59849 60686 59636
0079
-0186 Mathematics Male 132555 22198 63542
2003 Reading Female
Male 130434 129308
20680 24674
61849 63840
0099
Female 133974 22003 62020 -0200
Table 13 and Table 14 present data for the matched sample of students taking both PSSA and SAT by gender Scale scores for both assessments as well as studentsrsquo self-reported GPA are included in the tables The numbers of males versus females in the state student population is similar typically with a few more males than females per grade However many more females take the SAT tests suggesting that more females than males aspire to attend college Males outscored females by a small margin on the PSSA and the SAT mathematics tests This finding is consistent with scoring patterns on SAT and ACT reported by Willingham and Cole (1997) They suggest that as a rule females tend to avoid taking mathematics and science classes In an apparent inconsistency females outscored males on PSSA reading but not on SAT verbal Scores for SAT verbal were nearly identical for males and females Willingham and Cole found gender differences favoring females in writing skills The PSSArsquos performance-task items add a writing component that was not present in the SAT for the Classes of 2002 and 2003 However SAT will include a student-written essay beginning in spring 2005 This study found that females tended to have higher self-reported GPAs than males
Table 13 Gender Differences for Class of 2002 Matched Sample (2001 PSSA and 2002 SAT) Performance Standard Number of Effect SizeSubject Gender MeanMeasure Deviation Cases d
Mathematics Male 141925 20536 29403
PSSA Reading Female
Male Female
137503 137162 139420
19408 18761 16921
36530 29345 36451
0221
-0126 Mathematics Male 52273 11076 29787
SAT Verbal Female
Male 48821 50081
10527 10333
37042 29787
0319
Female 49582 10126 37042 0049
GPA Male Female
3243 3404
656
609 25323 32857 -0255
HumRRO 28 April 2004
Table 14 Gender Differences for Class of 2003 Matched Sample (2001 PSSA and 2002 SAT) Performance Mean Standard Number Effect Size Subject GenderMeasure Score Deviation of Cases d
Mathematics Male 145023 21049 31338
PSSA Reading Female
Male Female
138650 140570 140715
19790 17318 16427
38459 31328 38418
0312
-0009 Mathematics Male 52596 11067 31557
SAT Verbal Female
Male 48997 50524
10490 10235
38745 31557
0327
Female 49623 10097 38745 0089 Male 3265 653 25387GPA Female 3415 600 32925 -0239
Table 15 and Table 16 show regression results for adding gender as a predictor variable to the model for estimating PSSA scores based on SAT scores For both PSSA reading and math the regression weights for gender are negligible and the changes in R-square are essentially nonexistent Gender is coded such that the positive weight means that females tend to have higher reading and math scores than would be expected from gender differences in SAT verbal
Table 15 Regressions Results Showing the Adjusted Strength of Gender on Predicting 2001 PSSA 11th Grade Scale Scores Based on 2002 SAT Scores Standardized Coefficient
PSSA Component SAT Control Gender R2 Change in R2
due to Gender Reading 0704 0495 Reading 0706 +0081 0502 +0006 Math 0847 0717 Math 0851 +0025 0717 +0001
Table 16 Regressions Results Showing the Adjusted Strength of Gender on Predicting 2002 PSSA 11th Grade Scale Scores Based on 2003 SAT Scores Standardized Coefficient
PSSA Component SAT Control Gender R2 Change in R2
due to Gender Reading 0775 0601 Reading 0777 +0038 0602 +0001 Math 0865 0749 Math 0863 -0012 0749 0000
HumRRO 29 April 2004
Ethnic or Racial Differences
Table 17 presents performance means for the four major ethnic or racial groups3 (White Black HispanicLatino and Asian) for the PSSA only For these analyses the racialethnic categories reported with the PSSA data were used It should be noted that starting in 2003 the reported racialethnic categories were changed from those reported in 2001 and 2002 In 2003 the category of ldquoMixedrdquo was no longer included As a result those students previously selecting ldquoMixedrdquo were forced to select one of the other categories For the full population of PSSA takers the pattern of performance between these four groups is fairly consistent In mathematics Asians outscore all groups Whites outscore HispanicsLatinos and Blacks and HispanicsLatinos score between Blacks and Whites For Reading Asians and Whites score approximately the same and Blacks score almost one standard deviation lower than Whites However the score for HispanicsLatinos has shown a decrease over the three years of approximately 30 points This decrease has dropped the HispanicLatino group to below the mean Black group score The number of HispanicLatinos taking the PSSA has increased approximately 40 Blacks approximately 65 and Whites approximately 10 during that time as well
Table 17 EthnicRacial Differences for PSSA (Unmatched State Data) Hispanic Year Subject Measure White Black AsianLatino
2001
Mathematics
Reading
Mean SD
N Effect Size
Mean SD
N Effect Size
132481 21525 92185
131644 21066 91964
113596 17093 8274 0972
115158 20393 8117 0795
116757 18873 2954 0777
117025 21104 2924 0693
140820 24657 2489 -0360
132927 21707 2470 -0060
2002
Mathematics
Reading
Mean SD
N Effect Size
Mean SD
N Effect Size
133935 22098 97659
133917 20351 97428
114090 17626 10783 0993
114887 20070 10715 0942
116438 19041 3534 0848
116193 21155 3535 0854
143430 26757 2659 -0387
133711 22914 2655 0010
2003
Mathematics
Reading
Mean SD
N Effect Size
Mean SD
N
134059 20863
104064
134488 22411
104271
114619 16132 13669 1042
114796 21940 13871 0888
116389 17473 4106 0903
114052 22848 4158 0903
142013 23662 2865 -0357
134943 24743 2866 -0019
3 The racialethnic analyses were limited to these four groups because of the limited number of students in the other groups
HumRRO 30 April 2004
Table 18 and Table 19 present data for the matched sample of students taking both PSSA and SAT by ethnicity Scale scores for both assessments as well as studentsrsquo self-reported GPA are included in the tables In 2002 Asians (726) took the SAT tests at a much higher rate than any other group followed by Whites (608) Blacks (419) and HispanicsLatinos (364) The order remained the same in 2003 although all groups but Asians had a slightly lower percentage in 2002 than in 2003 This suggests that more Asians and Whites aspire to attend college than do Blacks or HispanicLatinos Scores on the PSSA SAT and GPA show the same order for the matched sample as for the total state sample for the PSSA Comparing the effect size for the PSSA versus the effect size for the SAT shows that the effect size for most groups in the Class of 2002 and components is approximately the same for the PSSA and the SAT The largest difference for Blacks is between the PSSA reading and the SAT verbal components (PSSA reading ndash 0883 and SAT verbal ndash 1011) Note also that the effect size for GPA is approximately half the effect size for the PSSA and SAT for Blacks and Hispanics However for Asians the GPA effect size is more similar to the effect size for math than it is for the SAT verbal or PSSA reading components
Table 18 EthnicRacial Differences for the Class of 2002 Matched Sample (2001 PSSA 11th
Grade and 2002 SAT) Performance Hispanic Subject Measure White Black AsianMeasure Latino
PSSA
Mathematics
Reading
Mean SD
N Effect Size
Mean SD
N Effect Size
140809 19272 56063
139658 17004 56017
120809 17759 3735 1079
123658 19180 3678 0883
128529 19483 1076 0634
129112 19199 1064 0582
146256 22812 1808 -0258
138040 19183 1807 0089
SAT
Mathematics
Verbal
Mean SD
N Effect Size
Mean SD
N Effect Size
51041 10409 56693
50476 9670
56693
40286 10268 3872 1040
40619 9836 3872 1011
44332 11082 1096 0624
44378 10964 1096 0590
54820 13077 1838 -0320 49547 13308 1838 0080
GPA
Mean SD
N Effect Size
3364 0621
49617
2940 0667 3337 0658
3126 0640 871
0377
3491 0615 1616 -0205
HumRRO 31 April 2004
Table 19 EthnicRacial Differences for the Class of 2003 for Matched Sample (2002 PSSA 11th
Grade and 2003 SAT) Performance HispanicSubject Measure White Black AsianMeasure Latino
Mean 142999 122766 129030 150221
Mathematics SD N
19659 59076
18097 4516
19834 1178
24869 1951
PSSA Effect Size Mean 142157
1071 125012
0707 129610
-0322 139776
Reading SD N
15746 59038
17622 4500
18763 1184
20264 1951
Effect Size 1026 0724 0131 Mean 51440 39999 43626 55739
Mathematics SD N
10295 59443
9997 4573
10967 1206
12831 1970
SAT Effect Size Mean 50834
1128 40568
0735 43851
-0370 50166
Verbal SD N
9539 59443
9913 4573
10745 1206
13163 1970
Effect Size 1055 0687 0058 Mean 3385 2933 3175 3538
GPA Mathematics SD N
0610 49511
0666 3799
0641 935
0595 1608
Effect Size 0708 0336 -0254
Table 20 through Table 23 show regression results for adding raceethnicity (White versus Black and White versus HispanicLatino) as a predictor variable to the model for estimating PSSA scores based on SAT scores For both PSSA reading and math the regression weights for raceethnicity are negligible and the changes in R-square are essentially nonexistent Raceethnicity is coded such that the negative weight means that Blacks or HispanicsLatinos tend to have lower reading and math scores than would be expected from ethnicity differences in SAT verbal
Table 20 Regressions Results Showing the Adjusted Strength of Being Black on Predicting 2001 PSSA 11th Grade Scale Scores Based on 2002 SAT Scores Standardized Coefficient
PSSA Component SAT
Control Black R2 Change in R2
due to being Black
Reading 0699 0489 Reading 0686 -0059 0493 +0003 Math 0843 0711 Math 0833 -043 0713 +0002
HumRRO 32 April 2004
Table 21 Regressions Results Showing the Adjusted Strength of Being Black on Predicting 2002 PSSA 11th Grade Scale Scores Based on 2003 SAT Scores Standardized Coefficient
PSSA Component SAT
Control Black R2 Change in R2
due to being Black
Reading 0769 0591 Reading 0750 -0068 0595 0004 Math 0863 0745 Math 0857 -0021 0746 0000
Table 22 Regressions Results Showing the Adjusted Strength of Being HispanicLatino on Predicting 2001 PSSA 11th Grade Scale Scores Based on 2002 SAT Scores Standardized Coefficient
PSSA Component SAT
Control HispanicLatino R2 Change in R2
due to being HispanicLatino
Reading 0687 0472 Reading 0685 -0026 0473 +0001 Math 0837 0700 Math 0836 -0014 0700 0000
Table 23 Regressions Results Showing the Adjusted Strength of Being HispanicLatino on Predicting 2002 PSSA 11th Grade Scale Scores Based on 2003 SAT Scores Standardized Coefficient
PSSA Component SAT
Control HispanicLatino R2 Change in R2
due to being HispanicLatino
Reading 0754 0568 Reading 0050 -0034 0569 +0001 Math 0857 0735 Math 0856 -0009 0735 0000
Economically Disadvantaged Differences
Table 24 presents performance means for those students identified as economically disadvantaged for the PSSA only This table provides information from the larger state population to use in comparison with the matched PSSA and SAT sample data The SAT-taking population can be expected to post higher means For the full population of PSSA takers the pattern of performance between males and females is consistent Noneconomically disadvantaged students outscore economically disadvantaged student to a large degree on all components and all years except 2001 when it was a medium degree The number of students identified more than doubled between 2001 and 2002 and increased an additional 40 in 2003
HumRRO 33 April 2004
Table 24 Differences for Economically Disadvantaged Students for PSSA (Unmatched State Data)
Year Subject Economically Disadvantaged
Mean Scale Score
Standard Deviation
Number of Cases
Effect Size d
2001 Mathematics
Reading
Yes No Yes No
118647 131377 118918 130564
18977 22014 21142 21570
8805 107332 8702
106864
0619
0545
2002 Mathematics
Reading
Yes No Yes No
116604 133857 116380 133704
18913 22497 20914 20617
17253 106297 17199 106035
0830
0834 Yes 118211 17997 24022Mathematics No 134575 21063 102919 08352003 Yes 116747 22817 24290Reading No 135050 22319 103137 0811
Table 25 Differences for Economically Disadvantaged Students for Matched Sample for the Class of 2002 (2001 PSSA 11th Grade and 2002 SAT)
Performance Economically Mean Standard Number Effect Measure Subject Disadvantaged Score Deviation of Cases Size
d
PSSA Mathematics
Reading
Yes No Yes No
130598 139668 131768 138535
18830 20044 18336 17829
2893 65296 2863 65176
0466
0374
SAT Mathematics
Verbal
Yes No Yes No
45185 50491 44694 49953
10399 10912 10131 10215
2926 66399 2926 66399
0498
0517
GPA Yes No
3195 3334
0661 0636
2561 57722 0214
HumRRO 34 April 2004
Table 26 Differences for Economically Disadvantaged Students for Matched Sample for the Class of 2003 (2002 PSSA 11th Grade and 2003 SAT) Performance
Measure Subject Economically Disadvantaged
Mean Score
Standard Deviation
Number of Cases
Effect Size d
PSSA Mathematics
Reading
Yes No Yes No
127741 142707 128169 141742
19474 20278 18498 16243
5822 65159 5812 65114
0753
0780
SAT Mathematics
Verbal
Yes No Yes No
42412 51341 42100 50748
10746 10616 10491 9845
5907 65604 5907 65604
0836
0850 Yes 3116 0680 4854GPA No 3369 0620 54404 0389
Table 27 Regressions Results Showing the Adjusted Strength of Being Economically Disadvantaged on Predicting 2001 PSSA 11th Grade Scale Scores Based on 2002 SAT Scores Standardized Coefficient
Change in R2
SAT Economically due to beingPSSA Component R2 Control Disadvantaged Economically
Disadvantaged Reading 0704 0495 Reading 0703 -0004 0495 0000 Math 0846 0715 Math 0845 -0009 0715 0000
Table 28 Regressions Results Showing the Adjusted Strength of Being Economically Disadvantaged on Predicting 2002 PSSA 11th Grade Scale Scores Based on 2003 SAT Scores Standardized Coefficient
SAT Change in R2
PSSA Component Control Economically Disadvantaged R2 due to being
Economically Disadvantaged
Reading 0775 0601 Reading 0765 -044 0602 0002 Math 0865 0749 Math 0864 -0005 0749 0000
Annual Family Income Differences
Camara and Schmidt (1999) point out that family income is related to performance on tests such as the SAT I They also point out that this finding is not unique to the SAT I or college admissions tests Terenzini Cabrera and Bernal (2001) also examined various differences in educational outcomes associated with varying levels of socioeconomic status (SES) This report
HumRRO 35 April 2004
examines differences associated with family income in this section The following section shows differences in student performance related to parental education level Terenzini Cabrera and Bernal (2001) and Camara and Schmidt (1999) point out differences between income wealth and SES
Because annual family income data comes from the SDQ of the SAT only matched student data can be presented showing relationships with family income Table 29 (Class of 2002) and Table 30 (Class of 2003) show student performance on the PSSA SAT and GPA versus four levels of family income As the table clearly shows student scores increase on all performance measures as income goes up However the effect size for GPA is about half of the effect size for either of the assessments The effect size for the PSSA is similar although slightly less than the effect size for the SAT for both components and both years
Table 29 Annual Family Income Differences for Matched Sample for the Class of 2002 (2001 PSSA 11th Grade and 2002 SAT)
Income Level Performance Subject MeasureMeasure $25000 to $40000 tolt $25000 gt $70000$40000 $70000
PSSA
Math
Reading
Mean SD
N Effect Size
Mean SD
N Effect Size
129900 19108 6658
131011 18466 6594
135381 18361 8709 -0293
136210 17165 8693 -0292
139702 18899 16365 -0516
138848 17110 16348 -0440
145045 20032 14902 -0774
142093 16921 14867 -0626
SAT
Math
Verbal
Mean SD
N Effect Size
Mean SD
N Effect Size
44665 10594 6822
44469 10177 6822
47766 10013 8856 -0301 47619 9546 8856 -0319
50272 10136 16549 -0541 49796 9485
16549 -0542
53816 10580 15122 -0864 52825 9815
15122 -0836
GPA
Mean SD
N Effect Size
3173 0656 6596
3262 0636 8607 -0138
3344 0631 16141 -0266
3412 0628
14726 -0372
HumRRO 36 April 2004
Table 30 Annual Family Income Differences for Matched Sample for the Class of 2003 (2002 PSSA 11th Grade and 2003 SAT)
Income Level Performance Subject MeasureMeasure $25000 - $40000 -lt $25000 gt $70000$40000 $70000
Mean 131577 136393 140924 147093
Math SD N
19401 6230
19051 7958
19319 14963
20560 14295
PSSA Effect Size Mean 132698
-0250 137311
-0483 140572
-0776 144569
Reading SD N
17576 6232
16201 7948
15919 14958
15965 14284
Effect Size -0273 -0470 -0707 Mean 44871 47689 50075 53965
Math SD N
10562 6304
10140 8010
10089 15045
10567 14388
SAT Effect Size Mean 44793
-0272 47581
-0504 49653
-0861 52905
Verbal SD N
10345 6304
9578 8010
9354 15045
9689 14388
Effect Size -0280 -0493 -0809 Mean 3188 3279 3357 3428
GPA SD N
0652 6115
0642 7832
0623 14659
0617 14000
Effect Size -0141 -0265 -0378
Parent Educational Differences
Camara and Schmidt (1999) also looked at the impact of parent education on student performance in standardized testing Their study showed that parental education is related to performance on the SAT I Higher parental education is associated with higher scores on the SAT I Table 31 and Table 32 show the means standard deviations number of students and effect size for various levels of student-reported motherrsquos education for the PSSA SAT and GPA The analyses indicate that the effect size for both assessments and GPA are larger as the motherrsquos educational level increases The effect size for PSSA is not as large as the effect size for SAT The effect size for GPA is about half of the effect size for PSSA or SAT Table 33 and Table 34 provide the same information regarding the fatherrsquos education level The results follow the same pattern as that for motherrsquos education level
HumRRO 37 April 2004
Table 31 Mothers Education Level Differences for Matched Sample for the Class of 2002 (2001 PSSA 11th Grade and 2002 SAT)
Subject Measure lt High School
High School
Some College
BABS Degree
Graduate Degree
Mean 128855 135908 138212 145789 148095
Math SD N
18785 2196
18542 18737
19161 16804
19982 12094
20688 6259
PSSA Effect Size Mean 129039
-378 135883
-0493 137803
-0873 143360
-0974 144735
Reading SD N
17886 2189
17134 18696
17441 16762
16733 12078
16981 6245
Effect Size -0377 -0495 -0883 -0985 Mean 43795 48049 49574 54133 55639
Math SD N
10476 2247
10021 18986
10429 17075
10547 12291
10924 6357
SAT Effect Size Mean 42614
-0415 47405
-0553 49277
-0983 53512
-1107 55072
Verbal SD N
99852247
929118986
963517075
9856 12291
10300 6357
Effect Size -0497 -0679 -1099 -1228 Mean 3142 3267 3289 3456 3504 SD 0653 0630 0640 0618 0601 GPA N 2145 18341 16424 11914 6150
Effect Size -0195 -0227 -0494 -0577
Table 32 Mothers Education Level Differences for Matched Sample for the Class of 2003 (2002 PSSA 11th Grade and 2003 SAT)
lt High High Some BABS GraduateSubject Measure School School College Degree Degree Mean 129723 137323 140038 148027 150140 SD 19513 18746 19865 20474 22494 Math N 2072 17801 16646 11406 5961
Effect Size -0397 -0524 -0915 -0970PSSA Mean 129022 137751 139799 145748 147071 SD 18092 16042 16241 15951 16272 Reading N 2066 17787 16638 11406 5954
Effect Size -0511 -0627 -0981 -1059 Mean 43631 48106 49738 54411 55641
Math SD N
10494 2095
10046 17922
10387 16756
10467 11496
11305 5992
SAT Effect Size Mean 42549
-0436 47592
-0585 49432
-1029 53618
-1101 55050
Verbal SD N
10124 2095
925417922
954716756
9795 11496
10522 5992
Effect Size -0520 -0700 -1111 -1211 Mean 3148 3285 3307 3475 3510
GPA SD N
0646 2003
0622 17344
0636 16134
0608 11088
0599 5797
Effect Size -0216 -0248 -0521 -0581
HumRRO 38 April 2004
Table 33 Fathers Education Level Differences for Matched Sample for the Class of 2002 (2001 PSSA 11th Grade and 2002 SAT)
Subject Measure lt High School
High School
Some College
BABS Degree
Graduate Degree
Mean 128908 135041 138368 144843 150072
Math SD N
18443 2850
18251 17616
18721 14573
19645 12461
20736 7835
PSSA Effect Size Mean 129571
-0334 135453
-0509 137985
-0836 142352
-1079 145994
Reading SD N
18191 2289
17066 17558
17291 14539
16798 12454
16661 7838
Effect Size -0333 -0474 -0730 -0942 Mean 43958 47510 49626 53651 56759
Math SD N
10229 2915
992617845
10116 14800
10368 12636
10727 7980
SAT Effect Size Mean 43245
-0352 47058
-0557 49210
-0941 52830
-122 56114
Verbal SD N
97782915
921217845
947514800
9571 12636
10128 7980
Effect Size -0401 -0620 -0991 -1293 Mean 3136 3247 3301 3432 3548 SD 0637 0634 0633 0618 0594 GPA N 2784 17269 14263 12198 7723
Effect Size -0175 -0260 -0472 -0669
Table 34 Fathers Education Level Differences for Matched Sample for the Class of 2003 (2002 PSSA 11th Grade and 2003 SAT)
lt High High Some BABS GraduateSubject Measure School School College Degree Degree Mean 131197 136533 140022 147183 152503 SD 19107 18733 19163 20247 22047 Math N 2766 16981 14422 11633 7272
Effect Size -0282 -0461 -0812 -1033PSSA Mean 130955 137222 140037 144765 148752 SD 17715 15901 15980 15990 16014 Reading N 2761 16968 14412 11629 7265
Effect Size -0372 -0538 -0818 -1054 Mean 44505 47569 49772 53911 57115
Math SD N
10230 2803
9938 17087
10023 14508
10352 11709
11009 7314
SAT Effect Size Mean 43701
-0304 47224
-0520 49499
-0914 52920
-1187 56296
Verbal SD N
9887 2803
919517087
931014508
9580 11709
10294 7314
Effect Size -0369 -0604 -0947 -1248 Mean 3139 3272 3316 3454 3558
GPA SD N
0639 2696
0624 16545
0632 14014
0606 11281
0582 7046
Effect Size -0211 -0279 -0506 -0686
HumRRO 39 April 2004
Limited English Proficiency Differences
Students identified as having limited English proficiency (LEP) would be expected to have more difficulty taking a test in English than those not identified As a result of these difficulties LEP students would be expected to have lower scores than non-LEP students Table 36 shows the mean standard deviation number of students and the effect size for the entire state on the PSSA in 2001 and 2002 As expected LEP students have lower scores than non-LEP students on both components and effect sizes are generally large However the math component effect size is only about half of the effect size for reading
Table 35 Limited English Proficiency Differences for 11th Grade PSSA (Unmatched State Data) Limited EffectMean Scale Standard NumberYear Subject English Size Score Deviation of CasesProficiency d
Yes 115312 18977 492Math No 130476 22047 115645 07372001 Yes 106216 15338 473Reading No 129784 21727 115093 1253 Yes 116560 20254 844Math No 131550 22812 122706 06952002 Yes 102618 16138 840Reading No 131483 21413 122394 1522
Table 36 and Table 37 show the mean standard deviation number of cases and effect size for the matched sample of students in the Classes of 2002 and 2003 The effect sizes are similar to those in the state sample for the PSSA and SATmdashvery larger in verbalreading and medium in math The effect size is slightly larger for PSSA than SAT in math but slightly smaller for PSSA than SAT in readingverbal However the GPA for LEP students is actually slightly higher than the GPA for non-LEP students
Table 36 Limited English Proficiency Differences for Matched Sample for the Class of 2002 (2001 PSSA 11th Grade and 2002 SAT)
LimitedPerformance Standard Number Effect Size Subject English Mean ScoreMeasure Deviation of Cases dProficiency Yes 125974 19661 134Math No 139310 20070 68055 0671PSSA Yes 113745 14649 132Reading No 138297 17876 67907 1502 Yes 42860 13045 136Math No 50282 10934 69189 0617SAT Yes 33353 9807 136Verbal No 49764 10241 69189 1637 Yes 3393 0617 111GPA No 3328 0637 60172 -0104
HumRRO 40 April 2004
Table 37 Limited English Proficiency Differences for Matched Sample for the Class of 2003 (2002 PSSA 11th Grade and 2003 SAT)
LimitedPerformance Mean Standard Number Effect Size Subject EnglishMeasure Score Deviation of Cases dProficiency Yes 126815 20257 289Mathematics No 141539 20607 70692 0721PSSA Yes 109386 15855 288Reading No 140757 16741 70638 1924 Yes 41564 12159 291Mathematics No 50641 10887 71220 0787SAT Yes 32526 8775 291Verbal No 50105 10126 71220 1855 Yes 3358 585 226GPA No 3348 629 59032 -0008
The regression analyses results (Table 38 and Table 39) show that there are negligible changes in R square for predicting PSSA from SAT scores when adding LEP to the equation for both reading and math for both classes
Table 38 Regressions Results Showing the Adjusted Strength of Being Limited English Proficient on Predicting 2001 PSSA 11th Grade Scale Scores Based on 2002 SAT Scores
Standardized Coefficient Change in R2
SAT Limited English due toPSSA Component R2 Control Proficiency Limited English
Proficiency Reading 0704 0495 Reading 0703 -0011 0495 0000
Math 0846 0715 Math 0845 -0004 0715 0000
Table 39 Regressions Results Showing the Adjusted Strength of Being Limited English Proficient on Predicting 2002 PSSA 11th Grade Scale Scores Based on 2003 SAT Scores
Standardized Coefficient Change in R2
PSSA Component SAT Control
Limited English Proficiency R2 due to
Limited English Proficiency
Reading 0775 0601 Reading 0771 -0033 0602 +0001
Math 0865 0749 Math 0865 0000 0749 0000
HumRRO 41 April 2004
School-Level Scores Means were calculated by school for all scale scores and grade indicators to analyze
school-level results School-level descriptive statistics are presented for the Classes of 2002 and 2003 for the PSSA (Table 40) SAT (Table 41) and GPA and course grades (Table 42) Only schools with at least 10 students with merged PSSA and SAT scores are included in the analyses School-level means showed an increase on both tests both test components GPA and course grades from the Class of 2002 to the Class of 2003 The change in scoring procedures from the 2001 PSSA to the 2002 PSSA (instituting a minimum score of 700 for the 2002 PSSA) is problematic However there were only 9 students in this college-bound sample in the Class of 2003 who scored a 700 on the 2002 PSSA reading component and no students who scored a 700 on the math component The change in course grades was extremely small
Table 40 PSSA School-Level Descriptive Statistics for the Classes of 2002 and 2003 Subject Measure Class of 2002 Class of 2003 Reading Mean 136973 139316
SD 7435 7088 N 586 586
Math Mean 136966 139333 SD 8335 8496
N 586 586 Limited to schools with at least 10 students with merged PSSA and SAT scores
Table 41 SAT School-Level Descriptive Statistics for the Classes of 2002 and 2003 Subject Measure Class of 2002 Class of 2003 Verbal Mean 48578 48907
SD 4207 4251 N 586 586
Math Mean 48847 49159 SD 4500 4601
N 586 586 Limited to schools with at least 10 students with merged PSSA and SAT scores
HumRRO 42 April 2004
Table 42 School-Level Descriptive Statistics GPA and Course Grades for the Classes of 2002 and 2003
Subject Measure Class of 2002 Class of 2003 GPA Mean 334 346
SD 019 019 N 586 586
English Mean SD
329 020
331 021
N 586 586 Math Mean 311 312
SD 021 022 N 586 586
Limited to schools with at least 10 students with merged PSSA and SAT scores
Average Within-Year School-Level Correlations
Table 43 and Table 44 present correlations among these school-level scores Table 45 presents correlations for the average across the two years4 As Hoffman (1998) pointed out there is a tendency for correlations among school scores to be higher than correlations among student-level scores (Class of 2002 - Table 8 Class of 2003 - Table 9 and average for the Classes of 2002 and 2003 - Table 10) This is the case except for those correlations involving GPA and course-grades (except for PSSA reading to math course grade and GPA to English course grade where school-level correlations are higher)
As Hoffman (1998) pointed out the lower school-level correlations for GPA suggests that grading scales are not equivalent across schools There is a tendency for different schools to grade differently As a result at the school level of analysis there is a weaker relationship between GPA and either PSSA or ACT scores When studentsrsquo scores are averaged at the school level observed differences are related not only to differing levels of student achievement but to the particular schoolrsquos grading practices However the school-level relationship between GPA and course grades remains strong for both PSSA and SAT
4 Average correlations were technically corrected with Fisherrsquos r to z transformations
HumRRO 43 April 2004
Table 43 School-Level PSSA SAT and Course Grade Correlations for the Class of 2002 PSSA SAT Course Grades
Variable Reading Math Verbal Math GPA (Total) English Math
ReadingPSSA
Math
1000
0861 1000
Verbal SAT
Math
0818 0883
0773 0935
1000
0941 1000
GPA
English Course
Grades Math
0413 0393
0411 0391
0423 0454
0371 0376
0359 0362
0416 0450
1000
0778 1000
0719 0542 1000 Limited to schools with at least 10 students with merged PSSA and SAT scores
Table 44 School-Level PSSA SAT and Course Grades Correlations for the Class of 2003 PSSA SAT Course Grades
Variable Reading Math Verbal Math GPA (Total) English Math
ReadingPSSA
Math
1000
0870 1000
Verbal SAT
Math
0905 0849
0868 0915
1000
0943 1000
GPA
English Course
Grades Math
0491 0443
0442 0394
0501 0489
0439 0425
0402 0394
0484 0486
1000
0780 1000
0784 0615 1000 Limited to schools with at least 10 students with merged PSSA and SAT scores
HumRRO 44 April 2004
Table 45 School-Level PSSA SAT and Course Grades Correlation Averages for the Class of 2002 and 2003
PSSA SAT Course Grades
Variable Reading Math Verbal Math GPA (Total) English Math
ReadingPSSA
Math
1000
0866 1000
Verbal SAT
Math
0868 0867
0826 0926
1000
0942 1000
GPA
English Course
Grades Math
0453 0418
0427 0393
0463 0472
0406 0401
0381 0378
0451 0468
1000
0779 1000
0753 0580 1000 Limited to schools with at least 10 students with merged PSSA and SAT scores
Table 46 shows that the mean school-level scores for both PSSA 11th grade reading and SAT verbal components of each assessment increased from the Class of 2002 to the Class of 2003 For the SAT the mean school-level change on the verbal component was +330 scale score points For the PSSA the mean school-level scale score change on the 11th grade reading component was +2343 scale score points Table 47 shows the fairly strong relationship between the differences in mean school-level scores on the SAT verbal component and the PSSA reading component for the Classes of 2002 and 2003 This relationship is graphically portrayed in Figure 17 Table 48 Table 49 and Figure 18 show the same information for the math components of the PSSA and SAT As would be expected the relationship between the math components is stronger than for the readingverbal components
Table 46 Difference in Mean School-Level SAT Verbal and PSSA Reading Scores From the Classes of 2002 and 2003
Difference in Mean School-Level Score From the Standard Number ofMeanClass of 2002 and Class of 2003 Deviation Schools SAT Verbal +330 1673 586
PSSA Reading +2343 4660 586 Limited to schools with at least 10 students with merged PSSA and SAT scores
Table 47 Correlation of Difference in School-Level Mean SAT Verbal Score and PSSA Reading Score Between the Classes of 2002 and 2003
Difference in Mean School-Level Score From the SAT PSSA Class of 2002 and Class of 2003 Verbal Reading
SAT Verbal 1
PSSA Reading 462 1
HumRRO 45 April 2004
-200 -100 0 100 200
Difference in School-Level PSSA Reading Mean Score between the Class of 2002 and Class of 2003
-100
-50
0
50
100
Diff
eren
ce in
Sch
ool-L
evel
SA
T V
erba
l Mea
n Sc
ore
betw
een
Cla
ss o
f 200
2 an
d C
lass
of 2
003
$
$$
$
$
$
$$
$
$$
$
$
$
$
$
$
$
$$
$
$
$
$
$
$
$
$
$
$
$
$
$
$$
$
$
$
$
$
$
$
$
$
$ $
$$
$
$
$
$
$
$
$
$$
$
$$
$ $
$$$ $$
$
$
$
$
$
$
$
$
$
$
$
$
$
$$
$
$
$
$$
$$
$$$
$
$$
$
$
$$
$$
$
$
$
$
$
$
$
$
$
$$$
$$$
$
$
$
$
$
$$
$$
$
$$
$
$
$
$
$
$
$
$
$
$
$
$
$
$
$
$
$
$ $
$$
$
$$$ $$
$
$$$
$$
$
$
$
$
$
$
$
$$
$$
$
$
$
$
$
$
$
$
$
$$
$$
$
$$
$
$
$$
$
$
$
$$
$
$$
$
$$
$
$
$
$
$
$
$
$
$
$
$$
$
$$
$$
$
$$$$
$$
$$
$
$$
$
$
$
$
$$
$
$
$
$$
$
$ $$$
$
$ $$
$
$
$
$$
$
$$
$
$
$
$ $$$
$$
$$
$
$ $
$
$
$$
$
$
$
$
$
$
$$
$
$
$ $
$
$
$
$
$$
$
$
$$
$
$
$
$ $$
$
$
$ $
$$
$
$
$
$
$
$
$
$
$
$
$$
$
$
$$ $
$
$
$
$$
$
$
$$ $
$
$
$
$
$
$
$
$
$
$
$
$
$ $
$
$$
$
$$
$
$
$
$
$
$$
$
$
$
$
$
$
$
$
$$
$
$$
$
$
$$$ $
$
$
$$
$$
$
$$
$
$
$ $$ $
$ $
$$
$
$
$$$$
$
$$$
$
$$
$
$
$
$ $
$
$
$
$
$ $$
$
$
$
$
$
$ $
$ $ $
$
$
$
$
$$
$
$
$
$
$
$
$
$ $
$
$$
$
$$ $
$
$
$
$
$
$
$
$ $
$$
$
$
$
$
$
$
$
$$
$
$$
$
$
$
$
$$
$
$
$
$$
$$
$
$
$ $$$
$
$
$
$
$
$
$$$$
$
$$
$
$
$$
$
$$
$
$
$
$$$
$
$$
$
$
$
$
$$
$$
$
$
$
$$
$
$$
$$
$$
$
$
$
$
$$
$
$
$
$$
$
$
$
$
$
$$
$
$
$
$
$$
$
$
$
$
$
$
$$
$$
Figure 17 Scatterplot of difference in school-level SAT verbal mean scores and school-level PSSA 11th grade reading mean scores between the Class of 2002 and Class of 2003
Table 48 Difference in Mean School-Level SAT Math and PSSA Math Scores From the Class of 2002 and Class of 2003
Difference in Mean School-Level Math Score From the Class of 2002 and Class of 2003 Mean Standard
Deviation Number of
Schools
SAT +313 1842 586
PSSA +2367 4687 586 Limited to schools with at least 10 students with merged PSSA and SAT scores
HumRRO 46 April 2004
Table 49 Correlation of Difference in School-Level Mean SAT Math Score and PSSA Math Score Between the Classes of 2002 and 2003
Difference in Mean School-Level Math Score From the Class of 2002 and Class of 2003 SAT PSSA
SAT 1
PSSA 644 1
-200 -100 0 100 200
Difference in School-Level PSSA Math Mean Scale Score between the Class of 2002 and Class of 2003
-100
-50
0
50
100
Diff
eren
ce i
n Sc
hool
-Lev
el S
AT
Mat
h M
ean
Scor
e
betw
e en
the
Clas
s of
200
2 an
d Cl
ass
of 2
003
$
$$ $
$
$$
$
$$
$
$
$$
$
$
$$ $$
$
$
$
$
$
$
$
$
$$$
$
$
$$$
$
$
$
$
$
$
$$
$
$
$
$
$
$
$
$
$$$ $
$
$$
$
$
$
$
$$ $$
$$
$
$
$
$
$
$
$
$$
$
$$
$
$$
$
$
$
$
$ $$$
$
$
$
$
$
$
$
$$
$
$
$
$$
$
$
$
$
$
$ $
$$
$
$
$
$$
$
$$
$
$
$
$
$
$
$
$
$
$$
$
$$
$$
$
$
$
$
$
$$
$
$
$$
$
$
$
$$
$
$
$
$
$
$
$
$
$
$
$
$
$
$
$
$
$$
$
$
$$ $
$
$
$
$
$$
$
$
$
$
$
$
$
$
$
$
$
$
$
$
$
$
$
$
$$
$
$
$
$
$
$
$
$
$
$
$$
$
$
$
$
$$$
$
$
$
$
$
$
$ $$
$
$
$
$
$$
$
$
$
$
$
$$$
$
$
$$$
$
$
$
$
$$
$
$
$$
$
$
$$$
$
$
$
$
$
$
$$$
$
$
$
$
$$
$
$
$
$
$
$
$
$ $
$
$
$
$
$
$
$
$
$
$
$
$
$
$
$
$
$
$
$
$
$
$$$$
$$
$$
$
$$$
$$
$
$$
$
$
$
$
$
$
$
$$
$
$$
$
$
$
$
$
$$
$
$
$
$
$
$$
$
$$
$
$
$$
$
$
$
$
$
$
$
$
$
$
$ $
$
$
$
$
$$
$
$$$ $
$
$
$
$
$
$ $
$$
$
$$
$
$
$$
$ $
$$
$
$
$
$
$
$
$
$
$
$
$
$$
$
$
$
$
$
$
$
$ $
$$
$
$
$
$
$$ $
$
$$
$
$$
$$
$
$
$
$
$
$
$
$
$
$
$$
$
$$
$
$
$$
$
$
$
$
$$
$$
$$$
$$
$
$
$
$$
$
$$
$
$$
$
$
$
$
$
$
$
$
$
$
$
$
$ $$
$
$
$
$
$$
$
$
$
$$
$
$
$
$
$$
$
$$$$
$
$
$
$$$ $
$
$$
$
$
$
$
$
$$
$
$
$$
$$
$ $ $
$
$
$
$
$$
$
$$
$$
$
$
$
$$
$
$
$
$$
$
$
$
$
$
$
$
$$
$
$
$$
$
$
$
Figure 18 Scatterplot of differences in school-level mean SAT math score and school-level mean PSSA math scores between the Classes of 2002 and 2003
Pooled Within-School Correlations
The above discussion alluded to school-level factors such as differences in grading practices which may be impacting observed correlations Figure 19 depicts an extreme version of such a situation Schools A B and C are clearly different in where their students lie with respect to PSSA or SAT scores but they are identical in terms of the grades their students
HumRRO 47 April 2004
receive Also within each school there is a relationship between grades and either PSSA scores or SAT scores However if a correlation were calculated using students from all schools without regard to school-level characteristics it would be zero
School A
School B PSSA or SAT Scores
School C
Grade Point Average (GPA)
Figure 19 Extreme hypothetical illustration of how mean differences among schools on PSSA or SAT scores that are not mirrored by differences in GPA can impact correlations (Ellipses represent students scores within each school)
Pooled within-school correlations are used to estimate relationships between measures calculated within schools and then averaged across all schools These pooled within-school correlations were calculated for each of the two years of data (Table 50 for the Class of 2002 and Table 51 for the Class of 2003) and then averaged across the two years (Table 52)5 The resulting average pooled within-school correlations are presented in Table 52
5 Again the technical r to z correction was used
HumRRO 48 April 2004
Table 50 Pooled Within-School Correlation for the Class of 2002 PSSA SAT Course Grades
Variable Reading Math Verbal Math GPA (Total) English Math
ReadingPSSA
Math
1000
0648 1000
Verbal SAT
Math
0693 0650
0569 0832
1000
0695 1000
GPA
English Course
Grades Math
0528 0573
0461 0412
0361 0542
0516 0559
0465 0402
0349 0541
1000
0703 1000
0668 0443 1000 Limited to schools with at least 10 students with merged PSSA and SAT scores
Table 51 Pooled Within-School Correlation for the Class of 2003 PSSA SAT Course Grades
Variable Reading Math Verbal Math GPA (Total) English Math
ReadingPSSA
Math
1000
0702 1000
Verbal SAT
Math
0757 0629
0666 0857
1000
0662 1000
GPA
English Course
Grades Math
0512 0564
0457 0405
0350 0541
0534 0679
0466 0414
0369 0548
1000
0698 1000
0667 0443 1000 Limited to schools with at least 10 students with merged PSSA and SAT scores
HumRRO 49 April 2004
Table 52 Pooled Within-School Correlation Averaged for Classes of 2002 and 2003 PSSA SAT Course Grades
Variable Reading Math Verbal Math GPA (Total) English Math
ReadingPSSA
Math
1000
0676 1000
Verbal SAT
Math
0727 0640
0620 0845
1000
0679 1000
GPA
English Course
Grades Math
0520 0569
0459 0409
0356 0542
0525 0569
0466 0408
0359 0546
1000
0701 1000
0668 0443 1000 Limited to schools with at least 10 students with merged PSSA and SAT scores
If differences between schoolsrsquo grading procedures are substantial and if within schools students with higher grades also have higher PSSA scores then the correlations in Table 52 will be higher than student correlations in Table 10 (student-level correlations averaged for the Classes of 2002 and 2003) The difference between the GPA correlations in Table 10 and Table 52 however are only marginally different (see Table 53) In nearly all cases the within-school correlations are higher However the range is relatively smallmdash0009 to 0039 for GPA 0176 to 0219 for English course grades and 0147 to 0237 for math course grades Thus grading differences among schools do appear to exist but the effect is small for studentsrsquo GPA but larger for both English and math course grades especially when compared to the matching assessment component (ie English course grade to PSSA reading and SAT verbal math course grade to PSSA math and SAT math)
HumRRO 50 April 2004
Table 53 Differences Between Student-Level Correlations and Pooled Within-School Correlations Averaged for the Classes of 2002 and 2003
GPA or Course Grade to Student-Level Pooled Within- Difference in Assessment Correlations School Correlations Correlations
GPA to PSSA Reading 0511 0520 0009
GPA to PSSA Math 0546 0569 0023
GPA to SAT Verbal 0494 0525 0031
GPA to SAT Math 0530 0569 0039
English to PSSA Reading 0240 0459 0219
English to PSSA Math 0226 0409 0183
English to SAT Verbal 0256 0466 0210
English to SAT Math 0232 0408 0176
Math to PSSA Reading 0202 0356 0154
Math to PSSA Math 0305 0542 0237
Math to SAT Verbal 0212 0359 0147
Math to SAT Math 0313 0546 0233
Comparison of the correlations in Table 52 to Table 10 can also be used to test a hypothesis about the relationship between PSSA and SAT performance It is suggested above that some schools might be working more successfully toward improving PSSA performance than others Again if these efforts are only tangentially affecting SAT scores then we might expect mean differences among schools on PSSA scores that are not mirrored by differences on SAT Within schools however we can still expect students who do better on PSSA to also have a tendency to do better on SAT Figure 20 provides an extreme illustration of this potential effect Comparing correlations between PSSA and SAT from Table 52 to Table 10 reveals no such trend (see Table 54) The differences are all small (-0020 to +0009) suggesting that there are no significant differences among schools in the average PSSA scores of their students that are not mirrored by differences in studentsrsquo SAT scores This conclusion is consistent with the earlier conclusion from the individual level data That is no strong methodological differences in skills requirements are evidenced
HumRRO 51 April 2004
SAT Scores
School A School B School C
PSSA Scale Scores
Figure 20 Extreme hypothetical illustration of how mean differences among schools on PSSA scores that are not mirrored by differences on SAT scores can impact correlations (Ellipses represent students scores within each school)
Table 54 Differences Between SAT and PSSA Components for Student-Level Correlations and Pooled Within-School Correlations Averaged for the Classes of 2002 and 2003
GPA or Course Grade to Student-Level Pooled Within- Difference in Assessment Correlations School Correlations Correlations
PSSA Reading to SAT Verbal 0742 0727 -0015
PSSA Reading to SAT Math 0690 0640 -0020
PSSA Math to SAT Verbal 0629 0620 +0009
PSSA Math to SAT Math 0856 0845 -0009
A third comparison can also be made with the pooled within-school correlations This concerns the intercorrelations within each assessment format The pooled within-school PSSA intercorrelation (Table 52) shows a very slight decrease from student-level PSSA correlations (Table 10) while the pooled within-school SAT intercorrelation (Table 52) shows a larger increase from the student-level SAT intercorrelations (Table 10) It is possible that this is due to an increased homogeneity for the pooled within-school results However Figure 21 presents an exaggerated illustration of another manner in which this difference might be obtained This pattern would yield higher correlations for all students than for students within a school and a higher correlation of school-level scores (school-level PSSA intercorrelation is 0866 school-level SAT intercorrelation is 0942 [both from Table 45]) than for student-level scores (student-level PSSA is 0686 student-level SAT intercorrelation is 0737 [both from Table 10]) Although small (see Table 55) this is the pattern of differences in correlations obtained for both PSSA intercorrelations and for SAT intercorrelations Note that the difference between the PSSA components is smaller than the difference between the SAT components The obtained pattern
HumRRO 52 April 2004
like that in Figure 21 but much less exaggerated could result from differences between schools in the population of their students from differences in instruction that impact PSSA and SAT test scores or both
Content
Area B School A
School B
School C
Content Area A
Figure 21 Exaggerated illustration of how mean differences among schools can increase overall correlations (Ellipses represent students scores within each school)
Table 55 Internal Differences between SAT and PSSA Components for Student-Level Correlations and Pooled Within-School Correlations Averaged for the Classes of 2002 and 2003
GPA or Course Grade to Student-Level Pooled With- Difference in Assessment Correlations School Correlations Correlations
PSSA Reading to PSSA Math 0686 0676 -0010
SAT Verbal to SAT Math 0737 0845 0108
Summary and Conclusion The purpose of this report is to explore the validity questions ldquoAre PSSA scores
appropriately related to other measures of educational achievementrdquo
The data presented in this report suggest the following main points
bull Students who do well on any of the assessments tend to do well on all of the assessmentsmdashPSSA SAT GPA or course grades
bull When schoolsrsquo means are calculated using only the SAT-taking population of students schools with high scores on SAT also have high PSSA scores GPA and course grades are also related to both PSSA and SAT although not as strongly as the relationship between the PSSA and SAT
HumRRO 53 April 2004
PSSA exhibits strong convergent validity coefficients Correlations are very high between PSSA and SAT PSSA is positively correlated with other measures of student achievement including course grades and GPA Gains on PSSA are reflective of changes on SAT at the school level All these data provide strong evidence in support of PSSA as a valid measure of student achievement
There are however a few clarifications and qualifications to these general conclusions but none that diminish the basic findings These clarifications and qualifications include the following
Changes in scores Both mean PSSA and SAT scores experienced an increase Changes between the two assessments are positively correlated Schools that have gained on one assessment tend to have also gained on the other assessment However the same relationship is also true for those schools that have decreased
PSSA and SAT are tied to different content domains use differently formatted items and were designed to serve very different purposes However it is clear from the data that students who tend to perform well on the PSSA can also be expected to perform well on the SAT and vice-versa It is clear from the data that schools that perform well on one test can be expected to perform well on the other It is also clear that schools that improve on one test can be expected to improve on the other
Discriminant validity At the student level and the school level the different assessments of mathematics achievement are more highly related to each other than to assessments of other subjects Students with high mathematics scores on one assessment will tend to do well on all other assessments but that tendency is most pronounced for other mathematics assessments The same holds for school scores There is a similar differentiation on readingverbal assessments at both the student and school level but not as pronounced as in mathematics
GPA shows positive relationships with both PSSA and SAT assessments at the student and school level but not as pronounced as the relationship between the two assessments This is interpreted as being due to differences in schoolsrsquo grading practices Grading practices apparently differ sufficiently to reduce school-level associations with PSSA and SAT scores
Neither gender race socioeconomic status nor limited English proficiency appear to influence the PSSA scores any more than would be expected based on observed differences for SAT scores In other words PSSA items are not injecting any unexpected gender racialethnic socioeconomic status or limited English proficiency bias
HumRRO 54 April 2004
References
Camara WJ amp Schmidt AE (1999) Group differences in standardized testing and social stratification (College Board Report No 99-5) New York College Entrance Examination Board
Campbell D T amp Fiske D W (1959) Convergent and discriminant validation by the multitrait-multimethod matrix Psychological Bulletin 56(2) 81-105
Cassady JC (2001) Self-reported GPA and SAT A Methodological Note Practical Assessment Research amp Evaluation 7(12)
Coe Robert (2002) Itrsquos the effect size stupid What effect size is and why itrsquos important Paper presented at the Annual Conference of the British Educational Research Association University of Exeter England Retrieved from httpwwwleedsacukeducoldocuments00002182htm
Cohen J (1988) Statistical power analysis for the behavioral sciences (2nd ed) Hillsdale NJ Erlbaum
Hoffman R G (1998) Relationships among Kentuckyrsquos open-response assessments ACT scores and studentsrsquo self-reported high school grades (HumRRO Report FR-WATSD-98-27) Radcliff KY Human Resources Research Organization
Lewis DM Mitzel HC amp Green DR (1996) Standard setting A bookmark approach Symposium presented at the Council of Chief State School Officers Conference on Large ndashScale Assessment Phoenix AZ
Livingston SA amp Zieky MJ (1978) Manual for setting standards on the Basic Skills Assessment Test Princeton NJ Educational Testing Service
Mead R amp Melby K (2003 February) Technical analysis Pennsylvania System of School Assessment 2003 reading and mathematics PSSA Data Recognition Corporation
Mead R amp Melby K (2002 April) Technical analysis Pennsylvania System of School Assessment 2001 reading and mathematics PSSA Data Recognition Corporation
Mead R Smith RM amp Swanlund A (2003) Technical analysis 2003 Pennsylvania System of School Assessment mathematics and reading Data Recognition Corporation
NCLB (2004) httpwwwedgovnclblandingjtml
Sicoly Fiore (2002) What do school-level scores from large-scale assessments really measure Educational Measurement Issues and Practice 21(4) 17-26
Terenzini PT Cabrera AF amp Bernal EM (2001) Swimming against the tide The poor in American higher education (Research Report No 2001-1) New York College Entrance Examination Board
Willingham WW amp Cole NS (1997) Gender and Fair Assessment Hillsdale NJ Erlbaum
HumRRO 55 April 2004
HumRROKDE April 2003

2001
PSS
A 1
1th
Gra
deM
ath
Scal
e Sc
ore 2000
1800
1600
1400
1200
1000
800
600
Outliers are hidden Extreme values are hidden
n=19993
n=11254 n=25509
n=970
1 2 3 4
Student-Reported Average Grade for Math on SAT Student Descriptive Questionnaire
Advanced
Proficient
Basic
Below Basic
Average Grade 1 - Passing 2 - Fair 3 - Good 4 - Excellent
Figure 11 Student-level relationship between 2001 PSSA 11th grade math scale score and student-reported average math course grades in the Student Descriptive Questionnaire (SDQ) of the SAT for the Class of 2002
HumRRO 21 April 2004
Outliers are hidden Extreme values are hidden
1 2 3 4
Student-Reported Average Grade for Math on SAT Student Descriptive Questionnaire
600
800
1000
1200
1400
1600
1800
2000
2002
PSS
A 1
1th
Gra
de M
ath
Scal
e Sc
ore
n=10370 n=24674
n=19835
n=1003
Advanced
Proficient
Basic
Below Basic
Average Grade 1 - Passing 2 - Fair 3 - Good 4 - Excellent
Figure 12 Student-level relationship between 2002 PSSA 11th grade math scale score and student-reported average math course grade in the SAT Student Descriptive Questionnaire (SDQ) for the Class of 2003
PSSA Scale Scores Versus SAT Reported Grade-Point Average
Figure 13 through Figure 16 illustrate relationships between PSSA scale scores and overall grade-point averages (GPAs) The GPAs are from the SATrsquos SDQ Students were asked to provide their GPA on a basic 4-point scale with pluses and minuses around each point (A+ = 43 A = 40 A- = 37 etc) Approximately 87 (60283 of 69325) of students in the Class of 2002 completed the GPA question in the SDQ and 83 (59258 of 71511) of students in the Class of 2003 completed the question The mean student-reported GPA was 333 (SD = 064) for the Class of 2002 and 335 (SD = 063) for the Class of 2003 The correlation for the 2001 PSSA 11th grade reading component with the 2002 GPA was 0501 For the 2001 PSSA 11th grade math component the correlation was 0539 For the 2002 PSSA the correlations were 0520 in Reading and 0553 in Math The box-plots for PSSA scale scores to GPA for both years and both tests performed as expectedmdashlower scores for lower GPAs and higher scores for higher GPAs Note that the median and boxes align fairly well with the appropriate performance levelsmdashA students in the Advanced and Proficient level B students generally in the Proficient level C students in the low Proficient and Basic levels and D students in the Basic level Note also that the number of students decreases sharply when the student-reported GPA drops below 30
HumRRO 22 April 2004
Outliers are hidden Extreme values are hidden
Advanced
Proficient
Basic
Below Basic
10 13 17 20 23 27 30 33 37 40 43
Student-reported GPA (4-point scale) on the 2002 SAT Student Descriptive Questionnaire (SDQ)
800
1000
1200
1400
1600
1800
2000
2001
PSS
A 1
1th
Gra
de R
eadi
ng S
cale
Sco
re
n=10261
n=5370 n=11810
n=11101 n=9668
n=4624
n=2381 n=3352
n=520 n=40
n=96
Figure 13 Student-level relationship between 2001 PSSA 11th grade reading scale score and student-reported grade-point average (GPA) from the SATrsquos Student Descriptive Questionnaire (SDQ) for the Class of 2002
HumRRO 23 April 2004
Outliers are hidden Extreme values are hidden
10 13 17 20 23 27 30 33 37 40 43 Student-reported GPA (4-point scale) on the 2003 SAT Student Descriptive Questionnaire (SDQ)
800
1000
1200
1400
1600
1800
2000
2002
PSS
A 1
1th
Gra
de R
eadi
ng S
cale
Sco
re
n=3304
n=10358
n=5089
n=11480
n=11507
n=9773
n=4602
n=2084 n=97 n=496 n=27
Advanced
Proficient
Basic
Below Basic
Figure 14 Student-level relationship between 2002 PSSA 11th Grade reading scale score and student-reported grade-point average (GPA) from the SATrsquos Student Descriptive Questionnaire (SDQ) for the Class of 2003
HumRRO 24 April 2004
Outliers are hidden Extreme values are hidden
10 13 17 20 23 27 30 33 37 40 43 Student-reported GPA (4-point scale) on the 2002 SAT Student Descriptive Questionnaire (SDQ)
800
1000
1200
1400
1600
1800
2000
2001
PSS
A 1
1th
Gra
de M
ath
Scal
e Sc
ore
n=10280
n=5391 n=11831
n=11123 n=9672
n=4635
n=2393 n=3377
n=526 n=42
n=97
Advanced
Proficient
Basic
Below Basic
Figure 15 Student-level relationship between 2001 PSSA 11th grade math scale score and student-reported grade-point average (GPA) from the SATrsquos Student Descriptive Questionnaire (SDQ) for the Class of 2002
HumRRO 25 April 2004
Outliers are hidden Extreme values are hidden
10 13 17 20 23 27 30 33 37 40 43 Student-reported GPA (4-point scale) on the 2003 SAT Student Descriptive Questionnaire (SDQ)
800
1000
1200
1400
1600
1800
2000
2002
PSS
A 1
1th
Gra
de M
ath
Scal
e Sc
ore
n=3319
n=10364
n=5091
n=11480
n=11514
n=9777
n=4600
n=2085 n=98
n=496
n=27
Advanced
Proficient
Basic
Below Basic
Figure 16 Student-level relationship between 2001 PSSA 11th grade math scale score and student-reported grade-point average (GPA) from the SATrsquos Student Descriptive Questionnaire (SDQ) for the class of 2002
HumRRO 26 April 2004
Differences in Performance for Demographic Groupings
Analyses were conducted to compare performance on the PSSA and SAT among students from varying backgrounds Average test performance tends to differ for students of differing genders ethnic groups and various measures associated with socioeconomic status The important question for judging bias on the PSSA is not whether specific groups show mean differences but whether those differences are larger for the PSSA than the differences observed on other measures of student achievement
Differences between measures of achievement can be captured in several ways This report will present two measures of mean differences First effect size statistics will be calculated for the differences between major categories of students (Coe 2002) The magnitude of the effect size statistics is less important than the difference between the effect sizes for PSSA compared to the other measures However measuring the magnitude of the gaps for NCLB-defined groups is instructive and important since all states are expected to make progress toward closing those gaps (No Child Left Behind 2004)
Effect size statistics can be interpreted as the average percentile standing of the average treated (or experimental) participant relative to the average untreated (or control) participant An effect size of 00 indicates that the mean of the treated group is at the 50th percentile of the control group An effect size of 08 indicates that the mean of the treated group is at the 79th
percentile of the control group An effect size of 17 indicates that the mean of the treated group is at the 955th percentile of the control group Cohen (1988) hesitantly defined effect sizes as ldquosmall d=2rdquo ldquomedium d=5rdquo and ldquolarge d=8rdquo He went on to caution against offering conventional operational definitions such as these in the diverse field of behavioral science
The second measure used to capture differences between measures of achievement was regression analysis Regression analysis was used to examine the extent to which PSSA differences in performance for various demographic groupings are similar to those found in SAT scores For each of the demographic groupings we calculated a regression equation to predict PSSA scores based on the matching SAT content score A second equation was created which added the specific demographic characteristic of interest If PSSA scores exhibit greater differences based on that demographic characteristic that characteristic will have a significant weight and there will be a meaningful increase in the prediction of the PSSA component score
Gender Differences
Table 12 presents performance means for males and females for the PSSA only This table provides information from the larger state population to use in comparison with the matched PSSA and SAT sample data The SAT-taking population can be expected to post higher means For all gender tables data is coded such that positive numbers indicate higher mean scores for males negative numbers indicate higher mean scores for females For the full population of PSSA takers the pattern of performance between males and females is consistent Males outscore females but only to a very small degree on the PSSA mathematics test for all three included years Females outscored males to a higher but still small degree on the PSSA reading test The differences between years are small and inconsistent This table shows that the gap in performance for both PSSA mathematics and reading between males and females is small and has not changed dramatically between 2001 and 2003
HumRRO 27 April 2004
Table 12 Gender Differences for PSSA (Unmatched State Data) Mean Scale Standard Number of Effect Size Year Subject Gender Score Deviation Cases d
Mathematics Male 130954 22870 56380
2001 Reading Female
Male Female
130288 127107 132719
21170 22731 20167
55496 56091 55280
0030
-0261 Mathematics Male 132475 23813 60777
2002 Reading Female
Male Female
130679 129478 133443
21694 22536 20034
59849 60686 59636
0079
-0186 Mathematics Male 132555 22198 63542
2003 Reading Female
Male 130434 129308
20680 24674
61849 63840
0099
Female 133974 22003 62020 -0200
Table 13 and Table 14 present data for the matched sample of students taking both PSSA and SAT by gender Scale scores for both assessments as well as studentsrsquo self-reported GPA are included in the tables The numbers of males versus females in the state student population is similar typically with a few more males than females per grade However many more females take the SAT tests suggesting that more females than males aspire to attend college Males outscored females by a small margin on the PSSA and the SAT mathematics tests This finding is consistent with scoring patterns on SAT and ACT reported by Willingham and Cole (1997) They suggest that as a rule females tend to avoid taking mathematics and science classes In an apparent inconsistency females outscored males on PSSA reading but not on SAT verbal Scores for SAT verbal were nearly identical for males and females Willingham and Cole found gender differences favoring females in writing skills The PSSArsquos performance-task items add a writing component that was not present in the SAT for the Classes of 2002 and 2003 However SAT will include a student-written essay beginning in spring 2005 This study found that females tended to have higher self-reported GPAs than males
Table 13 Gender Differences for Class of 2002 Matched Sample (2001 PSSA and 2002 SAT) Performance Standard Number of Effect SizeSubject Gender MeanMeasure Deviation Cases d
Mathematics Male 141925 20536 29403
PSSA Reading Female
Male Female
137503 137162 139420
19408 18761 16921
36530 29345 36451
0221
-0126 Mathematics Male 52273 11076 29787
SAT Verbal Female
Male 48821 50081
10527 10333
37042 29787
0319
Female 49582 10126 37042 0049
GPA Male Female
3243 3404
656
609 25323 32857 -0255
HumRRO 28 April 2004
Table 14 Gender Differences for Class of 2003 Matched Sample (2001 PSSA and 2002 SAT) Performance Mean Standard Number Effect Size Subject GenderMeasure Score Deviation of Cases d
Mathematics Male 145023 21049 31338
PSSA Reading Female
Male Female
138650 140570 140715
19790 17318 16427
38459 31328 38418
0312
-0009 Mathematics Male 52596 11067 31557
SAT Verbal Female
Male 48997 50524
10490 10235
38745 31557
0327
Female 49623 10097 38745 0089 Male 3265 653 25387GPA Female 3415 600 32925 -0239
Table 15 and Table 16 show regression results for adding gender as a predictor variable to the model for estimating PSSA scores based on SAT scores For both PSSA reading and math the regression weights for gender are negligible and the changes in R-square are essentially nonexistent Gender is coded such that the positive weight means that females tend to have higher reading and math scores than would be expected from gender differences in SAT verbal
Table 15 Regressions Results Showing the Adjusted Strength of Gender on Predicting 2001 PSSA 11th Grade Scale Scores Based on 2002 SAT Scores Standardized Coefficient
PSSA Component SAT Control Gender R2 Change in R2
due to Gender Reading 0704 0495 Reading 0706 +0081 0502 +0006 Math 0847 0717 Math 0851 +0025 0717 +0001
Table 16 Regressions Results Showing the Adjusted Strength of Gender on Predicting 2002 PSSA 11th Grade Scale Scores Based on 2003 SAT Scores Standardized Coefficient
PSSA Component SAT Control Gender R2 Change in R2
due to Gender Reading 0775 0601 Reading 0777 +0038 0602 +0001 Math 0865 0749 Math 0863 -0012 0749 0000
HumRRO 29 April 2004
Ethnic or Racial Differences
Table 17 presents performance means for the four major ethnic or racial groups3 (White Black HispanicLatino and Asian) for the PSSA only For these analyses the racialethnic categories reported with the PSSA data were used It should be noted that starting in 2003 the reported racialethnic categories were changed from those reported in 2001 and 2002 In 2003 the category of ldquoMixedrdquo was no longer included As a result those students previously selecting ldquoMixedrdquo were forced to select one of the other categories For the full population of PSSA takers the pattern of performance between these four groups is fairly consistent In mathematics Asians outscore all groups Whites outscore HispanicsLatinos and Blacks and HispanicsLatinos score between Blacks and Whites For Reading Asians and Whites score approximately the same and Blacks score almost one standard deviation lower than Whites However the score for HispanicsLatinos has shown a decrease over the three years of approximately 30 points This decrease has dropped the HispanicLatino group to below the mean Black group score The number of HispanicLatinos taking the PSSA has increased approximately 40 Blacks approximately 65 and Whites approximately 10 during that time as well
Table 17 EthnicRacial Differences for PSSA (Unmatched State Data) Hispanic Year Subject Measure White Black AsianLatino
2001
Mathematics
Reading
Mean SD
N Effect Size
Mean SD
N Effect Size
132481 21525 92185
131644 21066 91964
113596 17093 8274 0972
115158 20393 8117 0795
116757 18873 2954 0777
117025 21104 2924 0693
140820 24657 2489 -0360
132927 21707 2470 -0060
2002
Mathematics
Reading
Mean SD
N Effect Size
Mean SD
N Effect Size
133935 22098 97659
133917 20351 97428
114090 17626 10783 0993
114887 20070 10715 0942
116438 19041 3534 0848
116193 21155 3535 0854
143430 26757 2659 -0387
133711 22914 2655 0010
2003
Mathematics
Reading
Mean SD
N Effect Size
Mean SD
N
134059 20863
104064
134488 22411
104271
114619 16132 13669 1042
114796 21940 13871 0888
116389 17473 4106 0903
114052 22848 4158 0903
142013 23662 2865 -0357
134943 24743 2866 -0019
3 The racialethnic analyses were limited to these four groups because of the limited number of students in the other groups
HumRRO 30 April 2004
Table 18 and Table 19 present data for the matched sample of students taking both PSSA and SAT by ethnicity Scale scores for both assessments as well as studentsrsquo self-reported GPA are included in the tables In 2002 Asians (726) took the SAT tests at a much higher rate than any other group followed by Whites (608) Blacks (419) and HispanicsLatinos (364) The order remained the same in 2003 although all groups but Asians had a slightly lower percentage in 2002 than in 2003 This suggests that more Asians and Whites aspire to attend college than do Blacks or HispanicLatinos Scores on the PSSA SAT and GPA show the same order for the matched sample as for the total state sample for the PSSA Comparing the effect size for the PSSA versus the effect size for the SAT shows that the effect size for most groups in the Class of 2002 and components is approximately the same for the PSSA and the SAT The largest difference for Blacks is between the PSSA reading and the SAT verbal components (PSSA reading ndash 0883 and SAT verbal ndash 1011) Note also that the effect size for GPA is approximately half the effect size for the PSSA and SAT for Blacks and Hispanics However for Asians the GPA effect size is more similar to the effect size for math than it is for the SAT verbal or PSSA reading components
Table 18 EthnicRacial Differences for the Class of 2002 Matched Sample (2001 PSSA 11th
Grade and 2002 SAT) Performance Hispanic Subject Measure White Black AsianMeasure Latino
PSSA
Mathematics
Reading
Mean SD
N Effect Size
Mean SD
N Effect Size
140809 19272 56063
139658 17004 56017
120809 17759 3735 1079
123658 19180 3678 0883
128529 19483 1076 0634
129112 19199 1064 0582
146256 22812 1808 -0258
138040 19183 1807 0089
SAT
Mathematics
Verbal
Mean SD
N Effect Size
Mean SD
N Effect Size
51041 10409 56693
50476 9670
56693
40286 10268 3872 1040
40619 9836 3872 1011
44332 11082 1096 0624
44378 10964 1096 0590
54820 13077 1838 -0320 49547 13308 1838 0080
GPA
Mean SD
N Effect Size
3364 0621
49617
2940 0667 3337 0658
3126 0640 871
0377
3491 0615 1616 -0205
HumRRO 31 April 2004
Table 19 EthnicRacial Differences for the Class of 2003 for Matched Sample (2002 PSSA 11th
Grade and 2003 SAT) Performance HispanicSubject Measure White Black AsianMeasure Latino
Mean 142999 122766 129030 150221
Mathematics SD N
19659 59076
18097 4516
19834 1178
24869 1951
PSSA Effect Size Mean 142157
1071 125012
0707 129610
-0322 139776
Reading SD N
15746 59038
17622 4500
18763 1184
20264 1951
Effect Size 1026 0724 0131 Mean 51440 39999 43626 55739
Mathematics SD N
10295 59443
9997 4573
10967 1206
12831 1970
SAT Effect Size Mean 50834
1128 40568
0735 43851
-0370 50166
Verbal SD N
9539 59443
9913 4573
10745 1206
13163 1970
Effect Size 1055 0687 0058 Mean 3385 2933 3175 3538
GPA Mathematics SD N
0610 49511
0666 3799
0641 935
0595 1608
Effect Size 0708 0336 -0254
Table 20 through Table 23 show regression results for adding raceethnicity (White versus Black and White versus HispanicLatino) as a predictor variable to the model for estimating PSSA scores based on SAT scores For both PSSA reading and math the regression weights for raceethnicity are negligible and the changes in R-square are essentially nonexistent Raceethnicity is coded such that the negative weight means that Blacks or HispanicsLatinos tend to have lower reading and math scores than would be expected from ethnicity differences in SAT verbal
Table 20 Regressions Results Showing the Adjusted Strength of Being Black on Predicting 2001 PSSA 11th Grade Scale Scores Based on 2002 SAT Scores Standardized Coefficient
PSSA Component SAT
Control Black R2 Change in R2
due to being Black
Reading 0699 0489 Reading 0686 -0059 0493 +0003 Math 0843 0711 Math 0833 -043 0713 +0002
HumRRO 32 April 2004
Table 21 Regressions Results Showing the Adjusted Strength of Being Black on Predicting 2002 PSSA 11th Grade Scale Scores Based on 2003 SAT Scores Standardized Coefficient
PSSA Component SAT
Control Black R2 Change in R2
due to being Black
Reading 0769 0591 Reading 0750 -0068 0595 0004 Math 0863 0745 Math 0857 -0021 0746 0000
Table 22 Regressions Results Showing the Adjusted Strength of Being HispanicLatino on Predicting 2001 PSSA 11th Grade Scale Scores Based on 2002 SAT Scores Standardized Coefficient
PSSA Component SAT
Control HispanicLatino R2 Change in R2
due to being HispanicLatino
Reading 0687 0472 Reading 0685 -0026 0473 +0001 Math 0837 0700 Math 0836 -0014 0700 0000
Table 23 Regressions Results Showing the Adjusted Strength of Being HispanicLatino on Predicting 2002 PSSA 11th Grade Scale Scores Based on 2003 SAT Scores Standardized Coefficient
PSSA Component SAT
Control HispanicLatino R2 Change in R2
due to being HispanicLatino
Reading 0754 0568 Reading 0050 -0034 0569 +0001 Math 0857 0735 Math 0856 -0009 0735 0000
Economically Disadvantaged Differences
Table 24 presents performance means for those students identified as economically disadvantaged for the PSSA only This table provides information from the larger state population to use in comparison with the matched PSSA and SAT sample data The SAT-taking population can be expected to post higher means For the full population of PSSA takers the pattern of performance between males and females is consistent Noneconomically disadvantaged students outscore economically disadvantaged student to a large degree on all components and all years except 2001 when it was a medium degree The number of students identified more than doubled between 2001 and 2002 and increased an additional 40 in 2003
HumRRO 33 April 2004
Table 24 Differences for Economically Disadvantaged Students for PSSA (Unmatched State Data)
Year Subject Economically Disadvantaged
Mean Scale Score
Standard Deviation
Number of Cases
Effect Size d
2001 Mathematics
Reading
Yes No Yes No
118647 131377 118918 130564
18977 22014 21142 21570
8805 107332 8702
106864
0619
0545
2002 Mathematics
Reading
Yes No Yes No
116604 133857 116380 133704
18913 22497 20914 20617
17253 106297 17199 106035
0830
0834 Yes 118211 17997 24022Mathematics No 134575 21063 102919 08352003 Yes 116747 22817 24290Reading No 135050 22319 103137 0811
Table 25 Differences for Economically Disadvantaged Students for Matched Sample for the Class of 2002 (2001 PSSA 11th Grade and 2002 SAT)
Performance Economically Mean Standard Number Effect Measure Subject Disadvantaged Score Deviation of Cases Size
d
PSSA Mathematics
Reading
Yes No Yes No
130598 139668 131768 138535
18830 20044 18336 17829
2893 65296 2863 65176
0466
0374
SAT Mathematics
Verbal
Yes No Yes No
45185 50491 44694 49953
10399 10912 10131 10215
2926 66399 2926 66399
0498
0517
GPA Yes No
3195 3334
0661 0636
2561 57722 0214
HumRRO 34 April 2004
Table 26 Differences for Economically Disadvantaged Students for Matched Sample for the Class of 2003 (2002 PSSA 11th Grade and 2003 SAT) Performance
Measure Subject Economically Disadvantaged
Mean Score
Standard Deviation
Number of Cases
Effect Size d
PSSA Mathematics
Reading
Yes No Yes No
127741 142707 128169 141742
19474 20278 18498 16243
5822 65159 5812 65114
0753
0780
SAT Mathematics
Verbal
Yes No Yes No
42412 51341 42100 50748
10746 10616 10491 9845
5907 65604 5907 65604
0836
0850 Yes 3116 0680 4854GPA No 3369 0620 54404 0389
Table 27 Regressions Results Showing the Adjusted Strength of Being Economically Disadvantaged on Predicting 2001 PSSA 11th Grade Scale Scores Based on 2002 SAT Scores Standardized Coefficient
Change in R2
SAT Economically due to beingPSSA Component R2 Control Disadvantaged Economically
Disadvantaged Reading 0704 0495 Reading 0703 -0004 0495 0000 Math 0846 0715 Math 0845 -0009 0715 0000
Table 28 Regressions Results Showing the Adjusted Strength of Being Economically Disadvantaged on Predicting 2002 PSSA 11th Grade Scale Scores Based on 2003 SAT Scores Standardized Coefficient
SAT Change in R2
PSSA Component Control Economically Disadvantaged R2 due to being
Economically Disadvantaged
Reading 0775 0601 Reading 0765 -044 0602 0002 Math 0865 0749 Math 0864 -0005 0749 0000
Annual Family Income Differences
Camara and Schmidt (1999) point out that family income is related to performance on tests such as the SAT I They also point out that this finding is not unique to the SAT I or college admissions tests Terenzini Cabrera and Bernal (2001) also examined various differences in educational outcomes associated with varying levels of socioeconomic status (SES) This report
HumRRO 35 April 2004
examines differences associated with family income in this section The following section shows differences in student performance related to parental education level Terenzini Cabrera and Bernal (2001) and Camara and Schmidt (1999) point out differences between income wealth and SES
Because annual family income data comes from the SDQ of the SAT only matched student data can be presented showing relationships with family income Table 29 (Class of 2002) and Table 30 (Class of 2003) show student performance on the PSSA SAT and GPA versus four levels of family income As the table clearly shows student scores increase on all performance measures as income goes up However the effect size for GPA is about half of the effect size for either of the assessments The effect size for the PSSA is similar although slightly less than the effect size for the SAT for both components and both years
Table 29 Annual Family Income Differences for Matched Sample for the Class of 2002 (2001 PSSA 11th Grade and 2002 SAT)
Income Level Performance Subject MeasureMeasure $25000 to $40000 tolt $25000 gt $70000$40000 $70000
PSSA
Math
Reading
Mean SD
N Effect Size
Mean SD
N Effect Size
129900 19108 6658
131011 18466 6594
135381 18361 8709 -0293
136210 17165 8693 -0292
139702 18899 16365 -0516
138848 17110 16348 -0440
145045 20032 14902 -0774
142093 16921 14867 -0626
SAT
Math
Verbal
Mean SD
N Effect Size
Mean SD
N Effect Size
44665 10594 6822
44469 10177 6822
47766 10013 8856 -0301 47619 9546 8856 -0319
50272 10136 16549 -0541 49796 9485
16549 -0542
53816 10580 15122 -0864 52825 9815
15122 -0836
GPA
Mean SD
N Effect Size
3173 0656 6596
3262 0636 8607 -0138
3344 0631 16141 -0266
3412 0628
14726 -0372
HumRRO 36 April 2004
Table 30 Annual Family Income Differences for Matched Sample for the Class of 2003 (2002 PSSA 11th Grade and 2003 SAT)
Income Level Performance Subject MeasureMeasure $25000 - $40000 -lt $25000 gt $70000$40000 $70000
Mean 131577 136393 140924 147093
Math SD N
19401 6230
19051 7958
19319 14963
20560 14295
PSSA Effect Size Mean 132698
-0250 137311
-0483 140572
-0776 144569
Reading SD N
17576 6232
16201 7948
15919 14958
15965 14284
Effect Size -0273 -0470 -0707 Mean 44871 47689 50075 53965
Math SD N
10562 6304
10140 8010
10089 15045
10567 14388
SAT Effect Size Mean 44793
-0272 47581
-0504 49653
-0861 52905
Verbal SD N
10345 6304
9578 8010
9354 15045
9689 14388
Effect Size -0280 -0493 -0809 Mean 3188 3279 3357 3428
GPA SD N
0652 6115
0642 7832
0623 14659
0617 14000
Effect Size -0141 -0265 -0378
Parent Educational Differences
Camara and Schmidt (1999) also looked at the impact of parent education on student performance in standardized testing Their study showed that parental education is related to performance on the SAT I Higher parental education is associated with higher scores on the SAT I Table 31 and Table 32 show the means standard deviations number of students and effect size for various levels of student-reported motherrsquos education for the PSSA SAT and GPA The analyses indicate that the effect size for both assessments and GPA are larger as the motherrsquos educational level increases The effect size for PSSA is not as large as the effect size for SAT The effect size for GPA is about half of the effect size for PSSA or SAT Table 33 and Table 34 provide the same information regarding the fatherrsquos education level The results follow the same pattern as that for motherrsquos education level
HumRRO 37 April 2004
Table 31 Mothers Education Level Differences for Matched Sample for the Class of 2002 (2001 PSSA 11th Grade and 2002 SAT)
Subject Measure lt High School
High School
Some College
BABS Degree
Graduate Degree
Mean 128855 135908 138212 145789 148095
Math SD N
18785 2196
18542 18737
19161 16804
19982 12094
20688 6259
PSSA Effect Size Mean 129039
-378 135883
-0493 137803
-0873 143360
-0974 144735
Reading SD N
17886 2189
17134 18696
17441 16762
16733 12078
16981 6245
Effect Size -0377 -0495 -0883 -0985 Mean 43795 48049 49574 54133 55639
Math SD N
10476 2247
10021 18986
10429 17075
10547 12291
10924 6357
SAT Effect Size Mean 42614
-0415 47405
-0553 49277
-0983 53512
-1107 55072
Verbal SD N
99852247
929118986
963517075
9856 12291
10300 6357
Effect Size -0497 -0679 -1099 -1228 Mean 3142 3267 3289 3456 3504 SD 0653 0630 0640 0618 0601 GPA N 2145 18341 16424 11914 6150
Effect Size -0195 -0227 -0494 -0577
Table 32 Mothers Education Level Differences for Matched Sample for the Class of 2003 (2002 PSSA 11th Grade and 2003 SAT)
lt High High Some BABS GraduateSubject Measure School School College Degree Degree Mean 129723 137323 140038 148027 150140 SD 19513 18746 19865 20474 22494 Math N 2072 17801 16646 11406 5961
Effect Size -0397 -0524 -0915 -0970PSSA Mean 129022 137751 139799 145748 147071 SD 18092 16042 16241 15951 16272 Reading N 2066 17787 16638 11406 5954
Effect Size -0511 -0627 -0981 -1059 Mean 43631 48106 49738 54411 55641
Math SD N
10494 2095
10046 17922
10387 16756
10467 11496
11305 5992
SAT Effect Size Mean 42549
-0436 47592
-0585 49432
-1029 53618
-1101 55050
Verbal SD N
10124 2095
925417922
954716756
9795 11496
10522 5992
Effect Size -0520 -0700 -1111 -1211 Mean 3148 3285 3307 3475 3510
GPA SD N
0646 2003
0622 17344
0636 16134
0608 11088
0599 5797
Effect Size -0216 -0248 -0521 -0581
HumRRO 38 April 2004
Table 33 Fathers Education Level Differences for Matched Sample for the Class of 2002 (2001 PSSA 11th Grade and 2002 SAT)
Subject Measure lt High School
High School
Some College
BABS Degree
Graduate Degree
Mean 128908 135041 138368 144843 150072
Math SD N
18443 2850
18251 17616
18721 14573
19645 12461
20736 7835
PSSA Effect Size Mean 129571
-0334 135453
-0509 137985
-0836 142352
-1079 145994
Reading SD N
18191 2289
17066 17558
17291 14539
16798 12454
16661 7838
Effect Size -0333 -0474 -0730 -0942 Mean 43958 47510 49626 53651 56759
Math SD N
10229 2915
992617845
10116 14800
10368 12636
10727 7980
SAT Effect Size Mean 43245
-0352 47058
-0557 49210
-0941 52830
-122 56114
Verbal SD N
97782915
921217845
947514800
9571 12636
10128 7980
Effect Size -0401 -0620 -0991 -1293 Mean 3136 3247 3301 3432 3548 SD 0637 0634 0633 0618 0594 GPA N 2784 17269 14263 12198 7723
Effect Size -0175 -0260 -0472 -0669
Table 34 Fathers Education Level Differences for Matched Sample for the Class of 2003 (2002 PSSA 11th Grade and 2003 SAT)
lt High High Some BABS GraduateSubject Measure School School College Degree Degree Mean 131197 136533 140022 147183 152503 SD 19107 18733 19163 20247 22047 Math N 2766 16981 14422 11633 7272
Effect Size -0282 -0461 -0812 -1033PSSA Mean 130955 137222 140037 144765 148752 SD 17715 15901 15980 15990 16014 Reading N 2761 16968 14412 11629 7265
Effect Size -0372 -0538 -0818 -1054 Mean 44505 47569 49772 53911 57115
Math SD N
10230 2803
9938 17087
10023 14508
10352 11709
11009 7314
SAT Effect Size Mean 43701
-0304 47224
-0520 49499
-0914 52920
-1187 56296
Verbal SD N
9887 2803
919517087
931014508
9580 11709
10294 7314
Effect Size -0369 -0604 -0947 -1248 Mean 3139 3272 3316 3454 3558
GPA SD N
0639 2696
0624 16545
0632 14014
0606 11281
0582 7046
Effect Size -0211 -0279 -0506 -0686
HumRRO 39 April 2004
Limited English Proficiency Differences
Students identified as having limited English proficiency (LEP) would be expected to have more difficulty taking a test in English than those not identified As a result of these difficulties LEP students would be expected to have lower scores than non-LEP students Table 36 shows the mean standard deviation number of students and the effect size for the entire state on the PSSA in 2001 and 2002 As expected LEP students have lower scores than non-LEP students on both components and effect sizes are generally large However the math component effect size is only about half of the effect size for reading
Table 35 Limited English Proficiency Differences for 11th Grade PSSA (Unmatched State Data) Limited EffectMean Scale Standard NumberYear Subject English Size Score Deviation of CasesProficiency d
Yes 115312 18977 492Math No 130476 22047 115645 07372001 Yes 106216 15338 473Reading No 129784 21727 115093 1253 Yes 116560 20254 844Math No 131550 22812 122706 06952002 Yes 102618 16138 840Reading No 131483 21413 122394 1522
Table 36 and Table 37 show the mean standard deviation number of cases and effect size for the matched sample of students in the Classes of 2002 and 2003 The effect sizes are similar to those in the state sample for the PSSA and SATmdashvery larger in verbalreading and medium in math The effect size is slightly larger for PSSA than SAT in math but slightly smaller for PSSA than SAT in readingverbal However the GPA for LEP students is actually slightly higher than the GPA for non-LEP students
Table 36 Limited English Proficiency Differences for Matched Sample for the Class of 2002 (2001 PSSA 11th Grade and 2002 SAT)
LimitedPerformance Standard Number Effect Size Subject English Mean ScoreMeasure Deviation of Cases dProficiency Yes 125974 19661 134Math No 139310 20070 68055 0671PSSA Yes 113745 14649 132Reading No 138297 17876 67907 1502 Yes 42860 13045 136Math No 50282 10934 69189 0617SAT Yes 33353 9807 136Verbal No 49764 10241 69189 1637 Yes 3393 0617 111GPA No 3328 0637 60172 -0104
HumRRO 40 April 2004
Table 37 Limited English Proficiency Differences for Matched Sample for the Class of 2003 (2002 PSSA 11th Grade and 2003 SAT)
LimitedPerformance Mean Standard Number Effect Size Subject EnglishMeasure Score Deviation of Cases dProficiency Yes 126815 20257 289Mathematics No 141539 20607 70692 0721PSSA Yes 109386 15855 288Reading No 140757 16741 70638 1924 Yes 41564 12159 291Mathematics No 50641 10887 71220 0787SAT Yes 32526 8775 291Verbal No 50105 10126 71220 1855 Yes 3358 585 226GPA No 3348 629 59032 -0008
The regression analyses results (Table 38 and Table 39) show that there are negligible changes in R square for predicting PSSA from SAT scores when adding LEP to the equation for both reading and math for both classes
Table 38 Regressions Results Showing the Adjusted Strength of Being Limited English Proficient on Predicting 2001 PSSA 11th Grade Scale Scores Based on 2002 SAT Scores
Standardized Coefficient Change in R2
SAT Limited English due toPSSA Component R2 Control Proficiency Limited English
Proficiency Reading 0704 0495 Reading 0703 -0011 0495 0000
Math 0846 0715 Math 0845 -0004 0715 0000
Table 39 Regressions Results Showing the Adjusted Strength of Being Limited English Proficient on Predicting 2002 PSSA 11th Grade Scale Scores Based on 2003 SAT Scores
Standardized Coefficient Change in R2
PSSA Component SAT Control
Limited English Proficiency R2 due to
Limited English Proficiency
Reading 0775 0601 Reading 0771 -0033 0602 +0001
Math 0865 0749 Math 0865 0000 0749 0000
HumRRO 41 April 2004
School-Level Scores Means were calculated by school for all scale scores and grade indicators to analyze
school-level results School-level descriptive statistics are presented for the Classes of 2002 and 2003 for the PSSA (Table 40) SAT (Table 41) and GPA and course grades (Table 42) Only schools with at least 10 students with merged PSSA and SAT scores are included in the analyses School-level means showed an increase on both tests both test components GPA and course grades from the Class of 2002 to the Class of 2003 The change in scoring procedures from the 2001 PSSA to the 2002 PSSA (instituting a minimum score of 700 for the 2002 PSSA) is problematic However there were only 9 students in this college-bound sample in the Class of 2003 who scored a 700 on the 2002 PSSA reading component and no students who scored a 700 on the math component The change in course grades was extremely small
Table 40 PSSA School-Level Descriptive Statistics for the Classes of 2002 and 2003 Subject Measure Class of 2002 Class of 2003 Reading Mean 136973 139316
SD 7435 7088 N 586 586
Math Mean 136966 139333 SD 8335 8496
N 586 586 Limited to schools with at least 10 students with merged PSSA and SAT scores
Table 41 SAT School-Level Descriptive Statistics for the Classes of 2002 and 2003 Subject Measure Class of 2002 Class of 2003 Verbal Mean 48578 48907
SD 4207 4251 N 586 586
Math Mean 48847 49159 SD 4500 4601
N 586 586 Limited to schools with at least 10 students with merged PSSA and SAT scores
HumRRO 42 April 2004
Table 42 School-Level Descriptive Statistics GPA and Course Grades for the Classes of 2002 and 2003
Subject Measure Class of 2002 Class of 2003 GPA Mean 334 346
SD 019 019 N 586 586
English Mean SD
329 020
331 021
N 586 586 Math Mean 311 312
SD 021 022 N 586 586
Limited to schools with at least 10 students with merged PSSA and SAT scores
Average Within-Year School-Level Correlations
Table 43 and Table 44 present correlations among these school-level scores Table 45 presents correlations for the average across the two years4 As Hoffman (1998) pointed out there is a tendency for correlations among school scores to be higher than correlations among student-level scores (Class of 2002 - Table 8 Class of 2003 - Table 9 and average for the Classes of 2002 and 2003 - Table 10) This is the case except for those correlations involving GPA and course-grades (except for PSSA reading to math course grade and GPA to English course grade where school-level correlations are higher)
As Hoffman (1998) pointed out the lower school-level correlations for GPA suggests that grading scales are not equivalent across schools There is a tendency for different schools to grade differently As a result at the school level of analysis there is a weaker relationship between GPA and either PSSA or ACT scores When studentsrsquo scores are averaged at the school level observed differences are related not only to differing levels of student achievement but to the particular schoolrsquos grading practices However the school-level relationship between GPA and course grades remains strong for both PSSA and SAT
4 Average correlations were technically corrected with Fisherrsquos r to z transformations
HumRRO 43 April 2004
Table 43 School-Level PSSA SAT and Course Grade Correlations for the Class of 2002 PSSA SAT Course Grades
Variable Reading Math Verbal Math GPA (Total) English Math
ReadingPSSA
Math
1000
0861 1000
Verbal SAT
Math
0818 0883
0773 0935
1000
0941 1000
GPA
English Course
Grades Math
0413 0393
0411 0391
0423 0454
0371 0376
0359 0362
0416 0450
1000
0778 1000
0719 0542 1000 Limited to schools with at least 10 students with merged PSSA and SAT scores
Table 44 School-Level PSSA SAT and Course Grades Correlations for the Class of 2003 PSSA SAT Course Grades
Variable Reading Math Verbal Math GPA (Total) English Math
ReadingPSSA
Math
1000
0870 1000
Verbal SAT
Math
0905 0849
0868 0915
1000
0943 1000
GPA
English Course
Grades Math
0491 0443
0442 0394
0501 0489
0439 0425
0402 0394
0484 0486
1000
0780 1000
0784 0615 1000 Limited to schools with at least 10 students with merged PSSA and SAT scores
HumRRO 44 April 2004
Table 45 School-Level PSSA SAT and Course Grades Correlation Averages for the Class of 2002 and 2003
PSSA SAT Course Grades
Variable Reading Math Verbal Math GPA (Total) English Math
ReadingPSSA
Math
1000
0866 1000
Verbal SAT
Math
0868 0867
0826 0926
1000
0942 1000
GPA
English Course
Grades Math
0453 0418
0427 0393
0463 0472
0406 0401
0381 0378
0451 0468
1000
0779 1000
0753 0580 1000 Limited to schools with at least 10 students with merged PSSA and SAT scores
Table 46 shows that the mean school-level scores for both PSSA 11th grade reading and SAT verbal components of each assessment increased from the Class of 2002 to the Class of 2003 For the SAT the mean school-level change on the verbal component was +330 scale score points For the PSSA the mean school-level scale score change on the 11th grade reading component was +2343 scale score points Table 47 shows the fairly strong relationship between the differences in mean school-level scores on the SAT verbal component and the PSSA reading component for the Classes of 2002 and 2003 This relationship is graphically portrayed in Figure 17 Table 48 Table 49 and Figure 18 show the same information for the math components of the PSSA and SAT As would be expected the relationship between the math components is stronger than for the readingverbal components
Table 46 Difference in Mean School-Level SAT Verbal and PSSA Reading Scores From the Classes of 2002 and 2003
Difference in Mean School-Level Score From the Standard Number ofMeanClass of 2002 and Class of 2003 Deviation Schools SAT Verbal +330 1673 586
PSSA Reading +2343 4660 586 Limited to schools with at least 10 students with merged PSSA and SAT scores
Table 47 Correlation of Difference in School-Level Mean SAT Verbal Score and PSSA Reading Score Between the Classes of 2002 and 2003
Difference in Mean School-Level Score From the SAT PSSA Class of 2002 and Class of 2003 Verbal Reading
SAT Verbal 1
PSSA Reading 462 1
HumRRO 45 April 2004
-200 -100 0 100 200
Difference in School-Level PSSA Reading Mean Score between the Class of 2002 and Class of 2003
-100
-50
0
50
100
Diff
eren
ce in
Sch
ool-L
evel
SA
T V
erba
l Mea
n Sc
ore
betw
een
Cla
ss o
f 200
2 an
d C
lass
of 2
003
$
$$
$
$
$
$$
$
$$
$
$
$
$
$
$
$
$$
$
$
$
$
$
$
$
$
$
$
$
$
$
$$
$
$
$
$
$
$
$
$
$
$ $
$$
$
$
$
$
$
$
$
$$
$
$$
$ $
$$$ $$
$
$
$
$
$
$
$
$
$
$
$
$
$
$$
$
$
$
$$
$$
$$$
$
$$
$
$
$$
$$
$
$
$
$
$
$
$
$
$
$$$
$$$
$
$
$
$
$
$$
$$
$
$$
$
$
$
$
$
$
$
$
$
$
$
$
$
$
$
$
$
$ $
$$
$
$$$ $$
$
$$$
$$
$
$
$
$
$
$
$
$$
$$
$
$
$
$
$
$
$
$
$
$$
$$
$
$$
$
$
$$
$
$
$
$$
$
$$
$
$$
$
$
$
$
$
$
$
$
$
$
$$
$
$$
$$
$
$$$$
$$
$$
$
$$
$
$
$
$
$$
$
$
$
$$
$
$ $$$
$
$ $$
$
$
$
$$
$
$$
$
$
$
$ $$$
$$
$$
$
$ $
$
$
$$
$
$
$
$
$
$
$$
$
$
$ $
$
$
$
$
$$
$
$
$$
$
$
$
$ $$
$
$
$ $
$$
$
$
$
$
$
$
$
$
$
$
$$
$
$
$$ $
$
$
$
$$
$
$
$$ $
$
$
$
$
$
$
$
$
$
$
$
$
$ $
$
$$
$
$$
$
$
$
$
$
$$
$
$
$
$
$
$
$
$
$$
$
$$
$
$
$$$ $
$
$
$$
$$
$
$$
$
$
$ $$ $
$ $
$$
$
$
$$$$
$
$$$
$
$$
$
$
$
$ $
$
$
$
$
$ $$
$
$
$
$
$
$ $
$ $ $
$
$
$
$
$$
$
$
$
$
$
$
$
$ $
$
$$
$
$$ $
$
$
$
$
$
$
$
$ $
$$
$
$
$
$
$
$
$
$$
$
$$
$
$
$
$
$$
$
$
$
$$
$$
$
$
$ $$$
$
$
$
$
$
$
$$$$
$
$$
$
$
$$
$
$$
$
$
$
$$$
$
$$
$
$
$
$
$$
$$
$
$
$
$$
$
$$
$$
$$
$
$
$
$
$$
$
$
$
$$
$
$
$
$
$
$$
$
$
$
$
$$
$
$
$
$
$
$
$$
$$
Figure 17 Scatterplot of difference in school-level SAT verbal mean scores and school-level PSSA 11th grade reading mean scores between the Class of 2002 and Class of 2003
Table 48 Difference in Mean School-Level SAT Math and PSSA Math Scores From the Class of 2002 and Class of 2003
Difference in Mean School-Level Math Score From the Class of 2002 and Class of 2003 Mean Standard
Deviation Number of
Schools
SAT +313 1842 586
PSSA +2367 4687 586 Limited to schools with at least 10 students with merged PSSA and SAT scores
HumRRO 46 April 2004
Table 49 Correlation of Difference in School-Level Mean SAT Math Score and PSSA Math Score Between the Classes of 2002 and 2003
Difference in Mean School-Level Math Score From the Class of 2002 and Class of 2003 SAT PSSA
SAT 1
PSSA 644 1
-200 -100 0 100 200
Difference in School-Level PSSA Math Mean Scale Score between the Class of 2002 and Class of 2003
-100
-50
0
50
100
Diff
eren
ce i
n Sc
hool
-Lev
el S
AT
Mat
h M
ean
Scor
e
betw
e en
the
Clas
s of
200
2 an
d Cl
ass
of 2
003
$
$$ $
$
$$
$
$$
$
$
$$
$
$
$$ $$
$
$
$
$
$
$
$
$
$$$
$
$
$$$
$
$
$
$
$
$
$$
$
$
$
$
$
$
$
$
$$$ $
$
$$
$
$
$
$
$$ $$
$$
$
$
$
$
$
$
$
$$
$
$$
$
$$
$
$
$
$
$ $$$
$
$
$
$
$
$
$
$$
$
$
$
$$
$
$
$
$
$
$ $
$$
$
$
$
$$
$
$$
$
$
$
$
$
$
$
$
$
$$
$
$$
$$
$
$
$
$
$
$$
$
$
$$
$
$
$
$$
$
$
$
$
$
$
$
$
$
$
$
$
$
$
$
$
$$
$
$
$$ $
$
$
$
$
$$
$
$
$
$
$
$
$
$
$
$
$
$
$
$
$
$
$
$
$$
$
$
$
$
$
$
$
$
$
$
$$
$
$
$
$
$$$
$
$
$
$
$
$
$ $$
$
$
$
$
$$
$
$
$
$
$
$$$
$
$
$$$
$
$
$
$
$$
$
$
$$
$
$
$$$
$
$
$
$
$
$
$$$
$
$
$
$
$$
$
$
$
$
$
$
$
$ $
$
$
$
$
$
$
$
$
$
$
$
$
$
$
$
$
$
$
$
$
$
$$$$
$$
$$
$
$$$
$$
$
$$
$
$
$
$
$
$
$
$$
$
$$
$
$
$
$
$
$$
$
$
$
$
$
$$
$
$$
$
$
$$
$
$
$
$
$
$
$
$
$
$
$ $
$
$
$
$
$$
$
$$$ $
$
$
$
$
$
$ $
$$
$
$$
$
$
$$
$ $
$$
$
$
$
$
$
$
$
$
$
$
$
$$
$
$
$
$
$
$
$
$ $
$$
$
$
$
$
$$ $
$
$$
$
$$
$$
$
$
$
$
$
$
$
$
$
$
$$
$
$$
$
$
$$
$
$
$
$
$$
$$
$$$
$$
$
$
$
$$
$
$$
$
$$
$
$
$
$
$
$
$
$
$
$
$
$
$ $$
$
$
$
$
$$
$
$
$
$$
$
$
$
$
$$
$
$$$$
$
$
$
$$$ $
$
$$
$
$
$
$
$
$$
$
$
$$
$$
$ $ $
$
$
$
$
$$
$
$$
$$
$
$
$
$$
$
$
$
$$
$
$
$
$
$
$
$
$$
$
$
$$
$
$
$
Figure 18 Scatterplot of differences in school-level mean SAT math score and school-level mean PSSA math scores between the Classes of 2002 and 2003
Pooled Within-School Correlations
The above discussion alluded to school-level factors such as differences in grading practices which may be impacting observed correlations Figure 19 depicts an extreme version of such a situation Schools A B and C are clearly different in where their students lie with respect to PSSA or SAT scores but they are identical in terms of the grades their students
HumRRO 47 April 2004
receive Also within each school there is a relationship between grades and either PSSA scores or SAT scores However if a correlation were calculated using students from all schools without regard to school-level characteristics it would be zero
School A
School B PSSA or SAT Scores
School C
Grade Point Average (GPA)
Figure 19 Extreme hypothetical illustration of how mean differences among schools on PSSA or SAT scores that are not mirrored by differences in GPA can impact correlations (Ellipses represent students scores within each school)
Pooled within-school correlations are used to estimate relationships between measures calculated within schools and then averaged across all schools These pooled within-school correlations were calculated for each of the two years of data (Table 50 for the Class of 2002 and Table 51 for the Class of 2003) and then averaged across the two years (Table 52)5 The resulting average pooled within-school correlations are presented in Table 52
5 Again the technical r to z correction was used
HumRRO 48 April 2004
Table 50 Pooled Within-School Correlation for the Class of 2002 PSSA SAT Course Grades
Variable Reading Math Verbal Math GPA (Total) English Math
ReadingPSSA
Math
1000
0648 1000
Verbal SAT
Math
0693 0650
0569 0832
1000
0695 1000
GPA
English Course
Grades Math
0528 0573
0461 0412
0361 0542
0516 0559
0465 0402
0349 0541
1000
0703 1000
0668 0443 1000 Limited to schools with at least 10 students with merged PSSA and SAT scores
Table 51 Pooled Within-School Correlation for the Class of 2003 PSSA SAT Course Grades
Variable Reading Math Verbal Math GPA (Total) English Math
ReadingPSSA
Math
1000
0702 1000
Verbal SAT
Math
0757 0629
0666 0857
1000
0662 1000
GPA
English Course
Grades Math
0512 0564
0457 0405
0350 0541
0534 0679
0466 0414
0369 0548
1000
0698 1000
0667 0443 1000 Limited to schools with at least 10 students with merged PSSA and SAT scores
HumRRO 49 April 2004
Table 52 Pooled Within-School Correlation Averaged for Classes of 2002 and 2003 PSSA SAT Course Grades
Variable Reading Math Verbal Math GPA (Total) English Math
ReadingPSSA
Math
1000
0676 1000
Verbal SAT
Math
0727 0640
0620 0845
1000
0679 1000
GPA
English Course
Grades Math
0520 0569
0459 0409
0356 0542
0525 0569
0466 0408
0359 0546
1000
0701 1000
0668 0443 1000 Limited to schools with at least 10 students with merged PSSA and SAT scores
If differences between schoolsrsquo grading procedures are substantial and if within schools students with higher grades also have higher PSSA scores then the correlations in Table 52 will be higher than student correlations in Table 10 (student-level correlations averaged for the Classes of 2002 and 2003) The difference between the GPA correlations in Table 10 and Table 52 however are only marginally different (see Table 53) In nearly all cases the within-school correlations are higher However the range is relatively smallmdash0009 to 0039 for GPA 0176 to 0219 for English course grades and 0147 to 0237 for math course grades Thus grading differences among schools do appear to exist but the effect is small for studentsrsquo GPA but larger for both English and math course grades especially when compared to the matching assessment component (ie English course grade to PSSA reading and SAT verbal math course grade to PSSA math and SAT math)
HumRRO 50 April 2004
Table 53 Differences Between Student-Level Correlations and Pooled Within-School Correlations Averaged for the Classes of 2002 and 2003
GPA or Course Grade to Student-Level Pooled Within- Difference in Assessment Correlations School Correlations Correlations
GPA to PSSA Reading 0511 0520 0009
GPA to PSSA Math 0546 0569 0023
GPA to SAT Verbal 0494 0525 0031
GPA to SAT Math 0530 0569 0039
English to PSSA Reading 0240 0459 0219
English to PSSA Math 0226 0409 0183
English to SAT Verbal 0256 0466 0210
English to SAT Math 0232 0408 0176
Math to PSSA Reading 0202 0356 0154
Math to PSSA Math 0305 0542 0237
Math to SAT Verbal 0212 0359 0147
Math to SAT Math 0313 0546 0233
Comparison of the correlations in Table 52 to Table 10 can also be used to test a hypothesis about the relationship between PSSA and SAT performance It is suggested above that some schools might be working more successfully toward improving PSSA performance than others Again if these efforts are only tangentially affecting SAT scores then we might expect mean differences among schools on PSSA scores that are not mirrored by differences on SAT Within schools however we can still expect students who do better on PSSA to also have a tendency to do better on SAT Figure 20 provides an extreme illustration of this potential effect Comparing correlations between PSSA and SAT from Table 52 to Table 10 reveals no such trend (see Table 54) The differences are all small (-0020 to +0009) suggesting that there are no significant differences among schools in the average PSSA scores of their students that are not mirrored by differences in studentsrsquo SAT scores This conclusion is consistent with the earlier conclusion from the individual level data That is no strong methodological differences in skills requirements are evidenced
HumRRO 51 April 2004
SAT Scores
School A School B School C
PSSA Scale Scores
Figure 20 Extreme hypothetical illustration of how mean differences among schools on PSSA scores that are not mirrored by differences on SAT scores can impact correlations (Ellipses represent students scores within each school)
Table 54 Differences Between SAT and PSSA Components for Student-Level Correlations and Pooled Within-School Correlations Averaged for the Classes of 2002 and 2003
GPA or Course Grade to Student-Level Pooled Within- Difference in Assessment Correlations School Correlations Correlations
PSSA Reading to SAT Verbal 0742 0727 -0015
PSSA Reading to SAT Math 0690 0640 -0020
PSSA Math to SAT Verbal 0629 0620 +0009
PSSA Math to SAT Math 0856 0845 -0009
A third comparison can also be made with the pooled within-school correlations This concerns the intercorrelations within each assessment format The pooled within-school PSSA intercorrelation (Table 52) shows a very slight decrease from student-level PSSA correlations (Table 10) while the pooled within-school SAT intercorrelation (Table 52) shows a larger increase from the student-level SAT intercorrelations (Table 10) It is possible that this is due to an increased homogeneity for the pooled within-school results However Figure 21 presents an exaggerated illustration of another manner in which this difference might be obtained This pattern would yield higher correlations for all students than for students within a school and a higher correlation of school-level scores (school-level PSSA intercorrelation is 0866 school-level SAT intercorrelation is 0942 [both from Table 45]) than for student-level scores (student-level PSSA is 0686 student-level SAT intercorrelation is 0737 [both from Table 10]) Although small (see Table 55) this is the pattern of differences in correlations obtained for both PSSA intercorrelations and for SAT intercorrelations Note that the difference between the PSSA components is smaller than the difference between the SAT components The obtained pattern
HumRRO 52 April 2004
like that in Figure 21 but much less exaggerated could result from differences between schools in the population of their students from differences in instruction that impact PSSA and SAT test scores or both
Content
Area B School A
School B
School C
Content Area A
Figure 21 Exaggerated illustration of how mean differences among schools can increase overall correlations (Ellipses represent students scores within each school)
Table 55 Internal Differences between SAT and PSSA Components for Student-Level Correlations and Pooled Within-School Correlations Averaged for the Classes of 2002 and 2003
GPA or Course Grade to Student-Level Pooled With- Difference in Assessment Correlations School Correlations Correlations
PSSA Reading to PSSA Math 0686 0676 -0010
SAT Verbal to SAT Math 0737 0845 0108
Summary and Conclusion The purpose of this report is to explore the validity questions ldquoAre PSSA scores
appropriately related to other measures of educational achievementrdquo
The data presented in this report suggest the following main points
bull Students who do well on any of the assessments tend to do well on all of the assessmentsmdashPSSA SAT GPA or course grades
bull When schoolsrsquo means are calculated using only the SAT-taking population of students schools with high scores on SAT also have high PSSA scores GPA and course grades are also related to both PSSA and SAT although not as strongly as the relationship between the PSSA and SAT
HumRRO 53 April 2004
PSSA exhibits strong convergent validity coefficients Correlations are very high between PSSA and SAT PSSA is positively correlated with other measures of student achievement including course grades and GPA Gains on PSSA are reflective of changes on SAT at the school level All these data provide strong evidence in support of PSSA as a valid measure of student achievement
There are however a few clarifications and qualifications to these general conclusions but none that diminish the basic findings These clarifications and qualifications include the following
Changes in scores Both mean PSSA and SAT scores experienced an increase Changes between the two assessments are positively correlated Schools that have gained on one assessment tend to have also gained on the other assessment However the same relationship is also true for those schools that have decreased
PSSA and SAT are tied to different content domains use differently formatted items and were designed to serve very different purposes However it is clear from the data that students who tend to perform well on the PSSA can also be expected to perform well on the SAT and vice-versa It is clear from the data that schools that perform well on one test can be expected to perform well on the other It is also clear that schools that improve on one test can be expected to improve on the other
Discriminant validity At the student level and the school level the different assessments of mathematics achievement are more highly related to each other than to assessments of other subjects Students with high mathematics scores on one assessment will tend to do well on all other assessments but that tendency is most pronounced for other mathematics assessments The same holds for school scores There is a similar differentiation on readingverbal assessments at both the student and school level but not as pronounced as in mathematics
GPA shows positive relationships with both PSSA and SAT assessments at the student and school level but not as pronounced as the relationship between the two assessments This is interpreted as being due to differences in schoolsrsquo grading practices Grading practices apparently differ sufficiently to reduce school-level associations with PSSA and SAT scores
Neither gender race socioeconomic status nor limited English proficiency appear to influence the PSSA scores any more than would be expected based on observed differences for SAT scores In other words PSSA items are not injecting any unexpected gender racialethnic socioeconomic status or limited English proficiency bias
HumRRO 54 April 2004
References
Camara WJ amp Schmidt AE (1999) Group differences in standardized testing and social stratification (College Board Report No 99-5) New York College Entrance Examination Board
Campbell D T amp Fiske D W (1959) Convergent and discriminant validation by the multitrait-multimethod matrix Psychological Bulletin 56(2) 81-105
Cassady JC (2001) Self-reported GPA and SAT A Methodological Note Practical Assessment Research amp Evaluation 7(12)
Coe Robert (2002) Itrsquos the effect size stupid What effect size is and why itrsquos important Paper presented at the Annual Conference of the British Educational Research Association University of Exeter England Retrieved from httpwwwleedsacukeducoldocuments00002182htm
Cohen J (1988) Statistical power analysis for the behavioral sciences (2nd ed) Hillsdale NJ Erlbaum
Hoffman R G (1998) Relationships among Kentuckyrsquos open-response assessments ACT scores and studentsrsquo self-reported high school grades (HumRRO Report FR-WATSD-98-27) Radcliff KY Human Resources Research Organization
Lewis DM Mitzel HC amp Green DR (1996) Standard setting A bookmark approach Symposium presented at the Council of Chief State School Officers Conference on Large ndashScale Assessment Phoenix AZ
Livingston SA amp Zieky MJ (1978) Manual for setting standards on the Basic Skills Assessment Test Princeton NJ Educational Testing Service
Mead R amp Melby K (2003 February) Technical analysis Pennsylvania System of School Assessment 2003 reading and mathematics PSSA Data Recognition Corporation
Mead R amp Melby K (2002 April) Technical analysis Pennsylvania System of School Assessment 2001 reading and mathematics PSSA Data Recognition Corporation
Mead R Smith RM amp Swanlund A (2003) Technical analysis 2003 Pennsylvania System of School Assessment mathematics and reading Data Recognition Corporation
NCLB (2004) httpwwwedgovnclblandingjtml
Sicoly Fiore (2002) What do school-level scores from large-scale assessments really measure Educational Measurement Issues and Practice 21(4) 17-26
Terenzini PT Cabrera AF amp Bernal EM (2001) Swimming against the tide The poor in American higher education (Research Report No 2001-1) New York College Entrance Examination Board
Willingham WW amp Cole NS (1997) Gender and Fair Assessment Hillsdale NJ Erlbaum
HumRRO 55 April 2004
HumRROKDE April 2003

Outliers are hidden Extreme values are hidden
Advanced
Proficient
Basic
Below Basic
10 13 17 20 23 27 30 33 37 40 43
Student-reported GPA (4-point scale) on the 2002 SAT Student Descriptive Questionnaire (SDQ)
800
1000
1200
1400
1600
1800
2000
2001
PSS
A 1
1th
Gra
de R
eadi
ng S
cale
Sco
re
n=10261
n=5370 n=11810
n=11101 n=9668
n=4624
n=2381 n=3352
n=520 n=40
n=96
Figure 13 Student-level relationship between 2001 PSSA 11th grade reading scale score and student-reported grade-point average (GPA) from the SATrsquos Student Descriptive Questionnaire (SDQ) for the Class of 2002
HumRRO 23 April 2004
Outliers are hidden Extreme values are hidden
10 13 17 20 23 27 30 33 37 40 43 Student-reported GPA (4-point scale) on the 2003 SAT Student Descriptive Questionnaire (SDQ)
800
1000
1200
1400
1600
1800
2000
2002
PSS
A 1
1th
Gra
de R
eadi
ng S
cale
Sco
re
n=3304
n=10358
n=5089
n=11480
n=11507
n=9773
n=4602
n=2084 n=97 n=496 n=27
Advanced
Proficient
Basic
Below Basic
Figure 14 Student-level relationship between 2002 PSSA 11th Grade reading scale score and student-reported grade-point average (GPA) from the SATrsquos Student Descriptive Questionnaire (SDQ) for the Class of 2003
HumRRO 24 April 2004
Outliers are hidden Extreme values are hidden
10 13 17 20 23 27 30 33 37 40 43 Student-reported GPA (4-point scale) on the 2002 SAT Student Descriptive Questionnaire (SDQ)
800
1000
1200
1400
1600
1800
2000
2001
PSS
A 1
1th
Gra
de M
ath
Scal
e Sc
ore
n=10280
n=5391 n=11831
n=11123 n=9672
n=4635
n=2393 n=3377
n=526 n=42
n=97
Advanced
Proficient
Basic
Below Basic
Figure 15 Student-level relationship between 2001 PSSA 11th grade math scale score and student-reported grade-point average (GPA) from the SATrsquos Student Descriptive Questionnaire (SDQ) for the Class of 2002
HumRRO 25 April 2004
Outliers are hidden Extreme values are hidden
10 13 17 20 23 27 30 33 37 40 43 Student-reported GPA (4-point scale) on the 2003 SAT Student Descriptive Questionnaire (SDQ)
800
1000
1200
1400
1600
1800
2000
2002
PSS
A 1
1th
Gra
de M
ath
Scal
e Sc
ore
n=3319
n=10364
n=5091
n=11480
n=11514
n=9777
n=4600
n=2085 n=98
n=496
n=27
Advanced
Proficient
Basic
Below Basic
Figure 16 Student-level relationship between 2001 PSSA 11th grade math scale score and student-reported grade-point average (GPA) from the SATrsquos Student Descriptive Questionnaire (SDQ) for the class of 2002
HumRRO 26 April 2004
Differences in Performance for Demographic Groupings
Analyses were conducted to compare performance on the PSSA and SAT among students from varying backgrounds Average test performance tends to differ for students of differing genders ethnic groups and various measures associated with socioeconomic status The important question for judging bias on the PSSA is not whether specific groups show mean differences but whether those differences are larger for the PSSA than the differences observed on other measures of student achievement
Differences between measures of achievement can be captured in several ways This report will present two measures of mean differences First effect size statistics will be calculated for the differences between major categories of students (Coe 2002) The magnitude of the effect size statistics is less important than the difference between the effect sizes for PSSA compared to the other measures However measuring the magnitude of the gaps for NCLB-defined groups is instructive and important since all states are expected to make progress toward closing those gaps (No Child Left Behind 2004)
Effect size statistics can be interpreted as the average percentile standing of the average treated (or experimental) participant relative to the average untreated (or control) participant An effect size of 00 indicates that the mean of the treated group is at the 50th percentile of the control group An effect size of 08 indicates that the mean of the treated group is at the 79th
percentile of the control group An effect size of 17 indicates that the mean of the treated group is at the 955th percentile of the control group Cohen (1988) hesitantly defined effect sizes as ldquosmall d=2rdquo ldquomedium d=5rdquo and ldquolarge d=8rdquo He went on to caution against offering conventional operational definitions such as these in the diverse field of behavioral science
The second measure used to capture differences between measures of achievement was regression analysis Regression analysis was used to examine the extent to which PSSA differences in performance for various demographic groupings are similar to those found in SAT scores For each of the demographic groupings we calculated a regression equation to predict PSSA scores based on the matching SAT content score A second equation was created which added the specific demographic characteristic of interest If PSSA scores exhibit greater differences based on that demographic characteristic that characteristic will have a significant weight and there will be a meaningful increase in the prediction of the PSSA component score
Gender Differences
Table 12 presents performance means for males and females for the PSSA only This table provides information from the larger state population to use in comparison with the matched PSSA and SAT sample data The SAT-taking population can be expected to post higher means For all gender tables data is coded such that positive numbers indicate higher mean scores for males negative numbers indicate higher mean scores for females For the full population of PSSA takers the pattern of performance between males and females is consistent Males outscore females but only to a very small degree on the PSSA mathematics test for all three included years Females outscored males to a higher but still small degree on the PSSA reading test The differences between years are small and inconsistent This table shows that the gap in performance for both PSSA mathematics and reading between males and females is small and has not changed dramatically between 2001 and 2003
HumRRO 27 April 2004
Table 12 Gender Differences for PSSA (Unmatched State Data) Mean Scale Standard Number of Effect Size Year Subject Gender Score Deviation Cases d
Mathematics Male 130954 22870 56380
2001 Reading Female
Male Female
130288 127107 132719
21170 22731 20167
55496 56091 55280
0030
-0261 Mathematics Male 132475 23813 60777
2002 Reading Female
Male Female
130679 129478 133443
21694 22536 20034
59849 60686 59636
0079
-0186 Mathematics Male 132555 22198 63542
2003 Reading Female
Male 130434 129308
20680 24674
61849 63840
0099
Female 133974 22003 62020 -0200
Table 13 and Table 14 present data for the matched sample of students taking both PSSA and SAT by gender Scale scores for both assessments as well as studentsrsquo self-reported GPA are included in the tables The numbers of males versus females in the state student population is similar typically with a few more males than females per grade However many more females take the SAT tests suggesting that more females than males aspire to attend college Males outscored females by a small margin on the PSSA and the SAT mathematics tests This finding is consistent with scoring patterns on SAT and ACT reported by Willingham and Cole (1997) They suggest that as a rule females tend to avoid taking mathematics and science classes In an apparent inconsistency females outscored males on PSSA reading but not on SAT verbal Scores for SAT verbal were nearly identical for males and females Willingham and Cole found gender differences favoring females in writing skills The PSSArsquos performance-task items add a writing component that was not present in the SAT for the Classes of 2002 and 2003 However SAT will include a student-written essay beginning in spring 2005 This study found that females tended to have higher self-reported GPAs than males
Table 13 Gender Differences for Class of 2002 Matched Sample (2001 PSSA and 2002 SAT) Performance Standard Number of Effect SizeSubject Gender MeanMeasure Deviation Cases d
Mathematics Male 141925 20536 29403
PSSA Reading Female
Male Female
137503 137162 139420
19408 18761 16921
36530 29345 36451
0221
-0126 Mathematics Male 52273 11076 29787
SAT Verbal Female
Male 48821 50081
10527 10333
37042 29787
0319
Female 49582 10126 37042 0049
GPA Male Female
3243 3404
656
609 25323 32857 -0255
HumRRO 28 April 2004
Table 14 Gender Differences for Class of 2003 Matched Sample (2001 PSSA and 2002 SAT) Performance Mean Standard Number Effect Size Subject GenderMeasure Score Deviation of Cases d
Mathematics Male 145023 21049 31338
PSSA Reading Female
Male Female
138650 140570 140715
19790 17318 16427
38459 31328 38418
0312
-0009 Mathematics Male 52596 11067 31557
SAT Verbal Female
Male 48997 50524
10490 10235
38745 31557
0327
Female 49623 10097 38745 0089 Male 3265 653 25387GPA Female 3415 600 32925 -0239
Table 15 and Table 16 show regression results for adding gender as a predictor variable to the model for estimating PSSA scores based on SAT scores For both PSSA reading and math the regression weights for gender are negligible and the changes in R-square are essentially nonexistent Gender is coded such that the positive weight means that females tend to have higher reading and math scores than would be expected from gender differences in SAT verbal
Table 15 Regressions Results Showing the Adjusted Strength of Gender on Predicting 2001 PSSA 11th Grade Scale Scores Based on 2002 SAT Scores Standardized Coefficient
PSSA Component SAT Control Gender R2 Change in R2
due to Gender Reading 0704 0495 Reading 0706 +0081 0502 +0006 Math 0847 0717 Math 0851 +0025 0717 +0001
Table 16 Regressions Results Showing the Adjusted Strength of Gender on Predicting 2002 PSSA 11th Grade Scale Scores Based on 2003 SAT Scores Standardized Coefficient
PSSA Component SAT Control Gender R2 Change in R2
due to Gender Reading 0775 0601 Reading 0777 +0038 0602 +0001 Math 0865 0749 Math 0863 -0012 0749 0000
HumRRO 29 April 2004
Ethnic or Racial Differences
Table 17 presents performance means for the four major ethnic or racial groups3 (White Black HispanicLatino and Asian) for the PSSA only For these analyses the racialethnic categories reported with the PSSA data were used It should be noted that starting in 2003 the reported racialethnic categories were changed from those reported in 2001 and 2002 In 2003 the category of ldquoMixedrdquo was no longer included As a result those students previously selecting ldquoMixedrdquo were forced to select one of the other categories For the full population of PSSA takers the pattern of performance between these four groups is fairly consistent In mathematics Asians outscore all groups Whites outscore HispanicsLatinos and Blacks and HispanicsLatinos score between Blacks and Whites For Reading Asians and Whites score approximately the same and Blacks score almost one standard deviation lower than Whites However the score for HispanicsLatinos has shown a decrease over the three years of approximately 30 points This decrease has dropped the HispanicLatino group to below the mean Black group score The number of HispanicLatinos taking the PSSA has increased approximately 40 Blacks approximately 65 and Whites approximately 10 during that time as well
Table 17 EthnicRacial Differences for PSSA (Unmatched State Data) Hispanic Year Subject Measure White Black AsianLatino
2001
Mathematics
Reading
Mean SD
N Effect Size
Mean SD
N Effect Size
132481 21525 92185
131644 21066 91964
113596 17093 8274 0972
115158 20393 8117 0795
116757 18873 2954 0777
117025 21104 2924 0693
140820 24657 2489 -0360
132927 21707 2470 -0060
2002
Mathematics
Reading
Mean SD
N Effect Size
Mean SD
N Effect Size
133935 22098 97659
133917 20351 97428
114090 17626 10783 0993
114887 20070 10715 0942
116438 19041 3534 0848
116193 21155 3535 0854
143430 26757 2659 -0387
133711 22914 2655 0010
2003
Mathematics
Reading
Mean SD
N Effect Size
Mean SD
N
134059 20863
104064
134488 22411
104271
114619 16132 13669 1042
114796 21940 13871 0888
116389 17473 4106 0903
114052 22848 4158 0903
142013 23662 2865 -0357
134943 24743 2866 -0019
3 The racialethnic analyses were limited to these four groups because of the limited number of students in the other groups
HumRRO 30 April 2004
Table 18 and Table 19 present data for the matched sample of students taking both PSSA and SAT by ethnicity Scale scores for both assessments as well as studentsrsquo self-reported GPA are included in the tables In 2002 Asians (726) took the SAT tests at a much higher rate than any other group followed by Whites (608) Blacks (419) and HispanicsLatinos (364) The order remained the same in 2003 although all groups but Asians had a slightly lower percentage in 2002 than in 2003 This suggests that more Asians and Whites aspire to attend college than do Blacks or HispanicLatinos Scores on the PSSA SAT and GPA show the same order for the matched sample as for the total state sample for the PSSA Comparing the effect size for the PSSA versus the effect size for the SAT shows that the effect size for most groups in the Class of 2002 and components is approximately the same for the PSSA and the SAT The largest difference for Blacks is between the PSSA reading and the SAT verbal components (PSSA reading ndash 0883 and SAT verbal ndash 1011) Note also that the effect size for GPA is approximately half the effect size for the PSSA and SAT for Blacks and Hispanics However for Asians the GPA effect size is more similar to the effect size for math than it is for the SAT verbal or PSSA reading components
Table 18 EthnicRacial Differences for the Class of 2002 Matched Sample (2001 PSSA 11th
Grade and 2002 SAT) Performance Hispanic Subject Measure White Black AsianMeasure Latino
PSSA
Mathematics
Reading
Mean SD
N Effect Size
Mean SD
N Effect Size
140809 19272 56063
139658 17004 56017
120809 17759 3735 1079
123658 19180 3678 0883
128529 19483 1076 0634
129112 19199 1064 0582
146256 22812 1808 -0258
138040 19183 1807 0089
SAT
Mathematics
Verbal
Mean SD
N Effect Size
Mean SD
N Effect Size
51041 10409 56693
50476 9670
56693
40286 10268 3872 1040
40619 9836 3872 1011
44332 11082 1096 0624
44378 10964 1096 0590
54820 13077 1838 -0320 49547 13308 1838 0080
GPA
Mean SD
N Effect Size
3364 0621
49617
2940 0667 3337 0658
3126 0640 871
0377
3491 0615 1616 -0205
HumRRO 31 April 2004
Table 19 EthnicRacial Differences for the Class of 2003 for Matched Sample (2002 PSSA 11th
Grade and 2003 SAT) Performance HispanicSubject Measure White Black AsianMeasure Latino
Mean 142999 122766 129030 150221
Mathematics SD N
19659 59076
18097 4516
19834 1178
24869 1951
PSSA Effect Size Mean 142157
1071 125012
0707 129610
-0322 139776
Reading SD N
15746 59038
17622 4500
18763 1184
20264 1951
Effect Size 1026 0724 0131 Mean 51440 39999 43626 55739
Mathematics SD N
10295 59443
9997 4573
10967 1206
12831 1970
SAT Effect Size Mean 50834
1128 40568
0735 43851
-0370 50166
Verbal SD N
9539 59443
9913 4573
10745 1206
13163 1970
Effect Size 1055 0687 0058 Mean 3385 2933 3175 3538
GPA Mathematics SD N
0610 49511
0666 3799
0641 935
0595 1608
Effect Size 0708 0336 -0254
Table 20 through Table 23 show regression results for adding raceethnicity (White versus Black and White versus HispanicLatino) as a predictor variable to the model for estimating PSSA scores based on SAT scores For both PSSA reading and math the regression weights for raceethnicity are negligible and the changes in R-square are essentially nonexistent Raceethnicity is coded such that the negative weight means that Blacks or HispanicsLatinos tend to have lower reading and math scores than would be expected from ethnicity differences in SAT verbal
Table 20 Regressions Results Showing the Adjusted Strength of Being Black on Predicting 2001 PSSA 11th Grade Scale Scores Based on 2002 SAT Scores Standardized Coefficient
PSSA Component SAT
Control Black R2 Change in R2
due to being Black
Reading 0699 0489 Reading 0686 -0059 0493 +0003 Math 0843 0711 Math 0833 -043 0713 +0002
HumRRO 32 April 2004
Table 21 Regressions Results Showing the Adjusted Strength of Being Black on Predicting 2002 PSSA 11th Grade Scale Scores Based on 2003 SAT Scores Standardized Coefficient
PSSA Component SAT
Control Black R2 Change in R2
due to being Black
Reading 0769 0591 Reading 0750 -0068 0595 0004 Math 0863 0745 Math 0857 -0021 0746 0000
Table 22 Regressions Results Showing the Adjusted Strength of Being HispanicLatino on Predicting 2001 PSSA 11th Grade Scale Scores Based on 2002 SAT Scores Standardized Coefficient
PSSA Component SAT
Control HispanicLatino R2 Change in R2
due to being HispanicLatino
Reading 0687 0472 Reading 0685 -0026 0473 +0001 Math 0837 0700 Math 0836 -0014 0700 0000
Table 23 Regressions Results Showing the Adjusted Strength of Being HispanicLatino on Predicting 2002 PSSA 11th Grade Scale Scores Based on 2003 SAT Scores Standardized Coefficient
PSSA Component SAT
Control HispanicLatino R2 Change in R2
due to being HispanicLatino
Reading 0754 0568 Reading 0050 -0034 0569 +0001 Math 0857 0735 Math 0856 -0009 0735 0000
Economically Disadvantaged Differences
Table 24 presents performance means for those students identified as economically disadvantaged for the PSSA only This table provides information from the larger state population to use in comparison with the matched PSSA and SAT sample data The SAT-taking population can be expected to post higher means For the full population of PSSA takers the pattern of performance between males and females is consistent Noneconomically disadvantaged students outscore economically disadvantaged student to a large degree on all components and all years except 2001 when it was a medium degree The number of students identified more than doubled between 2001 and 2002 and increased an additional 40 in 2003
HumRRO 33 April 2004
Table 24 Differences for Economically Disadvantaged Students for PSSA (Unmatched State Data)
Year Subject Economically Disadvantaged
Mean Scale Score
Standard Deviation
Number of Cases
Effect Size d
2001 Mathematics
Reading
Yes No Yes No
118647 131377 118918 130564
18977 22014 21142 21570
8805 107332 8702
106864
0619
0545
2002 Mathematics
Reading
Yes No Yes No
116604 133857 116380 133704
18913 22497 20914 20617
17253 106297 17199 106035
0830
0834 Yes 118211 17997 24022Mathematics No 134575 21063 102919 08352003 Yes 116747 22817 24290Reading No 135050 22319 103137 0811
Table 25 Differences for Economically Disadvantaged Students for Matched Sample for the Class of 2002 (2001 PSSA 11th Grade and 2002 SAT)
Performance Economically Mean Standard Number Effect Measure Subject Disadvantaged Score Deviation of Cases Size
d
PSSA Mathematics
Reading
Yes No Yes No
130598 139668 131768 138535
18830 20044 18336 17829
2893 65296 2863 65176
0466
0374
SAT Mathematics
Verbal
Yes No Yes No
45185 50491 44694 49953
10399 10912 10131 10215
2926 66399 2926 66399
0498
0517
GPA Yes No
3195 3334
0661 0636
2561 57722 0214
HumRRO 34 April 2004
Table 26 Differences for Economically Disadvantaged Students for Matched Sample for the Class of 2003 (2002 PSSA 11th Grade and 2003 SAT) Performance
Measure Subject Economically Disadvantaged
Mean Score
Standard Deviation
Number of Cases
Effect Size d
PSSA Mathematics
Reading
Yes No Yes No
127741 142707 128169 141742
19474 20278 18498 16243
5822 65159 5812 65114
0753
0780
SAT Mathematics
Verbal
Yes No Yes No
42412 51341 42100 50748
10746 10616 10491 9845
5907 65604 5907 65604
0836
0850 Yes 3116 0680 4854GPA No 3369 0620 54404 0389
Table 27 Regressions Results Showing the Adjusted Strength of Being Economically Disadvantaged on Predicting 2001 PSSA 11th Grade Scale Scores Based on 2002 SAT Scores Standardized Coefficient
Change in R2
SAT Economically due to beingPSSA Component R2 Control Disadvantaged Economically
Disadvantaged Reading 0704 0495 Reading 0703 -0004 0495 0000 Math 0846 0715 Math 0845 -0009 0715 0000
Table 28 Regressions Results Showing the Adjusted Strength of Being Economically Disadvantaged on Predicting 2002 PSSA 11th Grade Scale Scores Based on 2003 SAT Scores Standardized Coefficient
SAT Change in R2
PSSA Component Control Economically Disadvantaged R2 due to being
Economically Disadvantaged
Reading 0775 0601 Reading 0765 -044 0602 0002 Math 0865 0749 Math 0864 -0005 0749 0000
Annual Family Income Differences
Camara and Schmidt (1999) point out that family income is related to performance on tests such as the SAT I They also point out that this finding is not unique to the SAT I or college admissions tests Terenzini Cabrera and Bernal (2001) also examined various differences in educational outcomes associated with varying levels of socioeconomic status (SES) This report
HumRRO 35 April 2004
examines differences associated with family income in this section The following section shows differences in student performance related to parental education level Terenzini Cabrera and Bernal (2001) and Camara and Schmidt (1999) point out differences between income wealth and SES
Because annual family income data comes from the SDQ of the SAT only matched student data can be presented showing relationships with family income Table 29 (Class of 2002) and Table 30 (Class of 2003) show student performance on the PSSA SAT and GPA versus four levels of family income As the table clearly shows student scores increase on all performance measures as income goes up However the effect size for GPA is about half of the effect size for either of the assessments The effect size for the PSSA is similar although slightly less than the effect size for the SAT for both components and both years
Table 29 Annual Family Income Differences for Matched Sample for the Class of 2002 (2001 PSSA 11th Grade and 2002 SAT)
Income Level Performance Subject MeasureMeasure $25000 to $40000 tolt $25000 gt $70000$40000 $70000
PSSA
Math
Reading
Mean SD
N Effect Size
Mean SD
N Effect Size
129900 19108 6658
131011 18466 6594
135381 18361 8709 -0293
136210 17165 8693 -0292
139702 18899 16365 -0516
138848 17110 16348 -0440
145045 20032 14902 -0774
142093 16921 14867 -0626
SAT
Math
Verbal
Mean SD
N Effect Size
Mean SD
N Effect Size
44665 10594 6822
44469 10177 6822
47766 10013 8856 -0301 47619 9546 8856 -0319
50272 10136 16549 -0541 49796 9485
16549 -0542
53816 10580 15122 -0864 52825 9815
15122 -0836
GPA
Mean SD
N Effect Size
3173 0656 6596
3262 0636 8607 -0138
3344 0631 16141 -0266
3412 0628
14726 -0372
HumRRO 36 April 2004
Table 30 Annual Family Income Differences for Matched Sample for the Class of 2003 (2002 PSSA 11th Grade and 2003 SAT)
Income Level Performance Subject MeasureMeasure $25000 - $40000 -lt $25000 gt $70000$40000 $70000
Mean 131577 136393 140924 147093
Math SD N
19401 6230
19051 7958
19319 14963
20560 14295
PSSA Effect Size Mean 132698
-0250 137311
-0483 140572
-0776 144569
Reading SD N
17576 6232
16201 7948
15919 14958
15965 14284
Effect Size -0273 -0470 -0707 Mean 44871 47689 50075 53965
Math SD N
10562 6304
10140 8010
10089 15045
10567 14388
SAT Effect Size Mean 44793
-0272 47581
-0504 49653
-0861 52905
Verbal SD N
10345 6304
9578 8010
9354 15045
9689 14388
Effect Size -0280 -0493 -0809 Mean 3188 3279 3357 3428
GPA SD N
0652 6115
0642 7832
0623 14659
0617 14000
Effect Size -0141 -0265 -0378
Parent Educational Differences
Camara and Schmidt (1999) also looked at the impact of parent education on student performance in standardized testing Their study showed that parental education is related to performance on the SAT I Higher parental education is associated with higher scores on the SAT I Table 31 and Table 32 show the means standard deviations number of students and effect size for various levels of student-reported motherrsquos education for the PSSA SAT and GPA The analyses indicate that the effect size for both assessments and GPA are larger as the motherrsquos educational level increases The effect size for PSSA is not as large as the effect size for SAT The effect size for GPA is about half of the effect size for PSSA or SAT Table 33 and Table 34 provide the same information regarding the fatherrsquos education level The results follow the same pattern as that for motherrsquos education level
HumRRO 37 April 2004
Table 31 Mothers Education Level Differences for Matched Sample for the Class of 2002 (2001 PSSA 11th Grade and 2002 SAT)
Subject Measure lt High School
High School
Some College
BABS Degree
Graduate Degree
Mean 128855 135908 138212 145789 148095
Math SD N
18785 2196
18542 18737
19161 16804
19982 12094
20688 6259
PSSA Effect Size Mean 129039
-378 135883
-0493 137803
-0873 143360
-0974 144735
Reading SD N
17886 2189
17134 18696
17441 16762
16733 12078
16981 6245
Effect Size -0377 -0495 -0883 -0985 Mean 43795 48049 49574 54133 55639
Math SD N
10476 2247
10021 18986
10429 17075
10547 12291
10924 6357
SAT Effect Size Mean 42614
-0415 47405
-0553 49277
-0983 53512
-1107 55072
Verbal SD N
99852247
929118986
963517075
9856 12291
10300 6357
Effect Size -0497 -0679 -1099 -1228 Mean 3142 3267 3289 3456 3504 SD 0653 0630 0640 0618 0601 GPA N 2145 18341 16424 11914 6150
Effect Size -0195 -0227 -0494 -0577
Table 32 Mothers Education Level Differences for Matched Sample for the Class of 2003 (2002 PSSA 11th Grade and 2003 SAT)
lt High High Some BABS GraduateSubject Measure School School College Degree Degree Mean 129723 137323 140038 148027 150140 SD 19513 18746 19865 20474 22494 Math N 2072 17801 16646 11406 5961
Effect Size -0397 -0524 -0915 -0970PSSA Mean 129022 137751 139799 145748 147071 SD 18092 16042 16241 15951 16272 Reading N 2066 17787 16638 11406 5954
Effect Size -0511 -0627 -0981 -1059 Mean 43631 48106 49738 54411 55641
Math SD N
10494 2095
10046 17922
10387 16756
10467 11496
11305 5992
SAT Effect Size Mean 42549
-0436 47592
-0585 49432
-1029 53618
-1101 55050
Verbal SD N
10124 2095
925417922
954716756
9795 11496
10522 5992
Effect Size -0520 -0700 -1111 -1211 Mean 3148 3285 3307 3475 3510
GPA SD N
0646 2003
0622 17344
0636 16134
0608 11088
0599 5797
Effect Size -0216 -0248 -0521 -0581
HumRRO 38 April 2004
Table 33 Fathers Education Level Differences for Matched Sample for the Class of 2002 (2001 PSSA 11th Grade and 2002 SAT)
Subject Measure lt High School
High School
Some College
BABS Degree
Graduate Degree
Mean 128908 135041 138368 144843 150072
Math SD N
18443 2850
18251 17616
18721 14573
19645 12461
20736 7835
PSSA Effect Size Mean 129571
-0334 135453
-0509 137985
-0836 142352
-1079 145994
Reading SD N
18191 2289
17066 17558
17291 14539
16798 12454
16661 7838
Effect Size -0333 -0474 -0730 -0942 Mean 43958 47510 49626 53651 56759
Math SD N
10229 2915
992617845
10116 14800
10368 12636
10727 7980
SAT Effect Size Mean 43245
-0352 47058
-0557 49210
-0941 52830
-122 56114
Verbal SD N
97782915
921217845
947514800
9571 12636
10128 7980
Effect Size -0401 -0620 -0991 -1293 Mean 3136 3247 3301 3432 3548 SD 0637 0634 0633 0618 0594 GPA N 2784 17269 14263 12198 7723
Effect Size -0175 -0260 -0472 -0669
Table 34 Fathers Education Level Differences for Matched Sample for the Class of 2003 (2002 PSSA 11th Grade and 2003 SAT)
lt High High Some BABS GraduateSubject Measure School School College Degree Degree Mean 131197 136533 140022 147183 152503 SD 19107 18733 19163 20247 22047 Math N 2766 16981 14422 11633 7272
Effect Size -0282 -0461 -0812 -1033PSSA Mean 130955 137222 140037 144765 148752 SD 17715 15901 15980 15990 16014 Reading N 2761 16968 14412 11629 7265
Effect Size -0372 -0538 -0818 -1054 Mean 44505 47569 49772 53911 57115
Math SD N
10230 2803
9938 17087
10023 14508
10352 11709
11009 7314
SAT Effect Size Mean 43701
-0304 47224
-0520 49499
-0914 52920
-1187 56296
Verbal SD N
9887 2803
919517087
931014508
9580 11709
10294 7314
Effect Size -0369 -0604 -0947 -1248 Mean 3139 3272 3316 3454 3558
GPA SD N
0639 2696
0624 16545
0632 14014
0606 11281
0582 7046
Effect Size -0211 -0279 -0506 -0686
HumRRO 39 April 2004
Limited English Proficiency Differences
Students identified as having limited English proficiency (LEP) would be expected to have more difficulty taking a test in English than those not identified As a result of these difficulties LEP students would be expected to have lower scores than non-LEP students Table 36 shows the mean standard deviation number of students and the effect size for the entire state on the PSSA in 2001 and 2002 As expected LEP students have lower scores than non-LEP students on both components and effect sizes are generally large However the math component effect size is only about half of the effect size for reading
Table 35 Limited English Proficiency Differences for 11th Grade PSSA (Unmatched State Data) Limited EffectMean Scale Standard NumberYear Subject English Size Score Deviation of CasesProficiency d
Yes 115312 18977 492Math No 130476 22047 115645 07372001 Yes 106216 15338 473Reading No 129784 21727 115093 1253 Yes 116560 20254 844Math No 131550 22812 122706 06952002 Yes 102618 16138 840Reading No 131483 21413 122394 1522
Table 36 and Table 37 show the mean standard deviation number of cases and effect size for the matched sample of students in the Classes of 2002 and 2003 The effect sizes are similar to those in the state sample for the PSSA and SATmdashvery larger in verbalreading and medium in math The effect size is slightly larger for PSSA than SAT in math but slightly smaller for PSSA than SAT in readingverbal However the GPA for LEP students is actually slightly higher than the GPA for non-LEP students
Table 36 Limited English Proficiency Differences for Matched Sample for the Class of 2002 (2001 PSSA 11th Grade and 2002 SAT)
LimitedPerformance Standard Number Effect Size Subject English Mean ScoreMeasure Deviation of Cases dProficiency Yes 125974 19661 134Math No 139310 20070 68055 0671PSSA Yes 113745 14649 132Reading No 138297 17876 67907 1502 Yes 42860 13045 136Math No 50282 10934 69189 0617SAT Yes 33353 9807 136Verbal No 49764 10241 69189 1637 Yes 3393 0617 111GPA No 3328 0637 60172 -0104
HumRRO 40 April 2004
Table 37 Limited English Proficiency Differences for Matched Sample for the Class of 2003 (2002 PSSA 11th Grade and 2003 SAT)
LimitedPerformance Mean Standard Number Effect Size Subject EnglishMeasure Score Deviation of Cases dProficiency Yes 126815 20257 289Mathematics No 141539 20607 70692 0721PSSA Yes 109386 15855 288Reading No 140757 16741 70638 1924 Yes 41564 12159 291Mathematics No 50641 10887 71220 0787SAT Yes 32526 8775 291Verbal No 50105 10126 71220 1855 Yes 3358 585 226GPA No 3348 629 59032 -0008
The regression analyses results (Table 38 and Table 39) show that there are negligible changes in R square for predicting PSSA from SAT scores when adding LEP to the equation for both reading and math for both classes
Table 38 Regressions Results Showing the Adjusted Strength of Being Limited English Proficient on Predicting 2001 PSSA 11th Grade Scale Scores Based on 2002 SAT Scores
Standardized Coefficient Change in R2
SAT Limited English due toPSSA Component R2 Control Proficiency Limited English
Proficiency Reading 0704 0495 Reading 0703 -0011 0495 0000
Math 0846 0715 Math 0845 -0004 0715 0000
Table 39 Regressions Results Showing the Adjusted Strength of Being Limited English Proficient on Predicting 2002 PSSA 11th Grade Scale Scores Based on 2003 SAT Scores
Standardized Coefficient Change in R2
PSSA Component SAT Control
Limited English Proficiency R2 due to
Limited English Proficiency
Reading 0775 0601 Reading 0771 -0033 0602 +0001
Math 0865 0749 Math 0865 0000 0749 0000
HumRRO 41 April 2004
School-Level Scores Means were calculated by school for all scale scores and grade indicators to analyze
school-level results School-level descriptive statistics are presented for the Classes of 2002 and 2003 for the PSSA (Table 40) SAT (Table 41) and GPA and course grades (Table 42) Only schools with at least 10 students with merged PSSA and SAT scores are included in the analyses School-level means showed an increase on both tests both test components GPA and course grades from the Class of 2002 to the Class of 2003 The change in scoring procedures from the 2001 PSSA to the 2002 PSSA (instituting a minimum score of 700 for the 2002 PSSA) is problematic However there were only 9 students in this college-bound sample in the Class of 2003 who scored a 700 on the 2002 PSSA reading component and no students who scored a 700 on the math component The change in course grades was extremely small
Table 40 PSSA School-Level Descriptive Statistics for the Classes of 2002 and 2003 Subject Measure Class of 2002 Class of 2003 Reading Mean 136973 139316
SD 7435 7088 N 586 586
Math Mean 136966 139333 SD 8335 8496
N 586 586 Limited to schools with at least 10 students with merged PSSA and SAT scores
Table 41 SAT School-Level Descriptive Statistics for the Classes of 2002 and 2003 Subject Measure Class of 2002 Class of 2003 Verbal Mean 48578 48907
SD 4207 4251 N 586 586
Math Mean 48847 49159 SD 4500 4601
N 586 586 Limited to schools with at least 10 students with merged PSSA and SAT scores
HumRRO 42 April 2004
Table 42 School-Level Descriptive Statistics GPA and Course Grades for the Classes of 2002 and 2003
Subject Measure Class of 2002 Class of 2003 GPA Mean 334 346
SD 019 019 N 586 586
English Mean SD
329 020
331 021
N 586 586 Math Mean 311 312
SD 021 022 N 586 586
Limited to schools with at least 10 students with merged PSSA and SAT scores
Average Within-Year School-Level Correlations
Table 43 and Table 44 present correlations among these school-level scores Table 45 presents correlations for the average across the two years4 As Hoffman (1998) pointed out there is a tendency for correlations among school scores to be higher than correlations among student-level scores (Class of 2002 - Table 8 Class of 2003 - Table 9 and average for the Classes of 2002 and 2003 - Table 10) This is the case except for those correlations involving GPA and course-grades (except for PSSA reading to math course grade and GPA to English course grade where school-level correlations are higher)
As Hoffman (1998) pointed out the lower school-level correlations for GPA suggests that grading scales are not equivalent across schools There is a tendency for different schools to grade differently As a result at the school level of analysis there is a weaker relationship between GPA and either PSSA or ACT scores When studentsrsquo scores are averaged at the school level observed differences are related not only to differing levels of student achievement but to the particular schoolrsquos grading practices However the school-level relationship between GPA and course grades remains strong for both PSSA and SAT
4 Average correlations were technically corrected with Fisherrsquos r to z transformations
HumRRO 43 April 2004
Table 43 School-Level PSSA SAT and Course Grade Correlations for the Class of 2002 PSSA SAT Course Grades
Variable Reading Math Verbal Math GPA (Total) English Math
ReadingPSSA
Math
1000
0861 1000
Verbal SAT
Math
0818 0883
0773 0935
1000
0941 1000
GPA
English Course
Grades Math
0413 0393
0411 0391
0423 0454
0371 0376
0359 0362
0416 0450
1000
0778 1000
0719 0542 1000 Limited to schools with at least 10 students with merged PSSA and SAT scores
Table 44 School-Level PSSA SAT and Course Grades Correlations for the Class of 2003 PSSA SAT Course Grades
Variable Reading Math Verbal Math GPA (Total) English Math
ReadingPSSA
Math
1000
0870 1000
Verbal SAT
Math
0905 0849
0868 0915
1000
0943 1000
GPA
English Course
Grades Math
0491 0443
0442 0394
0501 0489
0439 0425
0402 0394
0484 0486
1000
0780 1000
0784 0615 1000 Limited to schools with at least 10 students with merged PSSA and SAT scores
HumRRO 44 April 2004
Table 45 School-Level PSSA SAT and Course Grades Correlation Averages for the Class of 2002 and 2003
PSSA SAT Course Grades
Variable Reading Math Verbal Math GPA (Total) English Math
ReadingPSSA
Math
1000
0866 1000
Verbal SAT
Math
0868 0867
0826 0926
1000
0942 1000
GPA
English Course
Grades Math
0453 0418
0427 0393
0463 0472
0406 0401
0381 0378
0451 0468
1000
0779 1000
0753 0580 1000 Limited to schools with at least 10 students with merged PSSA and SAT scores
Table 46 shows that the mean school-level scores for both PSSA 11th grade reading and SAT verbal components of each assessment increased from the Class of 2002 to the Class of 2003 For the SAT the mean school-level change on the verbal component was +330 scale score points For the PSSA the mean school-level scale score change on the 11th grade reading component was +2343 scale score points Table 47 shows the fairly strong relationship between the differences in mean school-level scores on the SAT verbal component and the PSSA reading component for the Classes of 2002 and 2003 This relationship is graphically portrayed in Figure 17 Table 48 Table 49 and Figure 18 show the same information for the math components of the PSSA and SAT As would be expected the relationship between the math components is stronger than for the readingverbal components
Table 46 Difference in Mean School-Level SAT Verbal and PSSA Reading Scores From the Classes of 2002 and 2003
Difference in Mean School-Level Score From the Standard Number ofMeanClass of 2002 and Class of 2003 Deviation Schools SAT Verbal +330 1673 586
PSSA Reading +2343 4660 586 Limited to schools with at least 10 students with merged PSSA and SAT scores
Table 47 Correlation of Difference in School-Level Mean SAT Verbal Score and PSSA Reading Score Between the Classes of 2002 and 2003
Difference in Mean School-Level Score From the SAT PSSA Class of 2002 and Class of 2003 Verbal Reading
SAT Verbal 1
PSSA Reading 462 1
HumRRO 45 April 2004
-200 -100 0 100 200
Difference in School-Level PSSA Reading Mean Score between the Class of 2002 and Class of 2003
-100
-50
0
50
100
Diff
eren
ce in
Sch
ool-L
evel
SA
T V
erba
l Mea
n Sc
ore
betw
een
Cla
ss o
f 200
2 an
d C
lass
of 2
003
$
$$
$
$
$
$$
$
$$
$
$
$
$
$
$
$
$$
$
$
$
$
$
$
$
$
$
$
$
$
$
$$
$
$
$
$
$
$
$
$
$
$ $
$$
$
$
$
$
$
$
$
$$
$
$$
$ $
$$$ $$
$
$
$
$
$
$
$
$
$
$
$
$
$
$$
$
$
$
$$
$$
$$$
$
$$
$
$
$$
$$
$
$
$
$
$
$
$
$
$
$$$
$$$
$
$
$
$
$
$$
$$
$
$$
$
$
$
$
$
$
$
$
$
$
$
$
$
$
$
$
$
$ $
$$
$
$$$ $$
$
$$$
$$
$
$
$
$
$
$
$
$$
$$
$
$
$
$
$
$
$
$
$
$$
$$
$
$$
$
$
$$
$
$
$
$$
$
$$
$
$$
$
$
$
$
$
$
$
$
$
$
$$
$
$$
$$
$
$$$$
$$
$$
$
$$
$
$
$
$
$$
$
$
$
$$
$
$ $$$
$
$ $$
$
$
$
$$
$
$$
$
$
$
$ $$$
$$
$$
$
$ $
$
$
$$
$
$
$
$
$
$
$$
$
$
$ $
$
$
$
$
$$
$
$
$$
$
$
$
$ $$
$
$
$ $
$$
$
$
$
$
$
$
$
$
$
$
$$
$
$
$$ $
$
$
$
$$
$
$
$$ $
$
$
$
$
$
$
$
$
$
$
$
$
$ $
$
$$
$
$$
$
$
$
$
$
$$
$
$
$
$
$
$
$
$
$$
$
$$
$
$
$$$ $
$
$
$$
$$
$
$$
$
$
$ $$ $
$ $
$$
$
$
$$$$
$
$$$
$
$$
$
$
$
$ $
$
$
$
$
$ $$
$
$
$
$
$
$ $
$ $ $
$
$
$
$
$$
$
$
$
$
$
$
$
$ $
$
$$
$
$$ $
$
$
$
$
$
$
$
$ $
$$
$
$
$
$
$
$
$
$$
$
$$
$
$
$
$
$$
$
$
$
$$
$$
$
$
$ $$$
$
$
$
$
$
$
$$$$
$
$$
$
$
$$
$
$$
$
$
$
$$$
$
$$
$
$
$
$
$$
$$
$
$
$
$$
$
$$
$$
$$
$
$
$
$
$$
$
$
$
$$
$
$
$
$
$
$$
$
$
$
$
$$
$
$
$
$
$
$
$$
$$
Figure 17 Scatterplot of difference in school-level SAT verbal mean scores and school-level PSSA 11th grade reading mean scores between the Class of 2002 and Class of 2003
Table 48 Difference in Mean School-Level SAT Math and PSSA Math Scores From the Class of 2002 and Class of 2003
Difference in Mean School-Level Math Score From the Class of 2002 and Class of 2003 Mean Standard
Deviation Number of
Schools
SAT +313 1842 586
PSSA +2367 4687 586 Limited to schools with at least 10 students with merged PSSA and SAT scores
HumRRO 46 April 2004
Table 49 Correlation of Difference in School-Level Mean SAT Math Score and PSSA Math Score Between the Classes of 2002 and 2003
Difference in Mean School-Level Math Score From the Class of 2002 and Class of 2003 SAT PSSA
SAT 1
PSSA 644 1
-200 -100 0 100 200
Difference in School-Level PSSA Math Mean Scale Score between the Class of 2002 and Class of 2003
-100
-50
0
50
100
Diff
eren
ce i
n Sc
hool
-Lev
el S
AT
Mat
h M
ean
Scor
e
betw
e en
the
Clas
s of
200
2 an
d Cl
ass
of 2
003
$
$$ $
$
$$
$
$$
$
$
$$
$
$
$$ $$
$
$
$
$
$
$
$
$
$$$
$
$
$$$
$
$
$
$
$
$
$$
$
$
$
$
$
$
$
$
$$$ $
$
$$
$
$
$
$
$$ $$
$$
$
$
$
$
$
$
$
$$
$
$$
$
$$
$
$
$
$
$ $$$
$
$
$
$
$
$
$
$$
$
$
$
$$
$
$
$
$
$
$ $
$$
$
$
$
$$
$
$$
$
$
$
$
$
$
$
$
$
$$
$
$$
$$
$
$
$
$
$
$$
$
$
$$
$
$
$
$$
$
$
$
$
$
$
$
$
$
$
$
$
$
$
$
$
$$
$
$
$$ $
$
$
$
$
$$
$
$
$
$
$
$
$
$
$
$
$
$
$
$
$
$
$
$
$$
$
$
$
$
$
$
$
$
$
$
$$
$
$
$
$
$$$
$
$
$
$
$
$
$ $$
$
$
$
$
$$
$
$
$
$
$
$$$
$
$
$$$
$
$
$
$
$$
$
$
$$
$
$
$$$
$
$
$
$
$
$
$$$
$
$
$
$
$$
$
$
$
$
$
$
$
$ $
$
$
$
$
$
$
$
$
$
$
$
$
$
$
$
$
$
$
$
$
$
$$$$
$$
$$
$
$$$
$$
$
$$
$
$
$
$
$
$
$
$$
$
$$
$
$
$
$
$
$$
$
$
$
$
$
$$
$
$$
$
$
$$
$
$
$
$
$
$
$
$
$
$
$ $
$
$
$
$
$$
$
$$$ $
$
$
$
$
$
$ $
$$
$
$$
$
$
$$
$ $
$$
$
$
$
$
$
$
$
$
$
$
$
$$
$
$
$
$
$
$
$
$ $
$$
$
$
$
$
$$ $
$
$$
$
$$
$$
$
$
$
$
$
$
$
$
$
$
$$
$
$$
$
$
$$
$
$
$
$
$$
$$
$$$
$$
$
$
$
$$
$
$$
$
$$
$
$
$
$
$
$
$
$
$
$
$
$
$ $$
$
$
$
$
$$
$
$
$
$$
$
$
$
$
$$
$
$$$$
$
$
$
$$$ $
$
$$
$
$
$
$
$
$$
$
$
$$
$$
$ $ $
$
$
$
$
$$
$
$$
$$
$
$
$
$$
$
$
$
$$
$
$
$
$
$
$
$
$$
$
$
$$
$
$
$
Figure 18 Scatterplot of differences in school-level mean SAT math score and school-level mean PSSA math scores between the Classes of 2002 and 2003
Pooled Within-School Correlations
The above discussion alluded to school-level factors such as differences in grading practices which may be impacting observed correlations Figure 19 depicts an extreme version of such a situation Schools A B and C are clearly different in where their students lie with respect to PSSA or SAT scores but they are identical in terms of the grades their students
HumRRO 47 April 2004
receive Also within each school there is a relationship between grades and either PSSA scores or SAT scores However if a correlation were calculated using students from all schools without regard to school-level characteristics it would be zero
School A
School B PSSA or SAT Scores
School C
Grade Point Average (GPA)
Figure 19 Extreme hypothetical illustration of how mean differences among schools on PSSA or SAT scores that are not mirrored by differences in GPA can impact correlations (Ellipses represent students scores within each school)
Pooled within-school correlations are used to estimate relationships between measures calculated within schools and then averaged across all schools These pooled within-school correlations were calculated for each of the two years of data (Table 50 for the Class of 2002 and Table 51 for the Class of 2003) and then averaged across the two years (Table 52)5 The resulting average pooled within-school correlations are presented in Table 52
5 Again the technical r to z correction was used
HumRRO 48 April 2004
Table 50 Pooled Within-School Correlation for the Class of 2002 PSSA SAT Course Grades
Variable Reading Math Verbal Math GPA (Total) English Math
ReadingPSSA
Math
1000
0648 1000
Verbal SAT
Math
0693 0650
0569 0832
1000
0695 1000
GPA
English Course
Grades Math
0528 0573
0461 0412
0361 0542
0516 0559
0465 0402
0349 0541
1000
0703 1000
0668 0443 1000 Limited to schools with at least 10 students with merged PSSA and SAT scores
Table 51 Pooled Within-School Correlation for the Class of 2003 PSSA SAT Course Grades
Variable Reading Math Verbal Math GPA (Total) English Math
ReadingPSSA
Math
1000
0702 1000
Verbal SAT
Math
0757 0629
0666 0857
1000
0662 1000
GPA
English Course
Grades Math
0512 0564
0457 0405
0350 0541
0534 0679
0466 0414
0369 0548
1000
0698 1000
0667 0443 1000 Limited to schools with at least 10 students with merged PSSA and SAT scores
HumRRO 49 April 2004
Table 52 Pooled Within-School Correlation Averaged for Classes of 2002 and 2003 PSSA SAT Course Grades
Variable Reading Math Verbal Math GPA (Total) English Math
ReadingPSSA
Math
1000
0676 1000
Verbal SAT
Math
0727 0640
0620 0845
1000
0679 1000
GPA
English Course
Grades Math
0520 0569
0459 0409
0356 0542
0525 0569
0466 0408
0359 0546
1000
0701 1000
0668 0443 1000 Limited to schools with at least 10 students with merged PSSA and SAT scores
If differences between schoolsrsquo grading procedures are substantial and if within schools students with higher grades also have higher PSSA scores then the correlations in Table 52 will be higher than student correlations in Table 10 (student-level correlations averaged for the Classes of 2002 and 2003) The difference between the GPA correlations in Table 10 and Table 52 however are only marginally different (see Table 53) In nearly all cases the within-school correlations are higher However the range is relatively smallmdash0009 to 0039 for GPA 0176 to 0219 for English course grades and 0147 to 0237 for math course grades Thus grading differences among schools do appear to exist but the effect is small for studentsrsquo GPA but larger for both English and math course grades especially when compared to the matching assessment component (ie English course grade to PSSA reading and SAT verbal math course grade to PSSA math and SAT math)
HumRRO 50 April 2004
Table 53 Differences Between Student-Level Correlations and Pooled Within-School Correlations Averaged for the Classes of 2002 and 2003
GPA or Course Grade to Student-Level Pooled Within- Difference in Assessment Correlations School Correlations Correlations
GPA to PSSA Reading 0511 0520 0009
GPA to PSSA Math 0546 0569 0023
GPA to SAT Verbal 0494 0525 0031
GPA to SAT Math 0530 0569 0039
English to PSSA Reading 0240 0459 0219
English to PSSA Math 0226 0409 0183
English to SAT Verbal 0256 0466 0210
English to SAT Math 0232 0408 0176
Math to PSSA Reading 0202 0356 0154
Math to PSSA Math 0305 0542 0237
Math to SAT Verbal 0212 0359 0147
Math to SAT Math 0313 0546 0233
Comparison of the correlations in Table 52 to Table 10 can also be used to test a hypothesis about the relationship between PSSA and SAT performance It is suggested above that some schools might be working more successfully toward improving PSSA performance than others Again if these efforts are only tangentially affecting SAT scores then we might expect mean differences among schools on PSSA scores that are not mirrored by differences on SAT Within schools however we can still expect students who do better on PSSA to also have a tendency to do better on SAT Figure 20 provides an extreme illustration of this potential effect Comparing correlations between PSSA and SAT from Table 52 to Table 10 reveals no such trend (see Table 54) The differences are all small (-0020 to +0009) suggesting that there are no significant differences among schools in the average PSSA scores of their students that are not mirrored by differences in studentsrsquo SAT scores This conclusion is consistent with the earlier conclusion from the individual level data That is no strong methodological differences in skills requirements are evidenced
HumRRO 51 April 2004
SAT Scores
School A School B School C
PSSA Scale Scores
Figure 20 Extreme hypothetical illustration of how mean differences among schools on PSSA scores that are not mirrored by differences on SAT scores can impact correlations (Ellipses represent students scores within each school)
Table 54 Differences Between SAT and PSSA Components for Student-Level Correlations and Pooled Within-School Correlations Averaged for the Classes of 2002 and 2003
GPA or Course Grade to Student-Level Pooled Within- Difference in Assessment Correlations School Correlations Correlations
PSSA Reading to SAT Verbal 0742 0727 -0015
PSSA Reading to SAT Math 0690 0640 -0020
PSSA Math to SAT Verbal 0629 0620 +0009
PSSA Math to SAT Math 0856 0845 -0009
A third comparison can also be made with the pooled within-school correlations This concerns the intercorrelations within each assessment format The pooled within-school PSSA intercorrelation (Table 52) shows a very slight decrease from student-level PSSA correlations (Table 10) while the pooled within-school SAT intercorrelation (Table 52) shows a larger increase from the student-level SAT intercorrelations (Table 10) It is possible that this is due to an increased homogeneity for the pooled within-school results However Figure 21 presents an exaggerated illustration of another manner in which this difference might be obtained This pattern would yield higher correlations for all students than for students within a school and a higher correlation of school-level scores (school-level PSSA intercorrelation is 0866 school-level SAT intercorrelation is 0942 [both from Table 45]) than for student-level scores (student-level PSSA is 0686 student-level SAT intercorrelation is 0737 [both from Table 10]) Although small (see Table 55) this is the pattern of differences in correlations obtained for both PSSA intercorrelations and for SAT intercorrelations Note that the difference between the PSSA components is smaller than the difference between the SAT components The obtained pattern
HumRRO 52 April 2004
like that in Figure 21 but much less exaggerated could result from differences between schools in the population of their students from differences in instruction that impact PSSA and SAT test scores or both
Content
Area B School A
School B
School C
Content Area A
Figure 21 Exaggerated illustration of how mean differences among schools can increase overall correlations (Ellipses represent students scores within each school)
Table 55 Internal Differences between SAT and PSSA Components for Student-Level Correlations and Pooled Within-School Correlations Averaged for the Classes of 2002 and 2003
GPA or Course Grade to Student-Level Pooled With- Difference in Assessment Correlations School Correlations Correlations
PSSA Reading to PSSA Math 0686 0676 -0010
SAT Verbal to SAT Math 0737 0845 0108
Summary and Conclusion The purpose of this report is to explore the validity questions ldquoAre PSSA scores
appropriately related to other measures of educational achievementrdquo
The data presented in this report suggest the following main points
bull Students who do well on any of the assessments tend to do well on all of the assessmentsmdashPSSA SAT GPA or course grades
bull When schoolsrsquo means are calculated using only the SAT-taking population of students schools with high scores on SAT also have high PSSA scores GPA and course grades are also related to both PSSA and SAT although not as strongly as the relationship between the PSSA and SAT
HumRRO 53 April 2004
PSSA exhibits strong convergent validity coefficients Correlations are very high between PSSA and SAT PSSA is positively correlated with other measures of student achievement including course grades and GPA Gains on PSSA are reflective of changes on SAT at the school level All these data provide strong evidence in support of PSSA as a valid measure of student achievement
There are however a few clarifications and qualifications to these general conclusions but none that diminish the basic findings These clarifications and qualifications include the following
Changes in scores Both mean PSSA and SAT scores experienced an increase Changes between the two assessments are positively correlated Schools that have gained on one assessment tend to have also gained on the other assessment However the same relationship is also true for those schools that have decreased
PSSA and SAT are tied to different content domains use differently formatted items and were designed to serve very different purposes However it is clear from the data that students who tend to perform well on the PSSA can also be expected to perform well on the SAT and vice-versa It is clear from the data that schools that perform well on one test can be expected to perform well on the other It is also clear that schools that improve on one test can be expected to improve on the other
Discriminant validity At the student level and the school level the different assessments of mathematics achievement are more highly related to each other than to assessments of other subjects Students with high mathematics scores on one assessment will tend to do well on all other assessments but that tendency is most pronounced for other mathematics assessments The same holds for school scores There is a similar differentiation on readingverbal assessments at both the student and school level but not as pronounced as in mathematics
GPA shows positive relationships with both PSSA and SAT assessments at the student and school level but not as pronounced as the relationship between the two assessments This is interpreted as being due to differences in schoolsrsquo grading practices Grading practices apparently differ sufficiently to reduce school-level associations with PSSA and SAT scores
Neither gender race socioeconomic status nor limited English proficiency appear to influence the PSSA scores any more than would be expected based on observed differences for SAT scores In other words PSSA items are not injecting any unexpected gender racialethnic socioeconomic status or limited English proficiency bias
HumRRO 54 April 2004
References
Camara WJ amp Schmidt AE (1999) Group differences in standardized testing and social stratification (College Board Report No 99-5) New York College Entrance Examination Board
Campbell D T amp Fiske D W (1959) Convergent and discriminant validation by the multitrait-multimethod matrix Psychological Bulletin 56(2) 81-105
Cassady JC (2001) Self-reported GPA and SAT A Methodological Note Practical Assessment Research amp Evaluation 7(12)
Coe Robert (2002) Itrsquos the effect size stupid What effect size is and why itrsquos important Paper presented at the Annual Conference of the British Educational Research Association University of Exeter England Retrieved from httpwwwleedsacukeducoldocuments00002182htm
Cohen J (1988) Statistical power analysis for the behavioral sciences (2nd ed) Hillsdale NJ Erlbaum
Hoffman R G (1998) Relationships among Kentuckyrsquos open-response assessments ACT scores and studentsrsquo self-reported high school grades (HumRRO Report FR-WATSD-98-27) Radcliff KY Human Resources Research Organization
Lewis DM Mitzel HC amp Green DR (1996) Standard setting A bookmark approach Symposium presented at the Council of Chief State School Officers Conference on Large ndashScale Assessment Phoenix AZ
Livingston SA amp Zieky MJ (1978) Manual for setting standards on the Basic Skills Assessment Test Princeton NJ Educational Testing Service
Mead R amp Melby K (2003 February) Technical analysis Pennsylvania System of School Assessment 2003 reading and mathematics PSSA Data Recognition Corporation
Mead R amp Melby K (2002 April) Technical analysis Pennsylvania System of School Assessment 2001 reading and mathematics PSSA Data Recognition Corporation
Mead R Smith RM amp Swanlund A (2003) Technical analysis 2003 Pennsylvania System of School Assessment mathematics and reading Data Recognition Corporation
NCLB (2004) httpwwwedgovnclblandingjtml
Sicoly Fiore (2002) What do school-level scores from large-scale assessments really measure Educational Measurement Issues and Practice 21(4) 17-26
Terenzini PT Cabrera AF amp Bernal EM (2001) Swimming against the tide The poor in American higher education (Research Report No 2001-1) New York College Entrance Examination Board
Willingham WW amp Cole NS (1997) Gender and Fair Assessment Hillsdale NJ Erlbaum
HumRRO 55 April 2004
HumRROKDE April 2003

Outliers are hidden Extreme values are hidden
10 13 17 20 23 27 30 33 37 40 43 Student-reported GPA (4-point scale) on the 2003 SAT Student Descriptive Questionnaire (SDQ)
800
1000
1200
1400
1600
1800
2000
2002
PSS
A 1
1th
Gra
de R
eadi
ng S
cale
Sco
re
n=3304
n=10358
n=5089
n=11480
n=11507
n=9773
n=4602
n=2084 n=97 n=496 n=27
Advanced
Proficient
Basic
Below Basic
Figure 14 Student-level relationship between 2002 PSSA 11th Grade reading scale score and student-reported grade-point average (GPA) from the SATrsquos Student Descriptive Questionnaire (SDQ) for the Class of 2003
HumRRO 24 April 2004
Outliers are hidden Extreme values are hidden
10 13 17 20 23 27 30 33 37 40 43 Student-reported GPA (4-point scale) on the 2002 SAT Student Descriptive Questionnaire (SDQ)
800
1000
1200
1400
1600
1800
2000
2001
PSS
A 1
1th
Gra
de M
ath
Scal
e Sc
ore
n=10280
n=5391 n=11831
n=11123 n=9672
n=4635
n=2393 n=3377
n=526 n=42
n=97
Advanced
Proficient
Basic
Below Basic
Figure 15 Student-level relationship between 2001 PSSA 11th grade math scale score and student-reported grade-point average (GPA) from the SATrsquos Student Descriptive Questionnaire (SDQ) for the Class of 2002
HumRRO 25 April 2004
Outliers are hidden Extreme values are hidden
10 13 17 20 23 27 30 33 37 40 43 Student-reported GPA (4-point scale) on the 2003 SAT Student Descriptive Questionnaire (SDQ)
800
1000
1200
1400
1600
1800
2000
2002
PSS
A 1
1th
Gra
de M
ath
Scal
e Sc
ore
n=3319
n=10364
n=5091
n=11480
n=11514
n=9777
n=4600
n=2085 n=98
n=496
n=27
Advanced
Proficient
Basic
Below Basic
Figure 16 Student-level relationship between 2001 PSSA 11th grade math scale score and student-reported grade-point average (GPA) from the SATrsquos Student Descriptive Questionnaire (SDQ) for the class of 2002
HumRRO 26 April 2004
Differences in Performance for Demographic Groupings
Analyses were conducted to compare performance on the PSSA and SAT among students from varying backgrounds Average test performance tends to differ for students of differing genders ethnic groups and various measures associated with socioeconomic status The important question for judging bias on the PSSA is not whether specific groups show mean differences but whether those differences are larger for the PSSA than the differences observed on other measures of student achievement
Differences between measures of achievement can be captured in several ways This report will present two measures of mean differences First effect size statistics will be calculated for the differences between major categories of students (Coe 2002) The magnitude of the effect size statistics is less important than the difference between the effect sizes for PSSA compared to the other measures However measuring the magnitude of the gaps for NCLB-defined groups is instructive and important since all states are expected to make progress toward closing those gaps (No Child Left Behind 2004)
Effect size statistics can be interpreted as the average percentile standing of the average treated (or experimental) participant relative to the average untreated (or control) participant An effect size of 00 indicates that the mean of the treated group is at the 50th percentile of the control group An effect size of 08 indicates that the mean of the treated group is at the 79th
percentile of the control group An effect size of 17 indicates that the mean of the treated group is at the 955th percentile of the control group Cohen (1988) hesitantly defined effect sizes as ldquosmall d=2rdquo ldquomedium d=5rdquo and ldquolarge d=8rdquo He went on to caution against offering conventional operational definitions such as these in the diverse field of behavioral science
The second measure used to capture differences between measures of achievement was regression analysis Regression analysis was used to examine the extent to which PSSA differences in performance for various demographic groupings are similar to those found in SAT scores For each of the demographic groupings we calculated a regression equation to predict PSSA scores based on the matching SAT content score A second equation was created which added the specific demographic characteristic of interest If PSSA scores exhibit greater differences based on that demographic characteristic that characteristic will have a significant weight and there will be a meaningful increase in the prediction of the PSSA component score
Gender Differences
Table 12 presents performance means for males and females for the PSSA only This table provides information from the larger state population to use in comparison with the matched PSSA and SAT sample data The SAT-taking population can be expected to post higher means For all gender tables data is coded such that positive numbers indicate higher mean scores for males negative numbers indicate higher mean scores for females For the full population of PSSA takers the pattern of performance between males and females is consistent Males outscore females but only to a very small degree on the PSSA mathematics test for all three included years Females outscored males to a higher but still small degree on the PSSA reading test The differences between years are small and inconsistent This table shows that the gap in performance for both PSSA mathematics and reading between males and females is small and has not changed dramatically between 2001 and 2003
HumRRO 27 April 2004
Table 12 Gender Differences for PSSA (Unmatched State Data) Mean Scale Standard Number of Effect Size Year Subject Gender Score Deviation Cases d
Mathematics Male 130954 22870 56380
2001 Reading Female
Male Female
130288 127107 132719
21170 22731 20167
55496 56091 55280
0030
-0261 Mathematics Male 132475 23813 60777
2002 Reading Female
Male Female
130679 129478 133443
21694 22536 20034
59849 60686 59636
0079
-0186 Mathematics Male 132555 22198 63542
2003 Reading Female
Male 130434 129308
20680 24674
61849 63840
0099
Female 133974 22003 62020 -0200
Table 13 and Table 14 present data for the matched sample of students taking both PSSA and SAT by gender Scale scores for both assessments as well as studentsrsquo self-reported GPA are included in the tables The numbers of males versus females in the state student population is similar typically with a few more males than females per grade However many more females take the SAT tests suggesting that more females than males aspire to attend college Males outscored females by a small margin on the PSSA and the SAT mathematics tests This finding is consistent with scoring patterns on SAT and ACT reported by Willingham and Cole (1997) They suggest that as a rule females tend to avoid taking mathematics and science classes In an apparent inconsistency females outscored males on PSSA reading but not on SAT verbal Scores for SAT verbal were nearly identical for males and females Willingham and Cole found gender differences favoring females in writing skills The PSSArsquos performance-task items add a writing component that was not present in the SAT for the Classes of 2002 and 2003 However SAT will include a student-written essay beginning in spring 2005 This study found that females tended to have higher self-reported GPAs than males
Table 13 Gender Differences for Class of 2002 Matched Sample (2001 PSSA and 2002 SAT) Performance Standard Number of Effect SizeSubject Gender MeanMeasure Deviation Cases d
Mathematics Male 141925 20536 29403
PSSA Reading Female
Male Female
137503 137162 139420
19408 18761 16921
36530 29345 36451
0221
-0126 Mathematics Male 52273 11076 29787
SAT Verbal Female
Male 48821 50081
10527 10333
37042 29787
0319
Female 49582 10126 37042 0049
GPA Male Female
3243 3404
656
609 25323 32857 -0255
HumRRO 28 April 2004
Table 14 Gender Differences for Class of 2003 Matched Sample (2001 PSSA and 2002 SAT) Performance Mean Standard Number Effect Size Subject GenderMeasure Score Deviation of Cases d
Mathematics Male 145023 21049 31338
PSSA Reading Female
Male Female
138650 140570 140715
19790 17318 16427
38459 31328 38418
0312
-0009 Mathematics Male 52596 11067 31557
SAT Verbal Female
Male 48997 50524
10490 10235
38745 31557
0327
Female 49623 10097 38745 0089 Male 3265 653 25387GPA Female 3415 600 32925 -0239
Table 15 and Table 16 show regression results for adding gender as a predictor variable to the model for estimating PSSA scores based on SAT scores For both PSSA reading and math the regression weights for gender are negligible and the changes in R-square are essentially nonexistent Gender is coded such that the positive weight means that females tend to have higher reading and math scores than would be expected from gender differences in SAT verbal
Table 15 Regressions Results Showing the Adjusted Strength of Gender on Predicting 2001 PSSA 11th Grade Scale Scores Based on 2002 SAT Scores Standardized Coefficient
PSSA Component SAT Control Gender R2 Change in R2
due to Gender Reading 0704 0495 Reading 0706 +0081 0502 +0006 Math 0847 0717 Math 0851 +0025 0717 +0001
Table 16 Regressions Results Showing the Adjusted Strength of Gender on Predicting 2002 PSSA 11th Grade Scale Scores Based on 2003 SAT Scores Standardized Coefficient
PSSA Component SAT Control Gender R2 Change in R2
due to Gender Reading 0775 0601 Reading 0777 +0038 0602 +0001 Math 0865 0749 Math 0863 -0012 0749 0000
HumRRO 29 April 2004
Ethnic or Racial Differences
Table 17 presents performance means for the four major ethnic or racial groups3 (White Black HispanicLatino and Asian) for the PSSA only For these analyses the racialethnic categories reported with the PSSA data were used It should be noted that starting in 2003 the reported racialethnic categories were changed from those reported in 2001 and 2002 In 2003 the category of ldquoMixedrdquo was no longer included As a result those students previously selecting ldquoMixedrdquo were forced to select one of the other categories For the full population of PSSA takers the pattern of performance between these four groups is fairly consistent In mathematics Asians outscore all groups Whites outscore HispanicsLatinos and Blacks and HispanicsLatinos score between Blacks and Whites For Reading Asians and Whites score approximately the same and Blacks score almost one standard deviation lower than Whites However the score for HispanicsLatinos has shown a decrease over the three years of approximately 30 points This decrease has dropped the HispanicLatino group to below the mean Black group score The number of HispanicLatinos taking the PSSA has increased approximately 40 Blacks approximately 65 and Whites approximately 10 during that time as well
Table 17 EthnicRacial Differences for PSSA (Unmatched State Data) Hispanic Year Subject Measure White Black AsianLatino
2001
Mathematics
Reading
Mean SD
N Effect Size
Mean SD
N Effect Size
132481 21525 92185
131644 21066 91964
113596 17093 8274 0972
115158 20393 8117 0795
116757 18873 2954 0777
117025 21104 2924 0693
140820 24657 2489 -0360
132927 21707 2470 -0060
2002
Mathematics
Reading
Mean SD
N Effect Size
Mean SD
N Effect Size
133935 22098 97659
133917 20351 97428
114090 17626 10783 0993
114887 20070 10715 0942
116438 19041 3534 0848
116193 21155 3535 0854
143430 26757 2659 -0387
133711 22914 2655 0010
2003
Mathematics
Reading
Mean SD
N Effect Size
Mean SD
N
134059 20863
104064
134488 22411
104271
114619 16132 13669 1042
114796 21940 13871 0888
116389 17473 4106 0903
114052 22848 4158 0903
142013 23662 2865 -0357
134943 24743 2866 -0019
3 The racialethnic analyses were limited to these four groups because of the limited number of students in the other groups
HumRRO 30 April 2004
Table 18 and Table 19 present data for the matched sample of students taking both PSSA and SAT by ethnicity Scale scores for both assessments as well as studentsrsquo self-reported GPA are included in the tables In 2002 Asians (726) took the SAT tests at a much higher rate than any other group followed by Whites (608) Blacks (419) and HispanicsLatinos (364) The order remained the same in 2003 although all groups but Asians had a slightly lower percentage in 2002 than in 2003 This suggests that more Asians and Whites aspire to attend college than do Blacks or HispanicLatinos Scores on the PSSA SAT and GPA show the same order for the matched sample as for the total state sample for the PSSA Comparing the effect size for the PSSA versus the effect size for the SAT shows that the effect size for most groups in the Class of 2002 and components is approximately the same for the PSSA and the SAT The largest difference for Blacks is between the PSSA reading and the SAT verbal components (PSSA reading ndash 0883 and SAT verbal ndash 1011) Note also that the effect size for GPA is approximately half the effect size for the PSSA and SAT for Blacks and Hispanics However for Asians the GPA effect size is more similar to the effect size for math than it is for the SAT verbal or PSSA reading components
Table 18 EthnicRacial Differences for the Class of 2002 Matched Sample (2001 PSSA 11th
Grade and 2002 SAT) Performance Hispanic Subject Measure White Black AsianMeasure Latino
PSSA
Mathematics
Reading
Mean SD
N Effect Size
Mean SD
N Effect Size
140809 19272 56063
139658 17004 56017
120809 17759 3735 1079
123658 19180 3678 0883
128529 19483 1076 0634
129112 19199 1064 0582
146256 22812 1808 -0258
138040 19183 1807 0089
SAT
Mathematics
Verbal
Mean SD
N Effect Size
Mean SD
N Effect Size
51041 10409 56693
50476 9670
56693
40286 10268 3872 1040
40619 9836 3872 1011
44332 11082 1096 0624
44378 10964 1096 0590
54820 13077 1838 -0320 49547 13308 1838 0080
GPA
Mean SD
N Effect Size
3364 0621
49617
2940 0667 3337 0658
3126 0640 871
0377
3491 0615 1616 -0205
HumRRO 31 April 2004
Table 19 EthnicRacial Differences for the Class of 2003 for Matched Sample (2002 PSSA 11th
Grade and 2003 SAT) Performance HispanicSubject Measure White Black AsianMeasure Latino
Mean 142999 122766 129030 150221
Mathematics SD N
19659 59076
18097 4516
19834 1178
24869 1951
PSSA Effect Size Mean 142157
1071 125012
0707 129610
-0322 139776
Reading SD N
15746 59038
17622 4500
18763 1184
20264 1951
Effect Size 1026 0724 0131 Mean 51440 39999 43626 55739
Mathematics SD N
10295 59443
9997 4573
10967 1206
12831 1970
SAT Effect Size Mean 50834
1128 40568
0735 43851
-0370 50166
Verbal SD N
9539 59443
9913 4573
10745 1206
13163 1970
Effect Size 1055 0687 0058 Mean 3385 2933 3175 3538
GPA Mathematics SD N
0610 49511
0666 3799
0641 935
0595 1608
Effect Size 0708 0336 -0254
Table 20 through Table 23 show regression results for adding raceethnicity (White versus Black and White versus HispanicLatino) as a predictor variable to the model for estimating PSSA scores based on SAT scores For both PSSA reading and math the regression weights for raceethnicity are negligible and the changes in R-square are essentially nonexistent Raceethnicity is coded such that the negative weight means that Blacks or HispanicsLatinos tend to have lower reading and math scores than would be expected from ethnicity differences in SAT verbal
Table 20 Regressions Results Showing the Adjusted Strength of Being Black on Predicting 2001 PSSA 11th Grade Scale Scores Based on 2002 SAT Scores Standardized Coefficient
PSSA Component SAT
Control Black R2 Change in R2
due to being Black
Reading 0699 0489 Reading 0686 -0059 0493 +0003 Math 0843 0711 Math 0833 -043 0713 +0002
HumRRO 32 April 2004
Table 21 Regressions Results Showing the Adjusted Strength of Being Black on Predicting 2002 PSSA 11th Grade Scale Scores Based on 2003 SAT Scores Standardized Coefficient
PSSA Component SAT
Control Black R2 Change in R2
due to being Black
Reading 0769 0591 Reading 0750 -0068 0595 0004 Math 0863 0745 Math 0857 -0021 0746 0000
Table 22 Regressions Results Showing the Adjusted Strength of Being HispanicLatino on Predicting 2001 PSSA 11th Grade Scale Scores Based on 2002 SAT Scores Standardized Coefficient
PSSA Component SAT
Control HispanicLatino R2 Change in R2
due to being HispanicLatino
Reading 0687 0472 Reading 0685 -0026 0473 +0001 Math 0837 0700 Math 0836 -0014 0700 0000
Table 23 Regressions Results Showing the Adjusted Strength of Being HispanicLatino on Predicting 2002 PSSA 11th Grade Scale Scores Based on 2003 SAT Scores Standardized Coefficient
PSSA Component SAT
Control HispanicLatino R2 Change in R2
due to being HispanicLatino
Reading 0754 0568 Reading 0050 -0034 0569 +0001 Math 0857 0735 Math 0856 -0009 0735 0000
Economically Disadvantaged Differences
Table 24 presents performance means for those students identified as economically disadvantaged for the PSSA only This table provides information from the larger state population to use in comparison with the matched PSSA and SAT sample data The SAT-taking population can be expected to post higher means For the full population of PSSA takers the pattern of performance between males and females is consistent Noneconomically disadvantaged students outscore economically disadvantaged student to a large degree on all components and all years except 2001 when it was a medium degree The number of students identified more than doubled between 2001 and 2002 and increased an additional 40 in 2003
HumRRO 33 April 2004
Table 24 Differences for Economically Disadvantaged Students for PSSA (Unmatched State Data)
Year Subject Economically Disadvantaged
Mean Scale Score
Standard Deviation
Number of Cases
Effect Size d
2001 Mathematics
Reading
Yes No Yes No
118647 131377 118918 130564
18977 22014 21142 21570
8805 107332 8702
106864
0619
0545
2002 Mathematics
Reading
Yes No Yes No
116604 133857 116380 133704
18913 22497 20914 20617
17253 106297 17199 106035
0830
0834 Yes 118211 17997 24022Mathematics No 134575 21063 102919 08352003 Yes 116747 22817 24290Reading No 135050 22319 103137 0811
Table 25 Differences for Economically Disadvantaged Students for Matched Sample for the Class of 2002 (2001 PSSA 11th Grade and 2002 SAT)
Performance Economically Mean Standard Number Effect Measure Subject Disadvantaged Score Deviation of Cases Size
d
PSSA Mathematics
Reading
Yes No Yes No
130598 139668 131768 138535
18830 20044 18336 17829
2893 65296 2863 65176
0466
0374
SAT Mathematics
Verbal
Yes No Yes No
45185 50491 44694 49953
10399 10912 10131 10215
2926 66399 2926 66399
0498
0517
GPA Yes No
3195 3334
0661 0636
2561 57722 0214
HumRRO 34 April 2004
Table 26 Differences for Economically Disadvantaged Students for Matched Sample for the Class of 2003 (2002 PSSA 11th Grade and 2003 SAT) Performance
Measure Subject Economically Disadvantaged
Mean Score
Standard Deviation
Number of Cases
Effect Size d
PSSA Mathematics
Reading
Yes No Yes No
127741 142707 128169 141742
19474 20278 18498 16243
5822 65159 5812 65114
0753
0780
SAT Mathematics
Verbal
Yes No Yes No
42412 51341 42100 50748
10746 10616 10491 9845
5907 65604 5907 65604
0836
0850 Yes 3116 0680 4854GPA No 3369 0620 54404 0389
Table 27 Regressions Results Showing the Adjusted Strength of Being Economically Disadvantaged on Predicting 2001 PSSA 11th Grade Scale Scores Based on 2002 SAT Scores Standardized Coefficient
Change in R2
SAT Economically due to beingPSSA Component R2 Control Disadvantaged Economically
Disadvantaged Reading 0704 0495 Reading 0703 -0004 0495 0000 Math 0846 0715 Math 0845 -0009 0715 0000
Table 28 Regressions Results Showing the Adjusted Strength of Being Economically Disadvantaged on Predicting 2002 PSSA 11th Grade Scale Scores Based on 2003 SAT Scores Standardized Coefficient
SAT Change in R2
PSSA Component Control Economically Disadvantaged R2 due to being
Economically Disadvantaged
Reading 0775 0601 Reading 0765 -044 0602 0002 Math 0865 0749 Math 0864 -0005 0749 0000
Annual Family Income Differences
Camara and Schmidt (1999) point out that family income is related to performance on tests such as the SAT I They also point out that this finding is not unique to the SAT I or college admissions tests Terenzini Cabrera and Bernal (2001) also examined various differences in educational outcomes associated with varying levels of socioeconomic status (SES) This report
HumRRO 35 April 2004
examines differences associated with family income in this section The following section shows differences in student performance related to parental education level Terenzini Cabrera and Bernal (2001) and Camara and Schmidt (1999) point out differences between income wealth and SES
Because annual family income data comes from the SDQ of the SAT only matched student data can be presented showing relationships with family income Table 29 (Class of 2002) and Table 30 (Class of 2003) show student performance on the PSSA SAT and GPA versus four levels of family income As the table clearly shows student scores increase on all performance measures as income goes up However the effect size for GPA is about half of the effect size for either of the assessments The effect size for the PSSA is similar although slightly less than the effect size for the SAT for both components and both years
Table 29 Annual Family Income Differences for Matched Sample for the Class of 2002 (2001 PSSA 11th Grade and 2002 SAT)
Income Level Performance Subject MeasureMeasure $25000 to $40000 tolt $25000 gt $70000$40000 $70000
PSSA
Math
Reading
Mean SD
N Effect Size
Mean SD
N Effect Size
129900 19108 6658
131011 18466 6594
135381 18361 8709 -0293
136210 17165 8693 -0292
139702 18899 16365 -0516
138848 17110 16348 -0440
145045 20032 14902 -0774
142093 16921 14867 -0626
SAT
Math
Verbal
Mean SD
N Effect Size
Mean SD
N Effect Size
44665 10594 6822
44469 10177 6822
47766 10013 8856 -0301 47619 9546 8856 -0319
50272 10136 16549 -0541 49796 9485
16549 -0542
53816 10580 15122 -0864 52825 9815
15122 -0836
GPA
Mean SD
N Effect Size
3173 0656 6596
3262 0636 8607 -0138
3344 0631 16141 -0266
3412 0628
14726 -0372
HumRRO 36 April 2004
Table 30 Annual Family Income Differences for Matched Sample for the Class of 2003 (2002 PSSA 11th Grade and 2003 SAT)
Income Level Performance Subject MeasureMeasure $25000 - $40000 -lt $25000 gt $70000$40000 $70000
Mean 131577 136393 140924 147093
Math SD N
19401 6230
19051 7958
19319 14963
20560 14295
PSSA Effect Size Mean 132698
-0250 137311
-0483 140572
-0776 144569
Reading SD N
17576 6232
16201 7948
15919 14958
15965 14284
Effect Size -0273 -0470 -0707 Mean 44871 47689 50075 53965
Math SD N
10562 6304
10140 8010
10089 15045
10567 14388
SAT Effect Size Mean 44793
-0272 47581
-0504 49653
-0861 52905
Verbal SD N
10345 6304
9578 8010
9354 15045
9689 14388
Effect Size -0280 -0493 -0809 Mean 3188 3279 3357 3428
GPA SD N
0652 6115
0642 7832
0623 14659
0617 14000
Effect Size -0141 -0265 -0378
Parent Educational Differences
Camara and Schmidt (1999) also looked at the impact of parent education on student performance in standardized testing Their study showed that parental education is related to performance on the SAT I Higher parental education is associated with higher scores on the SAT I Table 31 and Table 32 show the means standard deviations number of students and effect size for various levels of student-reported motherrsquos education for the PSSA SAT and GPA The analyses indicate that the effect size for both assessments and GPA are larger as the motherrsquos educational level increases The effect size for PSSA is not as large as the effect size for SAT The effect size for GPA is about half of the effect size for PSSA or SAT Table 33 and Table 34 provide the same information regarding the fatherrsquos education level The results follow the same pattern as that for motherrsquos education level
HumRRO 37 April 2004
Table 31 Mothers Education Level Differences for Matched Sample for the Class of 2002 (2001 PSSA 11th Grade and 2002 SAT)
Subject Measure lt High School
High School
Some College
BABS Degree
Graduate Degree
Mean 128855 135908 138212 145789 148095
Math SD N
18785 2196
18542 18737
19161 16804
19982 12094
20688 6259
PSSA Effect Size Mean 129039
-378 135883
-0493 137803
-0873 143360
-0974 144735
Reading SD N
17886 2189
17134 18696
17441 16762
16733 12078
16981 6245
Effect Size -0377 -0495 -0883 -0985 Mean 43795 48049 49574 54133 55639
Math SD N
10476 2247
10021 18986
10429 17075
10547 12291
10924 6357
SAT Effect Size Mean 42614
-0415 47405
-0553 49277
-0983 53512
-1107 55072
Verbal SD N
99852247
929118986
963517075
9856 12291
10300 6357
Effect Size -0497 -0679 -1099 -1228 Mean 3142 3267 3289 3456 3504 SD 0653 0630 0640 0618 0601 GPA N 2145 18341 16424 11914 6150
Effect Size -0195 -0227 -0494 -0577
Table 32 Mothers Education Level Differences for Matched Sample for the Class of 2003 (2002 PSSA 11th Grade and 2003 SAT)
lt High High Some BABS GraduateSubject Measure School School College Degree Degree Mean 129723 137323 140038 148027 150140 SD 19513 18746 19865 20474 22494 Math N 2072 17801 16646 11406 5961
Effect Size -0397 -0524 -0915 -0970PSSA Mean 129022 137751 139799 145748 147071 SD 18092 16042 16241 15951 16272 Reading N 2066 17787 16638 11406 5954
Effect Size -0511 -0627 -0981 -1059 Mean 43631 48106 49738 54411 55641
Math SD N
10494 2095
10046 17922
10387 16756
10467 11496
11305 5992
SAT Effect Size Mean 42549
-0436 47592
-0585 49432
-1029 53618
-1101 55050
Verbal SD N
10124 2095
925417922
954716756
9795 11496
10522 5992
Effect Size -0520 -0700 -1111 -1211 Mean 3148 3285 3307 3475 3510
GPA SD N
0646 2003
0622 17344
0636 16134
0608 11088
0599 5797
Effect Size -0216 -0248 -0521 -0581
HumRRO 38 April 2004
Table 33 Fathers Education Level Differences for Matched Sample for the Class of 2002 (2001 PSSA 11th Grade and 2002 SAT)
Subject Measure lt High School
High School
Some College
BABS Degree
Graduate Degree
Mean 128908 135041 138368 144843 150072
Math SD N
18443 2850
18251 17616
18721 14573
19645 12461
20736 7835
PSSA Effect Size Mean 129571
-0334 135453
-0509 137985
-0836 142352
-1079 145994
Reading SD N
18191 2289
17066 17558
17291 14539
16798 12454
16661 7838
Effect Size -0333 -0474 -0730 -0942 Mean 43958 47510 49626 53651 56759
Math SD N
10229 2915
992617845
10116 14800
10368 12636
10727 7980
SAT Effect Size Mean 43245
-0352 47058
-0557 49210
-0941 52830
-122 56114
Verbal SD N
97782915
921217845
947514800
9571 12636
10128 7980
Effect Size -0401 -0620 -0991 -1293 Mean 3136 3247 3301 3432 3548 SD 0637 0634 0633 0618 0594 GPA N 2784 17269 14263 12198 7723
Effect Size -0175 -0260 -0472 -0669
Table 34 Fathers Education Level Differences for Matched Sample for the Class of 2003 (2002 PSSA 11th Grade and 2003 SAT)
lt High High Some BABS GraduateSubject Measure School School College Degree Degree Mean 131197 136533 140022 147183 152503 SD 19107 18733 19163 20247 22047 Math N 2766 16981 14422 11633 7272
Effect Size -0282 -0461 -0812 -1033PSSA Mean 130955 137222 140037 144765 148752 SD 17715 15901 15980 15990 16014 Reading N 2761 16968 14412 11629 7265
Effect Size -0372 -0538 -0818 -1054 Mean 44505 47569 49772 53911 57115
Math SD N
10230 2803
9938 17087
10023 14508
10352 11709
11009 7314
SAT Effect Size Mean 43701
-0304 47224
-0520 49499
-0914 52920
-1187 56296
Verbal SD N
9887 2803
919517087
931014508
9580 11709
10294 7314
Effect Size -0369 -0604 -0947 -1248 Mean 3139 3272 3316 3454 3558
GPA SD N
0639 2696
0624 16545
0632 14014
0606 11281
0582 7046
Effect Size -0211 -0279 -0506 -0686
HumRRO 39 April 2004
Limited English Proficiency Differences
Students identified as having limited English proficiency (LEP) would be expected to have more difficulty taking a test in English than those not identified As a result of these difficulties LEP students would be expected to have lower scores than non-LEP students Table 36 shows the mean standard deviation number of students and the effect size for the entire state on the PSSA in 2001 and 2002 As expected LEP students have lower scores than non-LEP students on both components and effect sizes are generally large However the math component effect size is only about half of the effect size for reading
Table 35 Limited English Proficiency Differences for 11th Grade PSSA (Unmatched State Data) Limited EffectMean Scale Standard NumberYear Subject English Size Score Deviation of CasesProficiency d
Yes 115312 18977 492Math No 130476 22047 115645 07372001 Yes 106216 15338 473Reading No 129784 21727 115093 1253 Yes 116560 20254 844Math No 131550 22812 122706 06952002 Yes 102618 16138 840Reading No 131483 21413 122394 1522
Table 36 and Table 37 show the mean standard deviation number of cases and effect size for the matched sample of students in the Classes of 2002 and 2003 The effect sizes are similar to those in the state sample for the PSSA and SATmdashvery larger in verbalreading and medium in math The effect size is slightly larger for PSSA than SAT in math but slightly smaller for PSSA than SAT in readingverbal However the GPA for LEP students is actually slightly higher than the GPA for non-LEP students
Table 36 Limited English Proficiency Differences for Matched Sample for the Class of 2002 (2001 PSSA 11th Grade and 2002 SAT)
LimitedPerformance Standard Number Effect Size Subject English Mean ScoreMeasure Deviation of Cases dProficiency Yes 125974 19661 134Math No 139310 20070 68055 0671PSSA Yes 113745 14649 132Reading No 138297 17876 67907 1502 Yes 42860 13045 136Math No 50282 10934 69189 0617SAT Yes 33353 9807 136Verbal No 49764 10241 69189 1637 Yes 3393 0617 111GPA No 3328 0637 60172 -0104
HumRRO 40 April 2004
Table 37 Limited English Proficiency Differences for Matched Sample for the Class of 2003 (2002 PSSA 11th Grade and 2003 SAT)
LimitedPerformance Mean Standard Number Effect Size Subject EnglishMeasure Score Deviation of Cases dProficiency Yes 126815 20257 289Mathematics No 141539 20607 70692 0721PSSA Yes 109386 15855 288Reading No 140757 16741 70638 1924 Yes 41564 12159 291Mathematics No 50641 10887 71220 0787SAT Yes 32526 8775 291Verbal No 50105 10126 71220 1855 Yes 3358 585 226GPA No 3348 629 59032 -0008
The regression analyses results (Table 38 and Table 39) show that there are negligible changes in R square for predicting PSSA from SAT scores when adding LEP to the equation for both reading and math for both classes
Table 38 Regressions Results Showing the Adjusted Strength of Being Limited English Proficient on Predicting 2001 PSSA 11th Grade Scale Scores Based on 2002 SAT Scores
Standardized Coefficient Change in R2
SAT Limited English due toPSSA Component R2 Control Proficiency Limited English
Proficiency Reading 0704 0495 Reading 0703 -0011 0495 0000
Math 0846 0715 Math 0845 -0004 0715 0000
Table 39 Regressions Results Showing the Adjusted Strength of Being Limited English Proficient on Predicting 2002 PSSA 11th Grade Scale Scores Based on 2003 SAT Scores
Standardized Coefficient Change in R2
PSSA Component SAT Control
Limited English Proficiency R2 due to
Limited English Proficiency
Reading 0775 0601 Reading 0771 -0033 0602 +0001
Math 0865 0749 Math 0865 0000 0749 0000
HumRRO 41 April 2004
School-Level Scores Means were calculated by school for all scale scores and grade indicators to analyze
school-level results School-level descriptive statistics are presented for the Classes of 2002 and 2003 for the PSSA (Table 40) SAT (Table 41) and GPA and course grades (Table 42) Only schools with at least 10 students with merged PSSA and SAT scores are included in the analyses School-level means showed an increase on both tests both test components GPA and course grades from the Class of 2002 to the Class of 2003 The change in scoring procedures from the 2001 PSSA to the 2002 PSSA (instituting a minimum score of 700 for the 2002 PSSA) is problematic However there were only 9 students in this college-bound sample in the Class of 2003 who scored a 700 on the 2002 PSSA reading component and no students who scored a 700 on the math component The change in course grades was extremely small
Table 40 PSSA School-Level Descriptive Statistics for the Classes of 2002 and 2003 Subject Measure Class of 2002 Class of 2003 Reading Mean 136973 139316
SD 7435 7088 N 586 586
Math Mean 136966 139333 SD 8335 8496
N 586 586 Limited to schools with at least 10 students with merged PSSA and SAT scores
Table 41 SAT School-Level Descriptive Statistics for the Classes of 2002 and 2003 Subject Measure Class of 2002 Class of 2003 Verbal Mean 48578 48907
SD 4207 4251 N 586 586
Math Mean 48847 49159 SD 4500 4601
N 586 586 Limited to schools with at least 10 students with merged PSSA and SAT scores
HumRRO 42 April 2004
Table 42 School-Level Descriptive Statistics GPA and Course Grades for the Classes of 2002 and 2003
Subject Measure Class of 2002 Class of 2003 GPA Mean 334 346
SD 019 019 N 586 586
English Mean SD
329 020
331 021
N 586 586 Math Mean 311 312
SD 021 022 N 586 586
Limited to schools with at least 10 students with merged PSSA and SAT scores
Average Within-Year School-Level Correlations
Table 43 and Table 44 present correlations among these school-level scores Table 45 presents correlations for the average across the two years4 As Hoffman (1998) pointed out there is a tendency for correlations among school scores to be higher than correlations among student-level scores (Class of 2002 - Table 8 Class of 2003 - Table 9 and average for the Classes of 2002 and 2003 - Table 10) This is the case except for those correlations involving GPA and course-grades (except for PSSA reading to math course grade and GPA to English course grade where school-level correlations are higher)
As Hoffman (1998) pointed out the lower school-level correlations for GPA suggests that grading scales are not equivalent across schools There is a tendency for different schools to grade differently As a result at the school level of analysis there is a weaker relationship between GPA and either PSSA or ACT scores When studentsrsquo scores are averaged at the school level observed differences are related not only to differing levels of student achievement but to the particular schoolrsquos grading practices However the school-level relationship between GPA and course grades remains strong for both PSSA and SAT
4 Average correlations were technically corrected with Fisherrsquos r to z transformations
HumRRO 43 April 2004
Table 43 School-Level PSSA SAT and Course Grade Correlations for the Class of 2002 PSSA SAT Course Grades
Variable Reading Math Verbal Math GPA (Total) English Math
ReadingPSSA
Math
1000
0861 1000
Verbal SAT
Math
0818 0883
0773 0935
1000
0941 1000
GPA
English Course
Grades Math
0413 0393
0411 0391
0423 0454
0371 0376
0359 0362
0416 0450
1000
0778 1000
0719 0542 1000 Limited to schools with at least 10 students with merged PSSA and SAT scores
Table 44 School-Level PSSA SAT and Course Grades Correlations for the Class of 2003 PSSA SAT Course Grades
Variable Reading Math Verbal Math GPA (Total) English Math
ReadingPSSA
Math
1000
0870 1000
Verbal SAT
Math
0905 0849
0868 0915
1000
0943 1000
GPA
English Course
Grades Math
0491 0443
0442 0394
0501 0489
0439 0425
0402 0394
0484 0486
1000
0780 1000
0784 0615 1000 Limited to schools with at least 10 students with merged PSSA and SAT scores
HumRRO 44 April 2004
Table 45 School-Level PSSA SAT and Course Grades Correlation Averages for the Class of 2002 and 2003
PSSA SAT Course Grades
Variable Reading Math Verbal Math GPA (Total) English Math
ReadingPSSA
Math
1000
0866 1000
Verbal SAT
Math
0868 0867
0826 0926
1000
0942 1000
GPA
English Course
Grades Math
0453 0418
0427 0393
0463 0472
0406 0401
0381 0378
0451 0468
1000
0779 1000
0753 0580 1000 Limited to schools with at least 10 students with merged PSSA and SAT scores
Table 46 shows that the mean school-level scores for both PSSA 11th grade reading and SAT verbal components of each assessment increased from the Class of 2002 to the Class of 2003 For the SAT the mean school-level change on the verbal component was +330 scale score points For the PSSA the mean school-level scale score change on the 11th grade reading component was +2343 scale score points Table 47 shows the fairly strong relationship between the differences in mean school-level scores on the SAT verbal component and the PSSA reading component for the Classes of 2002 and 2003 This relationship is graphically portrayed in Figure 17 Table 48 Table 49 and Figure 18 show the same information for the math components of the PSSA and SAT As would be expected the relationship between the math components is stronger than for the readingverbal components
Table 46 Difference in Mean School-Level SAT Verbal and PSSA Reading Scores From the Classes of 2002 and 2003
Difference in Mean School-Level Score From the Standard Number ofMeanClass of 2002 and Class of 2003 Deviation Schools SAT Verbal +330 1673 586
PSSA Reading +2343 4660 586 Limited to schools with at least 10 students with merged PSSA and SAT scores
Table 47 Correlation of Difference in School-Level Mean SAT Verbal Score and PSSA Reading Score Between the Classes of 2002 and 2003
Difference in Mean School-Level Score From the SAT PSSA Class of 2002 and Class of 2003 Verbal Reading
SAT Verbal 1
PSSA Reading 462 1
HumRRO 45 April 2004
-200 -100 0 100 200
Difference in School-Level PSSA Reading Mean Score between the Class of 2002 and Class of 2003
-100
-50
0
50
100
Diff
eren
ce in
Sch
ool-L
evel
SA
T V
erba
l Mea
n Sc
ore
betw
een
Cla
ss o
f 200
2 an
d C
lass
of 2
003
$
$$
$
$
$
$$
$
$$
$
$
$
$
$
$
$
$$
$
$
$
$
$
$
$
$
$
$
$
$
$
$$
$
$
$
$
$
$
$
$
$
$ $
$$
$
$
$
$
$
$
$
$$
$
$$
$ $
$$$ $$
$
$
$
$
$
$
$
$
$
$
$
$
$
$$
$
$
$
$$
$$
$$$
$
$$
$
$
$$
$$
$
$
$
$
$
$
$
$
$
$$$
$$$
$
$
$
$
$
$$
$$
$
$$
$
$
$
$
$
$
$
$
$
$
$
$
$
$
$
$
$
$ $
$$
$
$$$ $$
$
$$$
$$
$
$
$
$
$
$
$
$$
$$
$
$
$
$
$
$
$
$
$
$$
$$
$
$$
$
$
$$
$
$
$
$$
$
$$
$
$$
$
$
$
$
$
$
$
$
$
$
$$
$
$$
$$
$
$$$$
$$
$$
$
$$
$
$
$
$
$$
$
$
$
$$
$
$ $$$
$
$ $$
$
$
$
$$
$
$$
$
$
$
$ $$$
$$
$$
$
$ $
$
$
$$
$
$
$
$
$
$
$$
$
$
$ $
$
$
$
$
$$
$
$
$$
$
$
$
$ $$
$
$
$ $
$$
$
$
$
$
$
$
$
$
$
$
$$
$
$
$$ $
$
$
$
$$
$
$
$$ $
$
$
$
$
$
$
$
$
$
$
$
$
$ $
$
$$
$
$$
$
$
$
$
$
$$
$
$
$
$
$
$
$
$
$$
$
$$
$
$
$$$ $
$
$
$$
$$
$
$$
$
$
$ $$ $
$ $
$$
$
$
$$$$
$
$$$
$
$$
$
$
$
$ $
$
$
$
$
$ $$
$
$
$
$
$
$ $
$ $ $
$
$
$
$
$$
$
$
$
$
$
$
$
$ $
$
$$
$
$$ $
$
$
$
$
$
$
$
$ $
$$
$
$
$
$
$
$
$
$$
$
$$
$
$
$
$
$$
$
$
$
$$
$$
$
$
$ $$$
$
$
$
$
$
$
$$$$
$
$$
$
$
$$
$
$$
$
$
$
$$$
$
$$
$
$
$
$
$$
$$
$
$
$
$$
$
$$
$$
$$
$
$
$
$
$$
$
$
$
$$
$
$
$
$
$
$$
$
$
$
$
$$
$
$
$
$
$
$
$$
$$
Figure 17 Scatterplot of difference in school-level SAT verbal mean scores and school-level PSSA 11th grade reading mean scores between the Class of 2002 and Class of 2003
Table 48 Difference in Mean School-Level SAT Math and PSSA Math Scores From the Class of 2002 and Class of 2003
Difference in Mean School-Level Math Score From the Class of 2002 and Class of 2003 Mean Standard
Deviation Number of
Schools
SAT +313 1842 586
PSSA +2367 4687 586 Limited to schools with at least 10 students with merged PSSA and SAT scores
HumRRO 46 April 2004
Table 49 Correlation of Difference in School-Level Mean SAT Math Score and PSSA Math Score Between the Classes of 2002 and 2003
Difference in Mean School-Level Math Score From the Class of 2002 and Class of 2003 SAT PSSA
SAT 1
PSSA 644 1
-200 -100 0 100 200
Difference in School-Level PSSA Math Mean Scale Score between the Class of 2002 and Class of 2003
-100
-50
0
50
100
Diff
eren
ce i
n Sc
hool
-Lev
el S
AT
Mat
h M
ean
Scor
e
betw
e en
the
Clas
s of
200
2 an
d Cl
ass
of 2
003
$
$$ $
$
$$
$
$$
$
$
$$
$
$
$$ $$
$
$
$
$
$
$
$
$
$$$
$
$
$$$
$
$
$
$
$
$
$$
$
$
$
$
$
$
$
$
$$$ $
$
$$
$
$
$
$
$$ $$
$$
$
$
$
$
$
$
$
$$
$
$$
$
$$
$
$
$
$
$ $$$
$
$
$
$
$
$
$
$$
$
$
$
$$
$
$
$
$
$
$ $
$$
$
$
$
$$
$
$$
$
$
$
$
$
$
$
$
$
$$
$
$$
$$
$
$
$
$
$
$$
$
$
$$
$
$
$
$$
$
$
$
$
$
$
$
$
$
$
$
$
$
$
$
$
$$
$
$
$$ $
$
$
$
$
$$
$
$
$
$
$
$
$
$
$
$
$
$
$
$
$
$
$
$
$$
$
$
$
$
$
$
$
$
$
$
$$
$
$
$
$
$$$
$
$
$
$
$
$
$ $$
$
$
$
$
$$
$
$
$
$
$
$$$
$
$
$$$
$
$
$
$
$$
$
$
$$
$
$
$$$
$
$
$
$
$
$
$$$
$
$
$
$
$$
$
$
$
$
$
$
$
$ $
$
$
$
$
$
$
$
$
$
$
$
$
$
$
$
$
$
$
$
$
$
$$$$
$$
$$
$
$$$
$$
$
$$
$
$
$
$
$
$
$
$$
$
$$
$
$
$
$
$
$$
$
$
$
$
$
$$
$
$$
$
$
$$
$
$
$
$
$
$
$
$
$
$
$ $
$
$
$
$
$$
$
$$$ $
$
$
$
$
$
$ $
$$
$
$$
$
$
$$
$ $
$$
$
$
$
$
$
$
$
$
$
$
$
$$
$
$
$
$
$
$
$
$ $
$$
$
$
$
$
$$ $
$
$$
$
$$
$$
$
$
$
$
$
$
$
$
$
$
$$
$
$$
$
$
$$
$
$
$
$
$$
$$
$$$
$$
$
$
$
$$
$
$$
$
$$
$
$
$
$
$
$
$
$
$
$
$
$
$ $$
$
$
$
$
$$
$
$
$
$$
$
$
$
$
$$
$
$$$$
$
$
$
$$$ $
$
$$
$
$
$
$
$
$$
$
$
$$
$$
$ $ $
$
$
$
$
$$
$
$$
$$
$
$
$
$$
$
$
$
$$
$
$
$
$
$
$
$
$$
$
$
$$
$
$
$
Figure 18 Scatterplot of differences in school-level mean SAT math score and school-level mean PSSA math scores between the Classes of 2002 and 2003
Pooled Within-School Correlations
The above discussion alluded to school-level factors such as differences in grading practices which may be impacting observed correlations Figure 19 depicts an extreme version of such a situation Schools A B and C are clearly different in where their students lie with respect to PSSA or SAT scores but they are identical in terms of the grades their students
HumRRO 47 April 2004
receive Also within each school there is a relationship between grades and either PSSA scores or SAT scores However if a correlation were calculated using students from all schools without regard to school-level characteristics it would be zero
School A
School B PSSA or SAT Scores
School C
Grade Point Average (GPA)
Figure 19 Extreme hypothetical illustration of how mean differences among schools on PSSA or SAT scores that are not mirrored by differences in GPA can impact correlations (Ellipses represent students scores within each school)
Pooled within-school correlations are used to estimate relationships between measures calculated within schools and then averaged across all schools These pooled within-school correlations were calculated for each of the two years of data (Table 50 for the Class of 2002 and Table 51 for the Class of 2003) and then averaged across the two years (Table 52)5 The resulting average pooled within-school correlations are presented in Table 52
5 Again the technical r to z correction was used
HumRRO 48 April 2004
Table 50 Pooled Within-School Correlation for the Class of 2002 PSSA SAT Course Grades
Variable Reading Math Verbal Math GPA (Total) English Math
ReadingPSSA
Math
1000
0648 1000
Verbal SAT
Math
0693 0650
0569 0832
1000
0695 1000
GPA
English Course
Grades Math
0528 0573
0461 0412
0361 0542
0516 0559
0465 0402
0349 0541
1000
0703 1000
0668 0443 1000 Limited to schools with at least 10 students with merged PSSA and SAT scores
Table 51 Pooled Within-School Correlation for the Class of 2003 PSSA SAT Course Grades
Variable Reading Math Verbal Math GPA (Total) English Math
ReadingPSSA
Math
1000
0702 1000
Verbal SAT
Math
0757 0629
0666 0857
1000
0662 1000
GPA
English Course
Grades Math
0512 0564
0457 0405
0350 0541
0534 0679
0466 0414
0369 0548
1000
0698 1000
0667 0443 1000 Limited to schools with at least 10 students with merged PSSA and SAT scores
HumRRO 49 April 2004
Table 52 Pooled Within-School Correlation Averaged for Classes of 2002 and 2003 PSSA SAT Course Grades
Variable Reading Math Verbal Math GPA (Total) English Math
ReadingPSSA
Math
1000
0676 1000
Verbal SAT
Math
0727 0640
0620 0845
1000
0679 1000
GPA
English Course
Grades Math
0520 0569
0459 0409
0356 0542
0525 0569
0466 0408
0359 0546
1000
0701 1000
0668 0443 1000 Limited to schools with at least 10 students with merged PSSA and SAT scores
If differences between schoolsrsquo grading procedures are substantial and if within schools students with higher grades also have higher PSSA scores then the correlations in Table 52 will be higher than student correlations in Table 10 (student-level correlations averaged for the Classes of 2002 and 2003) The difference between the GPA correlations in Table 10 and Table 52 however are only marginally different (see Table 53) In nearly all cases the within-school correlations are higher However the range is relatively smallmdash0009 to 0039 for GPA 0176 to 0219 for English course grades and 0147 to 0237 for math course grades Thus grading differences among schools do appear to exist but the effect is small for studentsrsquo GPA but larger for both English and math course grades especially when compared to the matching assessment component (ie English course grade to PSSA reading and SAT verbal math course grade to PSSA math and SAT math)
HumRRO 50 April 2004
Table 53 Differences Between Student-Level Correlations and Pooled Within-School Correlations Averaged for the Classes of 2002 and 2003
GPA or Course Grade to Student-Level Pooled Within- Difference in Assessment Correlations School Correlations Correlations
GPA to PSSA Reading 0511 0520 0009
GPA to PSSA Math 0546 0569 0023
GPA to SAT Verbal 0494 0525 0031
GPA to SAT Math 0530 0569 0039
English to PSSA Reading 0240 0459 0219
English to PSSA Math 0226 0409 0183
English to SAT Verbal 0256 0466 0210
English to SAT Math 0232 0408 0176
Math to PSSA Reading 0202 0356 0154
Math to PSSA Math 0305 0542 0237
Math to SAT Verbal 0212 0359 0147
Math to SAT Math 0313 0546 0233
Comparison of the correlations in Table 52 to Table 10 can also be used to test a hypothesis about the relationship between PSSA and SAT performance It is suggested above that some schools might be working more successfully toward improving PSSA performance than others Again if these efforts are only tangentially affecting SAT scores then we might expect mean differences among schools on PSSA scores that are not mirrored by differences on SAT Within schools however we can still expect students who do better on PSSA to also have a tendency to do better on SAT Figure 20 provides an extreme illustration of this potential effect Comparing correlations between PSSA and SAT from Table 52 to Table 10 reveals no such trend (see Table 54) The differences are all small (-0020 to +0009) suggesting that there are no significant differences among schools in the average PSSA scores of their students that are not mirrored by differences in studentsrsquo SAT scores This conclusion is consistent with the earlier conclusion from the individual level data That is no strong methodological differences in skills requirements are evidenced
HumRRO 51 April 2004
SAT Scores
School A School B School C
PSSA Scale Scores
Figure 20 Extreme hypothetical illustration of how mean differences among schools on PSSA scores that are not mirrored by differences on SAT scores can impact correlations (Ellipses represent students scores within each school)
Table 54 Differences Between SAT and PSSA Components for Student-Level Correlations and Pooled Within-School Correlations Averaged for the Classes of 2002 and 2003
GPA or Course Grade to Student-Level Pooled Within- Difference in Assessment Correlations School Correlations Correlations
PSSA Reading to SAT Verbal 0742 0727 -0015
PSSA Reading to SAT Math 0690 0640 -0020
PSSA Math to SAT Verbal 0629 0620 +0009
PSSA Math to SAT Math 0856 0845 -0009
A third comparison can also be made with the pooled within-school correlations This concerns the intercorrelations within each assessment format The pooled within-school PSSA intercorrelation (Table 52) shows a very slight decrease from student-level PSSA correlations (Table 10) while the pooled within-school SAT intercorrelation (Table 52) shows a larger increase from the student-level SAT intercorrelations (Table 10) It is possible that this is due to an increased homogeneity for the pooled within-school results However Figure 21 presents an exaggerated illustration of another manner in which this difference might be obtained This pattern would yield higher correlations for all students than for students within a school and a higher correlation of school-level scores (school-level PSSA intercorrelation is 0866 school-level SAT intercorrelation is 0942 [both from Table 45]) than for student-level scores (student-level PSSA is 0686 student-level SAT intercorrelation is 0737 [both from Table 10]) Although small (see Table 55) this is the pattern of differences in correlations obtained for both PSSA intercorrelations and for SAT intercorrelations Note that the difference between the PSSA components is smaller than the difference between the SAT components The obtained pattern
HumRRO 52 April 2004
like that in Figure 21 but much less exaggerated could result from differences between schools in the population of their students from differences in instruction that impact PSSA and SAT test scores or both
Content
Area B School A
School B
School C
Content Area A
Figure 21 Exaggerated illustration of how mean differences among schools can increase overall correlations (Ellipses represent students scores within each school)
Table 55 Internal Differences between SAT and PSSA Components for Student-Level Correlations and Pooled Within-School Correlations Averaged for the Classes of 2002 and 2003
GPA or Course Grade to Student-Level Pooled With- Difference in Assessment Correlations School Correlations Correlations
PSSA Reading to PSSA Math 0686 0676 -0010
SAT Verbal to SAT Math 0737 0845 0108
Summary and Conclusion The purpose of this report is to explore the validity questions ldquoAre PSSA scores
appropriately related to other measures of educational achievementrdquo
The data presented in this report suggest the following main points
bull Students who do well on any of the assessments tend to do well on all of the assessmentsmdashPSSA SAT GPA or course grades
bull When schoolsrsquo means are calculated using only the SAT-taking population of students schools with high scores on SAT also have high PSSA scores GPA and course grades are also related to both PSSA and SAT although not as strongly as the relationship between the PSSA and SAT
HumRRO 53 April 2004
PSSA exhibits strong convergent validity coefficients Correlations are very high between PSSA and SAT PSSA is positively correlated with other measures of student achievement including course grades and GPA Gains on PSSA are reflective of changes on SAT at the school level All these data provide strong evidence in support of PSSA as a valid measure of student achievement
There are however a few clarifications and qualifications to these general conclusions but none that diminish the basic findings These clarifications and qualifications include the following
Changes in scores Both mean PSSA and SAT scores experienced an increase Changes between the two assessments are positively correlated Schools that have gained on one assessment tend to have also gained on the other assessment However the same relationship is also true for those schools that have decreased
PSSA and SAT are tied to different content domains use differently formatted items and were designed to serve very different purposes However it is clear from the data that students who tend to perform well on the PSSA can also be expected to perform well on the SAT and vice-versa It is clear from the data that schools that perform well on one test can be expected to perform well on the other It is also clear that schools that improve on one test can be expected to improve on the other
Discriminant validity At the student level and the school level the different assessments of mathematics achievement are more highly related to each other than to assessments of other subjects Students with high mathematics scores on one assessment will tend to do well on all other assessments but that tendency is most pronounced for other mathematics assessments The same holds for school scores There is a similar differentiation on readingverbal assessments at both the student and school level but not as pronounced as in mathematics
GPA shows positive relationships with both PSSA and SAT assessments at the student and school level but not as pronounced as the relationship between the two assessments This is interpreted as being due to differences in schoolsrsquo grading practices Grading practices apparently differ sufficiently to reduce school-level associations with PSSA and SAT scores
Neither gender race socioeconomic status nor limited English proficiency appear to influence the PSSA scores any more than would be expected based on observed differences for SAT scores In other words PSSA items are not injecting any unexpected gender racialethnic socioeconomic status or limited English proficiency bias
HumRRO 54 April 2004
References
Camara WJ amp Schmidt AE (1999) Group differences in standardized testing and social stratification (College Board Report No 99-5) New York College Entrance Examination Board
Campbell D T amp Fiske D W (1959) Convergent and discriminant validation by the multitrait-multimethod matrix Psychological Bulletin 56(2) 81-105
Cassady JC (2001) Self-reported GPA and SAT A Methodological Note Practical Assessment Research amp Evaluation 7(12)
Coe Robert (2002) Itrsquos the effect size stupid What effect size is and why itrsquos important Paper presented at the Annual Conference of the British Educational Research Association University of Exeter England Retrieved from httpwwwleedsacukeducoldocuments00002182htm
Cohen J (1988) Statistical power analysis for the behavioral sciences (2nd ed) Hillsdale NJ Erlbaum
Hoffman R G (1998) Relationships among Kentuckyrsquos open-response assessments ACT scores and studentsrsquo self-reported high school grades (HumRRO Report FR-WATSD-98-27) Radcliff KY Human Resources Research Organization
Lewis DM Mitzel HC amp Green DR (1996) Standard setting A bookmark approach Symposium presented at the Council of Chief State School Officers Conference on Large ndashScale Assessment Phoenix AZ
Livingston SA amp Zieky MJ (1978) Manual for setting standards on the Basic Skills Assessment Test Princeton NJ Educational Testing Service
Mead R amp Melby K (2003 February) Technical analysis Pennsylvania System of School Assessment 2003 reading and mathematics PSSA Data Recognition Corporation
Mead R amp Melby K (2002 April) Technical analysis Pennsylvania System of School Assessment 2001 reading and mathematics PSSA Data Recognition Corporation
Mead R Smith RM amp Swanlund A (2003) Technical analysis 2003 Pennsylvania System of School Assessment mathematics and reading Data Recognition Corporation
NCLB (2004) httpwwwedgovnclblandingjtml
Sicoly Fiore (2002) What do school-level scores from large-scale assessments really measure Educational Measurement Issues and Practice 21(4) 17-26
Terenzini PT Cabrera AF amp Bernal EM (2001) Swimming against the tide The poor in American higher education (Research Report No 2001-1) New York College Entrance Examination Board
Willingham WW amp Cole NS (1997) Gender and Fair Assessment Hillsdale NJ Erlbaum
HumRRO 55 April 2004
HumRROKDE April 2003

Outliers are hidden Extreme values are hidden
10 13 17 20 23 27 30 33 37 40 43 Student-reported GPA (4-point scale) on the 2003 SAT Student Descriptive Questionnaire (SDQ)
800
1000
1200
1400
1600
1800
2000
2002
PSS
A 1
1th
Gra
de M
ath
Scal
e Sc
ore
n=3319
n=10364
n=5091
n=11480
n=11514
n=9777
n=4600
n=2085 n=98
n=496
n=27
Advanced
Proficient
Basic
Below Basic
Figure 16 Student-level relationship between 2001 PSSA 11th grade math scale score and student-reported grade-point average (GPA) from the SATrsquos Student Descriptive Questionnaire (SDQ) for the class of 2002
HumRRO 26 April 2004
Differences in Performance for Demographic Groupings
Analyses were conducted to compare performance on the PSSA and SAT among students from varying backgrounds Average test performance tends to differ for students of differing genders ethnic groups and various measures associated with socioeconomic status The important question for judging bias on the PSSA is not whether specific groups show mean differences but whether those differences are larger for the PSSA than the differences observed on other measures of student achievement
Differences between measures of achievement can be captured in several ways This report will present two measures of mean differences First effect size statistics will be calculated for the differences between major categories of students (Coe 2002) The magnitude of the effect size statistics is less important than the difference between the effect sizes for PSSA compared to the other measures However measuring the magnitude of the gaps for NCLB-defined groups is instructive and important since all states are expected to make progress toward closing those gaps (No Child Left Behind 2004)
Effect size statistics can be interpreted as the average percentile standing of the average treated (or experimental) participant relative to the average untreated (or control) participant An effect size of 00 indicates that the mean of the treated group is at the 50th percentile of the control group An effect size of 08 indicates that the mean of the treated group is at the 79th
percentile of the control group An effect size of 17 indicates that the mean of the treated group is at the 955th percentile of the control group Cohen (1988) hesitantly defined effect sizes as ldquosmall d=2rdquo ldquomedium d=5rdquo and ldquolarge d=8rdquo He went on to caution against offering conventional operational definitions such as these in the diverse field of behavioral science
The second measure used to capture differences between measures of achievement was regression analysis Regression analysis was used to examine the extent to which PSSA differences in performance for various demographic groupings are similar to those found in SAT scores For each of the demographic groupings we calculated a regression equation to predict PSSA scores based on the matching SAT content score A second equation was created which added the specific demographic characteristic of interest If PSSA scores exhibit greater differences based on that demographic characteristic that characteristic will have a significant weight and there will be a meaningful increase in the prediction of the PSSA component score
Gender Differences
Table 12 presents performance means for males and females for the PSSA only This table provides information from the larger state population to use in comparison with the matched PSSA and SAT sample data The SAT-taking population can be expected to post higher means For all gender tables data is coded such that positive numbers indicate higher mean scores for males negative numbers indicate higher mean scores for females For the full population of PSSA takers the pattern of performance between males and females is consistent Males outscore females but only to a very small degree on the PSSA mathematics test for all three included years Females outscored males to a higher but still small degree on the PSSA reading test The differences between years are small and inconsistent This table shows that the gap in performance for both PSSA mathematics and reading between males and females is small and has not changed dramatically between 2001 and 2003
HumRRO 27 April 2004
Table 12 Gender Differences for PSSA (Unmatched State Data) Mean Scale Standard Number of Effect Size Year Subject Gender Score Deviation Cases d
Mathematics Male 130954 22870 56380
2001 Reading Female
Male Female
130288 127107 132719
21170 22731 20167
55496 56091 55280
0030
-0261 Mathematics Male 132475 23813 60777
2002 Reading Female
Male Female
130679 129478 133443
21694 22536 20034
59849 60686 59636
0079
-0186 Mathematics Male 132555 22198 63542
2003 Reading Female
Male 130434 129308
20680 24674
61849 63840
0099
Female 133974 22003 62020 -0200
Table 13 and Table 14 present data for the matched sample of students taking both PSSA and SAT by gender Scale scores for both assessments as well as studentsrsquo self-reported GPA are included in the tables The numbers of males versus females in the state student population is similar typically with a few more males than females per grade However many more females take the SAT tests suggesting that more females than males aspire to attend college Males outscored females by a small margin on the PSSA and the SAT mathematics tests This finding is consistent with scoring patterns on SAT and ACT reported by Willingham and Cole (1997) They suggest that as a rule females tend to avoid taking mathematics and science classes In an apparent inconsistency females outscored males on PSSA reading but not on SAT verbal Scores for SAT verbal were nearly identical for males and females Willingham and Cole found gender differences favoring females in writing skills The PSSArsquos performance-task items add a writing component that was not present in the SAT for the Classes of 2002 and 2003 However SAT will include a student-written essay beginning in spring 2005 This study found that females tended to have higher self-reported GPAs than males
Table 13 Gender Differences for Class of 2002 Matched Sample (2001 PSSA and 2002 SAT) Performance Standard Number of Effect SizeSubject Gender MeanMeasure Deviation Cases d
Mathematics Male 141925 20536 29403
PSSA Reading Female
Male Female
137503 137162 139420
19408 18761 16921
36530 29345 36451
0221
-0126 Mathematics Male 52273 11076 29787
SAT Verbal Female
Male 48821 50081
10527 10333
37042 29787
0319
Female 49582 10126 37042 0049
GPA Male Female
3243 3404
656
609 25323 32857 -0255
HumRRO 28 April 2004
Table 14 Gender Differences for Class of 2003 Matched Sample (2001 PSSA and 2002 SAT) Performance Mean Standard Number Effect Size Subject GenderMeasure Score Deviation of Cases d
Mathematics Male 145023 21049 31338
PSSA Reading Female
Male Female
138650 140570 140715
19790 17318 16427
38459 31328 38418
0312
-0009 Mathematics Male 52596 11067 31557
SAT Verbal Female
Male 48997 50524
10490 10235
38745 31557
0327
Female 49623 10097 38745 0089 Male 3265 653 25387GPA Female 3415 600 32925 -0239
Table 15 and Table 16 show regression results for adding gender as a predictor variable to the model for estimating PSSA scores based on SAT scores For both PSSA reading and math the regression weights for gender are negligible and the changes in R-square are essentially nonexistent Gender is coded such that the positive weight means that females tend to have higher reading and math scores than would be expected from gender differences in SAT verbal
Table 15 Regressions Results Showing the Adjusted Strength of Gender on Predicting 2001 PSSA 11th Grade Scale Scores Based on 2002 SAT Scores Standardized Coefficient
PSSA Component SAT Control Gender R2 Change in R2
due to Gender Reading 0704 0495 Reading 0706 +0081 0502 +0006 Math 0847 0717 Math 0851 +0025 0717 +0001
Table 16 Regressions Results Showing the Adjusted Strength of Gender on Predicting 2002 PSSA 11th Grade Scale Scores Based on 2003 SAT Scores Standardized Coefficient
PSSA Component SAT Control Gender R2 Change in R2
due to Gender Reading 0775 0601 Reading 0777 +0038 0602 +0001 Math 0865 0749 Math 0863 -0012 0749 0000
HumRRO 29 April 2004
Ethnic or Racial Differences
Table 17 presents performance means for the four major ethnic or racial groups3 (White Black HispanicLatino and Asian) for the PSSA only For these analyses the racialethnic categories reported with the PSSA data were used It should be noted that starting in 2003 the reported racialethnic categories were changed from those reported in 2001 and 2002 In 2003 the category of ldquoMixedrdquo was no longer included As a result those students previously selecting ldquoMixedrdquo were forced to select one of the other categories For the full population of PSSA takers the pattern of performance between these four groups is fairly consistent In mathematics Asians outscore all groups Whites outscore HispanicsLatinos and Blacks and HispanicsLatinos score between Blacks and Whites For Reading Asians and Whites score approximately the same and Blacks score almost one standard deviation lower than Whites However the score for HispanicsLatinos has shown a decrease over the three years of approximately 30 points This decrease has dropped the HispanicLatino group to below the mean Black group score The number of HispanicLatinos taking the PSSA has increased approximately 40 Blacks approximately 65 and Whites approximately 10 during that time as well
Table 17 EthnicRacial Differences for PSSA (Unmatched State Data) Hispanic Year Subject Measure White Black AsianLatino
2001
Mathematics
Reading
Mean SD
N Effect Size
Mean SD
N Effect Size
132481 21525 92185
131644 21066 91964
113596 17093 8274 0972
115158 20393 8117 0795
116757 18873 2954 0777
117025 21104 2924 0693
140820 24657 2489 -0360
132927 21707 2470 -0060
2002
Mathematics
Reading
Mean SD
N Effect Size
Mean SD
N Effect Size
133935 22098 97659
133917 20351 97428
114090 17626 10783 0993
114887 20070 10715 0942
116438 19041 3534 0848
116193 21155 3535 0854
143430 26757 2659 -0387
133711 22914 2655 0010
2003
Mathematics
Reading
Mean SD
N Effect Size
Mean SD
N
134059 20863
104064
134488 22411
104271
114619 16132 13669 1042
114796 21940 13871 0888
116389 17473 4106 0903
114052 22848 4158 0903
142013 23662 2865 -0357
134943 24743 2866 -0019
3 The racialethnic analyses were limited to these four groups because of the limited number of students in the other groups
HumRRO 30 April 2004
Table 18 and Table 19 present data for the matched sample of students taking both PSSA and SAT by ethnicity Scale scores for both assessments as well as studentsrsquo self-reported GPA are included in the tables In 2002 Asians (726) took the SAT tests at a much higher rate than any other group followed by Whites (608) Blacks (419) and HispanicsLatinos (364) The order remained the same in 2003 although all groups but Asians had a slightly lower percentage in 2002 than in 2003 This suggests that more Asians and Whites aspire to attend college than do Blacks or HispanicLatinos Scores on the PSSA SAT and GPA show the same order for the matched sample as for the total state sample for the PSSA Comparing the effect size for the PSSA versus the effect size for the SAT shows that the effect size for most groups in the Class of 2002 and components is approximately the same for the PSSA and the SAT The largest difference for Blacks is between the PSSA reading and the SAT verbal components (PSSA reading ndash 0883 and SAT verbal ndash 1011) Note also that the effect size for GPA is approximately half the effect size for the PSSA and SAT for Blacks and Hispanics However for Asians the GPA effect size is more similar to the effect size for math than it is for the SAT verbal or PSSA reading components
Table 18 EthnicRacial Differences for the Class of 2002 Matched Sample (2001 PSSA 11th
Grade and 2002 SAT) Performance Hispanic Subject Measure White Black AsianMeasure Latino
PSSA
Mathematics
Reading
Mean SD
N Effect Size
Mean SD
N Effect Size
140809 19272 56063
139658 17004 56017
120809 17759 3735 1079
123658 19180 3678 0883
128529 19483 1076 0634
129112 19199 1064 0582
146256 22812 1808 -0258
138040 19183 1807 0089
SAT
Mathematics
Verbal
Mean SD
N Effect Size
Mean SD
N Effect Size
51041 10409 56693
50476 9670
56693
40286 10268 3872 1040
40619 9836 3872 1011
44332 11082 1096 0624
44378 10964 1096 0590
54820 13077 1838 -0320 49547 13308 1838 0080
GPA
Mean SD
N Effect Size
3364 0621
49617
2940 0667 3337 0658
3126 0640 871
0377
3491 0615 1616 -0205
HumRRO 31 April 2004
Table 19 EthnicRacial Differences for the Class of 2003 for Matched Sample (2002 PSSA 11th
Grade and 2003 SAT) Performance HispanicSubject Measure White Black AsianMeasure Latino
Mean 142999 122766 129030 150221
Mathematics SD N
19659 59076
18097 4516
19834 1178
24869 1951
PSSA Effect Size Mean 142157
1071 125012
0707 129610
-0322 139776
Reading SD N
15746 59038
17622 4500
18763 1184
20264 1951
Effect Size 1026 0724 0131 Mean 51440 39999 43626 55739
Mathematics SD N
10295 59443
9997 4573
10967 1206
12831 1970
SAT Effect Size Mean 50834
1128 40568
0735 43851
-0370 50166
Verbal SD N
9539 59443
9913 4573
10745 1206
13163 1970
Effect Size 1055 0687 0058 Mean 3385 2933 3175 3538
GPA Mathematics SD N
0610 49511
0666 3799
0641 935
0595 1608
Effect Size 0708 0336 -0254
Table 20 through Table 23 show regression results for adding raceethnicity (White versus Black and White versus HispanicLatino) as a predictor variable to the model for estimating PSSA scores based on SAT scores For both PSSA reading and math the regression weights for raceethnicity are negligible and the changes in R-square are essentially nonexistent Raceethnicity is coded such that the negative weight means that Blacks or HispanicsLatinos tend to have lower reading and math scores than would be expected from ethnicity differences in SAT verbal
Table 20 Regressions Results Showing the Adjusted Strength of Being Black on Predicting 2001 PSSA 11th Grade Scale Scores Based on 2002 SAT Scores Standardized Coefficient
PSSA Component SAT
Control Black R2 Change in R2
due to being Black
Reading 0699 0489 Reading 0686 -0059 0493 +0003 Math 0843 0711 Math 0833 -043 0713 +0002
HumRRO 32 April 2004
Table 21 Regressions Results Showing the Adjusted Strength of Being Black on Predicting 2002 PSSA 11th Grade Scale Scores Based on 2003 SAT Scores Standardized Coefficient
PSSA Component SAT
Control Black R2 Change in R2
due to being Black
Reading 0769 0591 Reading 0750 -0068 0595 0004 Math 0863 0745 Math 0857 -0021 0746 0000
Table 22 Regressions Results Showing the Adjusted Strength of Being HispanicLatino on Predicting 2001 PSSA 11th Grade Scale Scores Based on 2002 SAT Scores Standardized Coefficient
PSSA Component SAT
Control HispanicLatino R2 Change in R2
due to being HispanicLatino
Reading 0687 0472 Reading 0685 -0026 0473 +0001 Math 0837 0700 Math 0836 -0014 0700 0000
Table 23 Regressions Results Showing the Adjusted Strength of Being HispanicLatino on Predicting 2002 PSSA 11th Grade Scale Scores Based on 2003 SAT Scores Standardized Coefficient
PSSA Component SAT
Control HispanicLatino R2 Change in R2
due to being HispanicLatino
Reading 0754 0568 Reading 0050 -0034 0569 +0001 Math 0857 0735 Math 0856 -0009 0735 0000
Economically Disadvantaged Differences
Table 24 presents performance means for those students identified as economically disadvantaged for the PSSA only This table provides information from the larger state population to use in comparison with the matched PSSA and SAT sample data The SAT-taking population can be expected to post higher means For the full population of PSSA takers the pattern of performance between males and females is consistent Noneconomically disadvantaged students outscore economically disadvantaged student to a large degree on all components and all years except 2001 when it was a medium degree The number of students identified more than doubled between 2001 and 2002 and increased an additional 40 in 2003
HumRRO 33 April 2004
Table 24 Differences for Economically Disadvantaged Students for PSSA (Unmatched State Data)
Year Subject Economically Disadvantaged
Mean Scale Score
Standard Deviation
Number of Cases
Effect Size d
2001 Mathematics
Reading
Yes No Yes No
118647 131377 118918 130564
18977 22014 21142 21570
8805 107332 8702
106864
0619
0545
2002 Mathematics
Reading
Yes No Yes No
116604 133857 116380 133704
18913 22497 20914 20617
17253 106297 17199 106035
0830
0834 Yes 118211 17997 24022Mathematics No 134575 21063 102919 08352003 Yes 116747 22817 24290Reading No 135050 22319 103137 0811
Table 25 Differences for Economically Disadvantaged Students for Matched Sample for the Class of 2002 (2001 PSSA 11th Grade and 2002 SAT)
Performance Economically Mean Standard Number Effect Measure Subject Disadvantaged Score Deviation of Cases Size
d
PSSA Mathematics
Reading
Yes No Yes No
130598 139668 131768 138535
18830 20044 18336 17829
2893 65296 2863 65176
0466
0374
SAT Mathematics
Verbal
Yes No Yes No
45185 50491 44694 49953
10399 10912 10131 10215
2926 66399 2926 66399
0498
0517
GPA Yes No
3195 3334
0661 0636
2561 57722 0214
HumRRO 34 April 2004
Table 26 Differences for Economically Disadvantaged Students for Matched Sample for the Class of 2003 (2002 PSSA 11th Grade and 2003 SAT) Performance
Measure Subject Economically Disadvantaged
Mean Score
Standard Deviation
Number of Cases
Effect Size d
PSSA Mathematics
Reading
Yes No Yes No
127741 142707 128169 141742
19474 20278 18498 16243
5822 65159 5812 65114
0753
0780
SAT Mathematics
Verbal
Yes No Yes No
42412 51341 42100 50748
10746 10616 10491 9845
5907 65604 5907 65604
0836
0850 Yes 3116 0680 4854GPA No 3369 0620 54404 0389
Table 27 Regressions Results Showing the Adjusted Strength of Being Economically Disadvantaged on Predicting 2001 PSSA 11th Grade Scale Scores Based on 2002 SAT Scores Standardized Coefficient
Change in R2
SAT Economically due to beingPSSA Component R2 Control Disadvantaged Economically
Disadvantaged Reading 0704 0495 Reading 0703 -0004 0495 0000 Math 0846 0715 Math 0845 -0009 0715 0000
Table 28 Regressions Results Showing the Adjusted Strength of Being Economically Disadvantaged on Predicting 2002 PSSA 11th Grade Scale Scores Based on 2003 SAT Scores Standardized Coefficient
SAT Change in R2
PSSA Component Control Economically Disadvantaged R2 due to being
Economically Disadvantaged
Reading 0775 0601 Reading 0765 -044 0602 0002 Math 0865 0749 Math 0864 -0005 0749 0000
Annual Family Income Differences
Camara and Schmidt (1999) point out that family income is related to performance on tests such as the SAT I They also point out that this finding is not unique to the SAT I or college admissions tests Terenzini Cabrera and Bernal (2001) also examined various differences in educational outcomes associated with varying levels of socioeconomic status (SES) This report
HumRRO 35 April 2004
examines differences associated with family income in this section The following section shows differences in student performance related to parental education level Terenzini Cabrera and Bernal (2001) and Camara and Schmidt (1999) point out differences between income wealth and SES
Because annual family income data comes from the SDQ of the SAT only matched student data can be presented showing relationships with family income Table 29 (Class of 2002) and Table 30 (Class of 2003) show student performance on the PSSA SAT and GPA versus four levels of family income As the table clearly shows student scores increase on all performance measures as income goes up However the effect size for GPA is about half of the effect size for either of the assessments The effect size for the PSSA is similar although slightly less than the effect size for the SAT for both components and both years
Table 29 Annual Family Income Differences for Matched Sample for the Class of 2002 (2001 PSSA 11th Grade and 2002 SAT)
Income Level Performance Subject MeasureMeasure $25000 to $40000 tolt $25000 gt $70000$40000 $70000
PSSA
Math
Reading
Mean SD
N Effect Size
Mean SD
N Effect Size
129900 19108 6658
131011 18466 6594
135381 18361 8709 -0293
136210 17165 8693 -0292
139702 18899 16365 -0516
138848 17110 16348 -0440
145045 20032 14902 -0774
142093 16921 14867 -0626
SAT
Math
Verbal
Mean SD
N Effect Size
Mean SD
N Effect Size
44665 10594 6822
44469 10177 6822
47766 10013 8856 -0301 47619 9546 8856 -0319
50272 10136 16549 -0541 49796 9485
16549 -0542
53816 10580 15122 -0864 52825 9815
15122 -0836
GPA
Mean SD
N Effect Size
3173 0656 6596
3262 0636 8607 -0138
3344 0631 16141 -0266
3412 0628
14726 -0372
HumRRO 36 April 2004
Table 30 Annual Family Income Differences for Matched Sample for the Class of 2003 (2002 PSSA 11th Grade and 2003 SAT)
Income Level Performance Subject MeasureMeasure $25000 - $40000 -lt $25000 gt $70000$40000 $70000
Mean 131577 136393 140924 147093
Math SD N
19401 6230
19051 7958
19319 14963
20560 14295
PSSA Effect Size Mean 132698
-0250 137311
-0483 140572
-0776 144569
Reading SD N
17576 6232
16201 7948
15919 14958
15965 14284
Effect Size -0273 -0470 -0707 Mean 44871 47689 50075 53965
Math SD N
10562 6304
10140 8010
10089 15045
10567 14388
SAT Effect Size Mean 44793
-0272 47581
-0504 49653
-0861 52905
Verbal SD N
10345 6304
9578 8010
9354 15045
9689 14388
Effect Size -0280 -0493 -0809 Mean 3188 3279 3357 3428
GPA SD N
0652 6115
0642 7832
0623 14659
0617 14000
Effect Size -0141 -0265 -0378
Parent Educational Differences
Camara and Schmidt (1999) also looked at the impact of parent education on student performance in standardized testing Their study showed that parental education is related to performance on the SAT I Higher parental education is associated with higher scores on the SAT I Table 31 and Table 32 show the means standard deviations number of students and effect size for various levels of student-reported motherrsquos education for the PSSA SAT and GPA The analyses indicate that the effect size for both assessments and GPA are larger as the motherrsquos educational level increases The effect size for PSSA is not as large as the effect size for SAT The effect size for GPA is about half of the effect size for PSSA or SAT Table 33 and Table 34 provide the same information regarding the fatherrsquos education level The results follow the same pattern as that for motherrsquos education level
HumRRO 37 April 2004
Table 31 Mothers Education Level Differences for Matched Sample for the Class of 2002 (2001 PSSA 11th Grade and 2002 SAT)
Subject Measure lt High School
High School
Some College
BABS Degree
Graduate Degree
Mean 128855 135908 138212 145789 148095
Math SD N
18785 2196
18542 18737
19161 16804
19982 12094
20688 6259
PSSA Effect Size Mean 129039
-378 135883
-0493 137803
-0873 143360
-0974 144735
Reading SD N
17886 2189
17134 18696
17441 16762
16733 12078
16981 6245
Effect Size -0377 -0495 -0883 -0985 Mean 43795 48049 49574 54133 55639
Math SD N
10476 2247
10021 18986
10429 17075
10547 12291
10924 6357
SAT Effect Size Mean 42614
-0415 47405
-0553 49277
-0983 53512
-1107 55072
Verbal SD N
99852247
929118986
963517075
9856 12291
10300 6357
Effect Size -0497 -0679 -1099 -1228 Mean 3142 3267 3289 3456 3504 SD 0653 0630 0640 0618 0601 GPA N 2145 18341 16424 11914 6150
Effect Size -0195 -0227 -0494 -0577
Table 32 Mothers Education Level Differences for Matched Sample for the Class of 2003 (2002 PSSA 11th Grade and 2003 SAT)
lt High High Some BABS GraduateSubject Measure School School College Degree Degree Mean 129723 137323 140038 148027 150140 SD 19513 18746 19865 20474 22494 Math N 2072 17801 16646 11406 5961
Effect Size -0397 -0524 -0915 -0970PSSA Mean 129022 137751 139799 145748 147071 SD 18092 16042 16241 15951 16272 Reading N 2066 17787 16638 11406 5954
Effect Size -0511 -0627 -0981 -1059 Mean 43631 48106 49738 54411 55641
Math SD N
10494 2095
10046 17922
10387 16756
10467 11496
11305 5992
SAT Effect Size Mean 42549
-0436 47592
-0585 49432
-1029 53618
-1101 55050
Verbal SD N
10124 2095
925417922
954716756
9795 11496
10522 5992
Effect Size -0520 -0700 -1111 -1211 Mean 3148 3285 3307 3475 3510
GPA SD N
0646 2003
0622 17344
0636 16134
0608 11088
0599 5797
Effect Size -0216 -0248 -0521 -0581
HumRRO 38 April 2004
Table 33 Fathers Education Level Differences for Matched Sample for the Class of 2002 (2001 PSSA 11th Grade and 2002 SAT)
Subject Measure lt High School
High School
Some College
BABS Degree
Graduate Degree
Mean 128908 135041 138368 144843 150072
Math SD N
18443 2850
18251 17616
18721 14573
19645 12461
20736 7835
PSSA Effect Size Mean 129571
-0334 135453
-0509 137985
-0836 142352
-1079 145994
Reading SD N
18191 2289
17066 17558
17291 14539
16798 12454
16661 7838
Effect Size -0333 -0474 -0730 -0942 Mean 43958 47510 49626 53651 56759
Math SD N
10229 2915
992617845
10116 14800
10368 12636
10727 7980
SAT Effect Size Mean 43245
-0352 47058
-0557 49210
-0941 52830
-122 56114
Verbal SD N
97782915
921217845
947514800
9571 12636
10128 7980
Effect Size -0401 -0620 -0991 -1293 Mean 3136 3247 3301 3432 3548 SD 0637 0634 0633 0618 0594 GPA N 2784 17269 14263 12198 7723
Effect Size -0175 -0260 -0472 -0669
Table 34 Fathers Education Level Differences for Matched Sample for the Class of 2003 (2002 PSSA 11th Grade and 2003 SAT)
lt High High Some BABS GraduateSubject Measure School School College Degree Degree Mean 131197 136533 140022 147183 152503 SD 19107 18733 19163 20247 22047 Math N 2766 16981 14422 11633 7272
Effect Size -0282 -0461 -0812 -1033PSSA Mean 130955 137222 140037 144765 148752 SD 17715 15901 15980 15990 16014 Reading N 2761 16968 14412 11629 7265
Effect Size -0372 -0538 -0818 -1054 Mean 44505 47569 49772 53911 57115
Math SD N
10230 2803
9938 17087
10023 14508
10352 11709
11009 7314
SAT Effect Size Mean 43701
-0304 47224
-0520 49499
-0914 52920
-1187 56296
Verbal SD N
9887 2803
919517087
931014508
9580 11709
10294 7314
Effect Size -0369 -0604 -0947 -1248 Mean 3139 3272 3316 3454 3558
GPA SD N
0639 2696
0624 16545
0632 14014
0606 11281
0582 7046
Effect Size -0211 -0279 -0506 -0686
HumRRO 39 April 2004
Limited English Proficiency Differences
Students identified as having limited English proficiency (LEP) would be expected to have more difficulty taking a test in English than those not identified As a result of these difficulties LEP students would be expected to have lower scores than non-LEP students Table 36 shows the mean standard deviation number of students and the effect size for the entire state on the PSSA in 2001 and 2002 As expected LEP students have lower scores than non-LEP students on both components and effect sizes are generally large However the math component effect size is only about half of the effect size for reading
Table 35 Limited English Proficiency Differences for 11th Grade PSSA (Unmatched State Data) Limited EffectMean Scale Standard NumberYear Subject English Size Score Deviation of CasesProficiency d
Yes 115312 18977 492Math No 130476 22047 115645 07372001 Yes 106216 15338 473Reading No 129784 21727 115093 1253 Yes 116560 20254 844Math No 131550 22812 122706 06952002 Yes 102618 16138 840Reading No 131483 21413 122394 1522
Table 36 and Table 37 show the mean standard deviation number of cases and effect size for the matched sample of students in the Classes of 2002 and 2003 The effect sizes are similar to those in the state sample for the PSSA and SATmdashvery larger in verbalreading and medium in math The effect size is slightly larger for PSSA than SAT in math but slightly smaller for PSSA than SAT in readingverbal However the GPA for LEP students is actually slightly higher than the GPA for non-LEP students
Table 36 Limited English Proficiency Differences for Matched Sample for the Class of 2002 (2001 PSSA 11th Grade and 2002 SAT)
LimitedPerformance Standard Number Effect Size Subject English Mean ScoreMeasure Deviation of Cases dProficiency Yes 125974 19661 134Math No 139310 20070 68055 0671PSSA Yes 113745 14649 132Reading No 138297 17876 67907 1502 Yes 42860 13045 136Math No 50282 10934 69189 0617SAT Yes 33353 9807 136Verbal No 49764 10241 69189 1637 Yes 3393 0617 111GPA No 3328 0637 60172 -0104
HumRRO 40 April 2004
Table 37 Limited English Proficiency Differences for Matched Sample for the Class of 2003 (2002 PSSA 11th Grade and 2003 SAT)
LimitedPerformance Mean Standard Number Effect Size Subject EnglishMeasure Score Deviation of Cases dProficiency Yes 126815 20257 289Mathematics No 141539 20607 70692 0721PSSA Yes 109386 15855 288Reading No 140757 16741 70638 1924 Yes 41564 12159 291Mathematics No 50641 10887 71220 0787SAT Yes 32526 8775 291Verbal No 50105 10126 71220 1855 Yes 3358 585 226GPA No 3348 629 59032 -0008
The regression analyses results (Table 38 and Table 39) show that there are negligible changes in R square for predicting PSSA from SAT scores when adding LEP to the equation for both reading and math for both classes
Table 38 Regressions Results Showing the Adjusted Strength of Being Limited English Proficient on Predicting 2001 PSSA 11th Grade Scale Scores Based on 2002 SAT Scores
Standardized Coefficient Change in R2
SAT Limited English due toPSSA Component R2 Control Proficiency Limited English
Proficiency Reading 0704 0495 Reading 0703 -0011 0495 0000
Math 0846 0715 Math 0845 -0004 0715 0000
Table 39 Regressions Results Showing the Adjusted Strength of Being Limited English Proficient on Predicting 2002 PSSA 11th Grade Scale Scores Based on 2003 SAT Scores
Standardized Coefficient Change in R2
PSSA Component SAT Control
Limited English Proficiency R2 due to
Limited English Proficiency
Reading 0775 0601 Reading 0771 -0033 0602 +0001
Math 0865 0749 Math 0865 0000 0749 0000
HumRRO 41 April 2004
School-Level Scores Means were calculated by school for all scale scores and grade indicators to analyze
school-level results School-level descriptive statistics are presented for the Classes of 2002 and 2003 for the PSSA (Table 40) SAT (Table 41) and GPA and course grades (Table 42) Only schools with at least 10 students with merged PSSA and SAT scores are included in the analyses School-level means showed an increase on both tests both test components GPA and course grades from the Class of 2002 to the Class of 2003 The change in scoring procedures from the 2001 PSSA to the 2002 PSSA (instituting a minimum score of 700 for the 2002 PSSA) is problematic However there were only 9 students in this college-bound sample in the Class of 2003 who scored a 700 on the 2002 PSSA reading component and no students who scored a 700 on the math component The change in course grades was extremely small
Table 40 PSSA School-Level Descriptive Statistics for the Classes of 2002 and 2003 Subject Measure Class of 2002 Class of 2003 Reading Mean 136973 139316
SD 7435 7088 N 586 586
Math Mean 136966 139333 SD 8335 8496
N 586 586 Limited to schools with at least 10 students with merged PSSA and SAT scores
Table 41 SAT School-Level Descriptive Statistics for the Classes of 2002 and 2003 Subject Measure Class of 2002 Class of 2003 Verbal Mean 48578 48907
SD 4207 4251 N 586 586
Math Mean 48847 49159 SD 4500 4601
N 586 586 Limited to schools with at least 10 students with merged PSSA and SAT scores
HumRRO 42 April 2004
Table 42 School-Level Descriptive Statistics GPA and Course Grades for the Classes of 2002 and 2003
Subject Measure Class of 2002 Class of 2003 GPA Mean 334 346
SD 019 019 N 586 586
English Mean SD
329 020
331 021
N 586 586 Math Mean 311 312
SD 021 022 N 586 586
Limited to schools with at least 10 students with merged PSSA and SAT scores
Average Within-Year School-Level Correlations
Table 43 and Table 44 present correlations among these school-level scores Table 45 presents correlations for the average across the two years4 As Hoffman (1998) pointed out there is a tendency for correlations among school scores to be higher than correlations among student-level scores (Class of 2002 - Table 8 Class of 2003 - Table 9 and average for the Classes of 2002 and 2003 - Table 10) This is the case except for those correlations involving GPA and course-grades (except for PSSA reading to math course grade and GPA to English course grade where school-level correlations are higher)
As Hoffman (1998) pointed out the lower school-level correlations for GPA suggests that grading scales are not equivalent across schools There is a tendency for different schools to grade differently As a result at the school level of analysis there is a weaker relationship between GPA and either PSSA or ACT scores When studentsrsquo scores are averaged at the school level observed differences are related not only to differing levels of student achievement but to the particular schoolrsquos grading practices However the school-level relationship between GPA and course grades remains strong for both PSSA and SAT
4 Average correlations were technically corrected with Fisherrsquos r to z transformations
HumRRO 43 April 2004
Table 43 School-Level PSSA SAT and Course Grade Correlations for the Class of 2002 PSSA SAT Course Grades
Variable Reading Math Verbal Math GPA (Total) English Math
ReadingPSSA
Math
1000
0861 1000
Verbal SAT
Math
0818 0883
0773 0935
1000
0941 1000
GPA
English Course
Grades Math
0413 0393
0411 0391
0423 0454
0371 0376
0359 0362
0416 0450
1000
0778 1000
0719 0542 1000 Limited to schools with at least 10 students with merged PSSA and SAT scores
Table 44 School-Level PSSA SAT and Course Grades Correlations for the Class of 2003 PSSA SAT Course Grades
Variable Reading Math Verbal Math GPA (Total) English Math
ReadingPSSA
Math
1000
0870 1000
Verbal SAT
Math
0905 0849
0868 0915
1000
0943 1000
GPA
English Course
Grades Math
0491 0443
0442 0394
0501 0489
0439 0425
0402 0394
0484 0486
1000
0780 1000
0784 0615 1000 Limited to schools with at least 10 students with merged PSSA and SAT scores
HumRRO 44 April 2004
Table 45 School-Level PSSA SAT and Course Grades Correlation Averages for the Class of 2002 and 2003
PSSA SAT Course Grades
Variable Reading Math Verbal Math GPA (Total) English Math
ReadingPSSA
Math
1000
0866 1000
Verbal SAT
Math
0868 0867
0826 0926
1000
0942 1000
GPA
English Course
Grades Math
0453 0418
0427 0393
0463 0472
0406 0401
0381 0378
0451 0468
1000
0779 1000
0753 0580 1000 Limited to schools with at least 10 students with merged PSSA and SAT scores
Table 46 shows that the mean school-level scores for both PSSA 11th grade reading and SAT verbal components of each assessment increased from the Class of 2002 to the Class of 2003 For the SAT the mean school-level change on the verbal component was +330 scale score points For the PSSA the mean school-level scale score change on the 11th grade reading component was +2343 scale score points Table 47 shows the fairly strong relationship between the differences in mean school-level scores on the SAT verbal component and the PSSA reading component for the Classes of 2002 and 2003 This relationship is graphically portrayed in Figure 17 Table 48 Table 49 and Figure 18 show the same information for the math components of the PSSA and SAT As would be expected the relationship between the math components is stronger than for the readingverbal components
Table 46 Difference in Mean School-Level SAT Verbal and PSSA Reading Scores From the Classes of 2002 and 2003
Difference in Mean School-Level Score From the Standard Number ofMeanClass of 2002 and Class of 2003 Deviation Schools SAT Verbal +330 1673 586
PSSA Reading +2343 4660 586 Limited to schools with at least 10 students with merged PSSA and SAT scores
Table 47 Correlation of Difference in School-Level Mean SAT Verbal Score and PSSA Reading Score Between the Classes of 2002 and 2003
Difference in Mean School-Level Score From the SAT PSSA Class of 2002 and Class of 2003 Verbal Reading
SAT Verbal 1
PSSA Reading 462 1
HumRRO 45 April 2004
-200 -100 0 100 200
Difference in School-Level PSSA Reading Mean Score between the Class of 2002 and Class of 2003
-100
-50
0
50
100
Diff
eren
ce in
Sch
ool-L
evel
SA
T V
erba
l Mea
n Sc
ore
betw
een
Cla
ss o
f 200
2 an
d C
lass
of 2
003
$
$$
$
$
$
$$
$
$$
$
$
$
$
$
$
$
$$
$
$
$
$
$
$
$
$
$
$
$
$
$
$$
$
$
$
$
$
$
$
$
$
$ $
$$
$
$
$
$
$
$
$
$$
$
$$
$ $
$$$ $$
$
$
$
$
$
$
$
$
$
$
$
$
$
$$
$
$
$
$$
$$
$$$
$
$$
$
$
$$
$$
$
$
$
$
$
$
$
$
$
$$$
$$$
$
$
$
$
$
$$
$$
$
$$
$
$
$
$
$
$
$
$
$
$
$
$
$
$
$
$
$
$ $
$$
$
$$$ $$
$
$$$
$$
$
$
$
$
$
$
$
$$
$$
$
$
$
$
$
$
$
$
$
$$
$$
$
$$
$
$
$$
$
$
$
$$
$
$$
$
$$
$
$
$
$
$
$
$
$
$
$
$$
$
$$
$$
$
$$$$
$$
$$
$
$$
$
$
$
$
$$
$
$
$
$$
$
$ $$$
$
$ $$
$
$
$
$$
$
$$
$
$
$
$ $$$
$$
$$
$
$ $
$
$
$$
$
$
$
$
$
$
$$
$
$
$ $
$
$
$
$
$$
$
$
$$
$
$
$
$ $$
$
$
$ $
$$
$
$
$
$
$
$
$
$
$
$
$$
$
$
$$ $
$
$
$
$$
$
$
$$ $
$
$
$
$
$
$
$
$
$
$
$
$
$ $
$
$$
$
$$
$
$
$
$
$
$$
$
$
$
$
$
$
$
$
$$
$
$$
$
$
$$$ $
$
$
$$
$$
$
$$
$
$
$ $$ $
$ $
$$
$
$
$$$$
$
$$$
$
$$
$
$
$
$ $
$
$
$
$
$ $$
$
$
$
$
$
$ $
$ $ $
$
$
$
$
$$
$
$
$
$
$
$
$
$ $
$
$$
$
$$ $
$
$
$
$
$
$
$
$ $
$$
$
$
$
$
$
$
$
$$
$
$$
$
$
$
$
$$
$
$
$
$$
$$
$
$
$ $$$
$
$
$
$
$
$
$$$$
$
$$
$
$
$$
$
$$
$
$
$
$$$
$
$$
$
$
$
$
$$
$$
$
$
$
$$
$
$$
$$
$$
$
$
$
$
$$
$
$
$
$$
$
$
$
$
$
$$
$
$
$
$
$$
$
$
$
$
$
$
$$
$$
Figure 17 Scatterplot of difference in school-level SAT verbal mean scores and school-level PSSA 11th grade reading mean scores between the Class of 2002 and Class of 2003
Table 48 Difference in Mean School-Level SAT Math and PSSA Math Scores From the Class of 2002 and Class of 2003
Difference in Mean School-Level Math Score From the Class of 2002 and Class of 2003 Mean Standard
Deviation Number of
Schools
SAT +313 1842 586
PSSA +2367 4687 586 Limited to schools with at least 10 students with merged PSSA and SAT scores
HumRRO 46 April 2004
Table 49 Correlation of Difference in School-Level Mean SAT Math Score and PSSA Math Score Between the Classes of 2002 and 2003
Difference in Mean School-Level Math Score From the Class of 2002 and Class of 2003 SAT PSSA
SAT 1
PSSA 644 1
-200 -100 0 100 200
Difference in School-Level PSSA Math Mean Scale Score between the Class of 2002 and Class of 2003
-100
-50
0
50
100
Diff
eren
ce i
n Sc
hool
-Lev
el S
AT
Mat
h M
ean
Scor
e
betw
e en
the
Clas
s of
200
2 an
d Cl
ass
of 2
003
$
$$ $
$
$$
$
$$
$
$
$$
$
$
$$ $$
$
$
$
$
$
$
$
$
$$$
$
$
$$$
$
$
$
$
$
$
$$
$
$
$
$
$
$
$
$
$$$ $
$
$$
$
$
$
$
$$ $$
$$
$
$
$
$
$
$
$
$$
$
$$
$
$$
$
$
$
$
$ $$$
$
$
$
$
$
$
$
$$
$
$
$
$$
$
$
$
$
$
$ $
$$
$
$
$
$$
$
$$
$
$
$
$
$
$
$
$
$
$$
$
$$
$$
$
$
$
$
$
$$
$
$
$$
$
$
$
$$
$
$
$
$
$
$
$
$
$
$
$
$
$
$
$
$
$$
$
$
$$ $
$
$
$
$
$$
$
$
$
$
$
$
$
$
$
$
$
$
$
$
$
$
$
$
$$
$
$
$
$
$
$
$
$
$
$
$$
$
$
$
$
$$$
$
$
$
$
$
$
$ $$
$
$
$
$
$$
$
$
$
$
$
$$$
$
$
$$$
$
$
$
$
$$
$
$
$$
$
$
$$$
$
$
$
$
$
$
$$$
$
$
$
$
$$
$
$
$
$
$
$
$
$ $
$
$
$
$
$
$
$
$
$
$
$
$
$
$
$
$
$
$
$
$
$
$$$$
$$
$$
$
$$$
$$
$
$$
$
$
$
$
$
$
$
$$
$
$$
$
$
$
$
$
$$
$
$
$
$
$
$$
$
$$
$
$
$$
$
$
$
$
$
$
$
$
$
$
$ $
$
$
$
$
$$
$
$$$ $
$
$
$
$
$
$ $
$$
$
$$
$
$
$$
$ $
$$
$
$
$
$
$
$
$
$
$
$
$
$$
$
$
$
$
$
$
$
$ $
$$
$
$
$
$
$$ $
$
$$
$
$$
$$
$
$
$
$
$
$
$
$
$
$
$$
$
$$
$
$
$$
$
$
$
$
$$
$$
$$$
$$
$
$
$
$$
$
$$
$
$$
$
$
$
$
$
$
$
$
$
$
$
$
$ $$
$
$
$
$
$$
$
$
$
$$
$
$
$
$
$$
$
$$$$
$
$
$
$$$ $
$
$$
$
$
$
$
$
$$
$
$
$$
$$
$ $ $
$
$
$
$
$$
$
$$
$$
$
$
$
$$
$
$
$
$$
$
$
$
$
$
$
$
$$
$
$
$$
$
$
$
Figure 18 Scatterplot of differences in school-level mean SAT math score and school-level mean PSSA math scores between the Classes of 2002 and 2003
Pooled Within-School Correlations
The above discussion alluded to school-level factors such as differences in grading practices which may be impacting observed correlations Figure 19 depicts an extreme version of such a situation Schools A B and C are clearly different in where their students lie with respect to PSSA or SAT scores but they are identical in terms of the grades their students
HumRRO 47 April 2004
receive Also within each school there is a relationship between grades and either PSSA scores or SAT scores However if a correlation were calculated using students from all schools without regard to school-level characteristics it would be zero
School A
School B PSSA or SAT Scores
School C
Grade Point Average (GPA)
Figure 19 Extreme hypothetical illustration of how mean differences among schools on PSSA or SAT scores that are not mirrored by differences in GPA can impact correlations (Ellipses represent students scores within each school)
Pooled within-school correlations are used to estimate relationships between measures calculated within schools and then averaged across all schools These pooled within-school correlations were calculated for each of the two years of data (Table 50 for the Class of 2002 and Table 51 for the Class of 2003) and then averaged across the two years (Table 52)5 The resulting average pooled within-school correlations are presented in Table 52
5 Again the technical r to z correction was used
HumRRO 48 April 2004
Table 50 Pooled Within-School Correlation for the Class of 2002 PSSA SAT Course Grades
Variable Reading Math Verbal Math GPA (Total) English Math
ReadingPSSA
Math
1000
0648 1000
Verbal SAT
Math
0693 0650
0569 0832
1000
0695 1000
GPA
English Course
Grades Math
0528 0573
0461 0412
0361 0542
0516 0559
0465 0402
0349 0541
1000
0703 1000
0668 0443 1000 Limited to schools with at least 10 students with merged PSSA and SAT scores
Table 51 Pooled Within-School Correlation for the Class of 2003 PSSA SAT Course Grades
Variable Reading Math Verbal Math GPA (Total) English Math
ReadingPSSA
Math
1000
0702 1000
Verbal SAT
Math
0757 0629
0666 0857
1000
0662 1000
GPA
English Course
Grades Math
0512 0564
0457 0405
0350 0541
0534 0679
0466 0414
0369 0548
1000
0698 1000
0667 0443 1000 Limited to schools with at least 10 students with merged PSSA and SAT scores
HumRRO 49 April 2004
Table 52 Pooled Within-School Correlation Averaged for Classes of 2002 and 2003 PSSA SAT Course Grades
Variable Reading Math Verbal Math GPA (Total) English Math
ReadingPSSA
Math
1000
0676 1000
Verbal SAT
Math
0727 0640
0620 0845
1000
0679 1000
GPA
English Course
Grades Math
0520 0569
0459 0409
0356 0542
0525 0569
0466 0408
0359 0546
1000
0701 1000
0668 0443 1000 Limited to schools with at least 10 students with merged PSSA and SAT scores
If differences between schoolsrsquo grading procedures are substantial and if within schools students with higher grades also have higher PSSA scores then the correlations in Table 52 will be higher than student correlations in Table 10 (student-level correlations averaged for the Classes of 2002 and 2003) The difference between the GPA correlations in Table 10 and Table 52 however are only marginally different (see Table 53) In nearly all cases the within-school correlations are higher However the range is relatively smallmdash0009 to 0039 for GPA 0176 to 0219 for English course grades and 0147 to 0237 for math course grades Thus grading differences among schools do appear to exist but the effect is small for studentsrsquo GPA but larger for both English and math course grades especially when compared to the matching assessment component (ie English course grade to PSSA reading and SAT verbal math course grade to PSSA math and SAT math)
HumRRO 50 April 2004
Table 53 Differences Between Student-Level Correlations and Pooled Within-School Correlations Averaged for the Classes of 2002 and 2003
GPA or Course Grade to Student-Level Pooled Within- Difference in Assessment Correlations School Correlations Correlations
GPA to PSSA Reading 0511 0520 0009
GPA to PSSA Math 0546 0569 0023
GPA to SAT Verbal 0494 0525 0031
GPA to SAT Math 0530 0569 0039
English to PSSA Reading 0240 0459 0219
English to PSSA Math 0226 0409 0183
English to SAT Verbal 0256 0466 0210
English to SAT Math 0232 0408 0176
Math to PSSA Reading 0202 0356 0154
Math to PSSA Math 0305 0542 0237
Math to SAT Verbal 0212 0359 0147
Math to SAT Math 0313 0546 0233
Comparison of the correlations in Table 52 to Table 10 can also be used to test a hypothesis about the relationship between PSSA and SAT performance It is suggested above that some schools might be working more successfully toward improving PSSA performance than others Again if these efforts are only tangentially affecting SAT scores then we might expect mean differences among schools on PSSA scores that are not mirrored by differences on SAT Within schools however we can still expect students who do better on PSSA to also have a tendency to do better on SAT Figure 20 provides an extreme illustration of this potential effect Comparing correlations between PSSA and SAT from Table 52 to Table 10 reveals no such trend (see Table 54) The differences are all small (-0020 to +0009) suggesting that there are no significant differences among schools in the average PSSA scores of their students that are not mirrored by differences in studentsrsquo SAT scores This conclusion is consistent with the earlier conclusion from the individual level data That is no strong methodological differences in skills requirements are evidenced
HumRRO 51 April 2004
SAT Scores
School A School B School C
PSSA Scale Scores
Figure 20 Extreme hypothetical illustration of how mean differences among schools on PSSA scores that are not mirrored by differences on SAT scores can impact correlations (Ellipses represent students scores within each school)
Table 54 Differences Between SAT and PSSA Components for Student-Level Correlations and Pooled Within-School Correlations Averaged for the Classes of 2002 and 2003
GPA or Course Grade to Student-Level Pooled Within- Difference in Assessment Correlations School Correlations Correlations
PSSA Reading to SAT Verbal 0742 0727 -0015
PSSA Reading to SAT Math 0690 0640 -0020
PSSA Math to SAT Verbal 0629 0620 +0009
PSSA Math to SAT Math 0856 0845 -0009
A third comparison can also be made with the pooled within-school correlations This concerns the intercorrelations within each assessment format The pooled within-school PSSA intercorrelation (Table 52) shows a very slight decrease from student-level PSSA correlations (Table 10) while the pooled within-school SAT intercorrelation (Table 52) shows a larger increase from the student-level SAT intercorrelations (Table 10) It is possible that this is due to an increased homogeneity for the pooled within-school results However Figure 21 presents an exaggerated illustration of another manner in which this difference might be obtained This pattern would yield higher correlations for all students than for students within a school and a higher correlation of school-level scores (school-level PSSA intercorrelation is 0866 school-level SAT intercorrelation is 0942 [both from Table 45]) than for student-level scores (student-level PSSA is 0686 student-level SAT intercorrelation is 0737 [both from Table 10]) Although small (see Table 55) this is the pattern of differences in correlations obtained for both PSSA intercorrelations and for SAT intercorrelations Note that the difference between the PSSA components is smaller than the difference between the SAT components The obtained pattern
HumRRO 52 April 2004
like that in Figure 21 but much less exaggerated could result from differences between schools in the population of their students from differences in instruction that impact PSSA and SAT test scores or both
Content
Area B School A
School B
School C
Content Area A
Figure 21 Exaggerated illustration of how mean differences among schools can increase overall correlations (Ellipses represent students scores within each school)
Table 55 Internal Differences between SAT and PSSA Components for Student-Level Correlations and Pooled Within-School Correlations Averaged for the Classes of 2002 and 2003
GPA or Course Grade to Student-Level Pooled With- Difference in Assessment Correlations School Correlations Correlations
PSSA Reading to PSSA Math 0686 0676 -0010
SAT Verbal to SAT Math 0737 0845 0108
Summary and Conclusion The purpose of this report is to explore the validity questions ldquoAre PSSA scores
appropriately related to other measures of educational achievementrdquo
The data presented in this report suggest the following main points
bull Students who do well on any of the assessments tend to do well on all of the assessmentsmdashPSSA SAT GPA or course grades
bull When schoolsrsquo means are calculated using only the SAT-taking population of students schools with high scores on SAT also have high PSSA scores GPA and course grades are also related to both PSSA and SAT although not as strongly as the relationship between the PSSA and SAT
HumRRO 53 April 2004
PSSA exhibits strong convergent validity coefficients Correlations are very high between PSSA and SAT PSSA is positively correlated with other measures of student achievement including course grades and GPA Gains on PSSA are reflective of changes on SAT at the school level All these data provide strong evidence in support of PSSA as a valid measure of student achievement
There are however a few clarifications and qualifications to these general conclusions but none that diminish the basic findings These clarifications and qualifications include the following
Changes in scores Both mean PSSA and SAT scores experienced an increase Changes between the two assessments are positively correlated Schools that have gained on one assessment tend to have also gained on the other assessment However the same relationship is also true for those schools that have decreased
PSSA and SAT are tied to different content domains use differently formatted items and were designed to serve very different purposes However it is clear from the data that students who tend to perform well on the PSSA can also be expected to perform well on the SAT and vice-versa It is clear from the data that schools that perform well on one test can be expected to perform well on the other It is also clear that schools that improve on one test can be expected to improve on the other
Discriminant validity At the student level and the school level the different assessments of mathematics achievement are more highly related to each other than to assessments of other subjects Students with high mathematics scores on one assessment will tend to do well on all other assessments but that tendency is most pronounced for other mathematics assessments The same holds for school scores There is a similar differentiation on readingverbal assessments at both the student and school level but not as pronounced as in mathematics
GPA shows positive relationships with both PSSA and SAT assessments at the student and school level but not as pronounced as the relationship between the two assessments This is interpreted as being due to differences in schoolsrsquo grading practices Grading practices apparently differ sufficiently to reduce school-level associations with PSSA and SAT scores
Neither gender race socioeconomic status nor limited English proficiency appear to influence the PSSA scores any more than would be expected based on observed differences for SAT scores In other words PSSA items are not injecting any unexpected gender racialethnic socioeconomic status or limited English proficiency bias
HumRRO 54 April 2004
References
Camara WJ amp Schmidt AE (1999) Group differences in standardized testing and social stratification (College Board Report No 99-5) New York College Entrance Examination Board
Campbell D T amp Fiske D W (1959) Convergent and discriminant validation by the multitrait-multimethod matrix Psychological Bulletin 56(2) 81-105
Cassady JC (2001) Self-reported GPA and SAT A Methodological Note Practical Assessment Research amp Evaluation 7(12)
Coe Robert (2002) Itrsquos the effect size stupid What effect size is and why itrsquos important Paper presented at the Annual Conference of the British Educational Research Association University of Exeter England Retrieved from httpwwwleedsacukeducoldocuments00002182htm
Cohen J (1988) Statistical power analysis for the behavioral sciences (2nd ed) Hillsdale NJ Erlbaum
Hoffman R G (1998) Relationships among Kentuckyrsquos open-response assessments ACT scores and studentsrsquo self-reported high school grades (HumRRO Report FR-WATSD-98-27) Radcliff KY Human Resources Research Organization
Lewis DM Mitzel HC amp Green DR (1996) Standard setting A bookmark approach Symposium presented at the Council of Chief State School Officers Conference on Large ndashScale Assessment Phoenix AZ
Livingston SA amp Zieky MJ (1978) Manual for setting standards on the Basic Skills Assessment Test Princeton NJ Educational Testing Service
Mead R amp Melby K (2003 February) Technical analysis Pennsylvania System of School Assessment 2003 reading and mathematics PSSA Data Recognition Corporation
Mead R amp Melby K (2002 April) Technical analysis Pennsylvania System of School Assessment 2001 reading and mathematics PSSA Data Recognition Corporation
Mead R Smith RM amp Swanlund A (2003) Technical analysis 2003 Pennsylvania System of School Assessment mathematics and reading Data Recognition Corporation
NCLB (2004) httpwwwedgovnclblandingjtml
Sicoly Fiore (2002) What do school-level scores from large-scale assessments really measure Educational Measurement Issues and Practice 21(4) 17-26
Terenzini PT Cabrera AF amp Bernal EM (2001) Swimming against the tide The poor in American higher education (Research Report No 2001-1) New York College Entrance Examination Board
Willingham WW amp Cole NS (1997) Gender and Fair Assessment Hillsdale NJ Erlbaum
HumRRO 55 April 2004
HumRROKDE April 2003
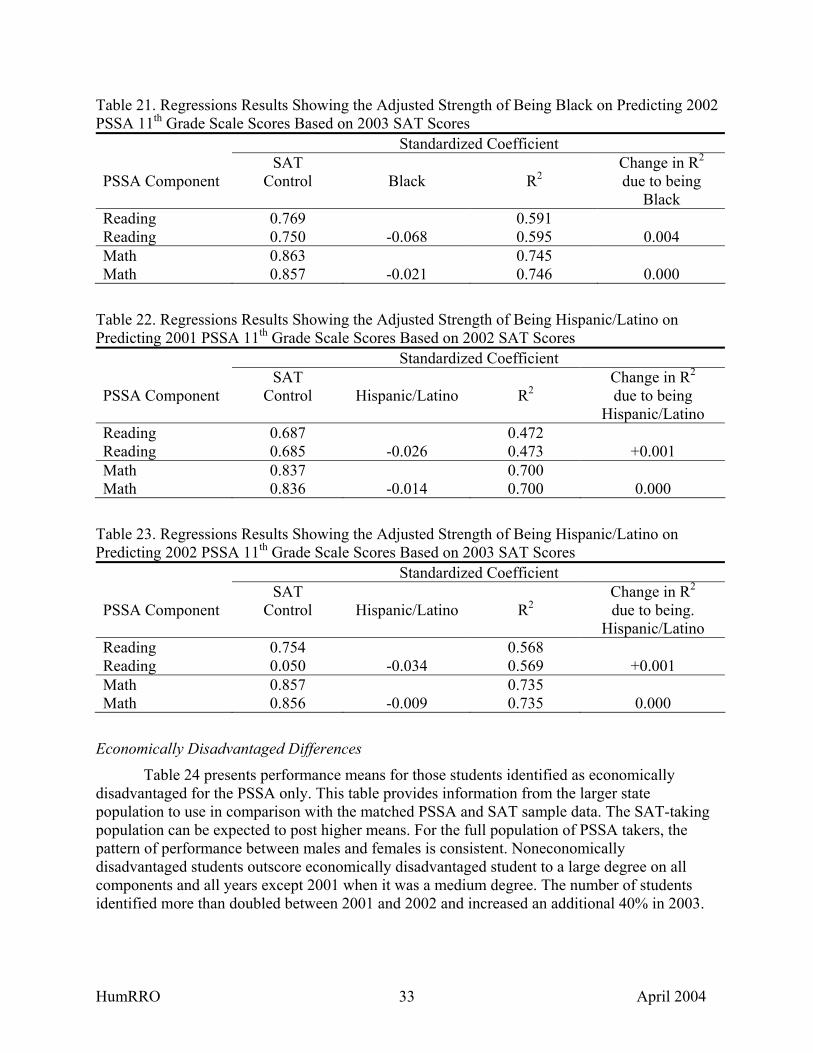
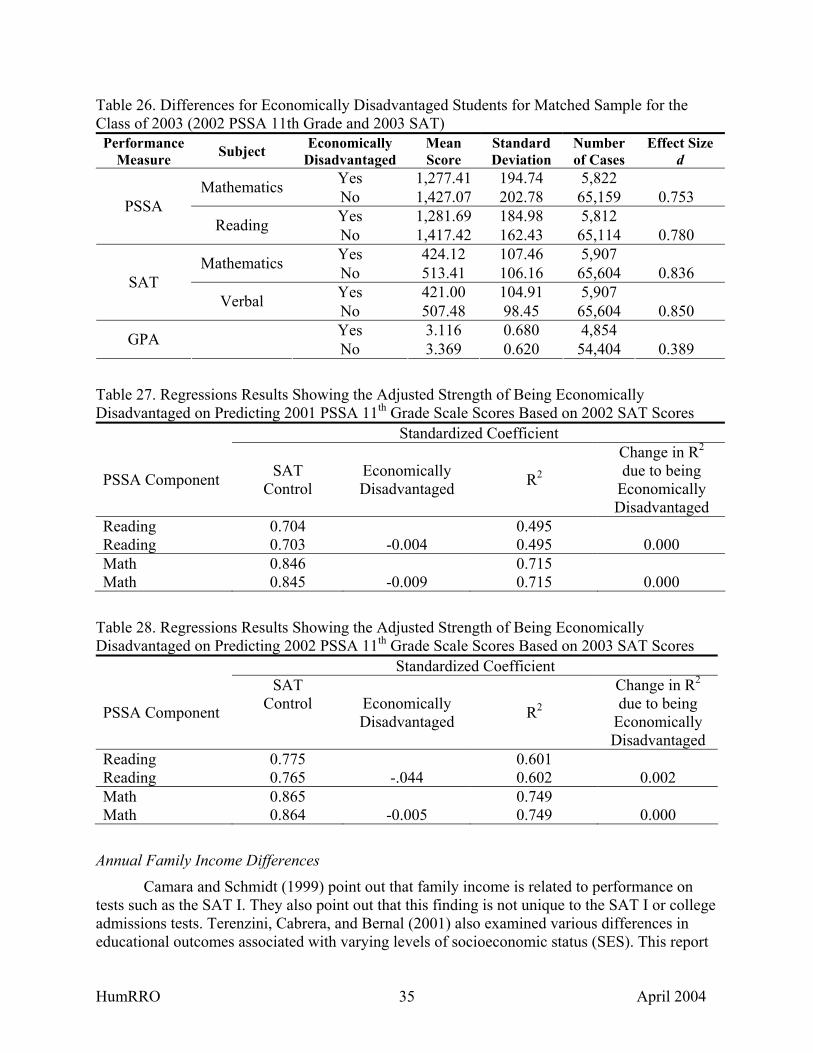
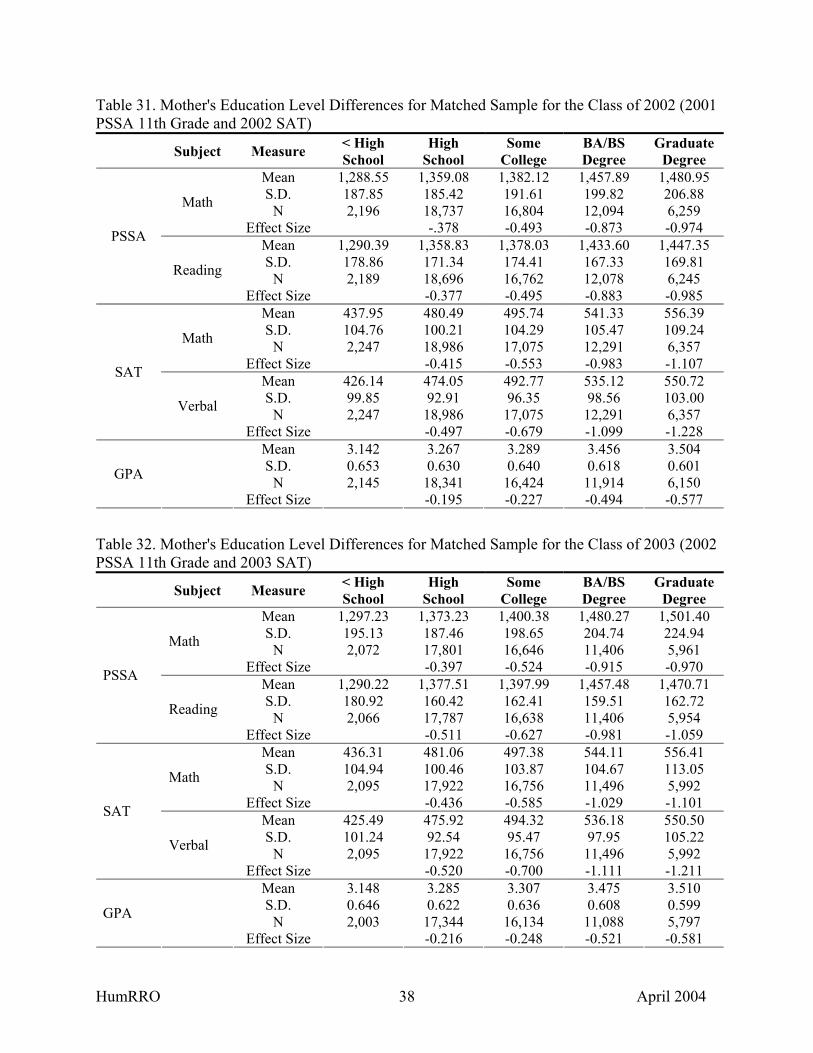
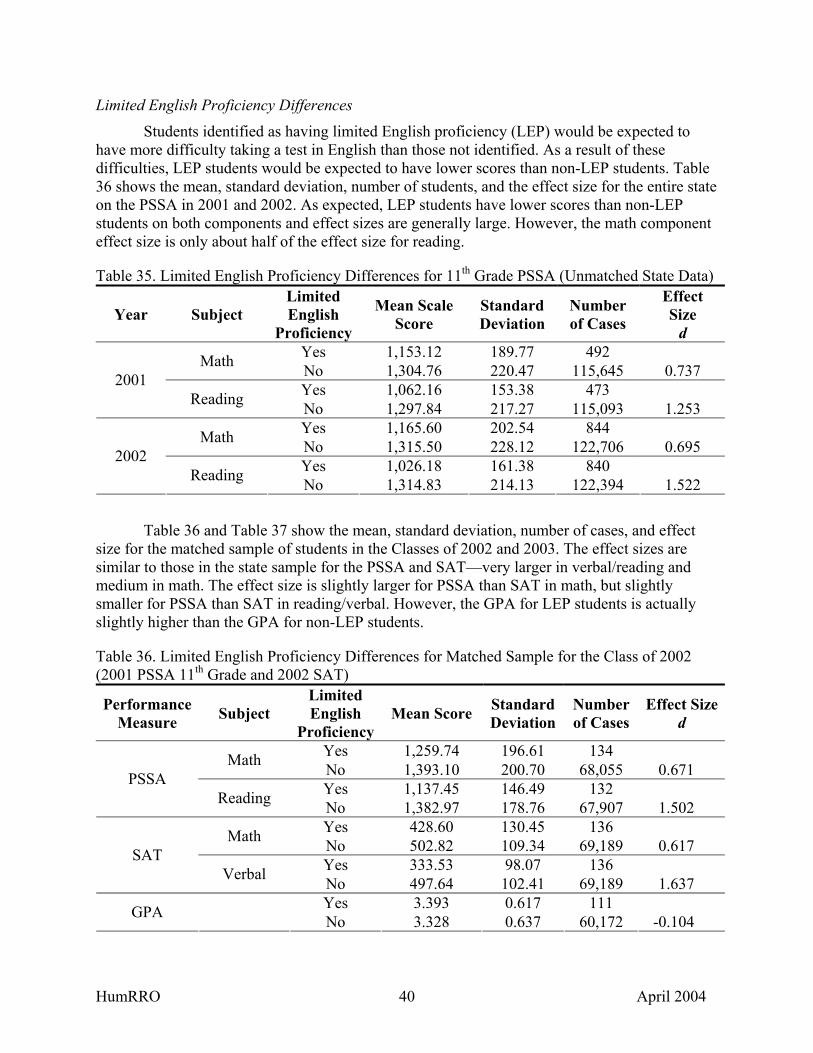
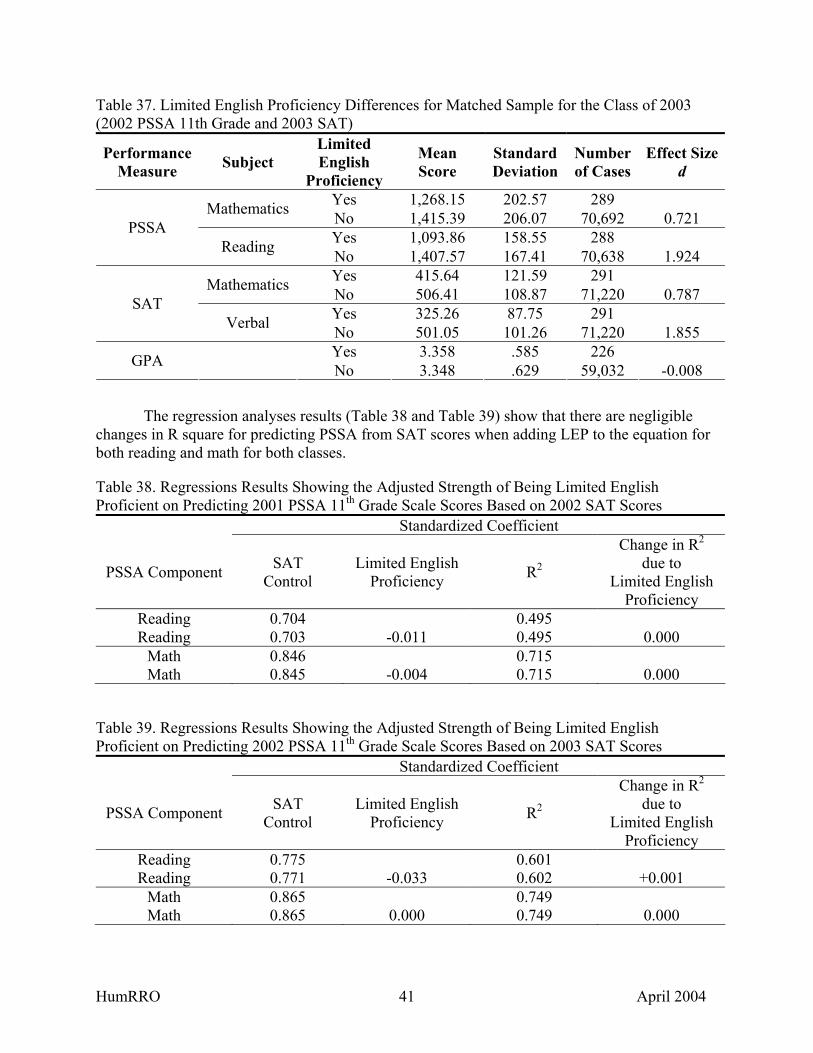

-200 -100 0 100 200
Difference in School-Level PSSA Reading Mean Score between the Class of 2002 and Class of 2003
-100
-50
0
50
100
Diff
eren
ce in
Sch
ool-L
evel
SA
T V
erba
l Mea
n Sc
ore
betw
een
Cla
ss o
f 200
2 an
d C
lass
of 2
003
$
$$
$
$
$
$$
$
$$
$
$
$
$
$
$
$
$$
$
$
$
$
$
$
$
$
$
$
$
$
$
$$
$
$
$
$
$
$
$
$
$
$ $
$$
$
$
$
$
$
$
$
$$
$
$$
$ $
$$$ $$
$
$
$
$
$
$
$
$
$
$
$
$
$
$$
$
$
$
$$
$$
$$$
$
$$
$
$
$$
$$
$
$
$
$
$
$
$
$
$
$$$
$$$
$
$
$
$
$
$$
$$
$
$$
$
$
$
$
$
$
$
$
$
$
$
$
$
$
$
$
$
$ $
$$
$
$$$ $$
$
$$$
$$
$
$
$
$
$
$
$
$$
$$
$
$
$
$
$
$
$
$
$
$$
$$
$
$$
$
$
$$
$
$
$
$$
$
$$
$
$$
$
$
$
$
$
$
$
$
$
$
$$
$
$$
$$
$
$$$$
$$
$$
$
$$
$
$
$
$
$$
$
$
$
$$
$
$ $$$
$
$ $$
$
$
$
$$
$
$$
$
$
$
$ $$$
$$
$$
$
$ $
$
$
$$
$
$
$
$
$
$
$$
$
$
$ $
$
$
$
$
$$
$
$
$$
$
$
$
$ $$
$
$
$ $
$$
$
$
$
$
$
$
$
$
$
$
$$
$
$
$$ $
$
$
$
$$
$
$
$$ $
$
$
$
$
$
$
$
$
$
$
$
$
$ $
$
$$
$
$$
$
$
$
$
$
$$
$
$
$
$
$
$
$
$
$$
$
$$
$
$
$$$ $
$
$
$$
$$
$
$$
$
$
$ $$ $
$ $
$$
$
$
$$$$
$
$$$
$
$$
$
$
$
$ $
$
$
$
$
$ $$
$
$
$
$
$
$ $
$ $ $
$
$
$
$
$$
$
$
$
$
$
$
$
$ $
$
$$
$
$$ $
$
$
$
$
$
$
$
$ $
$$
$
$
$
$
$
$
$
$$
$
$$
$
$
$
$
$$
$
$
$
$$
$$
$
$
$ $$$
$
$
$
$
$
$
$$$$
$
$$
$
$
$$
$
$$
$
$
$
$$$
$
$$
$
$
$
$
$$
$$
$
$
$
$$
$
$$
$$
$$
$
$
$
$
$$
$
$
$
$$
$
$
$
$
$
$$
$
$
$
$
$$
$
$
$
$
$
$
$$
$$
Figure 17 Scatterplot of difference in school-level SAT verbal mean scores and school-level PSSA 11th grade reading mean scores between the Class of 2002 and Class of 2003
Table 48 Difference in Mean School-Level SAT Math and PSSA Math Scores From the Class of 2002 and Class of 2003
Difference in Mean School-Level Math Score From the Class of 2002 and Class of 2003 Mean Standard
Deviation Number of
Schools
SAT +313 1842 586
PSSA +2367 4687 586 Limited to schools with at least 10 students with merged PSSA and SAT scores
HumRRO 46 April 2004
Table 49 Correlation of Difference in School-Level Mean SAT Math Score and PSSA Math Score Between the Classes of 2002 and 2003
Difference in Mean School-Level Math Score From the Class of 2002 and Class of 2003 SAT PSSA
SAT 1
PSSA 644 1
-200 -100 0 100 200
Difference in School-Level PSSA Math Mean Scale Score between the Class of 2002 and Class of 2003
-100
-50
0
50
100
Diff
eren
ce i
n Sc
hool
-Lev
el S
AT
Mat
h M
ean
Scor
e
betw
e en
the
Clas
s of
200
2 an
d Cl
ass
of 2
003
$
$$ $
$
$$
$
$$
$
$
$$
$
$
$$ $$
$
$
$
$
$
$
$
$
$$$
$
$
$$$
$
$
$
$
$
$
$$
$
$
$
$
$
$
$
$
$$$ $
$
$$
$
$
$
$
$$ $$
$$
$
$
$
$
$
$
$
$$
$
$$
$
$$
$
$
$
$
$ $$$
$
$
$
$
$
$
$
$$
$
$
$
$$
$
$
$
$
$
$ $
$$
$
$
$
$$
$
$$
$
$
$
$
$
$
$
$
$
$$
$
$$
$$
$
$
$
$
$
$$
$
$
$$
$
$
$
$$
$
$
$
$
$
$
$
$
$
$
$
$
$
$
$
$
$$
$
$
$$ $
$
$
$
$
$$
$
$
$
$
$
$
$
$
$
$
$
$
$
$
$
$
$
$
$$
$
$
$
$
$
$
$
$
$
$
$$
$
$
$
$
$$$
$
$
$
$
$
$
$ $$
$
$
$
$
$$
$
$
$
$
$
$$$
$
$
$$$
$
$
$
$
$$
$
$
$$
$
$
$$$
$
$
$
$
$
$
$$$
$
$
$
$
$$
$
$
$
$
$
$
$
$ $
$
$
$
$
$
$
$
$
$
$
$
$
$
$
$
$
$
$
$
$
$
$$$$
$$
$$
$
$$$
$$
$
$$
$
$
$
$
$
$
$
$$
$
$$
$
$
$
$
$
$$
$
$
$
$
$
$$
$
$$
$
$
$$
$
$
$
$
$
$
$
$
$
$
$ $
$
$
$
$
$$
$
$$$ $
$
$
$
$
$
$ $
$$
$
$$
$
$
$$
$ $
$$
$
$
$
$
$
$
$
$
$
$
$
$$
$
$
$
$
$
$
$
$ $
$$
$
$
$
$
$$ $
$
$$
$
$$
$$
$
$
$
$
$
$
$
$
$
$
$$
$
$$
$
$
$$
$
$
$
$
$$
$$
$$$
$$
$
$
$
$$
$
$$
$
$$
$
$
$
$
$
$
$
$
$
$
$
$
$ $$
$
$
$
$
$$
$
$
$
$$
$
$
$
$
$$
$
$$$$
$
$
$
$$$ $
$
$$
$
$
$
$
$
$$
$
$
$$
$$
$ $ $
$
$
$
$
$$
$
$$
$$
$
$
$
$$
$
$
$
$$
$
$
$
$
$
$
$
$$
$
$
$$
$
$
$
Figure 18 Scatterplot of differences in school-level mean SAT math score and school-level mean PSSA math scores between the Classes of 2002 and 2003
Pooled Within-School Correlations
The above discussion alluded to school-level factors such as differences in grading practices which may be impacting observed correlations Figure 19 depicts an extreme version of such a situation Schools A B and C are clearly different in where their students lie with respect to PSSA or SAT scores but they are identical in terms of the grades their students
HumRRO 47 April 2004
receive Also within each school there is a relationship between grades and either PSSA scores or SAT scores However if a correlation were calculated using students from all schools without regard to school-level characteristics it would be zero
School A
School B PSSA or SAT Scores
School C
Grade Point Average (GPA)
Figure 19 Extreme hypothetical illustration of how mean differences among schools on PSSA or SAT scores that are not mirrored by differences in GPA can impact correlations (Ellipses represent students scores within each school)
Pooled within-school correlations are used to estimate relationships between measures calculated within schools and then averaged across all schools These pooled within-school correlations were calculated for each of the two years of data (Table 50 for the Class of 2002 and Table 51 for the Class of 2003) and then averaged across the two years (Table 52)5 The resulting average pooled within-school correlations are presented in Table 52
5 Again the technical r to z correction was used
HumRRO 48 April 2004
Table 50 Pooled Within-School Correlation for the Class of 2002 PSSA SAT Course Grades
Variable Reading Math Verbal Math GPA (Total) English Math
ReadingPSSA
Math
1000
0648 1000
Verbal SAT
Math
0693 0650
0569 0832
1000
0695 1000
GPA
English Course
Grades Math
0528 0573
0461 0412
0361 0542
0516 0559
0465 0402
0349 0541
1000
0703 1000
0668 0443 1000 Limited to schools with at least 10 students with merged PSSA and SAT scores
Table 51 Pooled Within-School Correlation for the Class of 2003 PSSA SAT Course Grades
Variable Reading Math Verbal Math GPA (Total) English Math
ReadingPSSA
Math
1000
0702 1000
Verbal SAT
Math
0757 0629
0666 0857
1000
0662 1000
GPA
English Course
Grades Math
0512 0564
0457 0405
0350 0541
0534 0679
0466 0414
0369 0548
1000
0698 1000
0667 0443 1000 Limited to schools with at least 10 students with merged PSSA and SAT scores
HumRRO 49 April 2004
Table 52 Pooled Within-School Correlation Averaged for Classes of 2002 and 2003 PSSA SAT Course Grades
Variable Reading Math Verbal Math GPA (Total) English Math
ReadingPSSA
Math
1000
0676 1000
Verbal SAT
Math
0727 0640
0620 0845
1000
0679 1000
GPA
English Course
Grades Math
0520 0569
0459 0409
0356 0542
0525 0569
0466 0408
0359 0546
1000
0701 1000
0668 0443 1000 Limited to schools with at least 10 students with merged PSSA and SAT scores
If differences between schoolsrsquo grading procedures are substantial and if within schools students with higher grades also have higher PSSA scores then the correlations in Table 52 will be higher than student correlations in Table 10 (student-level correlations averaged for the Classes of 2002 and 2003) The difference between the GPA correlations in Table 10 and Table 52 however are only marginally different (see Table 53) In nearly all cases the within-school correlations are higher However the range is relatively smallmdash0009 to 0039 for GPA 0176 to 0219 for English course grades and 0147 to 0237 for math course grades Thus grading differences among schools do appear to exist but the effect is small for studentsrsquo GPA but larger for both English and math course grades especially when compared to the matching assessment component (ie English course grade to PSSA reading and SAT verbal math course grade to PSSA math and SAT math)
HumRRO 50 April 2004
Table 53 Differences Between Student-Level Correlations and Pooled Within-School Correlations Averaged for the Classes of 2002 and 2003
GPA or Course Grade to Student-Level Pooled Within- Difference in Assessment Correlations School Correlations Correlations
GPA to PSSA Reading 0511 0520 0009
GPA to PSSA Math 0546 0569 0023
GPA to SAT Verbal 0494 0525 0031
GPA to SAT Math 0530 0569 0039
English to PSSA Reading 0240 0459 0219
English to PSSA Math 0226 0409 0183
English to SAT Verbal 0256 0466 0210
English to SAT Math 0232 0408 0176
Math to PSSA Reading 0202 0356 0154
Math to PSSA Math 0305 0542 0237
Math to SAT Verbal 0212 0359 0147
Math to SAT Math 0313 0546 0233
Comparison of the correlations in Table 52 to Table 10 can also be used to test a hypothesis about the relationship between PSSA and SAT performance It is suggested above that some schools might be working more successfully toward improving PSSA performance than others Again if these efforts are only tangentially affecting SAT scores then we might expect mean differences among schools on PSSA scores that are not mirrored by differences on SAT Within schools however we can still expect students who do better on PSSA to also have a tendency to do better on SAT Figure 20 provides an extreme illustration of this potential effect Comparing correlations between PSSA and SAT from Table 52 to Table 10 reveals no such trend (see Table 54) The differences are all small (-0020 to +0009) suggesting that there are no significant differences among schools in the average PSSA scores of their students that are not mirrored by differences in studentsrsquo SAT scores This conclusion is consistent with the earlier conclusion from the individual level data That is no strong methodological differences in skills requirements are evidenced
HumRRO 51 April 2004
SAT Scores
School A School B School C
PSSA Scale Scores
Figure 20 Extreme hypothetical illustration of how mean differences among schools on PSSA scores that are not mirrored by differences on SAT scores can impact correlations (Ellipses represent students scores within each school)
Table 54 Differences Between SAT and PSSA Components for Student-Level Correlations and Pooled Within-School Correlations Averaged for the Classes of 2002 and 2003
GPA or Course Grade to Student-Level Pooled Within- Difference in Assessment Correlations School Correlations Correlations
PSSA Reading to SAT Verbal 0742 0727 -0015
PSSA Reading to SAT Math 0690 0640 -0020
PSSA Math to SAT Verbal 0629 0620 +0009
PSSA Math to SAT Math 0856 0845 -0009
A third comparison can also be made with the pooled within-school correlations This concerns the intercorrelations within each assessment format The pooled within-school PSSA intercorrelation (Table 52) shows a very slight decrease from student-level PSSA correlations (Table 10) while the pooled within-school SAT intercorrelation (Table 52) shows a larger increase from the student-level SAT intercorrelations (Table 10) It is possible that this is due to an increased homogeneity for the pooled within-school results However Figure 21 presents an exaggerated illustration of another manner in which this difference might be obtained This pattern would yield higher correlations for all students than for students within a school and a higher correlation of school-level scores (school-level PSSA intercorrelation is 0866 school-level SAT intercorrelation is 0942 [both from Table 45]) than for student-level scores (student-level PSSA is 0686 student-level SAT intercorrelation is 0737 [both from Table 10]) Although small (see Table 55) this is the pattern of differences in correlations obtained for both PSSA intercorrelations and for SAT intercorrelations Note that the difference between the PSSA components is smaller than the difference between the SAT components The obtained pattern
HumRRO 52 April 2004
like that in Figure 21 but much less exaggerated could result from differences between schools in the population of their students from differences in instruction that impact PSSA and SAT test scores or both
Content
Area B School A
School B
School C
Content Area A
Figure 21 Exaggerated illustration of how mean differences among schools can increase overall correlations (Ellipses represent students scores within each school)
Table 55 Internal Differences between SAT and PSSA Components for Student-Level Correlations and Pooled Within-School Correlations Averaged for the Classes of 2002 and 2003
GPA or Course Grade to Student-Level Pooled With- Difference in Assessment Correlations School Correlations Correlations
PSSA Reading to PSSA Math 0686 0676 -0010
SAT Verbal to SAT Math 0737 0845 0108
Summary and Conclusion The purpose of this report is to explore the validity questions ldquoAre PSSA scores
appropriately related to other measures of educational achievementrdquo
The data presented in this report suggest the following main points
bull Students who do well on any of the assessments tend to do well on all of the assessmentsmdashPSSA SAT GPA or course grades
bull When schoolsrsquo means are calculated using only the SAT-taking population of students schools with high scores on SAT also have high PSSA scores GPA and course grades are also related to both PSSA and SAT although not as strongly as the relationship between the PSSA and SAT
HumRRO 53 April 2004
PSSA exhibits strong convergent validity coefficients Correlations are very high between PSSA and SAT PSSA is positively correlated with other measures of student achievement including course grades and GPA Gains on PSSA are reflective of changes on SAT at the school level All these data provide strong evidence in support of PSSA as a valid measure of student achievement
There are however a few clarifications and qualifications to these general conclusions but none that diminish the basic findings These clarifications and qualifications include the following
Changes in scores Both mean PSSA and SAT scores experienced an increase Changes between the two assessments are positively correlated Schools that have gained on one assessment tend to have also gained on the other assessment However the same relationship is also true for those schools that have decreased
PSSA and SAT are tied to different content domains use differently formatted items and were designed to serve very different purposes However it is clear from the data that students who tend to perform well on the PSSA can also be expected to perform well on the SAT and vice-versa It is clear from the data that schools that perform well on one test can be expected to perform well on the other It is also clear that schools that improve on one test can be expected to improve on the other
Discriminant validity At the student level and the school level the different assessments of mathematics achievement are more highly related to each other than to assessments of other subjects Students with high mathematics scores on one assessment will tend to do well on all other assessments but that tendency is most pronounced for other mathematics assessments The same holds for school scores There is a similar differentiation on readingverbal assessments at both the student and school level but not as pronounced as in mathematics
GPA shows positive relationships with both PSSA and SAT assessments at the student and school level but not as pronounced as the relationship between the two assessments This is interpreted as being due to differences in schoolsrsquo grading practices Grading practices apparently differ sufficiently to reduce school-level associations with PSSA and SAT scores
Neither gender race socioeconomic status nor limited English proficiency appear to influence the PSSA scores any more than would be expected based on observed differences for SAT scores In other words PSSA items are not injecting any unexpected gender racialethnic socioeconomic status or limited English proficiency bias
HumRRO 54 April 2004
References
Camara WJ amp Schmidt AE (1999) Group differences in standardized testing and social stratification (College Board Report No 99-5) New York College Entrance Examination Board
Campbell D T amp Fiske D W (1959) Convergent and discriminant validation by the multitrait-multimethod matrix Psychological Bulletin 56(2) 81-105
Cassady JC (2001) Self-reported GPA and SAT A Methodological Note Practical Assessment Research amp Evaluation 7(12)
Coe Robert (2002) Itrsquos the effect size stupid What effect size is and why itrsquos important Paper presented at the Annual Conference of the British Educational Research Association University of Exeter England Retrieved from httpwwwleedsacukeducoldocuments00002182htm
Cohen J (1988) Statistical power analysis for the behavioral sciences (2nd ed) Hillsdale NJ Erlbaum
Hoffman R G (1998) Relationships among Kentuckyrsquos open-response assessments ACT scores and studentsrsquo self-reported high school grades (HumRRO Report FR-WATSD-98-27) Radcliff KY Human Resources Research Organization
Lewis DM Mitzel HC amp Green DR (1996) Standard setting A bookmark approach Symposium presented at the Council of Chief State School Officers Conference on Large ndashScale Assessment Phoenix AZ
Livingston SA amp Zieky MJ (1978) Manual for setting standards on the Basic Skills Assessment Test Princeton NJ Educational Testing Service
Mead R amp Melby K (2003 February) Technical analysis Pennsylvania System of School Assessment 2003 reading and mathematics PSSA Data Recognition Corporation
Mead R amp Melby K (2002 April) Technical analysis Pennsylvania System of School Assessment 2001 reading and mathematics PSSA Data Recognition Corporation
Mead R Smith RM amp Swanlund A (2003) Technical analysis 2003 Pennsylvania System of School Assessment mathematics and reading Data Recognition Corporation
NCLB (2004) httpwwwedgovnclblandingjtml
Sicoly Fiore (2002) What do school-level scores from large-scale assessments really measure Educational Measurement Issues and Practice 21(4) 17-26
Terenzini PT Cabrera AF amp Bernal EM (2001) Swimming against the tide The poor in American higher education (Research Report No 2001-1) New York College Entrance Examination Board
Willingham WW amp Cole NS (1997) Gender and Fair Assessment Hillsdale NJ Erlbaum
HumRRO 55 April 2004
HumRROKDE April 2003
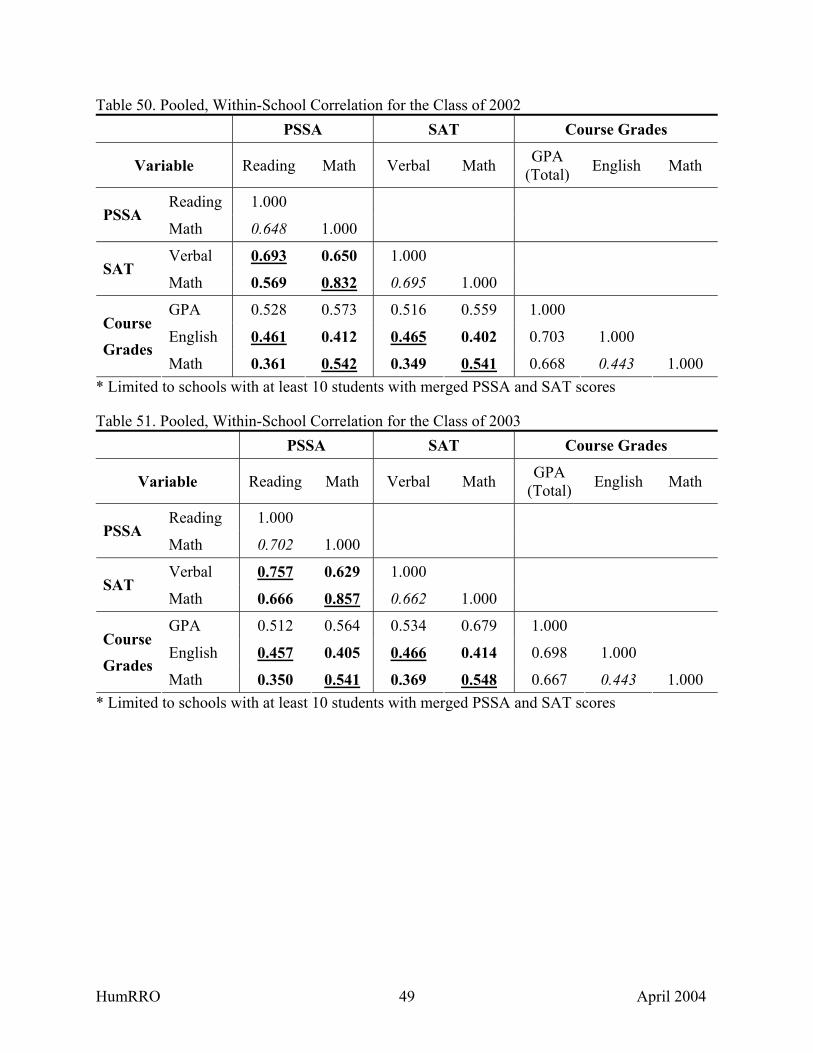
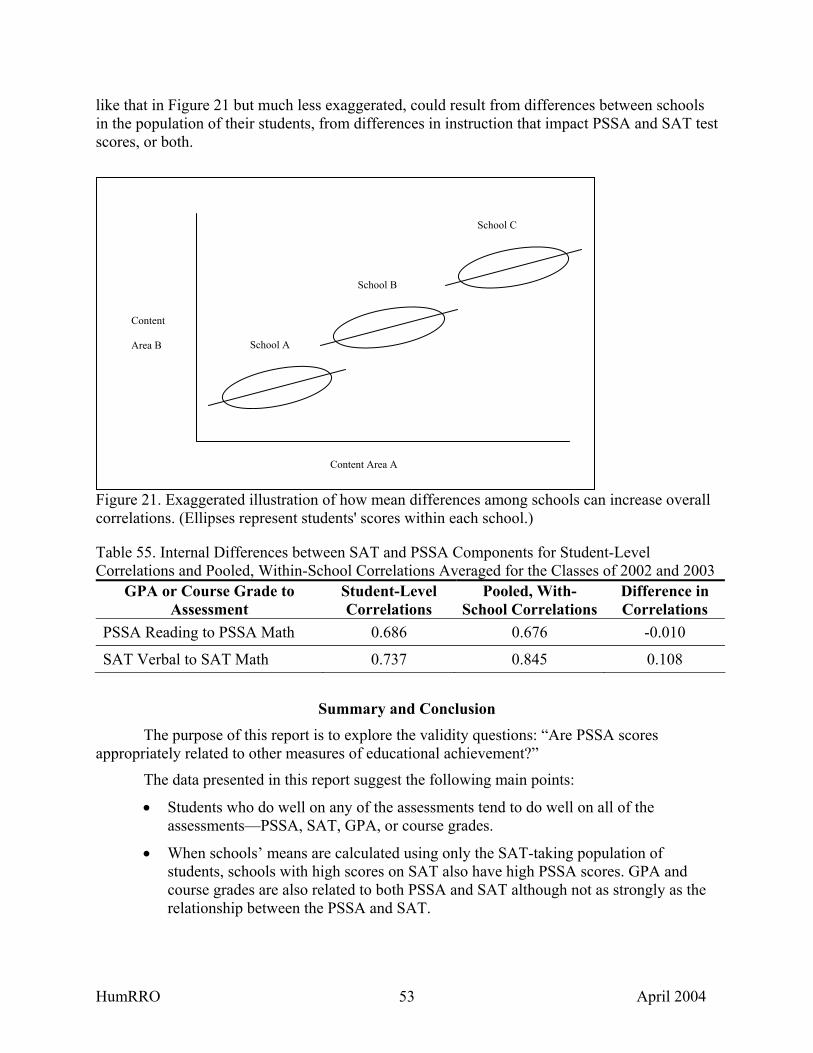

HumRROKDE April 2003