relating introspective accuracy to individual differences...
TRANSCRIPT

increasing the maturation of miR-16 from itsprecursor pre/pri–miR-16. Raphe additionallyresponds to chronic fluoxetine treatment byreleasing S100b, which in turn acts on thenoradrenergic neurons of the locus coeruleus. Bylowering miR-16 levels, S100b unlocks the ex-pression of serotonergic functions in this nor-adrenergic brain area. Our pharmacological andbehavioral data thus posit miR-16 as a centraleffector that regulates SERT expression andmediates the adaptive response of serotonergicand noradrenergic neurons to fluoxetine treatment.
References and Notes1. G. E. Torres, R. R. Gainetdinov, M. G. Caron, Nat. Rev.
Neurosci. 4, 13 (2003).2. E. C. Azmitia, Int. Rev. Neurobiol. 77, 31 (2007).3. O. Berton, E. J. Nestler, Nat. Rev. Neurosci. 7, 137
(2006).
4. Y. Qian, H. E. Melikian, D. B. Rye, A. I. Levey,R. D. Blakely, J. Neurosci. 15, 1261 (1995).
5. D. L. Murphy et al., Neuropharmacology 55, 932 (2008).6. S. Benmansour, W. A. Owens, M. Cecchi, D. A. Morilak,
A. Frazer, J. Neurosci. 22, 6766 (2002).7. D. P. Bartel, Cell 136, 215 (2009).8. C. M. Croce, Nat. Rev. Genet. 10, 704 (2009).9. K. S. Kosik, Nat. Rev. Neurosci. 7, 911 (2006).10. V. K. Gangaraju, H. Lin, Nat. Rev. Mol. Cell Biol. 10,
116 (2009).11. S. Mouillet-Richard et al., J. Biol. Chem. 275, 9186 (2000).12. J. M. Launay, B. Schneider, S. Loric, M. Da Prada,
O. Kellermann, FASEB J. 20, 1843 (2006).13. A. Frazer, J. Clin. Psychopharmacol. 17 (suppl. 1),
2S (1997).14. E. J. Nestler, M. Alreja, G. K. Aghajanian, Biol. Psychiatry
46, 1131 (1999).15. G. Martello et al., Nature 449, 183 (2007).16. M. A. Kim, H. S. Lee, B. Y. Lee, B. D. Waterhouse,
Brain Res. 1026, 56 (2004).17. N. Shanmugam, M. A. Reddy, R. Natarajan, J. Biol. Chem.
283, 36221 (2008).
18. R. Manev, T. Uz, H. Manev, Eur. J. Pharmacol. 420,R1 (2001).
19. A. Surget et al., Neuropsychopharmacology 34,1363 (2009).
20. P. Willner, Psychopharmacology (Berlin) 134, 319 (1997).21. Materials and methods and supporting data are available
on Science Online.22. We thank P. Weil-Malherbe, V. Mutel, F. d’Agostini,
G. Zürcher, E. Borroni, J. L. Moreau, F. Jenck, M. Bühler,and N. Pieron for skillful methodological assistance, andS. Blanquet, M. Briley, and L. Aggerbeck for criticalreading of the manuscript. O.K. is a professor at Paris XIUniversity. This work was funded by CNRS, ANR, andINSERM.
Supporting Online Materialwww.sciencemag.org/cgi/content/full/329/5998/1537/DC1Materials and MethodsFigs. S1 to S10References
14 June 2010; accepted 4 August 201010.1126/science.1193692
Relating Introspective Accuracy toIndividual Differences inBrain StructureStephen M. Fleming,1*† Rimona S. Weil,1,2* Zoltan Nagy,1 Raymond J. Dolan,1 Geraint Rees1,2
The ability to introspect about self-performance is key to human subjective experience, but theneuroanatomical basis of this ability is unknown. Such accurate introspection requires discriminatingcorrect decisions from incorrect ones, a capacity that varies substantially across individuals.We dissociated variation in introspective ability from objective performance in a simple perceptual-decision task, allowing us to determine whether this interindividual variability was associated with adistinct neural basis. We show that introspective ability is correlated with gray matter volume in theanterior prefrontal cortex, a region that shows marked evolutionary development in humans. Moreover,interindividual variation in introspective ability is also correlated with white-matter microstructureconnected with this area of the prefrontal cortex. Our findings point to a focal neuroanatomical substratefor introspective ability, a substrate distinct from that supporting primary perception.
Our moment-to-moment judgments of theoutside world are often subject to intro-spective interrogation. In this context,
introspective or “metacognitive” sensitivity refers
to the ability to discriminate correct from in-correct perceptual decisions (1), and its accuracyis essential for the appropriate guidance ofdecision-making and action (2, 3). For example,low confidence that a recent decision was correctmay prompt us to reexamine the evidence or seeka second opinion. Recently, behavioral studieshave begun to quantify metacognitive accuracyfollowing simple perceptual decisions and toisolate variations in this ability: A decision maybe made poorly, yet an individual may believe
that his or her performance was good, or viceversa (4–8). Whereas previous work has inves-tigated how confidence in perceptual decisionsvaries from trial to trial (9, 10), little is knownabout the biological basis of metacognitive abil-ity, defined here as how well an individual’s con-fidence ratings discriminate correct from incorrectdecisions over time. We hypothesized that in-dividual differences in metacognitive abilitywould be reflected in the anatomy of brain re-gions responsible for this function, in line withsimilar associations between brain anatomy andperformance in other cognitive domains (11–15).
We objectively quantified variability in meta-cognitive sensitivity between individuals andthen related these interindividual differences tobrain structure measured with magnetic reso-nance imaging (MRI). This approach was mo-tivated by observations that individual differencesin a range of skills—such as language (11),decision-making (12), and memory (13)—areconsistently associated with variation in healthybrain anatomy. Our experimental design dis-sociated a quantitative measure of metacognitiveaccuracy, Aroc (which is specific to an individual),from both objective task performance and subjec-tive confidence (which both vary on a trial-by-trialbasis). Earlier patient studies describe candidatebrain regions in which damage is associated withpoor introspective ability: in particular, a prefrontal-parietal network (16–18). Theories of prefrontal
1Wellcome Trust Centre for Neuroimaging, University CollegeLondon, 12 Queen Square, London WC1N 3BG, UK. 2Instituteof Cognitive Neuroscience, University College London, 17Queen Square, London WC1N 3AR, UK.
*These authors contributed equally to this work.†To whom correspondence should be addressed. E-mail:[email protected]
Fig. 1. Behavioral task. Participants com-pleted a two-alternative forced-choice taskthat required two judgments per trial: aperceptual response followed by an es-timate of relative confidence in their deci-sion. The perceptual response indicatedwhether the first or second temporal in-terval contained the higher-contrast (pop-out) Gabor patch (highlighted here with adashed circle that was not present in theactual display), which could appear at any one of six locations around a centralfixation point. Pop-out Gabor contrast was continually adjusted with the use ofa staircase procedure to maintain ~71% performance. Confidence ratings were
made using a one-to-six scale, with participants encouraged to use the whole scalefrom one = low relative confidence to six = high relative confidence. The blacksquare in the rightmost panel indicates the choice made in the metacognitive task.
www.sciencemag.org SCIENCE VOL 329 17 SEPTEMBER 2010 1541
REPORTSCORRECTED 11 MAY 2012; SEE LAST PAGE
on
Feb
ruar
y 20
, 201
5w
ww
.sci
ence
mag
.org
Dow
nloa
ded
from
o
n F
ebru
ary
20, 2
015
ww
w.s
cien
cem
ag.o
rgD
ownl
oade
d fr
om
on
Feb
ruar
y 20
, 201
5w
ww
.sci
ence
mag
.org
Dow
nloa
ded
from
o
n F
ebru
ary
20, 2
015
ww
w.s
cien
cem
ag.o
rgD
ownl
oade
d fr
om

function have emphasized a role for anterior(rostrolateral) prefrontal cortex (PFC) in carryingout second-order operations on internally gen-erated information (19, 20), a process necessaryformetacognition.We hypothesized that the localstructure of these regions (both gray-matter vol-ume and white-matter integrity) might reflect anindividual’s metacognitive ability.
We studied 32 healthy human participantswhile they made a series of visual judgements(21). The difficulty of the visual judgement wasvaried on a per-participant basis to keep per-formance at a constant level (71%), near sensorythreshold. In addition to asking participants tomake these objective perceptual judgements, wealso asked them to provide ratings of confidencein their decisions after each trial (Fig. 1). We thenused these ratings to determine metacognitiveability at an individual level through the construc-tion of type II receiver operating characteristic(ROC) curves (Fig. 2A) (21–23). The ROCmodelprovided an excellent fit to our data across par-ticipants (mean explained variance R2 = 0.97 T0.023). The area between the major diagonal andan individual’s ROC curve is a measure of theability to link confidence to perceptual perform-ance (Aroc). We found considerable variationacross individuals in metacognitive ability (Aroc =0.55 to 0.75), despite underlying task perform-ance being held constant (proportion correct: 70to 74%); furthermore, these measures were un-correlated (Pearson’s correlation coefficient r =–0.21, P = 0.24). To establish whether thisvariability was stable, we split data from eachparticipant into two halves and computed thetest-retest reliability of the two sets. This analysisrevealed intraparticipant consistency in Aroc (r =0.69, P = 0.00001) (fig. S2).
Having quantified interindividual variabilityin introspection, we then asked whether this var-iability in introspective judgements was predictedby variability in brain structure using two distinctmeasures: gray-matter volume measured from T1-weighted anatomical images and the fractionalanisotropy (FA) of white matter measured fromdiffusion tensor images. Our analysis examined thepossible relation between brain structure and fourdifferent measures: the metacognitive ability (Aroc)of our participants, objective performance on theperceptual task (sensitivity, d′, and criterion, c), andthe tendency to use high or low confidence re-sponses on individual trials (Broc) [see supportingonline material (SOM) methods section for de-tails]. Having removed the potentially confound-ing factors (24) of overall brain size and gender(as regressors of no interest), we found that an in-dividual’s metacognitive ability (Aroc) was signif-icantly correlated with gray-matter volume in theright anterior PFC (Fig. 3A) [Brodmann area (BA)10; peak voxel coordinates: [24, 65, 18]; tmax =4.8; P < 0.05, corrected for multiple compari-sons]. Furthermore, gray-matter volume in this re-gion did not correlate with task performance, asindexed by d′ (Fig. 3B) (r = 0.15, P = 0.42), oroverall confidence (Broc)( r = –0.023, P = 0.90).
Gray-matter volume in a homologous region inthe left anterior PFC was also correlated withAroc but did not survive correction for multiplecomparisons across the brain volume. Detailsof this and other clusters that did not survive awhole-brain correction are listed in table S2.Thus, variability in introspective judgements ofperformance on a simple visual-detection taskwas predicted by variability in the anatomicalstructure of the anterior PFC (BA 10), indepen-dently of both objective performance and levelof confidence. Finally, whereas our primary ques-tion addressed positive dependence of gray matteron Aroc, we also found that the left inferior tem-
poral gyrus showed a negative correlation withmetacognitive sensitivity (Fig. 3A) (coordinates:[–56, –30, –26]; tmax = 4.66; P < 0.05, correctedfor multiple comparisons), accompanied by a sim-ilar region on the right that did not survive cor-rection for multiple comparisons (see table S2 forfull details and coordinates).
After we established that gray-matter volumewas predictive of Aroc, we next analyzed white-matter microstructure. If the structure of the an-terior PFC is functionally related to metacognitiveperformance, we hypothesized that white-mattertracts connected with this region would alsoshow a similar microstructural correlation with
0 0.2 0.4 0.6 0.8 10
0.2
0.4
0.6
0.8
1
p(confidence | incorrect)
p(co
nfid
ence
|cor
rect
)
A B
0.55
0.6
0.65
0.7
0.75
0 10 20 30
Subjects
Metacognitiveability (Aroc)Performance(% correct)
Fig. 2. ROC calculation and behavioral performance. (A) Participants’ confidence ratings were used toconstruct a type II ROC function that quantifies the ability to discriminate between correct and incorrectresponses cumulated across levels of confidence. Aroc was calculated as the shaded area between the ROCcurve and the major diagonal (21). Mutually perpendicular dotted and solid lines represent the minor andmajor diagonals, respectively. (B) Plot of the relation between task performance (percentage correct) andAroc, with participants ordered by increasing Aroc value.
B
A
40
60
80
0.5 0.7
Vo
lum
ein
BA
10(a
.u.)
Aroc
40
60
80
0.7 0.9 1.1
d'
Fig. 3. Gray-matter volume correlated with introspective ability. (A) Projection of statistical (T) maps forpositive (hot color map: red, orange, yellow) and negative (cool color map: blue) correlations with Aroconto an inflated cortical surface (T1-weighted template, thresholded at T > 3 for display purposes).Significant clusters (P < 0.05, corrected for multiple comparisons) where metacognitive ability correlatedwith gray-matter volume (see SOMmethods) were found in right anterior PFC (BA 10; positive correlation)and the left inferior temporal gyrus (negative correlation), accompanied by contralateral homologousclusters at P < 0.001, uncorrected. (B) Plot of gray-matter volume in the right BA 10 cluster against bothAroc and d′ (see SOM methods for full details), indicating that the correlation with metacognitive abilitywas independent of task performance. a.u., arbitrary units.
17 SEPTEMBER 2010 VOL 329 SCIENCE www.sciencemag.org1542
REPORTS

expression of this behavioral trait. In a whole-brain analysis of white-matter microstructure(21), we found that FA (a measure of white-matter integrity) in the genu of the corpuscallosum was positively dependent on Aroc (Fig.4) (P < 0.05, corrected for multiple comparisons).This specific subdivision of the corpus callosumcontains white-matter fibers connected with theanterior and orbital PFCs in humans (25), con-sistent with metacognitive ability being depen-dent not only on anterior prefrontal gray matterbut also on reciprocal projections to and from thisarea. Neither objective performance (stimulus con-trast or d′) nor overall confidence (Broc) correlatedwith gray-matter volume or white-matter FAelsewhere in the brain (P > 0.05, corrected formultiple comparisons; see tables S2 and S3 foruncorrected correlations). We note that an absenceof structural correlations with these parametersmay have been due to our design deliberatelyminimizing variability in both d′ and Broc to isolatethe neural correlates of introspective ability (Aroc).
One concern is that the structural covariationthat we observed may have been potentially con-founded by differences in perceptual ability.Good perceptual ability may be reflected in thestaircase procedure converging on consistentlylow values for stimulus contrast for a given in-dividual. Therefore, we carried out control analy-ses (table S4) (21) to rule out this alternativeexplanation. These results demonstrated signifi-cant correlations of gray matter and FAwith Arocin the anterior PFC when controlling for changesin task parameters and an absence of correlationswith task parameters themselves. Thus, the structure-behavior correlations we observed here are unlikelyto be due to low-level differences in performance,but instead relate to underlying differences in in-dividual metacognitive ability.
How might these regions contribute to meta-cognition? Anterior subdivisions of the PFC have
been implicated in high-level control of cognition(19, 20, 26, 27) and are well placed to integratesupramodal perceptual information with decisionoutput (28), a process thought to be key formetacognitive sensitivity (1). Dorsolateral pre-frontal activity increases under conditions inwhich subjective reports match objective percep-tual performance (29), suggesting a computa-tional role in linking performance to confidence.Consistent with prefrontal gray-matter volumeplaying a causal role in metacognition, patientswith lesions to the anterior PFC show deficits insubjective reports as compared with controls,after factoring out differences in objective per-formance (16). Furthermore, impairing dorso-lateral PFC function with theta-burst transcranialmagnetic stimulation compromises the metacog-nitive sensitivity of subjective reports of aware-ness but leaves underlying task performance intact(30). Together with the present work, these find-ings suggest a central role for anterior and dor-solateral PFC in metacognitive sensitivity. Ourpresent findings may reflect innate differences inanatomy or, alternatively, may reflect the effectsof experience and learning, as has been found inthe sensorimotor domain (14, 15). This raises thetantalizing possibility of being able to “train”meta-cognitive ability by harnessing underlying neuralplasticity in the regions that we identify here (31).
Our main finding is a delineation of a notice-ably focal anatomical substrate that predicts in-terindividual variability in metacognitive ability.As with any correlational method, we cannot es-tablish whether the covariation we observed be-tween brain structure and metacognition reflects acausal relation. However, given a wealth of evi-dence for changes in gray-matter volume withinand between individuals associated with a range ofskills, we propose that underlying differences inmetacognitive ability are similarly dependent onlarge-scale brain anatomy. Our data provide an ini-
tial window to the biological basis of the ability tolink objective performance to subjective confidence.The demonstration that this ability may be depen-dent on local and phylogenetically recent prefrontalanatomy is consistent with a conjecture that meta-cognitive function has been selected for duringevolution (32), facilitating computations that allowus to introspect about self-performance.
References and Notes1. A. Cleeremans, B. Timmermans, A. Pasquali, Neural
Networks 20, 1032 (2007).2. J. Metcalfe, Metacognition: Knowing About Knowing
(MIT Press, Cambridge, MA, 1996).3. H. C. Lau, Prog. Brain Res. 168, 35 (2007).4. D. A. Washburn, J. D. Smith, L. A. Taglialatela,
J. Gen. Psychol. 132, 446 (2005).5. C. Kunimoto, J. Miller, H. Pashler, Conscious. Cogn. 10,
294 (2001).6. R. Szczepanowski, L. Pessoa, J. Vis. 7, 1 (2007).7. M. Graziano, M. Sigman, A. Rustichini, PLoS ONE 4,
e4909 (2009).8. S. M. Fleming, R. J. Dolan, Conscious. Cogn. 19, 352 (2010).9. R. Kiani, M. N. Shadlen, Science 324, 759 (2009).
10. A. Kepecs, N. Uchida, H. A. Zariwala, Z. F. Mainen,Nature 455, 227 (2008).
11. M. Carreiras et al., Nature 461, 983 (2009).12. D. S. Tuch et al., Proc. Natl. Acad. Sci. U.S.A. 102,
12212 (2005).13. L. Fuentemilla et al., J. Neurosci. 29, 8698 (2009).14. J. Scholz, M. C. Klein, T. E. J. Behrens, H. Johansen-Berg,
Nat. Neurosci. 12, 1370 (2009).15. B. Draganski et al., Nature 427, 311 (2004).16. A. Del Cul, S. Dehaene, P. Reyes, E. Bravo, A. Slachevsky,
Brain 132, 2531 (2009).17. A. P. Shimamura, Conscious. Cogn. 9, 313 (2000).18. J. S. Simons, P. V. Peers, Y. S. Mazuz, M. E. Berryhill,
I. R. Olson, Cereb. Cortex 20, 479 (2010).19. P. C. Fletcher, R. N. A. Henson, Brain 124, 849 (2001).20. K. Christoff, J. D. E. Gabrieli, Psychobiology 28, 168 (2000).21. Materials, methods, discussion of ROC model fits, and
details of control analyses are available as supportingmaterial on Science Online.
22. S. J. Galvin, J. V. Podd, V. Drga, J. Whitmore, Psychon.Bull. Rev. 10, 843 (2003).
23. D. E. Kornbrot, Percept. Psychophys. 68, 393 (2006).24. C. D. Smith, H. Chebrolu, D. R. Wekstein, F. A. Schmitt,
W. R. Markesbery, Neurobiol. Aging 28, 1075 (2007).25. H. J. Park et al., Hum. Brain Mapp. 29, 503 (2008).26. N. D. Daw, J. P. O’Doherty, P. Dayan, B. Seymour,
R. J. Dolan, Nature 441, 876 (2006).27. P. W. Burgess, I. Dumontheil, S. J. Gilbert, Trends Cogn.
Sci. 11, 290 (2007).28. N. Ramnani, A. M. Owen, Nat. Rev. Neurosci. 5, 184 (2004).29. H. C. Lau, R. E. Passingham, Proc. Natl. Acad. Sci. U.S.A.
103, 18763 (2006).30. E. Rounis et al., Cognit. Neurosci. 1, 165 (2010).31. E. B. Titchener, Lectures on the Experimental Psychology
of the Thought-Processes (Macmillan, New York, 1909).32. J. Metcalfe, in Handbook of Metamemory and Memory,
J. Dunlosky, R. A. Bjork, Eds. (Psychology Press, New York,2008), pp. 27–46.
33. This research was funded by the Wellcome Trust(G.R., R.J.D., Z.N.), the University College Londonfour-year Ph.D. program in neuroscience (S.M.F.),and the Medical Research Council (R.S.W.). We thankT. Sharot, G. Ridgway, and C. Frith for comments onearlier drafts of this manuscript.
Supporting Online Materialwww.sciencemag.org/cgi/content/full/329/5998/1541/DC1Materials and MethodsSOM TextFigs. S1 to S4Tables S1 to S4References
5 May 2010; accepted 23 July 201010.1126/science.1191883
Fig. 4. White-mattermicrostructure correlatedwith introspective ability.(A) Statistical (T) map ofvoxelwise correlations be-tween FA and Aroc, thresh-olded at T > 3 for displaypurposes and overlaid onsagittal (left) and axial(right) slices of the aver-age FA image across par-ticipants, at the x and zcoordinates indicated. Aregion within the genu oftheanteriorcorpuscallosumshowed a correlation be-tween FA and metacog-nitive ability that wasstatistically significantafter correcting for mul-tiple comparisons (P <0.05). (B) Plot of FA inthe anterior corpus callosum cluster against both Aroc and d′, indicating that the correlation withmetacognitive ability was independent of task performance.
x = 0 z = 0A
B
70
90
110
130
0.55 0.7
FA
ing
enu
of
corp
us
callo
sum
(a.u
.)
Aroc
0.7 0.9 1.1d'
www.sciencemag.org SCIENCE VOL 329 17 SEPTEMBER 2010 1543
REPORTS

1
CorreCtions & CLarifiCations
www.sciencemag.org sCiEnCE erratum post date 11 may 2012
ErratumReports: “Relating introspective accuracy to individual differences in brain structure” by S. M. Fleming et al. (17 September 2010, p. 1541). The authors have detected a minor pro-gramming error in their original analysis of brain structure. Thus, spatial coordinates for a subset of results should be corrected by ±2 mm (see the table below for the correct coordi-nates). No other aspects of their results or interpretations are affected.
CorreCtions & CLarifiCations
Post date 11 May 2012
Contrast Region Peak voxel reported in paper (MNI)
Corrected peak voxel (MNI)
GM-positive Aroc Right BA10 24, 65, 18 26, 66, 16 GM-positive Aroc Precuneus 6, –57, 18 8, –57, 19 WM-positive Aroc Anterior corpus
callosum 2, 26, –2 2, 27, –2
MNI, Montreal Neurological Institute; GM , grey matter volume; WM, white matter (fractional anisotropy); Aroc, a quantitative measure of metacognitive accuracy.

DOI: 10.1126/science.1191883, 1541 (2010);329 Science
et al.Stephen M. FlemingStructureRelating Introspective Accuracy to Individual Differences in Brain
This copy is for your personal, non-commercial use only.
clicking here.colleagues, clients, or customers by , you can order high-quality copies for yourIf you wish to distribute this article to others
here.following the guidelines
can be obtained byPermission to republish or repurpose articles or portions of articles
): February 20, 2015 www.sciencemag.org (this information is current as of
The following resources related to this article are available online at
http://www.sciencemag.org/content/336/6082/670.full.htmlA correction has been published for this article at:
http://www.sciencemag.org/content/329/5998/1541.full.htmlversion of this article at:
including high-resolution figures, can be found in the onlineUpdated information and services,
http://www.sciencemag.org/content/suppl/2010/09/14/329.5998.1541.DC1.html can be found at: Supporting Online Material
http://www.sciencemag.org/content/329/5998/1541.full.html#relatedfound at:
can berelated to this article A list of selected additional articles on the Science Web sites
http://www.sciencemag.org/content/329/5998/1541.full.html#ref-list-1, 8 of which can be accessed free:cites 28 articlesThis article
http://www.sciencemag.org/content/329/5998/1541.full.html#related-urls45 articles hosted by HighWire Press; see:cited by This article has been
http://www.sciencemag.org/cgi/collection/neuroscienceNeuroscience
subject collections:This article appears in the following
registered trademark of AAAS. is aScience2010 by the American Association for the Advancement of Science; all rights reserved. The title
CopyrightAmerican Association for the Advancement of Science, 1200 New York Avenue NW, Washington, DC 20005. (print ISSN 0036-8075; online ISSN 1095-9203) is published weekly, except the last week in December, by theScience
on
Feb
ruar
y 20
, 201
5w
ww
.sci
ence
mag
.org
Dow
nloa
ded
from
www.sciencemag.org/cgi/content/full/329/5998/1541/DC1
Supporting Online Material for
Relating Introspective Accuracy to Individual Differences in Brain Structure
Stephen M. Fleming,* Rimona S. Weil, Zoltan Nagy, Raymond J. Dolan, Geraint Rees
*To whom correspondence should be addressed. E-mail: [email protected]
Published 17 September 2010, Science 329, 1541 (2010)
DOI: 10.1126/science.1191883
This PDF file includes:
Materials and Methods SOM Text Figs. S1 to S4 Tables S1 to S4 References

1
Materials and Methods
Participants
32 participants (15 males; aged 19 – 37 years; mean age 26.4 years) gave written informed consent to take part in the experiment. The study was approved by the local Research Ethics Committee. One participant was excluded from further analysis of brain structure due to aberrant psychophysical task performance (d’ > 3SD from the group mean).
Stimuli
The perceptual decision display comprised six Gabor gratings (circular patches of smoothly varying light and dark bars) arranged around a central fixation point (Fig 1). Each Gabor subtended 1.4 degrees of visual angle in diameter, and consisted of a luminance pattern modulated at a spatial frequency of 2.2 cycles per degree. Each “baseline” Gabor had a contrast of 20% of maximum, and appeared at a mean eccentricity of 6.9 degrees. The fixation point comprised a black square measuring 0.2 degrees across, luminance 0.10 cd/m2, with a central white square 0.1 degrees across, luminance 13.64 cd/m2. The background was a uniform gray screen of luminance 3.66 cd/m2.
Baseline Gabors were displayed with a contrast of 20% (where 0% is no difference between the luminance of the grating bars and 100% is maximum difference, i.e. black to white). The pop-out Gabors were drawn from a stimulus set in which contrast varied from 23 to 80% in increments of 3%. At the time of confidence ratings, the display consisted of a grey screen (luminance 3.66 cd/m2) with the numbers 1 to 6 written left to right (luminance 13.64 cd/m2, 0.7 degrees in height, centred around fixation).
Stimuli were presented on a gamma calibrated CRT display (Dell FP2001, 20.1 inch display; 800 x 600 pixels; 60 Hz refresh rate), at a viewing distance of approximately 60 cm, situated in a darkened room. Stimulus display and response collection were controlled by Matlab 7.8.0 (Mathworks Inc., Natick, MA, USA) using the COGENT 2000 toolbox (http://www.vislab.ucl.ac.uk/cogent.php).
Task
The visual judgement comprised a temporal two-alternative forced choice pop-out task (see Fig. 1 for timings). All the Gabors in one interval were of the same contrast, but in the other interval, one of the Gabors was of a higher contrast than the others (the “pop-out” Gabor, illustrated by a dashed circle in Fig. 1 that was not present in the actual display). The temporal interval and spatial position of the pop-out Gabor varied randomly between trials. Participants were required to decide whether this pop-out Gabor had appeared in the first or the second interval. The perceptual judgement was indicated by participants using the left hand with the numbers ‘1’ (first interval) or ‘2’ (second interval) on the QWERTY keypad of a standard PC keyboard. Participants then indicated their confidence in the perceptual decision they had just made on a scale of 1 (low relative confidence) to 6 (high relative confidence), using their right hand to press
2
one of the numbers ‘1’ to ‘6’ on the numerical keypad. A square red frame (width 1 degree, thickness 0.1 degree) appeared around the selected rating (Fig. 1).
The contrast of the pop-out Gabor was chosen from the stimulus set of pop-out Gabors using a 1-up 2-down staircase procedure (S1), which at the limit results in convergence on 71% accuracy. The contrast of the pop-out Gabor at the end of each block was used as the starting contrast for the pop-out Gabor in the next block. Our aim in this staircase procedure was to equate objective perceptual performance across individuals, leaving quantification of metacognitive ability unconfounded by performance (S2).
Participants were instructed to try to use the whole of the confidence scale in their responses, and to bear in mind that the scale represents relative confidence, as, given the difficult nature of the task, they would rarely be completely certain that their visual judgement had been correct. Participants performed a practice session to familiarise themselves with the stimuli and task. The main experiment consisted of 600 trials, split into 6 blocks of 100 trials. They were given no feedback about their performance until the end of the experiment.
Quantification of metacognitive ability
The accuracy of metacognitive assessments can be intuited as how transparent an initial perceptual decision process is to a putative “higher” level assessment. This intuition can be captured within the logic of signal detection theory (SDT), which assesses how faithfully a creature separates signal from noise. Conventional applications of SDT assess detection performance by comparing the proportion of “hits” and “false alarms” in a stimulus detection task. By applying the logic of SDT to metacognition (“Type 2” SDT), we categorised a “hit” as a high confidence response after a correct decision and a “false alarm” as a high confidence response after an incorrect decision [see table S1 and (S3)]. Because the specific mathematical assumptions of conventional SDT may not hold for this new analysis (S4, S5), we used nonparametric assessments of sensitivity and bias (S6). We constructed Type 2 ROC curves for each participant (Fig. 2A and fig. S2) that characterised the probability of being correct for a given level of confidence. ROC curves were anchored at [0, 0] and [1, 1]. An ROC curve that bows sharply upwards indicates that the probability of being correct rises rapidly with confidence; conversely, a flat ROC function indicates a weak link between confidence and accuracy.
We noted a practice effect in the staircase parameters (fig. S1) reflected in a decrease in mean contrast and variability from block 1 to 2. A one-way ANOVA of mean contrast with block as a within-subjects factor revealed a significant effect of block (F(5,155) = 8.18, P < 0.001) that was abolished on removal of block 1 (F(4,124) = 1.56, P = 0.19). ROC analysis was therefore carried out on data from blocks 2-6, after stabilisation of psychophysical performance. To plot the ROC, hi = p(confidence = i | correct) and fi = p(confidence = i | incorrect) were calculated for all i. These probabilities were then transformed into cumulative probabilities, and plotted against each other (Fig. 2A and fig. S2). Following Kornbrot (S6), we computed distribution-free measures of sensitivity and bias from this ROC by dividing the area into two parts – KB is the area between the ROC curve and the major diagonal (solid line in Fig. 2A) to the right of the minor diagonal (dotted line in Fig. 2A), and KA is the area between the
3
ROC curve and major diagonal to the left of the minor diagonal. From simple geometry [derived in the Appendix of (S6)], these areas can be calculated as follows:
KA =14
[(hk+1 − fk )2
k=1
k=12
i
∑ − (hk − fk+1)2]
KB =14
[(hk+1 − fk )2
k=12
i
k= i
∑ − (hk − fk+1)2]
Sensitivity (Aroc) is then the sum of these areas, and Type 2 bias (Broc) is the log of the ratio:
Aroc = KA +KB
Broc = ln(KA
KB
)
Type I d' and bias (c) were calculated in the standard manner (S7):
d’ = 1/√2 [z(H) – z(F)] c = -0.5 [z(H) + z(F)] where z is the inverse of the cumulative normal distribution function, H = p(response = 1|interval = 1) and F = p(response = 1|interval = 2). Confirmatory correlation analyses between SDT parameters and grey matter (GM)/fractional anisotropy (FA) clusters [signal extracted using the MarsBar toolbox (S8)] were carried out using Pearson’s product-moment correlations in SPSS 17.0. Voxel-based morphometry analysis
Voxel-based morphometry (VBM) provides a quantitative measure (at each voxel) of the tissue volume per unit volume of spatially normalised image (S9). A 1.5T Sonata scanner (Siemens Medical Systems, Erlangen, Germany) was used to acquire all images for each participant. T1-weighted anatomical whole-brain scans were acquired for VBM analysis (176 slices, echo time = 3.56ms, TR = 12.24ms, voxel size 1mm isotropic). VBM preprocessing was carried out using SPM8 (http://www.fil.ion.ucl.ac.uk/spm). The images were first segmented into GM, white matter (WM) and cerebral spinal fluid in native space (S10). The GM segment images from this process were then rigidly aligned and subsequently warped to an iteratively improved template using nonlinear registration in DARTEL (S11). DARTEL’s “Normalise to MNI” module was then used to produce smoothed normalised images. The DARTEL template was affinely registered to MNI space, and the GM images were transformed using the DARTEL flow-fields and this affine transformation, in a way that preserved their local tissue

4
volumes (equivalent to a Jacobian “modulation” step). Smoothing used a Gaussian kernel of 8mm full width at half maximum.
The pre-processed GM images were entered into a multiple regression model in SPM8 to determine which brain regions showed significant covariation with the SDT-based measures of metacognitive ability. We included Aroc, d’, Type II criterion (Broc; the overall tendency to use high confidence responses), the absolute (unsigned) value of the Type I criterion (|c|) and gender (M = 1; F = 0) in the model. Type I criterion (c) measures the extent of the bias towards interval 1 or 2 on the perceptual decision task, with greater bias reflecting suboptimal performance. Positive values indicate bias towards interval 1, and negative values bias towards interval 2. We thus entered the absolute value of c as a covariate of no interest, with higher values indicating suboptimal performance bias towards either interval.
Adjustment for “global” brain volume using proportional scaling was applied, resulting in voxel values that were proportions of total GM volume. A binary mask (SPM8 grey.nii template > 0.3) was used to restrict the search volume to changes in GM. T-statistic maps reflecting the correlation between each regressor and regional GM volume were created. Cluster-based statistics were used to locate significant regions based on both their peak value and spatial extent after applying an initial cluster-defining threshold of P < 0.001. Due to structural images displaying local variation in smoothness, standard applications of cluster-based random field theory are inappropriate (S12). We thus applied non-stationary cluster extent correction when calculating family-wise error (FWE) corrected P values using the NS toolbox (http://www.fmri.wfubmc.edu/cms/NS-General). Computational simulations (S12) show that for designs with high degrees of freedom and sufficient smoothness, as here, using a cluster defining threshold of P < 0.001 with correction for non-stationarity provides adequate control over the family-wise false positive rate (P < 0.05).
Diffusion tensor imaging analysis
The diffusion tensor imaging (DTI) dataset comprised of 68 images with 60 slices and 2.3 mm isotropic resolution. The first 7 images were collected with b = 100 s/mm2. The diffusion encoding directions were isotropically distributed on the surface of the sphere
(S13) for the remaining 61 images and the b-value was 1000 s/mm2. The echo time was 90ms, each 2D image slice took 150ms to collect, and the field of view was 220mm. DTI data sets are often collected using echo-planar imaging (EPI) methods which are affected by susceptibility-induced artefacts. To reduce the extent of these artefacts two datasets were collected for each participant, with the only difference being that the phase encoding direction was reversed for the second run. This method ensures the susceptibility-induced distortions are equal and opposite in the two datasets, providing the opportunity to correct their effect (S14).
Diffusion-weighted images were first aligned using FSL’s eddycorrect (http://www.fmrib.ox.ac.uk/fsl/), and then combined into a single dataset with reduced susceptibility-induced artefacts. The main diffusion tensor was then fitted at each voxel using FSL’s dtifit. From the tensor a rotationally invariant measure of diffusion anisotropy can be calculated. One such measure is fractional anisotropy (FA) with values ranging from 0 (representing isotropic, or undirected, diffusion) to 1
5
(representing a single preferred direction of diffusion). This measure has been used extensively to investigate local WM integrity, as diffusion of water molecules is more restricted perpendicular to, rather than along, neuronal fibres. The calculated FA map for each participant (in native space) was imported into SPM8 and coregistered to the WM segment image of the same participant created during VBM analysis. Coregistration was carried out by maximising normalised mutual information between the images. The DARTEL flowfields and affine (MNI) transformation were then applied to each participant’s coregistered FA image, producing normalised FA images in MNI space. Unlike the VBM normalisation (which preserved the original local tissue volume), the FA images were normalised in a way that preserved their original voxel values (without “modulation”). Normalised FA images were also smoothed with a 8mm full-width at half maximum Gaussian kernel prior to statistical analysis. For one participant, DTI scans were unavailable, leaving 30 subjects in the FA analysis.
Statistical analysis of FA proceeded in an identical fashion to that of GM volume (see above). A multiple regression model was constructed consisting of Aroc, d’, Type II criterion (Broc; the overall tendency to use high confidence responses) and the absolute (unsigned) value of the Type I criterion (|c|). A binary mask (mean normalised FA > 0.2) was used to restrict the search volume to changes in WM. Statistical inference was conducted as for VBM. Probable tract labels were obtained using the JHU White-Matter Tractography Atlas within FSL.
ROC model fits
To explore how well a Gaussian Type II SDT model accounted for the confidence rating data (S7), we fit the following linear regression model:
z(h) = β0 + β1z(f) + ε
where z is the inverse of the cumulative normal distribution function. This model provided an excellent fit to the data (mean R2 = 0.97), indicating that the underlying f(X|correct) and f(X|incorrect) distributions are normal-like [where X is a random decision variable; see (S4) for further details]. The β1 parameter (slope) indicates the relative variance of the two distributions. This parameter was on average less than 1 within our sample (0.88 ± 0.026 SEM), indicating that the f(X|correct) distribution has greater variance than the f(X|incorrect). Interestingly, theoretical models that suggest a direct translation of Type I into Type II distributions predict a Type II ROC slope slightly less than 1 (S4). However, this picture is not clear-cut: recent metamemory data support an equal-variance Gaussian model (S15). We note that our use of nonparametric methods to characterise Aroc are not dependent on the specific form of the model used; indeed, it was the methodological uncertainty surrounding the quantification of Type II processes that led us to adopt the distribution-free approach (S6).
Control analyses of GM and FA correlations
We carried out additional analysis to rule out potential alternative interpretations of our findings. One concern is that variation in underlying perceptual acuity could confound the anatomical variance we ascribe to metacognitive ability (Aroc). Good perceptual ability may be reflected in low mean stimulus contrast and/or low staircase variability
6
(though we note that extraneous environmental or ocular factors also affect these variables). To rule out this interpretation, we computed the partial correlation between brain structure and Aroc while controlling for both mean stimulus contrast and the variability (SD) in the staircase required to achieve a constant level of performance within each individual. Both the GM cluster in BA10 (r = 0.39, P = 0.036) and the FA cluster in anterior corpus callosum (r = 0.74, P < 0.001) remained significantly correlated with Aroc after controlling for mean contrast and staircase variability.
This partial correlation analysis only examines the correlation of predefined regions. As a further test, we constructed a second design matrix in which mean stimulus contrast and staircase variability were directly entered as predictors of GM/FA, with gender again present as a covariate of no interest. Neither measure correlated with grey matter or FA at the statistical thresholds used in the main analysis (P > 0.05, corrected for multiple comparisons), even when applying a mask (8mm sphere) to isolate voxels within the vicinity of the BA10 (GM) or the anterior corpus callosum (FA) peak voxels. While we are cautious in interpreting uncorrected findings, one result of potential interest is that GM volume in the medial calcarine sulcus, consistent with the location of early visual cortex, showed increased volume in subjects with greater perceptual acuity as defined by negative mean stimulus contrast (P < 0.001, uncorrected). Table S4 details uncorrected results from these models for completeness. Together these control analyses indicate that the correlations we observe between Aroc and structure relate to differences in metacognitive ability rather than low-level differences in performance.
Negative correlations with Aroc
We found negative correlations with Aroc in bilateral regions of anterior inferior temporal grey matter (left, P < 0.05, corrected for multiple comparisons; right, P < 0.001, uncorrected; table S3). While we are cautious about interpreting the relevance of a decrease in grey matter volume for increased metacognitive ability, we note that these temporopolar regions have been implicated in both self-related (S16) and higher-order visual (S17) processing, and thus alterations in grey matter here might similarly place functional constraints on perceptual metacognition.

7
Figure S1
0 2 4 6 831
32
33
34
35
36
37Mean contrast
Block0 2 4 6 8
4
4.5
5
5.5SD contrast
Block
Stimulus parameters for the behavioural task. Mean and standard deviation (SD) of oddball Gabor contrast (percentage of maximum contrast) plotted for each block of the perceptual task, averaged over participants. Error bars represent one standard error of the mean. Because stimulus contrast and variability were significantly higher in Block 1 (see Methods), indicating a period of gradual stabilisation of performance, only data from blocks 2-6 were used to calculate SDT measures.

8
0 0.5 10
0.5
1
0 0.5 10
0.5
1
0 0.5 10
0.5
1
0 0.5 10
0.5
1
0 0.5 10
0.5
1
0 0.5 10
0.5
1
0 0.5 10
0.5
1
0 0.5 10
0.5
1
0 0.5 10
0.5
1
0 0.5 10
0.5
1
0 0.5 10
0.5
1
0 0.5 10
0.5
1
0 0.5 10
0.5
1
0 0.5 10
0.5
1
0 0.5 10
0.5
1
0 0.5 10
0.5
1
0 0.5 10
0.5
1
0 0.5 10
0.5
1
0 0.5 10
0.5
1
0 0.5 10
0.5
1
0 0.5 10
0.5
1
0 0.5 10
0.5
1
0 0.5 10
0.5
1
0 0.5 10
0.5
1
0 0.5 10
0.5
1
0 0.5 10
0.5
1
0 0.5 10
0.5
1
0 0.5 10
0.5
1
0 0.5 10
0.5
1
0 0.5 10
0.5
1
0 0.5 10
0.5
1
0 0.5 10
0.5
1
Figure S2
Individual ROC curves calculated from the behavioural data (see Materials and Methods & Fig. 2) plotted for each of the 32 participants, split into odd (blue; blocks 3 and 5) and even (red; blocks 2, 4 and 6) blocks of the psychophysics session.

9
Figure S3
0 1 2 3 4 5 6 7400
600
800
1000
1200
1400
1600Mean RT
Confidence level
RT
(ms)
Perceptual decisionConfidence judgment
Mean reaction times (RT) measured in milliseconds for both the perceptual decision (blue) and the confidence judgment (red) from blocks 2-6, plotted as a function of reported confidence level. Data are averaged across 32 participants and the error bars represent one standard error of the mean.

10
<
<
<
Figure S4
(A)
(B)
(C)
Axial “glass brains” (viewed from above) showing areas where grey matter volume correlates positively (A) and negatively (B) with Aroc, and where white matter fractional anisotropy correlates positively with Aroc (C). No suprathreshold fractional anisotropy clusters were found for negative correlations with Aroc (see also tables S2 and S3). All maps are thresholded at P < 0.001, uncorrected with an extent threshold of 10 voxels.
11
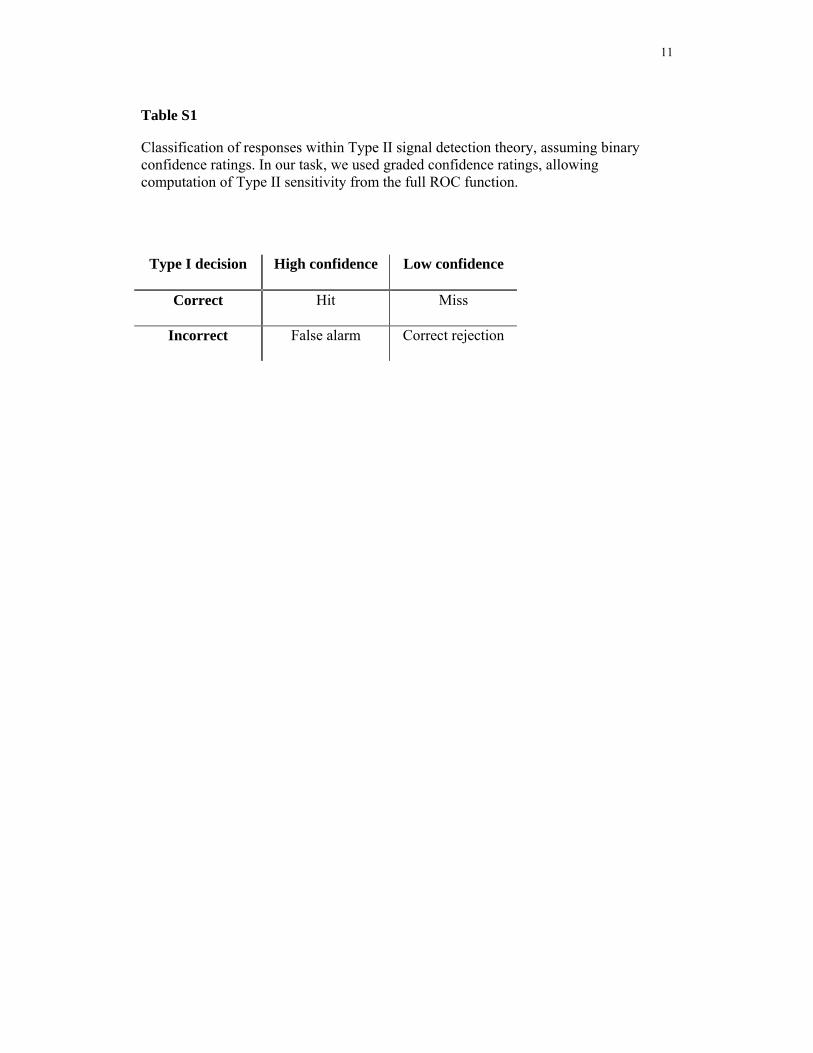
Table S1
Classification of responses within Type II signal detection theory, assuming binary confidence ratings. In our task, we used graded confidence ratings, allowing computation of Type II sensitivity from the full ROC function.
Type I decision High confidence Low confidence
Correct Hit Miss
Incorrect False alarm Correct rejection

12
Table S2
GM volume associated with behavioural variables (SDT parameters) entered into the multiple regression model. Whole-brain corrected clusters (P < 0.05, corrected for multiple comparisons) are indicated in bold type. For completeness, correlations that survive a height threshold of P < 0.001, uncorrected, and an extent threshold of 10 voxels are also reported. Abbreviations: PFC – prefrontal cortex; BA – Brodmann area.
Regressor Number of
voxels
Peak voxel
Z-score
P value (cluster FWE
corrected)
Peak voxel MNI
coordinates
Laterality Label
675 4.02 0.029 24 65 18 R Anterior PFC (BA10)
291 3.93 0.191 6 -57 18 L/R Precuneus/posterior cingulate
31 3.78 0.703 -20 53 12 L Anterior PFC (BA10)
25 3.45 0.829 36 39 21 R Dorsolateral PFC (BA46)
Aroc
29 3.44 0.497 33 50 9 R Anterior PFC (BA10)
713 3.92 0.026 -56 -30 -26 L Inferior temporal gyrus
76 3.69 0.753 -63 -30 10 L Superior Temporal gyrus
80 3.54 0.457 51 -33 -21 R Inferior temporal gyrus
Negative Aroc
15 3.22 0.995 -41 -3 -48 L Inferior temporal gyrusBroc 28 3.93 0.313 -33 -73 34 L Occipital lobe (BA19)
93 3.47 0.233 -59 -27 -14 L Middle temporal gyrus Negative Broc 20 3.35 0.826 -66 -10 3 L Superior temporal
gyrus 82 3.77 0.175 -3 -84 -21 L/R Cerebellum 16 3.68 0.939 53 -25 -15 R Middle temporal sulcus389 3.66 0.112 60 -39 51 R Superior parietal 47 3.45 0.817 6 -61 4 L/R Lingual gyrus
d'
18 3.26 0.953 -3 -9 66 L Supplementary motor area (BA6)
Negative d’ N/A N/A N/A N/A N/A No suprathreshold
clusters
13
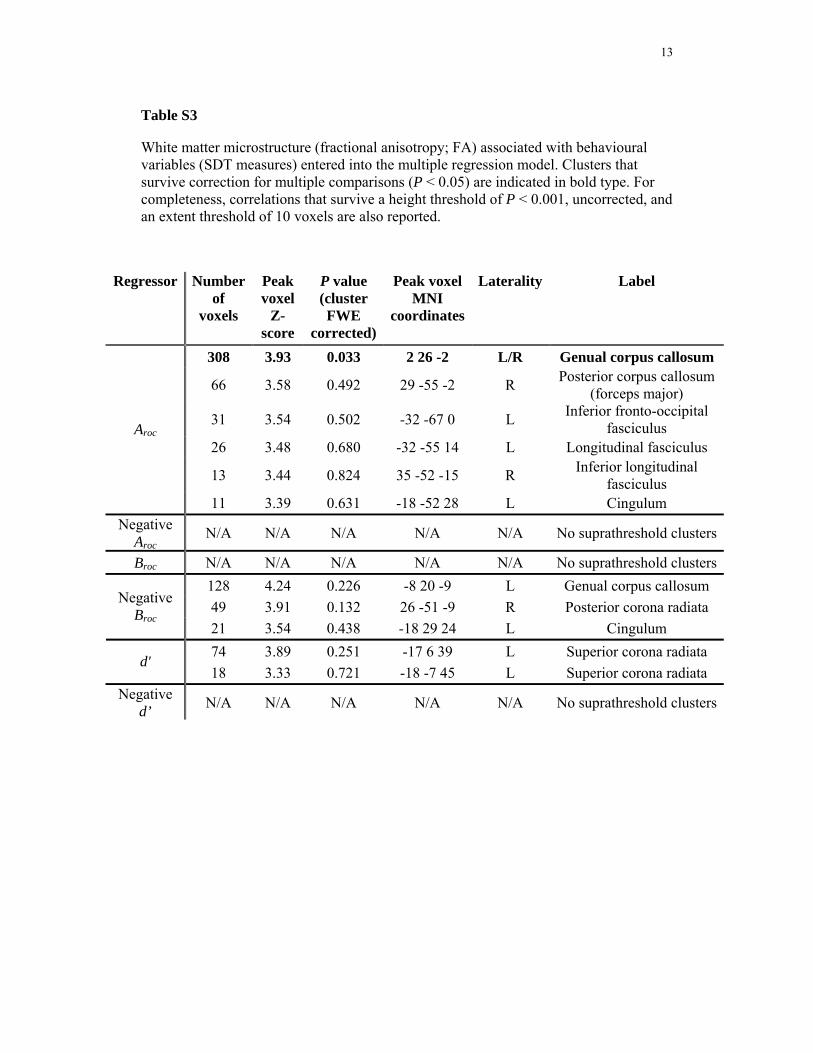
Table S3
White matter microstructure (fractional anisotropy; FA) associated with behavioural variables (SDT measures) entered into the multiple regression model. Clusters that survive correction for multiple comparisons (P < 0.05) are indicated in bold type. For completeness, correlations that survive a height threshold of P < 0.001, uncorrected, and an extent threshold of 10 voxels are also reported.
Regressor Number of
voxels
Peak voxel
Z-score
P value (cluster FWE
corrected)
Peak voxel MNI
coordinates
Laterality Label
308 3.93 0.033 2 26 -2 L/R Genual corpus callosum
66 3.58 0.492 29 -55 -2 R Posterior corpus callosum (forceps major)
31 3.54 0.502 -32 -67 0 L Inferior fronto-occipital fasciculus
26 3.48 0.680 -32 -55 14 L Longitudinal fasciculus
13 3.44 0.824 35 -52 -15 R Inferior longitudinal fasciculus
Aroc
11 3.39 0.631 -18 -52 28 L Cingulum Negative
Aroc N/A N/A N/A N/A N/A No suprathreshold clusters
Broc N/A N/A N/A N/A N/A No suprathreshold clusters128 4.24 0.226 -8 20 -9 L Genual corpus callosum 49 3.91 0.132 26 -51 -9 R Posterior corona radiata Negative
Broc 21 3.54 0.438 -18 29 24 L Cingulum 74 3.89 0.251 -17 6 39 L Superior corona radiata
d' 18 3.33 0.721 -18 -7 45 L Superior corona radiata
Negative d’ N/A N/A N/A N/A N/A No suprathreshold clusters

14
Table S4
GM correlating with negative stimulus contrast and staircase variability (low-level measures of perceptual performance). After correcting for multiple comparisons, no significant clusters were observed, but correlations that survive a height threshold P < 0.001, uncorrected, and an extent threshold of 10 voxels are reported for completeness.
Analysis Regressor Number of
voxels
Peak voxel
Z-score
P value (cluster FWE
corrected)
Peak voxel MNI
coordinates
Laterality Label
88 3.67 0.917 14 -10 24 R Caudate
51 3.56 0.783 -65 -57 4 L Middle temporal gyrus
78 3.44 0.913 5 -76 21 L/R Calcarine sulcus
80 3.38 0.908 3 36 42 L/R Dorsal medial
prefrontal cortex
Negative mean
contrast
11 3.21 0.982 -14 29 -20 L Orbitofrontal cortex
128 4.00 0.301 59 -42 1 R Middle temporal gyrus
29 3.70 0.577 -51 -33 36 L Inferior parietal
34 3.36 0.938 47 -15 -48 R Postcentral gyrus
GM
Negative SD
22 3.24 0.953 -44 -21 46 L Postcentral gyrus
Negative mean
contrast N/A N/A N/A N/A N/A
No suprathreshold
clusters FA Negative
SD 30 3.86 0.942 -29 -15 48 L Superior corona radiata

15
References S1. H. Levitt, Transformed up-down methods in psychoacoustics. J. Acoust. Soc. Am.
49, Suppl (1971). S2. H.C. Lau, in Frontiers of Consciousness, Eds. L. Weiskrantz, M. Davies (Oxford
University Press: 2008), pp. 245-258. S3. C. Kunimoto, J. Miller, H. Pashler, Confidence and accuracy of near-threshold
discrimination responses. Conscious. Cogn. 10, 294 (2001). S4. S.J. Galvin, J.V. Podd, V. Drga, J. Whitmore, Type 2 tasks in the theory of signal
detectability: discrimination between correct and incorrect decisions. Psychon. Bull. Rev. 10, 843 (2003).
S5. S. Evans, P. Azzopardi, Evaluation of a 'bias-free' measure of awareness. Spat.Vis.
20, 61 (2007). S6. D.E. Kornbrot, Signal detection theory, the approach of choice: model-based and
distribution-free measures and evaluation. Percept. Psychophys. 68, 393 (2006). S7. N. Macmillan, C. Creelman, Detection theory: a user's guide. (Lawrence Erlbaum:
New York, 2005). S8. M. Brett, J. Anton, R. Valabregue, J. Poline, Regions of interest analysis using an
SPM toolbox. Presented at the 8th International Conference on Functional Mapping of the Human Brain (2002).
S9. J. Ashburner, K.J. Friston, Voxel-based morphometry--the methods. NeuroImage
11, 805 (2000). S10. J. Ashburner, K.J. Friston, Unified segmentation. NeuroImage 26, 839 (2005). S11. J. Ashburner, A fast diffeomorphic image registration algorithm. NeuroImage 38,
95 (2007). S12. S. Hayasaka, K.L. Phan, I. Liberzon, K.J. Worsley, T.E. Nichols, Nonstationary
cluster-size inference with random field and permutation methods. NeuroImage 22, 676 (2004).
S13. K.M. Jansons, D.C. Alexander, Persistent angular structure: new insights from
diffusion MRI data. Inf. Process. Med. Imaging 18, 672 (2003). S14. J.L.R. Andersson, S. Skare, J. Ashburner, How to correct susceptibility distortions
in spin-echo echo-planar images: application to diffusion tensor imaging. NeuroImage 20, 870 (2003).
S15. P.A. Higham, No special K! A signal detection framework for the strategic

16
regulation of memory accuracy. J. Exp. Psychol. Gen. 136, 1 (2007). S16. U. Frith, C.D. Frith, Development and neurophysiology of mentalizing. Philos. T.
R. Soc. B. 358, 459 (2003). S17. C.G. Gross, S.D. Schonen, Representation of visual stimuli in inferior temporal
cortex. Philos. T. R. Soc. B. 335, 3 (1992).