reintermediation in fintech: evidence from online lending · lenders now overwhelmingly outsource...
TRANSCRIPT

Reintermediation in FinTech:
Evidence from Online Lending∗
Tetyana Balyuk Sergei Davydenko
August 6, 2018
Abstract
The peer-to-peer loan market was designed to allow borrowers and lenders
to interact online without banks as middlemen. Yet we document that P2P
lending platforms over time have evolved from trading venues into new credit
intermediaries. Lenders now overwhelmingly outsource all decision-making to
the platforms’ software and adopt passive investment strategies. The domi-
nant role of lending platforms with little skin in the game makes the market
vulnerable to moral hazard, checked by the threat of institutional investors’
withdrawal. Our findings suggest that the absence of private information spurs
reintermediation as the platform’s expertise in loan evaluation crowds out that
of investors.
Keywords: FinTech; Peer-to-peer lending; Consumer finance; Disintermediation; Reintermediation
JEL Classification Numbers: G11, G12, D53, D81, D82
∗Tetyana Balyuk ([email protected], tel. (404) 727-6351) is at Goizueta Business School, Emory University.Sergei Davydenko ([email protected], tel. (416) 978-5528) is at Joseph L. Rotman School of Management,University of Toronto. We thank Jeffrey Busse, Michele Dathan, Craig Doidge, Alex Dyck, Rohan Ganduri, ChristophHerpfer, Narasimhan Jegadeesh, Michael King, Gonzalo Maturana, Alexandra Niessen-Ruenz, Robert Wardrop, seminarparticipants at Cass Business School, Scheller College of Business, Goizueta Business School, Rotman School of Management,and attendees of the Toronto Fintech Conference, the Showcasing Women in Finance conference, and the FinteQC’18conference for helpful comments and suggestions.

Reintermediation in FinTech:
Evidence from Online Lending
August 6, 2018
Abstract
The peer-to-peer loan market was designed to allow borrowers and lenders
to interact online without banks as middlemen. Yet we document that P2P
lending platforms over time have evolved from trading venues into new credit
intermediaries. Lenders now overwhelmingly outsource all decision-making to
the platforms’ software and adopt passive investment strategies. The domi-
nant role of lending platforms with little skin in the game makes the market
vulnerable to moral hazard, checked by the threat of institutional investors’
withdrawal. Our findings suggest that the absence of private information spurs
reintermediation as the platform’s expertise in loan evaluation crowds out that
of investors.
Keywords: FinTech; Peer-to-peer lending; Consumer finance; Disintermediation; Reintermediation
JEL Classification Numbers: G11, G12, D53, D81, D82

Introduction
Online platforms such as Uber, Airbnb, and eBay bring together buyers and sellers of goods and services
over the Internet, reducing search costs in a multitude of very different markets. The rise of financial
technology (FinTech) is often predicted to result in similar developments in the financial sector, allowing
providers and users of finance to interact directly without the involvement of banks and other financial
intermediaries.1 Based upon these ideas, peer-to-peer (P2P) lending markets were created to allow
consumers to request small loans online and creditors to evaluate and directly fund loan applications
of their choosing. P2P lending platforms were originally organized as online auctions, like an eBay for
consumer loans. However, in contrast to eBay, these platforms over time have evolved to take central
stage in loan screening, evaluation, and pricing. Far from simply providing a meeting place for borrowers
and lenders, they have replaced traditional loan officers in all but name. Why did this happen, and what
does this market tell us about the nature and role of financial intermediaries?
This paper studies the reintermediation of P2P lending.2 We show that when decision making is based
on ‘hard’ data with no private information, the growth in FinTech companies’ technological expertise in
loan evaluation crowds out that of investors, who respond by becoming passive and voluntarily outsourcing
almost all decisions to a few such firms. The end result may be a highly centralized market, with the
platforms’ software replacing traditional intermediaries as a key decision maker.
We study the P2P lending market using loan data from Prosper, one of the biggest P2P platforms
in the U.S. We find that in early years, when loan rates were determined via auctions and the platform
performed no loan evaluation or pricing, loan funding rates were low and loan cancellations rare. In
late 2010, Prosper replaced the auction model with one in which the platform’s software evaluates the
loan’s risk, assigns an interest rate, and screens loans for possible fraud or excessive risk. We show
that following these changes, funding rates increased dramatically and investors became overwhelmingly
1E.g., “Role of banks recedes in wake of crisis,” Financial Times, June 22, 2014.2We define reintermediation as the re-emergence of the middleman in technology-enabled markets in the form of online
platform’s software designed to perform the functions of traditional intermediaries. These functions include pooling funds,sharing risks, transferring resources, producing information and providing incentives (see Philippon (2015)). By contrast, weconsider markets where such platforms only provide infrastructure that enables transfer of resources between other parties,but do not actively undertake other functions of traditional intermediaries to be disintermediated markets (e.g., tradingvenues, such as Electronic Communication Networks).
1

passive, outsourcing almost all decisions to the lending platform’s software.
Today, the P2P lending market in the U.S. is by and large neither peer-to-peer, nor a lending market
in which creditors decide who to lend to. First, we show that in recent years over 90% of loans have been
provided by institutions rather than retail ‘peers’, typically algorithmically without human involvement.
Over 80% of institutional loans are extended through the ‘passive’ mechanism, whereby investors pre-
specify loan portfolio parameters and Prosper then automatically funds whole loans on their behalf. And
while theoretically open to active investors’ screening, most of the remaining loans in practice are funded
within seconds by robots.
Second, the lending platform not only carries out essentially all of the traditional banks’ functions
related to consumer loan evaluation, pricing, and servicing, but also performs almost all of the loan
screening. We find that P2P investors agree to fund over 98% of loan applications on offer, even though the
platform’s software subsequently screens out and cancels 30% of them as too risky or possibly fraudulent.
We show that the screened-out loans would, if extended, result in substantially higher losses for investors
than other loans with similar risk scores. Nonetheless, investors do not attempt to identify and avoid such
loans, effectively outsourcing loan screening, along with all other decisions, to the platform’s algorithms.
Thus, P2P lending platforms have evolved from a mere meeting place for borrowers and lenders to
something resembling to a delegated asset manager, which for a fee invests creditors’ money in consumer
loans of its choosing at the price it deems appropriate. What are the key features of online lending
that encourage reintermediation, in contrast with other multi-sided platforms that simply facilitate direct
transactions between other parties? P2P loans are evaluated based on a few ‘hard’ variables, and investors
have no private or ‘soft’ information about individual borrowers.3 This information structure means that
investors’ market expertise is irrelevant, and makes the task of loan picking ripe for outsourcing. Under
these conditions, the lending platform has incentives to provide investors with high-quality loan analysis,
which can boost loan origination volume by attracting unskilled investors who would otherwise be unable
to judge the quality of loans on offer. By contrast, the tendency towards intermediation may be limited
3Petersen (2004) defines hard information as ‘quantitative, easy to store and transmit in impersonal ways, and its contentis independent of the collection process.’ In contrast, soft information is ‘information that is difficult to completely summarizein a numeric score.’ In the early years, P2P platforms made some ‘soft’ information about borrowers, such as their photosor textual descriptions, available to investors (see Ravina (2013), Duarte, Siegel, and Young (2012), and Larrimore et al.(2011)). Such information was removed from Prosper in late 2013 and is no longer used.
2

in those markets in which private information and industry expertise, as well as differences in opinion
and preferences, play a more prominent role.
Consistent with this view, we find the quality of Prosper’s loan analysis to be high and improving over
time. The absence of soft information and the arm’s length double-blind nature of P2P lending makes
online lending susceptible to adverse selection by borrowers, and we show that default rates on P2P
loans are higher than on other credits to consumers with similar FICO scores. Nonetheless, P2P lenders’
returns in most periods have been higher than those on junk bonds, even though investors predominantly
use passive strategies and perform none of the traditional lenders’ functions related to loan evaluation,
pricing, monitoring, and servicing. Investors’ returns reflect the performance of the lending platform
as the loan officer. We show that not only is Prosper’s in-house credit score much more informative
than FICO in predicting borrower default, but also that its accuracy has been increasing over time. We
argue that the presence of institutional investors who are able to identify mispriced loans motivates the
platform to improve its algorithms in order to increase funding rates and maximize loan volume. In turn,
investors have responded by adopting a more passive approach that largely forgoes active loan picking,
presumably because the quality of loan evaluation performed by the platform has become high enough
to render additional screening by investors unnecessary.
The original disintermediation and the subsequent reintermediation of the P2P lending market can
be rationalized within the model recently suggested by Vallee and Zeng (2018), in which the lending
platform solicits and pre-screens loan applications to ensure a certain level of quality before offering
them to investors. In the model, sophisticated investors can choose to become informed and perform
additional screening at a cost, whereas unsophisticated investors buy all loans on offer as long as the
average loan quality is high enough for them to break even. The model predicts that if the platform is
not sufficiently skilled at loan evaluation, sophisticated investors screen loans and pick only high-quality
ones for investment, while unsophisticated investors do not participate in the market. Consistent with
the model’s predictions, we show that in the industry’s early years investors evaluated the loans (through
the auction mechanism), with low funding rates and high returns. Vallee and Zeng (2018) also predict
that as the platform’s ability to identify bad loans improves, the equilibrium switches to one in which the
platform does all the screening and sophisticated investors choose to remain uninformed, investing in all
3

loans offered to them along with unsophisticated investors. The current state of the market, with passive
investors and high funding rates, can be thought of as this second equilibrium in Vallee and Zeng (2018).
Our evidence is instructive in the context of the vast theoretical literature that rationalizes the ex-
istence of financial intermediaries (see Gorton and Winton (2003) for a comprehensive review). Inter-
mediaries are thought to be more efficient at mitigating information-related frictions than decentralized
markets as they are better monitors (Diamond (1984), Williamson (1986)), reduce information production
costs (Ramakrishnan and Thakor (1984)), and enforce loan contracts (Boot, Thakor, and Udell (1991)).
The P2P lending market provides a relatively clean laboratory for testing a subset of these theories. In
contrast to banks, P2P platforms do not take deposits, perform liquidity transformation, diversify across
borrowers, or monitor loans after origination. Instead, our findings point towards scale economies and
technological improvements in loan evaluation as a key benefit of intermediation (Boyd and Prescott
(1986) and Millon and Thakor (1985)). We argue that intermediation may be particularly desirable when
investors have no private or ‘soft’ information.
A central question related to the role of banks as delegated loan evaluators and monitors (Diamond
(1984)) is, who monitors the bank? The intermediary’s moral hazard problem may be particularly acute
in P2P lending. Indeed, in contrast to banks, P2P platforms have historically had little or no stake in
the loans they helped originate. Given investors’ reliance on the platform for loan evaluation, a platform
may be tempted to relax its lending standards in order to inflate loan origination volume and thus its
fees. To investigate this issue, we present a case study of the market’s near-collapse in early 2016 and
the subsequent recovery. We document that between 2012 and 2015 returns on newly originated P2P
loans decreased by half, and this was not fully anticipated in platforms’ return estimates. Meanwhile,
loan originations were growing exponentially through 2015, and defaults did not peak until later. When
securities backed by Prosper loans were put on watch for downgrade in early 2016, loan originations
fell by as much as 83% in 4 months, driven by a steep decline in institutional funding. Following these
developments, the platform re-evaluated its credit models, increased interest rates, and tightened lending
standards. Since then, default rates have decreased, returns have gone up, and loan volume has largely
recovered. This episode suggests that the moral hazard problem may be checked by reputational concerns
and the threat of investor withdrawal if their trust in the quality of loan underwriting by the platform is
4

eroded. Nonetheless, the long-term viability of the current market model remains an open question.
This paper contributes to the emerging literature on FinTech and, specifically, P2P lending. Morse
(2015) provides a review of the early literature, whereas recent contributions include Balyuk (2018), Butler
et al. (2016), Hertzberg et al. (2016), Liskovich and Shaton (2017), Wei and Lin (2016), and Zhang and
Liu (2012). Our results complement Jagtiani and Lemieux (2017), who show that the platforms’ credit
scores are more informative that FICO, as well as Iyer et al. (2016), who document that investors
could infer borrower creditworthiness better than FICO during the disintermediation period. Among
theoretical contributions, our findings are closely aligned with the predictions of the model by Vallee
and Zeng (2018), outlined above. In the empirical section of their paper, Vallee and Zeng (2018) test
their model’s predictions regarding investors’ behavior and loan quality; by contrast, our focus is on the
platform’s role and the evolution of the market. Our paper is the first to explore reintermediation in
FinTech in a setting characterized by the dominance of ‘hard’ information, sophisticated loan investors,
and automated decision making by both investors and the lending platform.
Our findings are broadly supportive of Petersen (2004), who argues that collection and processing of
hard information may be more efficient than soft data because it can be delegated. They are also consistent
with the theoretical prediction of Stein (2002) that multi-layered organizations are more efficient when
information is ‘hard,’ inexpensive, and verifiable. As in Stein’s model, investment decisions in P2P
markets can be separated from information acquisition and screening. By providing high-quality loan
evaluation, the platform can encourage even uninformed lenders to invest in P2P loans with confidence.
Finally, we also contribute to the literature on technological innovation (e.g., Genrig (1998), Hauswald
and Marquez (2003)). Banerjee (2005) predicts that investing in screening technology may discourage
adoption of superior screening technology by other lenders. Our paper shows that improvements in loan
screening brought about by FinTech may crowd out screening by investors, giving rise to reintermediation.
1. The peer-to-peer lending market
The peer-to-peer (P2P) lending market is an online marketplace where individuals and institutions invest
in consumer loans. P2P lending platforms appeared in the U.S. in 2006, and have become one of the
most successful recent financial technology (FinTech) innovations in consumer finance. P2P loans are
5

fixed-term, fixed-interest, fully-amortizing unsecured loans. The typical maturities are 3 and 5 years.
The size of the loan ranges from $1,000 to $35,000, with interest rates between 5% and 35%. Around
80% of P2P loans are reportedly taken for credit card repayment or debt consolidation.
The two largest P2P lending platforms in the U.S. are Prosper Marketplace and Lending Club, which
together accounted for 98% of the U.S. market in 2014 (Economist (2014)) and are still dominant players
in the market despite some new entrants. As of Q1 2018, they have originated $39.4 billion in loans to
2.77 million borrowers. While this amounts to a small fraction of the $1.03 trillion in revolving consumer
debt and $2.85 trillion in secured and unsecured non-revolving consumer debt outstanding at the time
(FED (2018)), P2P lending amounts to one third of the unsecured personal loan volume. Loan originations
by P2P lending platforms have been growing exponentially since 2013, reaching at least $2.2 billion in
loans in the Q1 2018. PricewaterhouseCoopers estimates that by 2025 the size of the market will be at
least $150 billion annually (PwC (2015)).
1.1. Prosper Marketplace
Our analysis is based on data from Prosper Marketplace, which was the pioneer in the U.S. P2P lending
market, and is now the second largest P2P lending platform in the U.S. after Lending Club.4 Prosper
uses algorithm-based systems automating all steps of the lending process, including application handling,
data gathering and verification, underwriting, credit scoring, loan funding, investing and servicing.
1.1.1. Borrowing and lending through Prosper
To be eligible for a Prosper loan, prospective borrowers must have a FICO score of at least 640 and
satisfy several other criteria. When they request a loan online, they report their income, employment
status, and a number other relevant characteristics, and authorize Prosper to request a credit report
from a consumer credit bureau. The lending platform then uses a proprietary credit-scoring model to
evaluate the Estimated Loss Rate (ELR) on the loan, defined as the annualized expected loss of loan
principal due to borrower’s default. The ELR summarizes Prosper’s assessment of the loan’s default risk
4While we also have the data for Lending Club and report some key statistics for this platform, the Lending Club data isnot sufficiently detailed for us to study investors’ composition, funding rates, or cancellation decisions, and hence our focusis on Prosper. A description of Lending Club can be found in Paravisini, Rappoport, and Ravina (2016).
6
and fully determines the interest rate on the loan. Prosper estimates the ELR are based on a consumer
credit bureau’s score (such as FICO or SCOREX) and the platform’s own analysis of historical losses on
P2P loans.5 The ELR is mapped into one of seven Prosper ratings, which range from AA (the safest) to
HR (high risk). This mapping, loan interest rates, and the model Prosper uses to estimate the ELR are
adjusted periodically.
It is important to emphasize that in recent years the borrower information that Prosper uses and
passes on to investors has been limited to quantitative variables reported by the credit bureau and a
few self-reported borrower’s characteristics, such as income and employment status. ‘Soft’ information
of various kinds was allowed in P2P platforms in their early years, but was removed in 2013 ostensibly
to prevent borrowers’ discrimination, and is no longer used. Moreover, the platform’s decision making is
fully automated, and human intervention in the loan evaluation process is explicitly prohibited.6
If the borrower accepts the interest rate assigned by the platform, the loan application is listed online
through one of the three investment pools (see below), and investors can choose whether to fund the loan
or not. After the loan attracts funding or sufficient time has passed, Prosper initiates a pre-funding review,
which can result in loan cancellation by the platform if the Prosper’s screening algorithms determine the
loan to be too risky or possibly fraudulent. Thus, the platform performs automatic loans screening and
cancels loan applications when there is a suspicion that the interest rate assigned by the pricing algorithm
based on the observed variables may not adequately reflect true investment risk. If the loan is not canceled
by Prosper or withdrawn by the borrower, it is originated for the funded amount.
In addition to retail ‘peers’, investors in P2P loans include institutions, which typically prefer to fund
small loans in full. In response to their demand, in April 2013 Prosper introduced a ‘Whole Loan’ (insti-
5Prosper employs the following three-step procedure to evaluate the ELR. First, using its historical data on P2P loandefaults in conjunction with the borrower’s self-reported information and credit bureau data, the platform estimates theprobability of the loan becoming 60+ days past due within 12 months of the application date. This probability determines theloan’s Prosper Score, ranging from 1 to 11. Second, the platform computes historical loss rates for each combination of theProsper score and the FICO score (more precisely, one of 12 discrete FICO score bins, FICO 599-619, 619-639,. . . 829-850).Third, Prosper adjusts these ‘base’ loss rates based on a few variables it deems highly predictive of borrower risk, which atdifferent times included the maturity of the loan, the debt-to-income ratio, and whether the borrower has previously had aProsper loan. The Estimated Loss Rate equals the base loss rate plus any adjustments.
6“Prosper’s credit underwriting department carefully chooses permissible fair lending inputs from credit bureau variablesand does not rely on any other source other than our own customer credit experience and application information. Also,manual intervention of Prosper’s automated underwriting rules engine is not permitted. For this reason, there is little scopefor individuals to add human bias to credit decisions unlike with bank underwriting files.” (Yoshida (2016))
7
tutional) investment pool to allow accredited institutional investors to purchase loans in their entirety.
Retail investors participate in the P2P lending market through the ‘Fractional’ (retail) pool, which al-
lows a number of investors to crowdfund the loans. Fractional pool investors can choose how much to
contribute to each loan, starting with as little as $25 per loan. Prosper randomly allocates each loan
application to one of the three pools. Applications expire unfunded if over a two week’s period they fail
to attract funding for at least 70% of the requested amount.
Instead of selecting individual loans, many lenders invest passively by instructing Prosper to fund
loans with certain characteristics on their behalf. To facilitate this process for institutional investors,
in November 2013 Prosper added a passive investment possibility to the whole loan pool. The ‘Whole
Passive’ investment pool allows institutions to instruct the platform to invest their money automatically in
loans that satisfy certain criteria. By contrast, investors in the ‘Whole Active’ pool can review individual
loans and choose which ones to fund. Retail investors in the fractional pool have access to Quick Invest
and Auto Quick Invest tools and the Premier order execution service, designed to help them automate
their investment decisions.
Prosper makes money by charging borrowers an origination fee, which ranges from 1% to 5%. In
addition, investors pay a servicing fee of 1% per annum on all principal payments. Prosper’s estimated
return for investors is calculated as the borrower rate, minus the servicing fee, minus the ELR, adjusting
for any expected recovery of principal and lost interest, late collection fees, etc.
1.2. The evolution of lending procedures
The timeline of various developments affecting Prospers’ operations is presented in Figure 1. Prosper
began operations on November 1, 2005 as an online platform where consumers could borrow from their
friends and family. On February 21, 2006, the company announced its public launch as a P2P lending
marketplace. The funding model that Prosper originally used is often referred to as Prosper 1.0 (pre-
“quiet period” model). The platform played a passive role in loan facilitation by providing infrastructure
(similar to trading venues, such as Electronic Communication Networks) and loan ratings (similar to
rating agencies). Its ratings, however, were solely based on a consumer credit bureau’s scores. The
platform did little borrower screening other than imposing eligibility requirements, collecting credit bureau
8

data and self-reported borrower information, and facilitating loan repayment. The platform did not price
P2P loans. The interest rate was the maximum rate that a borrower was willing to pay up to a state-
mandated ceiling (in case of automated funding) or the maximum rate that lenders were willing to accept
on “winning bids” (in case of auction bidding). Lenders could either bid on each loan or invest via a
“standing order” (a passive investment strategy).
Regulatory scrutiny of the P2P loan market caused Prosper to enter a “quiet period” on October
15, 2008 and cease operations until July 13, 2009. Upon reopening, Prosper transformed P2P loans
into securities (‘borrower-dependent notes’) and made changes to its lending process. The platform’s
new funding model is often referred to as Prosper 2.0 (post-“quiet period” model). Prosper’s platform
continued to operate as an essentially disintermediated loan market with the platform doing little borrower
screening, other than fraud detection and income verification. The platform was verifying income and
employment for a quarter of P2P loans, cancelling around 15% of them because of verification failure.
The interest rate was determined in an auction process. Prosper set the minimum rate on a loan based on
its rating, whereas borrowers determined the maximum rate. Investors could place manual bids on P2P
loans or use Prosper’s “portfolio plan system” (a passive strategy). Because of the platform’s passive role
in loan evaluation and screening, we call the 2005-2010 period the disintermediation period.7
On December 20, 2010, Prosper made a major change to its platform by switching from the auction
funding model to a fixed rate model. The platform started pricing loans and took a more active role
in loan screening by stepping up its verification, loan cancellation, and collection efforts. On July 20,
2012, the platform also introduced more granular ELR-based pricing while continuing to report coarser
Prosper ratings alongside ELRs. The change to posted prices marks the change to the so-called Prosper
3.0 model and gradual transition to a reintermediated P2P loan market. We call the 2011-2012 period
the transition period.
Prosper made a number of substantial changes to its credit model throughout 2013: The platform
introduced a new credit model (end of 2012 – early 2013), launched separate investment pools for in-
stitutional investors (April 2013), and started using the FICO credit score in its pricing model instead
7Prosper’s data set contains limited data for 2005-2006, so we focus on 2007-2008 in most tests when examining theplatform’s role during this period.
9

of SCOREX (September 2013). Prosper’s loan evaluation and pricing has become more dynamic, with
frequent adjustments to its ELR algorithms and the mapping between ELRs and interest rates. Pros-
per has also been updating its credit model periodically.8 At the same time, Prosper has reduced the
amount of information provided to investors. In September 2013, the platform removed loan descriptions
from applications and eliminated the ability of investors to ask questions to borrowers. In January 2015,
Prosper reduced the frequency of updating its historical defaults data from daily to quarterly. Thus, soft
information that used to be available in the P2P loan market during the disintermediation period, such
as borrower pictures or narratives, was phased out and is no longer available. We refer to the period
after 2013 as the reintermediation period because of the platform’s active role as an intermediary in
the P2P loan market. As we argue below, one can compare the current Prosper to an investment fund
where automated software acts as a fund manager making essentially all decisions as to loan evaluation,
screening, and loan allocation.
2. The data
2.1. Sample construction
Two loan data sets are available for download from Prosper’s web site, one detailing loan applications
(“listings”) and one describing the subsequent performance of originated loans. To construct our sample,
we first remove any duplicates from each data set, retaining only the last entry for each loan. We also
remove all loan applications that do not meet Prosper’s eligibility criteria, loans without a Prosper rating
or with a Prosper score over 11 (the highest possible), as well as one-year maturity loans, which Prosper
stopped originating in April 2013. We also exclude loan applications from Iowa, Maine, North Dakota,
and Puerto Rico, because borrowers residing in these states were prohibited from using Prosper for a
substantial portion of our sample period and their loan applications could not result in loan origination.
The resulting data set includes 1,242,278 loan applications submitted between February 2007 and
February 2018, resulting in 871,414 originated loans. Loan applications fail to result in loan origination
8The platform’s latest credit model is based on TransUnion data. Prosper switched from using Equifax data to exclusivelyusing TransUnion data in April 2017. Of note, LendingClub has also been making some major changes to its pricing andscreening algorithms and the platform no longer uses FICO in its loan evaluation model, relying on machine learning.
10

if they are withdrawn by the borrower, expire unfunded, or are canceled by the platform as part of the
screening process. In practice, the most important of these factors by far is loan cancellations by Prosper,
which account for 86.6% of failed applications.
In order to relate loan returns after origination to borrower characteristics, it is necessary to merge
loan performance and listing details files, which are not linked in Prosper. To this end, we match loans in
the two data sets on variables common to both, i.e., loan origination date and time, loan amount, interest
rate, Prosper rating, and loan maturity. If there is a unique match based on these variables, the entry is
classified as matched. If there are several listings that can be matched to a particular loan or vice versa,
we classify all these observations as unmatched. This approach allows us to match 95% of originated
loans before 2010, but this proportion decreases in later years as the number of listings increases, so that
only 49% of loans originated in 2016 and later are matched uniquely.
Our matched sample consists of 423,065 originated loans, for which we have data on subsequent loan
performance through November 2017. We use this sample in tests that combine variables from both
files (e.g., regressions of loan default rates on borrower characteristics), but report statistics from the
full performance and listings data sets whenever possible. Most of our tests focus on the period after
February 2013, the month when Prosper added a large number of borrower characteristics employed in
our tests, including the FICO score, and around the time when the institutional loan pool was introduced.
Although the length of this period is less than half of Prosper’s history, it covers over 94% of all loans.
We supplement our analysis with data on loans originated by Lending Club (LC) between May 2007
and March 2018. After excluding loans that are not eligible for investment by the general public, the LC
sample includes 3,390,733 loans. Of these, there is enough information for us to compute default rates
for 1,646,238 loans, and realized returns for 1,558,437 loans. To match Prosper’s loan data, we focus on
LC’s loan performance through November 2017 in all loan default and returns tests.
2.2. Summary statistics
Table 1 provides descriptive statistics for all loan applications as well as for loans that were originated
on Prosper. The summary statistics for Lending Club loans are provided for reference. The median
loan size on Prosper is $12,000. Loans in our sample are amortized over either 36 or 60 months, with
11
the former comprising 71% of all loans. The median interest rate on originated loans is 14.3% and the
median estimated loss rate of principal due to default (ELR) is 6.24%. The median borrower’s FICO
score is 689.5 and median (self-reported) annual income is $60,700. For comparison, the median FICO
score in the general population during this period was 700 and the per capita income in the U.S. in 2016
was $43,183, according to the Bureau of Labor Statistics. Comparing the distributions of FICO scores,
we notice that while means and medians are similar for the general population and P2P borrowers, the
dispersion is much higher for the former. This is to be expected, given that risky borrowers with FICO
scores below 640 generally cannot apply for a P2P loan, whereas those with very high scores are less
likely to need a loan, or if they do, they may find it easier to secure cheap credit from banks.
The median applicant is employed with their current employer for 6.17 years, does not have a mortgage,
and has the debt-to-income ratio of 0.17. Around 15% of Prosper borrowers come back for another loan
from the platform. There are few differences between the characteristics of loan applications and those of
originated loans in the matched sample apparent from Table 1. One notable exception is that applicants
who have at least one prior Prosper loan are more likely to be successful. The platform’s algorithms are
much less likely to cancel a loan application if the borrower already has an outstanding Prosper loan,
presumably because the borrower was screened previously.
Panel C of Table 1 shows realized annual returns and default rates on Prosper loans. Across all
loans, the default rate is 6.23% per annum. With the average interest rate of 15.8% less 1% servicing fee
that Prosper subtracts from payments to lenders, net returns average 6.32% across the sample, and the
median is 10.5%. These returns are substantial for our sample period when interest rates were low by
historical standards, particularly given that, as we show below, in order to earn them investors needed
to do little else other than buy indiscriminately all loans offered to them by the platform. It should be
noted, however, that our sample period does not include any periods of major stress in the consumer
loan market. In addition, the general trend since 2011 has been toward lower returns, although there
may have been a partial reversal in the later part of the sample. The evolution of returns over time is
discussed in detail in Sections 5 and 6.
12

3. Main stylized facts
We begin our analysis by documenting several stylized facts about the P2P loan market focusing on
the period after 2013, which we call the reintermediation period. We show that investors regard the
lending platform as an intermediary rather than as a passive match-maker, and outsource most credit
adjudication tasks, such as loan evaluation and screening, to the platform’s software.
3.1. P2P investor pools and investment automation
Prosper’s platform was originally designed as a platform for peers to lend to peers. Despite some presence
of institutional investors in the platform’s early years, P2P loan investments were largely dominated by
retail lenders. Prosper introduced the institutional investment pool in April 2013, and split it into the
active and passive subpools in November 2013. Table 2 reports a large increase in the annual P2P loan
volume during the reintermediation period.
Figure 2 shows the relative size of the two institutional pools and the retail investor pool over time.
In recent years, the institutional loan funding has been the largest by far. Overall, since November
2013, 75.2% of all originated loans were funded through the passive institutional pool and 16.3% through
the active institutional pool. By contrast, retail investors funded only 9.4% of loans throughout this
period.9 Thus, only a small fraction of lending extended through P2P markets is still retail-to-retail, or
“peer-to-peer”.
Institutional lending is not only dominant, but also largely passive: Over 82.2% of all institutional
loans are funded through the Whole Passive pool, whereby the lending platform is instructed to fund
the loans on investors’ behalf automatically as long as they satisfy some pre-specified criteria. Moreover,
the true degree of investment automation is likely to be even higher, especially in the active institutional
(‘Whole Active’) pool. Although investors in this pool choose which loans to fund, human contribution
to this process may be largely limited to setting up loan-picking robots, with little involvement in the
evaluation of specific loans afterwards. Indeed, we find that the median loan in 2016 was funded within
9While the proportion of retail funding went up briefly to 30.3% in July 2016, this increase appears to have been temporary,driven by the drop in institutional funding following the Moody’s announcement of a potential downgrade of securitizationsbacked by Prosper loans. We describe this episode in greater detail below. By the end of 2016, the trend appears to havebeen reversed, with only 6.9% of loans funded through the retail investor pool throughout 2017.
13

just 3.75 seconds after being listed on the platform. These funding times are implausibly short for human
decision making, and suggest automated investment through the platform’s application programming
interface (API). We find that the funding times in the active institutional pool were steadily decreasing
in years 2013–2015, with the medians of 12, 10, and 8 seconds, respectively.10 These statistics are
consistent with fast algorithmic decision-making in the active institutional pool.
In contrast with the institutional pools, the median funding time in the retail investment pool increased
from 1.14 hours to 44.2 hours in 2013–2016 and then decreased to 7.4 hours in 2018, suggesting mostly
manual loan picking. However, there is large heterogeneity in funding times for this pool. Some 3.5%
of these loans are funded within a minute and about 5% are funded within five minutes of appearing on
the platform, suggesting automated decision-making. Investors’ attention spikes at 9AM and 5PM, when
Prosper makes new listings available; investors logging in around these times are also more likely to fund
older, outstanding listings.
To summarize, institutional investors fund 90% of Prosper loans, predominantly by instructing Prosper
to purchase in full on their behalf all loans that satisfy certain criteria investments are institutional and
involve little ongoing human input. Robots play a dominant role, with Prosper’s software evaluating
loans and funding 75% of them via the passive institutional pool, and active institutional investors using
algorithmic decision making with limited human involvement.
3.2. Funding rates and loan screening
Loan screening is as a key aspect of the lending decision. Information asymmetry between borrowers
and lenders can result in credit rationing (Stiglitz and Weiss (1981)), whereby some borrowers may be
unable to secure a loan at any interest rate because of lenders’ concerns about their hidden riskiness.11
The adverse selection problem may be particularly acute in P2P markets because of the absence of soft
information and the arm’s length relationship between borrowers and lenders, who do not even know
10The median funding time increased to 55 seconds in 2017. This was probably caused by Prosper’s switch to a new dataformat, with TransUnion replacing Experian as the source of credit report data. The median funding times dropped to 26seconds in 2018.
11Bester (1985) defines credit rationing as credit denied to borrowers who would otherwise accept higher interest rates orprovide collateral; this definition is consistent with how the term is used by Stiglitz and Weiss (1981). By contrast, Jaffeeand Russell (1976) define credit rationing as supplying a smaller loan amount than demanded by the borrowers after quotingan interest rate.
14

each other’s identities.
In contrast to traditional bank lending, where banks perform all loan evaluation and screening, the P2P
loan market’s design in principle allows both the lending platform and investors to engage in borrower
screening. On the one hand, the P2P lending platform prices loans and screens out (cancels) some
possibly fraudulent or risky loan applications.12 On the other hand, investors can perform their own
credit evaluation using the information provided by the platform to determine whether the loan price set
by the platform is commensurate with the loan’s level of credit risk, and deny finding to borrowers who
they deem too risky.
In our data set, screening out by investors results in denial of funding, and screening out by Prosper
results in a loan cancellation. Along with the loan pool composition, Figure 2 shows the proportion of
loan applications that failed to attract funding from investors. This proportion is quite small. As many
as 98.5% of all listed applications have been funded since 2013 and as many as 95.4% of loan applications
have been funded since 2007 (see Table 2). Table 3 reports historical funding and cancellation rates
by Prosper rating. Prosper ratings vary from AA (safest), with the average interest rate of 6.9% and
the average binned FICO score of 750.8, to HR (riskiest), for which the interest rate is 29.6% and the
FICO score average is 661.8 (see Panel A).13 The fraction of funded applications varies somewhat across
credit quality and investor pools, reflecting investors’ preferences and loan picking skills. Nonetheless,
the funding rates are universally high. By and large, investors fund almost all loans offered to them by
the lending platform, apparently with little if any effort to evaluate individual loan applications before
deciding to lend.
The low rejection rates suggest that investors rely on the lending platform for effective loan evaluation
and screening. Prosper’s algorithms flag a fraction of loan applications as potentially suspicious, and
attempt to automatically verify certain critical information, such as borrower’s income and employment
status. Prosper’s screening algorithm may cancel a loan if it determines that the likelihood of default
12Although Prosper provides a wealth of borrower data to investors, borrower identities are not shared with investors.Therefore, the P2P platform can do more in-depth borrower screening than investors can, including identity checks andincome verification.
13The table also shows that there is high correlation between the FICO score and the SCOREX score. The FICO scoreis a widely-recognized measure of default risk in consumer lending. However, because FICO is only available starting from2013 in the data, some of our tests are based on SCOREX.
15
by the borrower may be materially greater than the one implied by the initially assigned Prosper rating.
In the data, 25.9% of loan applications have been canceled by the lending platform since 2007, with
somewhat higher historical cancellation rates for high-rated loans (Table 3). Cancellation rates have been
even higher for the reintermediation period, standing at around 26.9% through the period (Table 2).14
These high cancellation rates are in sharp contract with less than 2% of applications rejected by investors.
In order to test whether investors tr to avoid suspicious loans, one can compare funding rates (outcome
of investors’ screening) on loans that are subsequently screened out (cancelled) by Prosper with those that
are not. Unless investors’ and the platform’s screening efforts are perfect substitutes, one would expect to
find fewer cancellations for funded versus unfunded loan applications. Contrary to the above hypothesis,
we find that on average 26.3% of funded loans are subsequently canceled by Prosper, compared with
only 16.6% of loans that failed to attract funding. This difference is particularly pronounced for riskier,
lower-rated loans. Thus, historically the probability of being screened out by Prosper has been more than
1.5 times as high for funded as for unfunded loans. Thus, investors appear unconcerned about potential
fraud, apparently trusting the platform’s screening algorithms and doing little screening of their own.
3.3. Evolution of loan screening: platform vs. investors
Table 2 reports loan funding and cancellation rates for each of the three phases in the platform’s de-
velopment, disintermediation, transition, and reintermediation. It shows that funding and cancellation
rates have generally both increased over time. The proportion of loan applications that receive investor
funding has increased from 24.9% during the disintermediation period to 73.2% during the transition
period and 98.5% during the reintermediation period. Loan cancellations by the platform increased from
a mere 5.0% in 2009–2010 to 21.9% in 2011–2012 and 26.9% since 2013. The quality of the borrower pool
as proxied by the SCOREX score hasn’t changed dramatically over time, although it is somewhat lower
during the reintermediation period. This decrease in borrower quality possibly reflects the platform’s
efforts to boost loan supply in view of the increased demand from institutional investors over this period.
Figure 3 shows the evolution of the proportion of loan applications rejected by investors (unfunded)
14Prosper reportedly verified income and/or employment information self-reported by borrowers for 58% of the originatedloans on a unit basis and approximately 72% of originated loans on a dollar basis between July 13, 2009 and March 31, 2016.Subsequent to such verification, Prosper canceled 11% of loan applications solely on the grounds of inaccurate or insufficientinformation (Prosper Prospectus dated May 24, 2016).
16

and by the platform (canceled). There is a sharp decline in the proportion of unfunded loans and a jump
in loan cancellations in 2011, when the lending platform switched from the disintermediated auction
market to the pre-set rate environment. The overall trend has been towards an increasing role of the
platform in loan screening, which we interpret as evidence of redetermination. Moreover, loan screening
by the lending platform has replaced that by investors, suggesting that the two are substitutes. Investors
over time have gradually outsourcing most of the decision-making on loan pricing and screening to the
lending platform, and have recently been willing to snap almost all loans offered to them by Prosper.
Table 2 also summarizes annual realized returns and their determinants for the three periods in the
platform’s evolution. Despite being as high as 14.1% during 2009–2010, realized loan returns decreased
during the transition period and reached 6.0% in the reintermediation period. The decrease in returns
after 2013 appears to be due to both lower interest rates for all Prosper ratings and increasing default
rates. While we discuss these trends in mode detail in Section 5, it should be noted that the observed
pattern is consistent with the predictions of Vallee and Zeng (2018). In their model, as the platform
takes a more central role in screening, it has incentives to reduce the quality of the loan pool to maximize
loan origination volume. This results in lower returns compared to earlier periods, when sophisticated
investors were active in loan evaluation and funded only high-quality loans.
Overall, the evidence so far suggests that in addition to evaluating the risk of default and assigning
loan interest rates, Prosper’s algorithms also essentially decide which loans should be originated and
which denied credit. The fact that investors agree to fund most of the loans that are subsequently flagged
as suspicious by Prosper suggests that they rely on the platform’s automated algorithms to screen out
fraudulent applications. The market is essentially one in which the platform’s algorithms make almost
all important decisions relevant to lending. And on the investors’ side, three quarters of the loans receive
funding through the passive institutional pool, and most of the remaining ones are invested in by robots,
apparently with more attention given to identifying underpriced loans15 than to detecting fraudulent
applications likely to result in large losses. Central to this market structure is the expectation of a high
quality credit analysis by the lending platform’s software as the de facto loan officer, which we study
15Balyuk and Davydenko (2017) show that investors are more likely to fund loans for which Prosper overestimates theprobability of default, offering opportunities for high risk-adjusted returns.
17

next.
4. Loan evaluation and the platform’s role
4.1. Adverse selection in P2P markets
Asymmetric information about borrower risk may result in a market failure (credit rationing), whereby
consumers may be denied credit because of lenders’ concerns that only the riskiest borrowers would
apply for loans (Stiglitz and Weiss (1981)). The absence of soft information means that P2P loan
applications must be evaluated based on a limited number of variables reported by either the borrower
(possibly untruthfully) or a consumer credit bureau. In addition, the arm’s length nature of P2P lending,
where neither the borrowers, nor the lenders know each other’s identity, may lower the psychological
and reputational costs of defaulting on a loan. These factors are likely to result in adverse selection, as
consumers of lower quality than suggested by their bureau credit scores may attempt to borrow through
the P2P market and later default in high numbers.
To test this hypothesis, one can compare consumer default rates on P2P loans with those for other
credits, controlling for the borrower’s FICO score as an observed traditional “hard” measure of credit
quality. Since roughly 80% of Prosper loans are taken to refinance credit card debt, P2P loan default
rates can be compared with those on credit card balances that consumers carry as debt. Using P2P loan
data from Lending Club, Jagtiani and Lemieux (2017) find that for a given FICO score, the probability
of debt becoming delinquent within 12 month of origination is noticeably higher for Lending Club loans
than for credit card debt. We reproduce their statistics on credit card defaults in Panel A of Table 4,
along with our own estimates of the 12-month delinquency rates on Prosper and Lending Club loans
originated during the same period.16
Consistent with the adverse selection being present in P2P markets, the table shows that P2P bor-
rowers are riskier than credit card borrowers with similar FICO scores. Moreover, borrowers on Prosper
are riskier than on Lending Club, which reportedly caters to the higher end of the P2P market.
16For comparability with Jagtiani and Lemieux (2017), in Panel A of Table 4 we compute default rates as the fraction ofloans that become 60 days past due within 12 months of origination. Elsewhere, we define default rates for a group of loansin the spirit of the hazard-rate analysis as the number of months that end in default divided by the total number of monthsthat the loans are under risk, annualized as 1 − (1 − p)12 to yield the same cumulative probability of survival.
18

Thus, the platform’s role in this market can be substantiated by the need to mitigate borrower adverse
selection, including detecting cases when the FICO score is not reflective of the true risk of borrowers.
4.2. Prosper score vs. FICO score
Prosper explicitly recognizes that P2P borrowers may not be representative of the general consumers’
population and employs its own proprietary model to predict loan losses. It combines an in-house analysis
of P2P loan defaults with a credit bureau’s score (FICO or SCOREX) to compute the Estimated Loss
Rate (ELR), which is then directly mapped into borrowers’ interest rates.17
The default-predicting ability of Prosper’s credit assessment relative to agency scores is illustrated
by Panel B of Table 4, which shows default rates for different combinations of Prosper ratings and
FICO buckets. Panel C of Table 4 shows the respective statistics for Lending Club subgrades, for
comparison. The first thing to note is that Prosper’s assessment differs substantially from what the
FICO score suggests for some borrowers, such as borrowers with FICO scores below 680 yet rated AA
by Prosper. Moreover, default rates vary widely across Prosper ratings, but little across FICO bins for a
given rating. For example, default rates for loans rated A vary between 2.52% and 3.27% across different
FICO buckets and the relationship between default probability and FICO buckets for this rating does
not appear monotonic. By contrast, default rates for loans within the 660-679 FICO bucket vary between
2.68% and 13.89% across different Prosper ratings, and the relationship looks monotonic in borrower risk
as measured by Prosper rating. Moreover, the probability of default for borrowers in the 660-679/AA
FICO-rating cell is similar to the default probability for the 780+ FICO consumers rated A by Prosper.
Thus, Prosper ratings largely subsume FICO scores, rendering them relatively uninformative. This
may have been expected, given that Prosper’s model incorporates FICO scores. What is reassuring is that
at least on average Prosper’s credit risk assessment is not simply incrementally informative but apparently
vastly superior. Thus, by processing hard information effectively, the lending platform is able to reduce
the uncertainty about borrowers’ quality, which should encourage lenders to participate in this market
17Based on data from Lending Club, which employs its own credit scoring procedure, Jagtiani and Lemieux (2017) findthat the platform’s assessment of borrowers’ risk often differs significantly from what their FICO scores suggest; they alsofind that the correlation between Lending Club’s scores and FICOs has been decreasing over the years, potentially becausethe platform has been reducing its reliance on the agency score in favor of its own evaluation of borrower risk. In early 2018,Lending Club reported plans to completely exclude FICO scores from their model.
19

and mitigate the credit rationing problem. Prosper’s risk evaluation should be particularly valuable for
unsophisticated retail investors, for whom evaluating individual loans’ risk would be impractical. As to
institutional investors, the fact that 80% of them invest through the whole passive loan pool suggests
that they also mostly trust Prosper’s assessment of risk and regard the assigned loan interest rate as
adequate.
4.3. Loan pricing and default risk
In this subsection, we examine which loan characteristics are priced by Prosper, and whether the same
variables also affect the hazard rate of default. As described above, Prosper uses a proprietary model to
estimate the loss rate on the loan (ELR), which is then mapped into the borrower’s interest rate. We focus
on ELR, which summarizes Prosper’s assessment of expected default losses. By contrast, loan interest
rates are also affected by time-varying interest rates and risk premia, and thus are a noisier measure of
default risk. We model default risk using a parametric hazard model, outlined in Appendix B.
Table 5 reports regressions of the ELR and the default hazard on various borrower and loan charac-
teristics. Most determinants of the ELR also strongly affect the hazard rate of default. The effect of most
variables conforms to expectations. Both the ELR and default risk are increasing in the debt-to-income
ratio and the borrower’s recent credit activity, as measured by the number of transactions and credit
inquiries within the last 6 months. They are decreasing in the borrower’s income, the number of credit
lines in the borrower’s name, and unused credit available on credit cards. Long-term loans and those
extended to self-employed and delinquent borrowers are riskier, which is reflected in Prosper’s model. Of
note, Prosper favors repeat borrowers with lower rates as it assigns lower ELRs to such borrowers, which
is consistent with lower default rates by such borrowers, perhaps owing to the survivorship bias.
While most borrower characteristics that feed into Prosper’s credit model do predict variations in
default risk, Column (3) of Table 5 shows that many variables are significantly related to the default
hazard even after controlling for the ELR. Thus, their effect on default may not be fully captured by the
Prosper model. Moreover, as Columns (4) and (5) show, some factors (such as non-linear transformations
of other variables, such as the debt-to-income ratio) significantly affect the ELR but are not related to
the actual default hazard in our tests. Moreover, some variables, such as whether the borrower has a
20

mortgage, seem to be priced with the wrong sign. Hence, it should be possible to build a more precise
model that would improve on that used by Prosper, which would allow investors to identify loans that are
can be expected to earn superior return given their true risk. Vallee and Zeng (2018) show that investors
subscribed to a service called LendingRobot are able to earn superior returns, presumably because its
algorithms correct some of the mispricing introduced by the platform.18 Nonetheless, the Prosper model
provides a high quality credit analysis, far superior to credit bureau’s scores.
4.4. Performance of Prosper’s model over time
Prosper states that its model is updated periodically to reflect changing expectations and to incorporate
the growing history of P2P loan performance. In addition to capturing the average level of default risk,
a good credit model should be able to distinguish between safe and risky loans in the cross-section. A
standard measure of classification accuracy is the area under the ROC (receiver operating characteris-
tic) curve, which plots the classifier’s sensitivity (the “true positive” rate, or the proportion of defaults
correctly classified as such) against 1–specificity (the “false positive” rate, or the proportion of nonde-
faulting loans wrongly classified as defaulting). The ROC area varies from a minimum of 0.5 for a random
predictor with no power to a maximum of 1 for a predictor that makes no classification errors.
To assess the cross-sectional accuracy of Prosper’s model and its performance over time, we measure
the area under the ROC curve using the ELR as the risk measure that summarizes Prosper’s risk assess-
ment. We focus on loans originated in the passive institutional pool, which are likely more representative
for the purposes of studying the quality of Prosper’s credit analysis than the average loan in the sample.
Indeed, the set of loans originated through the active institutional and retail pools is affected by investors’
attempts to identify attractive investments, which may bias the results.
Across all passive institutional loans, the ROC curve area is 0.651 (Table 6). For comparison, this
statistic is only 0.596 for FICO bins, which implies considerably lower accuracy. In fact, the lower bound
of the 95% confidence interval around the ELR-based ROC area is almost universally higher than the
upper bound of the 95% confidence interval around the ROC area based on FICO bins.
18In order to calculate loan returns, we also build our own parametric hazard model of defaults based on the full historyof loan performance available to date, as outlined in Appendix B, which includes 22 borrower and loan characteristics. Thevariables included in regressions of Table 5 constitute a subset of the full specification.
21

Moreover, ELR’s sorting ability has increased over the years. The ROC area based on ELR as the
classifier has been steadily increasing, with the lower bound of the confidence interval in 2017 being
higher than its upper bound in 2013. Figure 4 shows the ELR-based ROC area for different monthly loan
cohorts. As can be seen, the classification accuracy has generally been trending up, suggesting that the
quality of Prosper’s model has been improving over the years. The patterns described above are similar
for Lending Club (Panel C of Table 6).19 The predictive ability of its measure of loan risk, subgrade,
appears to exceed that of the FICO score, despite that the predictive ability of the FICO score for LC
loans is similar to FICO’s predictive ability for Prosper loans.
4.5. Loan screening by Prosper
In the presence of adverse selection coupled with investors’ tendency to fund almost all loans on offer, the
ability of the lending platform’s algorithms to identify and cancel applications from borrowers who are
riskier than they appear may potentially be crucial in preventing credit rationing and potential market
breakdown. Unlike traditional banking, where loan applications are screened before a credit decision is
made, Prosper uses a hybrid process: A P2P loan application is listed on the platform and becomes
available for investors to fund before the application is screened by Prosper’s algorithms, which may
involve verifying borrower’s self-reported information. This substantially reduces the time it takes to
originate a loan, but may raise concerns of lax screening.
To better understand the screening process in these markets, we first relate the probability of loan
cancellation to borrower characteristics. If Prosper effectively screens out borrowers of low hidden quality,
one would expect to see more cancellations for borrowers with overstated income or an unreliable FICO
score, either because of its coarseness as a measure of riskiness or because of a short credit history
that does not adequately reflect the borrower’s risk. Prosper does not verify income and employment
for all loans, but rather uses a proprietary algorithm to determine which loan applications to screen.
For example, according to Prosper, the algorithm is supposed to flag loans for which the borrower’s
self-reported income is ‘highly determinative’ of the Prosper rating.
19Recently, Vallee and Zeng (2018) have employed a similar methodology to document an upward trend in the accuracyof Lending Club’s and Prosper’s models. Their ROC area analysis is based on the platforms’ ratings; we use the ERL forProsper and subgrade for Lending Club as a more granular default predictors.
22

We examine the determinants of loan cancellations and contrast them against funding decisions by
investors in regressions presented in Table 7.20 As expected, the likelihood of loan cancellation is higher
for borrowers with lower debt-to-income ratios (Columns (1)–(3)). These borrowers likely have overstated
income that reduces the ratio or have little debt suggesting that other traditional lenders may have credit-
rationed these borrowers. It is surprising, however, that loan applications from self-employed borrowers
are rarely canceled, even though their income cannot be verified. Instead, Prosper appears to price
the risk in by assigning higher interest rates to self-employed applicants. Table 7 also shows that the
probability of loan cancellation is positively related to the FICO score, although the magnitude of the
effect is small on average. However, the fraction of applications from borrowers with a FICO score over
800 that are canceled by the platform is 40%, compared with only 29% for other borrowers, suggesting
that the screening algorithm is more likely to be skeptical about applicants with very high scores needing
a P2P loan.
In general, the effect of most borrower characteristics on the probability that the application is
subsequently canceled by Prosper is consistent with the platform’s screening out those borrowers whose
‘hard’ credit variables may not be reliable predictors of default. This includes borrowers who do not have
a mortgage, or have short credit histories and multiple credit inquiries. In contrast, loan applications from
borrowers with prior Prosper loans seem to be canceled significantly less often. Having a prior Prosper
loan reduces the probability of loan cancellation by 18 percentage points, or 67% relative to the average
cancellation rate. This is despite that the financial situation and the risk of the borrower may change
significantly between loan applications. Nonetheless, having screened a borrower once, the platform likely
has more trust in the information provided by the borrower in subsequent loan applications.
Columns (4)–(6) of Table 7 show that most characteristics that are correlated with a higher probability
of loan cancellation are also negatively related to the probability that the loan is funded by investors,
even when we control for the loan risk by including ELR fixed effects. This suggests that screening
by the platform and screening by investors can at least to a certain degree be considered substitutes.
Therefore, improvements in the platform’s ability to screen out risky loans can cause investors to cease
20Since we include listing month fixed effects into our model to control for differences in the borrower pool across timeand variations in the screening model employed by the platform, we prefer OLS with fixed effects to logit.
23

their own screening and become passive to avoid duplication of screening costs. This delegated screening
is similar to the role traditional intermediaries play in reducing costs of information production, as in
Ramakrishnan and Thakor (1984).
4.6. Screening effectiveness
To formally assess whether Prosper’s screening is effective, one would need to investigate if loans that were
canceled would have resulted in higher losses had they been extended. Unfortunately, this counterfactual
is generally unobservable, so the evidence is only indirect. Carmichael (2017) identifies borrowers who
applied for a P2P loan both through Prosper and through Lending Club. He finds that applicants whose
Prosper loans were canceled by the platform but who nevertheless received a loan from Lending Club are
significantly more likely to default given their rating, implying that canceled loans are riskier than they
appear.
Our own evidence regarding loan cancellations is based on Prosper applicants who, having had their
loan application canceled, reapply for another loan within a month. For such borrowers, Prosper re-uses
their previous credit report, but their self-reported information may be different.21 We first compare
loan and borrower characteristics for such re-applying borrowers appearing on their old (canceled) and
new (resubmitted) loans applications. We find that even though the applicants are the same and no
more than a month has passed between the applications, the proportion of applicants who admit to being
self-employed increases from 5% to 9%, and the stated monthly income is decreased by $1,710. Thus,
these applicants are likely untruthful on the first application, which is detected by Prosper and leads to
the loan cancellation. As a result of the revision in the application data, the loans’ assessed ELR increases
by 81.4 basis points on average, which results in a 0.31 points lower Prosper rating, 1.3 percentage points
higher interest rate, and 11.5% smaller loan size.
Regression analysis of Table 8 shows that, controlling for the ELR, re-submitted loans that receive
funding are significantly more likely to default. We find default rates on these loans to be 3 percentage
points higher than those for other borrowers with the same ELR in the same month. Thus, the loans
21We focus on borrowers who reapply within 30 days to mitigate concerns that the borrower’s true creditworthiness ortheir assessment by Prosper are affected by other unobservable factors. In the sample, 76.7% of borrowers who reapply afterthe application is canceled do so within this period, perhaps to ensure that Prosper uses their prior credit report instead ofrequesting a new one.
24

from the previously screened out applicants are too risky even for the newly assigned, higher ELR. Had
these loans been issued at the ELR assessed originally on the first application before it was canceled,
the resulting default rate would have been 4.3 points higher than on other loans with the same ELR.
These findings confirm that loans that are canceled by Prosper are indeed riskier than others with the
same assessed risk. However, Prosper appears too lenient when borrowers who were previously screened
out reapply for another loan, and does not fully compensate for their higher risk when assigning the new
ELR.22
Vallee and Zeng (2018) predict that when the platform increases its pricing precision (intensive margin
of loan screening), it needs to cancel fewer loan applications (extensive margin of screening). However,
their model does not allow for the differential pricing of loans of different risk. As such, it cannot
explain the existence of credit rationing (loan denial) in situations when riskier borrowers should be
able to secure funding simply by paying a higher interest rate. To investigate whether increasing the
effectiveness of loan pricing allows the lending platform to reduce the number of canceled loans, we relate
loan cancellations to the area under the ROC curve, calculated based on the loan’s ELR as the classifier
(Table 9). We find that the increase in the ROC area is associated with fewer cancellations, consistent
with Vallee and Zeng (2018). A one standard deviation increase in the ROC area is associated with the
loan cancellation rate that is almost 2 percentage point lower, which is a 6.4% decrease relative to the
mean. Interestingly, controlling for the fundings status, the passive pool indicator is not a significant
predictor of cancellations, which suggests that Prosper does not use lax screening criteria for loans in the
passive pool, which investors fund automatically without review.
Overall, the results on loan screening provide evidence that Prosper cancels more applications of
borrowers whose self-reported information may lead to the underestimation of default risk. Thus, the
platform’s role in screening borrowers extends beyond fraud detection or mechanical income verification,
suggesting a pro-active role in loan screening similar to that played by traditional credit intermediaries.
Although none of these tests can fully control for the endogeneity of borrowers’ choices, in the absence of
22Based solely on these statistics, and ignoring further issues arising from the self-selection of risky borrowers, the ELRfor repeat applicants after a loan cancellation should be increased by about 3.5% on average instead of the observed 0.8%.However, in interpreting these and other realized performance statistics documented in this paper, one should keep in mindthat we obtain them using more data and longer histories than were available at the time when Prosper algorithms werecalibrated, so the model parameters chosen at the time may have been adequate conditional on the available data.
25

a counterfactual our evidence and that reported in Carmichael (2017) suggest that Prosper’s screening
algorithms are able to identify and screen out at least some excessively risky or possibly fraudulent appli-
cations, mitigating the information frictions that can result in credit rationing and investors’ unwillingness
to lend.
5. Loan performance and investment returns
The evidence presented so far is consistent with the platform’s increasing expertise in loan pricing and
screening crowding out loan evaluation by investors, who become passive in response. Given the gradual
improvement in the platform’s ability to predict default, coupled with its incentives to maximize loan
origination volume, loan returns should be expected to trend down, as predicted by Vallee and Zeng’s
(2018) model. Yet whether this market structure allows investors to earn returns sufficient to attract
even unsophisticated investors to the market is an open question.
This section studies investors’ returns on P2P loans. The absence of secondary-market prices for
outstanding loans makes the estimation of realized loan returns a challenging task, which is compounded
by the fact that a large fraction of loans in the sample have not matured at the time of the study and
are still under risk of default in the future. To overcome these problems, we develop and implement a
new procedure for evaluating the performance of non-traded loans, which is described in Appendix A.
5.1. Market trends in loan performance
Figure 5 plots monthly realized returns on Prosper loans net of fees, and compares them with the return
on the BofA Merrill Lynch US High Yield Index during the reintermediation period. The mean (median)
monthly return on a portfolio of Prosper loans across calendar months has so far been 9.58% (8.78%).
On the one hand, these returns are noticeably higher than those on junk bonds, which averaged 6.37%
over the same period. On the other hand, we also find the default rate for Prosper loans in the sample
to be high, averaging 6.23% during these years. For comparison, excluding the financial crisis period,
default rates on high yield bonds are approximately 2%–2.5% in most sample years, increasing to 3.6%
in 2015 and 4.5% in 2016 (Ou et al. (2017)). Thus, Prosper loans have earned higher returns but also
had higher default risk than junk bonds during our (relatively benign) time period.
26

Figure 5 shows that returns on Prosper loans decreased from about 13.2% to 8.2% between January
2013 and November 2017. They fell below the high yield bond benchmark for a period of time in the first
half of 2016, and were as low as 5.6% in August 2016. This decrease in returns was due to rising default
rates, which increased from 5%–6% to above 8% by the end of 2015, without a commensurate increase in
loan interest rates.23 Default rates subsequently declined to 6.1% by the end of the sample, and returns
have increased by more than a percentage point.
Overall, although the market will need to go through a full credit cycle before we can assess the long-
term investment performance of P2P loans with confidence, so far investors have been able to achieve
net returns above those on junk bonds, except for a brief period in 2016. However, consistent with the
theoretical predictions of Vallee and Zeng’s (2018), returns have declined considerably since the market
became reintermediated. Given that loans originated in later years are over-represented in the data due
to the exponential growth of the market, the return on an average loan in the sample (6.23%) is more
modest than the market’s cumulative performance to date. Nonetheless, this evidence suggests that
lending platforms have been able to pass some of the value they create on to investors.
5.2. Returns to passive and active strategies
A well-established result in the literature is that actively-managed mutual funds underperform passive
benchmarks after fees (e.g., Gruber (1996); French (2008)). In contrast to equity markets, P2P loan
prices are determined by the lending platform’s software, rather than in negotiations between buyers
and sellers in the P2P loan market, implying more potential for mispricing. Therefore, it is possible
that active loan selection in P2P markets may outperform passive investment strategies. We test this
conjecture by comparing loan performance in the active institutional pool, where investors can evaluate
loan applications, with that in the passive pool, where applications are funded automatically as long as
they satisfy certain criteria.
Table 10 documents loan returns and their determinants during the reintermediation period, by
Prosper rating and across investment strategies (active vs. passive).24 Panel B reports estimated loss
23In early 2016, as doubts surfaced about Prosper’s loan quality and improprieties were alleged at Lending Club, the P2Plending market experienced its most serious crisis to date. We describe this episode in detail in the next section.
24When calculating realized returns by rating, we are assuming that any proceeds from loan repayment are reinvested intoloans with the same rating that are originated within the same investor pool.
27

rates (ELRs) for loans originated during this period, which range from 1.45% for AA-rated loans to 16.65%
for HR-rated loans. The annualized default rates on originated loans are close to Prosper’s loss estimates,
but somewhat smaller for E- and HR-rated loans (Panel C). Default rates increase monotonically from
1.55% for AA-rated loans to 13.87% for HR-rated loans. Panel D reports realized returns on originated
loans, which range from 4.18% for AA-rated loans to 12.08% for HR-rated loans.
Table 10 also compares returns on loans originated through active and passive institutional pools.
Active institutional investors’ returns average 6.5%, whereas passive institutional investors earn 5.6%.
The outperformance of active loan-picking strategies appears to be increasing with the riskiness of P2P
loans, and is more pronounced in lower-rated loans, such as loans rated D, E, and HR. However, these
univariate comparisons may be affected by the changing composition of the borrower pool. Even if the
allocation of loan applications among these pools is random, the changing relative shares of the pools
may result in differences in averages if the borrower composition changes.
We address this concern using regression analysis, reported in Table 11. While the negative and
significant coefficient for the passive pool dummy in column (1) appears to confirm that passive strategies
earn lower returns, other tests show that this difference disappears once we control for the time variation
in loan quality by including monthly fixed effects. Although Columns (5)–(7) suggest that loan originated
in the passive pool default more often even after controlling for Prosper rating or ELR, we do not find
statistically significant differences in net returns across the two pools (Columns (2)–(4)).25
Thus, while potentially there may be scope for improving over Prosper’s credit evaluation, in practice
the gains to active loan picking in the reintermediated period appear to be modest. On the one hand,
this implies that sophisticated investors who have the ability to perform their own credit analysis may
find it uneconomical to do so, and adopt passive strategies instead. On the other hand, to the extent that
some sophisticated investors (for example, those using LendingRobot for credit advice) remain active,
their presence is unlikely to deter unsophisticated investors from also participating in the market. Thus,
by providing high-quality loan analysis the lending platform can attract a wide range of investors.
25Note, however, that the short history of matured loans after 2013 is a greater statistical problem for distinguishingbetween returns rather than between interest rates or defaults. As defaults are infrequent and especially so for youngerloans, the statistical tests of returns may lack power to capture the differences even if these differences exist and will becomemore pronounced as loans mature.
28

6. Moral hazard and the 2016 crisis
P2P platforms’ main source of revenue is loan origination and servicing fees, which implies that the plat-
forms have incentives to maximize loan origination volume. Yet in contrast to banks, lending platforms
typically have little or no skin in the game, bearing little of the credit risk of the loans they help originate.
Moreover, because defaults are relatively infrequent and only observed as loans age, the quality of P2P
loans is revealed with a substantial lag, which makes it difficult for investors to detect any deterioration
in loan underwriting standards in a timely manner. Under these conditions, the platforms’ efforts to
boost loan volume may allow risky borrowers to obtain loans at attractive interest rates that may not
fully compensate investors for the risk of default. This moral hazard problem can potentially result in
the market’s breakdown if investors lose trust in the quality of the platforms’ loan evaluation.26
We illustrate this issue with the episode of near-market collapse in the first half of 2016 and subsequent
partial recovery, illustrated in Figure 6. High default rates in 2015 elevated concerns from investors and
rating agencies about the quality of P2P loans. On February 11, 2016, Moody’s placed Citibank’s secu-
ritizations of Prosper loans under review for downgrade and revised up loss expectations for Blackrock’s
securitizations. Upon the announcement, funding rates on Prosper plummeted as institutional investors
refused to fund new loans, and loan volume collapsed. Despite Prosper’s attempt to bring investors back
on board by raising interest rates, loan volume continued to drop until mid-July of 2016, when Moody’s
finally decided against the downgrade. Over the first half of 2016, loan volume on Prosper fell by 83%,
erasing cumulative gains from several years of growth.
In a separate development, a scandal around Lending Club broke out in April 2016. The platform
was accused of violating investor instructions by issuing P2P loans that did not meet buyers’ criteria,
and of poor governance due to undisclosed interest of its CEO in a fund that was buying Lending Club
loans, allegedly to boost demand. The loan volume halved as many investors, including banks and other
26A certain degree of lax screening is optimal in the model of Vallee and Zeng (2018) in the passive-investor (reinterme-diated) equilibrium. Indeed, as long as investors break even, the platform can boost loan origination volume by retainingsome low-quality loans in the pool even if it can costlessly screen them out. However, in contrast to this one-period model,in reality investors interact with the platform repeatedly over time. In repeated games the platform may have incentives toincrease the proportion of bad loans in the mix beyond investors’ break-even constraint, if by doing so it can boost volumesufficiently to outweigh future losses from potential investor retaliation.
29

institutions, put their P2P loan orders on hold or pulled out of the platform.27 Lending Club’s CEO
resigned. Both platforms responded to the crisis by re-evaluating their interest rate policies, tightening
the lending standards, and eventually switching to a different credit model. Meanwhile, having peaked
in mid-2016, default rates started to fall again and loan volume has partially recovered.
Figure 7 plots predicted and realized loan returns by month of origination, as well as the volume of
newly originated loans. Two developments are noteworthy and can shed some light on the precursors of
and lessons from this near-collapse in the P2P loan market. First, the gradual decline in loan returns
documented in Figure 5 was precipitated by the deterioration in the quality of loans made earlier, starting
with those originated right after the creation of the whole loan pool in April 2013. Because the median
loan age at default is 14 months, it took over a year for the declining loan quality to be reflected in lower
returns. All the while, loan volume was growing exponentially even as returns were falling and default
losses mounted. Second, while Prosper’s estimate of lenders’ returns either accurately predicted or was
somewhat below the actual loan performance up until December 2014, afterwards it remained between
6% and 7% until early 2017. The actual loan quality deteriorated over the subsequent two years, with
realized returns falling below 4% for some cohorts. Thus, the platform appears to have underestimated
the riskiness of the newly originated loans during this period. This jeopardized the whole market, as under
the reintermediated structure investors rely on the platform’s loan analysis to break even. Importantly, we
find that the drop in funding during the crisis was fully explained by institutional investors’ withdrawal,
whereas loan originations in the retail pool did not decline.
This evidence can be interpreted as consistent with the tendency towards potential erosion of under-
writing standards stemming from incentives to accelerate the growth in loan originations. At the same
time, the corrective actions taken by the platforms during the crisis and the subsequent market recovery
to date suggest that the moral hazard problem may be effectively checked by institutional investors’
threat to withdraw funding if loan performance falls too much. This is reminiscent of the disciplining role
of depositors in banks, which make these traditional intermediaries subject to bank runs when the trust
in the banking sector is eroded (Diamond and Dybvig (1983)). While the history of observed performance
27It is worth noting that Lending Club’s loan volume dropped later than Prosper’s. This mitigates the concern thatthe decrease in volume originated by the two platforms was caused by some exogenous event affecting the aggregate loandemand, such as an increase in the federal funds rate.
30
in P2P lending markets is too short to ascertain the viability of the current business model, we believe
that this episode illustrates both the potential importance of moral hazard for P2P markets and the
platforms’ capability of adapting in response to investor withdrawal.
7. Concluding remarks
Currently, the P2P lending market in the U.S. is neither peer-to-peer nor, for the most part, a lending
market in the traditional sense. Lending platforms’ software performs all essential functions of traditional
lending officers, including loan evaluation, pricing, screening, and servicing. Even though institutional
investors provide over 90% of financing, most of them choose to remain completely passive. Overall,
investors agree to fund over 98.5% of loans offered to them by the platform at the interest rates it deems
appropriate. It falls to the platform’s software to determine which loan applications should be canceled
due to excessive risks. The market looks much like delegated investment management, where the platform
chooses the investment portfolio, and investors’ decisions are largely limited to whether to participate in
the market or not. This structure is a far cry from the market’s early years, when the lending platforms’
role was to facilitate borrowers’ and lenders’ direct interactions in a decentralized marketplace.
Why did the market become reintermediated, and what are the lessons for our understanding of
the role of the intermediary? We show that loan screening efforts by lenders and the platform are
substitutes, which makes it economical to delegate them to a central intermediary to avoid duplication.
This outsourcing of decision making is facilitated by the absence of private information about P2P
borrowers, which limits the scope for investors’ disagreement regarding which loans should be funded.
In the situation when the loan data are limited to a number of ‘hard’, quantitative variables, loan
evaluation becomes a straightforward exercise in machine learning. By taking the lead in providing high-
quality loan analysis, lending platforms can attract uninformed investors to the market. This also makes
a technological ‘arms race’ unattractive for the sophisticated investors, who respond by becoming passive.
In essence, reintermediation arises as investors’ ability to evaluate loans at low cost falls short of the
platform’s, which has strong incentives to improve in order to boost loan volume. Consistent with the
predictions of Vallee and Zeng (2018), we find that investors’ returns are lower under the reintermediated
model. Nonetheless, the returns compare favorably with those on comparable fixed-income investments
31

during the same period, suggesting that the platforms have been able to pass some of the value they
create on to investors, at least during our benign sample period of low interest rates.
While lending platforms today perform many of the functions of traditional banks, they are different
in a number of other aspects, which some theoretical research has emphasized as central to their role
as intermediaries. In particular, lending platforms do not take deposits or perform liquidity or maturity
transformation, which would make them vulnerable to the threat of a bank run. Given that the platforms
function as delegated loan adjudicators but rarely hold stakes in the loans they originate, what is there to
ensure that high standards in loan evaluation are consistently enforced? The recent market crisis and the
platforms’ response to it suggest that the threat of investors’ withdrawal resulting in a market collapse
may provide sufficient discipline. Whether the prevailing structure of the market is sustainable in the
long term remains an open question.
References
Balyuk, T. 2018. Financial innovation and borrowers: Evidence from peer-to-peer lending. WorkingPaper, Emory University.
Balyuk, T. and S. Davydenko. 2017. Investment returns in peer-to-peer lending. Working Paper,University of Toronto.
Banerjee, P. 2005. Information acquisition under uncertainty in credit markets. Review of FinancialStudies 18:1075–1104.
Bester, H. 1985. Screening vs. rationing in credit markets with imperfect information. American Eco-nomic Review 75:850–855.
Boyd, J. H. and E. Prescott. 1986. Financial intermediary-coalitions, Journal of Economic Theory38:211–232.
Butler, A. W., J. Cornaggia, and U. G. Gurun. 2016. Do local capital market conditions affect consumers’borrowing decisions? Management Science 63:4175–4187.
Carmichael, D. 2017. The winner’s curse in an online lending market. Working Paper, University ofHouston.
Diamond, D. W. 1984. Financial intermediation and delegated monitoring. Review of Economic Studies51:393–414.
Diamond, D. and Ph. Dybvig. 1983. Bank runs, deposit insurance, and liquidity. Journal of PoliticalEconomy 91:401–419.
32

Duarte, J., S. Siegel, and L. Young. 2012. Trust and credit: The role of appearance in peer-to-peerlending. Review of Financial Studies 25:2455–2483.
Economist. 2014. Peer-to-peer lending: Banking without banks. Economist, February 28, 2014.
FED. 2018. Consumer credit – G.19. Board of Governors of the Federal Reserve System. May 7, 2018,retrieved from https://www.federalreserve.gov/releases/g19/current.
French, K. R. 2008. Presidential address: The cost of active investing. Journal of Finance 63:1537–1573.
Genrig, T. 1998. Screening, cross-border banking, and the allocation of credit. Research in Economics52:387–407.
Gorton, G. and A. Winton, 2003, Financial intermediation. In Handbook of the Economics of Finance1:431–552.
Gruber, M. J. 1996. Another puzzle: The growth in actively managed mutual funds. Journal of Finance51:783–810.
Hauswald, R. and R. Marquez. 2003. Information technology and financial services competition. Reviewof Financial Studies 16:921–948.
Hertzberg, A., A. Liberman, and D. Paravisini. 2018. Screening on loan terms: Evidence from maturitychoice in consumer credit. Review of Financial Studies, forthcoming.
Iyer, R., A. Ijaz, K. Erzo, F. P. Luttmer, and K. Shue. 2016. Screening peers softly: Inferring the qualityof small borrowers. Management Science 62:1554–1577.
Jagtiani, J. and C. Lemieux. 2017. Fintech lending: Financial inclusion, risk pricing, and alternativeinformation. Working Paper, Federal Reserve Bank of Philadelphia.
Jaffee, D. M. and T. Russell. 1976. Imperfect information, uncertainty, and credit rationing. QuarterlyJournal of Economics 90:651–666.
Kalbfleisch, J.D., and R.L. Prentice. 2002. The Statistical Analysis of Failure Time Data. 2nd ed. NewYork: Wiley.
Larrimore, L., L. Jiang, J. Larrimore, D. Markowitz, and S. Gorski. 2011. Peer to peer lending: Therelationship between language features, trustworthiness, and persuasion success. Journal of AppliedCommunication Research 39:19–37.
Liskovich, I. and M. Shaton. 2017. Borrowers in search of feedback: Evidence from consumer creditmarkets. Working Paper, University of Texas at Austin.
Michels, J. 2012. Do unverifiable disclosures matter? Evidence from peer-to-peer lending. AccountingReview 87:1385-1413.
Millon, M. H. and A. V. Thakor. 1985. Moral hazard and information sharing: A model of financialinformation gathering agencies. Journal of Finance 40:1403–1422.
Morse, A. 2015. Peer-to-peer crowdfunding: Information and the potential for disruption in consumerlending. Annual Review of Financial Economics 74:463–482.
Ou, S., I. Sumair, Y. Liu, and K. Kanthan. 2017. Annual default study: Corporate default and recoveryrates, 1920-2016. Working Paper, Moody’s Investor Service.
33

Paravisini, D., V. Rappoport, and E. Ravina. 2016. Risk aversion and wealth: Evidence from person-to-person lending portfolios. Management Science 63:279–297.
Petersen, M. A. 2004. Information: Hard and soft. Working Paper, Northwestern University.
Philippon, T. 2015. Has the US finance industry become less efficient? On the Theory and Measurementof Financial Intermediation. American Economic Review, 105:1408–38.
PwC. 2015. Peer pressure: How peer-to-peer lending platforms are transforming the consumer lendingindustry. PricewaterhouseCoopers, February 2015.
Ramakrishnan, R. T. S. and A. V. Thakor. 1984. Information reliability and a theory of financialintermediation. Review of Economic Studies 51:415–432.
Ravina, E. 2013. Love & loans: The effect of beauty and personal characteristics in credit markets.Working Paper, Columbia University.
Stein, J. C. 2002, Information production and capital allocation: Decentralized versus hierarchical firms.Journal of Finance 57:1891–1921.
Stein, R. M. 2002a. Benchmarking default prediction models: Pitfalls and remedies in model validation.Moody’s Corp.
Stiglitz, J. and A. Weiss. 1981. Credit rationing in markets with imperfect information. AmericanEconomic Review 71:393–410.
Vallee, B. and Y. Zeng. 2018. Marketplace lending: A new banking paradigm? Working Paper, HarvardBusiness School.
Wei, Z. and M. Lin. 2016. Market mechanisms in online peer-to-peer lending. Management Science63:4236–4257.
Williamson, S. D. 1986. Costly monitoring, financial intermediation, and equilibrium credit rationing.Journal of Monetary Economics 18:159–179.
Yoshida, G. 2016. Why banks and marketplace platforms are the perfect match. Prosper Blog, October30, 2016.
Zhang, J. and P. Liu. 2012. Rational herding in microloan markets. Management Science 58:892–912.
Appendix A:. Return calculations
Estimating returns on P2P loans is challenging, as the absence of a well-functioning secondary marketfor outstanding loans implies that market prices cannot be used to benchmark loan performance on anongoing basis. This problem is compounded by the fact that due to the explosive growth of the market,at the time of the study a large proportion of loans has not yet matured. As a result, in order to evaluateloan returns to date it is necessary to estimate the market value of outstanding loans.
Another important issue concerns reinvestment of interim cash flows. Because P2P loans are fullyamortizing, their duration is short relative to original maturity, and loan performance metrics are sensitiveto assumptions regarding the rate of return on cash flows received in early periods. Our base caseassumption is that interim loan payments are reinvested in similar loans belonging to the same cohort.
34

Thus, when reporting returns on a portfolio of loans with certain characteristics (e.g., with a certainrating), we assume that each loan’s cash flows are reinvested in the average loan from the same portfoliooriginated in the same month as the loan in question. This assumption results in a relatively simpleestimation procedure, but it can be unrealistic if there is no market for portfolio loans already outstanding.For this reason, we later also calculate realized returns under the more realistic assumption of reinvestmentin new loans that are originated at the time when each cash flow is received.
A.1. Assumptions and notation
We use the letter t to denote calendar time and τ to refer to the age of the loan, i.e., the number ofmonths since loan origination. For a loan originated in calendar month t0, the age at time t equals simplyτ = t− t0. We refer to all loans originated in month t0 as the t0-cohort.
When calculating returns for portfolio of loans, we assume that loan proceeds are reinvested at theaverage return on all portfolio loans from the same cohort with the same maturity. We refer to such agroup of loans as a ‘batch’. For instance, when computing returns by rating, a reinvestment batch for anA-rated loan with 36 month to maturity issued in January 2014 would comprise other 36-month A-ratedloans originated in the same month.
Denote by P and T a loan’s principal amount and its initial time to maturity in months. Let N bethe size of the batch the loan belongs to, with the batch loans indexed by i : 1 ≤ i ≤ N . We will usethe bar over a variable to denote its average value across all loans in the batch. Let R be the expectedmonthly return on the loan, and Rτ the realized return in month τ ; the batch averages for these variables
are R and¯Rτ .
Denote by τd the age at which the loan is observed to default, with τd = T + 1 if the loan neverdefaults. We say that a loan survives through month τ if τ < τd, i.e., the loan does not default on atleast the first τ payments. The probability of surviving for at least τ months is referred to as the survivalfunction and denoted Sτ .
P2P loans are fully amortized, so that in the absence of fees investors would be promised equal monthlypayments over the life of the loan. However, the platform’s servicing fee can result in payments beingdifferent in different months. For instance, Prosper charges a fee that is a proportion of the outstandingprincipal each month. Because the latter declines over the life of the loan, so does the fee withheldfrom each monthly payment. As a result, net loan payments to investors increase over time. We denotethe required payment on the loan τ months from origination as Cτ . We also assume that if the loandefaults in month τd, investors’ expected recovery payment discounted to time τd is ρτ . Evaluated atloan origination, the expected cash flow at age τ is given by:
Xτ = SτCτ + (Sτ−1 − Sτ )ρτ . (A1)
We assume that this cash flow is will be reinvested and expected to earn R per month, thus growing toXτ R
T−τ by the time the loan matures.
The actual cash flow received by the investor, Xτ , will be:
Xτ =
Cτ if τ < τd and τ ≤ Tρτ if τ = τd ≤ T0 if τd < τ ≤ or τ = 0,
(A2)
35

where ρτ is the realized recovery payment if the loan defaults at τ . If Xτ > 0 and τ < T , this cash flow is
reinvested and earns the cumulative return equal to¯Rτ+1× ¯
Rτ+2× . . .× ¯RT by the time the loan matures.
While the loan is outstanding, investors receive monthly payments and also hold a claim on futureloan payments, which becomes worthless when the loan defaults. We refer to this claim as the loanbalance, and denote its value at age τ as vτ for τ < τd. As the final piece of notation, the total loan valueat age τ is denoted Vτ . It is equal to the value of the loan balance if the loan is alive (i.e., vτ1τ<τd), plusthe accumulated value of all cash flows received up to τ .
A.2. Expected returns
The expected value of the loan’s cash flows at maturity can be found by growing each expected interimcash flow at rate R through maturity:
E0[VT ] =
T∑τ=1
Xτ RT−τ . (A3)
The cumulative expected return on the loan is defined as RT = E0[VT ]/P . Using Equation (A3) andaveraging over all loans in the batch, the average compound rate of growth satisfies:
RT =1
N
N∑i=1
RTi =1
N
T∑τ=1
RT−τN∑i=1
Xiτ/Pi. (A4)
Thus, the average expected batch return can be found by solving the following equation for R:
1 =T∑τ=1
1N
∑Ni=1Xiτ/Pi
Rτ. (A5)
The numerator in the above equation gives the expected cash flow in month τ for an investor who invests$1, splitting it equally across all loans in the batch. Equation (A5) shows that under our reinvestmentassumption and definition of the expected return, R is the internal rate of return (IRR) on such aninvestment. Once it is found, the individual loan’s expected monthly return can be computed as:
R = (E0[VT ]/P )1/T =
(T∑τ=1
Xτ RT−τ
)1/T
. (A6)
A.3. Realized returns
In order to evaluate the returns on the loan on a monthly basis while the loan is outstanding, one needs tocompute the market value of the loan balance each month, as well as the ongoing returns on the interimcash flows reinvested earlier. In the absence of secondary market prices, given the interest rate on theloan and our model of default risk, the estimates of realized returns will be driven by the observed defaultexperience for the loan and for the batch it belongs to.28
28By fixing risk premia instead of expected returns, our procedure can be easily extended to incorporate the effect ofchanges in the risk-free rate of interest on loan values. We ignore changes in interest rates in order to fully focus on theeffects of credit risk.
36

Our assumption that interim cash flows are reinvested in the average loan in the batch ensures that inany calendar month the average realized rate of return across all batch loans can be found as the averagereturn on loan balances across all batch loans that were alive in the previous month. To estimate thevalue of an outstanding loan in the absence of secondary market loan prices, we assume that if the loan isalive at τ , the value of the loan balance, vτ , can be found by discounting the expected future cash flowsat the ex ante rate R, assuming they will be reinvested at the ex ante batch rate R.
A.3.1. Loan balance returns
If a loan is alive at τ − 1, the conditional probability of survival through month τ equals Sτ/Sτ−1, andthe expected payment then equals Xτ/Sτ−1. The payment is expected to earn R monthly until maturity.Therefore, while the loan is alive the expected values of the loan balance can be computed recursively as:
vτ−1 =Sτvτ +Xτ (R/R)T−τ
Sτ−1R, (A7)
starting with vT = 0.
The actual realized return on the loan balance in month τ , denoted Rτ , will depend on whether theloan defaults in that month. If it does not, the loan balance return will be (vτ + Cτ )/vτ−1, and if itdefaults, the return will be ρτ/vτ−1. Using the notation for the realized cash flow Xτ given by Equation(A2), the return on the loan balance can be written as:
Rτ =Xτ + vτ1τ<τd
vτ−1. (A8)
The average realized rate of return on loan balances for all batch loans at age τ is denoted ¯Rτ andcan be found by averaging the loan balance returns given by Equation (A8) across all batch loans thatwere alive at τ − 1. Under our assumptions, all previously reinvested interim cash flows earn in month τ
the same return ¯Rτ .
A.3.2. Total loan returns
The total value of the loan at age τ is the value of the loan balance (zero if τ ≥ τd), plus the loan paymentreceived in that month, Xτ , plus the reinvested value of payments received in prior months. The priorpayments, whose value at τ − 1 can be found as Vτ−1 − vτ−1, earn in month τ the average batch return,¯Rτ . Thus, the loan value can be computed recursively as:
Vτ = vτ1τ<τd + Xτ + (Vτ−1 − vτ−1) ¯Rτ , (A9)
starting with V0 = v0 = P . The total realized loan return in month τ is then found as:
Rτ = Vτ/Vτ−1. (A10)
The equivalent realized return over the life of the loan is the geometric average of its monthly returns. Itcan also be computed simply as:
R = (VT /P )1/T . (A11)
37

A practical problem for a study of P2P loans is that a large fraction of them have not yet matured atthe time of the study. For such loans we assume that their future performance will be similar to thatobserved to date. Specifically, if τ ′ is the age of the loan at the time of the study, we compute the realizedreturn on the loan as
R = (Vτ ′/P )1/τ′. (A12)
Appendix B:. Implementation
B.1. Default and recovery data
We designate a loan as defaulted if Prosper reports its status as ‘Defaulted’ or ‘Charge-off’ but theloan is not marked as ‘Paid-in-full’ or ‘Settled-in-full’, because investors’ losses on repaid loans are smallor zero, and because we cannot recover the timing of default for such loans. For defaulted loans, weapproximate loan age at default, τd, as one plus the integer part of the sum of principal and interestrepaid divided by the monthly payment, C. Upon default, we calculate the residual cash flow in the lastperiod as the amount withdrawn to cover the interest and principal plus fees attributable to investors,plus proceeds from the sale of the loan or other recovery of principal (if any). This cash flow is receivedwith a substantial delay following default. We assume that the value of the recovery payment at τd, whichwe denote αiCi, can be found by discounting this residual cash flow over 12 months at the rate R. Wethen use the average α across all loans in our calculations of the expected recovery payment, αC. Weapproximate the net interest rate y as the borrower’s rate minus the loan servicing fee. The servicing feeis equal to 1% per annum for loans originated before August 1, 2016, and 1.075% pa for those originatedthereafter.
We disregard any prepayments or late fees paid on nondefaulting loans, because we have no informationon their timing. We assume no prepayments on defaulting loans. Any additional fees, such as the latepayment fee, are infrequent and we do not expect them to affect our calculations significantly.
B.2. Hazard model of default
We model default using tools of survival analysis; see Kalbfleisch and Prentice (2002) for a detailedexposition. Non-parametric examination of the P2P loan data suggests that the hazard rate of defaultis first increasing and then decreasing with loan age. The baseline hazard also appears to depend onloan maturity. To accommodate these features of the data, we estimate the hazard function using thelognormal regression model. Under this parameterization, the loan’s survival function Sτ ≡ S(τ |xi),which gives the probability that the loan survives for at least τ months given the vector of covariates xi,takes the following form:
S(τ |xi) = 1− Φ
{ln τ + (β0 + xiβx)
σ0 + σDDi
}, (B13)
where Di is the dummy variable that equals 1 for 5-year loans, and Φ is the cumulative normal distributionfunction. The parameters β and σ are estimated with maximum likelihood using all loan performancedata in the sample. The full model uses 22 borrower and loan characteristics; the details are availablefrom the authors upon request.
38

REINTERMEDIATIONDISINTERMEDIATION TRANSITION
"Friends a
nd family
" launch
Public lau
nch Reve
al more detai
led borrower d
ata
Partner w
ith W
ebBank
Switc
h from au
ction to
fixed pric
es G
ranular
ELR-base
d pricing
Intro
duce in
stitutio
nal pools
Remove
soft i
nformati
onHist
orical
data no lo
nger u
pdated dail
y
Moody's downgra
de warn
ing
Start
using T
ransU
nion data
Use only Tran
sUnion data
2014
PMI 6(Jan'17 - present)
20182015 2016 2017
PMI 7(Aug'15 - Dec'16)
2006 2007 2008 2009 2010 2011 2012 2013
("quiet period")Prosper 1.0 Shutdown by SEC
(Apr'14 - Jul'15)PMI 5
(Nov'05 - Oct'08) (Jul'09 - Dec'10) (Jan'11 - Dec'12) (Jan'13 - Mar'14) Prosper 2.0 Prosper 3.0 PMI 4
Fig 1. Timeline
This graph shows the evolution of Prosper’s P2P lending platform from its launch on November 1, 2005to present. The timeline highlights three periods in the platform’s evolution (top), significant changes inthe operation of the market (middle), and major credit model changes (bottom).
0%
10%
20%
30%
40%
50%
60%
70%
80%
90%
100%
Passive Institutional Active Institutional Retail Unfunded
Fig 2. Investment pools on Prosper
This graph illustrates the evolution of the three investment pools on Prosper, as well as the proportionof loan applications that failed to attract sufficient funding.
39

670
680
690
700
710
720
730
740
0
0.1
0.2
0.3
0.4
0.5
0.6
0.7
0.8
0.9
1
Jul-0
9
Oct
-09
Jan-
10
Apr-
10
Jul-1
0
Oct
-10
Jan-
11
Apr-
11
Jul-1
1
Oct
-11
Jan-
12
Apr-
12
Jul-1
2
Oct
-12
Jan-
13
Apr-
13
Jul-1
3
Oct
-13
Jan-
14
Apr-
14
Jul-1
4
Oct
-14
Jan-
15
Apr-
15
Jul-1
5
Oct
-15
Jan-
16
Apr-
16
Jul-1
6
Oct
-16
Jan-
17
Apr-
17
Evolution of loan rejection rates
SCOREX score Canceled by platform Unfunded by investors
Fig 3. Evolution of loan screening: platform vs. investors
This graph illustrates the evolution of loan screening and compares loan rejection rates by the P2P lendingplatform to rejection rates by investors (left axis). The average binned SCOREX score is used to proxyfor the quality of the borrower pool (right axis).
0.5
0.55
0.6
0.65
0.7
0.75
0.8
Nov-13 May-14 Nov-14 May-15 Nov-15 May-16 Nov-16 May-17
ELR as default predictor: Area under ROC curve
95% CI ROC area
Fig 4. Quality of Prosper’s credit scoring over time
This graph shows the ability of Prosper’s Estimated Loss Rate (ELR) to discriminate between defaultingand nondefaulting loans. For each month, the area under the ROC (receiver operating characteristic)curve is calculated using all loans originated in the passive investment pool in that month. This numberwould be equal to 1 for a variable that perfectly discriminates between defaulting and nondefaultingloans, with no type-I or type-II errors. Also shown are the linear time trend for the series and the 95%confidence intervals.
40

3%
4%
5%
6%
7%
8%
9%
10%
11%
12%
13%
14%
15%
Jan‐13 Apr‐13 Jul‐13 Oct‐13 Jan‐14 Apr‐14 Jul‐14 Oct‐14 Jan‐15 Apr‐15 Jul‐15 Oct‐15 Jan‐16 Apr‐16 Jul‐16 Oct‐16 Jan‐17 Apr‐17 Jul‐17 Oct‐17
P2P loan returns
Prosper loan returns Prosper default rate High yield bonds
Fig 5. P2P loan returns
This graph shows monthly realized returns and default rates on Prosper loans. The effective yield on theBofA Merrill Lynch US High Yield Index is shown for comparison.
65%
70%
75%
80%
85%
90%
95%
100%
0
100
200
300
400
500
600
700
800
900
1,000
1,100
1,200
1,300
1,400
1,500
Mar‐15 Jun‐15 Sep‐15 Dec‐15 Mar‐16 Jun‐16 Sep‐16 Dec‐16 Mar‐17 Jun‐17
Monthly loan originations and institutional funding
Prosper loans ($M) Lending Club loans ($M) Institutional funds on Prosper
Moo
dy's iss
ues w
arning
Moo
dy's cancels w
arning
Lend
ing Club
scan
dal
Fig 6. Market growth around the 2016 crisis
This graph shows the volume of new loans originated monthly through Prosper and Lending Club (leftaxis), as well as the fraction of originated Prosper loans that were funded through the institutionalinvestor pool (right axis).
41

0
100
200
300
400
500
600
0%
2%
4%
6%
8%
10%
12%
14%
16%
Predicted and realized returns by month of origination
Loans originated ($M) Estimated return Realized return
Fig 7. Predicted and realized returns by month of origination
This graph compares Prosper’s ex ante estimated lenders’ returns with realized loan returns for loansoriginated in different calendar months (left axis). It also shows the monthly value of newly originatedloans (right axis).
42

Table 1Descriptive statistics
This table reports loan and borrower characteristics for loan applications and for originated P2P loans. The sampleis 2007–2018. Loan amount is the loan amount requested by the borrower. Loan maturity is the number of monthsover which the loan amortizes. Interest rate is the interest rate on the loan set by the platform. Estimated Loss Rate(ELR) is the amount of principal that would be lost due to defaults and charge-offs on the loan estimated by Prosper.FICO score is the midpoint value of the FICO credit score, as binned by Prosper. SCOREX score is the midpointvalue of the Scorex Plus credit score binned by Prosper. Rating/grade (1-7) is a proprietary rating developed byProsper/LC allowing to analyze an application’s level of risk that ranges from 1 (rating HR/grade G) to 7 (ratingAA/grade A), 7 having the lowest risk. Employed is an indicator for the borrower being employed at the time ofapplication. Self-employed is an indicator for the borrower being self-employed at the time of application. Yearsemployed is the length of employment with the current employer, measured in years. Delinquent is an indicator ofthe borrower being currently late on any of their accounts, including accounts with charged-off balances. Mortgageis an indicator for the positive balance on real estate trades of the borrower. Monthly income is the borrower’smonthly income. Debt-to-income is the ratio of the monthly debt of the borrower to their stated monthly income.Credit lines is the number of open or closed accounts in the borrower’s name that the borrower is paying on time.Credit cards avl. is the aggregate available credit on all open bankcard trades reported within the last 6 months,measured in thousands. Prior loan is an indicator for the borrower having at least one prior Prosper loan. Realizedreturn is the annual realized return on a loan calculated based the approach in the Appendix. Realized default rateis the annualized probability of loan becoming delinquent, averaged over the life of the loan.
Prosper Marketplace (Prosper) Lending Club (LC)
Applications (N=1,242,278) Matched loans (N=423,065) All loans (N=1,727,272)
mean median sd mean median sd mean median sd
Panel A: Loan characteristics
Loan amount 13,186 12,000 8,017 12,408 10,000 8,257 14,755 12,600 8,857Loan maturity (mos.) 42.99 36 10.90 43.99 36 11.31 42.79 36 10.81Interest rate 15.8% 14.3% 6.8% 15.4% 14.3% 6.3% 13.2% 12.7% 4.7%Estimated Loss Rate 7.05% 6.24% 4.32% 6.75% 6.24% 3.92% N/A N/A N/A
Panel B: Borrower characteristics
FICO score 701.4 689.5 39.1 703.1 689.5 39.5 698.8 689.5 31.4SCOREX score 707.7 712.5 60.5 710.5 712.5 59.2 N/A N/A N/ARating/grade (1-7) 4.41 4 1.55 4.50 4 1.47 5.26 5 1.27Employed 0.81 1 0.40 0.83 1 0.37 0.92 1 0.28Self-employed 0.08 0 0.27 0.06 0 0.24 0.02 0 0.14Years employed 9.08 6.17 11.19 9.18 6.42 11.03 5.97 6.00 3.71Delinquent 0.16 0 0.37 0.15 0 0.36 0.01 0 0.07Mortgage 0.38 0 0.49 0.41 0 0.49 0.49 0 0.50Monthly income 7,108 5,083 187,678 6,368 5,000 83,266 6,447 5,417 9,922Debt-to-income 0.19 0.17 0.10 0.19 0.18 0.10 0.19 0.18 0.12Credit lines 11.04 10 5.29 11.08 10 5.26 11.69 11 5.55Credit card avl. 14.13 7.44 21.31 13.68 7.23 19.21 22.11 15.50 21.94Prior loan 0.15 0 0.36 0.21 0 0.41 N/A N/A N/A
Panel C: Loan performance
Realized return N/A 6.32% 10.5% 18.0% N/ARealized default rate N/A 6.23% 6.04%
43

Table 2Loan funding, screening, and returns
This table summarizes the evolution of loan funding, screening, and returns on Prosper’s lending platform. Thesample is 2007–2018. Annual loan volume is the average annual dollar volume of originated loans in each period,measured in million. Funding rate is the percent of loan applications funded by investors. Cancelation rate isthe percent of loan applications canceled by the platform. SCOREX score is the midpoint value of the ScorexPlus credit score binned by Prosper. Interest rate is the interest rate on the loan set by the platform. EstimatedLoss Rate (ELR) is the amount of principal that would be lost due to defaults and charge-offs on the loanestimated by Prosper. Realized return is the annual realized return on a loan calculated based the approach inthe Appendix. Realized default rate is the annualized probability of loan becoming delinquent, averaged overthe life of the loan.
Disintermediation Transition Reintermediation All periods
(2007–2008) (2009–2010) (2011–2012) (2013–2018) (2007–2018)
Panel A: Loan screening
Annual loan volume ($’mln)* 49.5 39.6 146.6 2,566 1,408Funding rate N/A 24.9% 73.2% 98.5% 95.4%Cancelation rate N/A 5.0% 21.9% 26.9% 25.9%
Panel B: Determinants of loan returns
SCOREX score 714.4 716.4 712.2 707.1 707.1Interest rate 14.2% 20.3% 22.1% 15.3% 15.3%Estimated Loss Rate (ELR) 12.1% 8.4% 9.1% 6.7% 6.7%Realized return 1.7% 14.1% 12.2% 6.0% 6.0%Realized default rate 8.68% 4.75% 5.31% 6.24% 6.23%
* Adjusted for the “quiet period” closure
44

Table 3Historical funding and cancelation rates by Prosper rating
This table reports historical funding, cancelation, and loan origination rates by Prosper rating, a proprietary rating developedby Prosper allowing to analyze a listing’s level of risk that ranges from HR to AA, AA having the lowest risk. The sampleis 2007–2018. Number of applications is the number of loan applications. FICO score is the midpoint value of the FICOcredit score binned by Prosper. SCOREX score is the midpoint value of the Scorex Plus credit score binned by Prosper.Funding rate is the percent of loan applications funded by investors. Cancelation rate is the percent of loan applicationscanceled by the platform. Loan origination rate is the percent of loan applications that result in loan origination.
Rating AA Rating A Rating B Rating C Rating D Rating E Rating HR All
Panel A: Loan applications
Number of applications 107,764 225,620 273,505 309,985 173,168 95,168 57,068 1,242,278(8.7%) (18.2%) (22.0%) (25.0%) (13.9%) (7.7%) (4.6%) (100%)
Interest rate 6.9% 9.6% 12.5% 16.6% 22.3% 27.5% 29.6% 15.8%FICO score 750.8 718.2 703.1 690.5 679.1 669.4 661.8 701.4SCOREX score 766.8 734.8 714.6 695.7 677.9 656.6 665.3 707.7
Panel B: Application status
Funding rate 96.4% 96.4% 97.7% 97.5% 93.8% 95.4% 72.4% 95.4%Cancelation rate 23.1% 26.5% 27.2% 26.8% 26.6% 24.5% 17.2% 25.9%
Funded applications 23.1% 26.6% 27.2% 26.9% 27.3% 24.9% 22.0% 26.3%Unfunded applications 23.1% 24.9% 26.4% 23.4% 14.8% 16.2% 4.7% 16.6%
Loan origination rate 73.9% 70.6% 71.0% 71.1% 67.9% 71.4% 56.4% 70.1%
45

Table 4FICO scores and default rates
This table compares defaults on Prosper loans to defaults on credit card debt and LendingClub loans for different FICO scores. Panel A reports the probability of a consumer loanbecoming delinquent within the first year for credits originated in 2014 and 2015, by FICObucket. Statistics on credit card delinquencies are from Jagtiani and Lemieux (2017). PanelB reports annualized probabilities of a Prosper loan becoming delinquent, averaged over thelife of the loan, for different combinations of FICO scores and Prosper ratings, where Prosperrating is a proprietary rating developed by Prosper allowing to analyze a listing’s level ofrisk that ranges from HR to AA, AA having the lowest risk. Panel C reports annualizedprobabilities of a Lending Club loan becoming delinquent, averaged over the life of the loan,for different combinations of FICO scores and LC grades, where LC grade is a proprietaryrating developed by LC allowing to analyze a listing’s level of risk that ranges from G to A,A having the lowest risk. The sample period is 2013–2017 (reintermediation period).
Panel A: Delinquency rates for credit card debt and P2P loans
781+ 741–780 701–740 681–700 661–680 600–660
Credit card balances* 1.70% 2.56% 3.50% 4.49% 5.20% 9.47%Lending Club loans** 1.96% 2.63% 3.97% 5.70% 6.85% N/AProsper loans** 2.11% 3.17% 5.15% 6.65% 7.13% 8.19%
Panel B: Default rates for Prosper loans by FICO and Prosper rating
All 780+ 760–779 700–739 680–699 660–679 <660
AA 1.59% 0.95% 1.49% 2.02% 2.19% 2.68%A 3.35% 2.52% 2.65% 3.48% 3.93% 3.53% 3.27%B 5.24% 4.30% 4.38% 5.19% 5.86% 5.42% 4.51%C 7.88% 8.13% 6.84% 7.80% 8.54% 7.99% 7.08%D 10.29% 15.02% 10.14% 10.22% 10.85% 10.49% 9.59%E 11.97% 9.26% 13.68% 11.75% 12.38% 12.58% 11.22%
HR 13.95% 12.94% 13.12% 13.89% 14.22%All 6.31% 2.12% 3.52% 5.58% 7.21% 7.86% 8.40%
Panel C: Default rates for Lending Club loans by FICO and LC grade
All 780+ 760–779 700–739 680–699 660–679 <660
A 1.85% 1.01% 1.44% 1.95% 2.37% 2.76% N/AB 3.92% 2.79% 3.07% 3.57% 4.12% 4.45% N/AC 6.47% 5.41% 5.61% 5.65% 6.49% 7.04% N/AD 9.25% 9.77% 9.00% 8.39% 9.01% 9.75% N/AE 11.83% 13.88% 12.79% 10.86% 11.42% 12.35% N/AF 14.61% 20.51% 16.21% 14.32% 14.26% 14.80% N/AG 17.24% 23.05% 17.75% 17.78% 16.85% N/AAll 6.04% 2.04% 2.98% 4.63% 6.44% 7.88% N/A
*We thank Julapa Jagtiani for providing these data. See Jagtiani and Lemieux (2017)**FICO buckets for Prosper and Lending Club loans are the same as in Panel B
46

Table 5Determinants of ELR and predictors of default
This table studies the determinants of the Estimated Loss Rate and their ability to predict default hazard.It also shows additional ELR determinants that are not consistent predictors of default hazard. The sampleperiod is 2013–2017 (reintermediation period) and consists of matched observations. i.e. observations withnon-missing loan outcome data. Estimated Loss Rate (ELR) is the amount of principal that would be lostdue to defaults and charge-offs on the loan estimated by Prosper. Default hazard is the risk of the borrowerdefaulting in each month from loan origination to maturity. Log of income is the natural logarithm of theborrower’s monthly income. Debt-to-income is the ratio of the monthly debt to the borrower’s monthlyincome. Self-employed is an indicator for the self-employed borrower. Credit lines is the number of open orclosed accounts in the borrower’s name that the borrower is paying on time. Credit cards avl. is the aggregateavailable credit on all open bankcard trades reported within the last 6 months, measured in thousands. Activitylast 6 m. is the number of trades opened by the borrower within the last 6 months. Delinquent trades is theaverage number of times the borrower was 60 days past due (DPD) or worse within the last 12 months.Inquiries last 6 m. is the number of times at least one bank or other business requested the borrower’s creditprofile from a consumer credit rating agency in the last 6 months. Prior loan is an indicator for the borrowerhaving at least one prior Prosper loan. Long-term loan is an indicator of the 60-month loan. SCOREX scoreis the midpoint value of the Scorex Plus credit score binned by Prosper. Mortgage is an indicator for thepositive balance on real estate trades of the borrower. Card utilization is the ratio of credit balances to creditlimits on all bank cards held by the borrower. The estimates of the intercept and fixed effects are omitted forbrevity. Standard errors are clustered at the listing month level. ***, **, and * denote statistical significanceat the 1%, 5%, and 10% levels, respectively. t-statistics are presented in parentheses.
ELR Default hazard Default hazard ELR Default hazard
(1) (2) (3) (4) (5)
ELR 0.084***(38.0)
Log of income -0.080** -0.22*** -0.20*** -0.35*** -0.21***(-2.44) (-15.1) (-13.6) (-11.5) (-15.0)
Debt-to-income 9.25*** 1.85*** 1.04*** 8.53*** 1.86***(55.0) (34.6) (18.5) (51.9) (34.1)
Self-employed 1.42*** 0.41*** 0.30*** 1.46*** 0.41***(24.1) (20.6) (13.8) (25.3) (20.3)
Credit lines -0.055*** -0.0071*** -0.0020 -0.14*** -0.0065**(-17.2) (-4.86) (-1.54) (-24.8) (-2.35)
Credit cards avl. -0.027*** -0.0022*** 0.00034 -0.018*** -0.0024***(-35.8) (-4.53) (0.89) (-25.5) (-4.29)
Activity last 6 m. 0.22*** 0.085*** 0.066*** 0.28*** 0.085***(21.0) (18.8) (14.6) (27.8) (18.3)
Delinquent trades 2.08*** 0.34*** 0.18*** 2.10*** 0.36***(15.8) (5.93) (3.42) (16.8) (6.19)
Inquiries last 6 m. 0.46*** 0.094*** 0.057*** 0.51*** 0.095***(14.8) (17.3) (12.2) (16.5) (17.1)
Prior loan -0.90*** -0.045*** 0.0085 -0.80*** -0.046***(-11.4) (-3.05) (0.63) (-10.6) (-3.10)
Long-term loan 1.76*** 0.39*** 0.26*** 1.75*** 0.40***(47.1) (16.6) (12.1) (45.4) (16.6)
SCOREX score -0.024*** -0.0045*** -0.0026*** -0.022*** -0.0043***(-43.3) (-39.7) (-19.8) (-40.5) (-34.1)
Mortgage 0.32*** -0.066***(14.4) (-5.35)
Card utilization2 1.56*** 0.018(32.8) (0.64)
Credit lines2 0.0031*** 0.000019(15.5) (0.21)
Month FEs YES NO NO YES NONo.obs. 306,175 306,175 306,175 306,175 306,175R2/Log-likelihood 0.436 -147094 -145586 0.452 -147074
47

Table 6ELR vs. FICO as default predictors
This table compares the ability of Prosper’s Estimated Loss Rate to predict defaults on Prosperloans (Panel A) to the predictive ability of the FICO score (Panel B). Panel C provides therespective results for Lending Club, for comparison. The sample period is 2013–2017 (reinter-mediation period). Estimated Loss Rate (ELR) is the amount of principal that would be lostdue to defaults and charge-offs on the loan estimated by Prosper. FICO score is the midpointvalue of the FICO credit score binned by Prosper. Subgrade is a subgrade assigned by LendingClub to a loan listing, where each LC grade, a proprietary rating developed by LC allowingto analyze a listing’s level of risk that ranges from G to A, is divided into 5 subgrades. Thesubgrades are increasing in the expected default risk of the loan and are coded as 1 for A1subgrade, 2 for A2 subgrade, ..., and 35 for G5 subgrade. ROC area is the area under the ROC(receiver operating characteristic) curve calculated annually using all loans originated in thepassive investment pool in that year for Prosper loans and all loans originated in all investmentpools for Lending Club loans. The ROC area is also calculated for the entire sample. Thisnumber would be equal to 1 for a variable that perfectly discriminates between defaulting andnondefaulting loans, with no type-I or type-II errors. 95% CI upper bound is the upper boundof the 95% confidence interval for the ROC area. 95% CI lower bound is the lower bound ofthe 95% confidence interval for the ROC area.
2013 2014 2015 2016 2017 All
Panel A: ELR as default predictor for Prosper loans
ROC area 0.640 0.638 0.658 0.680 0.717 0.65195% CI upper bound 0.675 0.645 0.662 0.687 0.726 0.65595% CI lower bound 0.604 0.631 0.653 0.673 0.707 0.648
No.obs. 1,831 44,435 81,465 56,341 88,270 203,939
Panel B: FICO score as default predictor for Prosper loans
ROC area 0.578 0.566 0.591 0.615 0.610 0.59695% CI upper bound 0.614 0.573 0.596 0.622 0.627 0.59995% CI lower bound 0.543 0.559 0.586 0.608 0.594 0.592
No.obs. 1,831 44,435 81,465 56,328 19,889 203,948
Panel C: Subgrade as default predictor for Lending Club loans
ROC area 0.668 0.670 0.686 0.689 0.708 0.68695% CI upper bound 0.672 0.673 0.688 0.692 0.713 0.68895% CI lower bound 0.664 0.667 0.684 0.687 0.703 0.685
No.obs. 134,814 235,629 421,095 434,407 405,425 1,631,370
48

Table 7Loan screening by the platform and investor funding
This table examines the determinants of loan cancellations and contrasts them against the funding decisions ofinvestors. The sample period is 2013–2017 (reintermediation period). Canceled is an indicator for the loan beingcanceled by the platform. Funded is an indicator for the loan being funded by investors. Log of income is the naturallogarithm of the borrower’s monthly income. Debt-to-income is the ratio of the monthly debt to the borrower’smonthly income. Self-employed is an indicator for the self-employed borrower. Credit lines is the number of openor closed accounts in the borrower’s name that the borrower is paying on time. Credit cards avl. is the aggregateavailable credit on all open bankcard trades reported within the last 6 months, measured in thousands. Activity last6 m. is the number of trades opened by the borrower within the last 6 months. Delinquent trades is the averagenumber of times the borrower was 60 days past due (DPD) or worse within the last 12 months. Inquiries last 6 m. isthe number of times at least one bank or other business requested the borrower’s credit profile from a consumer creditrating agency in the last 6 months. Prior loan is an indicator for the borrower having at least one prior Prosper loan.Long-term loan is an indicator of the 60-month loan. Mortgage is an indicator for the positive balance on real estatetrades of the borrower. Credit history is an indicator of the length of the borrower’s credit history being 6 years ofmore. FICO score is the midpoint value of the FICO credit score binned by Prosper. The estimates of the interceptand fixed effects are omitted for brevity. Standard errors are clustered at the listing month level. ***, **, and *denote statistical significance at the 1%, 5%, and 10% levels, respectively. t-statistics are presented in parentheses.
Canceled Funded
(1) (2) (3) (4) (5) (6)
Log of income -0.0077* -0.0078* -0.0081* 0.00070 0.00073 0.00064(-1.72) (-1.75) (-1.87) (0.66) (0.68) (0.61)
Debt-to-income -0.28*** -0.29*** -0.39*** 0.014*** 0.017*** 0.0055**(-24.9) (-25.2) (-31.5) (4.51) (4.95) (2.16)
Self-employed -0.037*** -0.037*** -0.051*** 0.0027*** 0.0027*** 0.00085(-4.94) (-4.94) (-7.00) (4.50) (4.39) (1.16)
Credit lines 0.00086*** 0.0010*** 0.0016*** -8.2e-06 -0.000072* -7.8e-06(5.32) (6.82) (9.75) (-0.21) (-1.90) (-0.21)
Credit cards avl. 0.0014*** 0.0012*** 0.0013*** -0.00015*** -0.000058*** -0.000042***(18.3) (21.9) (25.5) (-5.23) (-3.67) (-3.02)
Activity last 6 m. -0.0056*** -0.0050*** -0.0065*** 0.000085 -0.00015 -0.00031**(-11.9) (-11.5) (-15.7) (0.52) (-0.98) (-2.16)
Delinquent trades 0.049*** 0.058*** 0.052*** 0.0034** -0.00014 -0.00067(8.18) (9.59) (8.58) (2.24) (-0.097) (-0.45)
Inquiries last 6 m. 0.020*** 0.020*** 0.015*** -0.0014*** -0.0016*** -0.0022***(23.4) (23.8) (20.2) (-3.13) (-3.51) (-4.76)
Prior loan -0.18*** -0.18*** -0.17*** 0.0074*** 0.0081*** 0.0091***(-22.2) (-22.0) (-22.1) (7.50) (7.75) (7.46)
Long-term loan 0.0054** 0.0046** -0.021*** -0.0025** -0.0022* -0.0059***(2.61) (2.19) (-9.09) (-2.18) (-1.89) (-4.86)
Mortgage -0.050*** -0.053*** -0.052*** 0.0020*** 0.0033*** 0.0034***(-30.8) (-38.0) (-38.2) (3.62) (5.34) (5.34)
Credit history -0.047*** -0.046*** -0.037*** 0.0018** 0.0014 0.0023***(-15.8) (-15.6) (-12.6) (2.21) (1.59) (2.88)
FICO score 0.00026*** 0.00071*** -0.00010*** -0.000053***(6.17) (19.4) (-5.39) (-4.95)
ELR FEs NO NO YES NO NO YESMonth FEs YES YES YES YES YES YESNo.obs. 887,595 887,591 887,590 887,595 887,591 887,590R2 0.019 0.019 0.020 0.037 0.038 0.041
49

Table 8Resubmitted applications and default risk
This table studies default risk of borrowers whose applications werecanceled, resubmitted, re-evaluated by the platform, and subsequentlyfunded by investors. The sample period is 2013–2017 (reintermediationperiod). Default hazard is the risk of the borrower defaulting in eachmonth from loan origination to maturity. Resubmitted is an indicatorfor an application resubmitted after loan cancellation. Log of incomeis the natural logarithms of the borrower’s monthly income. Debt-to-income is the ratio of the monthly debt of the borrower to theirstated monthly income. Employed is an indicator for the borrowerbeing employed at the time of application. Self-employed is an indicatorfor the borrower being self-employed at the time of application. Long-term loan is an indicator of the 60-month loan. The estimates of theintercept and fixed effects are omitted for brevity. Estimated Loss Rate(ELR) is the amount of principal that would be lost due to defaultsand charge-offs on the loan estimated by Prosper. Old ELR refers tothe ELR on the canceled loan application. New ELR refers to the ELRon the resubmitted loan application. Standard errors are clustered atthe listing month level. ***, **, and * denote statistical significance atthe 1%, 5%, and 10% levels, respectively. t-statistics are presented inparentheses.
Default hazard
(1) (2) (3) (4)
Resubmitted 0.31*** 0.27*** 0.20*** 0.16***(24.9) (21.3) (15.9) (13.0)
Log of income -0.17*** -0.17***(-12.3) (-12.4)
Debt-to-income 0.67*** 0.63***(12.8) (12.0)
Employed -0.21*** -0.21***(-14.6) (-14.5)
Self-employed 0.063** 0.048*(2.55) (1.93)
Long-term loan 0.15*** 0.14***(6.69) (6.63)
Old ELR FEs YES YES NO NONew ELR FEs NO NO YES YES
Month FEs NO NO NO NONo.obs. 376,489 299,435 376,489 299,435Log-likelihood -149487 -142216 -149485 -142249
50
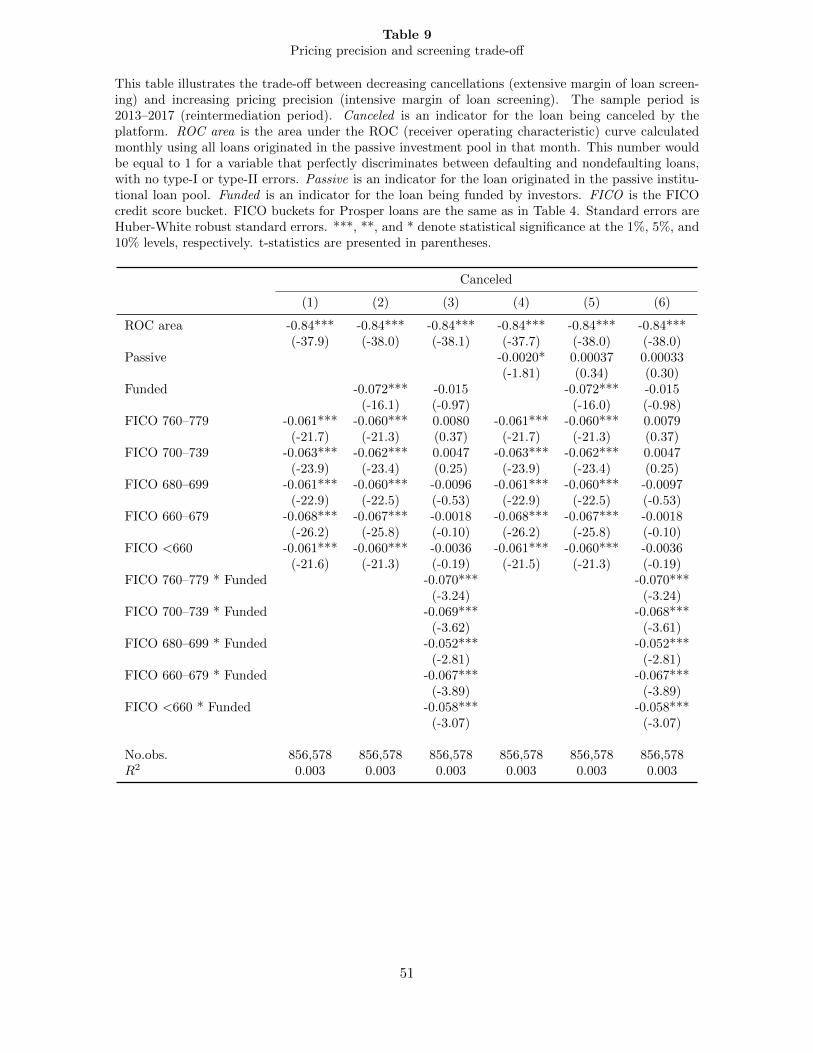
Table 9Pricing precision and screening trade-off
This table illustrates the trade-off between decreasing cancellations (extensive margin of loan screen-ing) and increasing pricing precision (intensive margin of loan screening). The sample period is2013–2017 (reintermediation period). Canceled is an indicator for the loan being canceled by theplatform. ROC area is the area under the ROC (receiver operating characteristic) curve calculatedmonthly using all loans originated in the passive investment pool in that month. This number wouldbe equal to 1 for a variable that perfectly discriminates between defaulting and nondefaulting loans,with no type-I or type-II errors. Passive is an indicator for the loan originated in the passive institu-tional loan pool. Funded is an indicator for the loan being funded by investors. FICO is the FICOcredit score bucket. FICO buckets for Prosper loans are the same as in Table 4. Standard errors areHuber-White robust standard errors. ***, **, and * denote statistical significance at the 1%, 5%, and10% levels, respectively. t-statistics are presented in parentheses.
Canceled
(1) (2) (3) (4) (5) (6)
ROC area -0.84*** -0.84*** -0.84*** -0.84*** -0.84*** -0.84***(-37.9) (-38.0) (-38.1) (-37.7) (-38.0) (-38.0)
Passive -0.0020* 0.00037 0.00033(-1.81) (0.34) (0.30)
Funded -0.072*** -0.015 -0.072*** -0.015(-16.1) (-0.97) (-16.0) (-0.98)
FICO 760–779 -0.061*** -0.060*** 0.0080 -0.061*** -0.060*** 0.0079(-21.7) (-21.3) (0.37) (-21.7) (-21.3) (0.37)
FICO 700–739 -0.063*** -0.062*** 0.0047 -0.063*** -0.062*** 0.0047(-23.9) (-23.4) (0.25) (-23.9) (-23.4) (0.25)
FICO 680–699 -0.061*** -0.060*** -0.0096 -0.061*** -0.060*** -0.0097(-22.9) (-22.5) (-0.53) (-22.9) (-22.5) (-0.53)
FICO 660–679 -0.068*** -0.067*** -0.0018 -0.068*** -0.067*** -0.0018(-26.2) (-25.8) (-0.10) (-26.2) (-25.8) (-0.10)
FICO <660 -0.061*** -0.060*** -0.0036 -0.061*** -0.060*** -0.0036(-21.6) (-21.3) (-0.19) (-21.5) (-21.3) (-0.19)
FICO 760–779 * Funded -0.070*** -0.070***(-3.24) (-3.24)
FICO 700–739 * Funded -0.069*** -0.068***(-3.62) (-3.61)
FICO 680–699 * Funded -0.052*** -0.052***(-2.81) (-2.81)
FICO 660–679 * Funded -0.067*** -0.067***(-3.89) (-3.89)
FICO <660 * Funded -0.058*** -0.058***(-3.07) (-3.07)
No.obs. 856,578 856,578 856,578 856,578 856,578 856,578R2 0.003 0.003 0.003 0.003 0.003 0.003
51
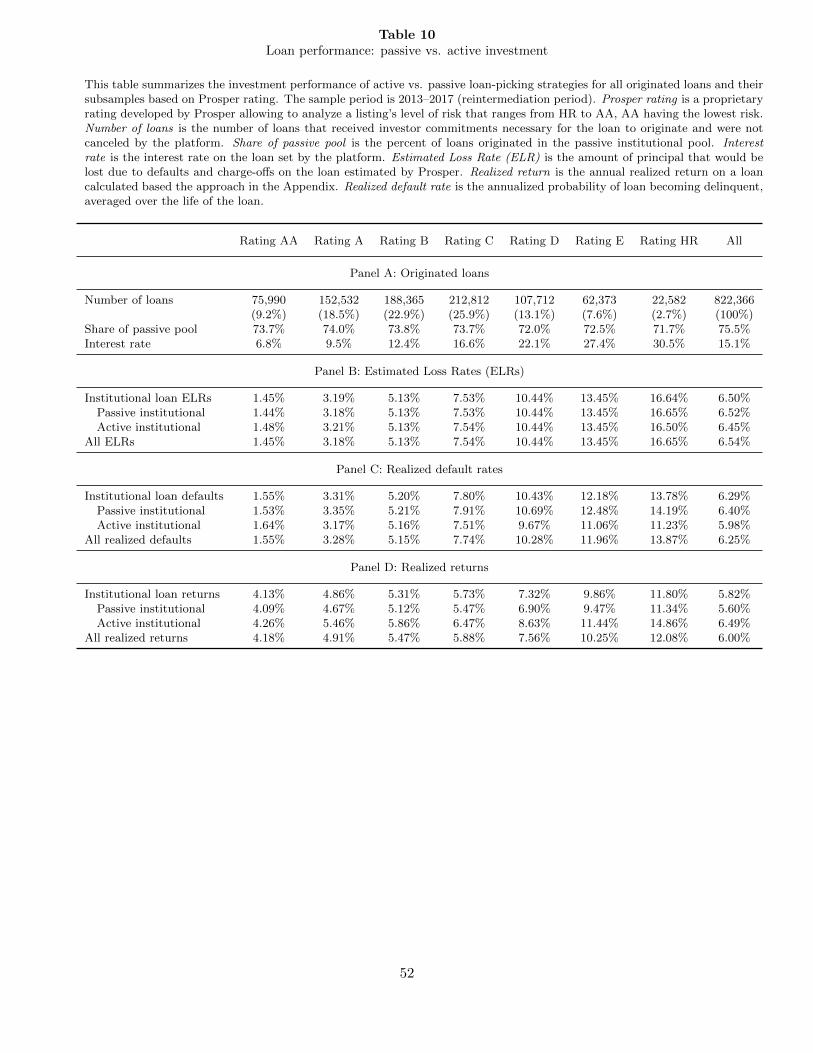
Table 10Loan performance: passive vs. active investment
This table summarizes the investment performance of active vs. passive loan-picking strategies for all originated loans and theirsubsamples based on Prosper rating. The sample period is 2013–2017 (reintermediation period). Prosper rating is a proprietaryrating developed by Prosper allowing to analyze a listing’s level of risk that ranges from HR to AA, AA having the lowest risk.Number of loans is the number of loans that received investor commitments necessary for the loan to originate and were notcanceled by the platform. Share of passive pool is the percent of loans originated in the passive institutional pool. Interestrate is the interest rate on the loan set by the platform. Estimated Loss Rate (ELR) is the amount of principal that would belost due to defaults and charge-offs on the loan estimated by Prosper. Realized return is the annual realized return on a loancalculated based the approach in the Appendix. Realized default rate is the annualized probability of loan becoming delinquent,averaged over the life of the loan.
Rating AA Rating A Rating B Rating C Rating D Rating E Rating HR All
Panel A: Originated loans
Number of loans 75,990 152,532 188,365 212,812 107,712 62,373 22,582 822,366(9.2%) (18.5%) (22.9%) (25.9%) (13.1%) (7.6%) (2.7%) (100%)
Share of passive pool 73.7% 74.0% 73.8% 73.7% 72.0% 72.5% 71.7% 75.5%Interest rate 6.8% 9.5% 12.4% 16.6% 22.1% 27.4% 30.5% 15.1%
Panel B: Estimated Loss Rates (ELRs)
Institutional loan ELRs 1.45% 3.19% 5.13% 7.53% 10.44% 13.45% 16.64% 6.50%Passive institutional 1.44% 3.18% 5.13% 7.53% 10.44% 13.45% 16.65% 6.52%Active institutional 1.48% 3.21% 5.13% 7.54% 10.44% 13.45% 16.50% 6.45%
All ELRs 1.45% 3.18% 5.13% 7.54% 10.44% 13.45% 16.65% 6.54%
Panel C: Realized default rates
Institutional loan defaults 1.55% 3.31% 5.20% 7.80% 10.43% 12.18% 13.78% 6.29%Passive institutional 1.53% 3.35% 5.21% 7.91% 10.69% 12.48% 14.19% 6.40%Active institutional 1.64% 3.17% 5.16% 7.51% 9.67% 11.06% 11.23% 5.98%
All realized defaults 1.55% 3.28% 5.15% 7.74% 10.28% 11.96% 13.87% 6.25%
Panel D: Realized returns
Institutional loan returns 4.13% 4.86% 5.31% 5.73% 7.32% 9.86% 11.80% 5.82%Passive institutional 4.09% 4.67% 5.12% 5.47% 6.90% 9.47% 11.34% 5.60%Active institutional 4.26% 5.46% 5.86% 6.47% 8.63% 11.44% 14.86% 6.49%
All realized returns 4.18% 4.91% 5.47% 5.88% 7.56% 10.25% 12.08% 6.00%
52

Table 11Loan returns and risk by investment strategy
This table tests whether realized returns and default hazard are different between the passive and activeinstitutional pools. The sample consists of all loans originated in the institutional loan pools in 2013–2017(reintermediation period). Realized return is the annual realized return on a loan calculated based theapproach in the Appendix. Default hazard is the risk of the borrower defaulting in each month from loanorigination to maturity. Passive is an indicator for the loan originated in the passive institutional loanpool. Prosper rating is a proprietary rating developed by Prosper allowing to analyze a listing’s level ofrisk that ranges from HR to AA, AA having the lowest risk. Estimated Loss Rate (ELR) is the amount ofprincipal that would be lost due to defaults and charge-offs on the loan estimated by Prosper. Standarderrors are clustered at the listing month level. ***, **, and * denote statistical significance at the 1%,5%, and 10% levels, respectively. t-statistics are presented in parentheses.
Realized return Default hazard
(1) (2) (3) (4) (5) (6) (7)
Passive -0.0091*** -0.00084 -0.0012 -0.0011 0.083*** 0.071*** 0.072***(-2.92) (-0.96) (-1.37) (-1.31) (4.01) (3.43) (3.49)
Rating = A 0.0022** 0.54***(2.13) (16.6)
Rating = B 0.0027* 0.94***(1.69) (28.4)
Rating = C 0.0035 1.32***(1.18) (37.8)
Rating = D 0.012** 1.61***(2.40) (44.2)
Rating = E 0.024*** 1.79***(4.13) (50.6)
Rating = HR 0.032*** 1.89***(3.70) (35.4)
ELR FEs NO NO NO YES NO NO YESMonth FEs NO YES YES YES NO NO NONo.obs. 268,995 268,994 268,994 268,994 342,927 342,927 342,927R2/Log-likelihood 0.00046 0.013 0.014 0.014 -140037 -134687 -134374
53