reinforcing the 68-95-99.7 rule
DESCRIPTION
Reinforcing the 68-95-99.7 Rule. Process. Survey data on 391 students Used the Verbal SAT scores Processed the information using MiniTab 15…. Results. Mean: 591.84 Standard Deviation: 73.24. Verbal Z-scores. Took Verbal SAT scores column (Verbal SAT - mean) / s.d. - PowerPoint PPT PresentationTRANSCRIPT


ProcessProcess
• Survey data on 391 students• Used the Verbal SAT scores• Processed the information using
MiniTab 15…
• Survey data on 391 students• Used the Verbal SAT scores• Processed the information using
MiniTab 15…

ResultsResults
• Mean: 591.84• Standard Deviation: 73.24
• Mean: 591.84• Standard Deviation: 73.24

Verbal Z-scoresVerbal Z-scores
• Took Verbal SAT scores column• (Verbal SAT - mean) / s.d.• …created VerbalZ column
• Took Verbal SAT scores column• (Verbal SAT - mean) / s.d.• …created VerbalZ column
-Created histograms comparing the two


Histogram of Verbal SAT scores
Histogram of Verbal SAT scores
• Shows fairly normal shape• Now, compare it to the
histogram displaying the VerbalZ scores…• Will it be the same shape?• Any differences?
• Shows fairly normal shape• Now, compare it to the
histogram displaying the VerbalZ scores…• Will it be the same shape?• Any differences?


What if we superimposed the
VerbalZ histogram over the Verbal histogram?
What if we superimposed the
VerbalZ histogram over the Verbal histogram?


• Note the discrepancy between the two near the mean…
• “The discrepancy has to do with the choices MiniTab makes about what interval midpoints to use” - Prof. Pfenning
• Note the discrepancy between the two near the mean…
• “The discrepancy has to do with the choices MiniTab makes about what interval midpoints to use” - Prof. Pfenning

CountCount• <-3 =2/391• (-3,-2) =5/391• (-2,-1) =47/391• (-1, 0) =146/391• (0,1) =130/391• (1,2) =49/391• (2,3) =12/391• >3 =0/391
• <-3 =2/391• (-3,-2) =5/391• (-2,-1) =47/391• (-1, 0) =146/391• (0,1) =130/391• (1,2) =49/391• (2,3) =12/391• >3 =0/391

Proportion of Standardized Values
Proportion of Standardized Values
• -3 to +3 = .995
• -2 to +2 = .951
• -1 to +1 = .706
• -3 to +3 = .995
• -2 to +2 = .951
• -1 to +1 = .706

Observed vs. ExpectedObserved vs. Expected• -3 to +3 = .995 vs .997
• -2 to +2 = .951 vs .95
• -1 to +1 = .706 vs .68
• So… it appears to be fairly normal
• -3 to +3 = .995 vs .997
• -2 to +2 = .951 vs .95
• -1 to +1 = .706 vs .68
• So… it appears to be fairly normal
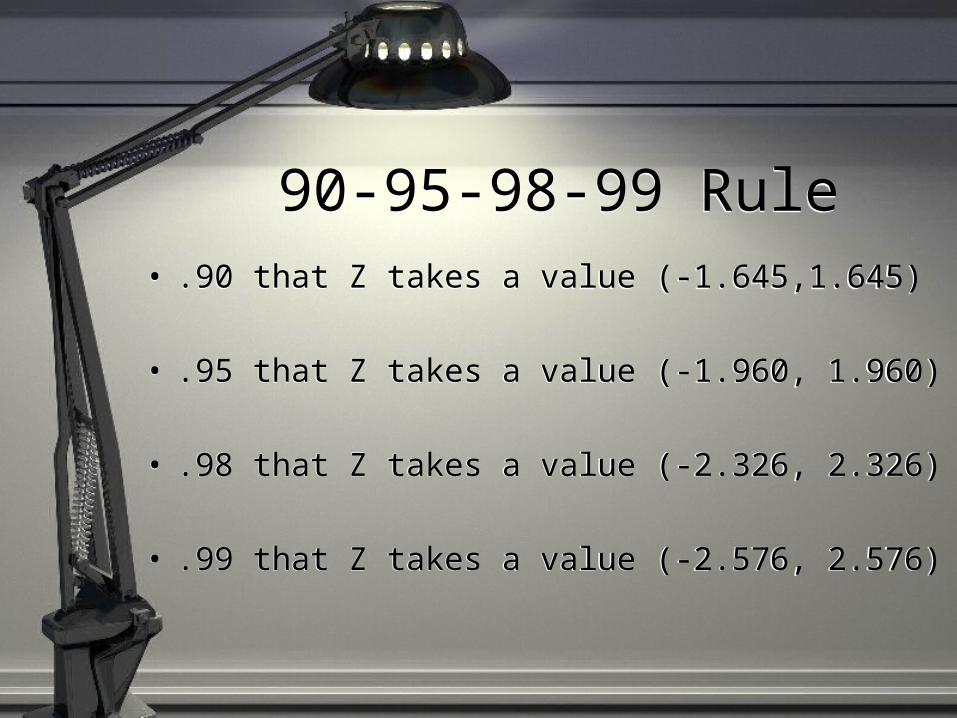
90-95-98-99 Rule90-95-98-99 Rule• .90 that Z takes a value (-1.645,1.645)
• .95 that Z takes a value (-1.960, 1.960)
• .98 that Z takes a value (-2.326, 2.326)
• .99 that Z takes a value (-2.576, 2.576)
• .90 that Z takes a value (-1.645,1.645)
• .95 that Z takes a value (-1.960, 1.960)
• .98 that Z takes a value (-2.326, 2.326)
• .99 that Z takes a value (-2.576, 2.576)

Results for Verbal SATsResults for Verbal SATs• .910 that Z takes a value (-1.645, 1.645)
• .969 that Z takes a value (-2.326, 2.326)
• .979 that Z takes a value (-2.576, 2.576)
• .910 that Z takes a value (-1.645, 1.645)
• .969 that Z takes a value (-2.326, 2.326)
• .979 that Z takes a value (-2.576, 2.576)
- How well does this conform to a perfect curve?