rehva private area contact us search heating ... - …seedengr.com/documents/protected zone...
TRANSCRIPT

10/13/2014 Protected zone ventilation reduces personal exposure to indoor pollution (full lenght): REHVA
http://www.rehva.eu/publications-and-resources/hvac-journal/2014/042014/protected-zone-ventilation-reduces-personal-exposure-to-indoor-pollution-full-lenght/ 1/17
Publications &Resources
Guidebooks Shop
HVAC Journal
2014
2013
2012
2011
Journalinformation
e-Newsletter
MENU
REHVAFederation of EuropeanHeating,
Ventilation and Air ConditioningAssociations
Search
Private area Contact us
/ Publications & Resources / HVAC Journal / 2014 / 04/2014 / Protected zone ventilation
reduces personal exposure to indoor pollution (full lenght)
Protected zone ventilationreducing personal exposure toindoor pollution (Full article)Abstract:The objective of this study is to exam the performance of protected zone ventilation(PZV), which is known as protected zone ventilation (POV) as well, regardingprotection of occupants from exposure to various indoor pollutants. Both gaseousand particulate pollutants were used to test the capacity of PZV to reduce thepersonal exposure to various indoor pollutant sources. Two breathing thermalmanikins and a cough generator were used in this study to produce exhaled airflowand cough jets, which simulated different indoor pollutant source. PZV is able to

10/13/2014 Protected zone ventilation reduces personal exposure to indoor pollution (full lenght): REHVA
http://www.rehva.eu/publications-and-resources/hvac-journal/2014/042014/protected-zone-ventilation-reduces-personal-exposure-to-indoor-pollution-full-lenght/ 2/17
HVAC Dictionary
How ToTranslate
F.A.Q. byTranslators
News
About TheDictionary
HVAC Terminology
Event presentations
EUSEW 2014 report
Buildingsenergy efficiency
Product energyefficiency
Heating andcooling
Electricity grids
Supporter Bulletin
Downloads
and cough jets, which simulated different indoor pollutant source. PZV is able toseparate an indoor space into a source zone and a target zone with differentpollutant concentration. The direct exposure of target manikin to breathing airflowand a cough is significantly reduced by using PZV with higher supply air velocity.The results may be used to make a guideline to design an efficient PZV system fordifferent industry and engineering applications.
Guangyu CaoVTT Technical ResearchCentre of Finland,[email protected]
Kai SirenAalto University, [email protected]
Peter V. NielsenAalborg University,[email protected]
Atila NovoselacUniversity of Texas atAustin, [email protected]
Keywords: ventilation, protected zone ventilation, air jets, cross contamination, protective ventilation, aircurtain
IntroductionAirflow distribution plays an important role in the indoor environment, where people spendover 90% of their time. Nowadays global epidemic respiratory diseases break out moreoften than ever, for example tuberculosis (TB) (1990), SARS (2003) and H1N1 (2009),which took place in many countries (WHO website and the CDC website). In some specialapplication, the indoor air change rate can be as high as 12-42 ACH. However, recentstudies show that mixing ventilation alone is not able to reduce substantially the exposureto indoor pollutant (Melikov et al. 2011, Mazumdar and Chen, 2009). Regarding theexposure to exhaled airflow, the exposure risk can be as high as 20 times by using MVthan other ventilation method (Olmedo, 2012; Nielsen, 2014). However, it is verychallenge for these methods to deal with both gaseous and particulate pollutants. Amongst some commonly used ventilation systems, the protected occupied zone

10/13/2014 Protected zone ventilation reduces personal exposure to indoor pollution (full lenght): REHVA
http://www.rehva.eu/publications-and-resources/hvac-journal/2014/042014/protected-zone-ventilation-reduces-personal-exposure-to-indoor-pollution-full-lenght/ 3/17
Guidebooks
REHVA Journal
HVAC Dictionary
Subscribe
Brochures
Downloadableforms
Technicaldocuments
Presentations
Position papers
Newsletter
Amongst some commonly used ventilation systems, the protected occupied zoneventilation (POV) was developed to reduce the personal exposure to indoor pollutant (Caoet al. 2011). POV has similar form as an ‘air curtain’, which may be used to prevent thetransfer of heat from indoor to outdoor via door way (Sirén, 2003). Pollutants source willbe located in the source zone, and even a sick person can be a pollutant source whilebreathing and coughing. By using CO2 as indoor pollutant source, the protectionefficiency of POV varies from 8% to 50% depending on the exhaust location, supply airvelocity and the usage of partitions (Cao et al. 2013). A push-pull ventilation system wasproved to be an efficient way to control contaminant and protect occupants. The term ofprotected zone ventilation (PZV) is similar to POV using downward plane jets to separatean indoor space into a source zone and a target zone, but can be used in some specificconditions.
However, little studies have discovered how different airflow distribution will affect indoorair quality with regards to the transport of gaseous and aerosols particles from the sourcezone and the target zone. The objective of study is to find out the performance ofPZV/POV regarding protection of occupants from exposure to indoor pollutants.
Figure 1. Sketch of measurement set-up of POV with the location of exhaust and diffuser(Cao et al. 2013).
Performance of POV to reduce the concentration ofindoor gaseous pollutant in the target zone
MembersAssociation

10/13/2014 Protected zone ventilation reduces personal exposure to indoor pollution (full lenght): REHVA
http://www.rehva.eu/publications-and-resources/hvac-journal/2014/042014/protected-zone-ventilation-reduces-personal-exposure-to-indoor-pollution-full-lenght/ 4/17
Supporters All
indoor gaseous pollutant in the target zoneExperimental setup and measurement conditionsAll measurements were conducted in a full-scale test room for two office workers at AaltoUniversity, Finland. The room has dimensions of (width × length × height) 2.0 m × 4.0 m ×2.65 m. The room was ventilated by a laminar airflow diffuser, as can be seen in Figure 1.Measurement conditions are shown in Table 1.
Table 1. Measurement conditions. (Cao et al. 2013)
Qsu
pply
(l/s)
Average
velocity at
slot (m/s)
Re at
slot
Air
change
rate of
the
room
Qe-left
=Qe-right
(l/s)
CO2
release
(L/min)
Room
temperatu
re (°C)
Supply air
temperatur
e (°C)
Case 1 35±
1.0
1.75±0.05 1167 5.9 17.5±0.5 4.3±0.1 20±1.0 20±0.5
Case 2 30±
1.0
1.50±0.05 1000 5.1 15.0±0.5 4.3±0.1 20±1.0 20±0.5
Case 3 20±
1.0
1.00±0.05 667 3.4 10.0±0.5 4.0±0.1 20±1.0 20±0.5
Case 4 35±
1.0
1.75±0.05 1167 5.9 17.5±0.5 4.3±0.1 20±1.0 20±0.5
Case 5 30±
1.0
1.50±0.05 1000 5.1 15.0±0.5 4.3±0.1 20±1.0 20±0.5
Case 6 20±
1.0
1.00±0.05 667 3.4 10.0±0.5 4.2±0.1 20±1.0 20±0.5
Discover our members
Map of our members across
Europe

10/13/2014 Protected zone ventilation reduces personal exposure to indoor pollution (full lenght): REHVA
http://www.rehva.eu/publications-and-resources/hvac-journal/2014/042014/protected-zone-ventilation-reduces-personal-exposure-to-indoor-pollution-full-lenght/ 5/17
1.0
Case 7 35±
1.0
1.75±0.05 1167 5.9 17.5±0.5 4.3±0.1 20±1.0 20±0.5
Case 8 30±
1.0
1.50±0.05 1000 5.1 15.0±0.5 4.2±0.1 20±1.0 20±0.5
Case 9 20±
1.0
1.00±0.05 667 3.4 10.0±0.5 4.0±0.1 20±1.0 20±0.5
Results and discussionMeasured CO2 concentrationFigure 2 shows the average values of measured CO2 concentration in 6 cases. Resultsshow that the supply air velocity of the plane jet affects the performance of POV. Whensupply air velocity is 1.75 and 1.5 m/s, the plane jet can separate the protected zone fromthe polluted zone at 800 ppm. With a lower supply air velocity, at 1.00 m/s, the plane jetdoes not prevent the transmission of pollutants from the polluted zone to the protectedzone. There is almost no difference between the two zones in Case 3, 6 and 9. whichmeans the pollutant was mixed up in the entire room, which is similar to the performanceof MV.

10/13/2014 Protected zone ventilation reduces personal exposure to indoor pollution (full lenght): REHVA
http://www.rehva.eu/publications-and-resources/hvac-journal/2014/042014/protected-zone-ventilation-reduces-personal-exposure-to-indoor-pollution-full-lenght/ 6/17
a) b)
c) d)
e) f)

10/13/2014 Protected zone ventilation reduces personal exposure to indoor pollution (full lenght): REHVA
http://www.rehva.eu/publications-and-resources/hvac-journal/2014/042014/protected-zone-ventilation-reduces-personal-exposure-to-indoor-pollution-full-lenght/ 7/17
Figure 2. Calculated and measured CO2 concentration: a) Case 1, b) Case 2, c) Case 4,d) Case 5, e) Case 7, f) Case 8 (Cao et al. 2013).
Protection efficiencyTo specify how the protected occupied zone ventilation (POV) protects people fromexposure to indoor pollutants, which may be transferred from the polluted zone to theclean zone, the protection efficiency (PE) is defined here as:
(38)
where c1 is the pollutant concentration in the exhaust in the protected zone, and c2 is thepollutant concentration in the exhaust in the polluted zone.
In MV, a fully mixing condition results in c1=c2 and . In the perfect protected
condition by POV, c1=0 and , which means that in the perfect case no pollutant willbe transferred into the protected zone from the polluted zone. In this case, the POVcompletely separates the space with a plane jet.
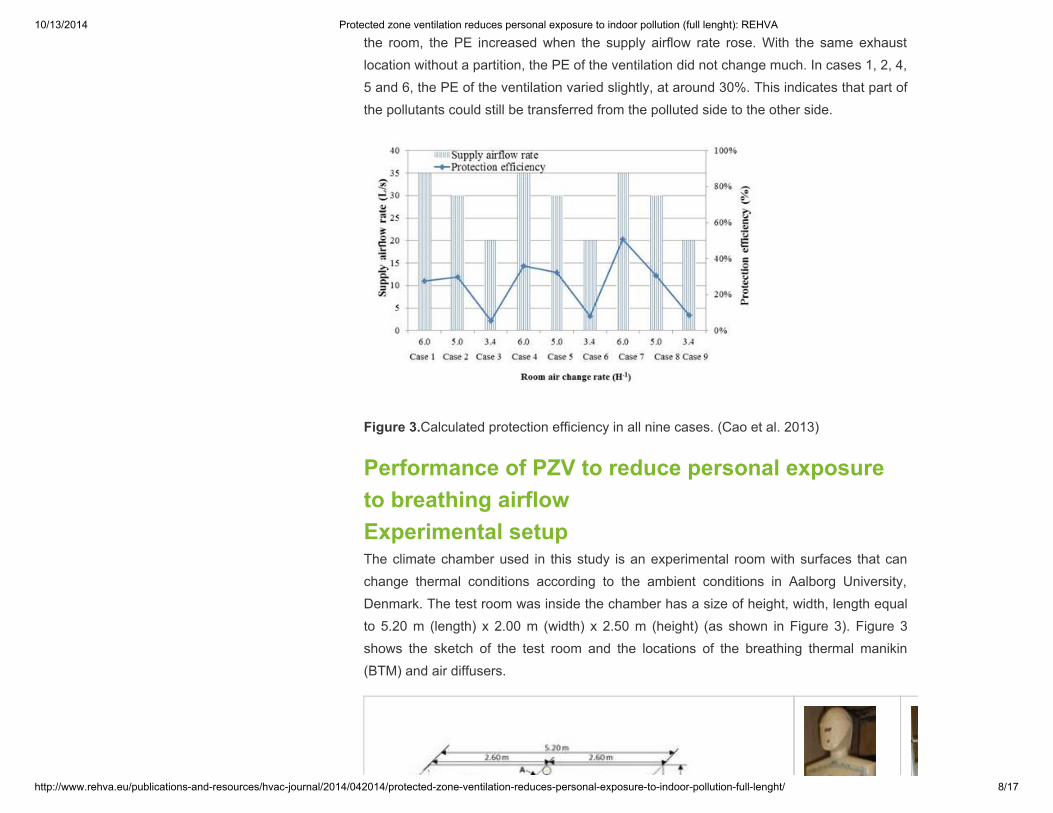
In this section, the protection efficiency (PE) is calculated based on measuredconcentration at the exhaust on each side. Figure 3 shows the PE in all cases against theroom air change rate, using the protected occupied zone ventilation (POV). The measuredPE of the POV depends on the supply airflow rate and the location of the exhaust. Withthe same exhaust location, the PE of the ventilation did not change very much. In cases 1,2, 4 and 5, the PE of the ventilation was about 30%, which was based on the newdefinition of the protection efficiency. This indicates that part of the pollutants could still betransferred from the polluted side to the other side. When the supply airflow rate was 20l/s, which is equal to an ACH value of 3.4, the PE was even lower than 10%. With higherairflow rates, the PE could reach a higher value, even up to 50%. Without the use of apartition in the room, the PE depended less on the supply airflow rate. There was only aslight difference in PE with ACH 5.0 and 6.0. With the use of a partition in the middle ofthe room, the PE increased when the supply airflow rate rose. With the same exhaust
10/13/2014 Protected zone ventilation reduces personal exposure to indoor pollution (full lenght): REHVA
http://www.rehva.eu/publications-and-resources/hvac-journal/2014/042014/protected-zone-ventilation-reduces-personal-exposure-to-indoor-pollution-full-lenght/ 8/17
the room, the PE increased when the supply airflow rate rose. With the same exhaustlocation without a partition, the PE of the ventilation did not change much. In cases 1, 2, 4,5 and 6, the PE of the ventilation varied slightly, at around 30%. This indicates that part ofthe pollutants could still be transferred from the polluted side to the other side.
Figure 3.Calculated protection efficiency in all nine cases. (Cao et al. 2013)
Performance of PZV to reduce personal exposureto breathing airflowExperimental setupThe climate chamber used in this study is an experimental room with surfaces that canchange thermal conditions according to the ambient conditions in Aalborg University,Denmark. The test room was inside the chamber has a size of height, width, length equalto 5.20 m (length) x 2.00 m (width) x 2.50 m (height) (as shown in Figure 3). Figure 3shows the sketch of the test room and the locations of the breathing thermal manikin(BTM) and air diffusers.

10/13/2014 Protected zone ventilation reduces personal exposure to indoor pollution (full lenght): REHVA
http://www.rehva.eu/publications-and-resources/hvac-journal/2014/042014/protected-zone-ventilation-reduces-personal-exposure-to-indoor-pollution-full-lenght/ 9/17
a) b) c)
Figure 4. Sketch of measurement set-up of PZV and photos of BTMs, a) Sketch ofmeasurement set-up, b) source BTM c) target BTM .
Mechanical lungs are connected to the manikin to simulate breathing functions. Thebreathing frequency of the two manikins in the experiments is kept at 16 times/minutes.The manikin simulates a standing person, which has a metabolic rate of 1.2 met. Thevolume of breathing air is kept at 8.8 L/minutes for each manikin.
Visualization of the cross-infection risk betweentwo personsAs the cross-infection risk will be very high when the distance between two manikins getsas close as 0.35 m, this section presents the visualization results of the cross-infectionrisk between two persons with PZV. At a distance of 0.35 m between two manikins, theexposure, cexp/cR, could be as high as 13 by using downward flow ventilation (cexp isthe inhaled concentration of the target person and cR is the concentration in the return ofthe room). Figure 4 shows that when there is no downward plane jet between the twobreathing thermal manikins, the exhaled air from the source manikin can easily approachthe breathing zone of the target manikin. The exhaled airflow bends to the lower part ofthe target manikin, which lowers the risk of the cross infection between source manikinand target manikin. When the supply velocity is increased up to 3.0 m/s, the exhaled

10/13/2014 Protected zone ventilation reduces personal exposure to indoor pollution (full lenght): REHVA
http://www.rehva.eu/publications-and-resources/hvac-journal/2014/042014/protected-zone-ventilation-reduces-personal-exposure-to-indoor-pollution-full-lenght/ 10/17
airflow cannot penetrate the download plane jet anymore.
Figure 5. Photos of smoke visualization between two BTM with and without downwardplane jet, a) without downward plane jet, b) jet velocity 2.2 m/s, c) jet velocity 3.0 m/s.
Instantaneous velocity of breathingInstantaneous velocity at point Ps.
Figure 6 shows the instantaneous velocity at point Ps for different cases. Without thedownward jet, the maximum velocity of the exhaled airflow of source manikin is2.8±0.2 m/s (9.19 ±0.65 fps) (see Figure 6 a). With downward plane jet, the maximumvelocity of the exhaled airflow of source manikin varies depending on the jet velocity. Witha jet velocity of 3.0 m/s (9.84 fps), the maximum exhalation velocity decreases to2.5±0.1 m/s (8.2±0.33 fps) (see Figure 6 b). While with a jet velocity of 4.0 m/s (13.12 fps),the maximum exhalation velocity increases to 3.3±0.2 m/s (10.83±0.65 fps) (see Figure 6c). The maximum velocity does not change so much when two breathing thermal manikinsare employed.

10/13/2014 Protected zone ventilation reduces personal exposure to indoor pollution (full lenght): REHVA
http://www.rehva.eu/publications-and-resources/hvac-journal/2014/042014/protected-zone-ventilation-reduces-personal-exposure-to-indoor-pollution-full-lenght/ 11/17
Figure 6. (a) Instantaneous velocity at Ps in case a, without a downward plane jet; (b)Instantaneous velocity at Ps in case b-1and (c) Instantaneous velocity at Ps in case b-2.(Cao et al. 2014)
Instantaneous velocity at point Pc.
Figure 7 shows the instantaneous velocity at point Pc in different cases. Withoutdownward jet, the maximum velocity of the exhaled airflow of source manikin is0.6±0.2 m/s (1.97±0.65 fps) (see Figure 7 a). With downward plane jet, the maximumvelocity of the exhaled airflow of source manikin varies depending on the jet velocity. Witha jet velocity of 3.0 m/s (9.84 fps), the maximum exhalation velocity decreases to0.7±0.2 m/s (2.30±0.65 fps) (see Figure 7 b). While with a jet velocity of 4.0 m/s(13.12 fps), the maximum exhalation velocity increases to 1.0±0.2 m/s (3.28±0.65 fps)(see Figure 7 c). The maximum velocity does not change so much when two breathingthermal manikins are employed.

10/13/2014 Protected zone ventilation reduces personal exposure to indoor pollution (full lenght): REHVA
http://www.rehva.eu/publications-and-resources/hvac-journal/2014/042014/protected-zone-ventilation-reduces-personal-exposure-to-indoor-pollution-full-lenght/ 12/17
Figure 7. (a) Instantaneous velocity at Pc in case a, without a downward plane jet; (b)Instantaneous velocity at Pc in case b-1 and (c) Instantaneous velocity at Pc in case b-2.(Cao et al. 2014)
Instantaneous velocity at point Pt.
Figure 8 shows the instantaneous velocity at point Pc in different cases. Withoutdownward jet, the maximum velocity of the exhaled airflow of source manikin is0.5±0.2 m/s (1.64±0.65 fps) (see Figure 8 a). With downward plane jet, the maximumvelocity of the exhaled airflow of source manikin varies depending on the jet velocity. Witha jet velocity of 3.0 m/s (9.84 fps), the maximum exhalation velocity decreases to0.3±0.2 m/s (0.98±0.65 fps) (see Figure 8 b). While with a supply velocity of 4.0 m/s(13.12 fps), the maximum exhalation velocity increases to 0.4±0.1 m/s (1.31±0.65 fps)(see Figure 8 c). The maximum velocity increases up to 1.0±0.2 m/s (3.28±0.65 fps) whentwo breathing thermal manikins are employed with a supply velocity of 3.0 m/s (9.84 fps).When increasing the supply velocity to 4.0 m/s (13.12 fps), the maximum velocity at Ptreaches even 2.0 m/s (6.56 fps).
Figure 8. (a) Instantaneous velocity at Pt in case a, without a downward plane jet; (b)Instantaneous velocity at Pt in case b-1 and (c) Instantaneous velocity at Pt in case b-2.

10/13/2014 Protected zone ventilation reduces personal exposure to indoor pollution (full lenght): REHVA
http://www.rehva.eu/publications-and-resources/hvac-journal/2014/042014/protected-zone-ventilation-reduces-personal-exposure-to-indoor-pollution-full-lenght/ 13/17
(Cao et al. 2014)
Performance of POV to reduce personal exposureto a cough jetExperimental setupThe experiments were performed in a chamber, which is located in the University of Texasat Austin, with dimensions of 2.3 m (length) × 1.94 m (height) × 2.1 m (width) (seeFigure 5). POV was used to separate a space into a source zone and a protected zone.Total particle concentration was used to calculate the personal exposure value, whichmeans all particle sizes will be summed together by using Aerodynamic Particle SizerSpectrometer (APS) Model 3321 and AeroTrak particle counter Model 8220.
Figure 9. Sketch of measurement set-up of POV and photos of the setup.
Results and discussionThe dimensionless exposure index is used to express the risk of personal exposure (PE)to a cough jet (Cao et al. 2013). Figure 6 shows that the average peak normalizedconcentration in the breathing zone for MV is 5 times and 20 times higher than by two-slot

10/13/2014 Protected zone ventilation reduces personal exposure to indoor pollution (full lenght): REHVA
http://www.rehva.eu/publications-and-resources/hvac-journal/2014/042014/protected-zone-ventilation-reduces-personal-exposure-to-indoor-pollution-full-lenght/ 14/17
concentration in the breathing zone for MV is 5 times and 20 times higher than by two-slotPOV and one-slot POV respectively. The one-slot POV has great potential to reduce thepeak concentration than a traditional MV.
a) b) c)
Figure 10. Normalized concentration of coughed particles (0.77 μm) in the breathingzone, a) with MV, b) with POV (two-slot), c) POV (one-slot) (Liu et al. 2014)
Smoke VisualizationSmoke tests were used to illustrate how a cough jet travels towards the target occupantunder a calm environment, MV, and two-slot one-slot POV. In Figure 11, a cough jetpenetrates slightly upwards towards the receiver occupant's breathing zone for a calmenvironment without ventilation. It implies that the buoyant human thermal plume has alittle impact on a cough jet when the distance between the two occupants is shorter than0.7 m. However, the cough jet is entrained upwards by the ceiling attached flows. With anidentical airflow rate with MV, the two POVs bend a cough jet downwards before the jettravels to the target occupant. The results show that the one-slot POV with a doubledischarge velocity has a better performance to redirect the cough jet (compared to thetwo-slot POV at the same flow rate), leading to a shorter penetration distance. Thissuggests that the POV using a smaller slot opening while maintaining the same ventilationrate is more effective at deflecting cough jets away from susceptible occupants.

10/13/2014 Protected zone ventilation reduces personal exposure to indoor pollution (full lenght): REHVA
http://www.rehva.eu/publications-and-resources/hvac-journal/2014/042014/protected-zone-ventilation-reduces-personal-exposure-to-indoor-pollution-full-lenght/ 15/17
rate is more effective at deflecting cough jets away from susceptible occupants.
Figure 11. Smoke visualization of a cough jet under different ventilation patterns. (Liu etal. 2014)
ConclusionsThe PZV/POV systems using a plane jet is able to separate the room into two zones witha different concentration level of contaminant. This indicates the PZV may protect peoplefrom the cross-contaminant in a room with an unknown indoor pollutant source. By usingpartitions and upper exhaust in PZV, the protected zone can be kept at a lowercontaminant concentration in the same room. The personal exposure to the respiratoryactivities may be very high when the distance between two people becomes very close.The downward airflow in PZV system may bend the exhaled airflow downward and reducethe direct exposure of the target manikin to the source manikin. The direct exposure oftarget manikin to breathing airflow and a cough is significantly reduced by using PZV withhigher supply air velocity. The results may be used to guide the design of an efficient PZVsystem for different industry and engineering applications. More detailed studies areneeded to get a better understanding of the performance of the PZV under differentconditions.
AcknowledgementThe authors wish to express their thanks for financial support from the Academy ofFinland through the postdoctoral project POWER-PAD (NO. 259678).
References

10/13/2014 Protected zone ventilation reduces personal exposure to indoor pollution (full lenght): REHVA
http://www.rehva.eu/publications-and-resources/hvac-journal/2014/042014/protected-zone-ventilation-reduces-personal-exposure-to-indoor-pollution-full-lenght/ 16/17
ReferencesCao G.Y., Jorma Heikkinen, Helena Järnström. Protection of office workers from exposureto respiratory diseases by a novel ventilation system. Indoor Air 2011. Austin, USA.
Cao, GY., Sirén, K. and Kilpeläinen S. (2013) Modelling and experimental study ofperformance of the protected occupied zone ventilation, Energ. Buildings, 68, 515–531.
Gupta JK., Lin CH, Chen Q. 2011.Transport of expiratory droplets in an aircraft cabin.Indoor Air 2011; 21: 3–11
Li Y, Leung GM, Tang JW, Yang X, Chao CYH, Lin JZ, et al. Role of ventilation inairborne transmission of infectious agents in the built environment – a multidisciplinarysystematic review. Indoor Air 2007;17:2–18.
Mazumdar S. and Chen Q. 2009. A one-dimensional analytical model for airbornecontaminant transport in airliner cabins. Indoor Air. Volume 19, Issue 1, February 2009,Pages: 3–13,
Melikov AK, Bolashikov Z, Georgiev E. Novel ventilation strategy for reducing the risk ofairborne cross infection in hospital rooms. In: Proceedings of indoor air 2011 [Austin,USA].
Nielsen P.V., Zajas J., Litewnicki M. and Jensen R.L. (2014) Breathing and Cross-Infection Risk in the Microenvironment around People, ASHRAE Papers CD: 2014ASHRAE Winter Conference.
Olmedo, P. V. Nielsen, M. Ruiz de Adana, R. L. Jensen, P. Grzelecki. Distribution ofexhaled contaminants and personal exposure in a room using three different airdistribution strategies. Indoor Air 2012; 22: 64–76
Rim D, Novoselac A. 2010.Ventilation effectiveness as an indicator of occupant exposureto particles from indoor sources. Building and Environment 45 (2010) 1214–1224
Sirén K. 2003.Technical dimensioning of a vertically upwards-blowing air curtain, Part II,Energy and Buildings 35 (2003) 697–705.
Liu SC, Cao GY, Boor B, Novoselac A. A Protected Occupied Zone Ventilation System toPrevent the Transmission of Coughed Particles. In: Proceedings of Indoor Air 2014, Hong

10/13/2014 Protected zone ventilation reduces personal exposure to indoor pollution (full lenght): REHVA
http://www.rehva.eu/publications-and-resources/hvac-journal/2014/042014/protected-zone-ventilation-reduces-personal-exposure-to-indoor-pollution-full-lenght/ 17/17
REHVA Office 40 Rue Washington 1050 Brussels - Belgium | Tel.: +32-2-5141171 | Fax: +32-2-5129062 | info[@]rehva.eu
copyright © 2002-2014 REHVA. ALL rights reserved. Disclaimer SitemapTrynisis Web Agency
Prevent the Transmission of Coughed Particles. In: Proceedings of Indoor Air 2014, HongKong, China.