iaq and thermal comfort in zero energy buildings - rehva
TRANSCRIPT

Technical University of Denmark
Professor Bjarne W. Olesen, Ph.D.
Department of Civil Engineering
Technical University of Denmark
Indoor Air Quality and Thermal Comfort in
Zero Energy Buildings

COMFORT-PRODUCTIVITYBuilding costs
People 100
Maintenance 10
Financing 10
Energy 1

Achieving Excellence in Indoor Environmental Quality
• Physical factors– Thermal Comfort
– Air quality (ventilation)
– Noise-Acoustic
– Illumination
• Personal factors– Activity
– Clothing
– Adaptation
– Expectation
– Exposure time

Energy Efficient Technologies
• Indoor air quality
– Reduce loads (pollution sources)
– Natural ventilation
– Air distribution (contaminant removal) effectiveness
» Personal ventilation
– Air cleaning
• Thermal comfort– Reduce loads (building shell, solar screen, internal loads)
– Low Temperatur Heating- and High Temperature Cooling Systems
– Use of building mass (Thermo-Active-Building-Systems (TABS))
– Drifting temperatures

MINIMIZE
Primary Energy UseIndoor Environmental Quality
WILL NOT WORK WITH ZERO
ENERGY BUILDINGS

Required energy for heating in residential buildings kWh / (m² . a)
220 130 54 30 00
50
100
150
200
250
300
Older
houses
1982 1995 2000 future
270
180
10070
22
kW
h/(
m².
a)
Low energy buildings will be standard !
Ventilation
TRANSMISSION
19%
28%
46%
85%

STANDARDS
• ISO EN 7730-2005 – Ergonomics of the thermal environment – Analytical determination and
interpretation of thermal comfort using calculation of the PMV and PPD indices and local thermal comfort effects.
• ASHRAE 55-2004– Thermal environment conditions for human occupancy
• ASHRAE 62.1 and 62.2 -2004– Ventilation and indoor air quality
• CR 1752– Ventilation of buildings-Design criteria for the indoor environment
• EN 13779– Ventilation for non-residential buildings - performance requirements for
ventilation and room-conditioning systems

EN15251 (CEN TC156 WG12)Indoor environmental input parameters for design and assessment of energy performance of buildings- addressing
indoor air quality, thermal environment, lighting and acoustics

CRITERIA FOR LIGHTING
Daylight factor, 2-5%, Ra colour rendering index

Indoor System Noise Criteria
Noise from
outside by
natural
ventilation?

Categories
Category Explanation
I High level of expectation and is recommended for spaces occupied
by very sensitive and fragile persons with special requirements
like handicapped, sick, very young children and elderly persons
II Normal level of expectation and should be used for new buildings
and renovations
III An acceptable, moderate level of expectation and may be used for
existing buildings
IV Values outside the criteria for the above categories. This category
should only be accepted for a limited part of the year

Cate
gory
Thermal state of the body as a
whole
Local thermal discomfort
PPD
%
Predicted
Mean Vote
Draught
Rate,
DR
%
Vertical air
tempe-
rature
difference
%
Warm
or
cool
floor
%
Radiant
Tempe-
rature
Asymmetry
%
I < 6 -0.2 < PMV < + 0.2 <10 < 3 < 10 < 5
II < 10 -0.5 < PMV < + 0.5 <20 < 5 < 10 < 5
III < 15 -0.7 < PMV < + 0.7 <30 < 10 < 15 < 10
IV > 15 PMV<-0.7; or 0,7<PMV >30
Recommended categories for design of mechanical heated and cooled buildings

Temperature ranges for hourly calculation of cooling and heating energy in three
categories of indoor environment
Type of building/ space
Category Operative Temperature for
Energy Calculations oC
Heating (winter
season), ~ 1,0 clo
Cooling (summer
season), ~ 0,5 clo
I 21,0 – 23,0 23,5 - 25,5
II 20,0 – 24,0 23,0 - 26,0
Offices and spaces with
similar activity (single offices, open plan offices,
conference rooms,
auditorium, cafeteria, restaurants, class rooms,
Sedentary activity ~1,2 met III 19,0 – 25,0 22,0 - 27,0

LOCAL THERMAL DISCOMFORT
• FLOOR SURFACE TEMPERATURE
• VERTICAL AIR TEMPERATURE DIFFERENCE
• DRAUGHT
• RADIANT TEMPERATUR ASYMMETRI

DRAUGHT
• MEAN AIR VELOCITY
• TURBULENCE
• AIR TEMPERATURE
DRAUGHT RATING, DR= (34-ta)(v-0.05)0.62(0.37 v Tu + 3.14)
International Centre for Indoor Environment And Energy

Parameter
Distance from cold
surface
Formular
Unit
Min. Air temperature at the
floor
x tmin = tRaum – (0,30 – 0,034*X)(tRaum –
tFläche )
°C
x<0.4 m 5,0
max 055,0 httv FlächeRaum m/s
0,4<x< 2,0 5.0
max32,1
095,0htt
Xv FlächeRaum
m/s
Max. air velocity at the floor
2,0<x 5.0
max 028,0 httv FlächeRaum m/s
Calculated values for the air movement at the floor (Heiselberg 1994) for
two-dimensional (Window- = Room width)

DOWN DRAUGHT
0
0,05
0,1
0,15
0,2
0,25
0,3
0,35
0,4
0,45
0 1 2 3 4 5 6 7
Height m
Air
velo
cit
y
m/s
U-Value
4.0
3.0
2.0
1.5 W/m2K
1.2
1.0
0.6
0.4
0.2
Outside Temperatur -12 0C

RADIANT TEMPERATURE ASYMMETRY
• HEATED CEILING: < 5 oC
• COOLED CEILING: < 14 oC
• WARM WALL: < 23 oC
• COOL WALL: <10 oC

UNIFORMITY OF OPERATIVE TEMPERATURE DISTRIBUTION
• to,warm - to,cold < 4 K
• to,warm - to,cold ~ 1,0 x Uw
• Uw < 4 W/m2K
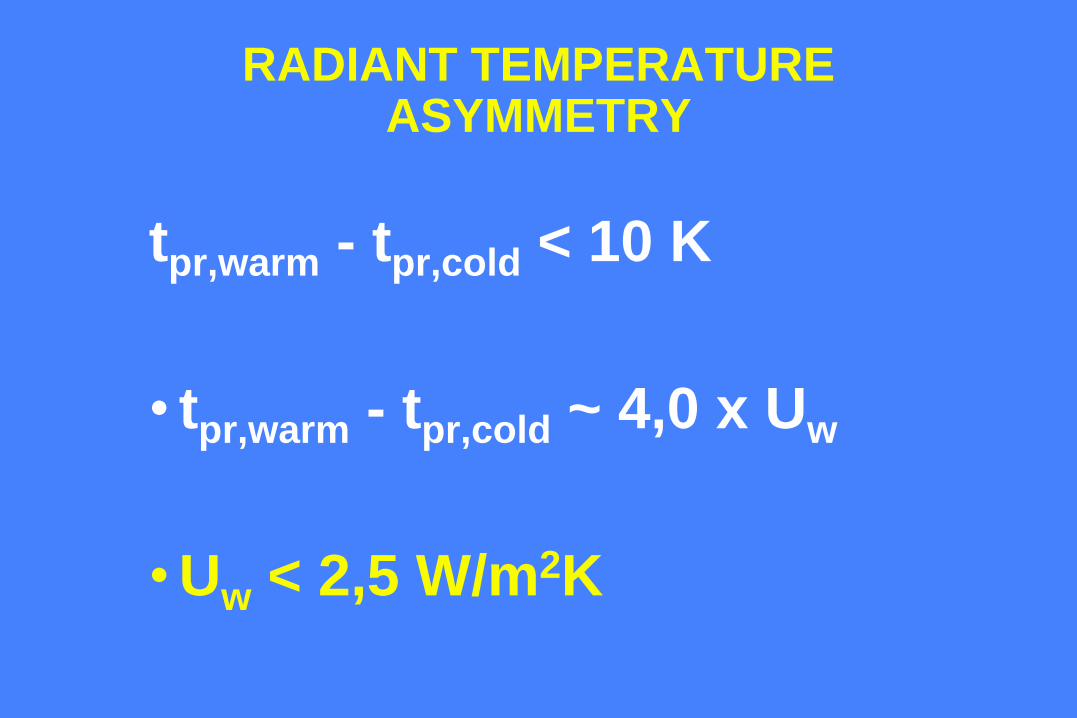
RADIANT TEMPERATURE ASYMMETRY
tpr,warm - tpr,cold < 10 K
• tpr,warm - tpr,cold ~ 4,0 x Uw
•Uw < 2,5 W/m2K

THERMAL COMFORT
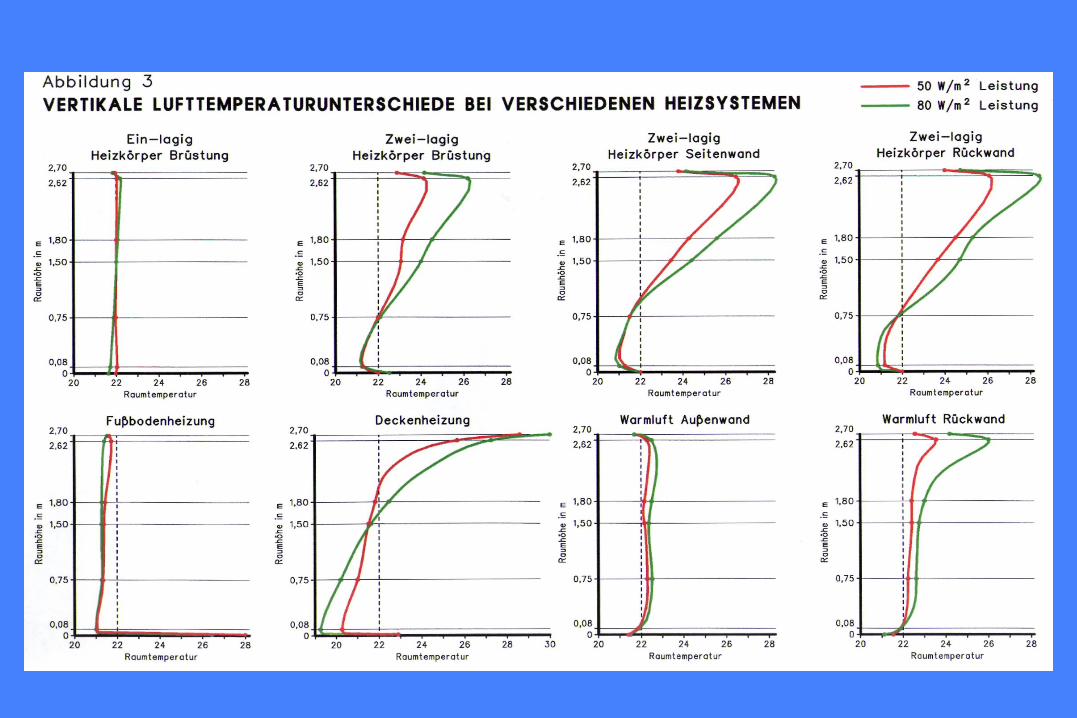
• VERTICAL AIR TEMPERATURE DIFFERENCE ta BETWEEN HEAD AND FEET:
< 3 oC (ISO EN 7730)
• SEATED PERSON:1.1 m and 0.1 m above floor level

FLOOR TEMPERATURE
• SEATED/STANDING PERSONS: 19 °C < ts < 29 °C
• BY HIGHER ACTIVITY LEVELS A LOWER FLOOR TEMPERATURE IS ACCEPTABLE
International Centre for Indoor Environment And Energy

SELF CONTROL
80
W/m?40
W/m?20
W/m?10
W/m?Heat load
Floortemperature
Heat. level temp. tiles
Heat. level temp. carpet
38,4
29,4
24,9
22,5
31,9
26,2
23,3
21,7
27,3
23,9
22,121,120
22242628303234363840
C°
Floortemperature at 20 °C Roomtemperature

FLOOR TEMPERATURE
Floor construction on concrete Optimum floortemperature
Recommended floortemperature range °C
1 min.°C
10 min.°C
1 min.10%
dissatisfied
10 min.15%
dissatisfied
Wilton-carpetNeedled felt sheet
5 mm corkWooden floor
PVC-sheet with felt underlay
Painted concrete floorConcrete floor
Marble
2123
2426.5
28
3028.5
30
24.525
2625.5
27
28.527
29
12-30.515.5-31
17-3122-31.5
24.5-32
27.5-32.524.6-32.0
27.5-32.5
21-2822.5-28
23-2823-28
25.5-28
27.5-2926-28.5
28-29.5

CONTROL OF ROOM TEMPERATURE
• Drifting temperature– OK within the comfort range
• Air temperature – Operative temperature– Less difference in zero energy buildings
• Individual room control– May be less important for energy use
– Still important for thermal comfort (bed room, living room)

Concept for calculation of design ventilation rate
People Component Building Component
Breathing Zone
Outdoor Airflow
Minimum
l/s/Person
Number of
People
Ventilation
per Smoker
Minimum
l/s/m²
Building Area
Vbz = RpPz + RsSd + RaAz
Number of
Smokers

Breathing zone outdoor airflow (Vbz),
• Vbz = RpPPz + RaAAz
•
• where:– Az = Zone floor area: the net occupiable floor area of the zone m2
– Pz = Zone population: the largest number of people expected to occupy the zone during typical usage.
– RPp = Outdoor airflow rate required per person: these values are based on non-adapted (adapted) occupants.
– RAa = Outdoor airflow rate required per unit area.

Recommended ventilation rates for non-residential buildings for three categories
Type of
building or
space
Cate-
gory
Per person
l/s,person
Per floor
area
l/s,m2
Per person
l/s,person
Per floor
area
l/s,m2
Per person
l/s,person
Per floor
area
l/s,m2
Very low polluted
building, revision
Low polluted building,
revision
Non-low polluted
building, revision
Single office I 5,0 1,5 10,0 2,0 20,0 3,0
II 3,0 1,0 7,0 1,4 14,0 2,1
III 2,0 0,6 4,0 0,8 8,0 1,2
Landscaped
office
I 7,5 1,5 15,0 1,7 30,0 2,7
II 4,5 1,0 10,5 1,2 21,0 1,9
III 3,0 0,6 6,0 0,7 12,0 1,1
Conference
room
I 1,0 1,5 2,0 6,0 4,0 7,0
II 0,6 1,0 1,4 4,2 2,8 4,9
III 0,4 0,6 0,8 2,4 1,6 2,8

Residential buildings
Category Air change
rate 1)
Living room and
bedrooms, mainly
outdoor air flow
Exhaust air flow, l/s
l/s,m2
(1)
ach l/s, pers2)
(2)
l/s/m2
(3)
Kitchen
(4a)
Bathrooms
(4b)
Toilets
(4)
I 0,49 0,7 10 1,4 28 20 14
II 0,42 0,6 7 1,0 20 15 10
III 0,35 0,5 4 0,6 14 10 7
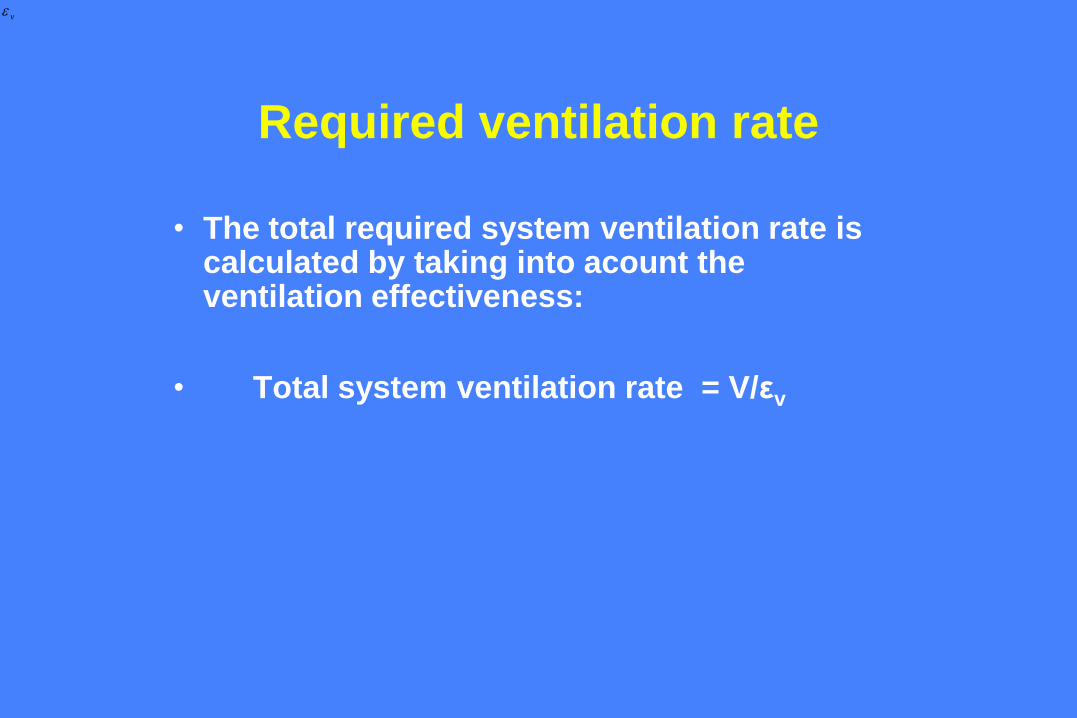
Required ventilation rate
• The total required system ventilation rate is calculated by taking into acount the ventilation effectiveness:
• Total system ventilation rate = V/εv
v

Ventilation effectiveness

Inhaled Air Quality
Veff 1 Veff 1.4 (6)

Ventilation effectiveness

Studies of heating systems

Studies of heating systems
Supply air
Exhaust air
Window
heating floor
System 1 System 2 System 3
System 4 System 5 possible additional System with floor heating
Supply air
Exhaust air
window
heating floor
System 1 System 2 System 3
System 4 System 5
Supply air
Exhaust air
Window
heating floor
System 1 System 2 System 3
System 4 System 5 possible additional System with floor heating
Supply air
Exhaust air
window
heating floor
System 1 System 2 System 3
System 4 System 5
Supply air
Exhaust air
Window
heating floor
System 1 System 2 System 3
System 4 System 5 possible additional System with floor heating
Supply air
Exhaust air
window
heating floor
System 1 System 2 System 3
System 4 System 5
Supply air
Exhaust air
Window
heating floor
System 1 System 2 System 3
System 4 System 5 possible additional System with floor heating
Supply air
Exhaust air
window
heating floor
System 1 System 2 System 3
System 4 System 5
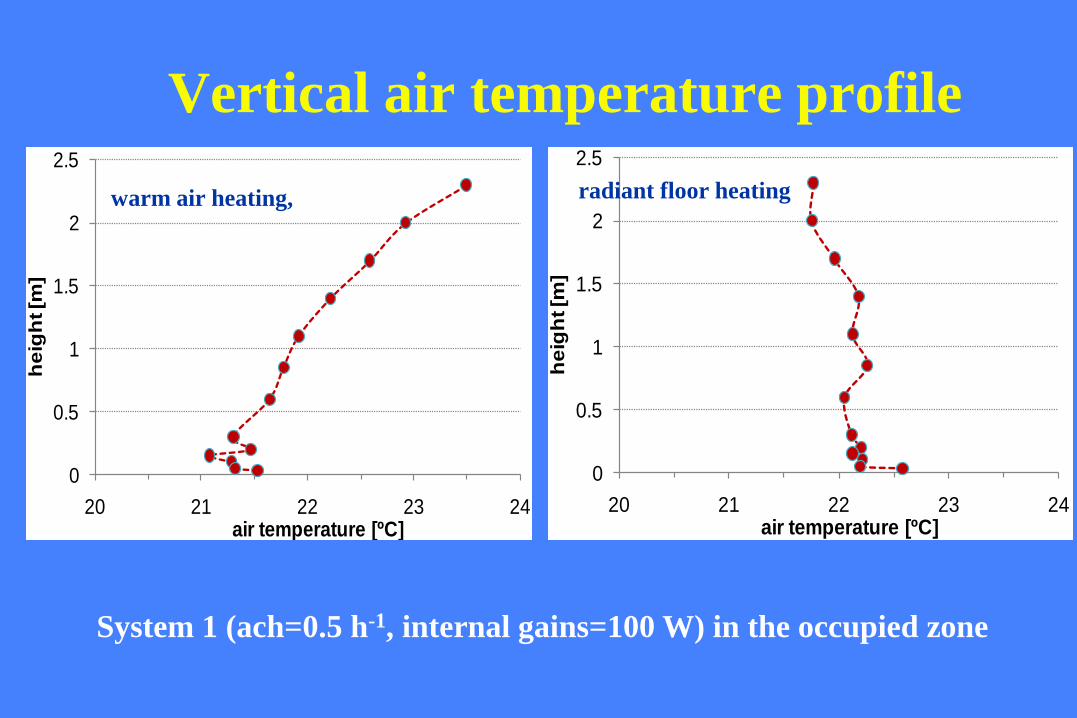
Vertical air temperature profile
0
0.5
1
1.5
2
2.5
20 21 22 23 24
he
igh
t [m
]
air temperature [ºC]
Temp. profile_syst1-case3-occupied zone
0
0.5
1
1.5
2
2.5
20 21 22 23 24
he
igh
t [m
]
air temperature [ºC]
Temp. profile_syst1-case5-occupied zone
System 1 (ach=0.5 h-1, internal gains=100 W) in the occupied zone
warm air heating, radiant floor heating

WARM AIR HEATINGContaminat Removal Effectiveness
CRE as a function of air flow rate for a combination of mixing
ventilation and warm air heating, with internal gains of 90 W (cases 3,
4 and 7). The curves represent average in the occupied zone
Supply air
Exhaust air
Window
heating floor
System 1 System 2 System 3
System 4 System 5 possible additional System with floor heating
Supply air
Exhaust air
window
heating floor
System 1 System 2 System 3
System 4 System 5
Supply air
Exhaust air
Window
heating floor
System 1 System 2 System 3
System 4 System 5 possible additional System with floor heating
Supply air
Exhaust air
window
heating floor
System 1 System 2 System 3
System 4 System 5
Supply air
Exhaust air
Window
heating floor
System 1 System 2 System 3
System 4 System 5 possible additional System with floor heating
Supply air
Exhaust air
window
heating floor
System 1 System 2 System 3
System 4 System 5
Supply air
Exhaust air
Window
heating floor
System 1 System 2 System 3
System 4 System 5 possible additional System with floor heating
Supply air
Exhaust air
window
heating floor
System 1 System 2 System 3
System 4 System 5

Indoor Air Quality and Thermal Comfortin
Zero Energy Buildings• Thermal Comfort
– More uniform conditions (radiant asymmetry, vertical air temperature differences)
– Less draught risk (reduced heat supply, no cold surfaces)
– Less difference between air and operative temperature
– Is individual room control important?
» Comfort
» Energy
• Indoor Air Quality– Tighter buildings
– Cannot rely on infiltration
– Can you heat with the ventilation system?
» Air distribution
» Ventilation effectiveness
» Individual room control

Indoor Air Quality and Thermal Comfortin
Zero Energy Buildings
If an energy efficient measure also improve the indoor environment
it will lower health risk and increase productivity
and always be cost efficient.

Occupant behaviourand
Energy Consumption• Simulation study:
– Occupant behaviour can affect energy consumption by more than 300 %
• Literature survey
– In identical dwellings, the highest energy consumption is typically 2-3 times as high as the lowest
– Differences as high as 600 % has been observed