regulatory services
TRANSCRIPT

Regulatory Services Licensing, Environmental Management and
Animal Control
April 24, 2012

Table of Contents Regulatory Services
Licensing, Environmental Management and Animal Control
Note: This Results Minneapolis session for Regulatory Services focuses on Licensing , Environmental
Management and Animal Control measures; The other Results Minneapolis sessions for Regulatory
Services in 2012 will focus on their other business units.
Performance Measures Page
1. Police Calls to Top 20 Problem Businesses 3
2. Police calls at On-Sale Liquor Establishments 4-5
3. Licensed Taxicabs and Drivers 6
4. Taxicab Companies 7
5. Taxicab Inspection Fees Collected 8
6. Taxicabs Cited or Impounded as Unlicensed 9
7. Business License Trends
-Food Licenses
-Alcohol Licenses at Food and Beverage Establishments
-Special Event Licenses
10-14
8. Farmers Markets and Mini-Markets 16-18
9. Foodborne Illness Outbreaks 19-21
10. Lead Poisoned Children and Property Rehabilitation 22-23
11. Erosion Control Enforcement 24
12. Noise Complaints and Inspections 25
13. Animal Bites and Declarations 26-27
14. Pets Licensed and Stray Outcomes 28-29
15. Outcomes for Adoptable Animals 30-31
Appendix
-Metro Area Ozone
-Average Benzene and Formaldehyde Concentrations
-Number of Renewable Energy Projects Citywide
Results Minneapolis: Regulatory Services April 24, 2012 2
Charts with “the sun” identify that measure as one of the City’s sustainability indicators.

Why is this measurement important? Routinely reviewing police calls for service at businesses is important because it can be an indicator that the business is having an unreasonable draw on Police resources and posing a risk to the safety, health and livability of city neighborhoods. However, it is important to analyze the total number of police calls because there are occasions that a high number of calls are not a negative impact indicator; rather it is due to a business reporting crime that is occurring around their business or due to the business being located in a busy intersection. What strategies are being used to make progress in this area? In February 2011 it was reported to Results Minneapolis that business licensing is utilizing an improved method of analyzing police calls and problem businesses. Each police precinct has a monthly problem business meeting at which business licensing staff and police personnel review police calls for service at businesses and coordinate an action plan to address any potential issues. This method has more immediate impact. The police calls have leveled off to a manageable level of service. Overall, the 20 businesses have an average of 42 calls per business per year, or less than 4 calls for service a month.
Results Minneapolis: Regulatory Services April 24, 2012 3
1176
1322
903 874 842
0
200
400
600
800
1000
1200
1400
2007 2008 2009 2010 2011
Number of Police Calls at Top 20 Problem Businesses
Problem Businesses

Why is this measure important? The City of Minneapolis has several entertainment districts; the most popular being the Downtown Warehouse District and the Uptown area. The success of these areas relies on a balance between a fun and exciting destination and a safe environment. Entertainment districts that are not managed well can negatively affect surrounding businesses, offices and residential area. We found that bars and restaurants that are operating without regard for the well-being of the surrounding area greatly affected the entire district. Entertainment establishments that were not well-operated were found to generate significantly more police calls for service than others. We also found that poorly managed establishments draw a customer base that was prone to overconsumption of alcohol, drug use, and were prone to creating situations of fighting and assaults. We have had recent incidents where poorly managed establishments created such chaos that nearby establishments closed early so their customers and employees could exit the area prior to bar close. It became obvious that intervention with the entertainment establishment operators was needed and that is why the Entertainment District Management Group was created.
Results Minneapolis: Regulatory Services April 24, 2012 4
Entertainment District Management
Narrative continued on next page…
1356
340 249 179
341
2465
1339
357 243 141 251
2331
1268
332 289 225 354
2468
1141
299 260 203 319
2221
0
500
1000
1500
2000
2500
3000Police Calls at On-Sale Liquor Establishments
2009 2010 2011 2012 Tgt.

What strategies are being used to make progress? Entertainment District Management Workgroup This group is a multiagency team with a goal to address issues related to entertainment districts in the city. The group meets quarterly to report on two primary objectives; 1) holding establishments accountable when they are not in compliance and 2) developing tools to standardize security practices. This group has been responsible for the improvements made in the security plan review form, the noise management review form and the procedure to request businesses with police calls to tell us how they addressed the security issue. This group has also reviewed the Alcohol Density Study that was conducted by the University of Minnesota department of Epidemiology. This study affirms that there is a positive correlation between alcohol density and the police calls. The goal of this group was to reduce alcohol related calls by 10%. This objective has not been realized citywide. If we accept the findings of the Alcohol Density Study, it may not be realized because the density of alcohol establishments has remained constant. The graph on the preceding page shows that alcohol related police calls have remained consistent for the past three years. These calls include alcohol violations, assaults, criminal sexual conduct, disturbances, persons down, drunk/intoxicated persons, fights, indecent exposure, narcotics, officer needs help; unknown trouble and unwanted persons. Uptown and Downtown Late Night Taxi Stands The Entertainment District Workgroup had identified a need for more taxicab service for late night patrons in the entertainment districts. In July of 2011, the Uptown District was identified as the area for a pilot program to establish taxi stands for late night use. Regulatory Services partnered with Minneapolis Police Department, Public Works, Uptown Businesses and the Taxi Industry to identify locations for these Taxi Stands. Eleven new taxi stands were established in the Uptown District, and they are available between the hours of 11:00 p.m. and 3:00 a.m. Thursday, Friday and Saturdays. These taxi stands allow patrons to have a quicker, easier, safer and more efficient access to Minneapolis Licensed taxicabs. With the success of the Uptown late night taxicab stands, a similar program is being implemented in the Warehouse District in Downtown Minneapolis. These taxi stands are due to begin service in April 2012.
Results Minneapolis: Regulatory Services April 24, 2012 5
Entertainment District Management

Results Minneapolis: Regulatory Services April 24, 2012 6
Why is this measure important? In 2007, the City of Minneapolis significantly amended the taxicab ordinance so that the number of taxicab licenses that were available was no longer capped at 373 licenses. Forty-five new licenses were issued each year until January 1, 2011, when the cap on licenses was completely lifted. The goal of this change was to allow individuals and small companies an opportunity to enter the taxicab business without having to buy licenses on the open market at inflated prices that sometimes reached $25,000 per license. Another goal was to increase the availability of taxicabs that can transport persons with disabilities, and to increase the number of taxicabs that were fuel efficient. What are the strategies we are using to make progress in this area? The City felt that by lifting the restrictive cap on the number of licenses the industry would be inclined to offer better taxicab services so as to survive the increased competition in the industry. Those companies that provide high quality service would become the choice of the taxicab riding public. Those that failed to have safe and clean vehicles, failed to provide service to all sectors of the community, and those who had no amenities such as on board credit card processing and fast reliable service would not survive. The following pages outline three strategies we are using to improve taxi service in the Twin Cities. - Increasing the number and type of taxicabs available. - Taxicab Safety Inspection and revenue generation - Unlicensed taxicab enforcement
Taxicabs
373 418 458
545
821 742
942 1,053
1,110 1,110 1,161
1,258
0
200
400
600
800
1,000
1,200
1,400
2007 2008 2009 2010 2011 2012
Licensed Taxicabs and Drivers
Taxicabs Drivers

Results Minneapolis: Regulatory Services April 24, 2012 7
To ensure that the Minneapolis taxicab fleet served those persons needing transportation in a wheelchair accessible vehicle, the ordinance mandated that every taxicab service company provide at least one wheelchair accessible taxicab for every 10 standard taxicabs. The industry was resistant to this mandate during the initial implementation, and significant fines were issued to gain compliance. As of January 1, 2012, the goal of 10 percent wheelchair taxicabs was achieved. The 2007 ordinance amendment also contained a mandate that all taxicab fleets be at least 10 percent fuel efficient. A fuel efficient vehicle was defined as a vehicle that can use fuel at a rate of 23 MPG or better, per federal ratings. The industry was initially resistant to this requirement but soon found that the drivers preferred to drive a fuel efficient vehicle due to the price of fuel. The mandate of 10 percent fuel efficient vehicles was found unconstitutional by a Supreme Court decision, however, voluntary use of fuel efficient vehicles made the mandate unnecessary. The Minneapolis taxicab fleet is now over 20 percent fuel efficient.
6
9 9 9 10 10
11 10
11 10
13 11 11
12 12 14 14
17
20
27
5
10
15
20
25
30
Taxicab Companies
Taxicabs
11 21
66
92
141 Target: 10% of total
taxicabs
0
20
40
60
80
100
120
140
160
0
20
40
60
80
100
120
140
160
2007 2008 2009 2010 2011
Fuel Efficient Taxicabs
8 13 17 25
77 Target: 10% of total
taxicabs
0
10
20
30
40
50
60
70
80
90
0
10
20
30
40
50
60
70
80
90
2007 2008 2009 2010 2011
Wheelchair Taxicabs

Results Minneapolis: Regulatory Services April 24, 2012 8
Taxicab Vehicle Inspection During the 4th Quarter of 2008, Regulatory Services partnered with Public Works to conduct taxicab vehicle inspections at the Currie Maintenance Facility. Taxicab inspections are performed by DOT certified technicians at various times during both day and evening shifts. The partnership has proved successful in two ways. The taxicab inspection is of very high quality to ensure safe vehicles, and the inspection fees support the maintenance staff at the garage. Since the start of this program in 2008, $380,325 has been transferred to the Public Works budget to allow the retention of maintenance staff.
Taxicabs
$25,110 $39,145 $40,485 $15,265
$70,965
$110,575
$147,355
$43,025 $11,355
$96,075
$149,720
$203,060
$58,290
$0
$50,000
$100,000
$150,000
$200,000
$250,000
2008 2009 2010 2011 1st QRT 2012
Taxicab Inspection Fees Collected 2008 - 2012
Total Amount Collected $503,280
License Division Public Works
Public Works,
$380,325
Licensing, $122,955
Total Revenue of the Taxicab Inspection Program
2008 - 1st Quarter 2012 Total Amount Collected $503,280

Unlicensed Taxicab enforcement Unlicensed or “Bandit” taxicabs are a negative reality in most major cities. Unlicensed taxicabs present significant safety concerns as the drivers may have criminal backgrounds, the vehicles may be unsafe, the meters are untested and the vehicles may not be insured. The License and Consumer Services Division began an aggressive enforcement initiative in 2008 where License Inspectors partnered with Police to combat this problem. Since 2008, 247 unlicensed taxicabs have been cited and impounded.
The aggressive enforcement has been effective and we plan to continue to do bi-monthly details in 2012 to ensure that only licensed taxicabs are operating in the city.
Results Minneapolis: Regulatory Services April 24, 2012 9
1 9
67
108
43
19
0
20
40
60
80
100
120
2006 2007 2008 2009 2010 2011
Taxicabs Cited or Impounded as Unlicensed
Taxicabs

Why are these measures important? For many years Business Licensing has made great strides in streamlining, standardizing and simplifying our processes. We have gauged our success with these efforts in the reduction of days it now takes for businesses to open in Minneapolis. We believe that these efforts are now institutionalized and that the benchmarks of 30 days to process liquor licenses, five days to process food licenses, and one day to process taxi and contractor licenses are some of the most efficient nationwide. We are ready to build on these successes and address the second part of Minneapolis City Goal “businesses thrive here.” Customer service and expanding opportunities are two focuses of our division in reaching these goals. Developing measures to track these efforts will be just as important as tracking the days to process licenses. Tracking the number of licenses in major categories will give us a good indicator of the stability of the licensing market. Developing these new measurements will also respond to the request of the newly formed Business Advisory Group that wants us to demonstrate how we support businesses to be successful in Minneapolis. The charts on the next four pages show the positive trends in license categories. Strategies used to continue success The strategies we intend to employ to ensure that we can assist the business community in being successful include: being extremely transparent with our goals and needs, being available as a resource for start-ups as well as existing businesses, and to be held accountable for providing fair but comprehensive inspection and enforcement services.
One effort that has been working successfully is annual business inspections. License inspectors visit each land-based business annually to review the business and premises for compliance with common ordinances. The inspectors use this opportunity look at the immediate surrounding area to make sure that a neighboring property is not in violation of ordinances that may negatively affect area businesses. We are now exploring the possibility of tiered business renewal inspections where we may conduct a renewal inspection at well run businesses every two years instead of annually. The inspector resources saved by this could be used to conduct additional inspections at poor performing, or problem business locations.
The graphs on the following four pages depict trends in the following three license types:
Food Licenses The food business license trends depicted on page 11 indicate that the number of grocery stores is declining, but the number of meat markets is increasing. The loss of grocery stores can be attributed to the requirement that even small grocery stores now must have fresh fruit and produce, proteins, and meat available. Also, new grocery stores may not sell tobacco products in C-1 zoning districts. The stores that attempted to survive by selling snack foods, tobacco and drug paraphernalia are finding it harder to do business in Minneapolis. We believe the trend of smaller ethnic meat markets is responsible for the increase in meat market licenses. The number of non-alcoholic restaurants has been growing steadily since 1994 and includes several small ethnic restaurants, deli operations, and high quality fast food restaurants. Mobile food truck licenses have also been steadily increasing since the inaugural season of 2010. Alcohol Licenses at Food and Beverage Establishments You will notice that the Alcohol Licenses depicted on page 12 and 13 have remained constant. This is particularly important during this difficult economy. The stabilization of this license category significantly contributes to Business Licensing’s ability to continue to reach the 7.9 million dollar revenue expectation without constantly increasing license fees. We believe that our business communities are able to maintain and thrive because we have provided businesses with opportunities to expand the uses of their existing businesses. The following charts show the increase in alcoholy licenses that expanded the uses of existing businesses and increased their customer base. Special Event Licenses The charts showing special event license increases on page 14 clearly indicate that Minneapolis continues to be a fun city with many events throughout the year. The event management team is comprised of staff from Regulatory Services, Public Works, Park Board, and the Police Department. This team ensures that special events are successfully managed by the event organizers and that the events are safe, do not leave the area a mess, that debris is recycled, and that detours and amplified sound do not disturb surrounding residents.
Business License Trends: Introduction
Results Minneapolis: Regulatory Services April 24, 2012 10

Results Minneapolis: Regulatory Services April 24, 2012 11
451 442 451 459 453 462 439
451 432
422 429 450 448 457
444 434
394 389 384 364
300
350
400
450
500
Grocery Store Licenses
Business License Trends: Food Licenses
60 57 52 59
50 58
69 76 75
83 85
107 102 108 109
118 111 111
105 105
0
20
40
60
80
100
120
140Meat Markets
481 481 491 498
511 523
498
535 530 531 523
556 556 567
549
583 566 572
588
566
400
450
500
550
600
Restaurant Licenses Without Liquor
0 10
28
40
0
10
20
30
40
50
2009 2010 2011 1 Qtr. 2012
Mobile Food Truck Licenses

Business License Trends: Alcohol Licenses at Food and Beverage Establishments
Results Minneapolis: Regulatory Services April 24, 2012 12
270 303
325 348
370 383 390 363 373 364 362
0
100
200
300
400
500
2001 2002 2003 2004 2005 2006 2007 2008 2009 2010 2011
On Sale Liquor Licenses
61 72
84 90 91
105 92
103 100 98 100 111
118
136
160 146 149 146 143 147
0
20
40
60
80
100
120
140
160
180
On Sale Wine and Strong Beer
63 64 65 63
55 56 51
43 45 42
39 33
30
22 20 15
10 10 9 8
0
10
20
30
40
50
60
70
3.2 On Sale Beer Without Entertainment

Results Minneapolis: Regulatory Services April 24, 2012 13
1 1 1
3 4
2 3
2
13
18
0
2
4
6
8
10
12
14
16
18
20
2002 2003 2004 2005 2006 2007 2008 2009 2010 2011
Liquor Catering Services
70 83
100
126 127 127 122
143 147 144 155
186 198
229 219 224 228 220
231 243
0
50
100
150
200
250
300
Sidewalk Cafe History
Business License Trends: Alcohol Licenses at Food and Beverage Establishments

Results Minneapolis: Regulatory Services April 24, 2012 14
Business License Trends: Special Event Licenses
59 58 56
63 61 61
71
91
40
50
60
70
80
90
100
2004 2005 2006 2007 2008 2009 2010 2011
Block Event Permits
86 129
213
119 158
137 131 119 119 131 141 169 174
203 180 185 180
247
328
446
499
0
100
200
300
400
500
600Short-Term Food Permits
4 9
17 23
30 25 23
36
23 28
33
42
29 29 24
43
70 71
0
10
20
30
40
50
60
70
80
Temporary On Sale Liquor Licenses

New
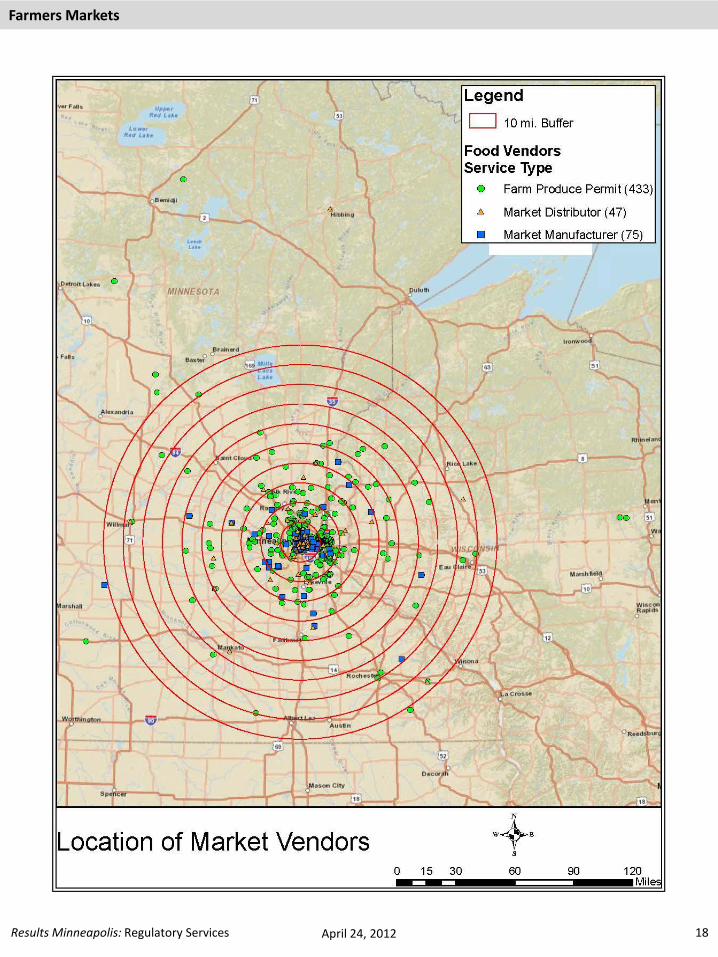
Why is this measure important? Playing a critical role in the Homegrown Minneapolis initiative, Regulatory Services works with stakeholders to update current regulations related to the local food movement while ensuring a safe food supply. Farmers markets provide fresh and local food, improve resident health, feed the local economy and contribute to greenhouse gas reduction. Tracking farmers markets and market vendors is one way to help gauge the availability of fresh and local foods in our community. The maps that follow depict the current locations of farmers markets and mini-markets for the City’s Urban Agriculture Topical Plan. The second map shows the locations of market vendors in the metro area who sell at city markets. A Public Market hosts all market vendor types. In 2012, as the result of ordinance amendments, to allow more consumer options and variety, there will be three types of Public Markets; farmers markets, produce and craft Markets and Mini-Markets (formerly termed “Local Produce Market”). A Municipal Market (a farmers market) is on City-owned land and is jointly operated by the City. In regard to the types of vendors, “grower” refers to vendors who sell their own locally grown products of their own farm such as fruits, vegetables, eggs, and meat etc. Market distributors re-sell fruits, vegetables and other food products produced by others. Market Manufacturers sell food products for on-site consumption at the market such as cookies, coffee, brats, etc. Market vendors, with some exceptions, are also allowed to sell their products to local businesses such as restaurants, caterers and grocery stores. Mini-markets are an example of how successful City/Community collaboration can achieve common goals. First Lady Michelle Obama recognized the City’s success as a model for providing access to fresh foods in an urban environment.
Results Minneapolis: Regulatory Services April 24, 2012 15
7 8
16 16
4
10
21 18
0
5
10
15
20
25
2008 2009 2010 2011
Farmers Markets and Mini-Markets
Farmers Markets Mini-Markets (Local Produce Markets)
46
80
120
185 186
020406080
100120140160180200
2007 2008 2009 2010 2011
Agricultural Permits Issued
Note: Chickens only, 2007-2009. Chickens & Honeybees started in 2010.
Farmers Markets
350 401
433
30 37 47 65 83 75 0
100
200
300
400
500
2009 2010 2011
Farmers Market Vendors
Grower Permit Market Distributors Market Manufacturer
What are the goals of this effort and what will it take to make progress? 2010 – Identified regulations that could be modified or eliminated to improve the regulatory environment for local foods. 2011 – Worked with farmers market mangers, other City departments and a cross-functional team to amend the Minneapolis farmers market ordinance to allow more indoor farmers markets in the city, required that 60 percent of vendors sell agricultural products, increase flexibility for mini-market in the foods they can sell, allowed more sampling and cooking demonstrations and market special events. 2012 to 2016 – Continue to work with Homegrown Minneapolis and CPED to develop City policies that support increased growth, sales, distribution, and consumption of foods that are healthy, sustainably produced, and locally grown for all Minneapolis residents and create the necessary internal structure to support these efforts. To achieve these goals, the current team of regulators, business operators, market managers, growers and other local foods stakeholders needs to be sustained. Collaboration and diversity is empowering team members to learn from each other and build upon each other’s strengths, knowledge, and abilities to systematically solve problems and create opportunities for local foods to flourish. The collaborative efforts are focused on promoting health, protecting the environment, increasing economic vitality, expanding social connectedness and improving food security. City staff have increased their understanding of the community’s needs while the community has expanded its understanding of local government. Note regarding farmers market maps/charts: One of the amendments to the farmers market ordinance was to eliminate the requirement for exempt produce vendors who are selling products of their own farms to register with the City. This was done in response to community need and to lesson the burden on local growers. The farmers market managers will now be accountable for keeping information on the grower for tracking purposes in case of a product recall or outbreak. The data implication is that the City will no longer have information on the exempt growers for mapping or other statistical purposes.
Results Minneapolis: Regulatory Services April 24, 2012 16
Farmers Markets

Results Minneapolis: Regulatory Services April 24, 2012 17
Markets & Mini Markets As of: April 2012
Farmers Markets
Results Minneapolis: Regulatory Services April 24, 2012 18
Farmers Markets

Why is this measurement important?
According to the CDC, 1 in 6 Americans have been afflicted with a foodborne illness and annually there are 3,000 tragic, preventable deaths. However, most of us are not conscious of foodborne illness until we become ill from unknowingly consuming contaminated food. A confirmed foodborne disease outbreak is defined as an incident in which two or more persons experience a similar illness after ingestion of a common food or meal and epidemiologic evaluation implicates the meal or food as the source of illness. Confirmed outbreaks may or may not be laboratory-confirmed. The City environmental health program investigates all reports of foodborne illness and if there is an outbreak, the team responds rapidly, collaborating with State and County epidemiologists, working around the clock with the implicated business to stop the outbreak and prevent more people from becoming ill.
Outbreaks are preventable. National food safety authorities recommend using the elimination of the risk factors for foodborne illness as a performance measure to track increases or decreases in foodborne illness. However, these statistics are needed to estimate national and global incidence rates.
What will it take to achieve the targets?
2012- 2016 Target: Work with the business community to implement food safety self-auditing to increase compliance in each category to 95 percent by 2016.
Mandatory self-auditing would be required in addition to and would compliment regulatory inspections. The program helps the community to recognize the value of our food safety inspectors and to understand the reasons behind the regulations. We have developed, piloted and evaluated self-auditing from 2007 - 2009. Implementing a full-time self-inspection program would require a dedicated community liaison. The analysis found that critical violations were reduced by 40 percent in the study group. The self-audit process, tools and resources were designed and produced by a cross-functional team of food service professionals, regulators and educators for food operators to increase the safety and security of their food. Self-inspections create internal peer to peer learning, strengthen training efforts by person in charge, change facility standard and make businesses safer and more successful.
Results Minneapolis: Regulatory Services April 24, 2012 19
Continued on next page…
Food Safety
129 127
166
127
5 2 9 3 Target:0
0
20
40
60
80
100
120
140
160
180
2008 2009 2010 2011 2012 Target
Foodborne Illness Outbreaks
Number of Cases Investigated Number of Confirmed Cases

The City’s Environmental Health Specialists educate business operators and enforce the Minnesota Food Code to prevent outbreaks and protect the City’s residents and visitors. The well-trained and knowledgeable food worker is the frontline defense against foodborne outbreaks. Inspection and enforcement efforts are focused on increasing accountability in management and the oversight of frontline food workers so that they handle food safely, do not work when ill, practice good personal hygiene, and handle food with clean hands. Over 50 percent of foodborne outbreaks are associated with an ill food worker contaminating food with improperly washed hands. The Food Manager is the key person on the front-line of public health. Often, food managers are busy with operational issues and do not spend much time training front-line workers to maintain food safety standards. Food Managers’ failures to work with staff to control risks is a major detriment to the safety, health, and livability of the community. The cost of a single case of food borne illness in the State of Minnesota is estimated at $1,790 per person and is coupled with substantial expenditure of City resources. Environmental Health staff investigates an average of 137 cases per year. Increasing compliance with the most critical food safety standards protects public health and reduces costs to the City and the community. In the last three years compliance rates for food safety standards and food handling health and hygiene were around 90 percent, while the compliance rate for maintaining food at proper temperatures has declined 7.5 percent.
Results Minneapolis: Regulatory Services April 24, 2012 20
Additional measures on next page…
Food Safety

Compliance Rate: Oversight of Food Safety Standards
Compliance Rate: Temperature Control
Compliance Rate: Food Handler Health & Hygiene
Results Minneapolis: Regulatory Services April 24, 2012 21
93%
7%
2009 (1229 Risk I Inspections)
89%
11%
2010 (1509 Risk I Inspections)
93%
7%
2011 (1810 Risk I Inspections)
% of Inspections in Compliance % of Inspections out of Compliance
93%
7%
2009 (1229 Risk I Inspections)
88%
12%
2010 (1509 Risk I Inspections)
86%
15%
2011 (1810 Risk I Inspections)
% of Inspections in Compliance % of Inspections out of Compliance
90%
10%
2009 (1229 Risk I Inspections)
90%
10%
2010 (1509 Risk I Inspections)
93%
7%
2011 (1810 Risk I Inspections)
% of Inspections in Compliance % of Inspections out of Compliance
Food Safety
Target: 95%
Target: 95%
Target: 95%

Why is this a priority? Childhood lead poisoning remains a major environmental health problem in Minneapolis and throughout our nation. Lead is very dangerous to children under the age of six years old because of their developing brains and nervous systems. Exposure to lead in children may cause nervous system and kidney damage, learning disabilities, attention deficit disorder, decreased intelligence, language and behavioral problems, decreased muscle and bone growth, and hearing damage. High lead levels in children can cause seizures, unconsciousness and death. Additionally, recent studies have linked lead exposure in children to adolescent criminal activity. What strategies are being used to accomplish this goal? We must aggressively identify and control lead-based paint hazards in older housing stock throughout Minneapolis in order to reach our goal of eliminating childhood lead poisoning. This target can be achieved through the inspection process, education and providing property owners financial incentives to remediate lead hazards preventatively. The State of Minnesota mandates that environmental inspection take place when a child's blood lead level is 15 ug/dbl. However, the Centers for Disease control considers a child to be lead poisoned when their blood lead level is 10 ug/dbl. In response to recent research and the CDC's definition, the City inspects the homes of all lead poisoned children with blood lead levels 10 ug/dbl and above. This has resulted in an additional 92 children having their homes tested and orders written to resolve the lead hazards in their homes between 2010-2011. These 92 lead poisoned children would have gone without service under the state mandate. What resources are needed to carry out this strategy? The chart on the next page depicts the lifetime economic impact of lead poisoning in Minneapolis. The calculation was based on an article posted by the Oklahoma County Medical Society in September of 2010 where it was determined that in 2009 the average lifetime cost per child is $97,080. This dollar amount includes costs for lead inspections, case management, medical management, lifetime earnings not earned due to loss of IQ points, special education costs, and cost due to violent juvenile offences attributed to lead poisoning. To calculate the societal cost to Minneapolis and its children, $97,080 was multiplied by the number of Minneapolis children with lead poisoning in the corresponding year. The grey shaded area depicts the cost in Minneapolis alone for lead poisoning. The blue represents the amount of money that has been spent yearly on lead poisoning prevention and paying for interventions in homes of lead poisoned children in Minneapolis through HUD grants awarded to the City. The pink represents, general funds and federal CDBG money that the City uses to investigate lead poisonings and provide enforcement on the homes of lead poisoned children in Minneapolis. This chart is a good visual representation of the cost of lead poisoning to society and the amount of money that the City spends on response to lead poisonings through Regulatory Services. In 2012, the city began offering swab services to all homes of lead poisoned children. The purpose is to immediately lower the available lead dust in the property until the property can be made lead safe. In 2012-2014 Regulatory Services will be administrating $1,860,000 HUD Healthy Homes grant that will make homes lead safe as part of correcting safety and environmental health hazards in homes. Regulatory Services was also awarded a $2,480,000 HUD Lead Hazard Control grant that will go toward making the homes of lead poisoned children lead safe; this grant will operate from 2012-2015. Source: The Bulletin, The Oklahoma County Medical Society, September, 2010 – Vol. 83, No 4
Results Minneapolis: Regulatory Services April 24, 2012 22
Environmental Health: Lead Poisoning
20 28 60 38 42 60 77 112
100 1
28
25 55 50 39
127
266
14
174
204 207
142 115
92 79 74 70 70
0
50
100
150
200
250
300
350
400
2004 2005 2006 2007 2008 2009 2010 2011 2012 2013Projected
Lead Poisoned Children and Property Rehabilitation
Lead Poisoning Rehab Prevention rehab Lead Poisoned Children

Results Minneapolis: Regulatory Services April 24, 2012 23
Environmental Health: Lead Poisoning
Regulatory Services was awarded a $2.48 million from HUD. Beginning in 2013, this grant will be used to address lead hazards in the homes of lead poisoned children.
$ 6.8 million
$ 0.08 million $ 0.5 million 0
123456789
101112131415161718192021
2004 2005 2006 2007 2008 2009 2010 2011 2012Estimate
$ in
Mill
ion
s
Costs of Lead Poisoning
Lifetime costs per child poisoned HUD grants General fund and CDBG
This represents the cost of investigation, additional medical care, special education, criminal justice system and loss of lifetime earnings for a lead poisoned child.
357
315 327
252
200 188
208
155
115 93
74 69
27
154
109
86 68 59 72
92 80 72
87 71 67
26
96.3%
Target: 100%
0
10
20
30
40
50
60
70
80
90
100
0
50
100
150
200
250
300
350
400
2000 2001 2002 2003 2004 2005 2006 2007 2008 2009 2010 2011 2012
Annual Inspections of Homes Where Children Have Elevated Blood-lead Levels
# of Children with bll>10 Inspected Homes % of Homes Inspected Target

Why are these measurements important? Environmental Services is increasing its proactive enforcement of environmental issues. Permits allow proactive enforcement of activities that, if done improperly, commonly result in environmental pollution and increased complaints. Such permitted activities include underground storage tank removal, erosion control, well installation, after hours work and outdoor events. Environmental Services issues over 350 erosion control permits per year for land disturbing activities, primarily construction sites. Without proper erosion control, rain will wash soil from these site into the storm system and into our lakes, streams and the Mississippi River. Eroded soil builds up within the City’s storm water sewers and treatment facilities, reducing the system’s effectiveness at preventing flooding and leading to higher maintenance costs. Sediment that reaches our valued water resources smothers aquatic life, carries pollutants and clogs channels, reducing navigability. Effective use of best practices prevents soil from ever leaving a construction site. Environmental Inspectors work with contractors to ensure these practices are used and properly maintained. As we increase inspection oversight there is an initial increase in violations and citations. However, as accountability increases so does compliance resulting in a drop in violations. As violations decrease, fewer follow up inspections are required, saving staff resources. What are the goals of this program and what will it take to achieve them? 2012 – Ensure all Erosion Permits are inspected to federal and local guidelines 2017 – Continue process improvements resulting in greater initial compliance with erosion control standards. In 2011, Environmental Services had its second year of inspecting commercial properties. Increased inspections provided greater oversight to protect our waterways, public infrastructure, and the aesthetics of our neighborhoods. There was a significant decrease in erosion control violations due to steps taken in 2010 and 2011 to increase field presence and the coordination with partners like the Mississippi Watershed Management Organization.
Results Minneapolis: Regulatory Services April 24, 2012 24
Environmental Health: Erosion Control
0
153
94
194
83
0
2
3
5
6
0.0
1.0
2.0
3.0
4.0
5.0
6.0
7.0
0
50
100
150
200
250
300
350
400
2007 2008 2009 2010 2011
Erosion Control Enforcement
Commercial Permits Residential permits Violations Inspections Per Permit

Why is this measurement important? In a vibrant city where people live, work and play, noise pollution from one use can often interfere with other uses. It is important to have an objective, enforceable standard to apply for interactions between homes, entertainment venues and industrial businesses. Noise complaints in the city vary from the low bass tones of bar music to the high pitched mechanical whine of a malfunctioning air conditioner. Objectively addressing noise complaints contributes to the City’s goals of Livable Communities, Healthy Lives and Jobs and Economic Vitality. What is the goal for this program and what will it take to achieve it? 2012 – Reduce number of noise-based complaints and inspections by focusing on a proactive planning approach with city partners. In 2008, Environmental Services rewrote and the City Council approved a new noise ordinance. Starting in 2009, an improved noise protocol was implemented based upon best practice research and the purchase of new sound monitoring equipment. These changes have enabled Environmental Services to resolve long standing noise issues while preventing others from occurring. Inspectors proactively schedule sound monitoring, helping businesses address issues and achieve compliance. Through coordination with the Police Department, Environmental Services is addressing areas with a history of noise complaints. In working with Business Licensing to develop noise mitigation plans for businesses, Environmental Services is being proactive in addressing issues at the most effective point, before they happen. As a result of these proactive inspections, the department has saved resources, cut down on overtime for evening and weekend inspections and more importantly, noise complaints have dropped 12 percent over the previous year. These improvements have also resulted in greater compliance without the issuance of citations. There has been a continuous decline each year since 2008 in the number of complaints (reduced 37 percent) and violations (reduced 56 percent) related to noise in Minneapolis.
Results Minneapolis: Regulatory Services April 24, 2012 25
Environmental Health: Noise Pollution
436 424
312 276
547
500
428
379 243
195
124 108
27 18
9 29
0
50
100
150
200
250
300
0
100
200
300
400
500
600
2008 2009 2010 2011
Noise Complaints and Inspections
Complaints Inspections Violations Citations

Animal Control: Dog Bites & Declarations
Results Minneapolis: Regulatory Services April 24, 2012 26
22 31 32 36 37
10
169 182
200 210
173
41
59 55
20 21 14
2 0
50
100
150
200
250
2007 2008 2009 2010 2011 1st Qtr 2012
Total Declarations, by type
Dangerous Potentially Dangerous Destruct
Narrative on next page…
113 74 87 87
15
453
310
308 284 324
61
453
425
382 371
411
76
0
50
100
150
200
250
300
350
400
450
500
2007 2008 2009 2010 2011 1st Qtr 2012
Animal Bites Annual Comparison
Serious Dog Bites* Dog Bites*YTD Total

Why is this measure important? Aggressive animals not only inflict injuries on individuals, but also undermine the sense of safety in a community. Victims of dog bites are often children. In addition, dangerous dogs can be indicators of underlying criminal activity occurring in a household--such as gangs, drugs, and domestic violence. These dogs are often abused, unsocialized, and unpredictable, which makes them a serious threat to the physical safety of Minneapolis employees and the residents of the communities in which the animals live. What will it take to achieve the target? Animal Care and Control believes that the number of animal bites reported each year will be harder to decrease significantly due to the under-reporting of minor bites, the growing pet population and the fact that where animals and humans coexist there will be bites. Instead, Animal Control gauges the impact of our work on the level of dangerous dog activity by tracking the number of reported bites that represent “Serious Bites.” Serious bites are defined as bites severe enough to warrant a dangerous dog declaration, destruct order, or immediate euthanasia upon owner release. There has been a 20 percent decrease in the number of “serious bites” reported in Minneapolis between 2008, the year this data started being collected, and today. The decrease in serious bites follows the enhancement of dangerous animal ordinances, increased coordination with the City Attorney’s office, and the reorganization of Minneapolis Animal Care and Control resources to focus on aggressive animals. Owners of all declared animals must follow strict animal handling requirements to be able to retain their animals. Individuals with a pattern of owning aggressive animals can have their right to have a dog restricted for a period of five years. In addition, individuals with violent felonies are required to have a permit to own a dog that weighs more than twenty pounds. In 2009, Minneapolis Animal Care and Control started bi-annual compliance checks of all registered declared animals, which revealed a number of animals out of compliance with dangerous animal requirements. All animals were brought into compliance and systems are in place to ensure continued compliance. In 2010, a Minneapolis Police Sergeant was hired by Regulatory Services to work solely on animal related criminal activity including dog fighting and domestic abuse. The culmination of ordinance amendments and revised policies and procedures regarding dangerous animals over the past 4 years has been institutionalized at Minneapolis Animal Care and Control and has resulted in safer communities. One area to note is the increase in Potentially Dangerous Dog declarations. Minneapolis Animal Care and Control follows state law and city ordinance in declaring dogs potentially dangerous and has been particularly aggressive in this area. Animal Care and Control uses the “potentially dangerous” declaration as an ‘early warning system’ to put careless and irresponsible dog owners on notice that they must take seriously the potential their pet has to cause harm.
Animal Control: Dog Bites & Declarations
Results Minneapolis: Regulatory Services April 24, 2012 27
Results Minneapolis: Regulatory Services April 24, 2012 28
Animal Control: Licensed & Unlicensed Stray Outcomes
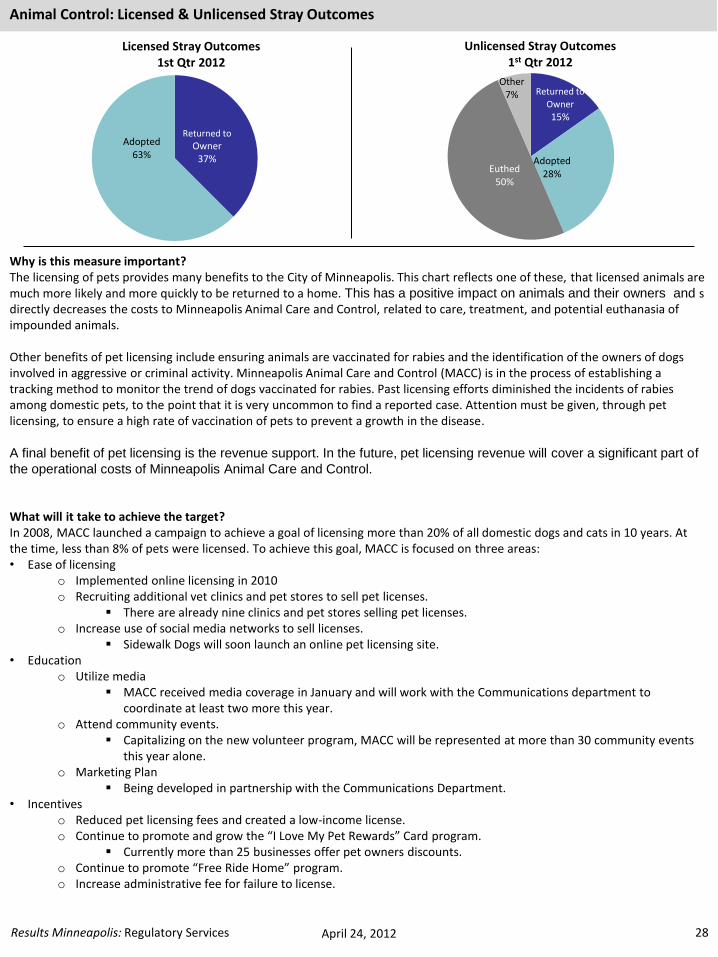
Returned to
Owner 37%
Adopted 63%
Licensed Stray Outcomes 1st Qtr 2012
Returned to
Owner 15%
Adopted 28% Euthed
50%
Other 7%
Unlicensed Stray Outcomes 1st Qtr 2012
Why is this measure important? The licensing of pets provides many benefits to the City of Minneapolis. This chart reflects one of these, that licensed animals are much more likely and more quickly to be returned to a home. This has a positive impact on animals and their owners and s directly decreases the costs to Minneapolis Animal Care and Control, related to care, treatment, and potential euthanasia of impounded animals. Other benefits of pet licensing include ensuring animals are vaccinated for rabies and the identification of the owners of dogs involved in aggressive or criminal activity. Minneapolis Animal Care and Control (MACC) is in the process of establishing a tracking method to monitor the trend of dogs vaccinated for rabies. Past licensing efforts diminished the incidents of rabies among domestic pets, to the point that it is very uncommon to find a reported case. Attention must be given, through pet licensing, to ensure a high rate of vaccination of pets to prevent a growth in the disease. A final benefit of pet licensing is the revenue support. In the future, pet licensing revenue will cover a significant part of
the operational costs of Minneapolis Animal Care and Control. What will it take to achieve the target? In 2008, MACC launched a campaign to achieve a goal of licensing more than 20% of all domestic dogs and cats in 10 years. At the time, less than 8% of pets were licensed. To achieve this goal, MACC is focused on three areas: • Ease of licensing
o Implemented online licensing in 2010 o Recruiting additional vet clinics and pet stores to sell pet licenses.
There are already nine clinics and pet stores selling pet licenses. o Increase use of social media networks to sell licenses.
Sidewalk Dogs will soon launch an online pet licensing site. • Education
o Utilize media MACC received media coverage in January and will work with the Communications department to
coordinate at least two more this year. o Attend community events.
Capitalizing on the new volunteer program, MACC will be represented at more than 30 community events this year alone.
o Marketing Plan Being developed in partnership with the Communications Department.
• Incentives o Reduced pet licensing fees and created a low-income license. o Continue to promote and grow the “I Love My Pet Rewards” Card program.
Currently more than 25 businesses offer pet owners discounts. o Continue to promote “Free Ride Home” program. o Increase administrative fee for failure to license.
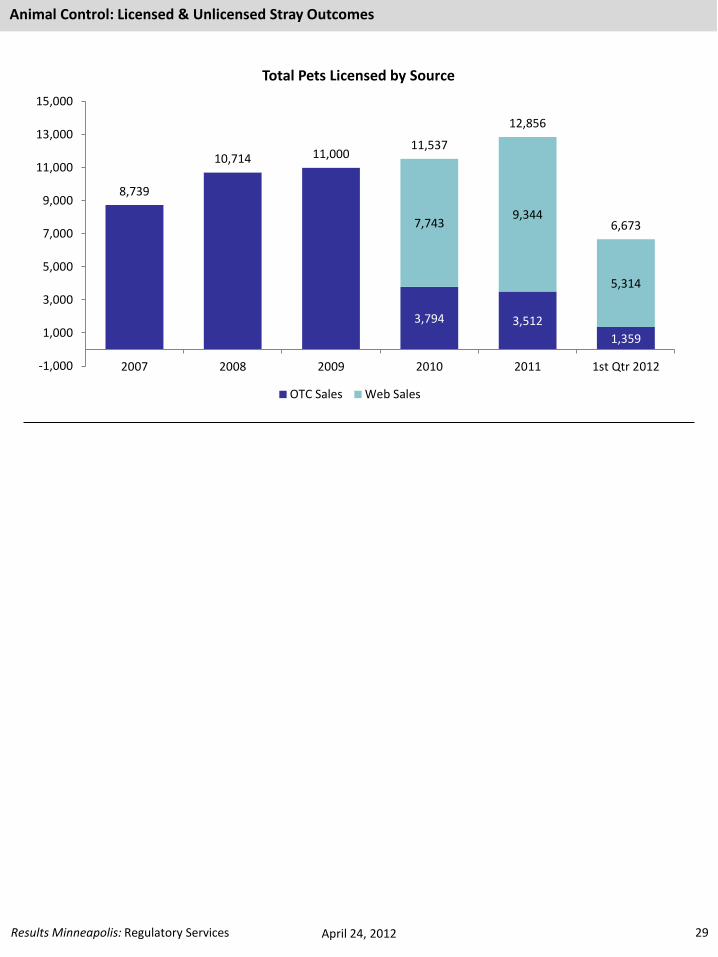
3,794 3,512
1,359
7,743 9,344
5,314
8,739
10,714 11,000 11,537
12,856
6,673
-1,000
1,000
3,000
5,000
7,000
9,000
11,000
13,000
15,000
2007 2008 2009 2010 2011 1st Qtr 2012
Total Pets Licensed by Source
OTC Sales Web Sales
Animal Control: Licensed & Unlicensed Stray Outcomes
Results Minneapolis: Regulatory Services April 24, 2012 29
Results Minneapolis: Regulatory Services April 24, 2012 30
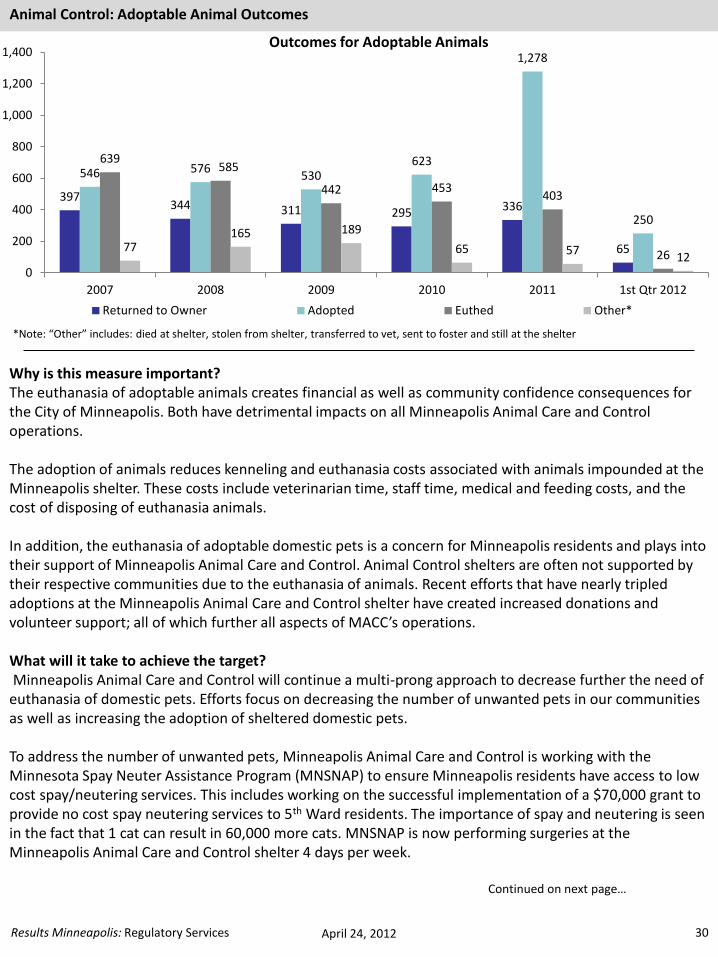
397 344 311 295 336
65
546 576 530
623
1,278
250
639 585
442 453 403
26 77
165 189
65 57 12
0
200
400
600
800
1,000
1,200
1,400
2007 2008 2009 2010 2011 1st Qtr 2012
Outcomes for Adoptable Animals
Returned to Owner Adopted Euthed Other*
*Note: “Other” includes: died at shelter, stolen from shelter, transferred to vet, sent to foster and still at the shelter
Animal Control: Adoptable Animal Outcomes
Why is this measure important? The euthanasia of adoptable animals creates financial as well as community confidence consequences for the City of Minneapolis. Both have detrimental impacts on all Minneapolis Animal Care and Control operations. The adoption of animals reduces kenneling and euthanasia costs associated with animals impounded at the Minneapolis shelter. These costs include veterinarian time, staff time, medical and feeding costs, and the cost of disposing of euthanasia animals. In addition, the euthanasia of adoptable domestic pets is a concern for Minneapolis residents and plays into their support of Minneapolis Animal Care and Control. Animal Control shelters are often not supported by their respective communities due to the euthanasia of animals. Recent efforts that have nearly tripled adoptions at the Minneapolis Animal Care and Control shelter have created increased donations and volunteer support; all of which further all aspects of MACC’s operations. What will it take to achieve the target? Minneapolis Animal Care and Control will continue a multi-prong approach to decrease further the need of euthanasia of domestic pets. Efforts focus on decreasing the number of unwanted pets in our communities as well as increasing the adoption of sheltered domestic pets. To address the number of unwanted pets, Minneapolis Animal Care and Control is working with the Minnesota Spay Neuter Assistance Program (MNSNAP) to ensure Minneapolis residents have access to low cost spay/neutering services. This includes working on the successful implementation of a $70,000 grant to provide no cost spay neutering services to 5th Ward residents. The importance of spay and neutering is seen in the fact that 1 cat can result in 60,000 more cats. MNSNAP is now performing surgeries at the Minneapolis Animal Care and Control shelter 4 days per week. Continued on next page…

February 22, 2011 31
For animals that do find their way to the shelter, Animal Care and Control will continue to grow adoption rates by: Rescue Groups -
• Recruit, screen, and utilize additional animal rescue groups. At no cost to the City of Minneapolis, rescue groups foster sheltered animals and place them in new homes.
o Since 2009, Minneapolis Animal Care and Control has nearly doubled the number of approved rescue groups – from 16 to 30.
Public Awareness - • Increasing public awareness of the ability to adopt quality animals at the Minneapolis shelter.
o Minneapolis Animal Care and Control hosted shelter events and obtained significant media coverage to highlight animal adoptions at the shelter in 2011.
o Continue the “Pet of the Week” program which taps into the power of social media. Animals identified for “Pet of the Week” are placed on the city’s website, a “Friends of MACC” website, and also sent out through various volunteer networks. 95 percent of “Pet of the Week” animals were adopted in 2011.
Partnerships - • Continue to strengthen the partnership with the Animal Humane Society.
o Nearly every Wednesday, the Humane Society pulls animals from the shelter; taking more than 200 animals in 2011.
Animal Control: Adoptable Animal Outcomes

Results Minneapolis: Regulatory Services April 24, 2012 32
Appendix

Results Minneapolis: Regulatory Services April 24, 2012 33
33
18
11
16
9 8 9 7 7 3
0
5
10
15
20
25
30
35
2005 2006 2007 2008 2009
Metro Area Ozone and Minneapolis Particulate Matter (in number of days)
Exceeded CASAC ozone levels Exceeded CASAC PM 2.5 levels
Source: Minnesota Polution Control Agency Based on Minnesota's annual 183-day ozone season from April 1 to September 30
0
0.5
1
1.5
2
2.5
3
2006 2007 2008 2009 2010
Co
nce
ntr
atio
n (
ug/
m3
)
Average Benzene and Formaldehyde Concentrations All Test Sites
Source: Minnesota Pollution Control Agency
Benzene concentration Benzene health benchmark
Formaldehyde concentration Formaldehyde health benchmark

6 4
5
2
28
24
14
10
3 3 4
7
4
0
5
12
19
6
0
5
10
15
20
25
30
2006 2007 2008 2009 2010 2011
Number of Renewable Energy Projects Citywide
Solar Photovoltaic Solar Thermal Geo Thermal
Results Minneapolis: Regulatory Services April 24, 2012 34
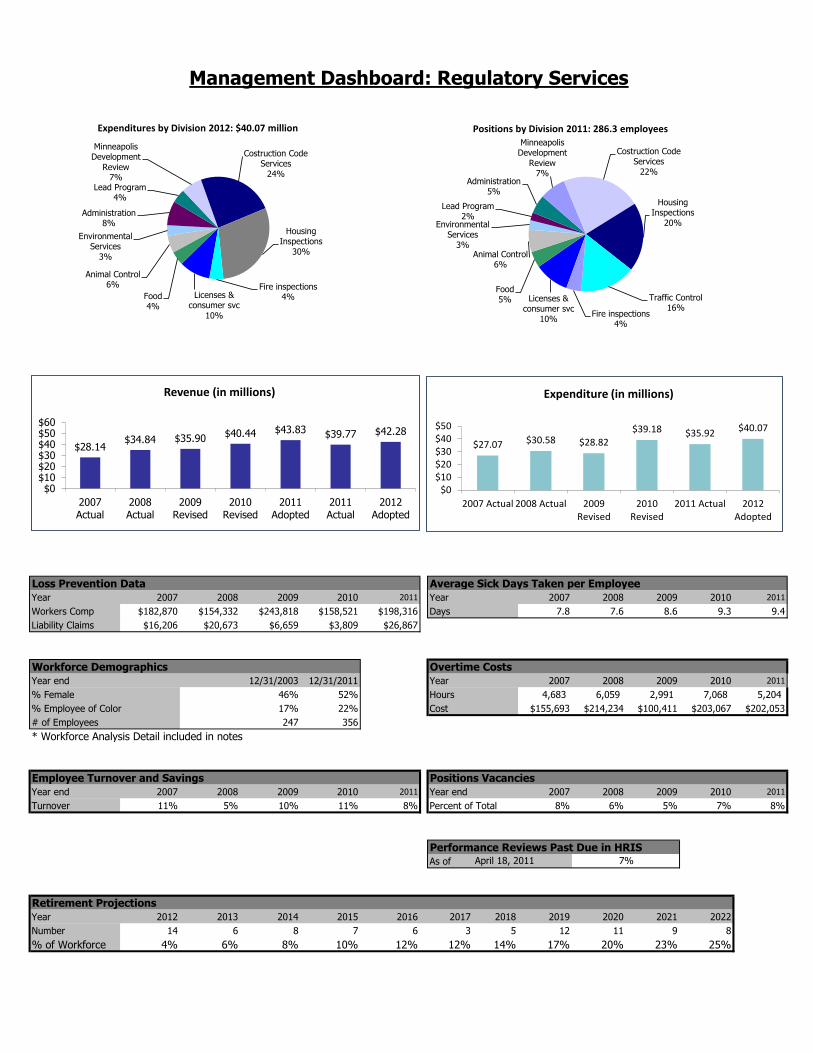
Loss Prevention Data Average Sick Days Taken per Employee
Year 2007 2008 2009 2010 2011 Year 2007 2008 2009 2010 2011
Workers Comp $182,870 $154,332 $243,818 $158,521 $198,316 Days 7.8 7.6 8.6 9.3 9.4
Liability Claims $16,206 $20,673 $6,659 $3,809 $26,867
Workforce Demographics Overtime Costs
Year end 12/31/2003 12/31/2011 Year 2007 2008 2009 2010 2011
% Female 46% 52% Hours 4,683 6,059 2,991 7,068 5,204
% Employee of Color 17% 22% Cost $155,693 $214,234 $100,411 $203,067 $202,053
# of Employees 247 356
* Workforce Analysis Detail included in notes
Employee Turnover and Savings Positions Vacancies
Year end 2007 2008 2009 2010 2011 Year end 2007 2008 2009 2010 2011
Turnover 11% 5% 10% 11% 8% Percent of Total 8% 6% 5% 7% 8%
Performance Reviews Past Due in HRIS
As of
Retirement Projections
Year 2012 2013 2014 2015 2016 2017 2018 2019 2020 2021 2022
Number 14 6 8 7 6 3 5 12 11 9 8
% of Workforce 4% 6% 8% 10% 12% 12% 14% 17% 20% 23% 25%
Management Dashboard: Regulatory Services
7%April 18, 2011
Licenses & consumer svc
10%
Food 4%
Animal Control 6%
Environmental Services
3%
Administration 8%
Lead Program 4%
Minneapolis Development
Review 7%
Costruction Code Services
24%
Housing Inspections
30%
Fire inspections 4%
Expenditures by Division 2012: $40.07 million
$28.14 $34.84 $35.90 $40.44 $43.83 $39.77 $42.28
$0$10$20$30$40$50$60
2007Actual
2008Actual
2009Revised
2010Revised
2011Adopted
2011Actual
2012Adopted
Revenue (in millions)
$27.07 $30.58 $28.82 $39.18 $35.92 $40.07
$0$10$20$30$40$50
2007 Actual 2008 Actual 2009Revised
2010Revised
2011 Actual 2012Adopted
Expenditure (in millions)
Licenses & consumer svc
10%
Food 5%
Animal Control 6%
Environmental Services
3%
Lead Program 2%
Administration 5%
Minneapolis Development
Review 7%
Costruction Code Services
22%
Housing Inspections
20%
Traffic Control 16%
Fire inspections 4%
Positions by Division 2011: 286.3 employees

Updated 4/20/11
Notes:
Average Sick Days taken per Employee
Notes:
(1) Above data is based on the payroll calendar year not the calendar year.
(2) Does not include employees who have separated from the department and may have used sick leave during the payroll year.
(2a) Does not include employees who were in a suspended ("S") Pay Status at the end of a given payroll year.
(2b) Includes employees who are in a paid ("P") Leave of Absence status and an unpaid Leave of Absence status ("L").
(3) Employees can use more sick leave than earned in a given year (Assuming that they have accrued leave that has carried over).
(4) Work Days Lost = Hours Used/Eight (8)
(5) Usage Rate = Hours Used/Hours Earned
(6) Overstated as it assumes everyone is FT and worked the entire year.
(7) 2003, 2004 and 2005 data includes Traffic Control which became part of the Police Department through December 31, 2009.
(8) 2009 data does not include Traffic Control
(9) 2009 had 27 pay periods
(10) 2010 data includes Traffic Control. It does not include 911
Overtime Costs
A) OT amount - Fiscol. Reconciled with CRS and Data ware house queries.
B) Hours - based on HRIS management reports with payroll data
Workforce Demographics
A) Includes employee counts at year’s end for 2003 and 2007.
B) Only includes active FT regular employees.
Workforce Analysis Detail
3 of 8 categories indicate under-utilization:
Professional 70 incumbents Female = 50.0% Avail. = 52.0%
Technician 93 incumbents Female = 30.1% Avail. = 58.3%
Protect Svc. (non-sworn) 11 inumbents Female = 36.4% Avail. = 67.5% ; POC = 0.0% Avail. = 6.3%
Employee Turnover and Savings
A) Turnover Savings= $Budgeted (personnel) - $Actual (personnel)
Position Vacancies
A) Includes only budgeted positions.
Retirement ProjectionsA) The projected time an employee is eligible to retire is based on service time in HRIS. For employees who received pension service credit in other
organizations, the actual year of retirement eligibility may be sooner than the projections show.

Management Dashboard: Regulatory Services