regulating industrial water pollution in america - resources for the
TRANSCRIPT

Regulating Industrial Water Pollution in the United States
Winston Harrington
April 2003 • Discussion Paper 03-03
Resources for the Future 1616 P Street, NW Washington, D.C. 20036 Telephone: 202–328–5000 Fax: 202–939–3460 Internet: http://www.rff.org
© 2003 Resources for the Future. All rights reserved. No portion of this paper may be reproduced without permission ofthe authors.
Discussion papers are research materials circulated by their authors for purposes of information and discussion. They havenot necessarily undergone formal peer review or editorial treatment.
Regulating Industrial Water Pollution in the United States
Winston Harrington
Abstract
The performance of the industrial point-source water pollution abatement program in the U.S. Clean Water Act is examined. I begin with a brief description of the statute and then turn to a description of the process used to develop the rules that govern effluent discharges. This is followed by a discussion of the outcomes resulting from efforts to apply these rules to industrial pollutant sources. Two types of outcomes are considered: administrative outcomes and outcomes in the water. Last, the issue of implementation is discussed: how the Clean Water Act may have affected the incentives governing the behavior of industrial dischargers, municipal waste treatment plant operators, and regulators. Surprisingly, there is some evidence that the Clean Water Act, at least as far as industrial point sources are concerned, may be evolving into an effluent fee policy, or at least a mixed policy.
Key Words: effluent guidelines, indirect dischargers, water quality.
JEL Classification Numbers: Q25, Q28

Contents
The Clean Water Act .............................................................................................................. 1
Developing Regulations for Industrial Point Sources.......................................................... 3
Discharge Requirements for POTWs.................................................................................. 4
Direct Discharges from Industrial Plants............................................................................ 5
Indirect Discharges from Industrial Plants ......................................................................... 6
Rulemaking Outcomes............................................................................................................ 8
Administrative effort........................................................................................................... 9
Regulatory output.............................................................................................................. 10
Regulatory stringency ....................................................................................................... 12
Abatement Costs ................................................................................................................... 13
Incremental costs and economic impact ........................................................................... 13
Comparison of Ex ante and Ex post Cost Estimates......................................................... 14
Patterns of abatement investment ..................................................................................... 16
Real Outcomes....................................................................................................................... 20
Have pollutant discharges from point sources been reduced? .......................................... 20
Has water quality improved? ............................................................................................ 21
Long-Run Responses of Point Sources to the Clean Water Act ....................................... 22
The Legacy of the POTW Construction Grants Program................................................. 23
Trends in Direct and Indirect Discharge........................................................................... 25
The Spread of Waste-Based Sewer Surcharges ................................................................ 26
Are Waste-Based Surcharges Effluent Fees? ................................................................... 27
Conclusion ............................................................................................................................. 29
References.............................................................................................................................. 34
Regulating Industrial Water Pollution in the United States
Winston Harrington∗
The Clean Water Act
The principal instrument governing efforts to improve and maintain water quality in the nation’s streams and lakes is the Clean Water Act (33 U.S.C. Chapter 26). Water quality became a mainly federal responsibility in 1972, with the passage of the Water Pollution Control Act Amendments of 1972 (P.L. 92-500).
Prior to 1972, water quality was primarily a state and local concern, and the federal government’s role was limited to providing grants to municipalities for wastewater treatment—the grants began in 1956—as well as information and planning assistance to the states. At the time, the states’ approach to water quality was use-based; water bodies were classified according to the highest desired use, and water quality standards were set accordingly. Implicitly, waste disposal and transport was accepted as one of the legitimate uses of the nation’s water resources. By 1970, however, a strong consensus felt that this approach had not prevented the steady decline in water quality throughout the country. Several well-publicized examples of poor water quality in the late 1960s, culminating in an incident on June 22, 1969, in which an oil slick on the Cuyahoga River near Cleveland caught fire, dramatized what appeared to be a growing problem. (On the other hand, the first National Water Quality Inventory, conducted by the Environmental Protection Agency (EPA) in 1973, found that in general water quality had improved in the preceding decade, at least in terms of fecal bacteria and organic matter (CEQ 1976)).
The new federal approach set as a national goal nothing less than the elimination of pollutant discharges into the nation’s waters by 1985. This “zero-discharge” goal did not refer to effluent itself, but to the pollutants in effluent. But it meant that, in the long run, waste disposal and assimilation was no longer to be an acceptable use of water resources. Two interim goals were set: the nation’s waters were to be “fishable and
∗ Senior Fellow, Resources for the Future, Washington, D.C. The author gratefully acknowledges support from the Smith Richardson Foundation and the National Center for Environmental Economics, U.S. Environemental Protection Agency.
Resources for the Future Harrington
swimmable” by 1983, and toxic pollutants in amounts harmful to human activities or aquatic ecosystems were to be eliminated.
The Clean Water Act relied primarily on two tools to achieve these goals: First, the Construction Grants Program would provide massive federal support to publicly owned treatment works (POTWs)—wastewater treatment plants owned and operated by municipalities and local sewer districts. These grants would pay 75% of the construction cost of new wastewater treatment plants, or for expansion of existing plants.1 The Construction Grants Program was in operation from 1973 to 1988, and, over its lifetime, paid out grants of $60 billion. It was replaced by a revolving loan fund.
The second tool was a system of technology-based regulations governing the discharge of water pollution from point sources. These point sources included both POTWs and two classes of industrial facilities: direct dischargers, which discharge effluent directly into receiving waters; and indirect dischargers, which discharge effluent into a sewer, where it is carried to a POTW. The industrial standards are the focus of this investigation, and we describe them in more detail in the next section.
The Clean Water Act was amended in 1977 and again in 1987 to extend the deadlines for promulgation of and compliance with the standards. In addition, in 1987 the EPA was ordered to promulgate effluent guidelines for additional point source categories.
The Clean Water Act was in the vanguard of a major change in the federal government’s regulation of economic activity. Up until the late 1960s, federal regulation tended to be economic, concerned with such matters as regulating the prices of goods or services produced by industries thought to be natural monopolies and whose activities crossed state lines. These included railroads, airlines, and transmission of natural gas and electricity. Federal regulation also restricted activities of banks and sought to prevent excessive concentrations of market power. The seventies began a period of “social regulation,” concerned with workplace safety and health, environmental quality, exposure to hazardous chemicals, unsafe consumer products, and like concerns. Ironically, as social regulation waxed, economic regulation waned, with deregulation of airlines, trucking, railroads, banking, and, currently in progress, electricity.
1 In addition to these federal funds, several states contributed matching funds to the capital costs of municipal wastewater treatment plants. Maryland, for example, contributed an additional 5 percent.
2

Resources for the Future Harrington
Developing Regulations for Industrial Point Sources
For point sources, the backbone of the regulation is the National Pollutant Discharge Elimination System (NPDES), which requires permits of all significant dischargers of wastewater into surface waters. These permits state the effluent discharge limits the source must meet, usually in terms of kilograms of pollutant per day. The dischargers affected include both industrial plants and POTWs, which are mostly owned by municipalities or special sanitary districts and are designed to treat domestic waste.
The specific requirements in the permits are determined by a complex system of regulation that begins with federally established Effluent Guidelines.2 The guidelines establish a set of technology-based performance standards that all point sources must meet, except where water quality considerations demand even more stringent standards.3 The guidelines are very detailed, breaking industrial plants into a very large number of categories, each with its own set of pollutant-specific regulations.
The technology-based Effluent Guidelines could not guarantee achievement of adequate water quality in all receiving waters, so permit writers were required to set even more stringent “water-quality-limited” standards for plants discharging into such water bodies. These standards necessarily depended on the current conditions of the receiving water body and its capacity to absorb waste. Also, the effluent limitations for any firm affected and were affected by the effluent limitations on all other firms.
The front-line administration of this program—i.e., the writing of the NPDES permits and the routine monitoring and enforcement of permit requirements—could be delegated, to appropriate state agencies upon demonstration of sufficient legal and institutional capacity for the job. At present, nearly all the states have delegated programs. The state departments of environmental quality (DEQs)4 are supervised by the 10 EPA regional offices.
2 42 CFR 403. Statutory authority for the Effluent Guidelines is found in the Clean Water Act (33 U.S.C. Chapter 26). 3 Technology-based standards are effluent limits for dischargers that are based on the performance of a designated abatement technology, without consideration of the environmental or social problem caused by the discharges. 4 This is a convenient generic term. Actual state names for the agencies responsible for environmental quality are quite varied.
3

Resources for the Future Harrington
Discharge Requirements for POTWs
Before turning to industrial point sources, we first describe the effluent discharge policy for POTWs, which also had to obtain NPDES permits. POTWs have an important influence on the industrial point source program. As noted above, many industrial plants—the indirect dischargers—discharge wastewater into sewers connected to POTWs. This gives POTWs the dual role of regulator and service provider for indirect discharging plants.
There are separate sets of guidelines for POTWs designed expressly for the treatment of household waste, which consists of about 100 gallons per person per day of organic waste rich in fecal bacteria and containing about 300 milligrams per liter (mg/l) each of biochemical oxygen demand (BOD) and total suspended solids (TSS), plus varying amounts of organic phosphorus and nitrogen. In 1972, most municipal wastewater treatment plants had “primary treatment”—use of physical processes (e.g., skimming, screening, settling)—capable of about 65% removal of BOD and TSS. Some also had in addition “secondary treatment,” a biological process that raised removal efficiency to 80–90%, or a waste concentration of about 15–30 mg/l. One of the goals and eventual achievements of the Clean Water Act was to implement secondary treatment throughout the United States and “tertiary” or advanced waste treatment processes where needed to meet water quality standards.
The typical restrictions contained in an NPDES permit for a POTW are as follows:
• Specific limitations on both conventional and nonconventional pollutants in both wastewater and sludge,5
• Toxic pollutant limitations, • Criteria on acceptable uses for sludge, • Removal efficiency requirements (e.g., 85% removal of BOD), and • Other operating requirements to ensure effective operation and maintenance.
5 Conventional pollutants include biochemical oxygen demand (BOD) and total suspended solids (TSS). BOD is the amount of dissolved oxygen that will be consumed in the water by the pollutant. EPA has identified 15 “pollutants of concern” that are often found in sludge and wastewater from POTWs. These include the “conventional pollutants” BOD, TSS, and ammonia, plus 12 metals such as arsenic and mercury. The POTW is also required to be on the lookout for other pollutants that may be local problems.
4

Resources for the Future Harrington
Direct Discharges from Industrial Plants
In the 1972 Act, Congress directed the EPA to prepare guidelines for 30 designated industries.6 These were major industries such as pulp and paper, organic chemicals, seafood, and fruit and vegetable processing. As noted above, the standards were supposed to be technology-based. Congress in fact specified several different kinds of standards: First was best practicable technology (BPT), which all plants in affected industries were to adopt by mid-1977. Congress did not define “practicable,” but the EPA appeared to rely on two rules of thumb: Where applicable, BPT meant secondary or biological treatment, and otherwise it would represent the best standard of treatment currently found in the industry. More stringent were the best available technology economically achievable, or BAT, standards, which were to be installed by mid-1983. Still more stringent were the new source performance standards (NSPS), which were to be applied to new plants seeking permits after the standards were promulgated. As mentioned above, for indirect dischargers there were also two sets of pretreatment standards, for new and existing sources. For each set of standards, at least two pollutants were regulated, and usually four or more.
For example, Table 1 shows the final BPT regulations for dairies, which are in several ways typical of all Effluent Guidelines. There are many subcategories, and acceptable pollutant discharge rates vary significantly among them. Besides BOD there are seven other BPT standards, but each is related to the BOD standard by a fixed numerical rule. The table shows four for BOD and four for TSS, each with a 30-day average and one-day maximum standard for large and small facilities In other words, the number of subcategories means that preparing the rules is very time-consuming and data-hungry, but perhaps not quite as much so as eight sets of standards per subcategory would suggest. The table shows no BAT or NSPS rules, but such rules show similar patterns.
6 In addition, EPA concluded in 1974 that 18 more industries required Effluent Guidelines. The total number of industries with guidelines today is about 65.
5

Resources for the Future Harrington
6
Table 1. BPT Regulations for the Dairy Point Source Category
BOD 30-day standard, large facilities (kg per 1000 kg of BOD5 input)
Receiving Stations 0.190 Fluid Products 1.350 Cultured Products 1.350 Butter 0.550 Cottage Cheese and Cultured Cream Cheese 2.680 Natural and Processed Cheese 0.290 Fluid Mix for Ice Cream and Other Frozen Desserts 0.880 Ice Cream, Frozen Desserts, and Dairy Desserts 1.840 Condensed Milk 1.380 Dry Milk 0.650 Condensed Whey 0.400 Dry Whey 0.400
Other limits To get the limits in each subcategory for the standards
below, Multiply the number above
by Large facility BOD one-day maximum discharge 2.5 Large facility TSS 30-day average 1.5 Large facility TSS one-day maximum discharge 3.75 Small facility BOD 30-day average 1.67 Small facility BOD one-day maximum discharge 3.33 Small facility TSS 30-day average 2.5 Small facility TSS one-day maximum discharge 5 pH limitation, all plants 6.0 to 9.0
Indirect Discharges from Industrial Plants
Household wastes show little variation from one day to the next, at least in comparison to industrial wastewater, and POTW designs take advantage of this characteristic. Much industrial waste is similar in important ways to domestic waste; for example, the food and paper industries have waste streams that are primarily organic. Thus many industrial wastes can potentially be treated in POTWs. However, industrial
Resources for the Future Harrington
wastewater can also cause serious problems for POTWs. Toxic material or highly acidic or alkaline material can disrupt the microbial ecology of the waste treatment plant, reducing its efficiency. Other wastes, toxic or otherwise, can pass through the plant unaffected and pose a direct public health risk or a threat to aquatic ecosystems. Still other wastes, such as alcohol, might be treatable but pose a threat of fire or explosion within the sewer itself. Finally, some industrial wastes could be too clean. Cooling water, for example, would simply add to the flow of the plant, diluting the waste stream and making pollutant abatement more difficult and costly.
The pretreatment guidelines (40 CFR Part 403) were designed to assist POTWs in dealing with the above problems. They contain instructions for setting up a pretreatment program, plus specific prohibitions against industrial discharge of wastes that would harm the POTW or that would pass through it unscathed. In addition, the guidelines established technology-based pretreatment standards for the quality of wastewater sent to a POTW from certain industrial categories. For other industries, the standard for pretreatment were to be set at the local level. In states where permit responsibility had been delegated, the state DEQs could further delegate responsibility for writing and enforcing permits to the local POTW. Nearly all states have done so.
In addition, the Effluent Guidelines for each industry contain pretreatment standards for new and existing plants discharging into sewers. These standards were designed to prevent industrial discharges from interfering with plant operations and to limit pass-through of untreated pollutants to what a direct discharging plant would be allowed under the BAT standards.
Headworks analysis
To set the local limits for pollutant discharge by industries, the POTW conducts a “headworks analysis,” or an estimate, pollutant by pollutant, of the total waste loading that the plant can safely accept from non-household sectors. An EPA guidance document (U.S. EPA 2001) provides detailed instructions on the preparation of the headworks analysis, and recommends that it be revisited every year. The headworks analysis begins with an estimate of allowable waste discharge into the environment, either in the plant effluent or the sludges. The allowable effluent discharge is generally taken from the NPDES permit. The POTW may have more discretion on sludge composition. If the plant wishes to produce sludge that is salable, for example, the permissible loading of toxic materials is much lower than it otherwise might be. Given the permissible discharge of each pollutant, getting the permissible influent at the headworks requires
7

Resources for the Future Harrington
knowledge of the total removal efficiency of each pollutant by the plant. Calculation of these removal efficiencies is thus central to the headworks analysis.
Next, the POTW estimates waste discharges from waste haulers, such as septic tank cleaners, and other wastes that may be delivered by truck, and from “uncontrolled sources,” perhaps small commercial operations that are difficult to control. These wastes are subtracted, pollutant-by-pollutant, in their entirety from the plant’s “maximum allowable headworks loading.” From the remainder, the POTW further subtracts a safety margin to allow for contingencies and a growth allowance. What is left is the waste load that can be allocated to nonhousehold users, or in EPA terminology, the maximum allowable industrial loading (MAIL).
Now the POTW must allocate the allowable discharges for each pollutant to the industrial users. Evidently, the most common allocation method is to set “uniform-concentration local discharge limitations,” which, “have become synonymous in the Pretreatment Program with the term local limits,” according to the EPA Guidance (U.S. EPA 2001 p. 6-3). In this method, the allowable discharges of each pollutant are allocated to users so that the limits, expressed in terms of pollutant concentration, are the same for each pollutant.
Although this is apparently the most common method chosen, it is not required. EPA guidance and regulations do not, for example, rule out the use of marketable permits to allocate the MAIL, much as emission offsets and ultimately cap-and-trade programs grew out of aggregate emission limits in nonattainment areas of the Clean Air Act. And yet, there has apparently been little if any use of tradable permits in this context anywhere in the country. Apparently the only tradable permit program currently in use for the allocation of local limits in POTWs is found in Passaic, New Jersey.7
Rulemaking Outcomes
In this section and the next, we consider two classes of outcomes of the Effluent Guidelines process. In this section we discuss what may be called the rulemaking outcomes, or the administrative outputs of the process. In the next section, we turn to the “real” outcomes, the effectiveness of the effluent limitations on the ground and their actual cost.
7 For a description of this program, see Industrial Economics (1998).
8

Resources for the Future Harrington
Administrative effort
One of the charges raised against the use of command-and-control (CAC) policy instruments is the supposed administrative effort required to implement the standards. This is a rather sweeping complaint, considering the great variety of CAC policies. In the case of the Effluent Guidelines, however, it seems to be a valid concern. Especially in the writing of the direct discharge standards, the program imposed large costs, not only on the agency, but also on other interested parties, such as affected firms, trade associations, and environmental groups. The costs were incurred when these affected parties made extensive comments on proposed regulations and, frequently, challenged final regulations in court.
Obviously, establishing the Effluent Guidelines was an enormous task for the young agency. Not only did it have to give operational meaning to words like “best,” “practicable,” and “economically achievable,” it also had to collect a vast amount of information about each industry to be regulated—including information about production techniques, location, waste products, and waste treatment technology. Moreover, the agency started out with a very narrow information base on these matters. In contrast to the older style of economic regulation practiced in the Federal Power Commission or the Interstate Commerce Commission, where regulators dealt with a single industry over a number of years, the EPA had to deal with the full range of manufacturing in the American economy.
The information requirements were exacerbated by another factor. Very early in the standard-setting process, the EPA became aware that the great heterogeneity in the products and processes of each of the 30 industries would preclude use of the same standards for all plants in that industry. Each industry, therefore, had to be subcategorized into generally homogeneous subsets for purposes of water pollution regulation. The number of subcategories was quite large (e.g., 20 in dairies, 9 in sugar, 105 in fruits and vegetables). In all, EPA created over 360 industrial subcategories among the first 30 industries requiring Effluent Guidelines. Each required separate BPT, BAT, NSPS, and pretreatment regulations.
To collect and organize the mass of information required to set these standards, EPA hired a number of consulting firms. Most of these firms had industry ties, which was an asset in winning the cooperation of the firms to be regulated, but it also raised concerns in some quarters about the contractors’ closeness to the industry. The contractors had the task of preparing “development documents” containing information
9
Resources for the Future Harrington
on the structure of the industry, its production and waste treatment technologies, the estimated cost of pollution abatement, and suggested effluent standards.
The development document with these suggested standards were taken under study by the EPA and often circulated among industry sources for comment. Soon thereafter, the agency would issue the proposed standards. As noted above, interested parties had the opportunity to submit additional information and make comments on the regulation during a comment period lasting several months. EPA took these comments and, after some further time had elapsed, would issue final standards.
In promulgating the Effluent Guidelines, the agency had to follow the procedures of informal or “notice-and-comment” rulemaking as specified in the Administrative Procedures Act (5 USC 553). The APA requires the agency to give notice of proposed rulemaking, propose regulations, and allow a 60- to 90-day period for interested parties to make comment before promulgating final regulations. The EPA received many comments on the proposed Effluent Guidelines, and was required to answer each comment in the Federal Register.
Finally, the regulations were often challenged in court. As of 1976, the National Commission on Water Quality (1976) reported that over 250 lawsuits had challenged specific guidelines. Every set of guidelines faced litigation.
Regulatory output
Initial BPT standards
Given the difficulties of promulgating the standards, it is not surprising that the promulgation of the Effluent Guidelines fell behind the schedule set by Congress. Indeed, not one of the original 30 sets of guidelines was issued within the statutory deadline of one year. However, it is probably more appropriate to view this as a consequence of impossible deadlines set by Congress, rather than regulatory dawdling by the EPA. It should be clear from the procedural and analytical requirements, not to mention the necessity of collecting and responding to public comments, that the EPA’s task was impossible within the statutory limitation and the resources available to it.
By any other standard, the Effluent Guidelines process was remarkably productive in terms of regulations written. Compared to other new rulemaking processes that were going on at approximately the same time, including health and safety regulation at the Occupational Safety and Health Administration (OSHA), hazardous substance
10

Resources for the Future Harrington
regulation under the Toxic Substances Control Act (TSCA), and regulation of consumer product safety at the Consumer Product Safety Commission, many more regulations were written for the Effluent Guidelines program than for any other program (Magat et al. 1986).
BAT standards
Amendments to the Clean Water Act in 1977 modified the BAT standards to focus on toxic discharges and devised a new set of standards called best conventional technology” (BCT) to designate more advanced abatement of conventional pollutants than that provided by the BPT standards. According to Adler et al. (1993), the EPA had difficulties writing new BAT toxics regulations or revising existing BAT regulations so as to reflect the new orientation on toxics. In 1987, further amendments to the Clean Water Act directed the EPA to prepare a plan indicating how it would comply with the BAT requirements. When the plan was unveiled in early 1988, the Natural Resources Defense Council (NRDC) sued, leading to a consent decree in which EPA agreed to prepare over 20 new BAT regulations in the next 10 years. As of 1992, the NRDC estimates that only one-third of all direct dischargers had permits based on the BAT standards. The other two-thirds were in categories for which no standards were written and had permits based on the “best professional judgment” (BPJ) of the permit writer (Adler et al. 1993).
Zero discharge
As a step toward meeting the zero-discharge goal, the BAT standards were to “result in further progress toward the national goal of eliminating the discharge of all pollutants … [and] require the elimination of all discharges if … such elimination is technically and economically feasible” (Sec. 301(b)(2)(A)). Sec. 304(b)(3) requires the EPA to “identify control measures and practices available to eliminate the discharges of pollutants from classes and categories of point sources.”
Inasmuch as complete elimination of all discharges would seem to be an impossible task, since 1972 there has been confusion and dispute over the meaning of the zero-discharge goal and how to make it operational. Adler et al. (1993) argue that the point of zero discharge was what we now call pollution prevention: the reduction, elimination, or capture of pollutants before they enter the wastewater stream. They strongly criticize the EPA for failing to implement the portions of the Clean Water Act
11

Resources for the Future Harrington
relating to zero discharge. BAT retains to this day an end-of-pipe focus, and the EPA has issued zero-discharge regulations in very few industrial categories.
Regulatory stringency
The moral premise underlying the Effluent Guidelines and other technology-based standards was that polluters ought to do their “best” to reduce waste discharges. Operationally, what was best was to be based on the technological possibilities, as determined by disinterested experts at the EPA and elsewhere. Seemingly, this language did not permit much bargaining between the agency and the regulated sources of pollution. In fact, of course, standard setting was never so cut-and-dried. For BPT standards in industries discharging organic waste, for example, EPA’s contractors first set the standard in each industry at what was considered secondary treatment, or about 20 mg/l for BOD and TSS. These concentrations were converted into quantity discharge standards, generally expressed in pounds of pollutant per thousand pounds of output, using data supplied by the industry or otherwise obtained by the contractors on water use and production.
The standards in the development document underwent substantial and systematic change before being released as final standards. Among the first 30 industries, the BPT standards for BOD and TSS increased on average by 44% and 92%, respectively. (Of course, there is another way of looking at the change. If a standard initially called for 90% reduction of a pollutant, a 92% increase in the standard would still result in an 81% reduction.). Only for a small number of subcategories were the final standards tighter than the contractor or proposed standards.
These results might seem to suggest that the affected industries were able to intervene to influence the content of the regulations in a way favorable to their interests. However, a statistical analysis of the BPT rulemaking experience by Magat et al. (1986) found otherwise. Magat et al. examined the effect on the BPT regulations of a number of “external signals,” including the number of comments received from industrial sources on the regulation, the political and economic power of the industry affected, and warnings or projections of unemployment or plant closures, and found none that were statistically significant.
Instead, they found that a number of internal variables, including document quality and staff turnover, were much more important in explaining outcomes. The researchers made their own ex ante assessments of the quality of the development
12

Resources for the Future Harrington
documents and economic analyses, based primarily on whether information presented was internally consistent and whether calculations could be replicated. They found that when the development document failed their quality test, the resulting BPT standards were 33% weaker for BOD and 44% weaker for TSS than they would have been had the document been stronger. Turnover during the process was associated with a weakening of the standards of 33% (BOD) and 68% (TSS).
Abatement Costs
One of the most important barriers to analysis of regulatory instruments is the great difficulty of getting good estimates of the cost of compliance, especially ex post. Ex ante estimates are a little easier to come by because, since the 1970s, federal rulemakers have been required either by agency policy or by presidential executive order to prepare estimates of the cost of compliance. From the very first rules promulgated in the Effluent Guidelines program, the agency estimated costs of compliance.
Incremental costs and economic impact
At the time the regulations were prepared, the focus was not on cost-effectiveness, but on the aggregate effects of regulations on the rate of inflation and the level of economic activity. Nonetheless, the development documents prepared to support the individual regulations did contain fairly detailed data on abatement costs of “model plants” of various output capacities and levels of abatement. From these development documents, researchers at RFF were able to construct rudimentary incremental abatement cost functions that would yield estimates of the cost of compliance with the regulations. These cost functions show that against a goal of minimizing total discharges of BOD and TSS, the Effluent Guidelines were far from cost-effective.
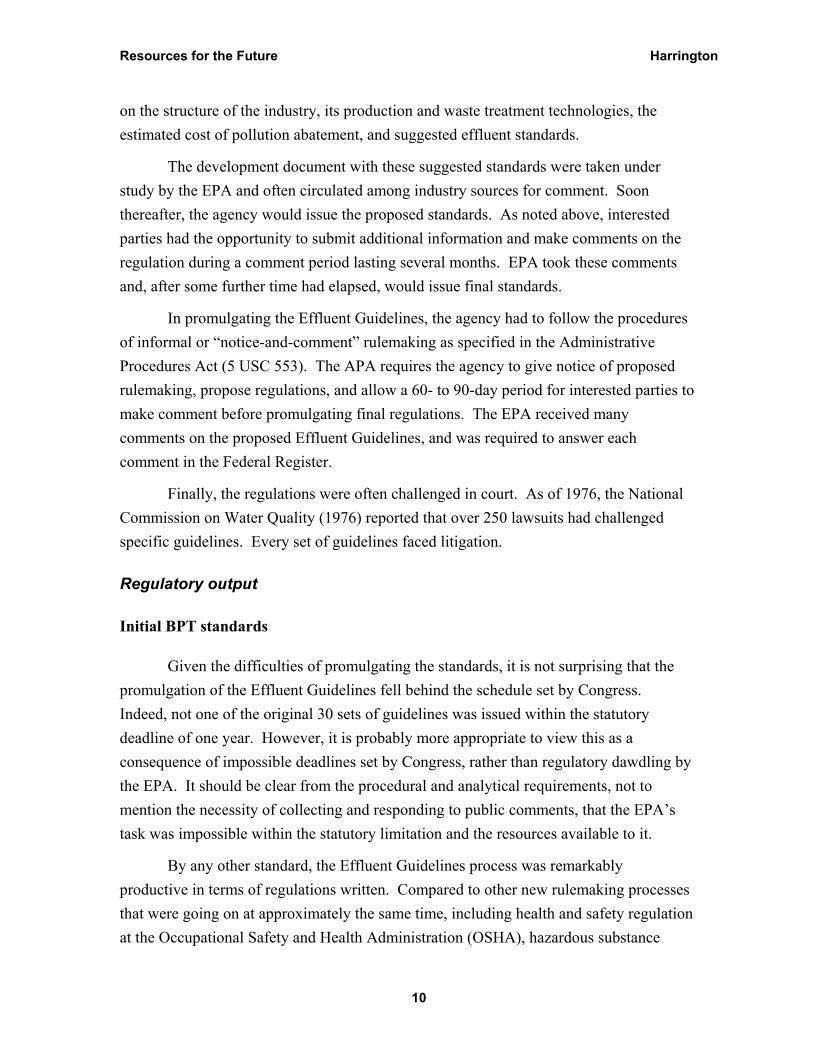
For example, among various subcategories of the poultry industry, ex ante incremental costs of BOD removal varied between $0.10 and $3.15 per pound. As shown in Table 2, the costs varied by plant size and type of bird processed, with chicken and fowl processing plants having particularly low marginal abatement costs.
13
Resources for the Future Harrington
14
Of course, the Effluent Guidelines were not intended to be cost-effective, but to define a praticable standard that plants in the industry could attain. Cost-effectiveness was not even a consideration in the economic analysis that was performed as part of the regulatory package. Instead, the regulators were concerned about the impact of the standards on plant closures and unemployment. An economic analysis was prepared for each regulation by combining abatement cost estimates with output demand elasticities taken from the economics literature to get the effect of the regulation on firm and industry profit. Employment and plant-closure effects were in turn based on the estimated loss of profits.
Comparison of Ex ante and Ex post Cost Estimates
In 1979, in response to a directive from Congress, the EPA published The Cost of Clean Air and Water, a report giving estimates of the expected cost to governments at all levels and to all industries of complying with the Clean Air and Clean Water Acts. According to this report, in the decade between 1977 and 1986, the nation’s manufacturers would spend $3.8 billion per year in capital costs and $15.9 billion per year in operating costs (in 2002 dollars).
Table 3 compares this estimate with the actual costs for the years 1982 through 1994, as reported in the annual Pollution Abatement Capital Expenditure (PACE) Survey. As noted in The Cost of Clean, delays in the issuance of rules and still greater delays
Table 2 Ex ante Incremental Costs of BOD Removal
($/kg) Chicken – large plants 0.10 Chicken –medium plants 0.16 Chicken –small plants 0.25 Duck – Large plants 1.04 Duck – Small plants 3.15 Fowl – large plants 0.10 Fowl – small plants 0.20 Further processing 0.35 Turkey 0.60 Source: Magat et al. (1986)

Resources for the Future Harrington
caused by legal challenges to them threw the timetable off by several years. As these delays were much more of an issue in some categories than in others, there is no exact comparison as to time period, and looking at the period 1982–1994 is probably no worse than looking at 1977–1986. Also, the PACE survey did not begin until 1982. As shown in Table 3, the capital costs rose sharply beginning in 1988, doubling by 1991, and then receding slightly. Examination of more detailed data shows that most of the increase is in a few industrial categories, notably organic chemicals and petroleum and coal products. Apparently this reflects the promulgation of the costly and important BAT rules in these industries.
In the aggregate, reported abatement costs in every year from 1982 to 1994 fell far short of the abatement costs estimated ex ante in 1979 (Table 3). On average, capital costs were overestimated by 72% and operating and maintenance (O&M) costs by 117%. The pattern of overestimation holds in all industrial categories; as shown in Table 4, there was only one category where costs were underestimated (stone, clay, and glass). Table 4 also illustrates how the costs of abatement are concentrated in a few key industries. Chemicals alone accounts for 31% of all abatement investment and 27% of operating costs.
This comparison is consistent with earlier findings by Harrington, Morgenstern, and Nelson (2000), which compared ex post and ex ante cost estimates for about 25 environmental and occupational health programs. Abatement costs tend to be overestimated for several reasons. Three are probably of special importance for effluent guidelines. First, the cost estimates do not—cannot—take account of technological innovation. Regulators were supposed to find an off-the-shelf technology that would achieve the specified abatement, and the cost estimate referred to this technology. Second, the baseline level of industrial pollution control was probably better than the EPA expected at the time (1973–78) the cost estimates for the first group of industries were prepared. As a result, the typical industrial plant had to do less than the EPA expected to come into compliance with the guidelines. Finally, as noted above, the regulations were relaxed considerably between the contractor’s report and the final promulgated standards. Most likely, the cost estimate was not revised to reflect the promulgated standard, but reflects at best the agency’s proposed standard. As discussed further below, the standards were relaxed considerably over the course of the rulemaking process.
15

Resources for the Future Harrington
Patterns of abatement investment
As noted above, one stated purpose of the zero-discharge requirement of the Clean Water Act was to encourage alternatives to end-of-pipe treatment. Although regulations were never promulgated to promote source reduction, the existing BAT regulations as well as the pretreatment requirements for indirect sources provide some incentive for source reduction. Even though technology-based standards for pollution abatement typically designate a particular end-of-pipe technology, permitees are generally allowed to use whatever technology is capable of meeting the requirements.
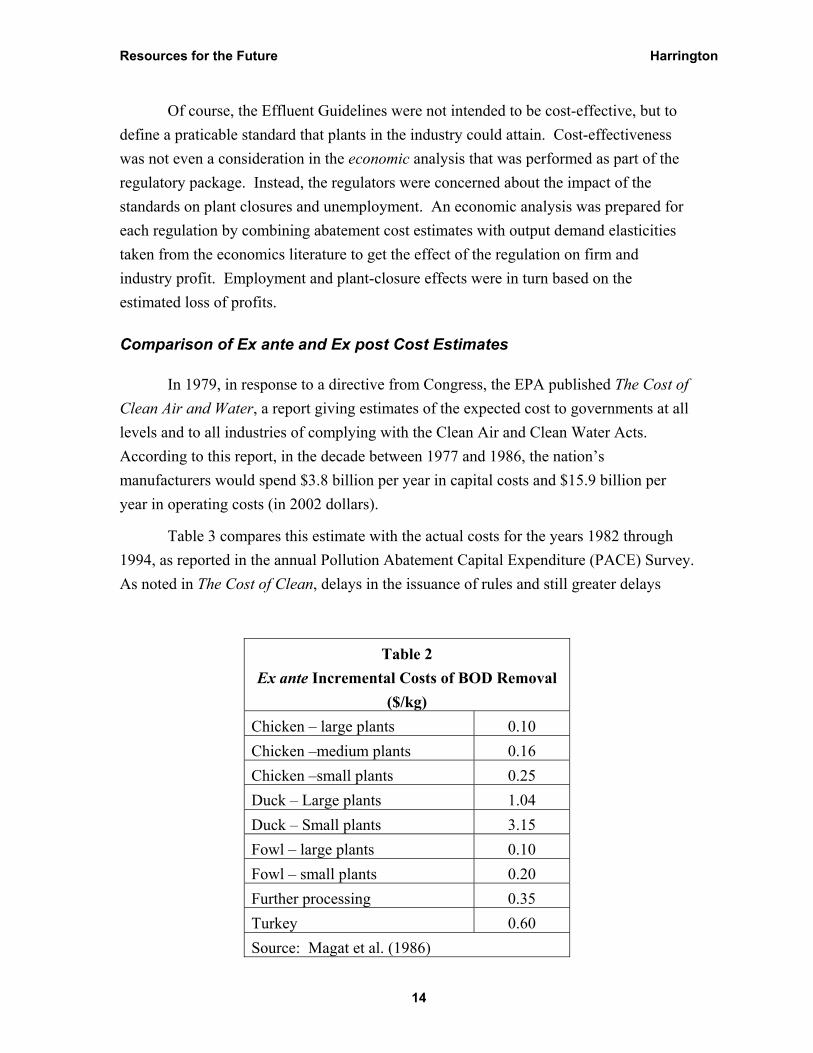
With this in mind, let us consider what the PACE data reveal about the choice of abatement technique. At least between 1986 and 1994, the PACE questionnaire allowed respondents to disaggregate expenditures into “end of pipe” and “process change” categories. In Figure 1, we show the share of abatement investment designated as “process change” by sector for the years 1986 and 1994. As shown, process change for all industry increased from 18% to 30% of all investment in this interval. Only two industries showed declines: furniture and nonelectrical machinery. Several categories, including printing/publishing, fabricated metal products, and chemicals, could show very large gains in the importance of process-change investment. Over this period, total investment in abatement nearly doubled, so the absolute increase in process change investment was greater than these figures suggest.
16

Resources for the Future Harrington
17
Table 3 Estimated Ex post Abatement Costs, All
Manufacturing (millions of 2002 dollars)
Year Capital O&M 1982 1629 58171983 1314 63261984 1373 66441985 1526 69111986 1524 70701987 NA NA 1988 1775 72671989 2420 77651990 3385 81921991 3469 78181992 3019 79111993 2696 77901994 2795 8092
Mean 82-94 2244 7300Ex ante 3870 15893

Resources for the Future Harrington
Table 4
Water Pollution Abatement Expenditures: Comparison of Ex ante and Ex post Estimates
(millions of 2002 dollars) 1979 Estimatea 1986 PACEb
Capital costs O&M
Capital Costs O&M
All industries 3870.6 15893.2 1528.4 7083.7 Food and kindred products 175.0 2349.9 159.0 823.0 Textiles 346.9 1107.3 15.4 139.5 Lumber 24.4 135.1 16.0 62.6 Furniture 1.2 3.1 1.0 26.9 Pulp and Paper 371.6 1594.5 142.4 831.3 Printing/publishing NC NC 6.3 37.9 Chemicals 1284.4 2999.5 478.3 1913.7 Petroleum and coal products 361.7 2738.7 178.6 849.4 Rubber and misc. plastics 101.9 265.3 14.1 76.4 Leather 33.2 72.6 1.6 24.8 Stone, clay, and glass 13.0 101.6 20.1 100.4 Primary metal 490.6 2541.8 109.8 748.6 aUSEPA, 1979. bU.S. Bureau of the Census, 1989.
18
Resources for the Future Harrington
Process change investment by industry, 1986 and 1994
0.00 0.10 0.20 0.30 0.40 0.50 0.60
All industries
Food and kindred prod
Textiles
Lumber
Furniture
Paper
Printing/publishing
Chemicals
Petroleum and coal prods
Rubber and misc. plastics
Leather
Stone, clay and glass
Primary metal
Fabricated metal prods.
Machinery, exc. Elec.
Electric equipment
Transportation equipment
Instruments
Process Change Investment, Pct. Of Total Investment
1986 1994
Figure 1
19

Resources for the Future Harrington
Real Outcomes
We consider two outcomes of the industrial water pollution permitting process. First, we consider the extent to which the new permits resulted in actual reductions in the amounts of pollutants entering water bodies. Second, we consider the evidence related to changes in water quality.
Have pollutant discharges from point sources been reduced?
According to an EPA estimate made in the early 1990s, full compliance with BAT-based permits and secondary treatment for POTWs would lead to a 97% reduction in the direct discharge of priority pollutants generated by POTWs and industrial point sources into the nation’s waters (Adler et al. 1993, p. 139, citing internal EPA documents). That assumes not only that discharge permits reflect BAT, but that the sources comply with them.
It appears that by the mid-1980s direct dischargers had achieved and thereafter sustained a high rate of compliance with permit conditions. EPA estimated in 1984 that only 6% of major direct dischargers were in “significant noncompliance” with their permit requirements. Over the next decade, the rate remained at this level, except for a brief excursion to about 14% in 1990 (U.S. EPA 1987, 1995). Thus, by the mid-1980s, direct dischargers had achieved a high rate of compliance with their NPDES permits. As noted above, however, most direct dischargers had permits that were not based on BAT, but on BPJ. These permits tended to impose less stringent requirements than the BAT standards.
It appears, therefore, that direct dischargers may have achieved significant effluent reductions by 1994, but they had not achieved the reductions anticipated in the BAT standards.
Among POTWs, the large-scale investment in wastewater treatment increased the fraction of the U.S. served by wastewater treatment plants from 42% in 1970 to 74% by 1985. Among all POTWs, the rate of significant noncompliance with permits was 11% in 1984 and had declined to about 9% in 1994. However, an EPA-sponsored audit of POTW pretreatment programs in 1992 found that 54% of significant industrial users (SIUs) were in “significant noncompliance,” which means they failed to observe at least one component of the POTW’s pretreatment program. Of these, 35% were in violation of discharge standards and 36% were in violation of self-monitoring or reporting requirements (Adler et al. 1993).
20

Resources for the Future Harrington
At least until the mid-1990s, in other words, the pollutant reductions achieved by the effluent guidelines program were significantly less than what had been achieved by full implementation. This failure probably accounts for at least part of the gap between ex ante and ex post estimates of compliance costs.
Has water quality improved?
It is generally agreed that the Clean Water Act has achieved some important local successes in improving water quality. In rivers near major cities, contact recreation is now encouraged in areas where it had been forbidden in the 1970s, an outcome probably attributable to the regulation of pollutants from point sources. Knopman and Smith (1993) cite improvements in the Potomac near Washington, the Delaware near Philadelphia, and the Flint River in Georgia. State water quality control administrators’ assessments of their own state’s progress during the first decade of the Clean Water Act indicated that most believe there has been significant improvement (Association of State and Interstate Water Pollution Control Administrators 1984). A report by the National Research Council (1993) acknowledged these improvements but warned that there were still many problems.
Even today, a systematic assessment of the effects of the Clean Water Act on water quality is very difficult and uncertain because of a lack of suitable data and no consensus on the most meaningful ways to aggregate trend data across water bodies and pollutants. The best evidence, from the 424 stations in the National Stream Quality Assessment Network (NASQAN),8 is mixed. For example, consider dissolved oxygen, the water quality criterion that might be expected to show the most improvement (i.e., increases in DO) as a result of pollution abatement from point sources. During the 1980s there was no significant change in average DO concentrations across all monitoring sites. Taken individually, 38 stations showed increasing DO, 26 showed decreasing DO, and for the rest there was no significant change. Among the 26 stations near urban areas,
8 Although there are thousands of water quality monitoring sites in rivers, streams, and estuaries across the country, the data are not suitable for discerning long-term trends in water quality; there are relatively few stations where data have been collected over a long period of time by the same methods and for the same pollutants. As of 1993, the only two exceptions are two networks operated by the U.S. Geological Survey (USGS): NASQAN, 420 stations located on major rivers; and the Hydrologic Basin Network, 55 stations located on headwaters in pristine areas, designed to provide water quality baselines. Two long-term environmental monitoring projects were initiated in the early 1990s. In 1991, the USGS began the National Water Quality Assessment (NAWQA), a long-term effort at water quality assessment that is just now beginning to yield results. The EPA launched the Environmental Monitoring and Assessment Program (EMAP), designed to monitor trends in ecological resources generally.
21
Resources for the Future Harrington
however, there was apparent improvement, as the percentage reporting large DO deficits (average concentrations less than 6.5 mg/l) decreased from 40% of all stations to 20%. Note the small sample size, however (Smith et al. 1991).
Smith et al. (1991) also examined loadings of several pollutants delivered to streams. For nitrate, the data show no change in loads except in two of the nation’s 14 water-resource regions, where concentrations declined by 0.4% per year (lower Mississippi) and 1.6% per year (upper Mississippi). Phosphorus concentrations declined in all but one region, and in three midwestern regions by over 3% per year. The authors attributed the improvement to reductions in point-source discharges and more widespread use of low-phosphorus detergents. Finally, suspended solids declined in 11 regions (by at most 1.3% per year) and increased modestly in three regions.
These results suggest that the Clean Water Act, and in particular its point-source programs, has made at least modest improvements in water quality, especially considering the increase in economic activity during the 1980s. Incomplete implementation of the Clean Water Act during the 1980s was one reason improvements were not larger, but probably a far more important factor was the failure of the Act to do much about nonpoint sources.
Long-Run Responses of Point Sources to the Clean Water Act
In the long run, it is expected that economic incentive (EI) and command-and-control (CAC) approaches to pollution abatement will lead to different results on the ground. Two hypotheses in particular address these differences. First, we hypothesize that EI approaches will exhibit greater dynamic efficiency—that is, they will encourage more innovation in waste treatment than CAC instruments, since they exert more pressure on firms to reduce pollutant discharges.
In addition, we expect EI approaches to be more adaptable to changes in conditions. Suppose, for example, economic growth in a region means that existing pollution-reduction policies cannot achieve acceptable air or water quality. If emission permits are marketable and fixed in supply, the reallocation of waste discharges is taken care of automatically, without intervention by the authorities.9 To accommodate growth in a CAC system, however, the entire regulatory process needs to be reopened, with new
9 It should be pointed out that an effluent fee system is not quite so automatic, since it requires the authorities to raise the tax rates.
22

Resources for the Future Harrington
regulations established for at least some sources. In fact, one of the ways that CAC systems have accommodated change in the past has been to convert, at least in part, to economic incentive systems. Indeed, this is how tradable permits were first introduced into stationary source air pollution policy in the late 1970s (Krupnick and Harrington 1980). Below we will discuss evidence for and against the proposition that economic incentives are likewise being gradually introduced into the point-source water pollution program.
Thirty years (1972–2002) is certainly enough time to observe the effects of the Clean Water Act on patterns of point-source water pollution, the overall structure of water pollution abatement, and how these changes in turn have affected the nature of regulation. And, as we describe below, there have been some interesting and important developments that make the policy landscape much different from what it was 30 years ago. Unfortunately, these changes are very difficult to document systematically, because the relevant data, when collected at all, are scattered in EPA regional offices, state DEQs, and POTWs. What follows is mostly a journalistic account, based on conversations the author had with officials in the EPA’s Office of Water, regulatory authorities in the water program offices of state DEQs, pretreatment coordinators at POTWs, and engineers at regulated firms and their consultants.
The Legacy of the POTW Construction Grants Program
Although the Construction Grants Program is not the direct focus of this paper, it appears to have had a powerful effect on industrial wastewater discharges. As noted above, federal construction grants would provide 75% of the capital cost of abatement technology, or more if the states chipped in. At the time, economists and others pointed out that these subsidies create perverse incentives for POTWs (e.g., Freeman 1978). In the first place, a capital-only subsidy distorts the mix of capital and other inputs and encourages the installation of waste treatment that is excessively capital-intensive. Freeman also argued that the subsidy would encourage the building of excess capacity. Perhaps there would be no such incentive if POTWs could be certain that the subsidy would always be available, but such a guarantee would be impossible to give, and, in any case, it was known that only a fixed amount of money was appropriated for the purpose. In addition, communities could have viewed the excess sewer capacity as a way of attracting industry.
23

Resources for the Future Harrington
A study by the Congressional Budget Office (CBO 1985) in references found that extensive excess capacity was installed, and specific examples emerged in conversations with POTWs and others. For example, the Washington Suburban Sanitary Commission (which serves Montgomery County and Prince George’s County near Washington, D.C.) was able to obtain construction grants for plants that would double its capacity.10 Twenty-five years later, WSSC still has excess capacity that dates to this period. WSSC does not even monitor for conventional pollutants because it can treat anything its industrial sources send to their plants. (It does monitor for pH and toxics, however, since those pollutants can interfere with plant operations.)
The excess capacity in POTWs became an attractive alternative to pollution abatement for many direct dischargers facing major expenses in complying with permit requirements based on the new Effluent Guidelines, particularly in plants processing organic wastes that could easily be handled by POTWs. A case involving Smithfield Foods provides an example.11 In the late 1980s, the state of Virginia promulgated new effluent regulations limiting phosphorus discharges from point sources into the Chesapeake Bay watershed to 2.0 mg/l. Two plants operated by Smithfield Foods in Isle of Wight County found it extremely difficult to meet this requirement and challenged the regulation. As the suit went through the courts, the plants continued to discharge wastewater with excessive phosphorus concentrations, and the state brought an enforcement action. The case was eventually resolved in part by an agreement by the firm to pipe the wastewater from these two plants 20 miles to an underutilized POTW operated by the Hampton Roads Sanitary District.
According to EPA regulations (40 CFR Sec. 35.2125), construction grant monies could not be used to treat industrial wastes. But once the plant was built, there was nothing to prevent the plant from accepting waste from industrial sources, especially if the industrial user paid a share of the costs. In fact, given that the excess POTW capacity exists, using it to treat industrial waste is efficient as long as there are no pass-through or interference issues, because otherwise the POTW would be underutilized. Of course, that is not to say that it is efficient ex ante to overbuild POTWs with the expectation of using the excess capacity to treat industrial waste.
10 Personal communication, Steve Laszlo, Washington Suburban Sanitary Commission, September 10, 2002. 11 The facts of the case are summarized in United States v. Smithfield Foods, Inc., 965 F. Supp. 769, 772–781 (E.D. Va. 1997).
24

Resources for the Future Harrington
Trends in Direct and Indirect Discharge
Many industrial dischargers, though obviously not all, have a choice of whether to seek an NPDES permit and discharge directly to receiving waters or to send wastewater to a POTW. Evidence suggests that, over the past 25 years, there has been a gradual shift away from direct discharge by major industrial dischargers and toward indirect discharge. Certainly in industries treating primarily organic waste, this trend is unmistakable, but it may extend to other industries as well. In Maryland, for example, the number of major direct dischargers has slowly declined from about 50 to 35 in the past two decades.12 According to Maryland state officials, the decline is not the result of plants switching over to indirect discharge. Rather, it is due to the gradual retirement of the existing direct discharging plants, together with the tendency of new plants to opt for indirect discharge whenever possible. Elsewhere, however, industrial plants facing difficulties meeting direct discharge standards have made the switch, the Smithfield plants discussed above being a prominent example.
At least in terms of numbers of plants, indirect dischargers now greatly outnumber direct dischargers. In 1995, the EPA reported that there were about 7,000 major dischargers holding NPDES permits and discharging directly into receiving waters. Of these, over half were POTWs. At the same time, there were over 35,000 “significant industrial users” discharging into POTWs (USEPA 1995).
In interviews, industry representatives, consultants, state officials, and pretreatment coordinators all agreed that most plants would vastly prefer to send wastes to a POTW. The reasons are not hard to find. One plant owned by a major manufacturer of dairy products and without access to a POTW incurred incremental costs of $3.16 per pound of BOD or TSS to meet BAT requirements. As discussed further in the next section, this is an order of magnitude greater than the unit fees imposed by POTWs. Moreover, the excess capacity induced by the Construction Grants Program probably has made POTW operators eager to take industrial waste since they could charge very low fees and still more than cover short-run marginal costs.
Industrial dischargers have other, less tangible reasons for avoiding direct discharge. Because the discharge goes directly into the receiving waters, permit requirements for direct dischargers are much more stringent and more closely scrutinized than those for indirect dischargers. They are also more visible, because environmental
12 Personal communication, Ed Stone, Maryland Department of Environment, September 30, 2002.
25

Resources for the Future Harrington
watchdog groups pay much closer attention when there is no POTW to mediate the discharge. Direct dischargers are also more concerned about liability, although recent federal regulations making violations of indirect discharge permits a violation of federal law may prompt more concern about indirect discharges.
The apparent shift from direct to indirect discharge carries with it several interesting ramifications for point-source water pollution policy. First, it moves pollutants into regimes in which effluent discharge regulations were less vigorously enforced, at least until the mid-1990s. As noted above, from 1984 to 1994 the rate of noncompliance with permit requirements was 50% greater for POTWs than for industrial direct dischargers, and the noncompliance rate with pretreatment permit requirements exceeded 50%. Second, it moves wastes out of closed systems, where all wastes that are generated are treated, and into combined sanitary and storm sewer systems. A number of cities, particularly in the Northeast and Midwest, still have combined systems, where untreated wastes can bypass POTWs and flow directly into water bodies. Third, it raises the possibility that more wastes will move into a regime in which a system of effluent charges may be emerging. This third possibility is discussed further below.
The Spread of Waste-Based Sewer Surcharges
Fees charged by POTWs for accepting industrial wastes can be fixed, based on the flow rate, based on the waste load, or some combination of the above. Some POTWs, though not many, have based fees on waste load since the 1960s, that is, before significant federal involvement in water quality. Over time, more and more POTWs have resorted to the use of waste-based fees, and they have gradually increased the range of pollutants on which a fee is collected. Today, a majority of POTWs charge for oxygen-demanding materials (usually BOD, by pound or kg of oxygen demanded) and TSS, and increasingly they charge for a variety of other pollutants, including nitrogen, phosphorus, and fats, oils, and grease (FOG).
These waste surcharges are said to have increased rapidly during the 1970s, but, since the early 1980s, they have stabilized or even declined somewhat. Their nominal basis is, or at least was, the average cost of abatement at the POTW. An EPA estimate prepared in 1986 of the cost of waste treatment at POTWs is 18¢/lb. BOD at a 25 million-gallon-per-day (MGD) plant and 35¢/lb. at 0.38 MGD and 3.3 MGD plants.13
13 51 Fed. Reg. 24986 (1986).
26

Resources for the Future Harrington
A sample of fees charged industrial users for BOD and TSS discharges is shown in Table 5. For space reasons we have left out fees on other pollutants, such as the fee on Kjeldahl nitrogen charged by some POTWs. The third column in Table 5 is for “effective BOD” applicable to dairy waste, based on a rule of thumb given to the author by Dr. Roy Carawan of North Carolina State University, which is that TSS concentration in untreated dairy plant effluents, not including cheese plants, is usually the greater of 500–600 mg/l or one-quarter of the BOD concentration. This effective fee is a crude representation of the waste surcharge that would be facing dairy plants expressed in terms of BOD concentration.
Are Waste-Based Surcharges Effluent Fees?
In form, at least, these waste-based surcharges look very much like effluent fees. Whether they perform like effluent fees depends on three questions. Are they large enough to have incentive effects? If so, do plant managers respond to these incentives, either installing pretreatment or some method of source reduction of waste loads? Finally, do regulators at the POTWs, their state overseers, and the EPA use the fees to limit waste loads? This last characteristic is assumed by the “textbook” discussions of economic instruments and their use. However, casual observation of the cases cited as examples of emission fees suggests that few fee systems have this property. Rates are set not with some target aggregate emission rate in mind, but to meet other objectives, such as raising revenue. Of course, the fact that these instruments are not “pure” does not mean they are not interesting or useful.
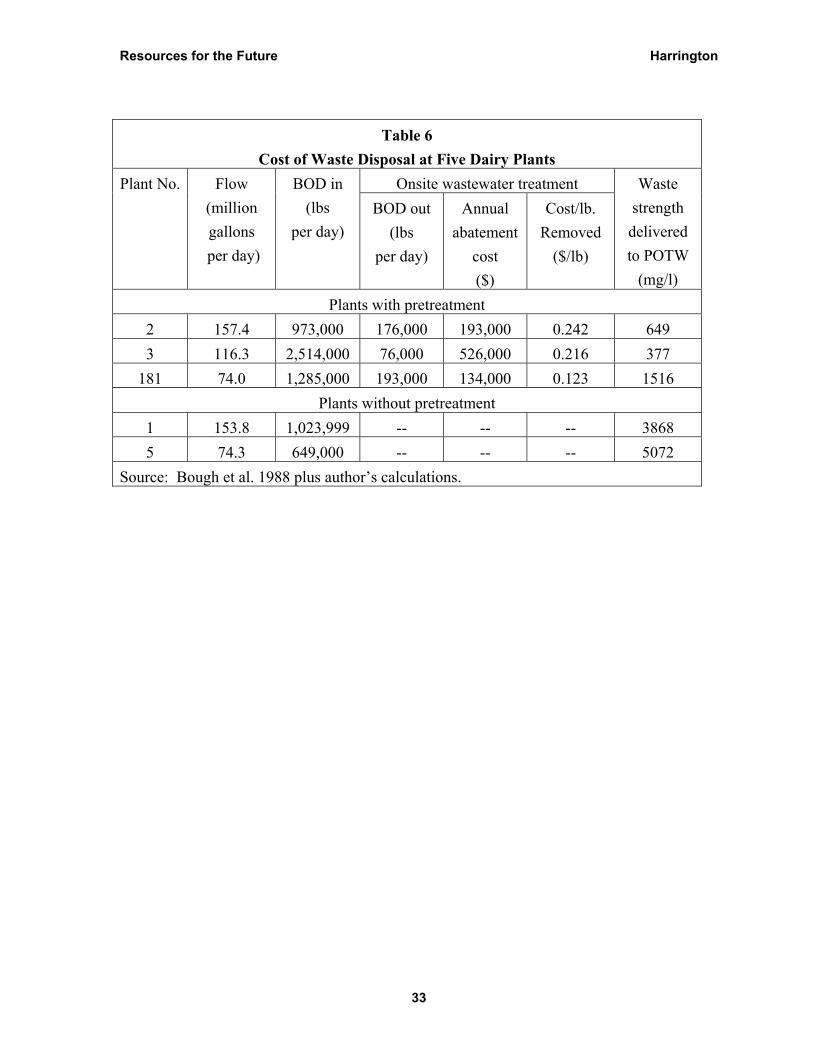
The slender evidence available to the author on the incentive properties of the waste-based surcharges comes from scattered sources. First, a paper presented at a conference on food processing wastes about 15 years ago suggests that at least at some plants, the cost of pretreatment is less than the waste-based fees charged by many POTWs. Table 6 shows data on five dairy processing plants from Missouri, including the incremental costs of waste treatment, expressed in terms of BOD removal. As shown, the incremental costs at the three plants with pretreatment vary from 12¢ to 24¢ per pound of BOD. Comparing these results to the waste surcharges shown in Table 5, we see that the BOD waste surcharges exceed the highest incremental pretreatment costs at seven plants, and the effective BOD for dairy wastes exceeds the highest incremental costs at 21 plants. It should be noted, however, that these results may not be typical. These three plants were in a uniquely favorable position regarding the disposal of sludges. Discussions with other dairy plant operators suggest that pretreatment of dairy wastes is
27
Resources for the Future Harrington
rarely cost-effective when compared to sending the untreated waste to the POTW and paying the fees.
What is cost-effective, however, is source reduction. Dairy operators report that the presence of waste surcharges has caused them to take a closer look at plant operations, and, as a result, they have found numerous opportunities for reducing waste loads by making changes to product specification, production process, product sequencing in a multiproduct operation, and production run lengths. For example, longer production runs mean less cleaning of equipment, and therefore less wastewater.
Nonetheless, there is some reason to question whether [or doubt that] plant managers are fully alive to the possibilities of reducing waste surcharges by examining waste loads in the plant. One pretreatment coordinator recounted a story about a dairy that was paying millions of dollars per year in waste surcharges, apparently without anyone at the plant being aware of it. It seems that the plant was a unit of a large multistate, multiplant operation, and the bills were being paid by the headquarters office, which had little idea of what kinds of waste reduction economies were available at the plant. When this pretreatment coordinator brought the magnitude of these fees to the attention of his technical contact at the dairy, that individual was able to contact the home office and implement a study of local waste-load reduction possibilities.14
This anecdotal evidence is therefore mixed with respect to the proposition that waste surcharges do have an incentive effect. In principle, it would be easy enough to test the proposition statistically, but assembling an appropriate dataset is not easy.
As to the third question, almost certainly regulators do not treat the surcharges as effluent fees, and it is not obvious how they could, given the current U.S. regulatory approach. Consider how a POTW operator might react to the increase in waste load brought on by local economic and population growth that threatens to cause an increase in waste discharges from the POTW. (This is analogous to the challenge that led to the introduction of pollution offsets in air quality management.) The POTW has a permit that specifies a limit on its waste discharge. Some portion of the available waste load has been allocated to industrial dischargers by a headworks analysis, as discussed in a preceding section. The increase in the waste load could imply a reduction in the waste load available to the industrial dischargers.
14 Personal communication, Lyle Milby, pretreatment coordinator, Norman, Oklahoma, September 24, 2002.
28

Resources for the Future Harrington
In an effluent fee regime, the way to respond to such increased waste loads is to increase the fees. The POTW can take this action, and the increase in fees will presumably induce waste reduction among industrial dischargers. However, the POTW cannot be certain that the waste reduction will be large enough or occur quickly enough to prevent the overall POTW discharge limits from being exceeded. Without this certainty, it is unlikely that the POTW will take the approach of simply raising the fee, nor is it likely that the regulatory authorities at the state DEQ or at the EPA will allow the use of fees only to control effluent, without setting new quantity limits based on a new headworks analysis. In other words, there appears to be an incompatibility between the use of fees upstream from the POTW and a nontransferable quantity instrument downstream.
Conclusion
Let us close with a discussion of the experience with the Effluent Guidelines in the context of hypotheses on the performance and characteristics of economic incentive instruments and command-and-control instruments.
When Congress was deliberating over the shape of federal water pollution legislation around 1970, there was a brief period when it appeared as though the use of economic incentives—namely, a set of effluent fees—to control industrial and domestic discharges might get a hearing. Ultimately, however, effluent fees were opposed by pollutant dischargers on the grounds that they were taxes and by environmental advocates who had no faith in the incentive properties of economic instruments. They were a “license to pollute,” and polluters would simply pay the fees and continue to pollute (Kelman 1982). The use of the police power was thought to be the only way of getting reliable results in a timely fashion.
By these lights, the performance of the Effluent Guidelines was surely disappointing. The NRDC’s performance audit of the Clean Water Act after 20 years (Adler et al. 1993) found serious delays both in the promulgation of the required BAT standards and in getting permits based on those standards, all of which required further legislation in 1987 to establish a new timetable for preparation of BAT standards. To put this in perspective, however, we should note that the Clean Water Act was among the first environmental statutes to impose significant and costly responsibilities on U.S. industry. Sources of pollution had to be convinced that environmental quality was a problem in the United States, that they were part of the problem, and that the federal
29
Resources for the Future Harrington
government had both the power to change their behavior and the willingness to use that power. To an extent probably unappreciated in 1972, the rulemaking procedures and the courts provide many opportunities for regulated parties to contest the regulations, resulting in delay and weaker standards. Still, the fact remained that the technology-based regulatory approach, adopted primarily because of its presumed effectiveness, was probably not as effective as its proponents had expected ex ante.
Today the Effluent Guidelines program appears to be changing in ways that no one anticipated in 1972. At that time, the focus of the program was on the BPT, BAT, and NSPS standards for direct dischargers. Over time, direct dischargers, while still important in some industries, have gradually become fewer in number and less important in environmental terms. Among indirect dischargers, furthermore, it is likely that waste surcharges increasingly are having incentive effects as they are raised by local POTWs for revenue purposes. That is, this quintessential regulatory program is gradually evolving into an economic incentive program.
Waste-based surcharges are in fact only one of at least three ways of introducing economic incentives into industrial water pollution control. The other two, which are beyond the scope of this paper, are the use of marketable permits to allocate the maximum allowable industrial load at POTWs, a program now in use at only one POTW, and the potential use of marketable permits to allocate total maximum daily loads (TMDLs) for direct dischargers into water-quality-limited water bodies.
As has been frequently observed, many, if not most, economic incentive programs in actual use around the world have evolved out of purely regulatory instruments. Perhaps it is time to look at this common observation from the other end. As time passes and new challenges emerge, CAC programs appear to have a strong tendency to adapt by incorporating economic incentives into their structure.
30

Resources for the Future Harrington
Table 5
Waste Surcharges for Selected POTWs
POTW BODa ( $ / lb )
TSSa ( $ / lb )
Effective BOD fee for dairy
plantsb ($/lb)
Providence, RI 0.600 0.600 0.75 Loudon, TN 0.460 0.460 0.575 Delta, CO 0.340 0.340 0.425 Salem, OR 0.301 0.222 0.357 Nashville, TN 0.293 0.140 0.328 Longmont, CO 0.270 0.230 0.325 Boulder, CO 0.260 0.285 0.33 Henderson, NV 0.230 0.220 0.285 Lakeland, FL 0.186 0.116 0.215 Mitchell, SD 0.180 0.160 0.22 Savannah, GA 0.160 0.160 0.20 Springfield, MO 0.151 0.086 0.172 Aberdeen, SD 0.150 0.012 0.18 Terre Haute, IN 0.150 0.150 0.187 Wilmington, NC 0.140 0.100 0.165 Gwinnett County Public Utilities, GA 0.120 0.120 0.15 Wilson, NC 0.109 0.152 0.147 Norman, OK 0.083 0.111 0.110 Princeton, NJ 0.060 0.076 0.079 North Davies Sewer District, UT 0.056 0.043 0.067
31

Resources for the Future Harrington
Sources: Pretreatment Coordinators listserv at yahoo.com, Mannapperuma et al. 1993, various web pages.
Notes.
These charges apply only to wastes at concentrations in excess of a locally determined threshold, usually 200-300 mg/l. For example, if waste strength is 1000 mg/l and the threshold is 300 mg/l, the fee is charged for only 7/10 of the waste load. bTo calculate “effective BOD” for dairy waste, add 25% of the fee for TSS to the BOD fee. A rule of thumb for the concentration of TSS in dairy waste (except for cheese plants) is 25% of the BOD concentration. (Personal communication, Roy Carawan, North Carolina State University, November 4, 2002).
32
Resources for the Future Harrington
Table 6
Cost of Waste Disposal at Five Dairy Plants Onsite wastewater treatment Plant No. Flow
(million gallons
per day)
BOD in (lbs
per day) BOD out
(lbs per day)
Annual abatement
cost ($)
Cost/lb. Removed
($/lb)
Waste strength delivered to POTW
(mg/l) Plants with pretreatment
2 157.4 973,000 176,000 193,000 0.242 649 3 116.3 2,514,000 76,000 526,000 0.216 377
181 74.0 1,285,000 193,000 134,000 0.123 1516 Plants without pretreatment
1 153.8 1,023,999 -- -- -- 3868 5 74.3 649,000 -- -- -- 5072
Source: Bough et al. 1988 plus author’s calculations.
33

Resources for the Future Harrington
References
Adler, Robert W., Jessica C. Landman, and Diane M. Cameron. 1993. The Clean Water Act Twenty Years Later. Washington DC: Island Press for the National Resources Defense Council.
Association of State and Interstate Water Pollution Control Administrators. 1984. America’s Clean Water: The States’ Evaluation of Progress: 1972-1982. Washington, D.C.: ASIWPCA.
Bough, Wayne A., Ed McJimsey and Donna Clark-Thomas. 1988. Operating Costs of Dairy Pretreatment vs. POTW Facilities and the Establishment of a Waste Minimization Program. Presented at the Food Processing Waste Conference, October 31–November 2, 1988, Atlanta, Georgia.
Congressional Budget Office (CBO). 1985. Efficient Investment in Wastewater Treatment Plants. Washington, DC: Congressional Budget Office.
Council on Environmental Quality (CEQ). 1976. Environment Quality—1976. Washington, DC: GPO.
Freeman, A. Myrick. Air and Water Pollution Policy. In Paul Portney, ed. Current Issues in U.S. Environmental Policy. Baltimore: Johns Hopkins University Press for Resources for the Future.
Harrington, Winston, Richard D. Morgenstern, and Peter Nelson. 2001. On the Accuracy of Regulatory Cost Estimates, Journal of Policy Analysis and Management 19(2).
Industrial Economics, Inc. 1998. Sharing the Load: Effluent Trading for Indirect Dischargers. U.S. EPA, Washington, DC, EPA-231-R-98-003.
Kelman, Steven. 1982. What Price Incentives? Economists and the Environment. Westport, CT: Auburn House.
Knopman, Debra S. and Richard A. Smith . 1993. Twenty Years of the Clean Water Act: Has U.S. Water Quality Improved? Environment 35(1): 16.
Krupnick Alan J. and Winston Harrington 1981. Stationary Source Pollution Policy and Prospects for Reform. In Environmental Regulation and the U.S. Economy. Henry Peskin, Paul R. Portney, and Allen V. Kneese, eds. (Baltimore: Johns Hopkins University Press for Resources for the Future, 1981).
Magat, Wesley A., Alan Krupnick, and Winston Harrington. 1986. Rules in the Making: A Statistical Analysis of Regulatory Behavior. Washington, DC: Resources for the Future.
34

Resources for the Future Harrington
Mannapperuma, Jatal, E.D. Yates and Paul Singh. 1993. Survey of Water Use in the California Food Processing Industry. Proceedings of the 1993 Food Industry Environmental Conference.
National Commission on Water Quality. 1976. Report to Congress.
Smith, Richard A. Richard B. Alexander, and Kenneth J. Lanfear. 1991. Stream Water Quality in the Conterminous United States—Status and Trends of Selected Indicators During the 1980s. National Water Summary 1990–91—Stream Water Quality: Hydrology. U.S. Geological Survey Water-Supply Paper 2400.
National Research Council. 1993. Managing Wastewater in Coastal Urban Areas. Washington, D.C.: National Academy Press.
Smith, Richard A., Richard B. Alexander, and M. Gordon Wolman. 1987. Water Quality Trends in the Nation’s Rivers. Science 235: 1607–1615.
U.S. Bureau of the Census. 1989. Pollution Abatement Costs and Expenditures, 1986. Washington, DC: GPO.
U.S. EPA. 1987. National Water Quality Inventory: 1986 Report to Congress.
U.S. EPA. 1995. National Water Quality Inventory: 1994 Report to Congress.
U.S. EPA. 1979. The Cost of Clean Air and Water. Report to Congress.
U.S. EPA. 2001. Local Limits Development Guidance Washington, DC, Office of Wastewater Management, U.S. EPA.
35