regulating away competition: the effect of regulation on
TRANSCRIPT

Regulating Away Competition The Effect of Regulation on
Entrepreneurship and Employment
James Bailey and Diana Thomas
September 2015
MERCATUS WORKING PAPER
James Bailey and Diana Thomas ldquoRegulating Away Competition The Effect of Regulation on Entrepreneurship and Employmentrdquo Mercatus Working Paper Mercatus Center at George Mason University Arlington VA September 2015
Abstract
Many scholars have worried that regulation deters entrepreneurship because larger firms can overcome the costs of complying with regulations more easily than smaller firms Using novel data on the extent of US federal regulations by industry at the four-digit NAICS (North American Industry Classification System) level the RegData database of the Mercatus Center at George Mason University and data on firm births and employment from the Statistics of US Businesses we run fixed effects regressions to show that more-regulated industries experienced fewer new firm births and slower employment growth in the period 1998 to 2011 Large firms may even successfully lobby government officials to increase regulations to raise their smaller rivalsrsquo costs We also find that regulations inhibit employment growth in small firms more than in large firms
JEL codes L26 L51 J68
Keywords entrepreneurship regulation RegData NAICS employment
Author Affiliation and Contact Information
James Bailey Assistant Professor Department of Economics amp Finance Creighton University JamesBaileycreightonedu
Diana Thomas Associate Professor Department of Economics amp Finance Creighton University dianathomascreightonedu
All studies in the Mercatus Working Paper series have followed a rigorous process of academic evaluation including (except where otherwise noted) at least one double-blind peer review Working Papers present an authorrsquos provisional findings which upon further consideration and revision are likely to be republished in an academic journal The opinions expressed in Mercatus Working Papers are the authorsrsquo and do not represent official positions of the Mercatus Center or George Mason University
3
Regulating Away Competition
The Effect of Regulation on Entrepreneurship and Employment
James Bailey and Diana Thomas
1 Introduction
The literature on the relationship between institutional quality and economic growth suggests
that better institutions tend to be associated with better long-term growth and are an important
indicator of overall economic well-being (Hall and Jones 1999 Acemoglu Johnson and
Robinson 2001 Djankov McLiesh and Ramalho 2006) Countries that have better institutions
(open access to political power greater constraints on the executive and greater political rights)
tend to have less burdensome regulation and as a result tend to perform better in terms of
economic growth (Djankov et al 2002)
One important input into economic growth is new firm creation The institution that
theoretically matters most for the creation of new firms is regulation of entry As the number of
procedures required before starting a new business increases fewer new businesses will enter the
market (Djankov et al 2002) More generally however a higher overall level of regulation in a
country can benefit larger incumbent firms that have the resources to shoulder compliance costs
while their smaller competitors falter in the face of an increasing regulatory burden1 Incumbents
may even pursue such regulation of entry deliberately to protect themselves from competition by
new entrants (Tullock 1967 Stigler 1971 Peltzman 1976)
Studies of institutional quality and its effect on entrepreneurship have so far focused on
the quality of institutions by country (Djankov et al 2002 Nystroumlm 2008 Byoslashrnskofv and Foss
1 Maloney and McCormick (1982) show for an example of environmental quality regulation that such regulation benefits larger producers in an industry Lacy Glenn Thomas (1990) estimates the effect of Food and Drug Administration regulation on research and development expenditures by pharmaceutical firms of different sizes and finds similar results
4
2008) Such studies suffer from the problem that healthy economies usually score well on a
number of different institutional variables making it difficult to isolate the specific effect of a
particular variable Klapper Laeven and Rajan (2006) try to correct for this weakness by using
an interaction between an industryrsquos natural propensity for entry and a countryrsquos regulatory
burden This leaves them with a measure of the relative magnitude of the effect of regulation of
entry on naturally high-entry industries only however rather than with an absolute measure of
the effect of regulation on new firm creation Using novel data on the changing intensity of
regulation by industry for the United States from the RegData database of the Mercatus Center at
George Mason University we are able to provide a better estimate of the absolute effect of
regulation on new firm creation and employment growth by industry
The following section reviews the theoretical and empirical literature on the relationship
between regulation and entrepreneurship Section 3 describes the data we use in this study
Section 4 provides details of our empirical strategy Section 5 summarizes our results and
section 6 concludes
2 Literature Review
Regulation although often intended to address some perceived market failure may come at the
cost of greater barriers to entry for new firms that seek to enter the market Knowing the ins and
outs of the regulatory framework that governs a particular industry represents a fixed cost of
doing business that can be difficult for smaller entrants to an industry to overcome (Maloney and
McCormick 1982)
The public choice literature on regulation following Tullock (1967) suggests that
regulation is promoted by the regulated industry itself and usually benefits existing producers
5
(Stigler 1971 Peltzman 1976) This view of regulation assumes that politicians cater to business
interests to maximize their private reelection prospects The public choice model is in conflict
with the classic public interest model of regulation following Pigou (1938) which holds that
regulation can counteract market failures and is instituted by government officials to maximize
the general welfare
Using data on entry regulation by country to test these two theories Djankov et al (2002)
find that for a sample of 85 countries countries with more open access to political power greater
constraints on the executive and greater political rights tend to have less burdensome regulation
Stricter regulation of entry is not associated with higher-quality products better pollution records
or health outcomes or livelier competition as the public-interest model of regulation would
predict Instead the authors find that countries with stricter regulation of entry are more likely to
exhibit sharply higher levels of corruption and a larger unofficial economy The authors conclude
that their evidence supports the public choice model of regulation which predicts that regulators
are captured by industry and operate for its benefit
Following up on Djankov et al (2002) Klapper Laeven and Rajan (2006) provide the
microfoundation for the relationship between regulation and growth The authors use European
firm data and country-specific cost-of-entry data from Djankov et al (2002) to study the effect of
market entry regulations on the creation of new limited-liability firms the average size of
entrants and the growth of incumbent firms Their analysis suggests that new firm creation
especially in naturally high-entry industries is limited when barriers to entry are high They also
find that new entrants tend to be larger when regulatory requirements for entry are more
burdensome and that incumbent firms tend to grow more slowly when competition is reduced in
that manner
6
Sobel Clark and Lee (2007) use the total entrepreneurial activity index from the
Kauffman Centerrsquos Global Entrepreneurship Monitor to represent a general measure of
entrepreneurial activity The authors find evidence that entrepreneurial activity is negatively
affected by both domestic entry restrictions and barriers to international competition (trade
barriers)
Nystroumlm (2008) uses data on economic freedom by country from the Fraser Institute and
self-employment as a measure of entrepreneurship and finds that a smaller government sector
better legal structure and security of property rights as well as less regulation of credit labor
and business tend to increase entrepreneurship In the same issue of Public Choice and also
using the economic freedom index to measure institutional quality Bjoslashrnskov and Foss (2008)
find that the size of government is negatively correlated with entrepreneurial activity as
measured by survey data from the Global Entrepreneurship Monitor Consortium The authors
similarly find that the sound money measure from the economic freedom index is positively
correlated with entrepreneurial activity None of the other measures of economic freedom
including regulation are significantly correlated with entrepreneurship
Sobel (2008) examines the relationship between institutional quality and different types
of entrepreneurship for the 48 US states More specifically Sobel finds evidence that supports
Baumolrsquos (1990) theory of productive unproductive and destructive entrepreneurship which
suggests that institutions channel generally prevalent entrepreneurial tendencies into either
productive economic or unproductive political opportunities
All the existing studies suffer from the problem that regulation is usually industry
specific but their measures of regulatory burden or institutional quality more generally are
country or state specific Klapper Laeven and Rajan (2006) try to compensate for that
7
shortcoming by creating an interaction between an industryrsquos natural propensity for new entry
and the countryrsquos regulatory burden The interaction leaves the authors with a relative measure of
the effect of regulation on new firm creation
In this paper we use a novel dataset on regulation by industry for the United Statesmdash
RegDatamdashto overcome that shortcoming and provide an absolute measure of the effect of
regulation by industry on new firm creation We describe the new dataset in more detail in the
next section
3 Data
To quantify the effect of regulation on firm size and employment growth we use industry-level
data on firms from the Statistics of US Businesses (SUSB) together with RegDatarsquos index of
regulatory intensity and several control variables Our sample contains data from 215 industries
for 1997ndash2011
The SUSB is compiled annually by the US Census Bureau using data on the full
population of US firmsmdashit is not simply a sample subject to sampling error We use the dynamic
version of the SUSB maintained by the Office of Advocacy of the US Small Business
Administration The dynamic SUSB provides information on the number of new firms in each
industry (firm births) the number of firms exiting each industry (firm deaths) and the number of
employees hired and fired for each industry Key variables from the SUSB are summarized in
table 1 The data identify industries down to four-digit North American Industry Classification
System (NAICS) codes The NAICS breaks down industries to progressively greater levels of
detail starting with the two-digit level such as 31 (manufacturing) Three-digit codes dig deeper
with industry classifications such as 311 (food manufacturing) Four-digit codes provide still
8
greater detail with industry classifications such as 3111 (animal food manufacturing) and 3112
(grain and oil seed milling) The SUSB describes 290 four-digit industries Although the SUSB
began in 1988 it first used the older Standard Industrial Classification system before
transitioning to the NAICS in 1998 To ensure consistency in the industry classifications in the
data we use only the 1998ndash2011 SUSB information
Table 1 Summary Statistics for Key Variables
Variable13 Mean13 Standard13 deviation13 Minimum13 Maximum13 Observations13
Firm13 births13 (all13 sizes)13 254313 460813 013 3809213 249413 Firm13 births13 (1ndash413 employees)13 154513 309713 013 2799213 249213 Firm13 births13 (500+13 employees)13 34813 85113 013 980613 249013 Firm13 deaths13 (all13 sizes)13 247413 434913 013 4094413 249413 Firm13 deaths13 (1ndash413 employees)13 155813 309813 013 3592213 249213 Firm13 deaths13 (500+13 employees)13 31413 81313 013 1088213 249013 New13 hires13 (all13 sizes)13 2410513 5013113 013 49572313 236313 New13 hires13 (1ndash413 employees)13 328113 582313 013 4672213 181713 New13 hires13 (500+13 employees)13 1279813 2769113 013 33096113 180213 Industry13 Regulation13 Index13 2160213 7912713 002213 73486613 249413
Source Data on firm births firm deaths and new hires are from the 1998ndash2011 Statistics of US Businesses data on the Industry Regulation Index are from the 1998ndash2011 RegData database Note Observations are at the industry-year level with industries measured using four-digit NAICS (North American Industry Classification System) codes
Our data on regulation come from RegData Compiled by the Mercatus Center
RegData tracks how much of each yearrsquos Code of Federal Regulations applies to each
industry The index of regulatory intensity is based on text analysis of the Code of Federal
Regulations which is published annually and contains all regulations issued at the federal
level More specifically the index contains a search term count of the number of occurrences
of a list of words that are likely to indicate binding constraints The words are ldquoshallrdquo ldquomustrdquo
ldquomay notrdquo ldquoprohibitedrdquo and ldquorequiredrdquo In addition to that search term count the RegData
index which measures the intensity of regulation of a particular industry also contains a
9
measure of industry targeting The industry targeting measure quantifies how frequently the
regulations produced by a specific regulator target a specific industry See Al-Ubaydli and
McLaughlin (2014) for details
Previous attempts to quantify the extent of regulation compared the overall level of
regulation in different states or countries RegData is the first dataset to quantify the level of
regulation by industry and it does so for 215 separate industries A further advantage of
RegData is that it measures the intensity of regulation by counting constraints Previous work
has tended to use cruder measures such as page counts (Coffey McLaughlin and Tollison
2012 Dawson and Seater 2013) or in recent years file-size data from state statutes (Mulligan
and Shleifer 2005) Such attempts to measure the extent of regulation have obvious
shortcomings Not all the information contained in the Federal Register for example is
dedicated to regulation Furthermore not all pages even when they are dedicated to regulation
are equal A particular page could be of enormous consequence in terms of its regulatory
impact or it might have little effect To mitigate some of the shortfalls of existing measures of
regulation by industry RegData focuses on the number of binding constraints that apply to a
particular industry
RegData was recently expanded to classify industries down to the four-digit NAICS
level That level is consistent with our dynamic SUSB firm data with the exception that RegData
tracks only 215 four-digit industries compared with the SUSBrsquos 290 RegData has available data
for the period 1997 to 2012
We use several indicators of the overall business and macroeconomic climate as control
variables presuming that firm births and deaths by industry are driven by general factors as well
as by industry-specific ones Our data on real gross domestic product growth the Gross
10
Domestic Product Price Index gross domestic private investment and corporate profits come
from the US Bureau of Economic Analysis Our data on unemployment real output per worker
industrial production 10-year Treasury interest rates and unit labor costs were obtained from the
Federal Reserve Bank of Saint Louisrsquos FRED (Federal Reserve Economic Data) database All
control variables are available from 1997 to 2012
Our study focuses on the period 1998 to 2011 The limiting factor is the availability of
the dynamic SUSB data RegData also goes back only to 1997 As table 1 shows these 14 years
are enough to give us a reasonable number of observations because we observe so many
industries in each year
4 Empirical Strategy
Our main empirical strategy is to estimate the effect of regulatory burdens on firm births firm
deaths and employment across industries using a 1998ndash2011 panel of data Our main fixed
effects regression is as follows
ln 119865119894119903119898119861119894119903119905ℎ119904 = 1198870 + 1198871 times ln 119877119890119892119906119897119886119905119894119900119899119868119899119889119890119909 + 1198872 times 119910119890119886119903 +
1198873 times 119894119899119889119906119904119905119903119910 + 1198874times 119888119900119899119905119903119900119897119904 + 119890
where firm births by industry are drawn from the SUSB the index of regulatory intensity is
drawn from RegData and is described earlier 119910119890119886119903 represents year dummies 119894119899119889119906119904119905119903119910 is a
dummy for each four-digit NAICS industry 119888119900119899119905119903119900119897119904 is a vector of economic control variables
described below and 119890 is the error term Industry fixed effects are the key to our identification
strategy They account for the fact that some industries may persistently have more firm births
than other industries for reasons apart from regulationmdashfor instance they may be large or have
naturally low barriers to entry
11
Our control variables are real gross domestic product growth the Gross Domestic
Product Price Index gross domestic private investment corporate profits unemployment real
output per worker industrial production 10-year Treasury interest rates and unit labor costs2 In
separate regressions we use the natural log of firm deaths by industry and the change in
employment by industry as dependent variables
We use the natural log of our main variables of interest because they are highly right
skewed as is demonstrated by kernel density graphs in the appendix (see figures A1 and A2)
The use of natural logs also makes interpreting the results easiermdashunderstanding the meaning of
an increase of 1 in the regulatory index is difficult but understanding the meaning of a 1 percent
increase is easy
5 Results
Firm Births
Table 2 summarizes the results of our analysis for the effect of regulation on firm births for firms
of different sizes as well as for all firms in the sample
The results suggest that a 10 percent increase in the intensity of regulation as measured
by the RegData index leads to a statistically significant 05 percent decrease in overall firm
births Regulation is also associated with a similar statistically significant decrease among small
firms though it has no statistically significant effect on large firms This finding supports the
hypothesis that incumbents benefit from regulation because it deters new entrants Our estimate
2 Because these variables are observed at the national level each year they are perfectly collinear with year dummies including them in a regression together with year dummies causes some variables to be dropped Thus we use year dummies as our only national-level controls in the regressions reported in the body of the paper In the appendix we show the results from using the economic controls listed plus a linear time trend instead of year dummies The results are nearly indistinguishable from those when we use only year dummies
12
of the effect of regulation on firm births of large firms is not statistically significant a fact that
provides some support for the idea that larger firms are better able than smaller firms to deal with
regulatory compliance costs
Table 2 Effect of Regulatory Index on Firm Births
Variable13 All13 firms13 Small13 firms13 Large13 firms13
Regulatory13 index13 minus0049913 minus0042613 minus0063913 (00183)13 (00172)13 (00478)13
Year13 dummies13 Yes13 Yes13 Yes13 Industry13 dummies13 Yes13 Yes13 Yes13 F-shy‐statistic13 34513 16813 4913 R213 (within)13 01613 01113 00313 Observations13 249313 248613 238013
p lt 01 p lt 005 p lt 001 Note Robust standard errors clustered by industry are given in parentheses The number of observations is similar across firm types because the Statistics of US Businesses is a firm-level survey that is aggregated to the industry-year level for public use
Firm Deaths
Table 3 summarizes our findings for the effect of regulation on firm deaths The results suggest
that regulation has no statistically significant effect on firm deaths The finding supports the idea
that incumbents usually benefit from regulationmdashregulation drives away new entrants (as seen in
the reduced number of firm births) but it does not put existing firms out of business (there is no
increase in firm deaths) In fact there is some evidence that deaths among large firms actually
decrease13 a 10 percent increase in regulation is associated with a 09 percent decrease in the
deaths of large firms (though this is statistically significant at only the 10 percent level of
increased regulation)
13
Table 3 Effect of Regulatory Index on Firm Deaths
Variable13 All13 firms13 Small13 firms13 Large13 firms13
Regulatory13 index13 minus0014113 0000313 minus0090613 (00217)13 (00216)13 (00476)13
Year13 dummies13 Yes13 Yes13 Yes13 Industry13 dummies13 Yes13 Yes13 Yes13 F-shy‐statistic13 13113 10513 12913 R213 (within)13 00713 00413 00613 Observations13 249213 247513 244913
p lt 01 p lt 005 p lt 001 Note Robust standard errors clustered by industry are given in parentheses The number of observations is similar across firm types because the Statistics of US Businesses is a firm-level survey that is aggregated to the industry-year level for public use
New Hires
Table 4 summarizes our results for the effect of regulation on employment growth The results
suggest that regulation deters hiring overall A 10 percent increase in regulation is associated
with a statistically significant 09 percent decrease in hiring The effect for small firms is slightly
smaller a 10 percent increase in regulation is associated with a 05 percent decrease in hiring
The effect for large firms is not statistically significant
Table 4 Effect of Regulatory Index on New Hires
Variable13 All13 firms13 Small13 firms13 Large13 firms13
Regulatory13 index13 minus0093113 minus0053513 minus0090713 (00320)13 (00199)13 (00566)13
Year13 dummies13 Yes13 Yes13 Yes13 Industry13 dummies13 Yes13 Yes13 Yes13 F-shy‐statistic13 27813 10613 8813 R213 (within)13 01813 00913 00913 Observations13 236213 181013 169013
p lt 01 p lt 005 p lt 001 Note Robust standard errors clustered by industry are given in parentheses The number of observations is similar across firm types because the Statistics of US Businesses is a firm-level survey that is aggregated to the industry-year level for public use
14
Alternative Measures
Results not presented here show that an alternative measure of regulation the total number of
different regulators of an industry has no effect on firm births firm deaths or hiring We also
find no statistically significant effect on firms of the level of regulation coming from specific
large regulators such as the US Environmental Protection Agency or the US Department of
Health and Human Services The results suggest that at least by using firm births firm deaths
and hiring as measures of firm activity we cannot support the theory of the anticommons
So far we have investigated the effect of regulation in a year on firm behavior in the same
year But some regulation may not take effect immediately13 especially if it is put in place near the
end of the year In table 5 we investigate the effect of this yearrsquos regulations on next yearrsquos firm
births firm deaths and new hires The results are similar to the main results that found the
current-year effect of regulation Regulation leads to a statistically significant reduction in hiring
and firm births for firms overall and for small firms and a reduction in the deaths of large firms
Table 5 One-Year Lagged Effect of Regulatory Index on Firm Births Firm Deaths and New Hires
Firm13 Births13 Variable13 All13 firms13 Small13 firms13 Large13 firms13
Regulatory13 index13 minus0047013 minus0035913 minus0056713 (00182)13 (00179)13 (00530)13
Year13 dummies13 Yes13 Yes13 Yes13 Industry13 dummies13 Yes13 Yes13 Yes13 F-shy‐statistic13 36013 17513 5513 R213 (within)13 01713 01213 00413 Observations13 228713 228113 218013
continued13 on13 next13 page13 13 13
15
Firm13 Deaths13 Variable13 All13 firms13 Small13 firms13 Large13 firms13
Regulatory13 index13 minus0021513 minus0021213 minus0091113 (00211)13 (00199)13 (00451)13
Year13 dummies13 Yes13 Yes13 Yes13 Industry13 dummies13 Yes13 Yes13 Yes13 F-shy‐statistic13 12513 11413 10613 R213 (within)13 00713 00413 00613 Observations13 228713 227113 224613
13 New13 Hires13
Variable13 All13 firms13 Small13 firms13 Large13 firms13
Regulatory13 index13 minus0062913 minus0048213 minus0086013 (00242)13 (00194)13 (00467)13
Year13 dummies13 Yes13 Yes13 Yes13 Industry13 dummies13 Yes13 Yes13 Yes13 F-shy‐statistic13 28513 11313 8713 R213 (within)13 01813 00913 01013 Observations13 216813 165213 153813
p lt 01 p lt 005 p lt 001 Note Robust standard errors clustered by industry are given in parentheses The number of observations is similar across firm types because the Statistics of US Businesses is a firm-level survey that is aggregated to the industry-year level for public use
Robustness
One possible concern with a long-run panel study like ours is that we find spurious correlations
driven by the fact that our dependent variables and our measure of regulation both increase over
time even though they may not be causally related to each other We believe our study deals
with this situation by using year fixed effects and by using what are essentially first-differenced
variablesmdashwe measure flows (firm births firm deaths and new hires) rather than stocks
(current number of existing firms and current number of employees) Formal tests for a unit root
in our dependent variables confirm this intuition A Fisher unit-root test using augmented
Dickey-Fuller tests rejects the null hypothesis of a unit root for all our dependent variables (with
p lt 001 for all variables)
16
Another way to address concerns about causality in a panel setting is to investigate
Granger causality to see whether changes in one variable occur before changes in another
Granger causality tests with one lag show that regulation Granger-causes firm births but firm
births do not Granger-cause regulation Similarly regulation Granger-causes new hires but new
hires do not Granger-cause regulation Neither firm deaths nor regulation Granger-cause each
other that finding matches up with our insignificant results for overall firm deaths
6 Conclusion
Using novel data on the intensity of regulation by industry we provide evidence that supports the
idea that regulation has a negative effect on new firm creation and employment growth Small
firms are affected more dramatically than are large firms in our sample but neither small nor
large firms seem to exit an industry when the intensity of regulation increases In fact we find
that large incumbents are actually less likely to die when their industry becomes more regulated
That finding suggests that incumbents in particular benefit from increasing levels of regulation
and provides support for the idea that incumbents might actively seek increasing regulation to
deter entry and limit competition (consistent with capture theory)
We find that a 10 percent increase in regulation leads to a 05 percent reduction in new
firm births and a 09 percent reduction in hiring Over the period 1998 to 2011 that we study
RegData shows that the overall level of federal regulation increased by 24 percent Thus our
results suggest that from 1998 to 2011 increased federal regulation reduced the entry of new
firms by 12 percent and reduced hiring by 22 percent That result implies that returning to the
level of regulation in effect in 1998 would lead to the creation of 30 new firms and the hiring of
530 new employees every year for an average industry
17
Overall our results confirm that regulators should be more aware of the important
tradeoff between regulation and firm creationmdashand by extension economic growth Regulators
should consider more carefully the potential economic effects of their decisions regarding new
and expanding levels of regulation
18
Bibliography
Acemoglu D Johnson S amp Robinson J (2001) The Colonial Origins of Comparative Development An Empirical Investigation American Economic Review 91(5) 1369ndash401
Al-Ubaydli O amp McLaughlin P A (2014) RegData A Numerical Database on Industry-Specific Regulations for All US Industries and Federal Regulations 1997ndash2012 Mercatus Working Paper Mercatus Center at George Mason University Arlington VA
Baumol W (1990) Entrepreneurship Productive Unproductive and Destructive Journal of Political Economy 98(5) 893ndash921
Bjoslashrnskov C amp Foss N J (2008) Economic Freedom and Entrepreneurial Activity Some Cross-Country Evidence Public Choice 134(34) 307ndash28
Calcagno P T amp Sobel R S (2014) Regulatory Costs on Entrepreneurship and Establishment Employment Size Small Business Economics 42(3) 541ndash59
Coffey B McLaughlin P A amp Tollison R (2012) Regulators and Redskins Public Choice 153(12) 191ndash204
Dawson J amp Seater J (2013) Federal Regulation and Aggregate Economic Growth Journal of Economic Growth 18(2) 137ndash77
Djankov S La Porta R Lopez-de-Silanes F amp Shleifer A (2002) The Regulation of Entry Quarterly Journal of Economics 117(1) 1ndash37
Djankov S McLiesh C amp Ramalho R M (2006) Regulation and Growth Economics Letters 92(3) 395ndash401
Hall R amp Jones C (1999) Why Do Some Countries Produce So Much More Output per Worker than Others Quarterly Journal of Economics 114 (1) 83ndash116
Klapper L Laeven L amp Rajan R (2006) Entry Regulation as a Barrier to Entrepreneurship Journal of Financial Economics 82(3) 591ndash629
Maloney M T amp McCormick R E (1982) A Positive Theory of Environmental Quality Regulation Journal of Law and Economics 25(1) 99ndash123
Mulligan C amp Shleifer A (2005) The Extent of the Market and the Supply of Regulation Quarterly Journal of Economics 120(4) 1445ndash73
Nystroumlm K (2008) The Institutions of Economic Freedom and Entrepreneurship Evidence from Panel Data Public Choice 136(34) 269ndash82
Peltzman S (1976) Toward a More General Theory of Regulation Journal of Law and Economics 19(2) 211ndash40 Conference on the Economics of Politics and Regulation
19
Peltzman S (1989) The Economic Theory of Regulation after a Decade of Deregulation Brookings Papers on Economic Activity Microeconomics 1989 (special issue) 1ndash59
Pigou A (1938) The Economics of Welfare 4th edition London MacMillan
RegData database version 20 Developed by Patrick A McLaughlin Omar Al-Ubaydli and the Mercatus Center at George Mason University httpregdataorgtype=regulatory _restrictionsampregulator[]=0
Sobel R S (2008) Testing Baumol Institutional Quality and the Productivity of Entrepreneurship Journal of Business Venturing 23(6) 641ndash55
Sobel R S Clark J amp Lee D R (2007) Freedom Barriers to Entry Entrepreneurship and Economic Progress Review of Austrian Economics 20 221ndash36
Stigler G J (1971) The Theory of Economic Regulation Bell Journal of Economics and Managment Science 2(1) 3ndash21
Thomas L G (1990) Regulation and Firm Size FDA Impacts on Innovation The RAND Journal of Economics 21(4) 497ndash517
Tullock G (1967) The Welfare Costs of Tariffs Monopolies and Theft Western Economic Journal 5(3) 224ndash32
20
Appendix Data Distribution and Robustness Checks
Figure A1 Distributions of Key Variables Untransformed Variables Compared for Their Natural Log
Source Data are from the 1998ndash2011 Statistics of US Businesses
21
Figure A2 Distributions of Key Variables Untransformed Variables Compared for Their Natural Log
Source Data on new hires are from the 1998ndash2011 Statistics of US Businesses Data on regulation are from the 1998ndash2011 RegData database
22
Table A1 Effect of Regulatory Index on Firm Births when Macroeconomic Controls Are Included
Variables13 (1)13 (2)13 (3)13
All13 firms13 Small13 firms13 Large13 firms13
lnRegulation13 minus0050213 minus0042513 minus0064213 (00182)13 (00172)13 (00478)13
Time13 minus026513 minus014713 013913 (00585)13 (00662)13 (0182)13
GDP13 growth13 minus0059713 minus00065913 minus0075713 (000961)13 (000832)13 (00270)13
Productivity13 0062113 0063013 0014013 (000940)13 (000908)13 (00309)13
Interest13 rates13 10-shy‐year13 treasuries13 minus0086513 minus0085913 024313 (00337)13 (00417)13 (0107)13
Unit13 labor13 costs13 0033113 0026013 minus010213 (00196)13 (00229)13 (00594)13
GDP13 price13 index13 minus0034513 00011913 minus0026213 (00193)13 (00202)13 (00505)13
Gross13 private13 domestic13 investment13 minus00012613 minus00012513 minus213e-shy‐0513 (0000177)13 (0000171)13 (0000660)13
Corporate13 profits13 000099913 000060013 minus000035413 (0000163)13 (0000208)13 (0000525)13
Unemployment13 minus0061413 minus017913 minus0080413 (00376)13 (00423)13 (0138)13
Industrial13 production13 0071313 0028713 0013913 (000833)13 (000785)13 (00254)13
Constant13 525513 293613 minus267313 (1146)13 (1297)13 (3564)13
Observations13 249313 248613 238013 R213 015113 010413 003313 F-shy‐stat13 349913 198613 553913
p lt 01 p lt 005 p lt 001 Note Robust standard errors are in parentheses
23
Table A2 Effect of Regulatory Index on Firm Deaths when Macroeconomic Controls Are Included
Variables13 (1)13 (2)13 (3)13
All13 firms13 Small13 firms13 Large13 firms13
lnRegulation13 minus0014413 minus000043313 minus0090513 (00217)13 (00216)13 (00476)13
Time13 minus0074913 00070213 minus052113 (00765)13 (00699)13 (0162)13
GDP13 growth13 minus0064913 minus0042113 minus0081413 (000860)13 (000928)13 (00206)13
Productivity13 0030213 minus0018413 015713 (000968)13 (000813)13 (00246)13
Interest13 rates13 10-shy‐year13 treasuries13 0043913 0047113 minus0046213 (00423)13 (00398)13 (00957)13
Unit13 labor13 costs13 minus0028313 minus0028613 0069613 (00273)13 (00219)13 (00535)13
GDP13 price13 index13 minus0065313 minus0042413 minus018713 (00137)13 (00171)13 (00446)13
Gross13 private13 domestic13 investment13 minus000024313 000098113 minus00013113 (0000188)13 (0000202)13 (0000494)13
Corporate13 profits13 681e-shy‐0513 minus000038413 000086113 (0000204)13 (0000175)13 (0000454)13
Unemployment13 0024213 016413 0023413 (00509)13 (00605)13 (0118)13
Industrial13 production13 0043313 00077613 010113 (000761)13 (00104)13 (00199)13
Constant13 152913 minus735513 102013 (1498)13 (1368)13 (3168)13
Observations13 249213 247513 244913 R213 006513 003313 006113 F-shy‐stat13 147413 109713 141613
p lt 01 p lt 005 p lt 001 Note Robust standard errors are in parentheses
24
Table A3 Effect of Regulatory Index on New Hires when Macroeconomic Controls Are Included
Variables13 (1)13 (2)13 (3)13
All13 firms13 Small13 firms13 Large13 firms13
lnRegulation13 minus0093413 minus0053413 minus0090613 (00319)13 (00199)13 (00566)13
Time13 minus014413 minus0053113 010413 (0108)13 (00966)13 (0253)13
GDP13 growth13 minus0058513 minus00055813 minus0031513 (00170)13 (00117)13 (00337)13
Productivity13 0085513 0030113 0043913 (00191)13 (00126)13 (00397)13
Interest13 rates13 10-shy‐year13 treasuries13 0055013 minus0052313 012813 (00605)13 (00602)13 (0157)13
Unit13 labor13 costs13 minus0026013 000097313 minus0075913 (00350)13 (00324)13 (00855)13
GDP13 price13 index13 minus0064813 0037113 minus0048113 (00291)13 (00280)13 (00652)13
Gross13 private13 domestic13 investment13 00013813 000072013 minus000032813 (0000359)13 (0000220)13 (0000800)13
Corporate13 profits13 000043313 000025213 minus000043913 (0000324)13 (0000286)13 (0000712)13
Unemployment13 minus017813 minus010813 minus025513 (00842)13 (00540)13 (0173)13
Industrial13 production13 0061913 0017813 minus00052213 (00150)13 (00110)13 (00307)13
Constant13 290313 111013 minus192613 (2107)13 (1892)13 (4958)13
Observations13 236213 181013 169013 R213 017013 008513 009513 F-shy‐stat13 291013 124713 103113
p lt 01 p lt 005 p lt 001 Note Robust standard errors are in parentheses13
- 1 Introduction
- 2 Literature Review
- 3 Data
- 4 Empirical Strategy
- 5 Results
-
- Firm Births
- Firm Deaths
- New Hires
- Alternative Measures
- Robustness
-
- 6 Conclusion
- Bibliography
- Appendix Data Distribution and Robustness Checks
-
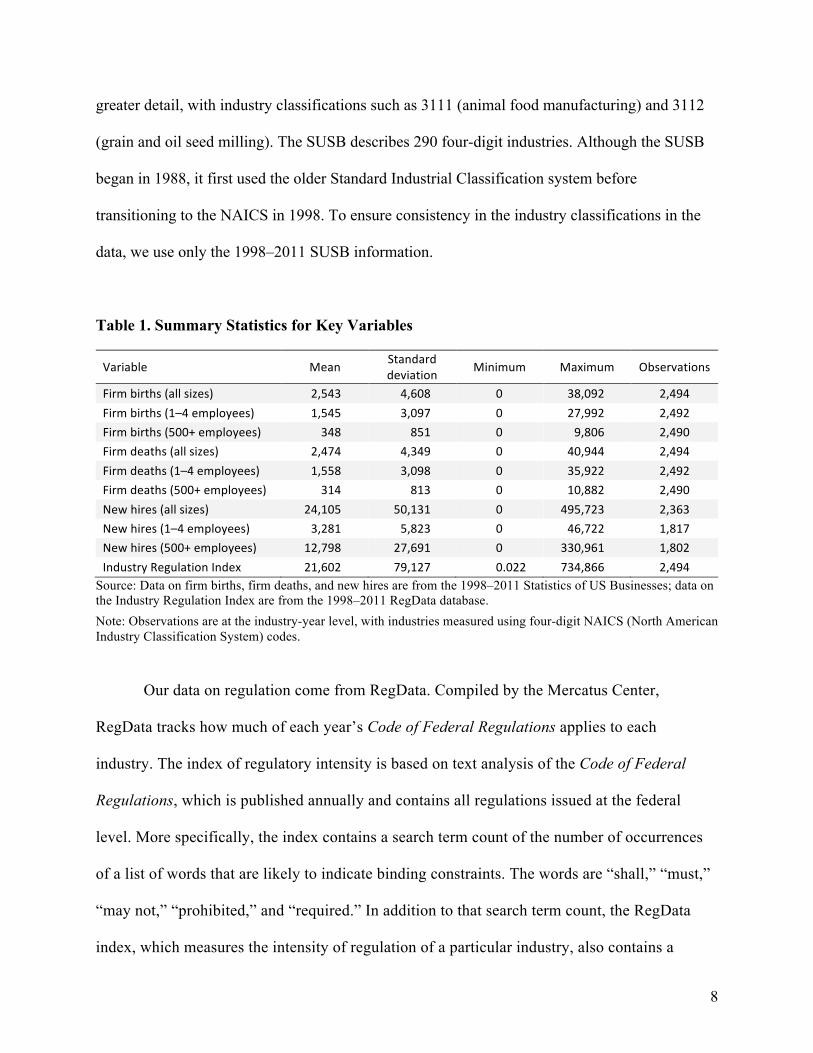
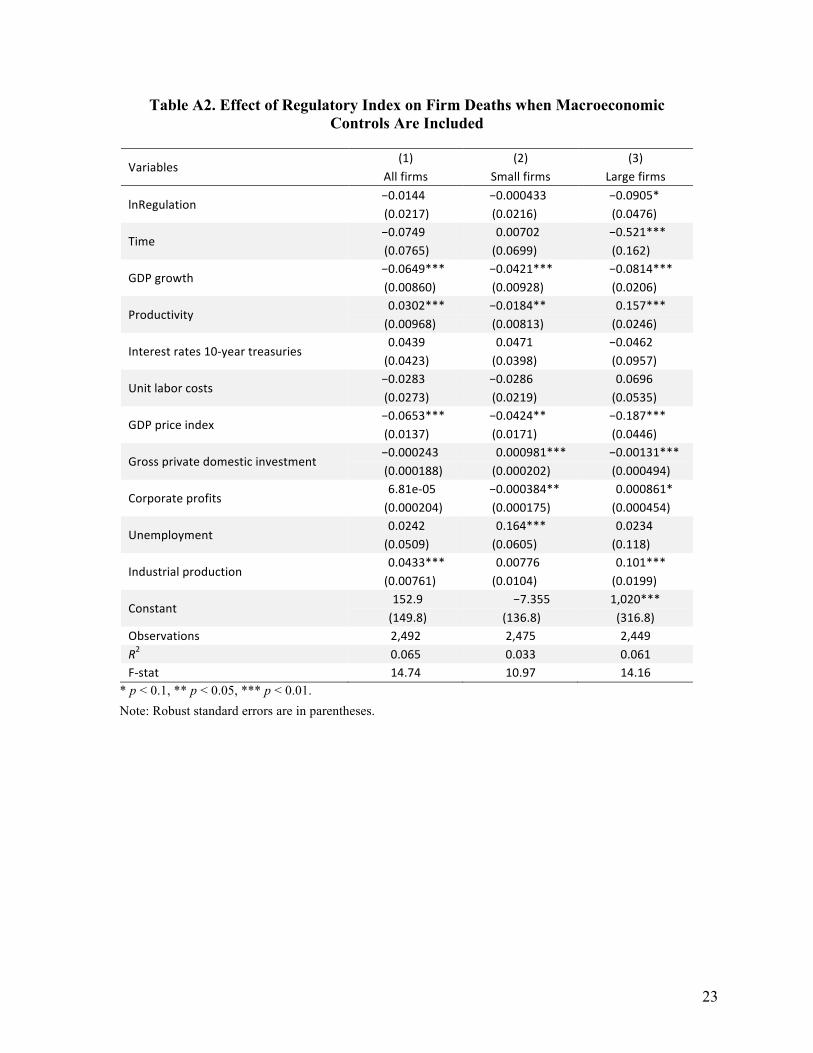