regulated spacing of synapses and presynaptic active zones at larval neuromuscular junctions in...
TRANSCRIPT
Regulated Spacing of Synapsesand Presynaptic Active Zones at LarvalNeuromuscular Junctions in Different
Genotypes of the Flies Drosophilaand Sarcophaga
I.A. MEINERTZHAGEN,1* C.K. GOVIND,2 B.A. STEWART,3 J.M. CARTER,1
AND H.L. ATWOOD3
1Neuroscience Institute, Life Sciences Centre, Dalhousie University,Halifax, Nova Scotia, Canada B3H 4J1
2Life Sciences Division, University of Toronto at Scarborough,Scarborough, Ontario, Canada M1C 1A4
3Department of Physiology, Faculty of Medicine, University of Toronto,Toronto, Ontario, Canada M5S 1A8
ABSTRACTSynapses at larval neuromuscular junctions of the flies Drosophila melanogaster and
Sarcophaga bullata are not distributed randomly. They have been studied in serial electronmicrographs of two identified axons (axons 1 and 2) that innervate ventral longitudinalmuscles 6 and 7 of the larval body wall. The following fly larvae were examined: axon1—wild-type Sarcophaga and Drosophila and Drosophila mutants duncem14 and fasIIe76, ahypomorphic allele of the fasciclin II gene; and axon 2—drosophila wild-type, duncem14, andfasIIe76. These lines were selected to provide a wide range of nerve terminal phenotypes inwhich to study the distribution and spacing of synapses. Each terminal varicosity is appliedclosely to the underlying subsynaptic reticulum of the muscle fiber and has 15–40 synapses.Each synapse usually bears one or more active zones, characterized by dense bodies that areT-shaped in cross section; they are located at the presumed sites of transmitter release. Thedistribution of synapses was characterized from the center-to-center distance of each synapseto its nearest neighbor. The mean spacing between nearest-neighbor pairs ranged from 0.84µm to 1.05 µm for axon 1, showing no significant difference regardless of genotype. Thecorresponding values for axon 2, 0.58 µm to 0.75 µm, were also statistically indistinguishablefrom one another in terminals of different genotype but differed significantly from the valuesfor axon 1. Thus, the functional class of the axon provides a clear prediction of the spacing ofits synapses, suggesting that spacing may be determined by the functional properties oftransmission at the two types of terminals. Individual dense bodies were situated mostly atleast 0.4 µm away from one another, suggesting that an interaction between neighboringactive zones could prevent their final positions from being located more closely. J. Comp.Neurol. 393:482–492, 1998. r 1998 Wiley-Liss, Inc.
Indexing terms: dense body; transmitter release; synaptogenesis; fasII; dunce
When neurons establish functionally correct synapticpartnerships during synaptogenesis, the number of syn-apses they form matches both the need for transmitterrelease from the presynaptic terminal and the location ofpostsynaptic receptor sites, in order to attain the requisitesafety factor for transmission (Lnenicka and Mellon,1983a,b). During this process, synaptic sites become local-ized on regions of the presynaptic nerve terminals wherecontacts have been established with the postsynaptictarget cell (Dennis, 1981; Govind, 1992; Grinnell, 1995;
Grant Sponsor: NSERC; Grant numbers: CPG 0181755, OPG 0006967,OPG 00000065; Grant sponsor: NIH; Grant number; EY-03592.
J.M. Carter is presently with the Program in Neuroscience, Division ofNeurobiology, Arizona Research Laboratories, 611 Gould-Simpson ScienceBuilding, University of Arizona, Tucson, AZ 85721.
*Correspondence to: I.A. Meinertzhagen, Neuroscience Institute, LifeSciences Centre, Dalhousie University, Halifax, Nova Scotia, Canada B3H4J1. E-mail: [email protected]
Received 18 June 1997; Revised 26 November 1997; Accepted 28 Novem-ber 1997
THE JOURNAL OF COMPARATIVE NEUROLOGY 393:482–492 (1998)
r 1998 WILEY-LISS, INC.
Haydon and Drapeau, 1995; Keshishian et al., 1996). Theresult is the allocation of a proportion of the membraneareas of both presynaptic and postsynaptic cells to zones ofmutual apposition. For many synaptic partners, theseproportions are regulated (Nicol and Meinertzhagen, 1982a;Sargent, 1983). Within the area of presynaptic membraneapposition to the postsynaptic target, specialized activezones for release of neurotransmitter are established(Propst et al., 1986; Prokop et al., 1996). The number ofactive zones is regulated, apparently in accordance withthe functional demands of neurotransmission. At thecrayfish neuromuscular junction, for example, high-outputterminals have more active zones than low-output termi-nals (Cooper et al., 1995a, 1996b).
The spacing of active zones on each input terminal mayalso be regulated, although, to date, this aspect hasreceived less rigorous study. An ideal location to map suchdistributions is at the neuromuscular junction, where thecylindrical shape of the postsynaptic muscle fiber readilyprojects to a planar surface, and the spheroidal shape ofthe presynaptic terminal’s surface can also be readilymapped (Jahromi and Atwood, 1974; Atwood et al., 1978).Recent interest in the genetically manipulable neuromus-cular organization of Drosophila, either in its differenti-ated state in the mature larva (Jan and Jan, 1976;Kurdyak et al., 1994) or during target selection (Johansenet al., 1989; Sink and Whitington, 1991a–c) and synapto-genesis in the embryo (Broadie and Bate, 1993a,b; Bateand Broadie, 1995), provides a model invertebrate synapse(Keshishian et al., 1996) at which to examine the questionsof how active zones are distributed and whether theirdistribution is perturbed by genetic mutations affectingthe nerve terminals.
This distribution can be viewed as a record of the sites atwhich synapses form. The record is a running log thatreveals not only what occurs during synaptogenesis in theembryo (Broadie and Bate, 1993a,b; Bate and Broadie,1995) but also the possible influence of postembryonicsynaptic turnover or migration, which is well recognized atthe crustacean neuromuscular junction (Govind, 1982)and elsewhere in nervous systems (Cotman et al., 1981).The occurrence of such processes would be expected tomodify the initial pattern through synaptic dysjunctionand reformation in the differentiated nervous system.
In Diptera, such as Drosophila, the location of a synapticactive zone is often manifested by the presence of apresynaptic ribbon or dense body, which is T-shaped incross section (Meinertzhagen, 1996). Such dense bodiesprovide a clear marker for the presumed site of transmit-ter release, for which clear evidence exists from studies notonly on neuromuscular junctions (Heuser et al., 1979;Heuser and Reese, 1981) but also on vertebrate hair cells(Roberts et al., 1991; Issa and Hudspeth, 1994, 1996) andsynapses of photoreceptor terminals (Saint Marie andCarlson, 1982).
In this study, we have examined the distribution ofactive zones at neuromuscular junctions of ventral longitu-dinal muscles 6 and 7 of the fly larva, which are innervatedby terminals of only two motoneurons (Jan and Jan, 1976;Broadie et al., 1993; Keshishian et al., 1993). These twoidentifiable neurons were studied in larvae of differentgenetic backgrounds in which the number and size ofneuromuscular terminals are known to differ. We exam-ined the hypothesis that synapses distribute randomlyover the surface of the terminal and, in addition, investi-
gated the effects of differences in nerve terminal morphol-ogy and axon type on the spacing of synapses and activezones, to test the hypothesis that synapses and their activezones are altered in their spacing when the morphology ofa terminal changes. A preliminary report appeared previ-ously (Meinertzhagen et al., 1996).
MATERIALS AND METHODS
Animals
Neuromuscular terminals were examined from two spe-cies of Diptera, the fruitfly Drosophila melanogaster andthe fleshfly Sarcophaga bullata. Drosophila were eitherCanton-S wild type or one of two mutants: duncem14a
(dncm14; Dudai et al., 1976) and fasIIe76. The former is amutant null allele of the gene for cAMP-specific phosphodi-esterase (Chen et al., 1986), in which evoked transmitterrelease is increased, and exhibits altered calcium depen-dence (Zhong and Wu, 1991); and in which other studieshave demonstrated overgrowth and increased branchingof nerve terminals (Zhong et al., 1992; Schuster et al.,1996). The latter is a hypomorphic allele of the genefasciclin II, which is generated by imprecise excision(Greningloh et al., 1991) in which expression of the adhe-sion molecule Fasciclin II is less than 10% of that in thewild type, resulting in reduced neuromuscular terminals(fewer varicosities) and larger synapses (Stewart et al.,1996). The fleshfly, Sarcophaga bullata, was also exam-ined as a second case in which the neuromuscular termi-nals are larger than in wild type Drosophila.
Electron microscopy
Wandering third-instar larvae of Drosophila and Sar-cophaga were dissected in Schneider’s medium at roomtemperature (23°C) by making a dorsal midline incisionand pinning the cuticle out flat. The internal organs wereremoved carefully to expose the muscles of the body wall(Crossley, 1978; Bate, 1993) and the peripheral motorinnervation (Hertweck, 1931), according to proceduresmodified from previously published methods (Atwood etal., 1993). The dissected preparation was superfused withprimary fixative comprising of 3% glutaraldehyde and0.5% paraformaldehyde in 0.1 M phosphate buffer, pH 7.2,with 4% sucrose added for 0.5 hour. Abdominal segment 3with exposed muscles 6 and 7 was then isolated and fixedfor a further 1–2 hours in fresh primary fixative. Afterfixation, the tissue was washed in the same buffer for 20minutes, postfixed in 1% osmium tetroxide for 1 hour,rinsed in buffer for 20 minutes, and then dehydrated inethanol, cleared in propylene oxide, and embedded inresin.
Muscles 6 and 7 were located and identified in thick (0.5µm) sections prior to retrimming the block face to includethese muscles in ultrathin (approximately 80 nm) sections.Series of sections were mounted on Formvar-coated, single-slot grids and stained with lead citrate and uranyl acetate.Series of 70–200 sections, 70–90 nm thick, were used toreconstruct segments approximately 5–15 µm long andbearing one or more varicosities of the terminals of axons 1and 2 from micrograph negatives at magnifications of7,0003 (Sarcophaga, fasIIe76) or 12,0003 (all other Dro-sophila series).
SYNAPSE SPACING AT FLY NEUROMUSCULAR TERMINALS 483

Computer reconstructionsof neuromuscular terminals
The three-dimensional (3-D) surfaces of motor nerveterminals were reconstructed from consecutive thin-section profiles by using a computer graphics workstation(ICAR, ISG Technologies, Inc., Mississauga, Ontario,Canada) with customized graphics accelerator boards andcomputer-reconstruction software (Allegro 5.0.1: ISG Tech-nologies, Inc.), as described previously (Meinertzhagenand Hu, 1996). To display the profiles of the synapticcontacts and their dense bodies on the presynaptic mem-brane surface, we traced them directly onto the membraneitself. Reconstructions were carried out to a limit of 210sections.
Reconstructions of neuromuscular terminals were basedon the following EM series. 1) Drosophila melanogasterwild type (209 sections averaging 77 nm thick, with 5.9%sections missed), dncm14 (84 sections averaging 74 nmthick, with 10.7% sections missed), and fasIIe76 hypomorph(series 1 of 153 sections and series 2 of 95 sections with1.0% sections missed, both averaging 75 nm thick); and 2)Sarcophaga bullata wild type (89 sections averaging 82nm thick, with 10.1% sections missed).
The reconstructions present clear views of neuronalsurfaces decorated with the locations of synaptic contactsites (Fig. 1A). The latter were readily identified in elec-tron micrographs from the densely stained and uniformlyspaced pre- and postsynaptic membranes. The distancesbetween the centers of these sites were measured by usingthe ICAR software: The operator traced the shortest pathbetween them over the reconstructed plasmalemma sur-face that appeared on the monitor screen. This gavedirectly the topographical distances between synapticcenters. Dimensions were calibrated to the nearest 0.1 µm,despite a reading accuracy for the movement of thekeyboard mouse estimated at 60.05 µm.
Distances between nearest-neighborsynapses and active-zone dense bars
Distances were measured between the centers of everysynaptic contact site and its nearest neighbor (the smallestof the distances to all other neighboring sites) as well asbetween every dense bar (the structure of the active zonelocated inside the presynaptic membrane) and its nearestneighbor. Three distances were measured (Fig. 1C): i) Thedistance between dense bodies in two adjacent synapses
Fig. 1. Mapping the distribution of active zones at a neuromuscu-lar terminal: Drosophila wild type axon 1. A: Reconstructed plasma-lemma surface of part of terminal decorated with the sites of synapses(white patches) and their presynaptic dense bodies (black). B: Map ofthe center-to-center spacing of synapses, including synapses that lacka dense body, at the same magnification as A. Synaptic sites 9–14 and21 are those connected in A by lines. Note that A is an aerial view, and
B is a map and that the two differ because of distortion introduced bythe surface topography of the terminal. C: Three parameters of thedistances between adjacent active zones: Parameter (i), the distancebetween nearest-neighbor dense bodies in adjacent synapses; param-eter (ii), the distance between nearest-neighbor dense bodies in thesame synapse; parameter (iii), the distance between nearest-neighborsynapses. Scale bar 5 1.0 µm (also applies to A).
484 I.A. MEINERTZHAGEN ET AL.
was measured for all pairs of complete synapses. ii) Thesedistances were augmented by the closer distances mea-sured between dense bodies in the same synapse, and alldistances were then mapped for the entire terminal. iii) Toinclude synapses that lacked a dense body (often 10–20%of the total: Atwood et al., 1993), the distances betweensynaptic centers were also measured. Because the siteswere of finite area, this required designating a center foreach site, which was assigned from the point of intersec-tion of two arbitrarily selected orthogonal diameters.Center-to-center spacings for all pairs of synapses weremeasured, including those synapses lacking dense bodies.Thus, parameter iii was used to describe the distribution ofall synapses, parameter i was used to describe the distribu-tion of dense bodies at those synapses, and parameter iiwas used to describe the distribution of all dense bodies,regardless of their allocation to individual synapses. Aftermapping, the coordinates for each synapse were entered ina spreadsheet (Excel 4.0; Microsoft Corp; Redmond, WA),and nearest-neighbor distances were calculated by usingcustom C-program software on an IBM Pentium computer(Armonk, NY).
The distances obtained were then analyzed within thecorresponding frequency distributions by using the TukeyHSD test (Systat 5.2.1; Systat Inc; Evanston, IL), andcenter-to-center spacings were tested for a normal distribu-tion by plotting them against the expectation for a nor-mally distributed population by using a normal probabilityplot of standardized data (Systat). The sample size wasdetermined by the number of units being tested; thus, forthe comparison of individual terminal varicosities, thenumber of varicosities was used as the sample size ratherthan the number of animals.
Spatial distribution of synaptic sites
The distances between neighboring synaptic sites, asmeasured for the three categories above, were used todraw maps (Fig. 1B) manually by using a compass and themethod of triangulation (Meinertzhagen and Hu, 1996).Analysis of these maps was then used to test the distribu-tion patterns of synapses and their dense bodies over theterminal’s surface. This required the accurate surveyingand projection of the 3-D topographical surface of terminalvaricosities upon a 2-D map, a process that necessarilyinvolved the introduction of small distortions betweendistant sites over the terminal but that preserved the localspacings between neighboring sites (Meinertzhagen andHu, 1996).
We examined the spatial distributions of synaptic sitesand dense bodies to determine whether a pattern existsthat is either contagious (clustered) or regular (evenlydistributed). The overall area of presynaptic membraneoccupied by the synapses was measured from the map oftheir positions (Fig. 1B) by using commercial software(Minicad13.1, Diehl Graphsoft, Inc; Ellicott City, MD),and the observed mean center-to-center spacings werethen compared with those expected for the same number ofsynapses within the same area of membrane, to give theratio R. R is 1.0 for a random distribution, less than 1 for acontagious distribution, and more than 1 for a distributionthat is regular (Clark and Evans, 1954). The calculation ofR omitted consideration of edge effects.
RESULTS
Identification and reconstructionof synaptic terminals
The musculature of the larval abdomen receives innerva-tion from motoneurons in the ventral ganglion of thecentral nervous system (CNS; Sink and Whitington, 1991b;Keshishian et al., 1993; Yeh et al., 1995). The ventrallongitudinal muscles 6 and 7 of the larval abdomen receivethe simplest pattern of innervation of muscles of thisgroup: Both muscles are innervated conjointly by only twomotoneurons, which give rise to Type I varicosities (.2 µmdiameter) on the surfaces of the innervated muscles. Oneof the motoneurons (RP3; Broadie et al., 1993) gives rise toaxon 1 (Atwood et al., 1993), which forms relatively largevaricosities (termed Type Ib); the other (neuron 6/7b;Keshishian et al., 1993) gives rise to axon 2, whichproduces varicosities of smaller average diameter (termedType Is; Kurdyak et al., 1994).
The terminals of these two physiologically identifiedneurons, arising from their respective motor innervations,axon 1 and axon 2, were studied in larvae of differentgenetic backgrounds. Compared with the wild type, termi-nals in the mutant dncm14 are overgrown and establish alarger terminal surface in total, whereas, in fasIIe76, theyare reduced and have fewer but larger varicosities. Inaddition, we compared two species, one large (Sarcophaga)and the other small (Drosophila). These comparisonsallowed us to seek principles in synaptic spacing that areindependent of differences both in size and between spe-cies.
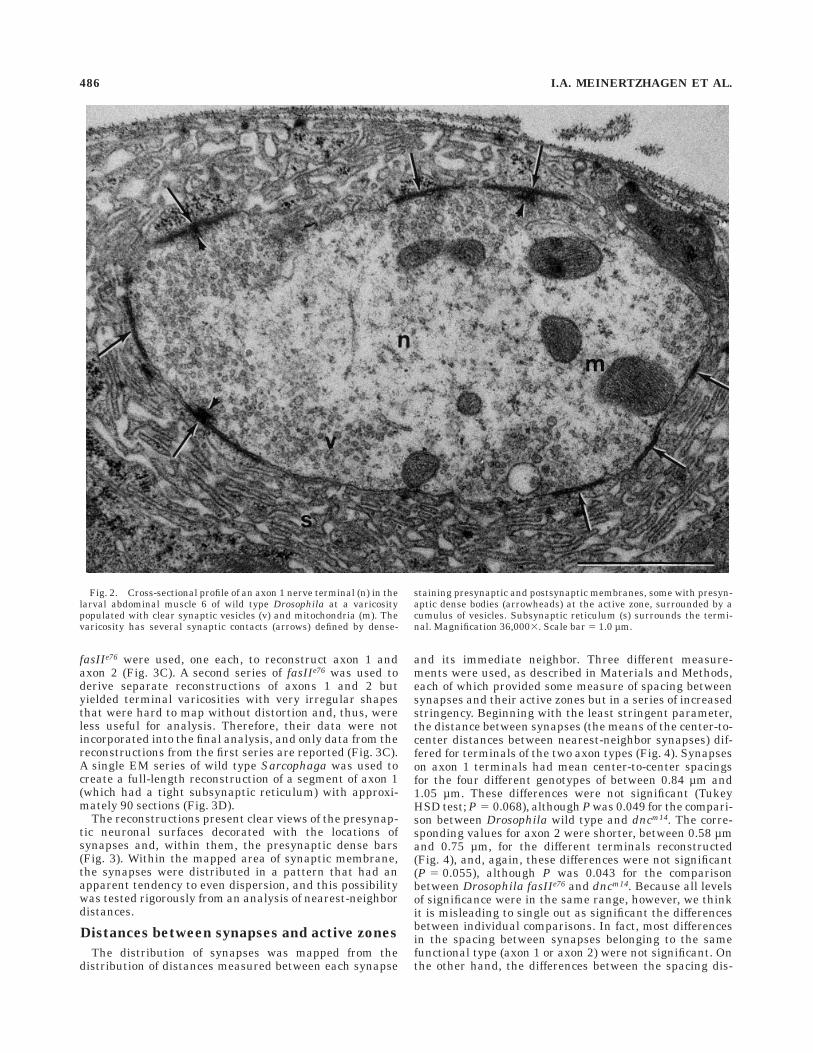
In electron microscopy (EM), Type Ib terminals (fromaxon 1) have been distinguished from Type Is terminals(from axon 2) on the basis of previously reported ultrastruc-tural criteria, especially the greater development of thesubsynaptic reticulum around Type Ib varicosities, andtheir larger mean size and greater mitochondrial content(Atwood et al., 1993; Fig. 2). A similar differentiation hasalso been observed for Sarcophaga (Feeney, 1995). Forboth axons 1 and 2 and for both species of fly, synapseswere identified from the presence of an electron-densecoating of the presynaptic membrane, within which one ormore characteristic profiles of presynaptic dense bodieswere frequently situated, located at presumptive activezones and associated with a cumulus of synaptic vesicles(Atwood et al., 1993; Fig. 2). The terminology for synapseand active zone used here differs from that used by someother workers (see, e.g., Schuster et al., 1996). In commonwith synaptic sites elsewhere in the dipteran nervoussystem (Meinertzhagen, 1996), the dense bodies wereT-shaped in cross section.
Three dimensional reconstructions of the synaptic vari-cosities reveal the latter as irregular ellipsoids over whichit was possible to view the distribution of synapses andtheir dense bodies for each of the different types of larvaexamined. Reconstructions of segments of the larval termi-nals of wild type Canton S Drosophila were made from aseries of 209 micrographs in which terminals from bothaxons fit into a single image stack (Fig. 3A). For this seriesalone, the basal lamina surrounding the axons and form-ing part of the muscle was also reconstructed. A series of 90sections from dncm14 was used to reconstruct two smallersegments of terminals from this mutant (Fig. 3B). Twoseparate image stacks made from a single EM series of
SYNAPSE SPACING AT FLY NEUROMUSCULAR TERMINALS 485
fasIIe76 were used, one each, to reconstruct axon 1 andaxon 2 (Fig. 3C). A second series of fasIIe76 was used toderive separate reconstructions of axons 1 and 2 butyielded terminal varicosities with very irregular shapesthat were hard to map without distortion and, thus, wereless useful for analysis. Therefore, their data were notincorporated into the final analysis, and only data from thereconstructions from the first series are reported (Fig. 3C).A single EM series of wild type Sarcophaga was used tocreate a full-length reconstruction of a segment of axon 1(which had a tight subsynaptic reticulum) with approxi-mately 90 sections (Fig. 3D).
The reconstructions present clear views of the presynap-tic neuronal surfaces decorated with the locations ofsynapses and, within them, the presynaptic dense bars(Fig. 3). Within the mapped area of synaptic membrane,the synapses were distributed in a pattern that had anapparent tendency to even dispersion, and this possibilitywas tested rigorously from an analysis of nearest-neighbordistances.
Distances between synapses and active zones
The distribution of synapses was mapped from thedistribution of distances measured between each synapse
and its immediate neighbor. Three different measure-ments were used, as described in Materials and Methods,each of which provided some measure of spacing betweensynapses and their active zones but in a series of increasedstringency. Beginning with the least stringent parameter,the distance between synapses (the means of the center-to-center distances between nearest-neighbor synapses) dif-fered for terminals of the two axon types (Fig. 4). Synapseson axon 1 terminals had mean center-to-center spacingsfor the four different genotypes of between 0.84 µm and1.05 µm. These differences were not significant (TukeyHSD test; P 5 0.068), although P was 0.049 for the compari-son between Drosophila wild type and dncm14. The corre-sponding values for axon 2 were shorter, between 0.58 µmand 0.75 µm, for the different terminals reconstructed(Fig. 4), and, again, these differences were not significant(P 5 0.055), although P was 0.043 for the comparisonbetween Drosophila fasIIe76 and dncm14. Because all levelsof significance were in the same range, however, we thinkit is misleading to single out as significant the differencesbetween individual comparisons. In fact, most differencesin the spacing between synapses belonging to the samefunctional type (axon 1 or axon 2) were not significant. Onthe other hand, the differences between the spacing dis-
Fig. 2. Cross-sectional profile of an axon 1 nerve terminal (n) in thelarval abdominal muscle 6 of wild type Drosophila at a varicositypopulated with clear synaptic vesicles (v) and mitochondria (m). Thevaricosity has several synaptic contacts (arrows) defined by dense-
staining presynaptic and postsynaptic membranes, some with presyn-aptic dense bodies (arrowheads) at the active zone, surrounded by acumulus of vesicles. Subsynaptic reticulum (s) surrounds the termi-nal. Magnification 36,0003. Scale bar 5 1.0 µm.
486 I.A. MEINERTZHAGEN ET AL.
tances of synapses from axon 1 as a group and of synapsesfrom axon 2 as a group were highly significant(P , 0.00001). Within individual genotypes, the differencebetween axon 1 and axon 2 had the lowest probability ofsignificance in dncm14 (P 5 0.0066), whereas the two otherDrosophila comparisons had P , 0.001. Thus, axon 2synapses were more closely spaced than those of axon 1,even though axon 2 had fewer synapses per varicosity thanaxon 1 (Atwood et al., 1993).
Distribution of center-to-center distances between
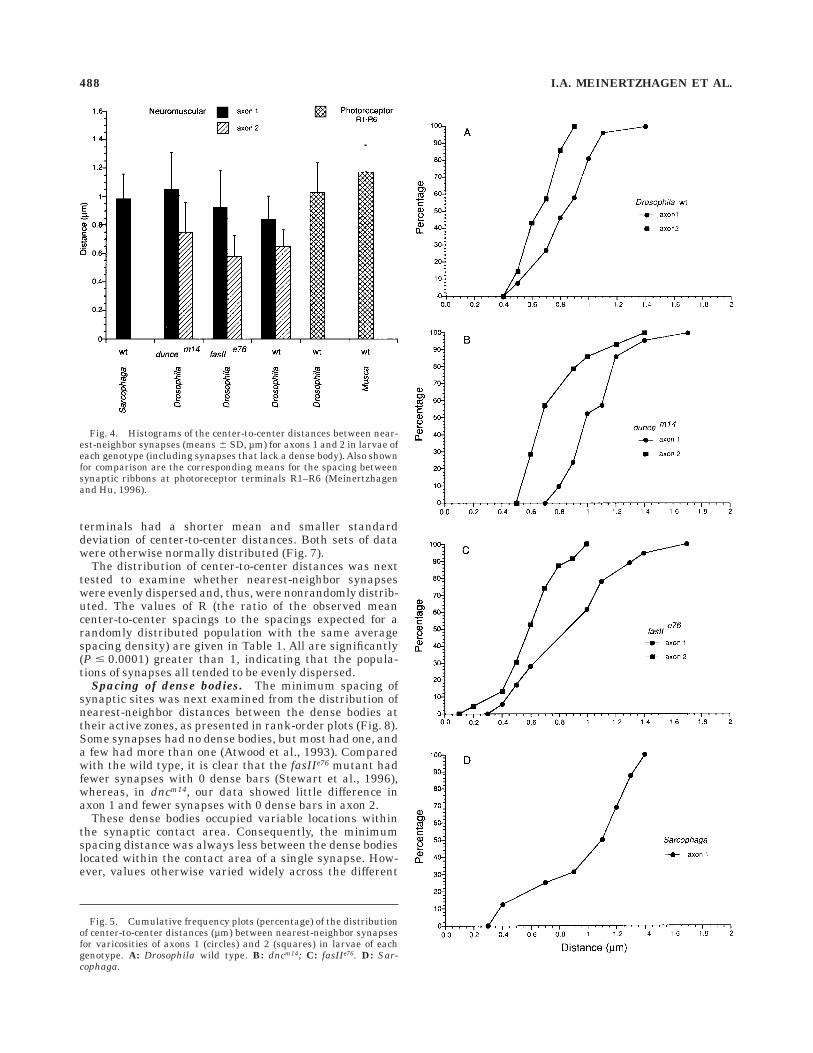
nearest-neighbor synapses. The distribution of center-to-center distances between nearest-neighbor synapseswas plotted separately for each genotype (Fig. 5). Valuesfor axon 1 varicosities in Drosophila ranged from 0.41 µmto 0.98 µm for the wild type (Fig. 5A) compared with0.78–1.62 µm for dncm14 (Fig. 5B) and 0.33–1.63 µm forfasIIe76 (Fig. 5C). The corresponding values for Sarcophagawere 0.36–1.39 µm (Fig. 5D). For axon 2 in Drosophila,
values ranged from 0.40 µm to 0.80 µm for the wild type(Fig. 5A) compared with 0.50–1.35 µm for dncm14 (Fig. 5B)and 0.18–0.98 µm for fasIIe76 (Fig. 5C). The minimumcenter-to-center distances between nearest-neighbor syn-apses (the intercepts at the abscissae in Fig. 5A–C) did notdiffer invariably in the terminals of axon 1 from those inaxon 2, whereas the minimum center-to-center distancesfor both axon 1 and axon 2 terminals might have beensmaller in the e76 excision line of the fas II gene than inthe other genotypes. For the distribution of distancevalues, on the other hand, qualitative differences did existbetween the plots for axon 1 and axon 2. Because thesample sizes for individual plots were small, however, toanalyze the distribution of synaptic sites and pursue thisquestion further, data were pooled to give two largerpopulations of distances (81 for the synapses of axon 1, 51for those of axon 2). Comparison of the pooled datarevealed that the distributions differed (Fig. 6): Axon 2
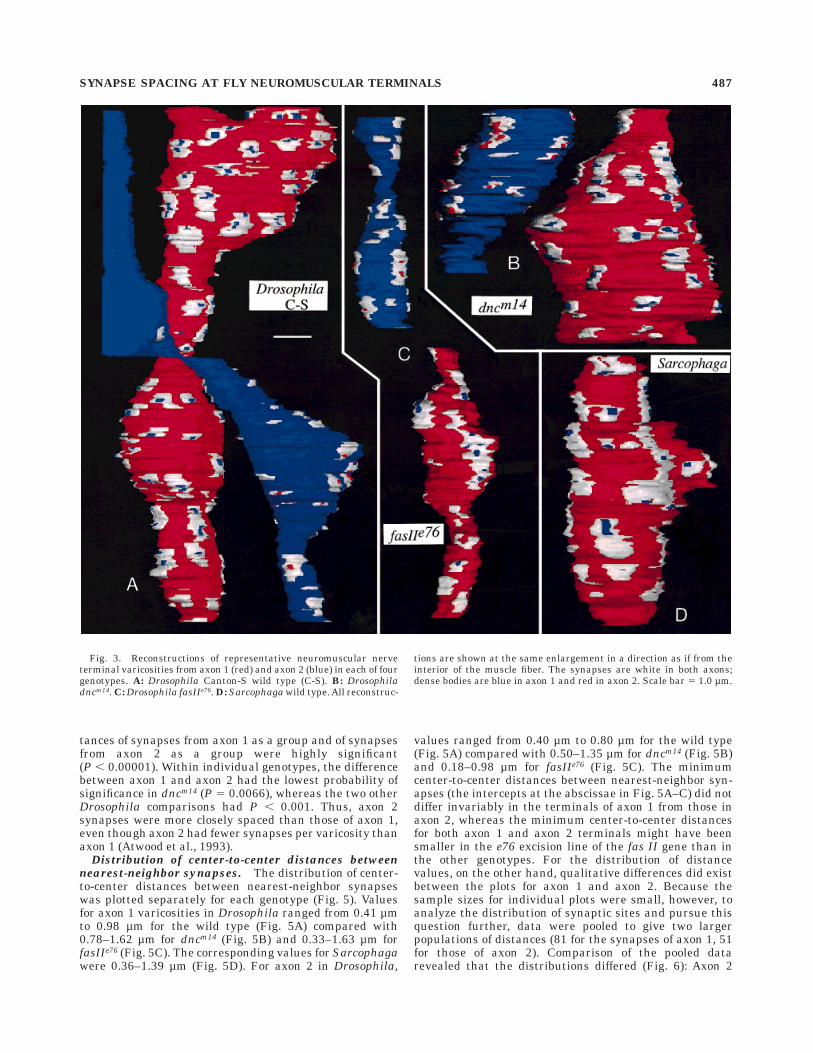
Fig. 3. Reconstructions of representative neuromuscular nerveterminal varicosities from axon 1 (red) and axon 2 (blue) in each of fourgenotypes. A: Drosophila Canton-S wild type (C-S). B: Drosophiladncm14. C: Drosophila fasIIe76. D: Sarcophaga wild type. All reconstruc-
tions are shown at the same enlargement in a direction as if from theinterior of the muscle fiber. The synapses are white in both axons;dense bodies are blue in axon 1 and red in axon 2. Scale bar 5 1.0 µm.
SYNAPSE SPACING AT FLY NEUROMUSCULAR TERMINALS 487
terminals had a shorter mean and smaller standarddeviation of center-to-center distances. Both sets of datawere otherwise normally distributed (Fig. 7).
The distribution of center-to-center distances was nexttested to examine whether nearest-neighbor synapseswere evenly dispersed and, thus, were nonrandomly distrib-uted. The values of R (the ratio of the observed meancenter-to-center spacings to the spacings expected for arandomly distributed population with the same averagespacing density) are given in Table 1. All are significantly(P # 0.0001) greater than 1, indicating that the popula-tions of synapses all tended to be evenly dispersed.
Spacing of dense bodies. The minimum spacing ofsynaptic sites was next examined from the distribution ofnearest-neighbor distances between the dense bodies attheir active zones, as presented in rank-order plots (Fig. 8).Some synapses had no dense bodies, but most had one, anda few had more than one (Atwood et al., 1993). Comparedwith the wild type, it is clear that the fasIIe76 mutant hadfewer synapses with 0 dense bars (Stewart et al., 1996),whereas, in dncm14, our data showed little difference inaxon 1 and fewer synapses with 0 dense bars in axon 2.
These dense bodies occupied variable locations withinthe synaptic contact area. Consequently, the minimumspacing distance was always less between the dense bodieslocated within the contact area of a single synapse. How-ever, values otherwise varied widely across the different
Fig. 4. Histograms of the center-to-center distances between near-est-neighbor synapses (means 6 SD, µm) for axons 1 and 2 in larvae ofeach genotype (including synapses that lack a dense body). Also shownfor comparison are the corresponding means for the spacing betweensynaptic ribbons at photoreceptor terminals R1–R6 (Meinertzhagenand Hu, 1996).
Fig. 5. Cumulative frequency plots (percentage) of the distributionof center-to-center distances (µm) between nearest-neighbor synapsesfor varicosities of axons 1 (circles) and 2 (squares) in larvae of eachgenotype. A: Drosophila wild type. B: dncm14; C: fasIIe76. D: Sar-cophaga.
488 I.A. MEINERTZHAGEN ET AL.

reconstructed terminals, represented as plots from theaxon 1 dense bodies in wild type Drosophila (Fig. 8A) anddncm14 (Fig. 8B), revealing no clear trend. This was prob-ably because of the small sample of synapses available formany terminal varicosities, some of which had around 40synapses, but others had less than 20.
The minimum spacing between dense bodies was about0.40 µm. Among terminals of axon 1, the numbers ofsynaptic dense bodies situated closer than 0.40 µm fromthe neighboring dense body were as follows: Sarcophaga (2of 27 pairs); Drosophila wild type (2 of 35), fasIIe76 (3 of 13),and dncm14 (2 of 30). The corresponding numbers amongterminals of axon 2 were as follows: Drosophila wild type(0 of 12 dense bodies situated closer than 0.40 µm from theneighboring dense body), dncm14 (2 of 17 situated closer),and fasIIe76 (6 of 13). Thus, for the particular terminalsreconstructed in Drosophila, axon 1 in dncm14 had morewidely spaced synapses than the wild type (Fig. 8), whereasboth axon 1 and axon 2 in fasIIe76 had closer minimumdistances (more pairs situated closer than 0.40 µm) thanthe corresponding axons in the wild type. The small
number of sampled synapses that we were able to recon-struct in all terminals restricted the validity of thisconclusion, confirmation of which may have to awaitanalysis by less laborious methods. Among the distribu-tions of active zones at all terminals, for sites with morethan one dense body, the separation between two densebodies at the same site was generally among the least ofthe distances measured between all dense bodies, i.e., itwas generally less than the distance between the densebodies at different synapses (Fig. 8). This was a more orless inevitable outcome of the roughly circular shape ofmost active zones.
DISCUSSION
Spacing of sites
The spacing of synaptic sites on the varicosities ofneuromuscular terminals exhibits three major phenom-ena. First, the overall density of synaptic sites depends onthe functional class of terminal. This density is greater forthe terminals of axon 2, which, however, have fewer activezones on each varicosity. Second, there is a clear minimumspacing between adjacent active zones, revealed as theminimum center-to-center distance between nearest-neighbor dense bodies. Third, there is a variable separa-tion between the dense bodies at synaptic sites. Thesethree points will be addressed in turn.
Differences between terminalsfrom axon 1 and axon 2
The analysis presented here confirms that varicositiesfrom axon 1 are larger and have more active zones thanthose from axon 2, as found previously (Atwood et al.,1993). The maximum number of synapses over terminalvaricosities of axon 1 was somewhat less than 40, whereas,for axon 2, the corresponding number was eight. The sizeof the synapses and the mean number of dense bodies ineach synapse, by contrast, are both similar (Atwood et al.,1993). The present results confirm previous findings (At-wood et al., 1993).
The spacing density of synapses is characteristic foreach neuromuscular terminal type, axon 1 or axon 2,regardless of the genetic background of the fly. Thisconservation is not only unaffected by the species of flylarva, but it is also unaffected by the enlarged terminalarborizations and altered calcium dependence in release oftransmitter in dncm14 (Zhong and Wu, 1991; Schuster etal., 1996) as well as by the average enlargement ofterminal varicosities and their reduced number in fasIIe76
(Stewart et al., 1996). Thus, the decreased number ofboutons in fasIIe76 is accompanied by an increase in size ofsynapses (Stewart et al., 1996), but these conserve theirmean spacing density. The density of active zones and,thus, of transmitter-release sites, seems to be determinedautonomously by the terminal in ways that differ betweenthe two motoneurons. The patterns of their central activa-tion (Kurdyak et al., 1994) are known to affect synapsedistribution in crayfish neuromuscular terminals (Lnenickaet al., 1986) and could also be a major determining factorat the larval neuromuscular junctions of the fly. In fact,there are a number of similarities in physiology andstructure between axons 1 and 2 in Drosophila andbetween ‘‘tonic’’ and ‘‘phasic’’ neurons of crustaceans (At-wood and Cooper, 1995).
Fig. 6. Cumulative frequency plots (percentage) for the minimumspacings (µm) between nearest-neighbor synapses. Open symbols;neuromuscular synapses, including those that lack a dense body; datawere pooled from those in Figure 5 separately for axon 1 (circles) andaxon 2 (squares) in Drosophila, regardless of genotype; solid symbols;for comparison, data on presynaptic ribbons of photoreceptor tetradsin wild type Drosophila (squares) and Musca (circles) are plotted fromdata in Meinertzhagen and Hu (1996).
Fig. 7. Pooled center-to-center distances between synapses foraxon 1 and axon 2 for data pooled from Figure 5, normalized withrespect to mean (0) and multiples of S.D., plotted against valuesexpected for a normal distribution with the same mean and S.D. Thecloseness of the linearity of the relationship between observed andexpected values and of its slope to 1 indicates the closeness of theobserved values to a normal distribution.
SYNAPSE SPACING AT FLY NEUROMUSCULAR TERMINALS 489

The physiology of transmitter release also differs at thetwo types of terminals and may be correlated with thedifferences in spacing among synapses and active zones.There is evidence to suggest that the properties of facilita-tion differ for the two motoneurons innervating the larvalmuscle in Drosophila (Kurdyak et al., 1994), and theprobability of transmitter release from each active zonealso differs. Despite the constant mean size of the synapseand the mean number of its dense bodies in each type ofterminal (Atwood et al., 1993), in an external calcium-ionconcentration of 1 mM terminal varicosities of both typesrelease about 3 quanta per impulse (Stewart, 1996; Karu-nanithi, Stewart, and Atwood, unpublished observations).Because the number of synapses per varicosity is muchhigher for axon 1, the probability of release from eachactive zone at terminals of axon 2 is greater. This corre-lates with the higher density of release sites in varicositiesof axon 2.
Placement of active zones
Active zones are distributed nonrandomly over thesurface of the presynaptic membrane of the nerve termi-nal. All synaptic populations tend toward even spacing,which is apparent from visual inspection and was con-firmed by spatial statistics. Even spacing arises in partfrom the minimum spacing that is found between synapticsites distributed over the surfaces of the reconstructedneuromuscular varicosities. Only in axon 2 of fasIIe76 weremany active zones situated less than the minimum dis-tance of 0.40 µm away from their nearest neighbor. Theexistence of a finite, minimal spacing between active zonessuggests that adjacent sites may interact during synapto-genesis in a manner that greatly reduces the probabilitythat a dense body at a synapse can be established within adistance less than 0.4 µm from another dense body. Asimilar distribution with a tendency to even dispersion oftransmitter-release sites has been found over the surfaceof photoreceptor terminals, where it has been proposed tooptimize the concentration of transmitter in the synapticcleft (Meinertzhagen and Hu, 1996). Beyond the exclusionzone established by the minimum spacing distance aroundeach active zone, the distances between active zone centersare normally distributed. This suggests that the place-ment of individual sites itself is not geometrically con-strained but is probabilistic.
Minimum spacing between synapticdense bodies
The spacing between active zones could also be assessedfrom the minimum distance between dense bodies, whichwas about 0.40 µm. Closer spacing among dense bodies hasbeen recorded in terminal varicosities of the crayfish(Cooper et al., 1996a), in which many pairs of dense bodieswere situated closer than 0.40 µm. By comparison, the
Fig. 8. Rank-order plots for the distances between all dense bodiesand their nearest neighbors for axon 1 in Drosophila. A: Canton-S wildtype. B: dncm14. Solid symbols, distances between two closest densebodies occurring within the same synapse; open symbols, distancesbetween a dense body and the nearest dense body in an adjacentsynapse.
TABLE 1. Nearest-Neighbor Distances (µm 6 S.D.) Between Synapses of Different Presynaptic Terminals
Species Genotype Mean N-N Axon R1 Mean N-N Axon R1 P*
Drosophila Wild type 0.84 6 0.16 1 1.91 0.65 6 0.12 2 1.89 1.5 3 1023
Drosophilia dncm14 1.05 6 0.18 1 2.10 0.75 6 0.21 2 1.73 3.5 3 1024
Drosophilia fasIIe76 0.93 6 0.26 1 2.63 0.58 6 0.15 2 1.50 1.0 3 1024
Sarcophaga Wild type 0.77 6 0.31 1 2.08
1The ratio between the observed mean center-to-center spacings and those expected for the population of synapses in the area of membrane reconstructed (Clark and Evans, 1954),omitting consideration of edge effects. N-N, nearest neighbor.*Unpaired t-test, two tailed (Statview 5121).
490 I.A. MEINERTZHAGEN ET AL.
corresponding minimum spacing distance between presyn-aptic ribbons (dense bodies) in adult photoreceptor termi-nals is much greater (Fig. 6). Thus, for only about 13% ofpairs of synaptic ribbons in Drosophila photoreceptorterminals, R1–R6, was the minimum distance shorterthan 0.8 µm, whereas in Musca R1–R6 the correspondingnumber was as low as 5% of pairs (Meinertzhagen and Hu,1996). In the lobster, a strong correlation exists betweenthe number of presynaptic dense bodies and the strengthof transmission of the nerve terminal (Govind and Chiang,1979), both of which are down-regulated after axotomy(Chiang and Govind, 1984). Not until a recent detailedstudy, however, has the number of dense bodies per surfacearea of terminal varicosity and the number of dense bodiesper synapse been clearly shown to be greater at high-output terminals of the crayfish excitor motoneuron to theopener muscle than at low-output terminals (Cooper et al.,1995b). Apparently, synapses with multiple dense bodieshave a greater probability of transmitter release (Wojtow-icz et al., 1994). The results presented here indicate thatsynapses in axon 2, which have a higher rate of transmit-ter release per synapse, also have more closely spaceddense bodies than their counterparts in axon 1.
Similarities in the spacing of active zones betweenphotoreceptor and neuromuscular synapses exist despitemanifest differences in the organization of postsynapticcells at these two sites. Rather than a single postsynapticcell, as at the neuromuscular synapse, at photoreceptorsynapses, each active zone abuts four postsynaptic ele-ments, constituting a tetrad (Burkhardt and Braitenberg,1976; Frohlich, 1985; Meinertzhagen and O’Neil, 1991).The presynaptic focus for each tetrad is a dense body, orpresynaptic ribbon, which is the actual site of vesicleexocytosis (Saint Marie and Carlson, 1982). At tetradsynapses, it is now well demonstrated that presynapticribbons can change in number (Brandstatter and Mein-ertzhagen, 1995; Rybak and Meinertzhagen, 1997) and,thus, are labile structures (Meinertzhagen, 1993). Thesame appears to be true for dense bodies at the neuromus-cular synapses of the crayfish, which increase in numberfollowing high-frequency stimulation of an isolated prepa-ration (Wojtowicz et al., 1994) or in an intact animal(Mearow and Govind, 1989). The distribution of densebodies seen here in normal larval neuromuscular termi-nals, therefore, may also reflect the pattern of recentaddition of new dense bodies as well as the disappearanceof old dense bodies.
ACKNOWLEDGMENTS
We thank Dr. Leo Marin and Ms. Joanne Pearce forelectron microscopy and Ms. J.A. Horne for writing theprogram for the analysis of nearest-neighbor distancesand for processing the digital images. This work wassupported by NSERC grants, CPG 0181755 (I.A.M.,H.L.A.), OPG 0006967 (C.K.G.), and OPG 00000065 (I.A.M.)
LITERATURE CITED
Atwood, H.L. and R.L. Cooper (1995) Functional and structural parallels incrustacean and Drosophila neuromuscular systems. Am Zool. 35:556–565.
Atwood, H.L., C.K. Govind, and I. Kwan (1978) Nonhomogeneous excita-tory synapses of a crab stomach muscle. J. Neurobiol. 9:17–28.
Atwood, H.L., C.K. Govind, and C.-F. Wu (1993) Differential ultrastructureof synaptic terminals on ventral longitudinal abdominal muscles inDrosophila larvae. J. Neurobiol. 24:1008–1024.
Bate, M. (1993) The mesoderm and its derivatives. In M. Bate and A.Martinez Arias (eds): The Development of Drosophila melanogaster.Plainview, NY: Cold Spring Harbor Laboratory Press, pp. 1013–1090.
Bate, M. and K.S. Broadie (1995) Wiring by fly: The neuromuscular systemof the Drosophila embryo. Neuron 15:513–525.
Brandstatter, J.H. and I.A. Meinertzhagen (1995) The rapid assembly ofsynaptic sites in photoreceptor terminals of the fly’s optic lobe recover-ing from cold shock. Proc. Natl. Acad. Sci. USA 92:2677–2681.
Broadie, K.S. and M. Bate (1993a) Activity-dependent development of theneuromuscular synapse during Drosophila embryogenesis. Neuron11:607–619.
Broadie, K.S. and M. Bate (1993b) Development of the embryonic neuromus-cular synapse of Drosophila melanogaster. J. Neurosci. 13:144–166.
Broadie, K., H. Sink, D. Van Vactor, D. Fambrough, P.M. Whitington, M.Bate, and C.S. Goodman (1993) From growth cone to synapse: The lifehistory of the RP3 motor neuron. Development 119(Suppl.):227–238.
Burkhardt, W. and V. Braitenberg (1976) Some peculiar synaptic complexesin the first visual ganglion of the fly, Musca domestica. Cell Tissue Res.173:287–308.
Chen, C.N., S. Denome, and R.L. Davis (1986) Molecular analysis of cDNAclones and the corresponding genomic coding sequences of the Dro-sophila dunce1 gene, the structural gene for cAMP phosphodiesterase.Proc. Natl. Acad. Sci. USA 83:9313–9317.
Chiang, R.G. and C.K. Govind (1984) Decrease in transmitter output andsynaptic ultrastructure at lobster neuromuscular terminals with decen-tralization. Brain Res. 299:265–279.
Clark, P.J. and F.C. Evans (1954) Distance to nearest neighbor as ameasure of spatial relationships in populations. Ecology 35:445–453.
Cooper, R.L., L. Marin, and H.L. Atwood (1995a) Synaptic differentiation ofa single motor neuron: Conjoint definition of transmitter release,presynaptic calcium signals, and ultrastructure. J. Neurosci. 15:4209–4222.
Cooper, R.L., B.A. Stewart, J.M. Wojtowicz, S. Wang, and H.L. Atwood(1995b) Quantal measurement and analysis methods compared forcrayfish and Drosophila neuromuscular junctions and rat hippocam-pus. J. Neurosci. Methods 61:67–78.
Cooper R.L., J.L. Winslow, C.K. Govind, and H.L. Atwood (1996a) Synapticstructural complexity as a factor enhancing probability of calcium-mediated transmitter release. J. Neurophysiol. 75:2451–2466.
Cooper, R.L., C.C. Harrington, L. Marin, and H.L. Atwood (1996b) Quantalrelease at visualized terminals of a crayfish motor axon: Intraterminaland regional differences. J. Comp. Neurol. 375:583–600.
Cotman, C.W., M. Nieto-Sampedro, and E.W. Harris (1981) Synapsereplacement in the nervous system of adult vertebrates. Physiol. Rev.61:684–784.
Crossley, A.C. (1978) The morphology and development of the Drosophilamuscular system. In M. Ashburner and T.R.F. Wright (eds): TheGenetics and Biology of Drosophila, Vol. 2b. New York: Academic Press,pp. 499–560.
Dennis, M.J. (1981) Development of the neuromuscular junction: Inductiveinteractions between cells. Annu. Rev. Neurosci. 4:43–68.
Dudai, Y., Y.N. Jan, D. Byers, W.G. Quinn, and S. Benzer (1976) dunce, amutant of Drosophila deficient in learning. Proc. Natl. Acad. Sci. USA73:1684–1688.
Feeney, C.-J. (1995) Two types of motor nerve terminals on abdominalmuscles in larval flesh flies, Sarcophaga bullata [M.Sc. thesis]. Depart-ment of Zoology, University of Toronto.
Frohlich, A. (1985) Freeze-fracture study of an invertebrate multiple-contact synapse: The fly photoreceptor tetrad. J. Comp. Neurol. 241:311–326.
Govind, C.K. (1982) Development of nerve, muscle and synapse. In D.E.Bliss, H.L. Atwood, and D.C. Sandeman (eds): The Biology of Crustacea,Vol. 3, Neurobiology: Structure and Function. New York: AcademicPress, pp. 185–204.
Govind, C.K. (1992) Age-related remodeling of lobster neuromuscularterminals. Exp. Gerontol. 27:63–74.
Govind, C.K. and R.G. Chiang (1979) Correlation between presynapticdense bodies and transmitter output at lobster neuromuscular termi-nals by serial section electron microscopy. Brain Res. 161:377–388.
Grenningloh, G., E.J. Rehm, and C.S. Goodman (1991) Genetic analysis ofgrowth cone guidance in Drosophila: Fasciclin II functions as a neuro-nal recognition molecule. Cell 67:45–57.
Grinnell, A.D. (1995) Dynamics of nerve-muscle interaction in developingand mature neuromuscular junctions. Physiol. Rev. 75:789–834.
SYNAPSE SPACING AT FLY NEUROMUSCULAR TERMINALS 491
Haydon, P.G. and P. Drapeau (1995) From contact to connection: Earlyevents during synaptogenesis. Trends Neurosci. 18:196–201.
Hertweck, H. (1931) Anatomie und Variabilitat des Nervensystems und derSinnesorgane von Drosophila melanogaster (Meigen). Z. Wissen. Zool.139:559–663.
Heuser, J.E. and T.S. Reese (1981) Structural changes after transmitterrelease at the frog neuromuscular junction. J. Cell Biol. 88:564–580.
Heuser, J.E., T.S. Reese, M.J. Dennis, Y. Jan, L. Jan, and L. Evans (1979)Synaptic vesicle exocytosis captured by quick freezing and correlatedwith quantal transmitter release. J. Cell Biol. 81:275–300.
Issa, N.P. and A.J. Hudspeth (1994) Clustering of Ca21 channels and Ca21
-activated K1 channels at fluorescently labeled presynaptic active zonesof hair cells. Proc. Natl. Acad. Sci. USA 91:7578–7582.
Issa, N.P. and A.J. Hudspeth (1996) The entry and clearance of Ca21 atindividual presynaptic active zones of hair cells from the bullfrog’ssacculus. Proc. Natl. Acad. Sci. USA 93:9527–9532.
Jahromi, S.S. and H.L. Atwood (1974) Three-dimensional ultrastructure ofthe crayfish neuromuscular apparatus. J. Cell Biol. 63:599–613.
Jan, L.Y. and Y.N. Jan (1976) Properties of the larval neuromuscularjunction in Drosophila melanogaster. J. Physiol. 262:189–214.
Johansen, J., M.E. Halpern, and H. Keshishian (1989) Axonal guidance andthe development of muscle-fiber-specific innervation in Drosophilaembryos. J. Neurosci. 9:4318–4332.
Keshishian, H., A. Chiba, T.N. Chang, M.S. Halfon, E.W. Harkins, J.Jarecki, L. Wang, M. Anderson, S. Cash, M.E. Halpern, and J. Johansen(1993) Cellular mechanisms governing synaptic development in Dro-sophila melanogaster. J. Neurobiol. 24:757–787.
Keshishian, H., K.S. Broadie, A. Chiba, and M. Bate (1996) The Drosophilaneuromuscular junction: A model system for studying synaptic develop-ment and function. Annu. Rev. Neurosci. 19:545–575.
Kurdyak, P., H.L. Atwood, B.A. Stewart, and C.-F. Wu (1994) Differentialphysiology and morphology of motor axons to ventral longitudinalmuscles in larval Drosophila. J. Comp. Neurol. 350:463–472.
Lnenicka, G.A. and D. Mellon (1983a) Transmitter release during normaland altered growth of identified muscle fibres in the crayfish. J. Physiol.345:285–296.
Lnenicka, G.A. and D. Mellon (1983b) Changes in electrical properties andquantal current during growth of identified muscle fibres in thecrayfish. J. Physiol. 345:261–284.
Lnenicka, G.A., H.L. Atwood, and L. Marin (1986) Morphological transfor-mation of synaptic terminals of a phasic motoneuron by long-term tonicstimulation. J. Neurosci. 6:2252–2258.
Mearow, K.M., and C.K. Govind (1989) Stimulation-induced changes atcrayfish (Procambarus clarkii) neuromuscular terminals. Cell TissueRes. 256:119–123.
Meinertzhagen, I.A. (1993) The synaptic populations of the fly’s opticneuropil and their dynamic regulation: Parallels with the vertebrateretina. Progr. Retinal Res. 12:13–39.
Meinertzhagen, I.A. (1996) Ultrastructure and quantification of synapsesin the insect nervous system. J. Neurosci. Methods 69:59–73.
Meinertzhagen, I.A. and X. Hu (1996) Evidence for site selection duringsynaptogenesis: The surface distribution of synaptic sites in photorecep-tor terminals of the flies Musca and Drosophila Cell. Mol. Neurobiol.16:677–698.
Meinertzhagen, I.A. and S.D. O’Neil (1991) Synaptic organization ofcolumnar elements in the lamina of the wild type in Drosophilamelanogaster. J. Comp. Neurol. 305:232–263.
Meinertzhagen, I.A., C.K. Govind, J. Pearce, B.A. Stewart, and H.L. Atwood(1996) Constant spacing of synaptic release sites at photoreceptor andneuromuscular terminals in the fly. In N. Elsner and H.-U. Schnitzler(eds): Proc. 24th Gottingen Neurobiology Conference, Gottingen, Ger-many, Vol. II. Stuttgart: Georg Thieme Verlag, p. 560.
Nicol, D. and I.A. Meinertzhagen (1982a) An analysis of the number andcomposition of the synaptic populations formed by photoreceptors of thefly. J. Comp. Neurol. 207:29–44.
Prokop, A., M. Landgraf, E. Rushton, K. Broadie, and M. Bate (1996)Presynaptic development at the Drosophila neuromuscular junction:Assembly and localization of presynaptic active zones. Neuron 17:617–626.
Propst, J.W., A.A. Herrera, and C. Ko (1986) A comparison of active zonestructure in frog neuromuscular junctions from two fast muscles withdifferent synaptic efficacy. J. Neurocytol. 15:525–534.
Roberts, W.M., R.A. Jacobs, and A.J. Hudspeth (1991) The hair cell as apresynaptic terminal. Ann. NY Acad. Sci. 635:221–233.
Rybak, J. and I.A. Meinertzhagen (1997) The effects of light reversals onphotoreceptor synaptogenesis in the fly Musca domestica. Eur. J.Neurosci. 9:319–333.
Saint Marie, R.L. and S.D. Carlson (1982) Synaptic vesicle activity instimulated and unstimulated photoreceptor axons in the housefly. Afreeze-fracture study. J. Neurocytol. 11:747–761.
Sargent, P.B. (1983) The number of synaptic boutons terminating onXenopus cardiac ganglion cells is directly correlated with cell size. J.Physiol. (London) 343:85–104.
Schuster, C.M., G.W. Davis, R.D. Fetter, and C.S. Goodman (1996) Geneticdissection of structural and functional components of synaptic plastic-ity. II. Fasciclin II controls presynaptic structural plasticity. Neuron17:655–667.
Sink, H. and P.M. Whitington (1991a) Pathfinding in the central nervoussystem and periphery by identified embryonic Drosophila motor axons.Development 112:307–316.
Sink, H. and P.M. Whitington (1991b) Location and connectivity of abdomi-nal motoneurons in the embryo and larva of Drosophila melanogaster. J.Neurobiol. 22:298–311.
Sink, H. and P.M. Whitington (1991c) Early ablation of target musclesmodulates the arborisation pattern of an identified embryonic Dro-sophila motor axon. Development 113:701–707.
Stewart, B.A. (1996) Neuromuscular Physiology in Drosophila: NerveTerminal Morphology and Synaptic Strength [Ph.D. thesis]. Universityof Toronto.
Stewart, B.A., C.M. Schuster, C.S. Goodman, and H.L. Atwood (1996)Homeostasis of synaptic transmission in Drosophila with geneticallyaltered nerve terminal morphology. J. Neurosci. 16:3877–3886.
Wojtowicz, J.M., L. Marin, and H.L. Atwood (1994) Activity-inducedchanges in synaptic release sites at the crayfish neuromuscular junc-tion. J. Neurosci. 14:3688–3703.
Yeh, E., K. Gustafson, and G.L. Boulianne (1995) Green fluorescent proteinas a vital marker and reporter of gene expression in Drosophila. Proc.Natl. Acad. Sci. USA 92:7036–7040.
Zhong, Y. and C.-F. Wu (1991) Altered synaptic plasticity in Drosophilamemory mutants with a defective cyclic AMP cascade. Science 251:198–201.
Zhong, Y., V. Budnik, and C.-F. Wu (1992) Synaptic plasticity in Drosophilamemory and hyperexcitable mutants: Role of cAMP cascade. J. Neuro-sci. 12:644–651.
492 I.A. MEINERTZHAGEN ET AL.