regionally competitive energy tariffs and textile sector’s
TRANSCRIPT
Regionally Competitive Energy Tariffs and Textile Sector’s Competitiveness
Regionally Competitive Energy Tariffs and Textile Sector’s Competitiveness PIDE REPORT
MARCH
2021
ww
w.p
ide.
org
.pk
Regionally Competitive Energy Tariffs and Textile Sector’s Competitiveness
i PIDE
A Report by Pakistan Institute of Development Economics
Regionally Competitive Energy Tariffs
and Textile Sector’s Competitiveness
MARCH 2021
Regionally Competitive Energy Tariffs and Textile Sector’s Competitiveness
ii PIDE
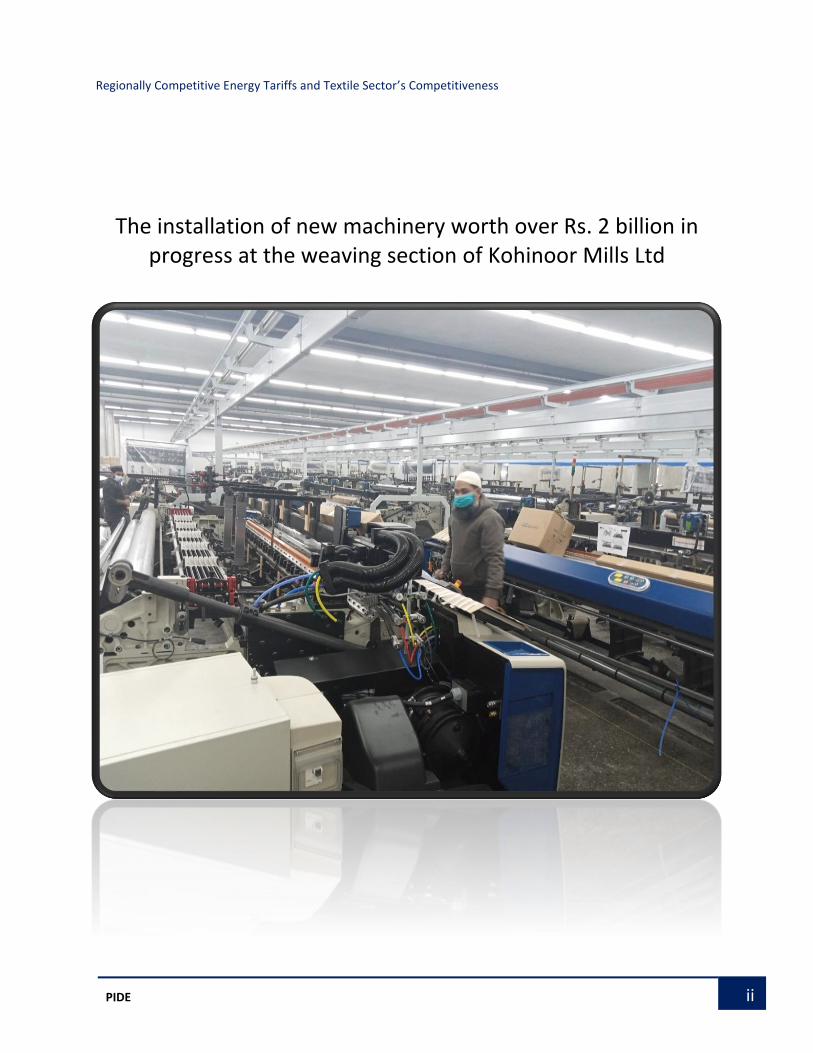
The installation of new machinery worth over Rs. 2 billion in progress at the weaving section of Kohinoor Mills Ltd
Regionally Competitive Energy Tariffs and Textile Sector’s Competitiveness
iii PIDE
ACKNOWLEDGEMENTS
This study was commissioned by All Pakistan Textile Mills Association (APTMA) to the Pakistan Institute
of Development Economics (PIDE), Islamabad. The report has been prepared under the supervision of Dr.
Nadeem Ul Haque, Vice Chancellor, PIDE. The report is prepared by the research team of PIDE
comprising Dr. Ahmed Waqar Qasim, Research Economist; Saddam Hussein, Research
Economist; Mohammad Shaaf Najib, Staff Economist and Dr. Uzma Zia, Senior Research Economist. The
report has also been peer-reviewed by Shahid H. Kardar, Vice Chancellor, Beaconhouse National
University (BNU) and Dr. Hafeez A. Pasha, Professor Emeritus, BNU.
Regionally Competitive Energy Tariffs and Textile Sector’s Competitiveness
iv PIDE
FOREWORD
Confused, inconsistent and unsteady policy plagues investors in Pakistan. The horizon for them
remains hazy or dark!. Is it any wonder then that Pakistan’s growth (as well as concomitant sectoral
growth) has been lackluster?
Policy seldom takes the big picture into account. It is rushed to meet the current emergency without
a long view. Government of the day is always trigger happy to claim credit and blame the past
lacking both the patience or the capacity to make considered, well-researched and holistic
decisions.
With policy capacity, attention span and processes so attenuated, it is not surprising to see vested
interests of all sorts overtaking government. Real resources are expended to capture policy rather
than develop businesses and grow the economy.
As a good example of the how policy continues to fumble, review the energy crisis. The direct loss
of the poorly conceived energy policy over the last 13 years amounts to Rs. 7 trillion and continues
to grow. Problems that have been discussed in the media have persisted without even a serious
discussion or debate. Some of these are
• The sector continues to be managed centrally without configuring self-sufficient cost
centers.
• Technology (such as smart, pay as you go, meters, smart grid) is little used.
• IPP issue has never been solved; instead, we continue to sign more contracts.
• Line losses persist without attention.
• Pricing continues to be penalized productive sectors, developing confused cross subsidies
and penalizing bulk industrial units.
• Consumers and investors continue to bear the burden of policy mistakes of the past.
• Energy planning is whimsical leading to long periods of large excess supply and demand.
These are only some issues that come to mind. I could give you a larger list. But this is enough to
make the point that problems persist, and policy has does not focus.
Surprisingly, the government has never put in any effort or resources into analyzing or researching
these issues and developing a comprehensive policy on energy or any of these issues. This allows
various vested interests such as the labor in the power sector, IPPs, suppliers, donors, and various
industry groups. Policy developed without serious deliberation, research and empowering of the
constituents of the sector, merely lays grounds for capture and waste of resources. We see ample
evidence of that.
We present here a study we did for APTMA to review the issue of ricing energy costs due to the
policy of passing on the cost of inability to reform to the consumer on the textile industry. To
highlight the policy consistency issues concerning the textile sector of Pakistan, this report
analyses the Regionally Competitive Energy Tariffs (RCET) given to the textile sector and their
impact on the textile sector, particularly the exports. The report argues that the government’s
policy of RCET has boosted value-added textile exports and now its abandonment by the
government will have serious repercussions for the industry.

Regionally Competitive Energy Tariffs and Textile Sector’s Competitiveness
v PIDE
Under the RCET policy, the government of Pakistan offered RLNG tariff at $6.5/mmbtu and
electricity tariffs at 7.5 cents/kWh. The electricity tariffs, however, were suddenly raised to 9
cents/kWh in September 2020. The change has been worrisome for the industry, as energy tariffs
have the most significant impact among all the factors that make textile exports regionally
uncompetitive. It also implies that a small change in the factor costs brings with it a substantial
impact on the country’s export performance.
It is pertinent to note that, Pakistan has robust untapped export potential in the textile sector. To
unfold this inherent potential, large investment in machinery, enhanced skill set, and product
development is critical. Nonetheless, success in these avenues is not possible in the absence of
supporting policies from the government, particularly in the backdrop of tough competition within
the textile sector in the region.
Presently, the textile sector is experiencing expansion and up-gradation, all because of the RCET
policy that has turned profits from the business into positive territory. The sector is seeking more
finances and asking for more technological up-gradation support. Now, to optimize the full
potential of the textile sector and retain as well as enhance the existing customer base, the
consistent implementation of RCET policy is the need of the time. However, with the whimsical
policy signals, we would not be able to develop investors’ confidence, and reap the full potential
benefits of the sector will remain a far-distant target.
The COVID pandemic, where it has damaged the economic situation worse, has also provided us
a chance to re-orient our textile sector according to the needs of the time. The policies from the
government that are supportive like, the RCET policy, will play a key role as a catalyst in this
reorientation.
Finally, reform should be a top priority. Without deep reform, the energy sector will continue to
bleed and eventually force our energy prices to rise to uncompetitive levels, incapacitating our
productivity, growth, and investment.
I would like to thank the All-Pakistan Textile Mills Association (APTMA) and Mr. Shahid Sattar,
Executive Director, APTMA, and Gohar Ejaz Patron of APTMA for providing us an opportunity
and for giving generously of their time to work with us. We welcome this opportunity to
collaborate with domestic industry.
PIDE is Pakistan’s premiere think tank and collaborates with a lot of ministries, regulatory
agencies, and many private and public agencies research on contract basis and otherwise. Such
collaborations are of extreme importance to developing the economy and better policy. So, I urge
all to collaborate with PIDE.
Nadeem Ul Haque
Vice-Chancellor
Regionally Competitive Energy Tariffs and Textile Sector’s Competitiveness
vi PIDE
Table of Contents
1. Pakistan’s Textile Sector: Introduction ....................................................................................................... 1
2. Structure of Textile Sector ............................................................................................................................ 2
3. Export Performance of Textile Sector ......................................................................................................... 3
4. Cost of Production and Energy Cost ........................................................................................................... 5
4.1. Regionally Competitive Energy Tariffs ........................................................................................................ 6
4.2. Regionally Competitive Energy Tariffs and Textile Sector’s Performance .............................................. 8
4.3. Cross-Country Comparison of Conversion Cost ....................................................................................... 10
4.4. Cost of Conversion: Further Considerations ............................................................................................. 10
5. Energy Tariffs and Investment ................................................................................................................... 13
6. Energy Tariffs and Employment ................................................................................................................. 14
7. Regionally Competitive Energy Tariffs and Fiscal Burden ...................................................................... 15
8. Why Competitive Energy Tariffs are Indispensable to Remain Regionally Competitive ...................... 17
9. Replacing Competitive Energy Tariff Policy with Drawback of Local Taxes and Levies (DLTL)
Scheme .......................................................................................................................................................... 22
10. Three Main Challenges to Textile Sector ................................................................................................... 23
1. Challenges at Policy Front ......................................................................................................................... 24
2. Challenges in Acquiring Raw Material ...................................................................................................... 25
3. Challenges at Energy Front ....................................................................................................................... 27
11. Other Challenges ......................................................................................................................................... 28
12. Conclusion and the Way Forward .............................................................................................................. 30
Appendices .................................................................................................................................................................. 31
Regionally Competitive Energy Tariffs and Textile Sector’s Competitiveness
vii PIDE
Executive Summary
The economic significance of the textile sector in Pakistan is undeniable. The sector
contributes around 60% of the total export earnings and provides employment opportunities for
around 40% of the total labor force. Although, substantial export earnings of Pakistan are based
on textile products; though, its share in the international textile exports is considerably low. Out
of a total of $ 792 billion of textile exports, Pakistan contributes merely 1.7%. The sector has so
far managed to endure but remained somewhat stagnant due to high manufacturing expenses,
recurrent power shortages, high energy costs, and flawed government strategies. Yet, the textile
sector outperformed during the current pandemic and recorded a 10.79% growth in exports during
January 2021, MoM basis.
In the textile sector, energy cost is the leading component in terms of conversion cost. Among
all the factors that make the textile sector of Pakistan regionally un-competitive, energy tariff is at
the core. Since it makes up around 35-40% of conversion cost in textile, therefore, to delve into
the way forward, it is pertinent to ensure the availability of energy at regionally competitive tariff
rates.
The recent outshining performance of the textile sector can partially be attributed to the
Regionally Competitive Energy Tariff (RCET) policy that the government has adopted, since late
2018. Under the RCET policy, the government offers a regionally competitive RLNG/Gas tariff
at the rate of $ 6.5/mmbtu and fixed electricity tariffs at 7.5 cents/kWh for export-oriented units of
the zero-rated sectors. In September 2020, the electricity tariffs were revised from 7.5 cents/kWh
to 9 cents/kWh. Against this backdrop, the study aims to evaluate how the RCET policy is
contributing towards getting the textile sector regionally competitive. The study accomplished this
task by comprehensively analyzing the costs of production of all listed companies along with
primary data gathered via detailed questionnaires, field visits, and online interviews.
The findings of the study show that the average share of the power and energy cost observes a
04-percentage point drop after the implementation of the RCET policy and stands at 32% of the
conversion cost. At the aggregate level, the total sales revenue and export sales revenue increased
by 14%, while local sales revenue increased by 19%. Both spinning and weaving subsectors
Regionally Competitive Energy Tariffs and Textile Sector’s Competitiveness
viii PIDE
recorded higher growth in exports than growth in local sales. Moreover, the quarterly comparison
indicates the 22% increase in sales during the first quarter of 2021, compared to the same quarter
of 2020.
The recent surge in investment initiatives by the textile industry compared to almost stagnant
investment growth before the RCET policy discloses the positive spill-over effects of the policy.
The estimates show that a 10% increase in the energy tariff causes a 1.1% decrease in
investment within the textile sector of Pakistan. The average capital employed is around Rs. 3.8
billion in the listed textile units. Moreover, the analysis also indicates that around 75% of textile
units undertake new investment initiatives when the energy tariffs fall. So, out of 571 textile units,
it is expected that 387 units will venture on some sort of new investment initiative. The sector at
aggregate will observe a minimum surge of around Rs. 88 billion in terms of new investments due
to RCET policy.
Remarkably, the recent announcement by the State Bank of Pakistan (SBP) declares that out
of recent loan applications under Temporary Economic Relief Facility (TERF), around 60% came
from the textile sector alone. Moreover, the textile sector has experienced approximately $1.60
billion investment during the first half of the current fiscal year. These overwhelming loan
demands for new investment from the textile sector are partially due to competitive energy tariff
rates and partially due to concessionary mark-ups.
Similarly, the semi-elasticity of employment to the energy and power indicates that a 10%
increase in the energy tariff makes a firm lay off 62 employees on average. Since the number
of textile units is around 521, hence, a 10% energy tariff increment also brings a loss of 32,302
employment opportunities. Our data also indicates that the average textile units provide
employment opportunities for around 2,303 individuals. Consequently, a 10% increase in the
energy tariff takes around 14 textile units at the brink of closing the operations.
To analyze how significant RCET is for the sustainability and functionality of the textile sector,
we undertook a simulation exercise. The exercise was performed on 8 textile products, where we
removed the competitive energy tariffs and compared the price offered by Pakistan in the
international market with regional countries that include Bangladesh, China, and India. The results
indicate that the upstream industry (spinning and weaving) will become regionally uncompetitive
Regionally Competitive Energy Tariffs and Textile Sector’s Competitiveness
ix PIDE
in the event of the RCET policy withdrawal. The spinning sector will not only lose international
market share but also put domestic sales in jeopardy. While downstream industry would remain in
the competition even without RCET rates but would lose the price rankings.
Furthermore, in-depth interview and field survey reveals three main challenges that the textile
sector is currently facing are;
• Policy Issue: unpredictable, inconsistent, and non-inclusive
• Raw Material: poor quality, falling production, absence of R&D
• Energy Issues: unending worries about tariff shift, transmission, and supply issues
The study also points out that the energy tariffs in Pakistan are high due to governance issues,
operational and commercial inefficiencies, lack of effective planning, flawed policies, distorted
pricing strategy, irrational cross-subsidization, and most importantly sub-optimal energy mix. The
unit cost of service of electricity is around Rs.13.7/kwh (8 cents/kWh) during 2020. Nonetheless,
the unit energy price set by the policymakers attempts to cover all these inefficiencies and much
higher than service cost for the industrial consumers. Naturally, it raises the question that why a
foreign importer would pay for our systemic inefficiencies? In short, the study finds convincing
evidence that the electricity tariff above 7.5 cents/kWh is not competitive, particularly within the
region. Therefore, the call by the industry for reverting to 7.5 cents/kWh tariff for electricity along
with $6.5/mmbtu for Gas/RLNG is not without legitimate grounds.
Regionally Competitive Energy Tariffs and Textile Sector’s Competitiveness
1 PIDE
1. Pakistan’s Textile Sector: Introduction
The textile sector in Pakistan is one of the vital economic drivers for the economy and
constitutes 8.5% of GDP. Out of the total export earnings, around 60% come only from the export
of textile products. The textile sector employs around 40% (19 million workers) of the total labor
force and contributes 46% in total manufacturing of Pakistan.1 In aggregate, the textile and
clothing sector supports around 29% of value-addition in manufacturing across Pakistan (WDI,
2006). Pakistan is the 8th largest exporter of cotton in Asia, and it has the largest yarn spinning
capacity after India and China. The sector has a strong linkage with agriculture and cottage
industries and the livelihood of around 25 million individuals, either directly or indirectly, depends
upon the textile sector. Moreover, the inherent potential for higher value-addition at subsequent
stages of the production chain further signifies the importance of the textile sector for Pakistan.
Having said that, the performance of the sector has suffered a lot over the last 10-15 years due
to weak policy support. The export and growth performance of the sector suffered greatly due to
high manufacturing expenses, recurrent power shortages, and flawed strategies. Resultantly, textile
exports remained merely around $12.78 billion during 2020 (SBP). However, the textile sector has
outperformed during the current pandemic and recorded a 10.79% growth in exports during
January 2021 over the corresponding month of last year (PBS). This recent extraordinary
performance of the textile sector can partially be attributed to the regionally competitive energy
tariff (RCET) policy that the government has adopted since late 2018.
Against this backdrop, the study attempts to evaluate how the RCET policy is contributing
towards making the textile sector of Pakistan regionally competitive. Moreover, how RCET helps
to boost investment and employment opportunities in the sector. Section 2 spells out some
dynamics of the structure of the textile sector of Pakistan. Section 3 provides a brief overview of
the relative performance of the sector. Section 4 carries out the analysis of the factors of production
in the textile sector and highlights the role of energy in the production process and contains a cross-
country comparison as well. Section 5 highlights the role of energy tariffs in boosting investment
in the textile sector, while section 6 contains the same discussion in the case of employment. Then,
1 These figures are taken from the textile sector brief, the board of investment (PBIT) that can be accessed at
https://invest.gov.pk/textile#gallery.

Regionally Competitive Energy Tariffs and Textile Sector’s Competitiveness
2 PIDE
Section 7 explores the structure of energy tariff settings in Pakistan, and Section 8 elaborates on
the importance of regional competitive energy tariffs for the competitiveness of our textile units.
Afterward, Section 9 reviews the possibility of offering a DLTL scheme instead of the RCET
policy. Towards the end, both Sections 10 and 11 extend on the identified problems that the textile
sector is facing, and Section 12 concludes the discussion.
2. Structure of Textile Sector
The textile sector in Pakistan consists of organized and unorganized subsectors. The organized
subsector includes spinning units, integrated textile
mills, and a small number of shuttle-less looms.
While unorganized subsector includes small and
medium enterprises (SMEs) engaged in weaving,
processing, garments, and hosiery. These
downstream SMEs have an enormous export potential that has yet not been fully realized.
According to the annual report (2018-19) of the Textile Commissioner’s Organization (TCO),
the textile sector of Pakistan consists of 40 composite units and 477 spinning units with 13 million
spindles and 198,801 rotors. The
installed capacity also includes 28,500
shuttle-less looms and 375,000
conventional looms. While in the case of
spinning, Pakistan supports around 5%
of global spinning capacity following by
China and India (Memon, 2017).2 The
spinning stage can also be considered as
2 Memon, N. A. (2017). Pakistan Textile Spinning Industry Adversely Affected by Slowdown in China’s Imports Yarn. Pakistan
Textile Journal, Spinning Review, pp. 36-3
Table-1: Number of Textile Mills Composite Spinning
Baluchistan 0 10
KP 0 19
Punjab 23 332
Sindh 17 127
Total 40 477
Table-2: Installed Capacity
Baluchistan KP Punjab Sindh Total
Spindle 269,208 838,376 9,546,468 2,661,701 13,409,420
Rotors 13,689 2,690 85,480 96,942 198,801
Looms 0 0 5859 3225 9,084
Source: Calculations based on the data collected from the annual report of
the textile industry, 2018-19, TCO
Regionally Competitive Energy Tariffs and Textile Sector’s Competitiveness
3 PIDE
the starting point of the textile value chain. As per the available data, around 15% of the spindle
capacity stood idle during June 2018. While 36% rotors and 30% looms installed capacity
remained unutilized for the same period.
3. Export Performance of Textile Sector
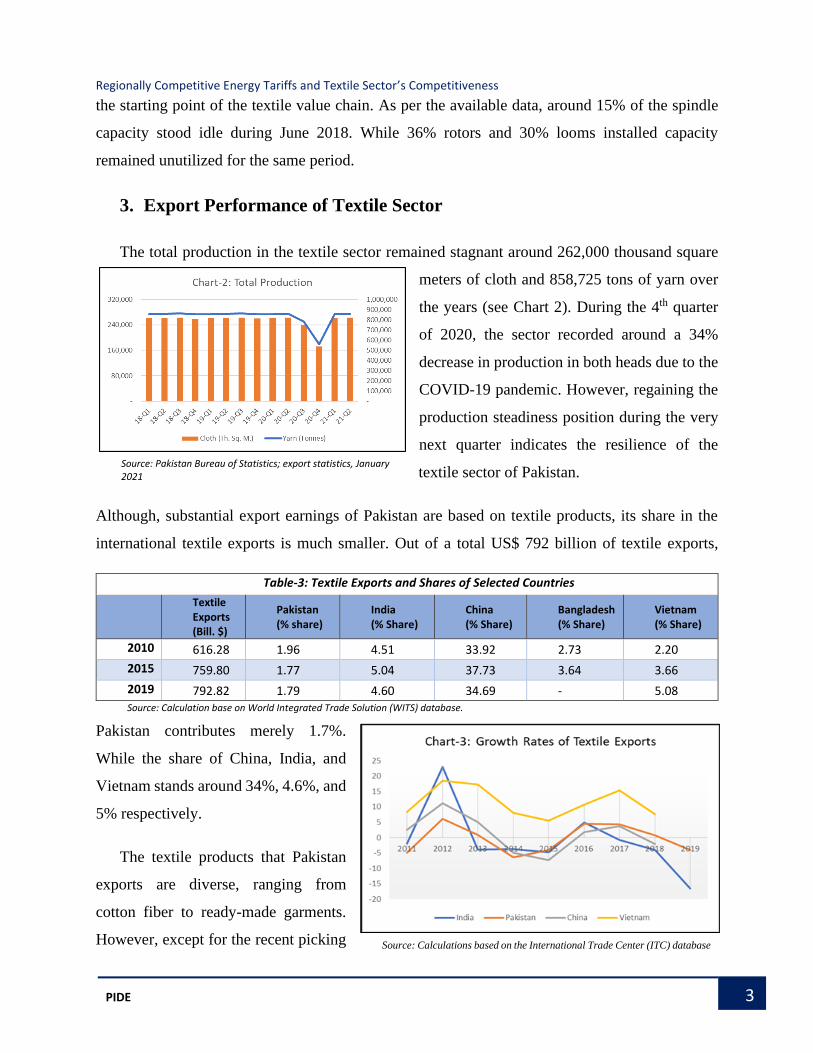
The total production in the textile sector remained stagnant around 262,000 thousand square
meters of cloth and 858,725 tons of yarn over
the years (see Chart 2). During the 4th quarter
of 2020, the sector recorded around a 34%
decrease in production in both heads due to the
COVID-19 pandemic. However, regaining the
production steadiness position during the very
next quarter indicates the resilience of the
textile sector of Pakistan.
Although, substantial export earnings of Pakistan are based on textile products, its share in the
international textile exports is much smaller. Out of a total US$ 792 billion of textile exports,
Pakistan contributes merely 1.7%.
While the share of China, India, and
Vietnam stands around 34%, 4.6%, and
5% respectively.
The textile products that Pakistan
exports are diverse, ranging from
cotton fiber to ready-made garments.
However, except for the recent picking
Table-3: Textile Exports and Shares of Selected Countries
Textile Exports (Bill. $)
Pakistan (% share)
India (% Share)
China (% Share)
Bangladesh (% Share)
Vietnam (% Share)
2010 616.28 1.96 4.51 33.92 2.73 2.20
2015 759.80 1.77 5.04 37.73 3.64 3.66
2019 792.82 1.79 4.60 34.69 - 5.08 Source: Calculation base on World Integrated Trade Solution (WITS) database.
Source: Pakistan Bureau of Statistics; export statistics, January 2021
Source: Calculations based on the International Trade Center (ITC) database

Regionally Competitive Energy Tariffs and Textile Sector’s Competitiveness
4 PIDE
up, the growth till 2019 followed a
downward trend. Due to the
regionally competitive energy tariff
rates and partially due to the closure
of regional textile market operations,
the textile sector has shown a
promising growth potential, only if
tapped wisely. For instance, Chart 4
indicates a positive trend in value-
added products’ exports. Therefore, if Pakistan wants to increase textile exports from $12.78
billion to $26 billion, then the priority should be given to promote and export high value-added
products. Table 4 below further elaborates the export potential of the textile sector of Pakistan.
Out of the top 20 products with the highest unrealized export potential, 14 products are from the
textile sector.
Table-4: Unrealized Export Potential of Textile Product Among Top 20 Products
HS Code Description Exports
(US$ Mil.)
Unrealized Exports Potential
Tech
no
logy
Lev
el
Pri
ce S
tab
ility
Pro
min
ence
of
SMEs
South Asia Non-OECD OECD
520512 Cotton Yarn, >=85%,.. 951.02 55% 38% 59% 630260 Toilet & Kitchen Linen.. 743.17 86% 47% 21% 630231 Bed Linen, of Cotton,.. 660.83 88% 50% 41% 620342 Men/Boy's Trousers… 764.85 97% 65% 10% 620452 Women/Girls Trousers… 443.86 96% 63% 32% 520942 Denim Fabrics of cotton.. 337.09 48% 53% 25% 630210 Bed Linen, knitted or … 402.80 96% 56% 16% 610510 Men/Boys Shirts, cott,… 279.28 89% 86% 43% 610910 T-shirts, singlets… 260.81 71% 76% 63% 630710 Floorcloths, dish-… 262.42 99% 85% 32% 520511 Cotton Yarn, >/=85%... 211.57 81% 29% 73% 520812 Plain Weave Cotton … 200.17 68% 53% 38% 520912 Twill weave cotton fab… 163.20 73% 44% 48% 6115 Pantyhose, tights… 283.24 66% 78% 30%
Notes: Products belong to the textile sector from the top 20 products listed by ITC with respect to their export potential to the world. Development indicators are relative to the country’s current situation, green indicating performance above its trade-weighted median and red otherwise. Export (US$ thousand) correspond to average exports to the world over the period 2009-13.
Source: Borrowed from the country brief “Pakistan” International Trade Center (ITC).
Source: Pakistan Bureau of Statistics; export statistics, January 2021
Regionally Competitive Energy Tariffs and Textile Sector’s Competitiveness
5 PIDE
Therefore, to unfold the inherent export potential of the textile sector, the large investment in
machinery, skill, and product development, along with government supporting policies are the key
areas to focus on.
4. Cost of Production and Energy Cost
In the textile sector, the major factors of production other than capital include raw material
(i.e., cotton), energy, and labor. In terms of cost of conversion (where the cost of raw material is
subtracted from the total cost of production), energy cost is the leading component, especially in
spinning and weaving. Thus, to delve into the way forward, it is pertinent to comprehend the
importance and relative share of energy in the conversion cost. Due to severe competition among
regional countries, a minor cost difference in relative terms brings a huge impact on the
international market.
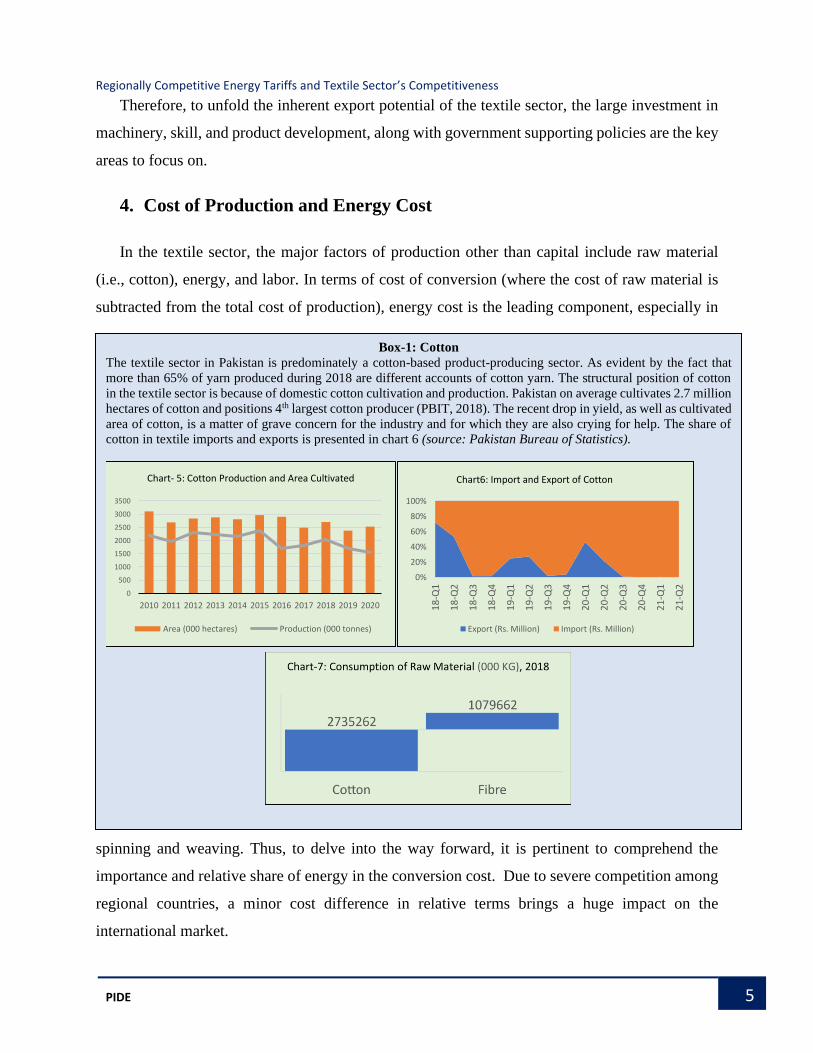
Box-1: Cotton
The textile sector in Pakistan is predominately a cotton-based product-producing sector. As evident by the fact that
more than 65% of yarn produced during 2018 are different accounts of cotton yarn. The structural position of cotton
in the textile sector is because of domestic cotton cultivation and production. Pakistan on average cultivates 2.7 million
hectares of cotton and positions 4th largest cotton producer (PBIT, 2018). The recent drop in yield, as well as cultivated
area of cotton, is a matter of grave concern for the industry and for which they are also crying for help. The share of
cotton in textile imports and exports is presented in chart 6 (source: Pakistan Bureau of Statistics).
0
500
1000
1500
2000
2500
3000
3500
2010 2011 2012 2013 2014 2015 2016 2017 2018 2019 2020
Chart- 5: Cotton Production and Area Cultivated
Area (000 hectares) Production (000 tonnes)
0%
20%
40%
60%
80%
100%
18
-Q1
18
-Q2
18
-Q3
18
-Q4
19
-Q1
19
-Q2
19
-Q3
19
-Q4
20
-Q1
20
-Q2
20
-Q3
20
-Q4
21
-Q1
21
-Q2
Chart6: Import and Export of Cotton
Export (Rs. Million) Import (Rs. Million)
Regionally Competitive Energy Tariffs and Textile Sector’s Competitiveness
6 PIDE
4.1. Regionally Competitive Energy Tariffs
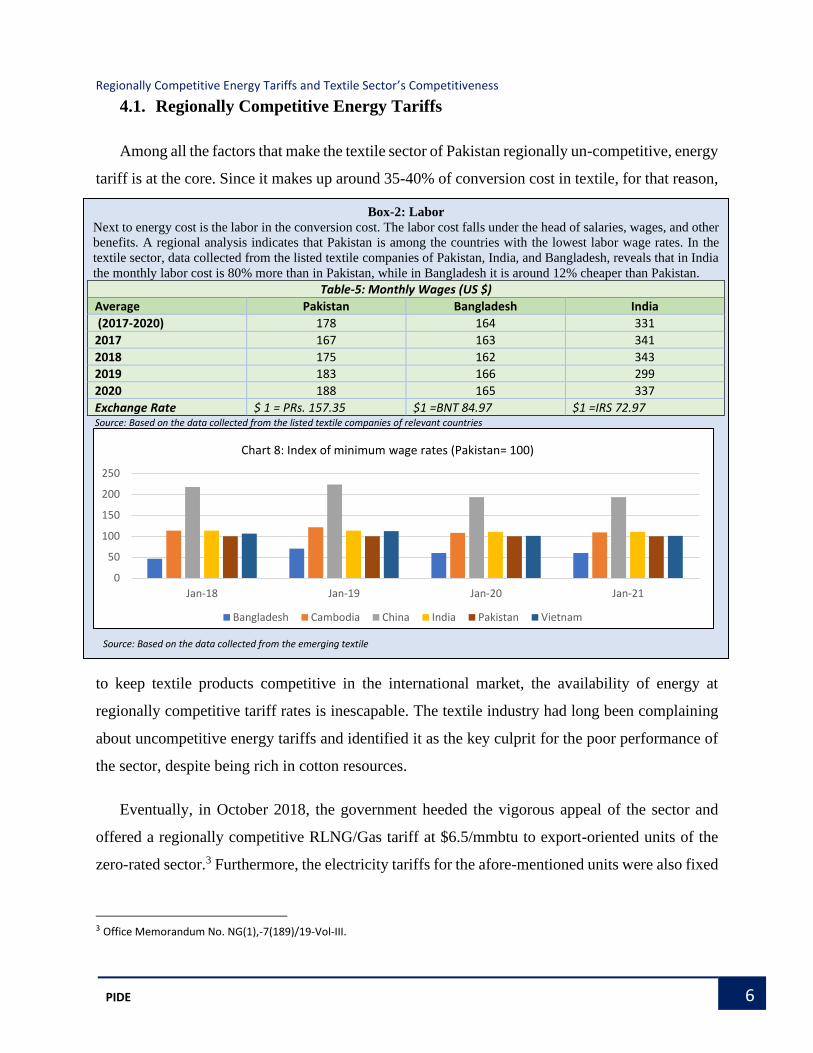
Among all the factors that make the textile sector of Pakistan regionally un-competitive, energy
tariff is at the core. Since it makes up around 35-40% of conversion cost in textile, for that reason,
to keep textile products competitive in the international market, the availability of energy at
regionally competitive tariff rates is inescapable. The textile industry had long been complaining
about uncompetitive energy tariffs and identified it as the key culprit for the poor performance of
the sector, despite being rich in cotton resources.
Eventually, in October 2018, the government heeded the vigorous appeal of the sector and
offered a regionally competitive RLNG/Gas tariff at $6.5/mmbtu to export-oriented units of the
zero-rated sector.3 Furthermore, the electricity tariffs for the afore-mentioned units were also fixed
3 Office Memorandum No. NG(1),-7(189)/19-Vol-III.
Box-2: Labor
Next to energy cost is the labor in the conversion cost. The labor cost falls under the head of salaries, wages, and other
benefits. A regional analysis indicates that Pakistan is among the countries with the lowest labor wage rates. In the
textile sector, data collected from the listed textile companies of Pakistan, India, and Bangladesh, reveals that in India
the monthly labor cost is 80% more than in Pakistan, while in Bangladesh it is around 12% cheaper than Pakistan.
Table-5: Monthly Wages (US $)
Average Pakistan Bangladesh India
(2017-2020) 178 164 331
2017 167 163 341
2018 175 162 343
2019 183 166 299
2020 188 165 337
Exchange Rate $ 1 = PRs. 157.35 $1 =BNT 84.97 $1 =IRS 72.97 Source: Based on the data collected from the listed textile companies of relevant countries
0
50
100
150
200
250
Jan-18 Jan-19 Jan-20 Jan-21
Chart 8: Index of minimum wage rates (Pakistan= 100)
Bangladesh Cambodia China India Pakistan Vietnam
Source: Based on the data collected from the emerging textile database.
Regionally Competitive Energy Tariffs and Textile Sector’s Competitiveness
7 PIDE
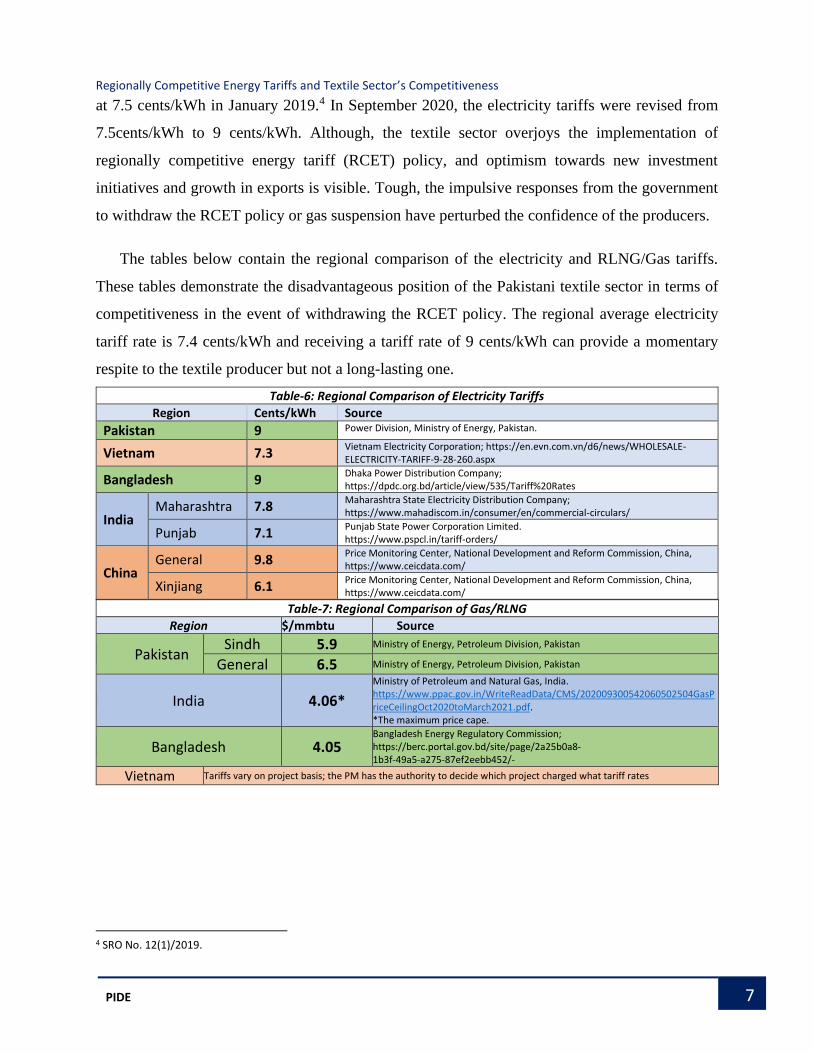
at 7.5 cents/kWh in January 2019.4 In September 2020, the electricity tariffs were revised from
7.5cents/kWh to 9 cents/kWh. Although, the textile sector overjoys the implementation of
regionally competitive energy tariff (RCET) policy, and optimism towards new investment
initiatives and growth in exports is visible. Tough, the impulsive responses from the government
to withdraw the RCET policy or gas suspension have perturbed the confidence of the producers.
The tables below contain the regional comparison of the electricity and RLNG/Gas tariffs.
These tables demonstrate the disadvantageous position of the Pakistani textile sector in terms of
competitiveness in the event of withdrawing the RCET policy. The regional average electricity
tariff rate is 7.4 cents/kWh and receiving a tariff rate of 9 cents/kWh can provide a momentary
respite to the textile producer but not a long-lasting one.
Table-6: Regional Comparison of Electricity Tariffs Region Cents/kWh Source
Pakistan 9 Power Division, Ministry of Energy, Pakistan.
Vietnam 7.3 Vietnam Electricity Corporation; https://en.evn.com.vn/d6/news/WHOLESALE-ELECTRICITY-TARIFF-9-28-260.aspx
Bangladesh 9 Dhaka Power Distribution Company; https://dpdc.org.bd/article/view/535/Tariff%20Rates
India Maharashtra 7.8
Maharashtra State Electricity Distribution Company; https://www.mahadiscom.in/consumer/en/commercial-circulars/
Punjab 7.1 Punjab State Power Corporation Limited. https://www.pspcl.in/tariff-orders/
China General 9.8
Price Monitoring Center, National Development and Reform Commission, China, https://www.ceicdata.com/
Xinjiang 6.1 Price Monitoring Center, National Development and Reform Commission, China, https://www.ceicdata.com/
Table-7: Regional Comparison of Gas/RLNG
Region $/mmbtu Source
Pakistan Sindh 5.9 Ministry of Energy, Petroleum Division, Pakistan
General 6.5 Ministry of Energy, Petroleum Division, Pakistan
India 4.06*
Ministry of Petroleum and Natural Gas, India. https://www.ppac.gov.in/WriteReadData/CMS/202009300542060502504GasPriceCeilingOct2020toMarch2021.pdf. *The maximum price cape.
Bangladesh 4.05 Bangladesh Energy Regulatory Commission; https://berc.portal.gov.bd/site/page/2a25b0a8- 1b3f-49a5-a275-87ef2eebb452/-
Vietnam Tariffs vary on project basis; the PM has the authority to decide which project charged what tariff rates
4 SRO No. 12(1)/2019.
Regionally Competitive Energy Tariffs and Textile Sector’s Competitiveness
8 PIDE
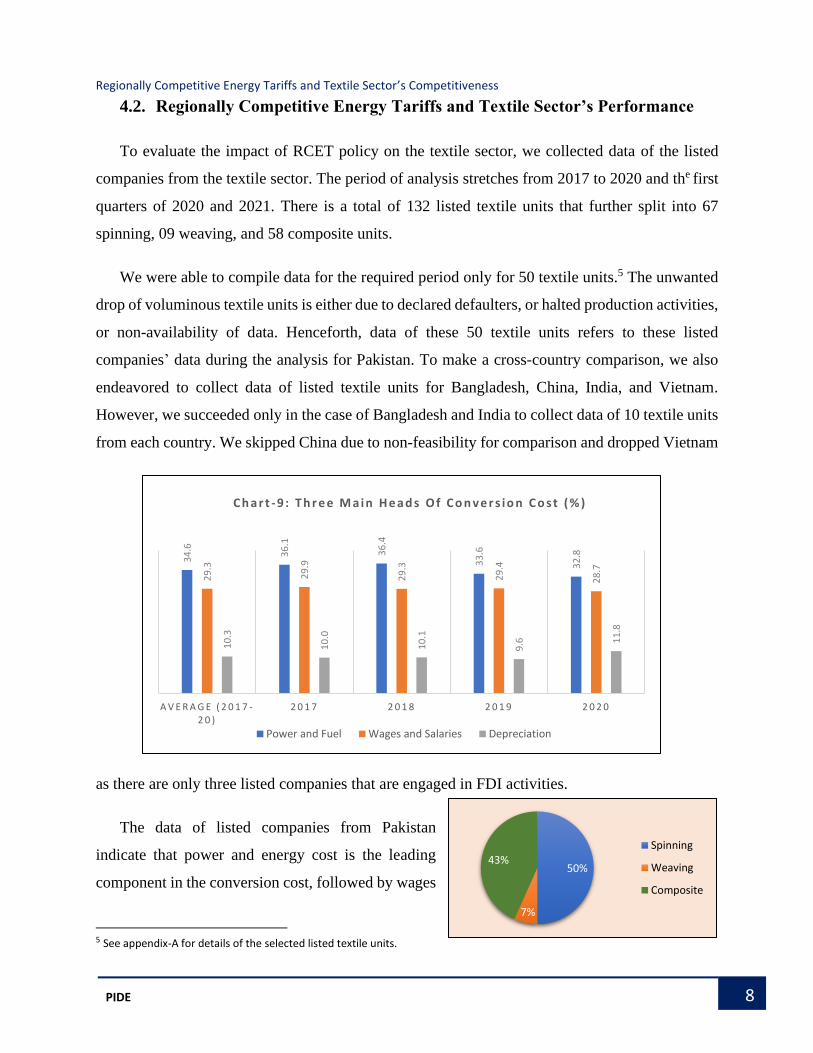
4.2. Regionally Competitive Energy Tariffs and Textile Sector’s Performance
To evaluate the impact of RCET policy on the textile sector, we collected data of the listed
companies from the textile sector. The period of analysis stretches from 2017 to 2020 and the first
quarters of 2020 and 2021. There is a total of 132 listed textile units that further split into 67
spinning, 09 weaving, and 58 composite units.
We were able to compile data for the required period only for 50 textile units.5 The unwanted
drop of voluminous textile units is either due to declared defaulters, or halted production activities,
or non-availability of data. Henceforth, data of these 50 textile units refers to these listed
companies’ data during the analysis for Pakistan. To make a cross-country comparison, we also
endeavored to collect data of listed textile units for Bangladesh, China, India, and Vietnam.
However, we succeeded only in the case of Bangladesh and India to collect data of 10 textile units
from each country. We skipped China due to non-feasibility for comparison and dropped Vietnam
as there are only three listed companies that are engaged in FDI activities.
The data of listed companies from Pakistan
indicate that power and energy cost is the leading
component in the conversion cost, followed by wages
5 See appendix-A for details of the selected listed textile units.
34
.6
36
.1
36
.4
33
.6
32
.8
29
.3
29
.9
29
.3
29
.4
28
.7
10
.3
10
.0
10
.1
9.6 1
1.8
A V E R A G E ( 2 0 1 7 -2 0 )
2 0 1 7 2 0 1 8 2 0 1 9 2 0 2 0
C h a r t - 9 : T h r e e M a i n H e a d s O f C o n v e r s i o n C o s t ( % )
Power and Fuel Wages and Salaries Depreciation
50%
7%
43%Spinning
Weaving
Composite
Regionally Competitive Energy Tariffs and Textile Sector’s Competitiveness
9 PIDE
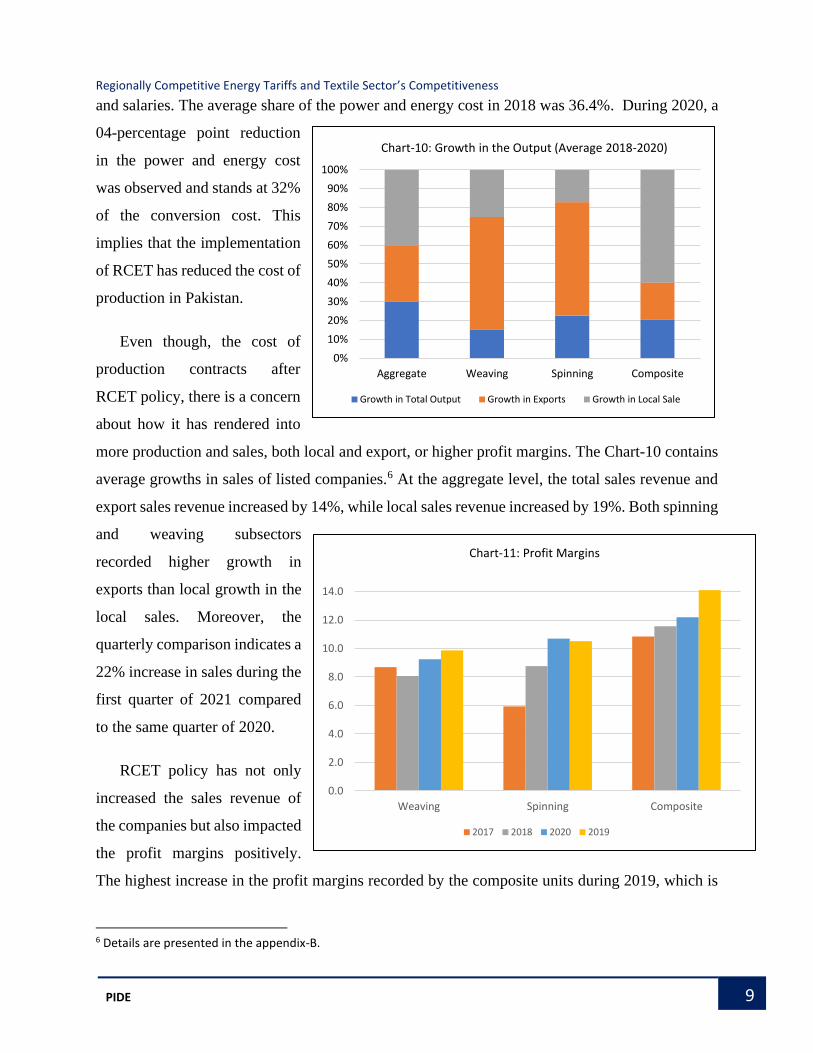
and salaries. The average share of the power and energy cost in 2018 was 36.4%. During 2020, a
04-percentage point reduction
in the power and energy cost
was observed and stands at 32%
of the conversion cost. This
implies that the implementation
of RCET has reduced the cost of
production in Pakistan.
Even though, the cost of
production contracts after
RCET policy, there is a concern
about how it has rendered into
more production and sales, both local and export, or higher profit margins. The Chart-10 contains
average growths in sales of listed companies.6 At the aggregate level, the total sales revenue and
export sales revenue increased by 14%, while local sales revenue increased by 19%. Both spinning
and weaving subsectors
recorded higher growth in
exports than local growth in the
local sales. Moreover, the
quarterly comparison indicates a
22% increase in sales during the
first quarter of 2021 compared
to the same quarter of 2020.
RCET policy has not only
increased the sales revenue of
the companies but also impacted
the profit margins positively.
The highest increase in the profit margins recorded by the composite units during 2019, which is
6 Details are presented in the appendix-B.
0.0
2.0
4.0
6.0
8.0
10.0
12.0
14.0
Weaving Spinning Composite
Chart-11: Profit Margins
2017 2018 2020 2019
0%
10%
20%
30%
40%
50%
60%
70%
80%
90%
100%
Aggregate Weaving Spinning Composite
Chart-10: Growth in the Output (Average 2018-2020)
Growth in Total Output Growth in Exports Growth in Local Sale
Regionally Competitive Energy Tariffs and Textile Sector’s Competitiveness
10 PIDE
around 14.1% of the sales revenue. While profit margins slashed down in 2020 due to COVID-19,
these remained higher than that of 2018 and 2017. Whereas gross profits during first quarter of
2021 jumped up by 116% on QoQ basis.
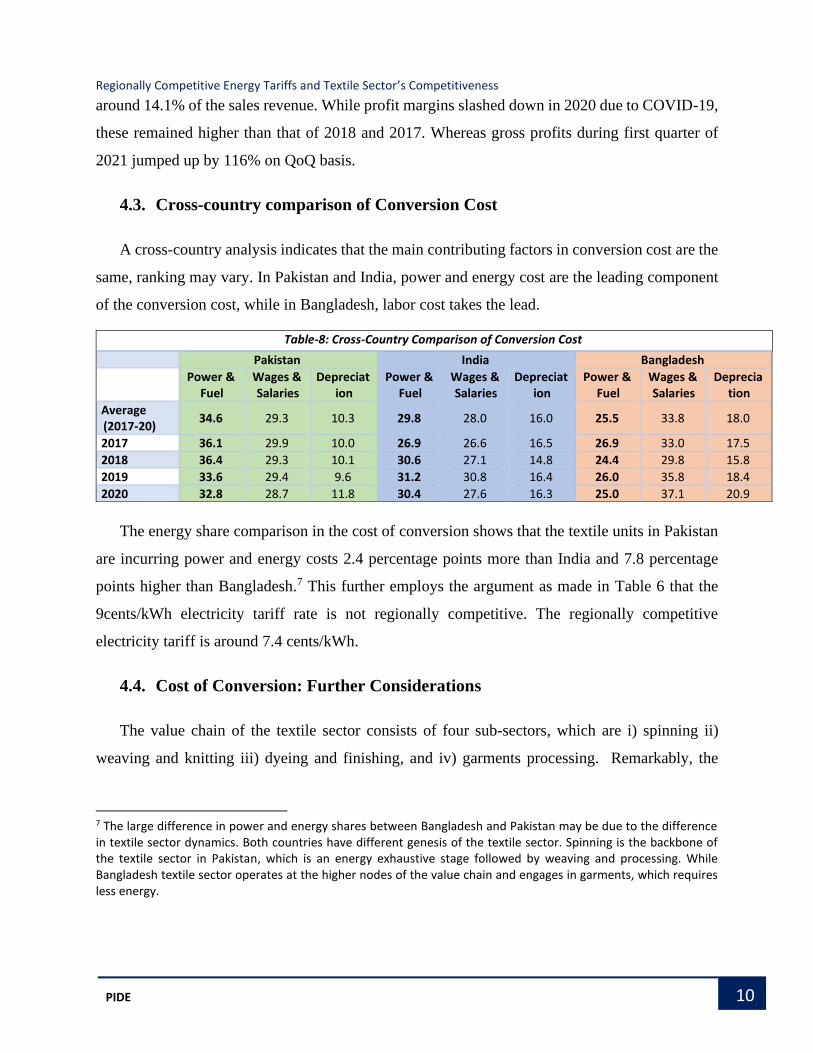
4.3. Cross-country comparison of Conversion Cost
A cross-country analysis indicates that the main contributing factors in conversion cost are the
same, ranking may vary. In Pakistan and India, power and energy cost are the leading component
of the conversion cost, while in Bangladesh, labor cost takes the lead.
The energy share comparison in the cost of conversion shows that the textile units in Pakistan
are incurring power and energy costs 2.4 percentage points more than India and 7.8 percentage
points higher than Bangladesh.7 This further employs the argument as made in Table 6 that the
9cents/kWh electricity tariff rate is not regionally competitive. The regionally competitive
electricity tariff is around 7.4 cents/kWh.
4.4. Cost of Conversion: Further Considerations
The value chain of the textile sector consists of four sub-sectors, which are i) spinning ii)
weaving and knitting iii) dyeing and finishing, and iv) garments processing. Remarkably, the
7 The large difference in power and energy shares between Bangladesh and Pakistan may be due to the difference in textile sector dynamics. Both countries have different genesis of the textile sector. Spinning is the backbone of the textile sector in Pakistan, which is an energy exhaustive stage followed by weaving and processing. While Bangladesh textile sector operates at the higher nodes of the value chain and engages in garments, which requires less energy.
Table-8: Cross-Country Comparison of Conversion Cost
Pakistan India Bangladesh Power &
Fuel Wages & Salaries
Depreciation
Power & Fuel
Wages & Salaries
Depreciation
Power & Fuel
Wages & Salaries
Depreciation
Average (2017-20)
34.6 29.3 10.3 29.8 28.0 16.0 25.5 33.8 18.0
2017 36.1 29.9 10.0 26.9 26.6 16.5 26.9 33.0 17.5
2018 36.4 29.3 10.1 30.6 27.1 14.8 24.4 29.8 15.8
2019 33.6 29.4 9.6 31.2 30.8 16.4 26.0 35.8 18.4
2020 32.8 28.7 11.8 30.4 27.6 16.3 25.0 37.1 20.9
Regionally Competitive Energy Tariffs and Textile Sector’s Competitiveness
11 PIDE
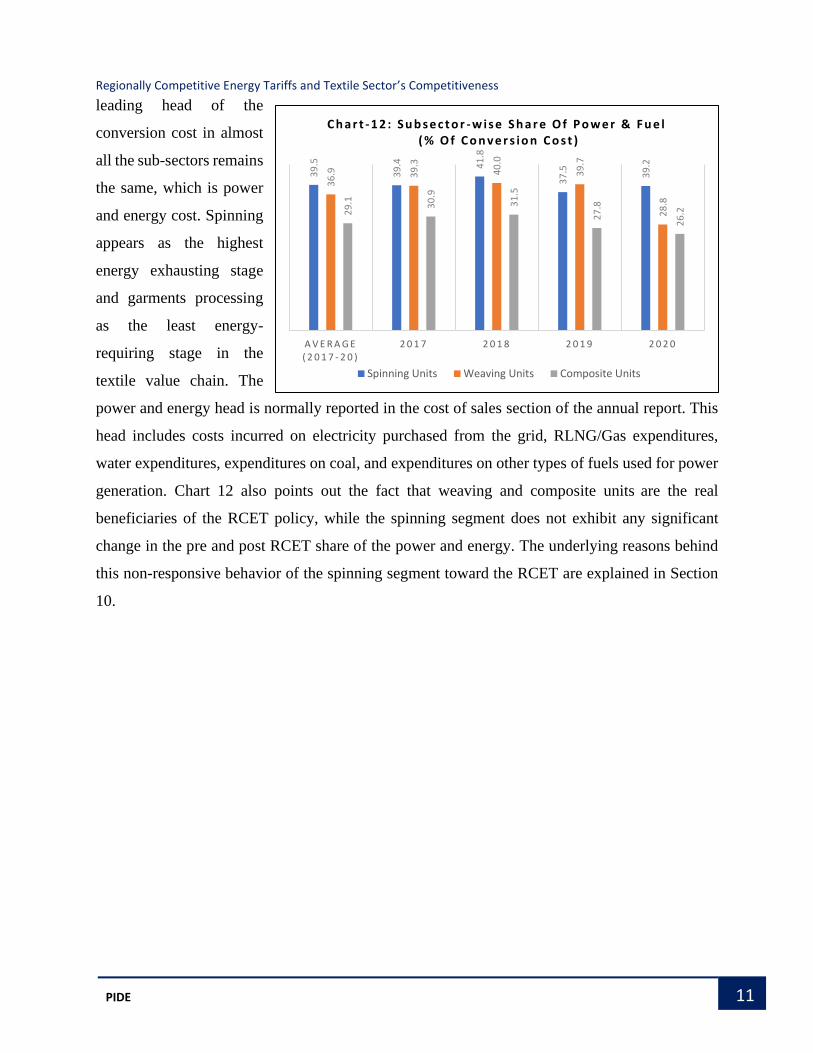
leading head of the
conversion cost in almost
all the sub-sectors remains
the same, which is power
and energy cost. Spinning
appears as the highest
energy exhausting stage
and garments processing
as the least energy-
requiring stage in the
textile value chain. The
power and energy head is normally reported in the cost of sales section of the annual report. This
head includes costs incurred on electricity purchased from the grid, RLNG/Gas expenditures,
water expenditures, expenditures on coal, and expenditures on other types of fuels used for power
generation. Chart 12 also points out the fact that weaving and composite units are the real
beneficiaries of the RCET policy, while the spinning segment does not exhibit any significant
change in the pre and post RCET share of the power and energy. The underlying reasons behind
this non-responsive behavior of the spinning segment toward the RCET are explained in Section
10.
39
.5
39
.4 41
.8
37
.5 39
.2
36
.9 39
.3
40
.0
39
.7
28
.8
29
.1 30
.9
31
.5
27
.8
26
.2
A V E R A G E ( 2 0 1 7 - 2 0 )
2 0 1 7 2 0 1 8 2 0 1 9 2 0 2 0
C h a r t - 1 2 : S u b s e c t o r - w i s e S h a r e O f P o w e r & F u e l( % O f C o n v e r s i o n C o s t )
Spinning Units Weaving Units Composite Units
Regionally Competitive Energy Tariffs and Textile Sector’s Competitiveness
12 PIDE
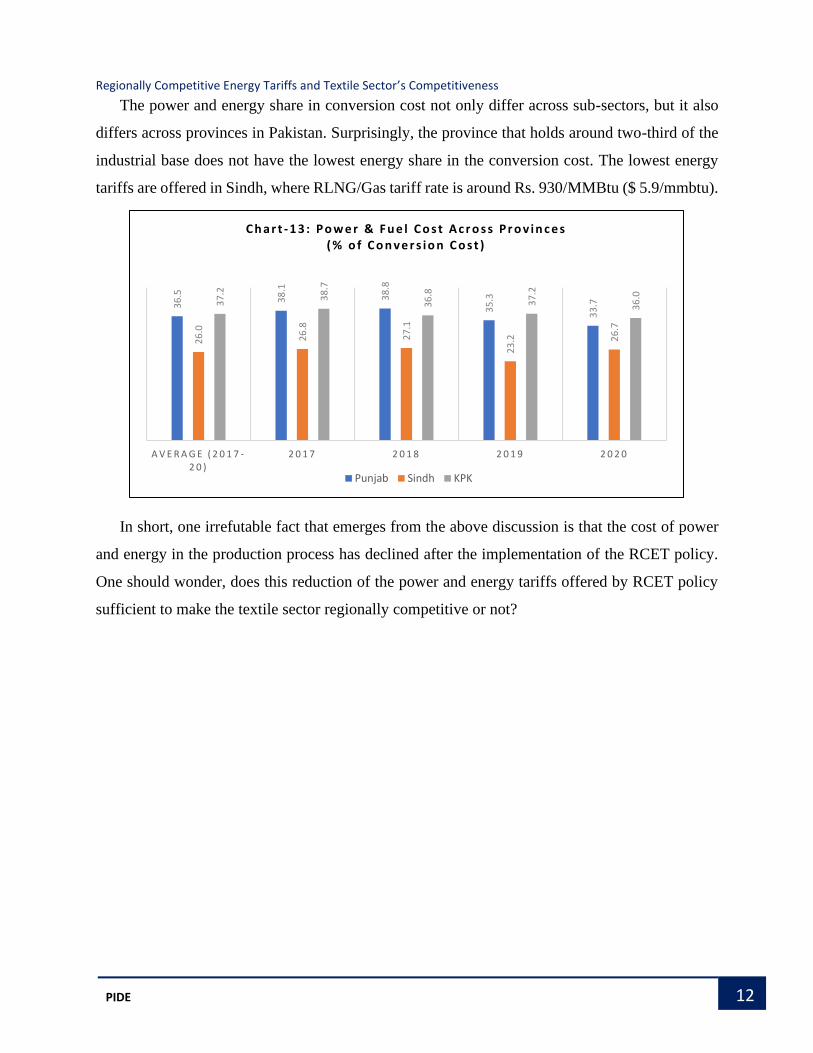
The power and energy share in conversion cost not only differ across sub-sectors, but it also
differs across provinces in Pakistan. Surprisingly, the province that holds around two-third of the
industrial base does not have the lowest energy share in the conversion cost. The lowest energy
tariffs are offered in Sindh, where RLNG/Gas tariff rate is around Rs. 930/MMBtu ($ 5.9/mmbtu).
In short, one irrefutable fact that emerges from the above discussion is that the cost of power
and energy in the production process has declined after the implementation of the RCET policy.
One should wonder, does this reduction of the power and energy tariffs offered by RCET policy
sufficient to make the textile sector regionally competitive or not?
36
.5 38
.1
38
.8
35
.3
33
.7
26
.0
26
.8
27
.1
23
.2 26
.7
37
.2
38
.7
36
.8
37
.2
36
.0
A V E R A G E ( 2 0 1 7 -2 0 )
2 0 1 7 2 0 1 8 2 0 1 9 2 0 2 0
C h a r t - 1 3 : P o w e r & F u e l C o s t A c r o s s P r o v i n c e s ( % o f C o n v e r s i o n C o s t )
Punjab Sindh KPK
Regionally Competitive Energy Tariffs and Textile Sector’s Competitiveness
13 PIDE
5. Energy Tariffs and Investment
Since energy cost is a crucial and principal component of the conversion cost. Therefore, the
performance of the textile sector deeply depends on the energy tariffs. The recent surge in the
investment initiatives by textile industrialists compared to almost stagnant investment growth
before the RCET policy unveils the centrality of the energy tariffs. To divulge the underlying
relationship between output supply and energy tariffs, we consider the following model.8
𝑞(𝜑) = 𝜑𝑙𝛼𝑘𝛽𝑃𝑜𝑤𝜔 [∫ 𝑥𝐻(𝑗)𝛾−1
𝛾1
0𝑑𝑗 + 𝑧 ∫ 𝑥𝐹(𝑗)
𝛾−1
𝛾𝑁
0𝑑𝑗]
𝜃𝛾
𝛾−1
… (1)
Where; 𝜑 measures the labor productivity of the textile unit, 𝑙 is the amount of labor employed,
𝑘 is the amount of capital employed, 𝑃𝑜𝑤 is the amount of energy employed, 𝑥𝐻(𝑗) is a particular
variety 𝑗 of the domestic raw material 𝑥𝐻 , 𝑥𝐹 is the variety 𝑗 of imported raw material, 𝑧 ∈ {0,1}
implies either the textile unit employs domestic raw material or imported raw material.
From cost minimization of the cost function associated with equation (1), we can derive the
conditional demand of capital as follow.
8 For details see; Appendix-B.
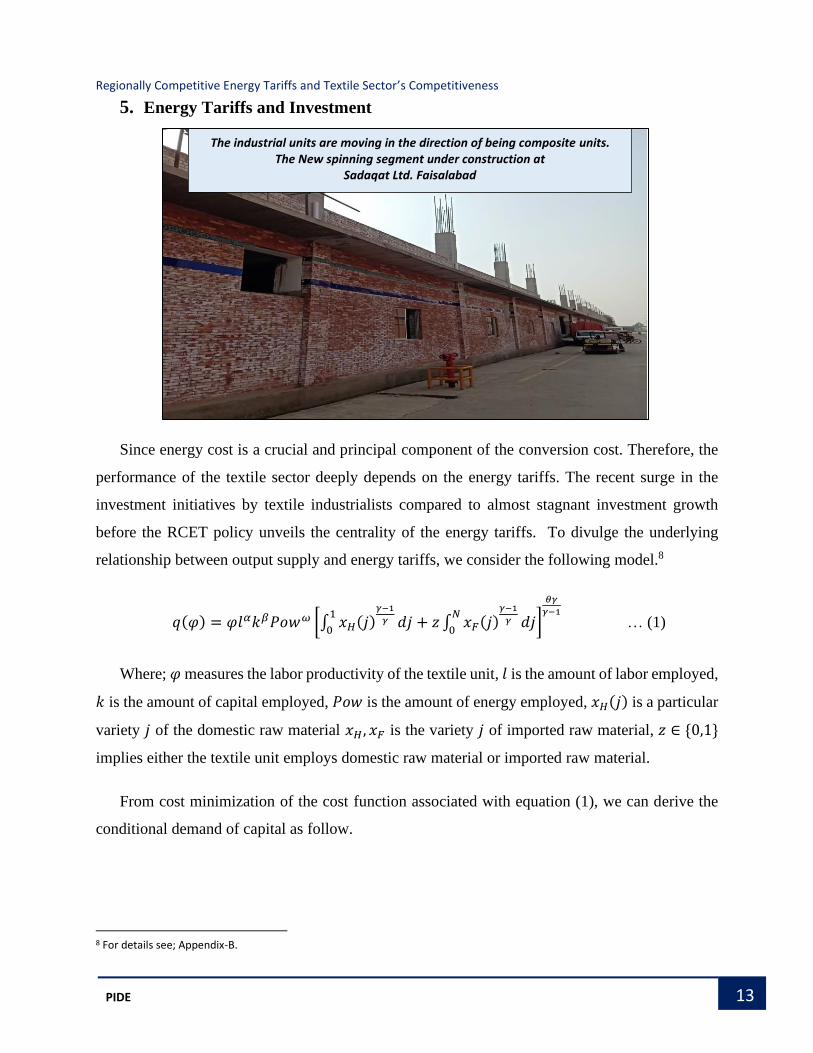
The industrial units are moving in the direction of being composite units. The New spinning segment under construction at
Sadaqat Ltd. Faisalabad
Regionally Competitive Energy Tariffs and Textile Sector’s Competitiveness
14 PIDE
𝑘 = (𝑞
𝜑) (
𝑤
𝛼)
𝛼
(𝑟
𝛽)
𝛽−1
(𝜇
𝜔)
𝜔
(𝑃
𝜃)
𝜃
… (2)
We can easily gauge the impact of energy tariffs on the investment in the sector by estimating
equation (2). The regression analysis based on the listed companies’ data indicates that the
elasticity of investment to the energy and power is - 0.11, which means a 10% increase in the
energy tariff causes a 1.1% decrease in investment in the textile sector of Pakistan. In other
words, a reduction in energy tariff rates after the RCET policy (where price falls from Rs.
21.90/kWh to Rs. 14.15/kWh), the investment in the textile sector will increase by 6% in the long
run.
The average capital employed is around Rs. 3.8 billion in the listed textile units. Moreover, the
analysis also indicates that around 75% of textile units undertake new investment initiatives when
the energy tariffs fall. Therefore, out of 571 textile units, it is expected that 387 units will venture
into some sort of new investment initiatives. The sector at aggregate will observe a minimum surge
of around Rs.88 billion in new investments. Remarkably, the recent announcement by the State
Bank of Pakistan (SBP) declares that out of recent loan applications under Temporary Economic
Relief Facility (TERF), around 60% came from the textile sector alone. Moreover, the textile sector
has experienced approximately $ 1.60 billion investment during the first half of the current fiscal
year. These overwhelming loan demands for new investment from the textile sector are partially
due to competitive energy tariff rates and partially due to concessionary mark-ups.
6. Energy Tariffs and Employment
We can also similarly derive conditional demand of labor as in the case of capital. The labor
demand can be described as.
𝑙 = (𝑞
𝜑) (
𝑤
𝛼)
(𝛼−1)
(𝑟
𝛽)
𝛽
(𝜇
𝜔)
𝜔
(𝑃
𝜃)
𝜃
… (3)
Equation (3) is again estimated by using the listed companies’ data. The lin-log function
indicates that the semi-elasticity of employment to the energy and power is around - 622. This
indicates that a 10% increase in the energy tariff makes a firm lay off 62 employees on average.
Regionally Competitive Energy Tariffs and Textile Sector’s Competitiveness
15 PIDE
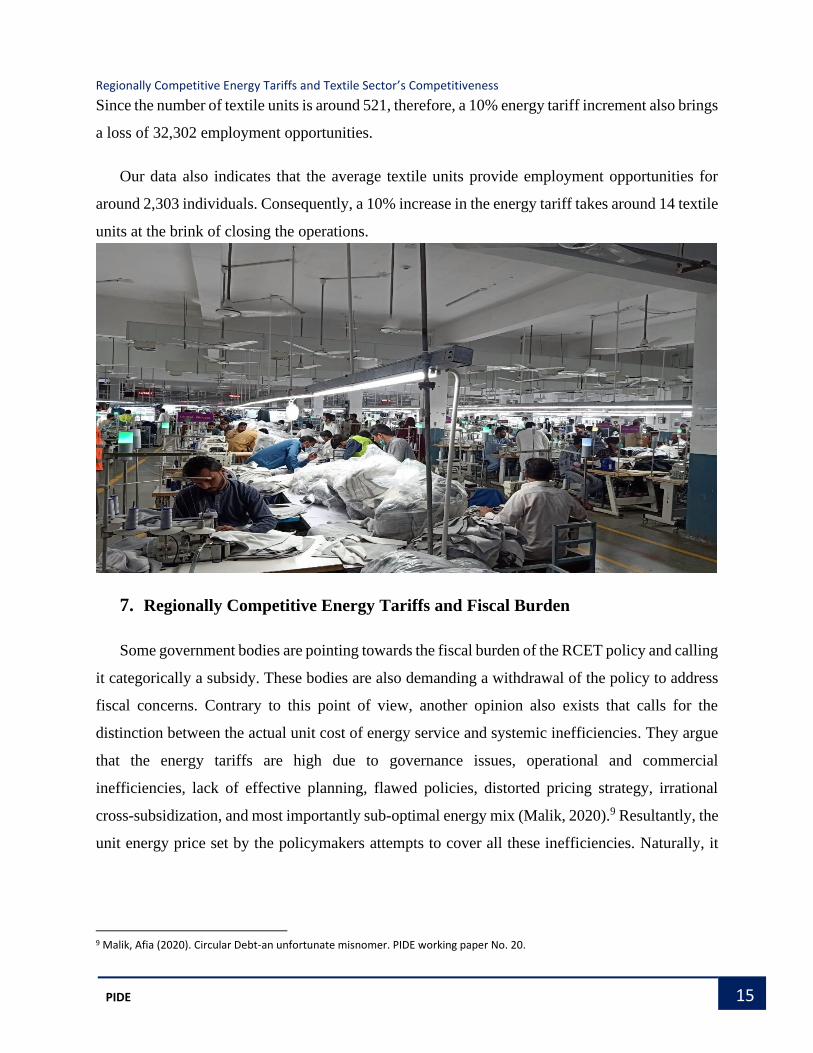
Since the number of textile units is around 521, therefore, a 10% energy tariff increment also brings
a loss of 32,302 employment opportunities.
Our data also indicates that the average textile units provide employment opportunities for
around 2,303 individuals. Consequently, a 10% increase in the energy tariff takes around 14 textile
units at the brink of closing the operations.
7. Regionally Competitive Energy Tariffs and Fiscal Burden
Some government bodies are pointing towards the fiscal burden of the RCET policy and calling
it categorically a subsidy. These bodies are also demanding a withdrawal of the policy to address
fiscal concerns. Contrary to this point of view, another opinion also exists that calls for the
distinction between the actual unit cost of energy service and systemic inefficiencies. They argue
that the energy tariffs are high due to governance issues, operational and commercial
inefficiencies, lack of effective planning, flawed policies, distorted pricing strategy, irrational
cross-subsidization, and most importantly sub-optimal energy mix (Malik, 2020).9 Resultantly, the
unit energy price set by the policymakers attempts to cover all these inefficiencies. Naturally, it
9 Malik, Afia (2020). Circular Debt-an unfortunate misnomer. PIDE working paper No. 20.
Regionally Competitive Energy Tariffs and Textile Sector’s Competitiveness
16 PIDE
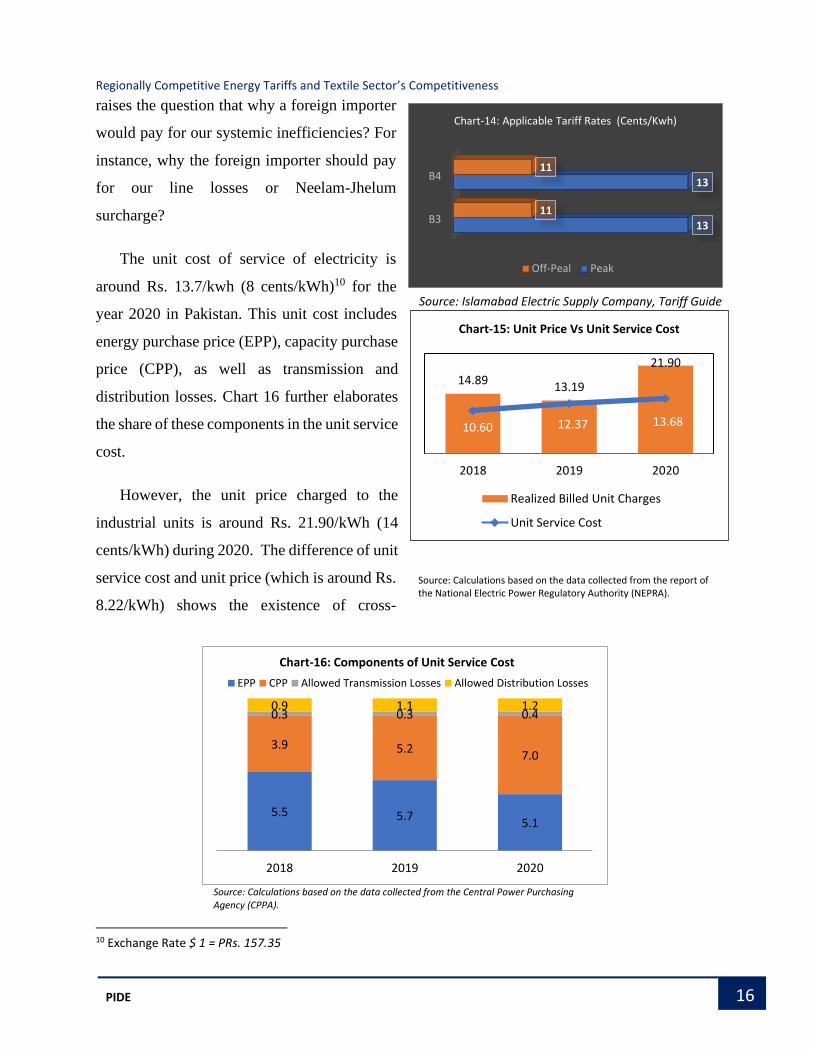
raises the question that why a foreign importer
would pay for our systemic inefficiencies? For
instance, why the foreign importer should pay
for our line losses or Neelam-Jhelum
surcharge?
The unit cost of service of electricity is
around Rs. 13.7/kwh (8 cents/kWh)10 for the
year 2020 in Pakistan. This unit cost includes
energy purchase price (EPP), capacity purchase
price (CPP), as well as transmission and
distribution losses. Chart 16 further elaborates
the share of these components in the unit service
cost.
However, the unit price charged to the
industrial units is around Rs. 21.90/kWh (14
cents/kWh) during 2020. The difference of unit
service cost and unit price (which is around Rs.
8.22/kWh) shows the existence of cross-
10 Exchange Rate $ 1 = PRs. 157.35
Source: Islamabad Electric Supply Company, Tariff Guide
Source: Calculations based on the data collected from the Central Power Purchasing Agency (CPPA).
Source: Calculations based on the data collected from the report of the National Electric Power Regulatory Authority (NEPRA).
14.8913.19
21.90
10.60 12.37 13.68
2018 2019 2020
Chart-15: Unit Price Vs Unit Service Cost
Realized Billed Unit Charges
Unit Service Cost
5.5 5.75.1
3.9 5.27.0
0.3 0.3 0.40.9 1.1 1.2
2018 2019 2020
Chart-16: Components of Unit Service Cost
EPP CPP Allowed Transmission Losses Allowed Distribution Losses
B3
B4
13
13
11
11
Chart-14: Applicable Tariff Rates (Cents/Kwh)
Off-Peal Peak
Regionally Competitive Energy Tariffs and Textile Sector’s Competitiveness
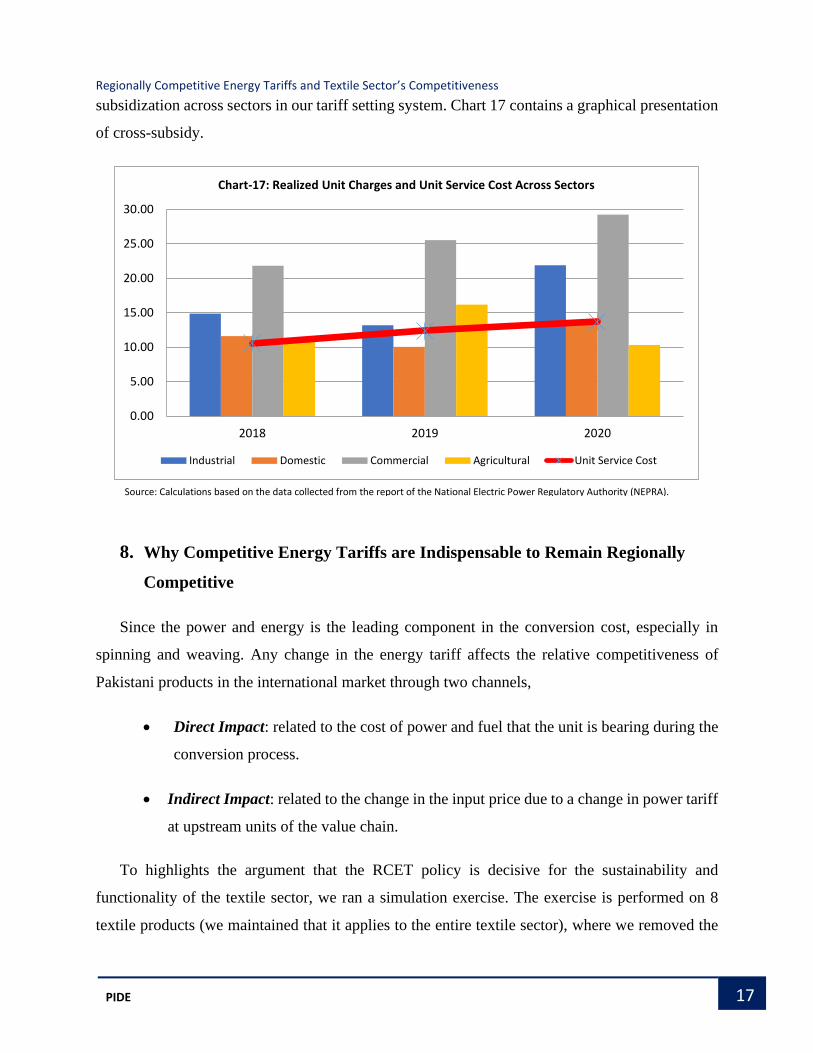
17 PIDE
subsidization across sectors in our tariff setting system. Chart 17 contains a graphical presentation
of cross-subsidy.
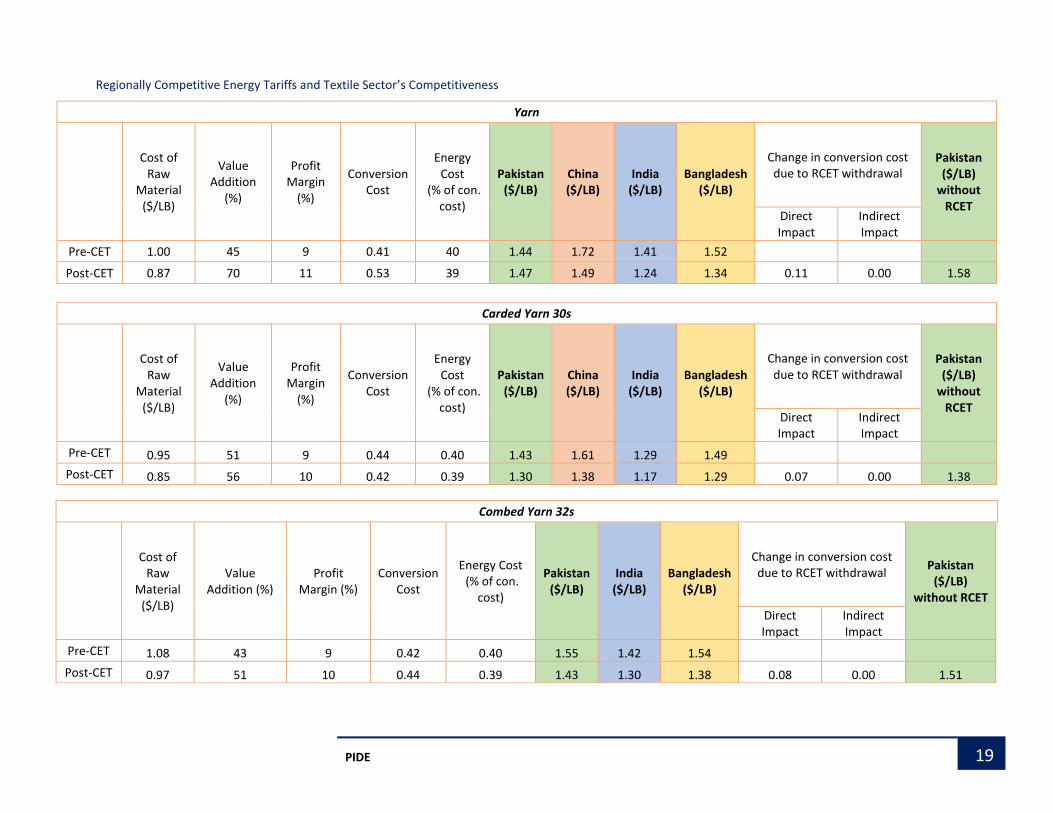
8. Why Competitive Energy Tariffs are Indispensable to Remain Regionally
Competitive
Since the power and energy is the leading component in the conversion cost, especially in
spinning and weaving. Any change in the energy tariff affects the relative competitiveness of
Pakistani products in the international market through two channels,
• Direct Impact: related to the cost of power and fuel that the unit is bearing during the
conversion process.
• Indirect Impact: related to the change in the input price due to a change in power tariff
at upstream units of the value chain.
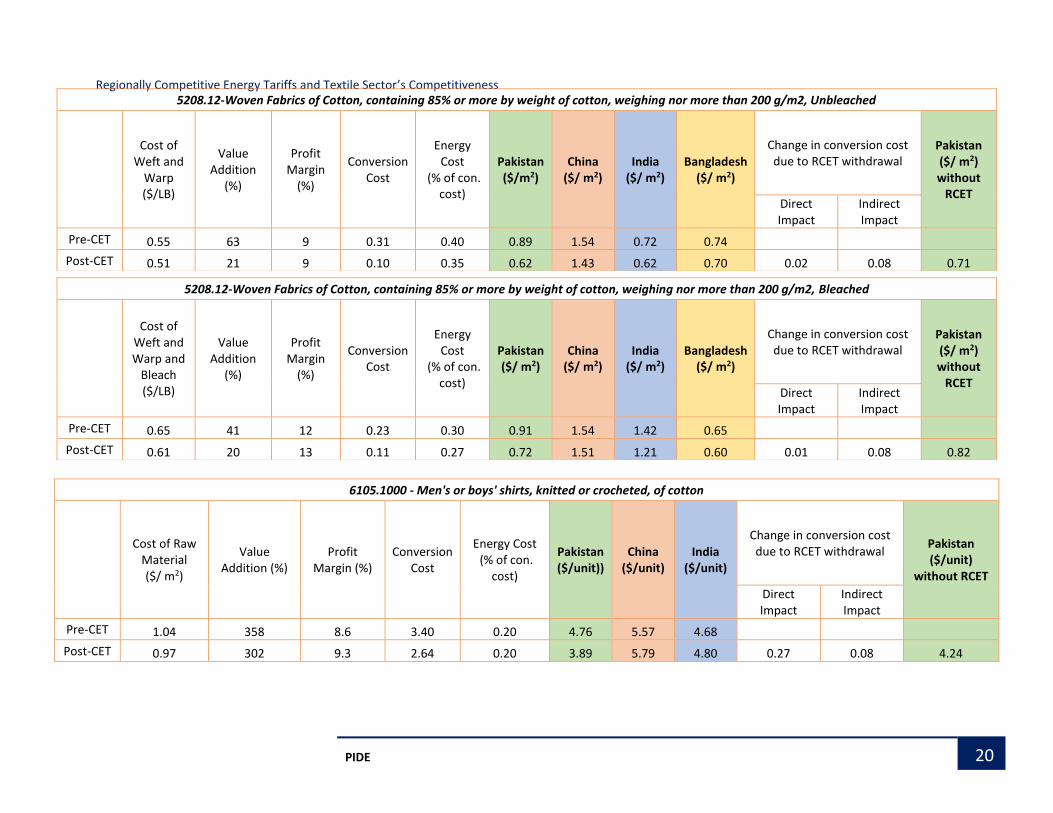
To highlights the argument that the RCET policy is decisive for the sustainability and
functionality of the textile sector, we ran a simulation exercise. The exercise is performed on 8
textile products (we maintained that it applies to the entire textile sector), where we removed the
Source: Calculations based on the data collected from the report of the National Electric Power Regulatory Authority (NEPRA).
0.00
5.00
10.00
15.00
20.00
25.00
30.00
2018 2019 2020
Chart-17: Realized Unit Charges and Unit Service Cost Across Sectors
Industrial Domestic Commercial Agricultural Unit Service Cost

Regionally Competitive Energy Tariffs and Textile Sector’s Competitiveness
18 PIDE
competitive energy tariffs and compared the price offered by Pakistan in the international market
with regional countries. The prices of raw cotton, yarn, carded yarn and combed yarn is taken from
the emerging textile database.11 While the prices of the rest of the raw materials and outputs are
gathered from International Trade Center (ITC)12 database. For further details related to
assumptions and costing sheets, see Appendix-D.
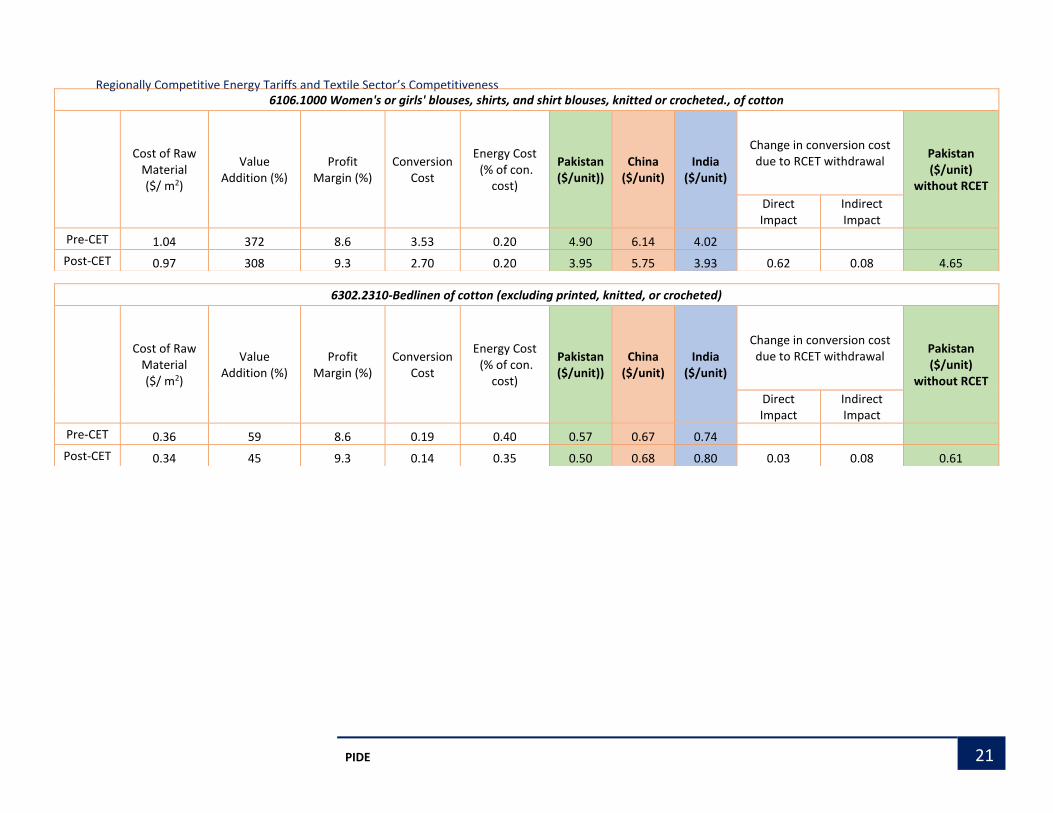
The results indicate that the upstream industry (spinning and weaving) will become regionally
uncompetitive in the event of the RCET policy withdrawal. The spinning sector will not only lose
international market share but also put domestic sales in jeopardy. While downstream industry,
although will remain in the competition even without RCET rates but will definitely lose the price
rankings. The change of market price ranking due to RCET withdrawal is highlighted for the rest
of the products.
11 Can access at https://www.emergingtextiles.com/ 12 Can access at https://www.intracen.org/
Regionally Competitive Energy Tariffs and Textile Sector’s Competitiveness
19 PIDE
Yarn
Cost of Raw
Material ($/LB)
Value Addition
(%)
Profit Margin
(%)
Conversion Cost
Energy Cost
(% of con. cost)
Pakistan ($/LB)
China ($/LB)
India ($/LB)
Bangladesh ($/LB)
Change in conversion cost due to RCET withdrawal
Pakistan ($/LB)
without RCET
Direct Impact
Indirect Impact
Pre-CET 1.00 45 9 0.41 40 1.44 1.72 1.41 1.52
Post-CET 0.87 70 11 0.53 39 1.47 1.49 1.24 1.34 0.11 0.00 1.58
Carded Yarn 30s
Cost of Raw
Material ($/LB)
Value Addition
(%)
Profit Margin
(%)
Conversion Cost
Energy Cost
(% of con. cost)
Pakistan ($/LB)
China ($/LB)
India ($/LB)
Bangladesh ($/LB)
Change in conversion cost due to RCET withdrawal
Pakistan ($/LB)
without RCET
Direct Impact
Indirect Impact
Pre-CET 0.95 51 9 0.44 0.40 1.43 1.61 1.29 1.49
Post-CET 0.85 56 10 0.42 0.39 1.30 1.38 1.17 1.29 0.07 0.00 1.38
Combed Yarn 32s
Cost of Raw
Material ($/LB)
Value Addition (%)
Profit Margin (%)
Conversion Cost
Energy Cost (% of con.
cost)
Pakistan ($/LB)
India ($/LB)
Bangladesh ($/LB)
Change in conversion cost due to RCET withdrawal
Pakistan ($/LB)
without RCET
Direct Impact
Indirect Impact
Pre-CET 1.08 43 9 0.42 0.40 1.55 1.42 1.54
Post-CET 0.97 51 10 0.44 0.39 1.43 1.30 1.38 0.08 0.00 1.51
Regionally Competitive Energy Tariffs and Textile Sector’s Competitiveness
20 PIDE
5208.12-Woven Fabrics of Cotton, containing 85% or more by weight of cotton, weighing nor more than 200 g/m2, Unbleached
Cost of Weft and
Warp ($/LB)
Value Addition
(%)
Profit Margin
(%)
Conversion Cost
Energy Cost
(% of con. cost)
Pakistan ($/m2)
China ($/ m2)
India ($/ m2)
Bangladesh ($/ m2)
Change in conversion cost due to RCET withdrawal
Pakistan ($/ m2) without
RCET Direct Impact
Indirect Impact
Pre-CET 0.55 63 9 0.31 0.40 0.89 1.54 0.72 0.74
Post-CET 0.51 21 9 0.10 0.35 0.62 1.43 0.62 0.70 0.02 0.08 0.71
5208.12-Woven Fabrics of Cotton, containing 85% or more by weight of cotton, weighing nor more than 200 g/m2, Bleached
Cost of Weft and Warp and
Bleach ($/LB)
Value Addition
(%)
Profit Margin
(%)
Conversion Cost
Energy Cost
(% of con. cost)
Pakistan ($/ m2)
China ($/ m2)
India ($/ m2)
Bangladesh ($/ m2)
Change in conversion cost due to RCET withdrawal
Pakistan ($/ m2) without
RCET Direct Impact
Indirect Impact
Pre-CET 0.65 41 12 0.23 0.30 0.91 1.54 1.42 0.65
Post-CET 0.61 20 13 0.11 0.27 0.72 1.51 1.21 0.60 0.01 0.08 0.82
6105.1000 - Men's or boys' shirts, knitted or crocheted, of cotton
Cost of Raw
Material ($/ m2)
Value Addition (%)
Profit Margin (%)
Conversion Cost
Energy Cost (% of con.
cost)
Pakistan ($/unit))
China ($/unit)
India ($/unit)
Change in conversion cost due to RCET withdrawal
Pakistan ($/unit)
without RCET
Direct Impact
Indirect Impact
Pre-CET 1.04 358 8.6 3.40 0.20 4.76 5.57 4.68
Post-CET 0.97 302 9.3 2.64 0.20 3.89 5.79 4.80 0.27 0.08 4.24
Regionally Competitive Energy Tariffs and Textile Sector’s Competitiveness
21 PIDE
6106.1000 Women's or girls' blouses, shirts, and shirt blouses, knitted or crocheted., of cotton
Cost of Raw
Material ($/ m2)
Value Addition (%)
Profit Margin (%)
Conversion Cost
Energy Cost (% of con.
cost)
Pakistan ($/unit))
China ($/unit)
India ($/unit)
Change in conversion cost due to RCET withdrawal
Pakistan ($/unit)
without RCET
Direct Impact
Indirect Impact
Pre-CET 1.04 372 8.6 3.53 0.20 4.90 6.14 4.02
Post-CET 0.97 308 9.3 2.70 0.20 3.95 5.75 3.93 0.62 0.08 4.65
6302.2310-Bedlinen of cotton (excluding printed, knitted, or crocheted)
Cost of Raw
Material ($/ m2)
Value Addition (%)
Profit Margin (%)
Conversion Cost
Energy Cost (% of con.
cost)
Pakistan ($/unit))
China ($/unit)
India ($/unit)
Change in conversion cost due to RCET withdrawal
Pakistan ($/unit)
without RCET
Direct Impact
Indirect Impact
Pre-CET 0.36 59 8.6 0.19 0.40 0.57 0.67 0.74
Post-CET 0.34 45 9.3 0.14 0.35 0.50 0.68 0.80 0.03 0.08 0.61
Regionally Competitive Energy Tariffs and Textile Sector’s Competitiveness
22 PIDE
9. Replacing Competitive Energy Tariff Policy with Drawback of Local Taxes
and Levies (DLTL) Scheme
Recently another channel to offer the concessionary energy tariffs has also been in the debate,
which involves replacing the RCET policy with a duty drawback on local taxes and levies (DLTL)
scheme. The proposed scheme will be offered to export-oriented units of the zero-rated sectors.
Under this scheme, they will receive a refund against the energy tariffs paid during the production
process after filing a refund claim at exporting stage. Now the question is either such schemes will
work more efficiently in making the sector regionally competitive or not? It is pertinent to note
that most of the business community has already forthrightly rejected this proposal.
Before answering this question, first, we must re-think the primary rationale for the demand
and introduction of the competitive energy tariff. The rationale for the competitive energy is simply
to provide a regional level playing field to our export-oriented units of the five zero-rated sectors.
Then, the provision of a direct concession based on the unit of service cost of energy, which is
termed as the competitive energy tariff, is a far more efficient way than an indirect concession like
DLTL. Besides, DLTL also involves extra costs, like:
• Time and Delay Cost
Schemes like DLTL involve a refund mechanism, which mostly involves the release of
claims at the end of a fiscal year. But in the case of Pakistan, as evident by the recent
release of Rs. 5.5 billion of DLTL claims due since 2014, time and delay cost is much
higher.
• Documentation Cost
The submission of a refund claim also involves excessive documentation and shoe-
leather cost, for instance, getting an audit and verification of claims by the authorized
bank before submitting the refund claim.
Therefore, the very core objective of making the textile sector competitive would not be
realized by providing such delayed concessions and supports. The sector is now emerging stronger
Regionally Competitive Energy Tariffs and Textile Sector’s Competitiveness
23 PIDE
and needs finances to grow. Therefore, a direct and timely provision of relief will have far-reaching
effects.
Now consider the scenario of replacing the competitive energy tariffs with DLTL. With the
introduction of such a scheme, the textile units will have to pay the regionally uncompetitive
energy tariffs, for instance, the electricity tariff is 14 cents/kWh. Due to higher energy costs, the
price of output domestically produced will ultimately rise. Consequently, the output price of the
products will also be regionally uncompetitive. Since the inputs imports of the textile are subject
to a zero rate. A unit at the mid or downstream of the value chain will prefer imported inputs
instead of costly domestic inputs. Eventually, domestic units at the upstream of the value chain
will suffer the most. Such kind of policy would be catastrophic for the spinning sector and it would
be difficult for the spinners to remains in the market by offering competitive rates.
Lastly, the introduction of a DLTL scheme for energy tariffs based on the supposition that it
will have a trickle-down effect for the whole value chain is not a pragmatic approach. Exporters
in the textile sector (which are merely 28% of the listed textile units), seldom share the benefits of
such a scheme with their suppliers. Moreover, the main beneficiaries of such a scheme would be
the vertically integrated units, which also represent only a minuscule chunk of the industry.
Persistently, a textile unit that is not directly involved in the export business would not be able to
obtain any benefit from such a scheme and lose domestic market share as well.
10. Three Main Challenges to Textile Sector
To grasp the dynamics of the sector and have a deeper understanding of the issues and
challenges that the textile sector is facing, our teams organized two week-long field visits with the
help of the All Pakistan Textile Mills Association (APTMA). We targeted Lahore and Faisalabad,
as both cities are the leading textile industrial hubs. These visits involve in-depth interviews with
senior management and structured questionnaire filling from the technical officers from different
textile units. The table below contains a summary of the number of units we visited.
1. No. of Spinning Units Visited 7
2. No. of Weaving Unit Visited 5
3. No. of Processing Units Visited 3
4. No. of Knitting Units Visited 2
Regionally Competitive Energy Tariffs and Textile Sector’s Competitiveness
24 PIDE
5. No. of Garments Units Visited 3
6. No. of Composite Units Visited 4
7. No. of Structured Interviews with Technical Officers Conducted 11
8. No. of in-Depth Interview with Senior Management Conducted 5
Three main challenges that emerged in unanimity during the interviews and discussion with
the experts, technical officers, and senior management from the textile sector, which are;
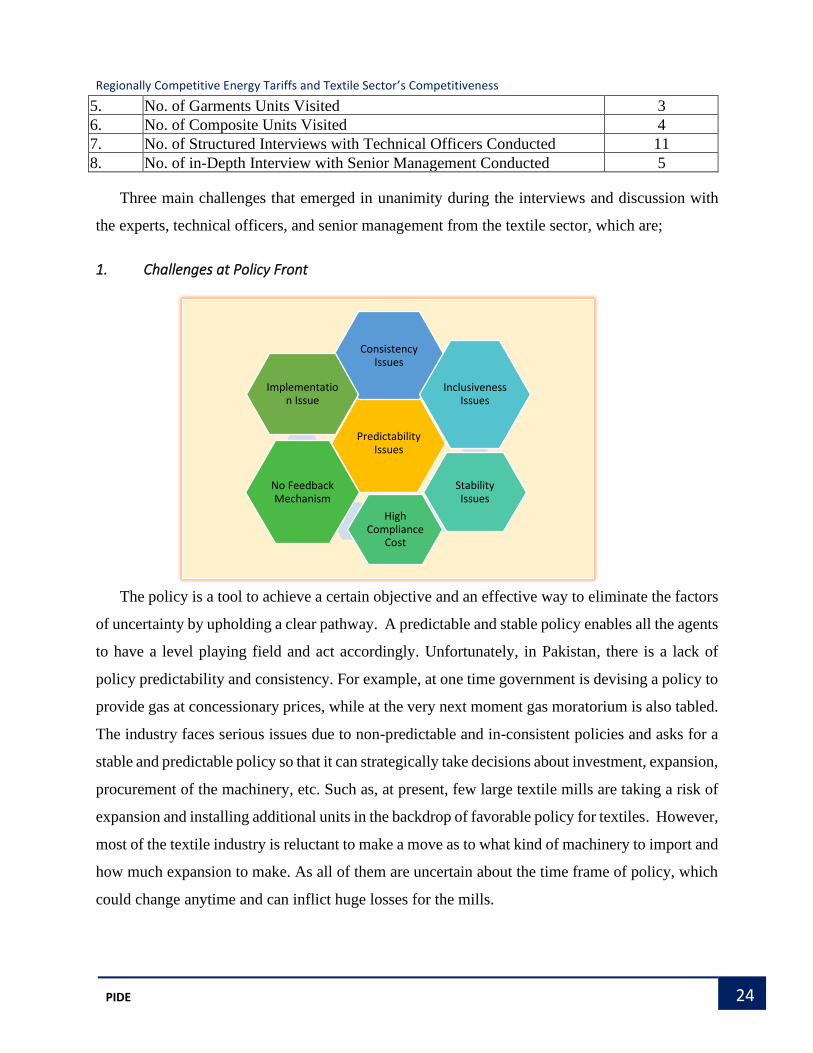
1. Challenges at Policy Front
The policy is a tool to achieve a certain objective and an effective way to eliminate the factors
of uncertainty by upholding a clear pathway. A predictable and stable policy enables all the agents
to have a level playing field and act accordingly. Unfortunately, in Pakistan, there is a lack of
policy predictability and consistency. For example, at one time government is devising a policy to
provide gas at concessionary prices, while at the very next moment gas moratorium is also tabled.
The industry faces serious issues due to non-predictable and in-consistent policies and asks for a
stable and predictable policy so that it can strategically take decisions about investment, expansion,
procurement of the machinery, etc. Such as, at present, few large textile mills are taking a risk of
expansion and installing additional units in the backdrop of favorable policy for textiles. However,
most of the textile industry is reluctant to make a move as to what kind of machinery to import and
how much expansion to make. As all of them are uncertain about the time frame of policy, which
could change anytime and can inflict huge losses for the mills.
Predictability Issues
Consistency Issues
Inclusiveness Issues
Stability Issues
High Compliance
Cost
No Feedback Mechanism
Implementation Issue
Regionally Competitive Energy Tariffs and Textile Sector’s Competitiveness
25 PIDE
Here, it is pertinent to note that whatever the government decides, should be through an
inclusive process, taking all the stakeholders on board and then make an inclusive endogenous
decision. This is also important because, within the textile sector, there are different segments i.e.,
spinning, weaving, knitting, and garments, etc. Each segment has different problems which require
different approaches to tackle them. So, inclusive policymaking would give them a chance to voice
their concern.
The textile sector is now in dire need of a long run and comprehensive investment planning to
emerge as the key driver for economic growth. Investment on such a scale would also have positive
spillover effects within the industry and across some other industries as well. As of now, the
productivity of the industry has increased a bit and investment is also happening. Now, to avail the
full potential of the textile sector and retain as well as enhance the existing customer base, the
consistent implementation of RCET policy is the need of the time. Contrarily, some quarters are
proposing the withdrawal of the RCET policy, while others are suggesting the moratorium of gas.
With these whimsical policy signals, we would not be able to develop investors’ confidence, and
reaping the full potential benefits of the sector will remain a far-distant target.
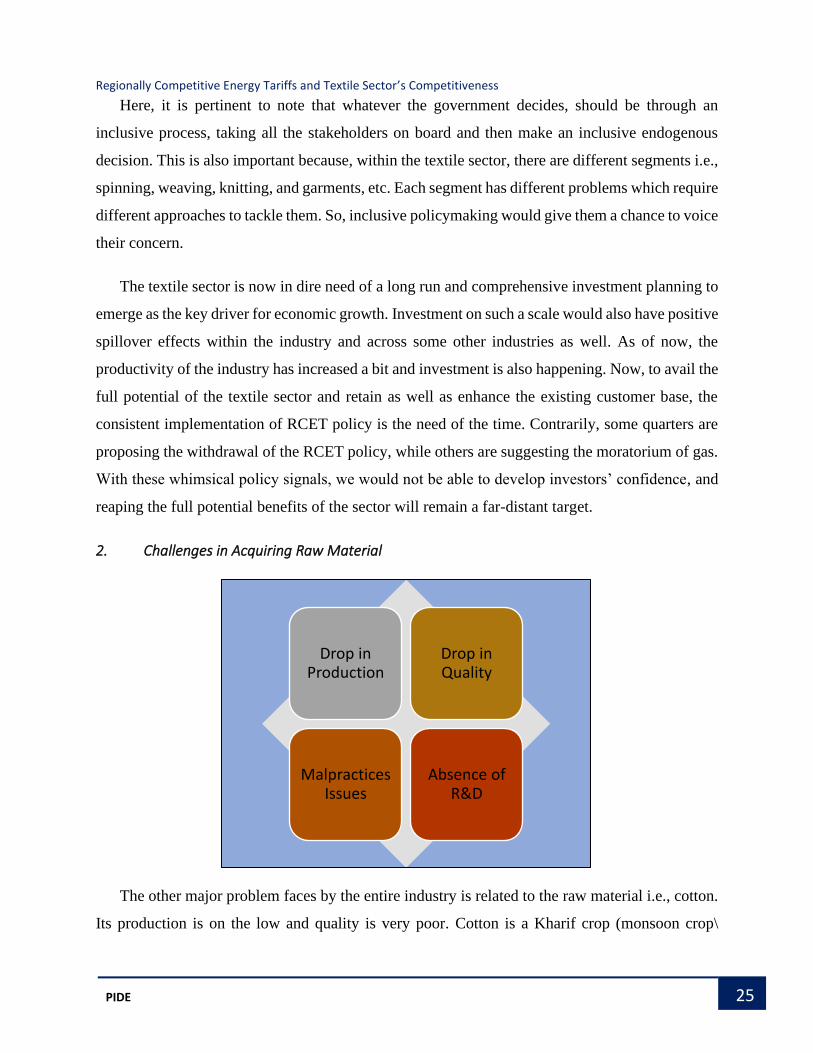
2. Challenges in Acquiring Raw Material
The other major problem faces by the entire industry is related to the raw material i.e., cotton.
Its production is on the low and quality is very poor. Cotton is a Kharif crop (monsoon crop\
Drop in Production
Drop in Quality
Malpractices Issues
Absence of R&D
Regionally Competitive Energy Tariffs and Textile Sector’s Competitiveness
26 PIDE
autumn crop). In Pakistan, there are three other major Kharif crops as well, besides cotton. These
include maize, rice, and sugarcane. Over the last two decades, the area of sugar cane and rice
cultivation has increased by almost 19 %. Whereas the cultivation area of maize has increased by
a 40 %. In contrast, the cultivation area of cotton has decreased by 18 %.13 Besides, the cotton crop
is more prone to pest attacks and plant diseases. In parallel, if farmers use pesticides, it adds to the
cost, and for the small farmer, integrated pesticide management is expensive. Thus, farmers are
shifting from cotton to those crops which are profitable for them.
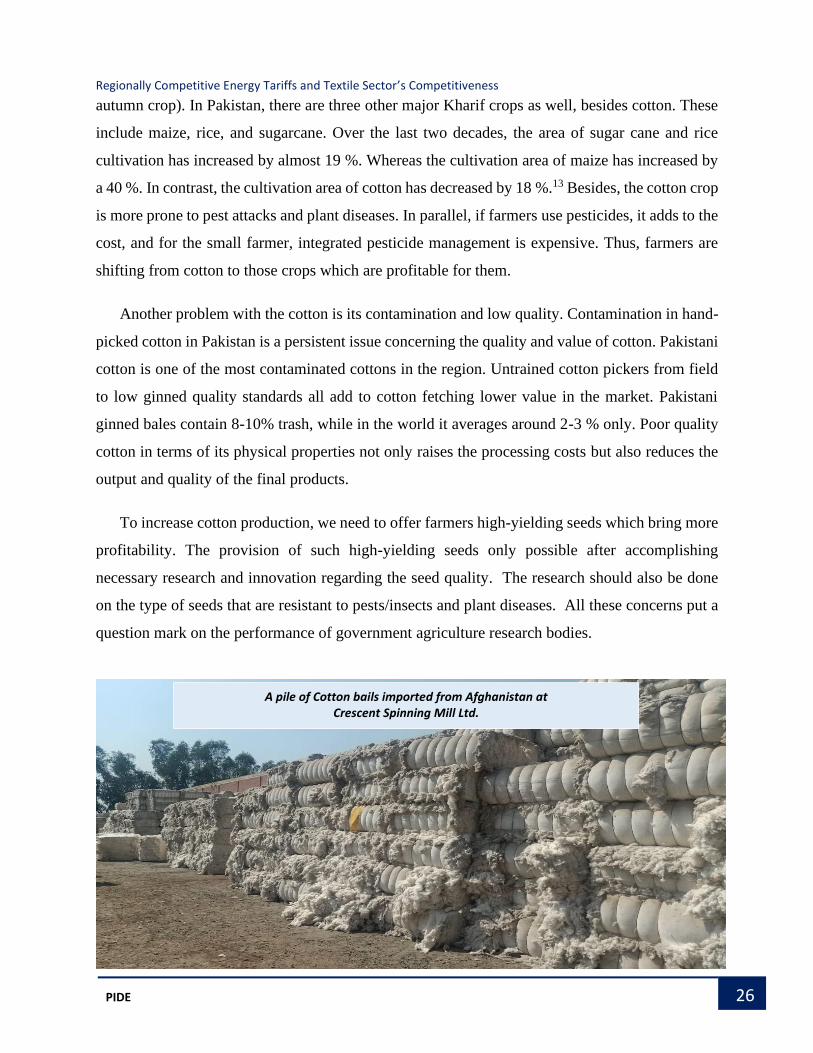
Another problem with the cotton is its contamination and low quality. Contamination in hand-
picked cotton in Pakistan is a persistent issue concerning the quality and value of cotton. Pakistani
cotton is one of the most contaminated cottons in the region. Untrained cotton pickers from field
to low ginned quality standards all add to cotton fetching lower value in the market. Pakistani
ginned bales contain 8-10% trash, while in the world it averages around 2-3 % only. Poor quality
cotton in terms of its physical properties not only raises the processing costs but also reduces the
output and quality of the final products.
To increase cotton production, we need to offer farmers high-yielding seeds which bring more
profitability. The provision of such high-yielding seeds only possible after accomplishing
necessary research and innovation regarding the seed quality. The research should also be done
on the type of seeds that are resistant to pests/insects and plant diseases. All these concerns put a
question mark on the performance of government agriculture research bodies.
13 Similarly, if we observe the growth in the yield per hectare during the last two decades, there is a 40 % growth in yield per hectare in sugarcane and rice. Encouragingly, yield per hectare of maize grew by 171 % during this time, while cotton could grow meagerly, only by 15 %.
A pile of Cotton bails imported from Afghanistan at Crescent Spinning Mill Ltd.
Regionally Competitive Energy Tariffs and Textile Sector’s Competitiveness
27 PIDE
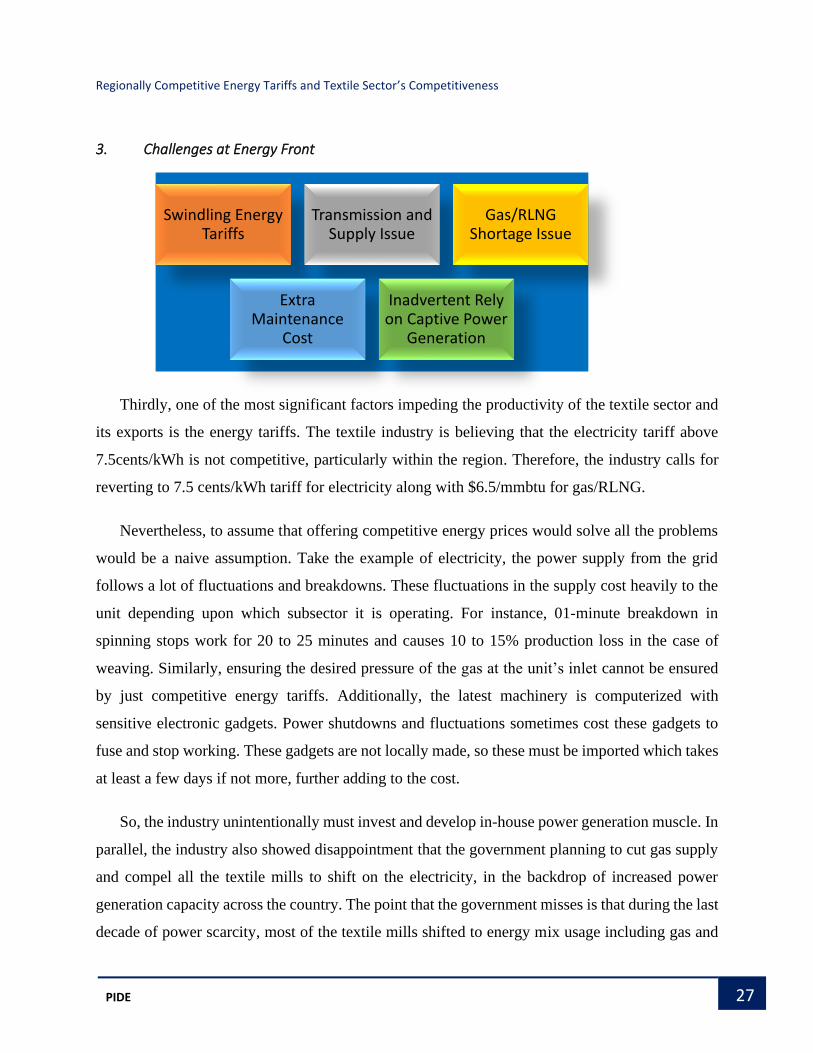
3. Challenges at Energy Front
Thirdly, one of the most significant factors impeding the productivity of the textile sector and
its exports is the energy tariffs. The textile industry is believing that the electricity tariff above
7.5cents/kWh is not competitive, particularly within the region. Therefore, the industry calls for
reverting to 7.5 cents/kWh tariff for electricity along with $6.5/mmbtu for gas/RLNG.
Nevertheless, to assume that offering competitive energy prices would solve all the problems
would be a naive assumption. Take the example of electricity, the power supply from the grid
follows a lot of fluctuations and breakdowns. These fluctuations in the supply cost heavily to the
unit depending upon which subsector it is operating. For instance, 01-minute breakdown in
spinning stops work for 20 to 25 minutes and causes 10 to 15% production loss in the case of
weaving. Similarly, ensuring the desired pressure of the gas at the unit’s inlet cannot be ensured
by just competitive energy tariffs. Additionally, the latest machinery is computerized with
sensitive electronic gadgets. Power shutdowns and fluctuations sometimes cost these gadgets to
fuse and stop working. These gadgets are not locally made, so these must be imported which takes
at least a few days if not more, further adding to the cost.
So, the industry unintentionally must invest and develop in-house power generation muscle. In
parallel, the industry also showed disappointment that the government planning to cut gas supply
and compel all the textile mills to shift on the electricity, in the backdrop of increased power
generation capacity across the country. The point that the government misses is that during the last
decade of power scarcity, most of the textile mills shifted to energy mix usage including gas and
Swindling Energy Tariffs
Transmission and Supply Issue
Gas/RLNG Shortage Issue
Extra Maintenance
Cost
Inadvertent Rely on Captive Power
Generation
Regionally Competitive Energy Tariffs and Textile Sector’s Competitiveness
28 PIDE
coal. In this context, they also imported machinery compatible with gas and coal. Now, what they
will do? Purchase new machinery that runs on electricity. Even if they bear the burden of the cost,
it is not sure for how long the government will be able to supply ample power to the industry. Even
if they do, they cannot provide uninterrupted supply and control power fluctuations. To control
these issues, a complete overhaul of the electricity infrastructure is required, which is out of the
question in the short run as it is a gigantic investment.
Besides that, some mills are more comfortable in using energy mix with a higher proportion
of gas and coal since it is more economical. Moreover, there also surfaced a demand for making
the best use of indigenous coal. The industry suggested that the government should incentivize
local coal mining and should focus particularly on refining the coal, so that textile and other
industries can use local coal at a very low transaction cost, eventually slashing down their
aggregate cost.
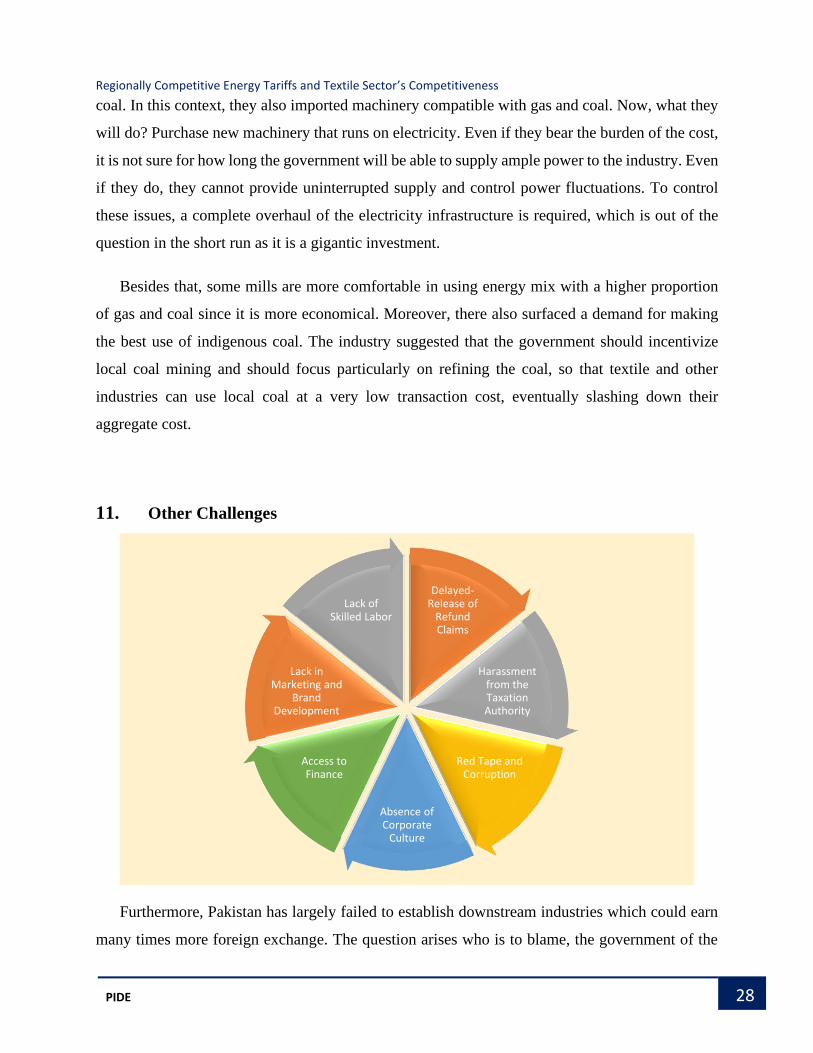
11. Other Challenges
Furthermore, Pakistan has largely failed to establish downstream industries which could earn
many times more foreign exchange. The question arises who is to blame, the government of the
Delayed-Release of
Refund Claims
Harassment from the Taxation Authority
Red Tape and Corruption
Absence of Corporate
Culture
Access to Finance
Lack in Marketing and
Brand Development
Lack of Skilled Labor
Regionally Competitive Energy Tariffs and Textile Sector’s Competitiveness
29 PIDE
textile industry itself? Respondents remarked that there is an inherent problem with the industry’s
attitude. Only the businessmen of Karachi have a bit sensible business approach. The rest of the
country has a mindset of bureaucrat or elite who does not plan about growing a business, but just
reaping considerable profit so that he/she can sit back, maintain, and enjoy the present lifestyle. In
simpler words, there is a dearth of corporate culture in Pakistan. Plus, our industry is not familiar
with modern marketing and branding techniques and tools that are widely used across the globe.
Without using the same techniques Pakistani products cannot compete with the international
competitors.
Similar is the case with the use of modern technology and human resource training. The
industry itself should be proactive and launch such initiatives to train and equip its workers with
modern skills, to amplify its productivity, rather than shifting the blame on the government and do
nothing. On the other hand, the government is also partially responsible as it is not providing a
favorable environment and the right incentives to promote downstream industries. The government
should also facilitate the industry to organize trade fairs regularly to promote Pakistani products
and establish global linkages to enhance its exports.
Further, interacting with the industry, we asked them if procuring finances from the
government is difficult or easy? The majority of them were of the view that they can get finances
easily, though the budget under this head should be increased so that procuring finances of large-
scale investments, which can include setting up an additional unit or plant becomes easier.
On the question, as to whether other government schemes to support the industry like Duty
Drawback on Local Taxes and Levies (DLTL), Duty and Tax Remission Scheme (DTRE),
Temporary Economic Refinance Facility (TERF), Long Term Financing Facility (LTFF), Export
Finance Scheme (EFS) along with few other schemes beneficial to the sector. The response was
positive. Nevertheless, the industry wants these schemes to be enhanced. The loudest voice for the
call of enhancement of the above-mentioned schemes came from export-oriented textile mills, as
they are in a more advantageous position to benefit from these schemes.
On the other hand, the textile sector does not seem happy with the free-flowing exchange rate.
They stated that the free-floating exchange rate and devaluation of the rupee stagnated the growth
of the inbound currency. What happened is that Pakistan is exporting more goods for the same
Regionally Competitive Energy Tariffs and Textile Sector’s Competitiveness
30 PIDE
amount of money, as Pakistan exports got cheaper. So, celebrating growth in exports is not
appropriate as it is in quantity terms only. In monetary terms, we are still at the same level. So, a
suggestion for keeping the exchange rate bit under control was voiced. However, some experts
had a different point of view.
12. Conclusion and the Way Forward
Pakistan has strong export potential in the textile sector. To unfold the inherent export potential
of the textile sector, large investment in machinery, enhanced skill set, and product development
is critical. However, success in these avenues is not possible in the absence of supporting policies
from the government. This is particularly true due to the fierce competition in textile products that
our region observes. Resultantly, a slight relative difference in the factor costs brings a massive
bearing on the country’s export performance. The same was true in the case of energy tariffs
applied to the textile sector before the RCET policy. Being the leading component of conversion
cost, regionally uncompetitive energy tariffs made our textile products uncompetitive. Eventually,
the government offered regionally competitive energy tariffs to the industry in late 2018, and the
textile sector started showing signs of revival.
The textile sector is presently experiencing expansion and up-gradation, all because of the
RCET policy that has turned profits from the business into positive territory. The sector is seeking
more finances and asking for more technological up-gradation support. Now, to optimize the full
potential of the textile sector and retain as well as enhance the existing customer base, the
consistent implementation of RCET policy is the need of the time. In contrast, some quarters are
proposing the withdrawal of the RCET policy, while others are suggesting the moratorium of gas.
With these whimsical policy signals, we would not be able to develop investors’ confidence, and
reap the full potential benefits of the sector will remain a far-distant target.
The COVID pandemic, where it has damaged the economic situation quite badly, has also
provided us a chance to re-orient our textile sector according to the needs of the time. The policies
from the government that are supportive like, the RCET policy, will play a key role and would act
as a catalyst in this re-orientation. Therefore, the government should come up with new supportive
policies that lead towards more value-addition and more foreign earnings instead of abandoning
the existing support.
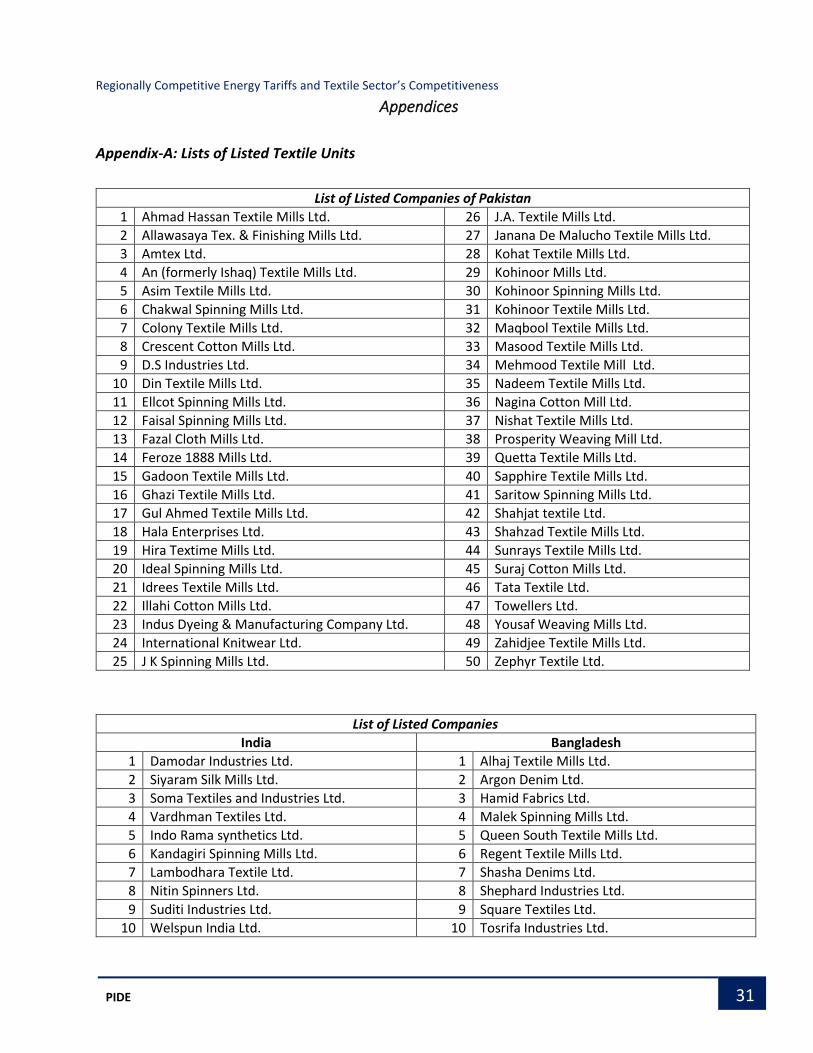
Regionally Competitive Energy Tariffs and Textile Sector’s Competitiveness
31 PIDE
Appendices
Appendix-A: Lists of Listed Textile Units
List of Listed Companies of Pakistan
1 Ahmad Hassan Textile Mills Ltd. 26 J.A. Textile Mills Ltd.
2 Allawasaya Tex. & Finishing Mills Ltd. 27 Janana De Malucho Textile Mills Ltd.
3 Amtex Ltd. 28 Kohat Textile Mills Ltd.
4 An (formerly Ishaq) Textile Mills Ltd. 29 Kohinoor Mills Ltd.
5 Asim Textile Mills Ltd. 30 Kohinoor Spinning Mills Ltd.
6 Chakwal Spinning Mills Ltd. 31 Kohinoor Textile Mills Ltd.
7 Colony Textile Mills Ltd. 32 Maqbool Textile Mills Ltd.
8 Crescent Cotton Mills Ltd. 33 Masood Textile Mills Ltd.
9 D.S Industries Ltd. 34 Mehmood Textile Mill Ltd.
10 Din Textile Mills Ltd. 35 Nadeem Textile Mills Ltd.
11 Ellcot Spinning Mills Ltd. 36 Nagina Cotton Mill Ltd.
12 Faisal Spinning Mills Ltd. 37 Nishat Textile Mills Ltd.
13 Fazal Cloth Mills Ltd. 38 Prosperity Weaving Mill Ltd.
14 Feroze 1888 Mills Ltd. 39 Quetta Textile Mills Ltd.
15 Gadoon Textile Mills Ltd. 40 Sapphire Textile Mills Ltd.
16 Ghazi Textile Mills Ltd. 41 Saritow Spinning Mills Ltd.
17 Gul Ahmed Textile Mills Ltd. 42 Shahjat textile Ltd.
18 Hala Enterprises Ltd. 43 Shahzad Textile Mills Ltd.
19 Hira Textime Mills Ltd. 44 Sunrays Textile Mills Ltd.
20 Ideal Spinning Mills Ltd. 45 Suraj Cotton Mills Ltd.
21 Idrees Textile Mills Ltd. 46 Tata Textile Ltd.
22 Illahi Cotton Mills Ltd. 47 Towellers Ltd.
23 Indus Dyeing & Manufacturing Company Ltd. 48 Yousaf Weaving Mills Ltd.
24 International Knitwear Ltd. 49 Zahidjee Textile Mills Ltd.
25 J K Spinning Mills Ltd. 50 Zephyr Textile Ltd.
List of Listed Companies
India Bangladesh
1 Damodar Industries Ltd. 1 Alhaj Textile Mills Ltd.
2 Siyaram Silk Mills Ltd. 2 Argon Denim Ltd.
3 Soma Textiles and Industries Ltd. 3 Hamid Fabrics Ltd.
4 Vardhman Textiles Ltd. 4 Malek Spinning Mills Ltd.
5 Indo Rama synthetics Ltd. 5 Queen South Textile Mills Ltd.
6 Kandagiri Spinning Mills Ltd. 6 Regent Textile Mills Ltd.
7 Lambodhara Textile Ltd. 7 Shasha Denims Ltd.
8 Nitin Spinners Ltd. 8 Shephard Industries Ltd.
9 Suditi Industries Ltd. 9 Square Textiles Ltd.
10 Welspun India Ltd. 10 Tosrifa Industries Ltd.
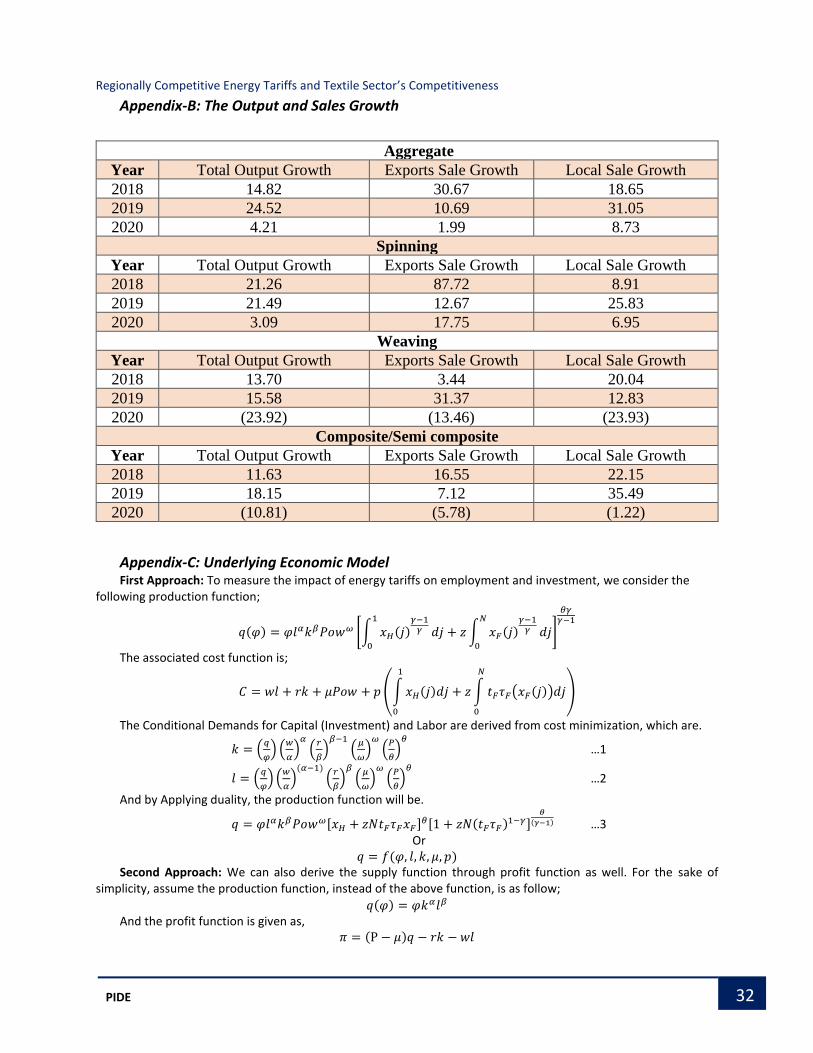
Regionally Competitive Energy Tariffs and Textile Sector’s Competitiveness
32 PIDE
Appendix-B: The Output and Sales Growth
Aggregate
Year Total Output Growth Exports Sale Growth Local Sale Growth
2018 14.82 30.67 18.65
2019 24.52 10.69 31.05
2020 4.21 1.99 8.73
Spinning
Year Total Output Growth Exports Sale Growth Local Sale Growth
2018 21.26 87.72 8.91
2019 21.49 12.67 25.83
2020 3.09 17.75 6.95
Weaving
Year Total Output Growth Exports Sale Growth Local Sale Growth
2018 13.70 3.44 20.04
2019 15.58 31.37 12.83
2020 (23.92) (13.46) (23.93)
Composite/Semi composite
Year Total Output Growth Exports Sale Growth Local Sale Growth
2018 11.63 16.55 22.15
2019 18.15 7.12 35.49
2020 (10.81) (5.78) (1.22)
Appendix-C: Underlying Economic Model First Approach: To measure the impact of energy tariffs on employment and investment, we consider the
following production function;
𝑞(𝜑) = 𝜑𝑙𝛼𝑘𝛽𝑃𝑜𝑤𝜔 [∫ 𝑥𝐻(𝑗)𝛾−1
𝛾
1
0
𝑑𝑗 + 𝑧 ∫ 𝑥𝐹(𝑗)𝛾−1
𝛾
𝑁
0
𝑑𝑗]
𝜃𝛾𝛾−1
The associated cost function is;
𝐶 = 𝑤𝑙 + 𝑟𝑘 + 𝜇𝑃𝑜𝑤 + 𝑝 (∫ 𝑥𝐻(𝑗)𝑑𝑗
1
0
+ 𝑧 ∫ 𝑡𝐹𝜏𝐹(𝑥𝐹(𝑗))𝑑𝑗
𝑁
0
)
The Conditional Demands for Capital (Investment) and Labor are derived from cost minimization, which are.
𝑘 = (𝑞
𝜑) (
𝑤
𝛼)
𝛼
(𝑟
𝛽)
𝛽−1
(𝜇
𝜔)
𝜔
(𝑃
𝜃)
𝜃
…1
𝑙 = (𝑞
𝜑) (
𝑤
𝛼)
(𝛼−1)
(𝑟
𝛽)
𝛽
(𝜇
𝜔)
𝜔
(𝑃
𝜃)
𝜃
…2
And by Applying duality, the production function will be.
𝑞 = 𝜑𝑙𝛼𝑘𝛽𝑃𝑜𝑤𝜔[𝑥𝐻 + 𝑧𝑁𝑡𝐹𝜏𝐹𝑥𝐹]𝜃[1 + 𝑧𝑁(𝑡𝐹𝜏𝐹)1−𝛾]𝜃
(𝛾−1) …3 Or
𝑞 = 𝑓(𝜑, 𝑙, 𝑘, 𝜇, 𝑝) Second Approach: We can also derive the supply function through profit function as well. For the sake of
simplicity, assume the production function, instead of the above function, is as follow;
𝑞(𝜑) = 𝜑𝑘𝛼𝑙𝛽 And the profit function is given as,
𝜋 = (Ρ − 𝜇)𝑞 − 𝑟𝑘 − 𝑤𝑙
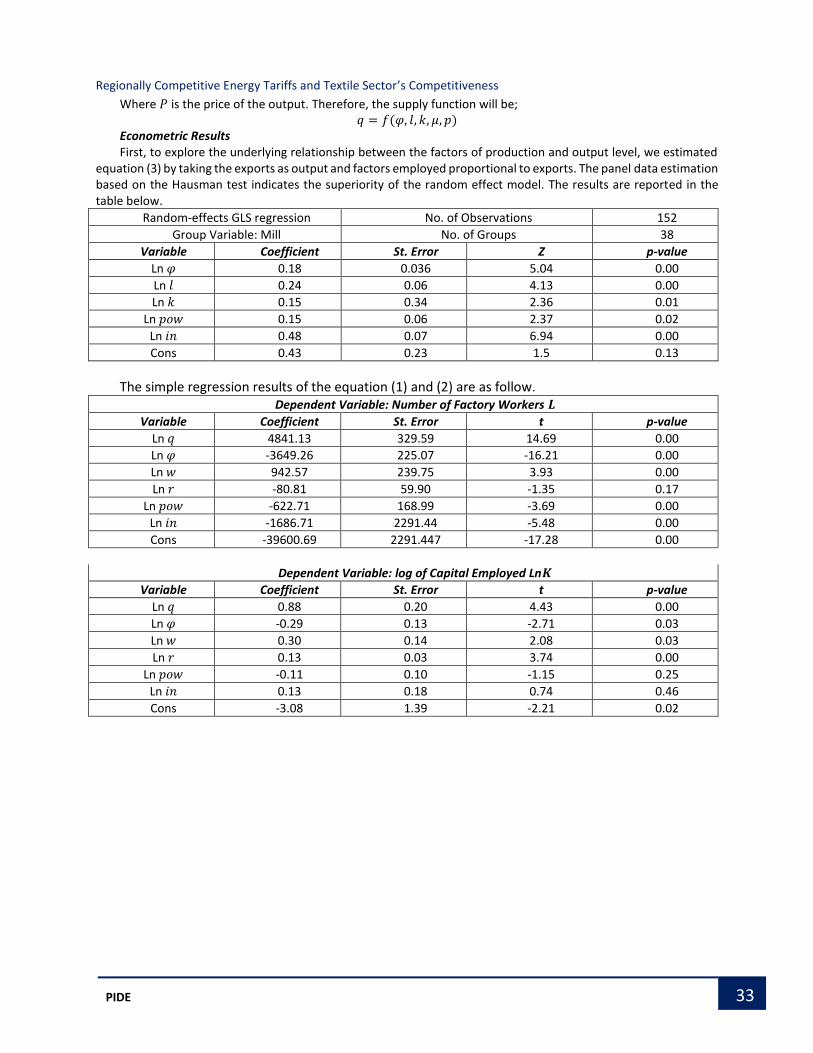
Regionally Competitive Energy Tariffs and Textile Sector’s Competitiveness
33 PIDE
Where 𝑃 is the price of the output. Therefore, the supply function will be; 𝑞 = 𝑓(𝜑, 𝑙, 𝑘, 𝜇, 𝑝)
Econometric Results First, to explore the underlying relationship between the factors of production and output level, we estimated
equation (3) by taking the exports as output and factors employed proportional to exports. The panel data estimation based on the Hausman test indicates the superiority of the random effect model. The results are reported in the table below.
Random-effects GLS regression No. of Observations 152
Group Variable: Mill No. of Groups 38
Variable Coefficient St. Error Z p-value
Ln 𝜑 0.18 0.036 5.04 0.00
Ln 𝑙 0.24 0.06 4.13 0.00
Ln 𝑘 0.15 0.34 2.36 0.01
Ln 𝑝𝑜𝑤 0.15 0.06 2.37 0.02
Ln 𝑖𝑛 0.48 0.07 6.94 0.00
Cons 0.43 0.23 1.5 0.13
The simple regression results of the equation (1) and (2) are as follow.
Dependent Variable: Number of Factory Workers 𝑳
Variable Coefficient St. Error t p-value
Ln 𝑞 4841.13 329.59 14.69 0.00
Ln 𝜑 -3649.26 225.07 -16.21 0.00
Ln 𝑤 942.57 239.75 3.93 0.00
Ln 𝑟 -80.81 59.90 -1.35 0.17
Ln 𝑝𝑜𝑤 -622.71 168.99 -3.69 0.00
Ln 𝑖𝑛 -1686.71 2291.44 -5.48 0.00
Cons -39600.69 2291.447 -17.28 0.00
Dependent Variable: log of Capital Employed Ln𝑲
Variable Coefficient St. Error t p-value
Ln 𝑞 0.88 0.20 4.43 0.00
Ln 𝜑 -0.29 0.13 -2.71 0.03
Ln 𝑤 0.30 0.14 2.08 0.03
Ln 𝑟 0.13 0.03 3.74 0.00
Ln 𝑝𝑜𝑤 -0.11 0.10 -1.15 0.25
Ln 𝑖𝑛 0.13 0.18 0.74 0.46
Cons -3.08 1.39 -2.21 0.02
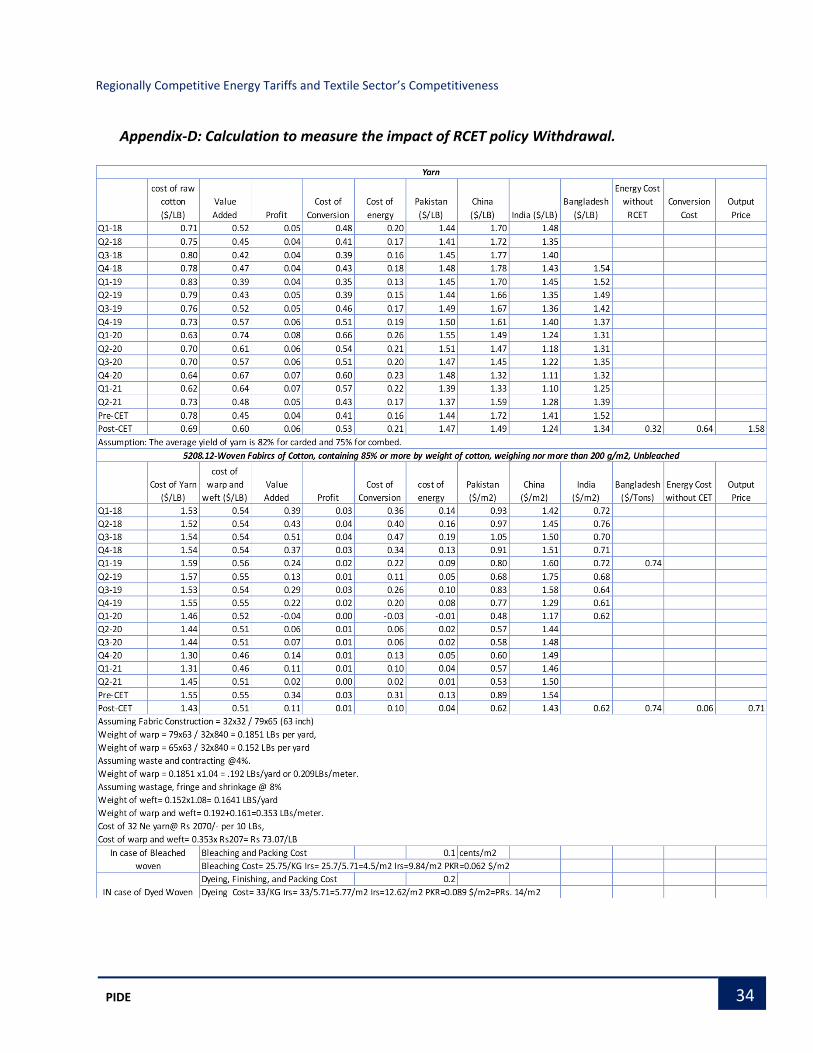
Regionally Competitive Energy Tariffs and Textile Sector’s Competitiveness
34 PIDE
Appendix-D: Calculation to measure the impact of RCET policy Withdrawal.
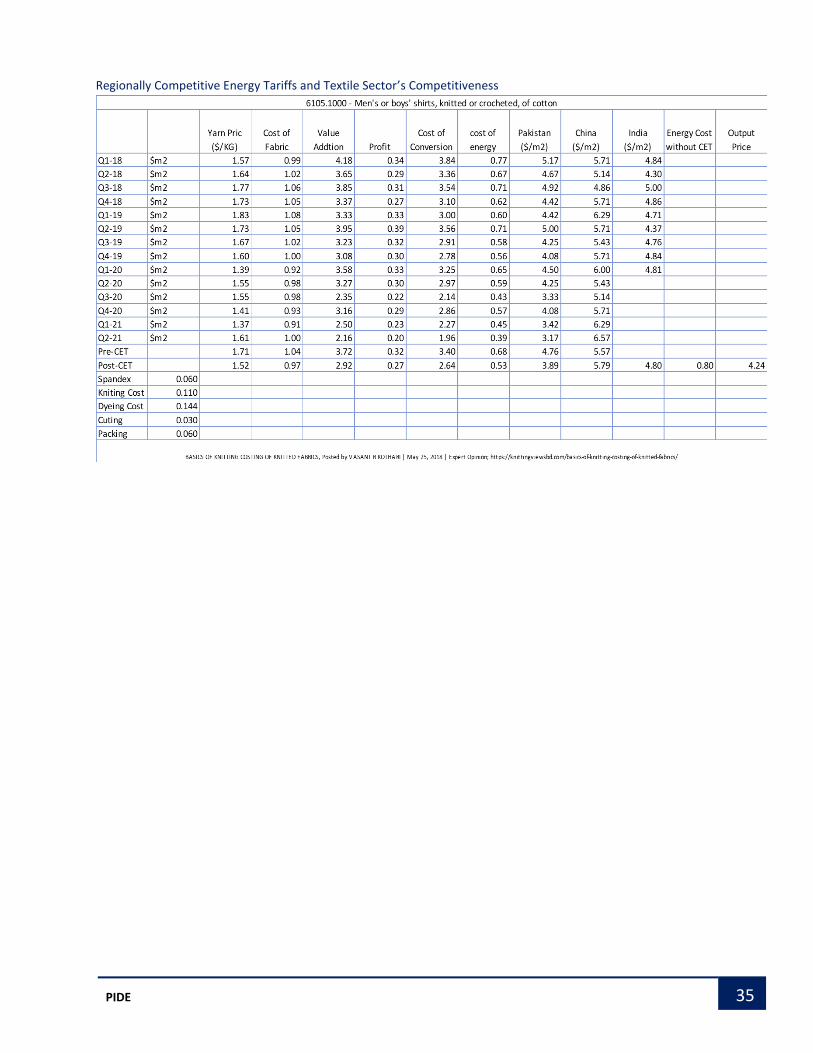
Regionally Competitive Energy Tariffs and Textile Sector’s Competitiveness
35 PIDE

Regionally Competitive Energy Tariffs and Textile Sector’s Competitiveness
36 PIDE
PAKISTAN INSTITUTE OF DEVELOPMENT ECONOMICS