india corn exports competitive regionally
TRANSCRIPT
United States Department of Agriculture Foreign Agricultural Service Grain: World Markets and Trade
Approved by the World Agricultural Outlook Board/USDA For email subscription, click here to register:
https://public.govdelivery.com/accounts/USDAFAS/subscriber/new
March 2021
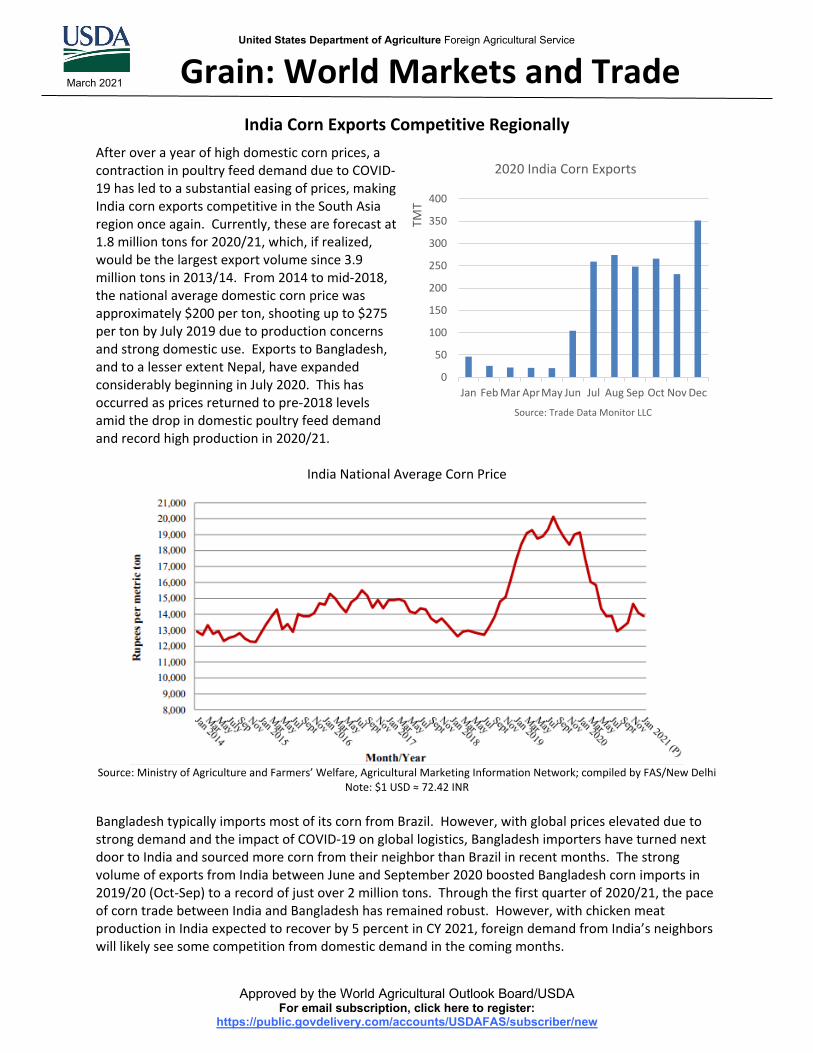
India Corn Exports Competitive Regionally After over a year of high domestic corn prices, a contraction in poultry feed demand due to COVID-19 has led to a substantial easing of prices, making India corn exports competitive in the South Asia region once again. Currently, these are forecast at 1.8 million tons for 2020/21, which, if realized, would be the largest export volume since 3.9 million tons in 2013/14. From 2014 to mid-2018, the national average domestic corn price was approximately $200 per ton, shooting up to $275 per ton by July 2019 due to production concerns and strong domestic use. Exports to Bangladesh, and to a lesser extent Nepal, have expanded considerably beginning in July 2020. This has occurred as prices returned to pre-2018 levels amid the drop in domestic poultry feed demand and record high production in 2020/21.
India National Average Corn Price
Source: Ministry of Agriculture and Farmers’ Welfare, Agricultural Marketing Information Network; compiled by FAS/New Delhi
Note: $1 USD ≈ 72.42 INR Bangladesh typically imports most of its corn from Brazil. However, with global prices elevated due to strong demand and the impact of COVID-19 on global logistics, Bangladesh importers have turned next door to India and sourced more corn from their neighbor than Brazil in recent months. The strong volume of exports from India between June and September 2020 boosted Bangladesh corn imports in 2019/20 (Oct-Sep) to a record of just over 2 million tons. Through the first quarter of 2020/21, the pace of corn trade between India and Bangladesh has remained robust. However, with chicken meat production in India expected to recover by 5 percent in CY 2021, foreign demand from India’s neighbors will likely see some competition from domestic demand in the coming months.
0
50
100
150
200
250
300
350
400
Jan Feb Mar Apr May Jun Jul Aug Sep Oct Nov Dec
TMT
2020 India Corn Exports
Source: Trade Data Monitor LLC
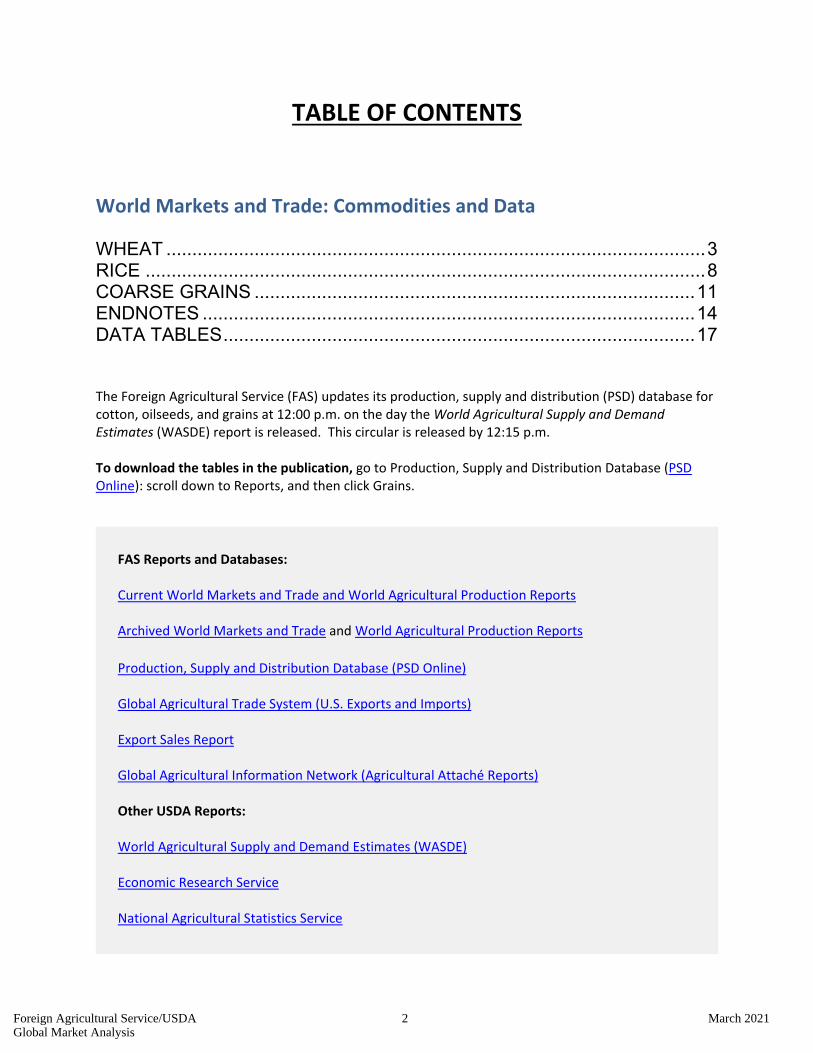
TABLE OF CONTENTS
World Markets and Trade: Commodities and Data WHEAT ........................................................................................................ 3 RICE ............................................................................................................ 8 COARSE GRAINS ..................................................................................... 11 ENDNOTES ............................................................................................... 14 DATA TABLES ........................................................................................... 17 The Foreign Agricultural Service (FAS) updates its production, supply and distribution (PSD) database for cotton, oilseeds, and grains at 12:00 p.m. on the day the World Agricultural Supply and Demand Estimates (WASDE) report is released. This circular is released by 12:15 p.m. To download the tables in the publication, go to Production, Supply and Distribution Database (PSD Online): scroll down to Reports, and then click Grains.
FAS Reports and Databases: Current World Markets and Trade and World Agricultural Production Reports Archived World Markets and Trade and World Agricultural Production Reports Production, Supply and Distribution Database (PSD Online) Global Agricultural Trade System (U.S. Exports and Imports) Export Sales Report Global Agricultural Information Network (Agricultural Attaché Reports) Other USDA Reports: World Agricultural Supply and Demand Estimates (WASDE) Economic Research Service National Agricultural Statistics Service
Foreign Agricultural Service/USDA 2 March 2021Global Market Analysis
WHEAT
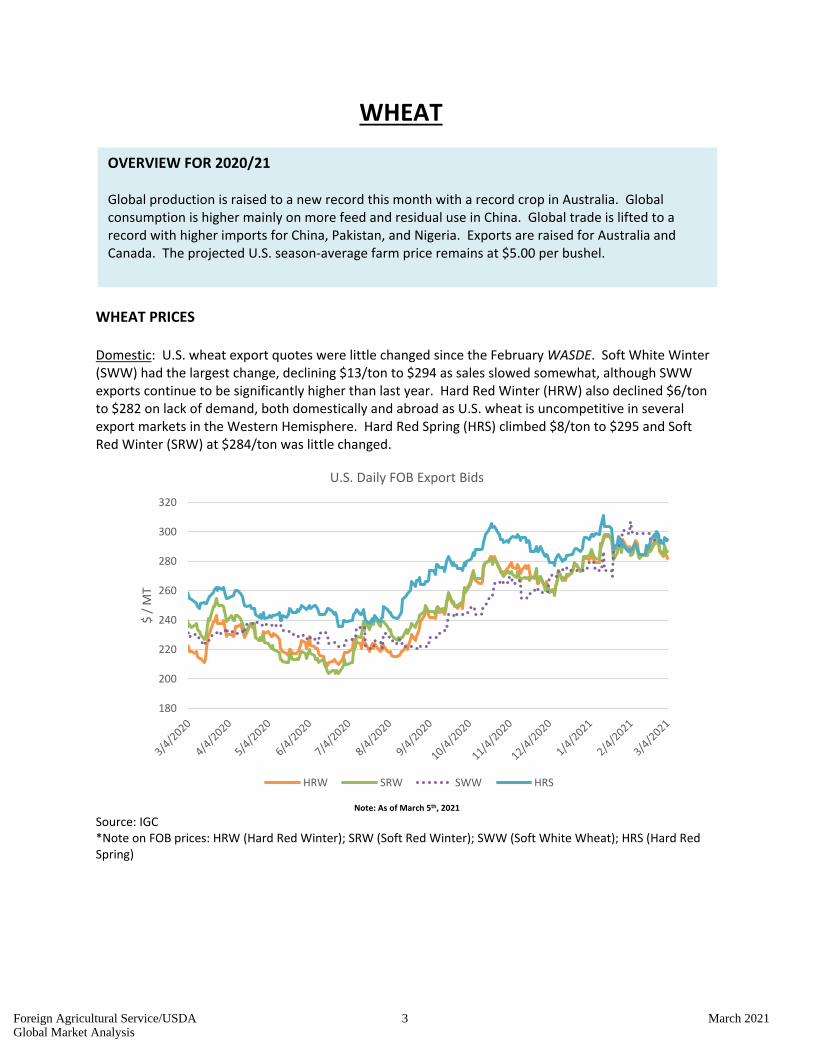
WHEAT PRICES Domestic: U.S. wheat export quotes were little changed since the February WASDE. Soft White Winter (SWW) had the largest change, declining $13/ton to $294 as sales slowed somewhat, although SWW exports continue to be significantly higher than last year. Hard Red Winter (HRW) also declined $6/ton to $282 on lack of demand, both domestically and abroad as U.S. wheat is uncompetitive in several export markets in the Western Hemisphere. Hard Red Spring (HRS) climbed $8/ton to $295 and Soft Red Winter (SRW) at $284/ton was little changed.
Note: As of March 5th, 2021
Source: IGC *Note on FOB prices: HRW (Hard Red Winter); SRW (Soft Red Winter); SWW (Soft White Wheat); HRS (Hard Red Spring)
OVERVIEW FOR 2020/21 Global production is raised to a new record this month with a record crop in Australia. Global consumption is higher mainly on more feed and residual use in China. Global trade is lifted to a record with higher imports for China, Pakistan, and Nigeria. Exports are raised for Australia and Canada. The projected U.S. season-average farm price remains at $5.00 per bushel.
180
200
220
240
260
280
300
320
$ / M
T
U.S. Daily FOB Export Bids
HRW SRW SWW HRS
Foreign Agricultural Service/USDA 3 March 2021Global Market Analysis
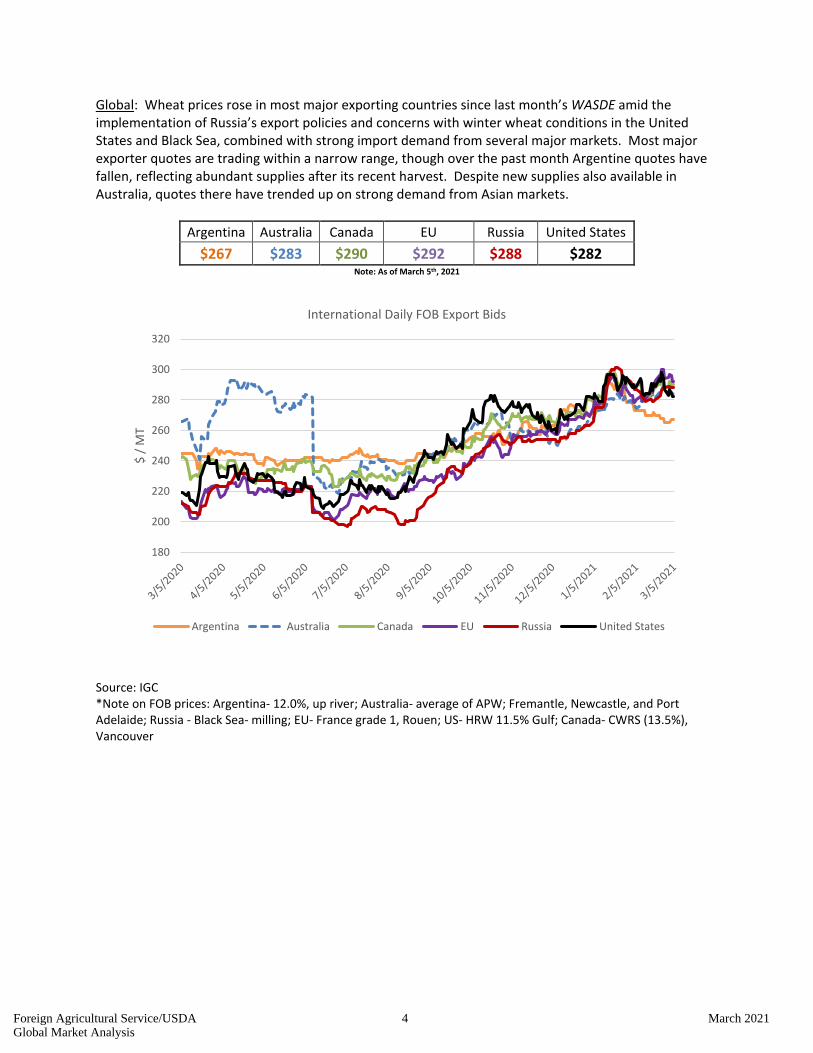
Global: Wheat prices rose in most major exporting countries since last month’s WASDE amid the implementation of Russia’s export policies and concerns with winter wheat conditions in the United States and Black Sea, combined with strong import demand from several major markets. Most major exporter quotes are trading within a narrow range, though over the past month Argentine quotes have fallen, reflecting abundant supplies after its recent harvest. Despite new supplies also available in Australia, quotes there have trended up on strong demand from Asian markets.
Argentina Australia Canada EU Russia United States $267 $283 $290 $292 $288 $282
Note: As of March 5th, 2021
Source: IGC *Note on FOB prices: Argentina- 12.0%, up river; Australia- average of APW; Fremantle, Newcastle, and Port Adelaide; Russia - Black Sea- milling; EU- France grade 1, Rouen; US- HRW 11.5% Gulf; Canada- CWRS (13.5%), Vancouver
180
200
220
240
260
280
300
320
$ / M
T
International Daily FOB Export Bids
Argentina Australia Canada EU Russia United States
Foreign Agricultural Service/USDA 4 March 2021Global Market Analysis
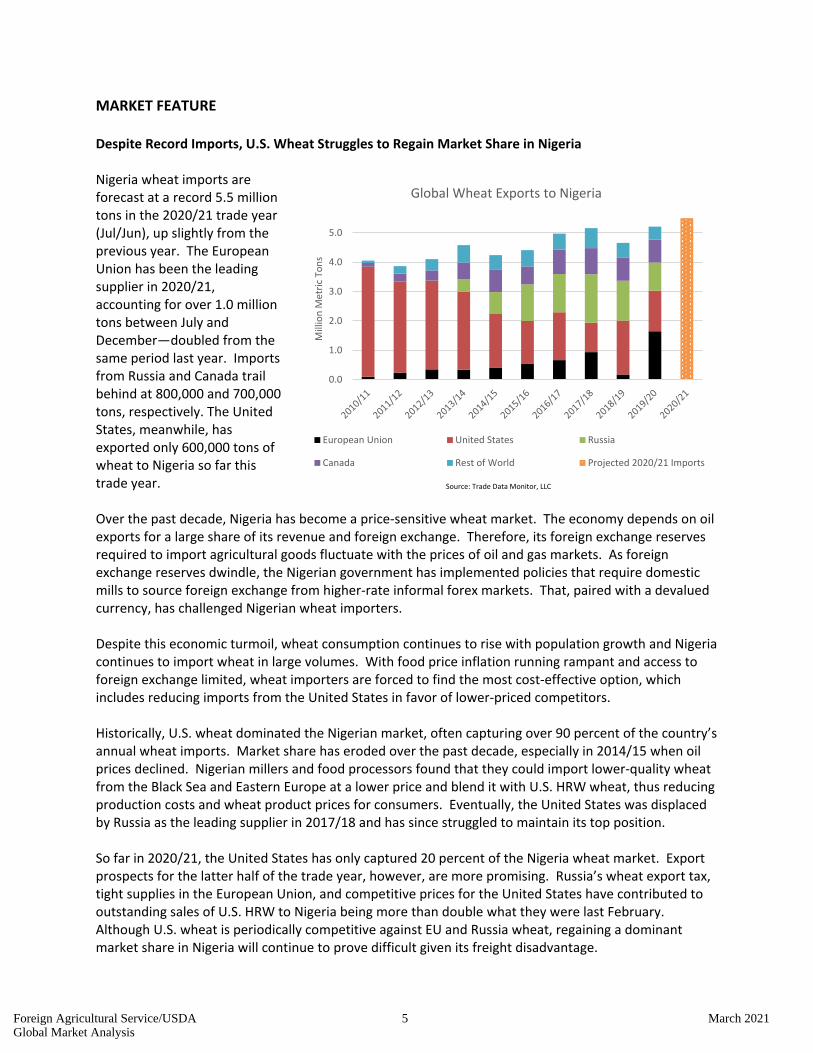
MARKET FEATURE Despite Record Imports, U.S. Wheat Struggles to Regain Market Share in Nigeria Nigeria wheat imports are forecast at a record 5.5 million tons in the 2020/21 trade year (Jul/Jun), up slightly from the previous year. The European Union has been the leading supplier in 2020/21, accounting for over 1.0 million tons between July and December—doubled from the same period last year. Imports from Russia and Canada trail behind at 800,000 and 700,000 tons, respectively. The United States, meanwhile, has exported only 600,000 tons of wheat to Nigeria so far this trade year. Over the past decade, Nigeria has become a price-sensitive wheat market. The economy depends on oil exports for a large share of its revenue and foreign exchange. Therefore, its foreign exchange reserves required to import agricultural goods fluctuate with the prices of oil and gas markets. As foreign exchange reserves dwindle, the Nigerian government has implemented policies that require domestic mills to source foreign exchange from higher-rate informal forex markets. That, paired with a devalued currency, has challenged Nigerian wheat importers. Despite this economic turmoil, wheat consumption continues to rise with population growth and Nigeria continues to import wheat in large volumes. With food price inflation running rampant and access to foreign exchange limited, wheat importers are forced to find the most cost-effective option, which includes reducing imports from the United States in favor of lower-priced competitors. Historically, U.S. wheat dominated the Nigerian market, often capturing over 90 percent of the country’s annual wheat imports. Market share has eroded over the past decade, especially in 2014/15 when oil prices declined. Nigerian millers and food processors found that they could import lower-quality wheat from the Black Sea and Eastern Europe at a lower price and blend it with U.S. HRW wheat, thus reducing production costs and wheat product prices for consumers. Eventually, the United States was displaced by Russia as the leading supplier in 2017/18 and has since struggled to maintain its top position. So far in 2020/21, the United States has only captured 20 percent of the Nigeria wheat market. Export prospects for the latter half of the trade year, however, are more promising. Russia’s wheat export tax, tight supplies in the European Union, and competitive prices for the United States have contributed to outstanding sales of U.S. HRW to Nigeria being more than double what they were last February. Although U.S. wheat is periodically competitive against EU and Russia wheat, regaining a dominant market share in Nigeria will continue to prove difficult given its freight disadvantage.
Source: Trade Data Monitor, LLC
0.0
1.0
2.0
3.0
4.0
5.0
Mill
ion
Met
ric T
ons
Global Wheat Exports to Nigeria
European Union United States Russia
Canada Rest of World Projected 2020/21 Imports
Source: Trade Data Monitor, LLC
Foreign Agricultural Service/USDA 5 March 2021Global Market Analysis
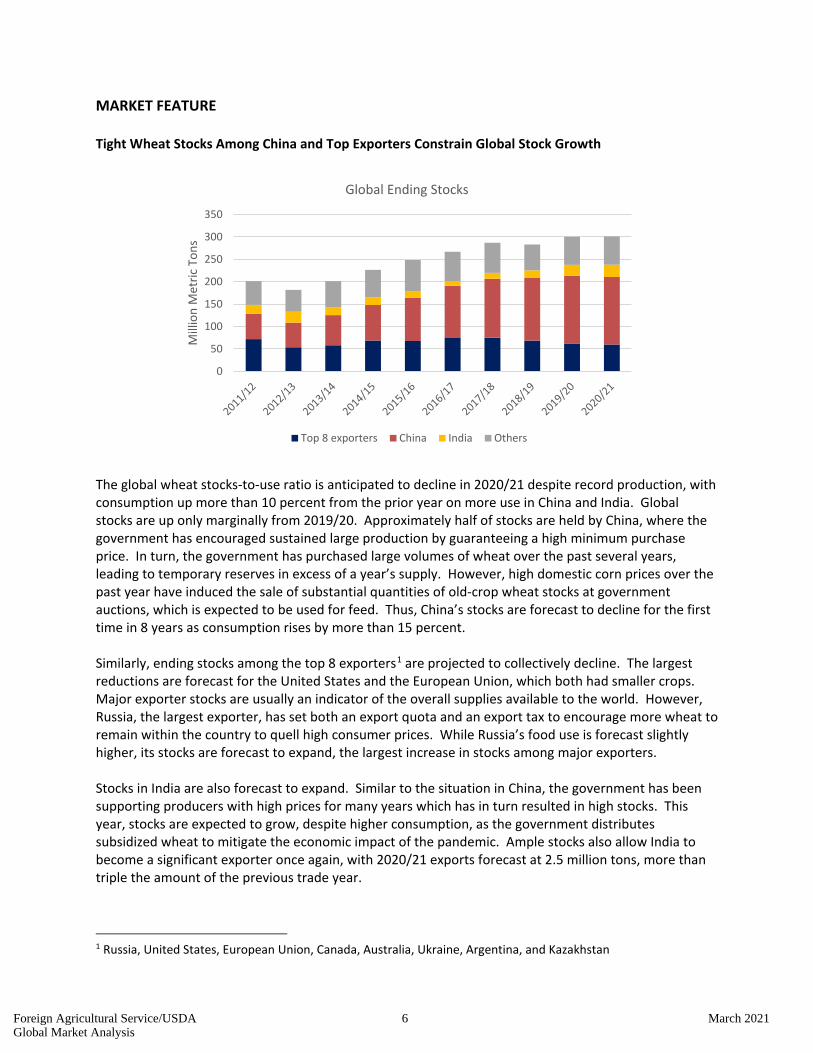
MARKET FEATURE Tight Wheat Stocks Among China and Top Exporters Constrain Global Stock Growth
The global wheat stocks-to-use ratio is anticipated to decline in 2020/21 despite record production, with consumption up more than 10 percent from the prior year on more use in China and India. Global stocks are up only marginally from 2019/20. Approximately half of stocks are held by China, where the government has encouraged sustained large production by guaranteeing a high minimum purchase price. In turn, the government has purchased large volumes of wheat over the past several years, leading to temporary reserves in excess of a year’s supply. However, high domestic corn prices over the past year have induced the sale of substantial quantities of old-crop wheat stocks at government auctions, which is expected to be used for feed. Thus, China’s stocks are forecast to decline for the first time in 8 years as consumption rises by more than 15 percent. Similarly, ending stocks among the top 8 exporters1 are projected to collectively decline. The largest reductions are forecast for the United States and the European Union, which both had smaller crops. Major exporter stocks are usually an indicator of the overall supplies available to the world. However, Russia, the largest exporter, has set both an export quota and an export tax to encourage more wheat to remain within the country to quell high consumer prices. While Russia’s food use is forecast slightly higher, its stocks are forecast to expand, the largest increase in stocks among major exporters. Stocks in India are also forecast to expand. Similar to the situation in China, the government has been supporting producers with high prices for many years which has in turn resulted in high stocks. This year, stocks are expected to grow, despite higher consumption, as the government distributes subsidized wheat to mitigate the economic impact of the pandemic. Ample stocks also allow India to become a significant exporter once again, with 2020/21 exports forecast at 2.5 million tons, more than triple the amount of the previous trade year.
1 Russia, United States, European Union, Canada, Australia, Ukraine, Argentina, and Kazakhstan
0
50
100
150
200
250
300
350
Mill
ion
Met
ric T
ons
Global Ending Stocks
Top 8 exporters China India Others
Foreign Agricultural Service/USDA 6 March 2021Global Market Analysis
TRADE CHANGES IN 2020/21 (1,000 MT)
Country Attribute Previous Current Change Reason
China Imports 10,000 10,500 500 Competitively priced imports have spurred strong volumes
Jordan Imports 1,200 1,500 300 Large shipments from Russia
Kazakhstan Imports 300 500 200 Larger imports of high-quality wheat from Russia
Mexico Imports 5,000 4,800 -200 Sluggish HRW imports from the United States
Nigeria Imports 5,100 5,500 400 Large import volumes from European Union and Russia
Pakistan Imports 3,000 3,600 600 Government continues to tender for more imports to offset low stocks
Turkey Imports 8,000 8,200 200 Strong import pace, mostly from Russia Vietnam Imports 3,600 3,400 -200 Slower pace to date
Australia Exports 18,000 19,500 1,500 Larger production and strong shipments to Asian markets
Canada Exports 26,500 27,000 500 Strong export pace driven by shipments to China
India Exports 2,200 2,500 300 Robust sales to neighboring countries at competitive prices
Kazakhstan Exports 7,500 7,700 200 Strong shipments to Central Asian markets
Foreign Agricultural Service/USDA 7 March 2021Global Market Analysis
RICE
RICE PRICES
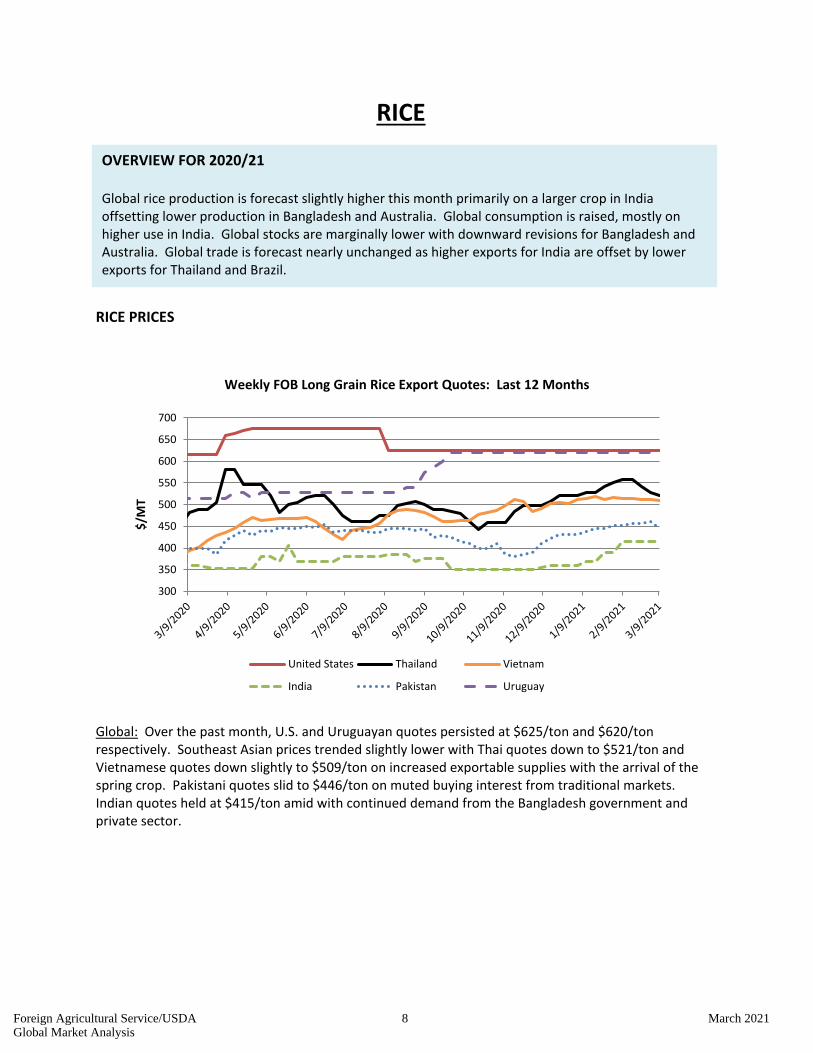
Global: Over the past month, U.S. and Uruguayan quotes persisted at $625/ton and $620/ton respectively. Southeast Asian prices trended slightly lower with Thai quotes down to $521/ton and Vietnamese quotes down slightly to $509/ton on increased exportable supplies with the arrival of the spring crop. Pakistani quotes slid to $446/ton on muted buying interest from traditional markets. Indian quotes held at $415/ton amid with continued demand from the Bangladesh government and private sector.
300
350
400
450
500
550
600
650
700
$/M
T
Weekly FOB Long Grain Rice Export Quotes: Last 12 Months
United States Thailand Vietnam
India Pakistan Uruguay
OVERVIEW FOR 2020/21 Global rice production is forecast slightly higher this month primarily on a larger crop in India offsetting lower production in Bangladesh and Australia. Global consumption is raised, mostly on higher use in India. Global stocks are marginally lower with downward revisions for Bangladesh and Australia. Global trade is forecast nearly unchanged as higher exports for India are offset by lower exports for Thailand and Brazil.
Foreign Agricultural Service/USDA 8 March 2021Global Market Analysis
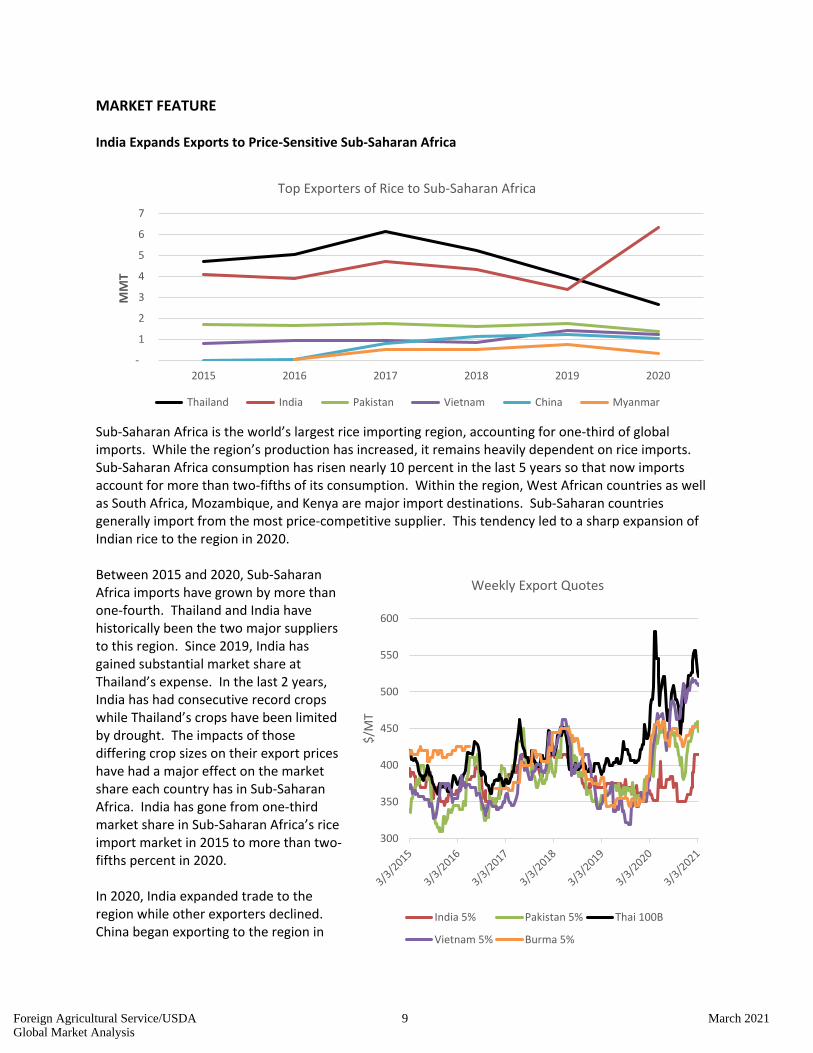
MARKET FEATURE India Expands Exports to Price-Sensitive Sub-Saharan Africa
Sub-Saharan Africa is the world’s largest rice importing region, accounting for one-third of global imports. While the region’s production has increased, it remains heavily dependent on rice imports. Sub-Saharan Africa consumption has risen nearly 10 percent in the last 5 years so that now imports account for more than two-fifths of its consumption. Within the region, West African countries as well as South Africa, Mozambique, and Kenya are major import destinations. Sub-Saharan countries generally import from the most price-competitive supplier. This tendency led to a sharp expansion of Indian rice to the region in 2020. Between 2015 and 2020, Sub-Saharan Africa imports have grown by more than one-fourth. Thailand and India have historically been the two major suppliers to this region. Since 2019, India has gained substantial market share at Thailand’s expense. In the last 2 years, India has had consecutive record crops while Thailand’s crops have been limited by drought. The impacts of those differing crop sizes on their export prices have had a major effect on the market share each country has in Sub-Saharan Africa. India has gone from one-third market share in Sub-Saharan Africa’s rice import market in 2015 to more than two-fifths percent in 2020. In 2020, India expanded trade to the region while other exporters declined. China began exporting to the region in
-
1
2
3
4
5
6
7
2015 2016 2017 2018 2019 2020
MM
T
Top Exporters of Rice to Sub-Saharan Africa
Thailand India Pakistan Vietnam China Myanmar
300
350
400
450
500
550
600
$/M
T
Weekly Export Quotes
India 5% Pakistan 5% Thai 100B
Vietnam 5% Burma 5%
Foreign Agricultural Service/USDA 9 March 2021Global Market Analysis
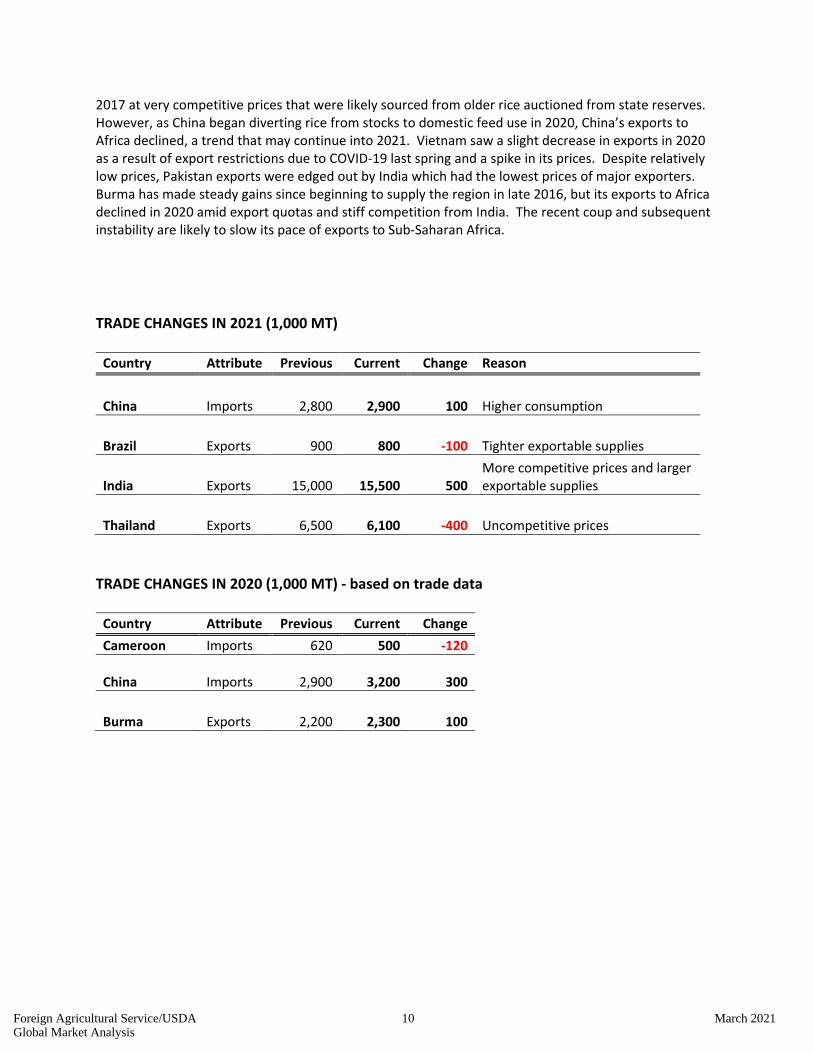
2017 at very competitive prices that were likely sourced from older rice auctioned from state reserves. However, as China began diverting rice from stocks to domestic feed use in 2020, China’s exports to Africa declined, a trend that may continue into 2021. Vietnam saw a slight decrease in exports in 2020 as a result of export restrictions due to COVID-19 last spring and a spike in its prices. Despite relatively low prices, Pakistan exports were edged out by India which had the lowest prices of major exporters. Burma has made steady gains since beginning to supply the region in late 2016, but its exports to Africa declined in 2020 amid export quotas and stiff competition from India. The recent coup and subsequent instability are likely to slow its pace of exports to Sub-Saharan Africa. TRADE CHANGES IN 2021 (1,000 MT)
Country Attribute Previous Current Change Reason
China Imports
2,800
2,900 100 Higher consumption
Brazil Exports 900 800 -100 Tighter exportable supplies
India Exports 15,000 15,500 500 More competitive prices and larger exportable supplies
Thailand Exports
6,500
6,100 -400 Uncompetitive prices TRADE CHANGES IN 2020 (1,000 MT) - based on trade data
Country Attribute Previous Current Change Cameroon Imports 620 500 -120
China Imports
2,900
3,200 300
Burma Exports
2,200
2,300 100
Foreign Agricultural Service/USDA 10 March 2021Global Market Analysis
COARSE GRAINS
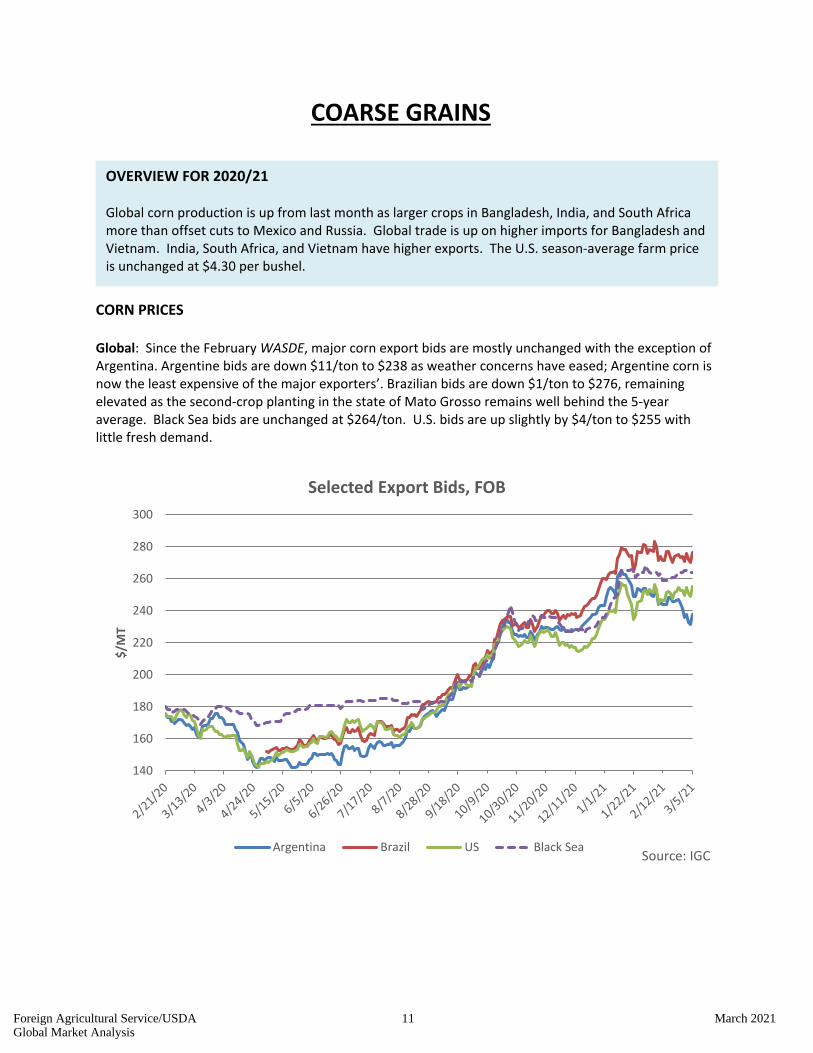
CORN PRICES Global: Since the February WASDE, major corn export bids are mostly unchanged with the exception of Argentina. Argentine bids are down $11/ton to $238 as weather concerns have eased; Argentine corn is now the least expensive of the major exporters’. Brazilian bids are down $1/ton to $276, remaining elevated as the second-crop planting in the state of Mato Grosso remains well behind the 5-year average. Black Sea bids are unchanged at $264/ton. U.S. bids are up slightly by $4/ton to $255 with little fresh demand.
140
160
180
200
220
240
260
280
300
$/M
T
Selected Export Bids, FOB
Argentina Brazil US Black SeaSource: IGC
OVERVIEW FOR 2020/21 Global corn production is up from last month as larger crops in Bangladesh, India, and South Africa more than offset cuts to Mexico and Russia. Global trade is up on higher imports for Bangladesh and Vietnam. India, South Africa, and Vietnam have higher exports. The U.S. season-average farm price is unchanged at $4.30 per bushel.
Foreign Agricultural Service/USDA 11 March 2021Global Market Analysis
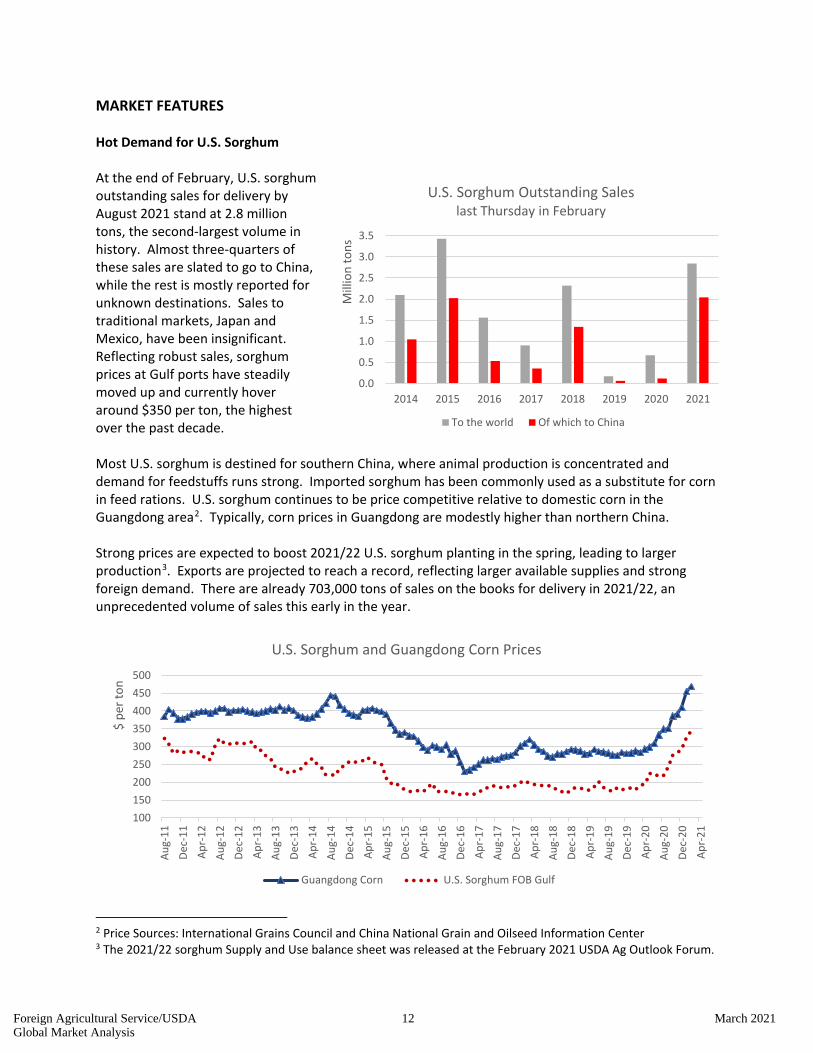
MARKET FEATURES Hot Demand for U.S. Sorghum At the end of February, U.S. sorghum outstanding sales for delivery by August 2021 stand at 2.8 million tons, the second-largest volume in history. Almost three-quarters of these sales are slated to go to China, while the rest is mostly reported for unknown destinations. Sales to traditional markets, Japan and Mexico, have been insignificant. Reflecting robust sales, sorghum prices at Gulf ports have steadily moved up and currently hover around $350 per ton, the highest over the past decade. Most U.S. sorghum is destined for southern China, where animal production is concentrated and demand for feedstuffs runs strong. Imported sorghum has been commonly used as a substitute for corn in feed rations. U.S. sorghum continues to be price competitive relative to domestic corn in the Guangdong area2. Typically, corn prices in Guangdong are modestly higher than northern China. Strong prices are expected to boost 2021/22 U.S. sorghum planting in the spring, leading to larger production3. Exports are projected to reach a record, reflecting larger available supplies and strong foreign demand. There are already 703,000 tons of sales on the books for delivery in 2021/22, an unprecedented volume of sales this early in the year.
2 Price Sources: International Grains Council and China National Grain and Oilseed Information Center 3 The 2021/22 sorghum Supply and Use balance sheet was released at the February 2021 USDA Ag Outlook Forum.
100150200250300350400450500
Aug-
11De
c-11
Apr-
12Au
g-12
Dec-
12Ap
r-13
Aug-
13De
c-13
Apr-
14Au
g-14
Dec-
14Ap
r-15
Aug-
15De
c-15
Apr-
16Au
g-16
Dec-
16Ap
r-17
Aug-
17De
c-17
Apr-
18Au
g-18
Dec-
18Ap
r-19
Aug-
19De
c-19
Apr-
20Au
g-20
Dec-
20Ap
r-21
$ pe
r ton
U.S. Sorghum and Guangdong Corn Prices
Guangdong Corn U.S. Sorghum FOB Gulf
0.0
0.5
1.0
1.5
2.0
2.5
3.0
3.5
2014 2015 2016 2017 2018 2019 2020 2021
Mill
ion
tons
U.S. Sorghum Outstanding Sales last Thursday in February
To the world Of which to China
Foreign Agricultural Service/USDA 12 March 2021Global Market Analysis
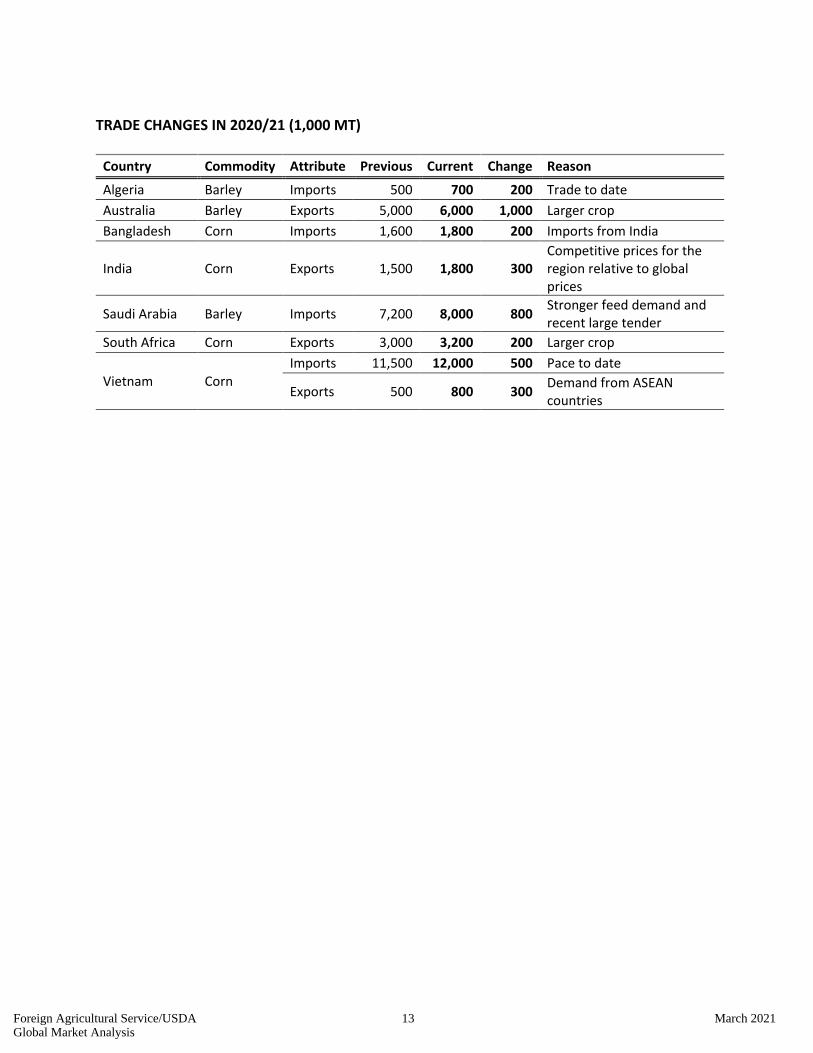
TRADE CHANGES IN 2020/21 (1,000 MT)
Country Commodity Attribute Previous Current Change Reason
Algeria Barley Imports 500 700 200 Trade to date Australia Barley Exports 5,000 6,000 1,000 Larger crop Bangladesh Corn Imports 1,600 1,800 200 Imports from India
India Corn Exports 1,500 1,800 300 Competitive prices for the region relative to global prices
Saudi Arabia Barley Imports 7,200 8,000 800 Stronger feed demand and recent large tender
South Africa Corn Exports 3,000 3,200 200 Larger crop
Vietnam Corn Imports 11,500 12,000 500 Pace to date
Exports 500 800 300 Demand from ASEAN countries
Foreign Agricultural Service/USDA 13 March 2021Global Market Analysis
ENDNOTES REGIONAL TABLES North America: Canada, Mexico, the United States Central America: Belize, Costa Rica, El Salvador, Guatemala, Honduras, Nicaragua, Panama Caribbean: Anguilla, Antigua and Barbuda, Aruba, Bahamas, Barbados, Bermuda, British Virgin Islands, Cayman Islands, Cuba, Dominica, Dominican Republic, French West Indies, Grenada, Guadeloupe, Haiti, Jamaica and Dep, Leeward-Windward Islands, Martinique, Montserrat, Netherlands Antilles, Puerto Rico, Kitts and Nevis, St. Lucia, St. Vincent and the Grenadines, Trinidad and Tobago, Turks and Caicos Islands, U.S. Virgin Islands South America: Argentina, Bolivia, Brazil, Chile, Colombia, Ecuador, Falkland Islands (Islas Malvinas), French Guiana, Guyana, Paraguay, Peru, Suriname, Uruguay, Venezuela EU: Austria, Belgium/Luxembourg, Bulgaria, Croatia, Cyprus, Czech Republic, Denmark, Estonia, Finland, France, Germany, Greece, Hungary, Ireland, Italy, Latvia, Lithuania, Malta, Netherlands, Poland, Portugal, Romania, Slovakia, Slovenia, Spain, Sweden, and the United Kingdom. Effective January 1, 2021, the separation of the United Kingdom (UK) from the European Union (EU) is complete, including trade between both entities. FAS will continue using the term “European Union” to mean the countries involved in the previous customs union, i.e., EU27+UK, from January 2021 through April 2021 for field crops PSDs (except cotton). Starting in May 2021 with the release of 2021/22 data, field crops PSDs will reflect EU27 and UK separately. Beginning with the release of 2021/22 (or calendar year 2022) data for each commodity group (except cotton), historical data for both EU27 and the UK will be provided for 5 years (2016/17 through 2020/21; or calendar years 2017 through 2021). Cotton PSDs have been and will continue to be maintained on an individual country-level basis, including the UK. See below for notes on prior years’ EU Consolidated data. Other Europe: Albania, Azores, Bosnia and Herzegovina, Former Yugoslavia, Gibraltar, Iceland, Macedonia, Montenegro, Norway, Serbia, Switzerland Former Soviet Union: Armenia, Azerbaijan, Belarus, Georgia, Kazakhstan, Kyrgyzstan, Moldova, Russia, Tajikistan, Turkmenistan, Ukraine, Uzbekistan Middle East: Bahrain, Iran, Iraq, Israel, Jordan, Kuwait, Lebanon, Oman, Qatar, Saudi Arabia, Syria, Turkey, United Arab Emirates, Yemen North Africa: Algeria, Egypt, Libya, Morocco, Tunisia Sub-Saharan Africa: all African countries except North Africa East Asia: China, Hong Kong, Japan, South Korea, North Korea, Macau, Mongolia, Taiwan South Asia: Afghanistan, Bangladesh, Bhutan, India, Nepal, Pakistan, Sri Lanka, Maldives
Foreign Agricultural Service/USDA 14 March 2021Global Market Analysis
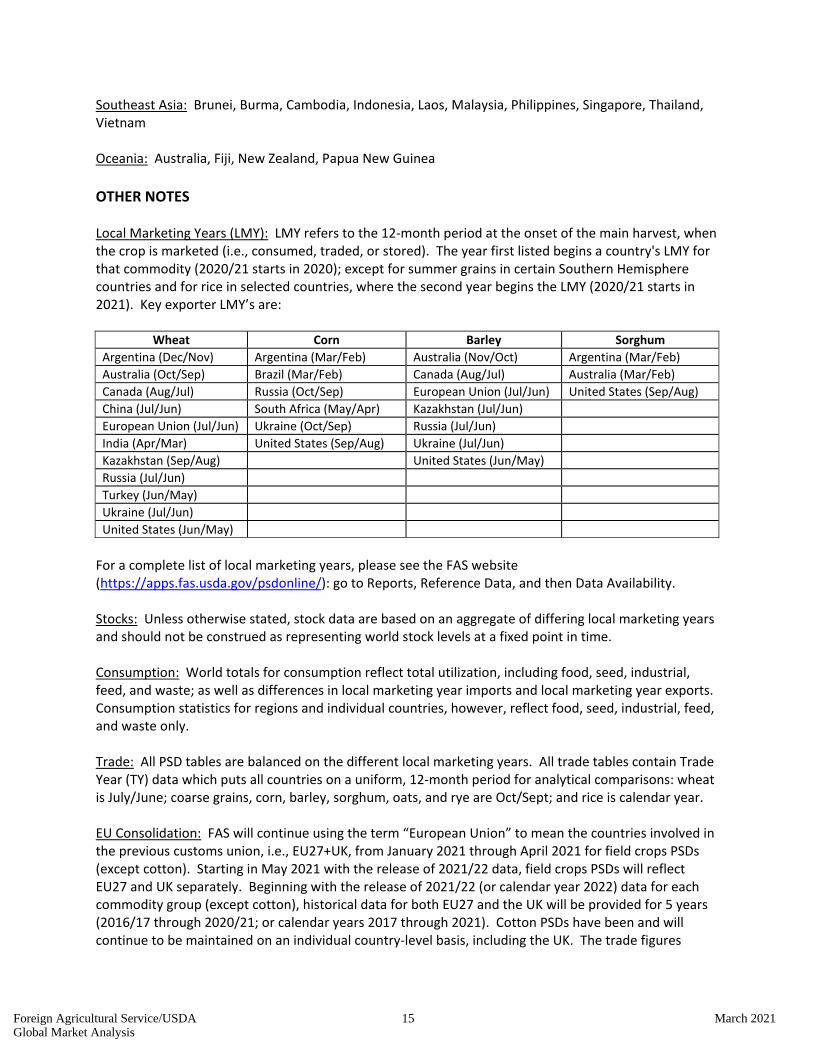
Southeast Asia: Brunei, Burma, Cambodia, Indonesia, Laos, Malaysia, Philippines, Singapore, Thailand, Vietnam Oceania: Australia, Fiji, New Zealand, Papua New Guinea OTHER NOTES Local Marketing Years (LMY): LMY refers to the 12-month period at the onset of the main harvest, when the crop is marketed (i.e., consumed, traded, or stored). The year first listed begins a country's LMY for that commodity (2020/21 starts in 2020); except for summer grains in certain Southern Hemisphere countries and for rice in selected countries, where the second year begins the LMY (2020/21 starts in 2021). Key exporter LMY’s are:
Wheat Corn Barley Sorghum Argentina (Dec/Nov) Argentina (Mar/Feb) Australia (Nov/Oct) Argentina (Mar/Feb) Australia (Oct/Sep) Brazil (Mar/Feb) Canada (Aug/Jul) Australia (Mar/Feb) Canada (Aug/Jul) Russia (Oct/Sep) European Union (Jul/Jun) United States (Sep/Aug) China (Jul/Jun) South Africa (May/Apr) Kazakhstan (Jul/Jun) European Union (Jul/Jun) Ukraine (Oct/Sep) Russia (Jul/Jun) India (Apr/Mar) United States (Sep/Aug) Ukraine (Jul/Jun) Kazakhstan (Sep/Aug) United States (Jun/May) Russia (Jul/Jun) Turkey (Jun/May) Ukraine (Jul/Jun) United States (Jun/May)
For a complete list of local marketing years, please see the FAS website (https://apps.fas.usda.gov/psdonline/): go to Reports, Reference Data, and then Data Availability. Stocks: Unless otherwise stated, stock data are based on an aggregate of differing local marketing years and should not be construed as representing world stock levels at a fixed point in time. Consumption: World totals for consumption reflect total utilization, including food, seed, industrial, feed, and waste; as well as differences in local marketing year imports and local marketing year exports. Consumption statistics for regions and individual countries, however, reflect food, seed, industrial, feed, and waste only. Trade: All PSD tables are balanced on the different local marketing years. All trade tables contain Trade Year (TY) data which puts all countries on a uniform, 12-month period for analytical comparisons: wheat is July/June; coarse grains, corn, barley, sorghum, oats, and rye are Oct/Sept; and rice is calendar year. EU Consolidation: FAS will continue using the term “European Union” to mean the countries involved in the previous customs union, i.e., EU27+UK, from January 2021 through April 2021 for field crops PSDs (except cotton). Starting in May 2021 with the release of 2021/22 data, field crops PSDs will reflect EU27 and UK separately. Beginning with the release of 2021/22 (or calendar year 2022) data for each commodity group (except cotton), historical data for both EU27 and the UK will be provided for 5 years (2016/17 through 2020/21; or calendar years 2017 through 2021). Cotton PSDs have been and will continue to be maintained on an individual country-level basis, including the UK. The trade figures
Foreign Agricultural Service/USDA 15 March 2021Global Market Analysis
starting from 1999/00 represent the European Union (EU27 plus UK) and exclude all intra-trade. For the years 1960/61 through 1998/99, figures are the EU-15 and also exclude all intra-trade. EU-15 member states' data for grains are no longer maintained in the official USDA database. Data for the individual NMS-10, plus Bulgaria, Romania, and Croatia, exists only prior to 1999/00. Statistics: (1) Wheat trade statistics include wheat, flour, and selected pasta products on a grain equivalent basis. (2) Rice trade statistics include rough, brown, milled, and broken on a milled equivalent basis. (3) Coarse grains statistics include corn, barley, sorghum, oats, rye, millet, and mixed grains but exclude trade in barley malt, millet, and mixed grains. Unaccounted: This term includes grain in transit, reporting discrepancies in some countries, and trade to countries outside the USDA database. The Global Commodity Analysis Division, Global Market Analysis, Foreign Agricultural Service, USDA, Washington, DC 20250, prepared this publication. Information is gathered from official statistics of foreign governments and other foreign source materials, reports of U.S. agricultural attachés and Foreign Service officers, office research, and related information. Further information may be obtained by writing the Division or telephoning (202) 720-3448. Note: For further details on world grain production, please see World Agricultural Production March 2021. This publication is available in its entirety on the Internet via the Foreign Agricultural Service Home Page. The address is: http://www.fas.usda.gov
Graham Soley (202) 772-4235 [email protected] Wheat Amy Gaito (202) 772-4890 [email protected] Wheat Rachel Trego (202) 720-1073 [email protected] Wheat/Rice Adolfo Escoto [email protected] Rice Jadon Marianetti (202) 720-5237 [email protected] Rice Yoonhee Macke (202) 690-4199 [email protected] Coarse Grains Kevin Min (202) 720-0626 [email protected] Coarse Grains
Foreign Agricultural Service/USDA 16 March 2021Global Market Analysis
DATA TABLES
Page Intentionally Left Blank
Foreign Agricultural Service/USDA 17 March 2021Global Market Analysis
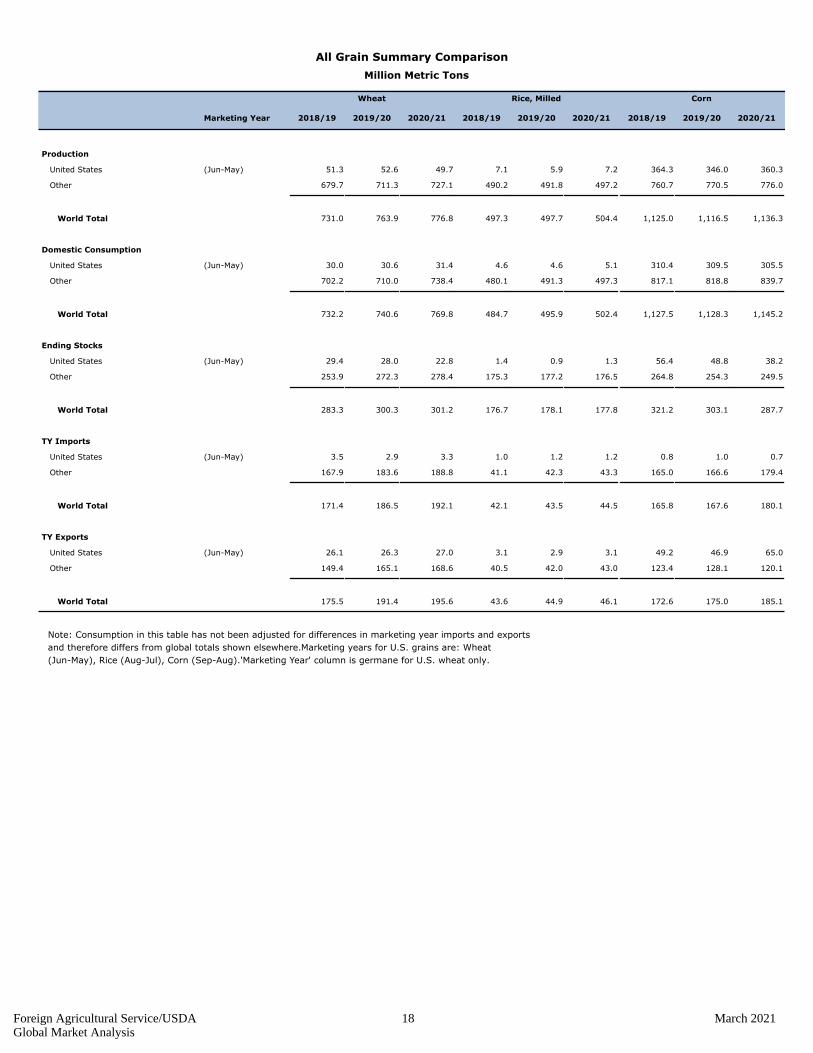
All Grain Summary Comparison
Million Metric Tons
Marketing Year
Wheat Rice, Milled Corn
2020/212019/202018/192020/212019/202018/192020/212019/202018/19
Production
United States (Jun-May) 51.3 52.6 49.7 7.1 5.9 7.2 364.3 346.0 360.3
Other 679.7 711.3 727.1 490.2 491.8 497.2 760.7 770.5 776.0
World Total 731.0 763.9 776.8 497.3 497.7 504.4 1,125.0 1,116.5 1,136.3
Domestic Consumption
United States (Jun-May) 30.0 30.6 31.4 4.6 4.6 5.1 310.4 309.5 305.5
Other 702.2 710.0 738.4 480.1 491.3 497.3 817.1 818.8 839.7
World Total 732.2 740.6 769.8 484.7 495.9 502.4 1,127.5 1,128.3 1,145.2
Ending Stocks
United States (Jun-May) 29.4 28.0 22.8 1.4 0.9 1.3 56.4 48.8 38.2
Other 253.9 272.3 278.4 175.3 177.2 176.5 264.8 254.3 249.5
World Total 283.3 300.3 301.2 176.7 178.1 177.8 321.2 303.1 287.7
TY Imports
United States (Jun-May) 3.5 2.9 3.3 1.0 1.2 1.2 0.8 1.0 0.7
Other 167.9 183.6 188.8 41.1 42.3 43.3 165.0 166.6 179.4
World Total 171.4 186.5 192.1 42.1 43.5 44.5 165.8 167.6 180.1
TY Exports
United States (Jun-May) 26.1 26.3 27.0 3.1 2.9 3.1 49.2 46.9 65.0
Other 149.4 165.1 168.6 40.5 42.0 43.0 123.4 128.1 120.1
World Total 175.5 191.4 195.6 43.6 44.9 46.1 172.6 175.0 185.1
Note: Consumption in this table has not been adjusted for differences in marketing year imports and exports
and therefore differs from global totals shown elsewhere.Marketing years for U.S. grains are: Wheat
(Jun-May), Rice (Aug-Jul), Corn (Sep-Aug).'Marketing Year' column is germane for U.S. wheat only.
Foreign Agricultural Service/USDA 18 March 2021Global Market Analysis
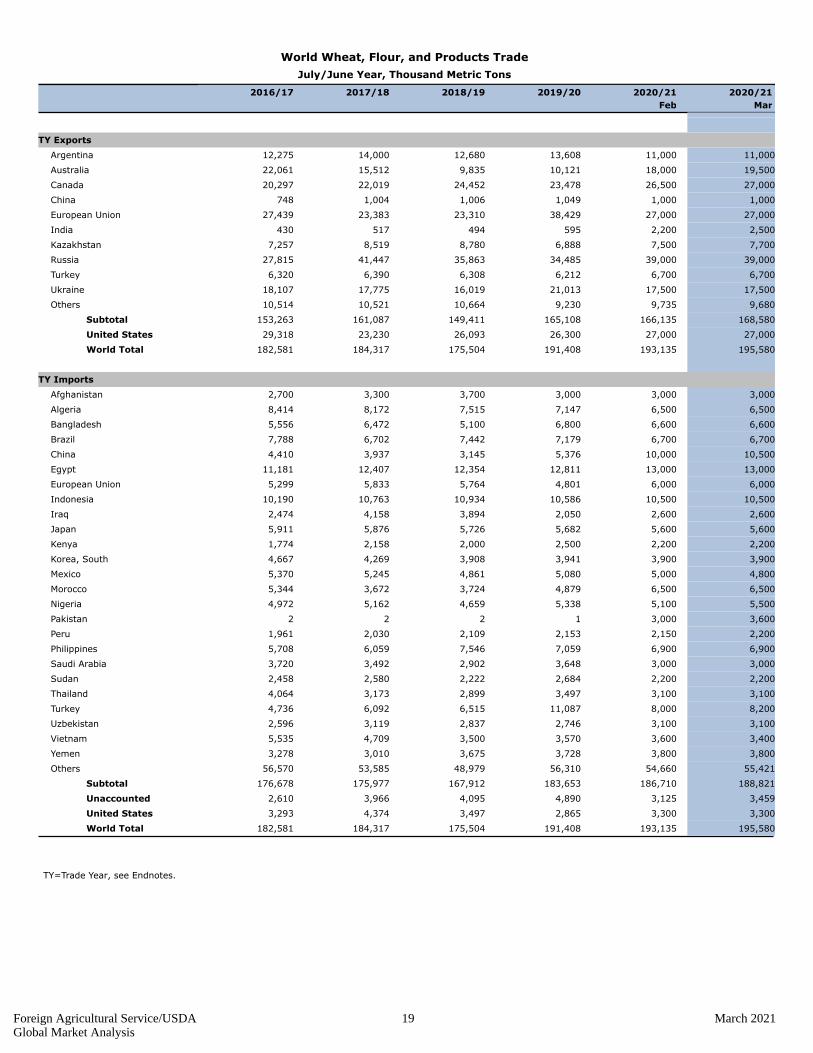
World Wheat, Flour, and Products Trade
July/June Year, Thousand Metric Tons
2016/17 2017/18 2018/19 2019/20 2020/21
Feb
2020/21
Mar
none
TY Exports
11,00011,00013,60812,68014,00012,275 Argentina
19,50018,00010,1219,83515,51222,061 Australia
27,00026,50023,47824,45222,01920,297 Canada
1,0001,0001,0491,0061,004748 China
27,00027,00038,42923,31023,38327,439 European Union
2,5002,200595494517430 India
7,7007,5006,8888,7808,5197,257 Kazakhstan
39,00039,00034,48535,86341,44727,815 Russia
6,7006,7006,2126,3086,3906,320 Turkey
17,50017,50021,01316,01917,77518,107 Ukraine
9,6809,7359,23010,66410,52110,514 Others
168,580166,135165,108149,411161,087153,263 Subtotal
27,00027,00026,30026,09323,23029,318 United States
195,580193,135191,408175,504184,317182,581 World Total
none
TY Imports
3,0003,0003,0003,7003,3002,700 Afghanistan
6,5006,5007,1477,5158,1728,414 Algeria
6,6006,6006,8005,1006,4725,556 Bangladesh
6,7006,7007,1797,4426,7027,788 Brazil
10,50010,0005,3763,1453,9374,410 China
13,00013,00012,81112,35412,40711,181 Egypt
6,0006,0004,8015,7645,8335,299 European Union
10,50010,50010,58610,93410,76310,190 Indonesia
2,6002,6002,0503,8944,1582,474 Iraq
5,6005,6005,6825,7265,8765,911 Japan
2,2002,2002,5002,0002,1581,774 Kenya
3,9003,9003,9413,9084,2694,667 Korea, South
4,8005,0005,0804,8615,2455,370 Mexico
6,5006,5004,8793,7243,6725,344 Morocco
5,5005,1005,3384,6595,1624,972 Nigeria
3,6003,0001222 Pakistan
2,2002,1502,1532,1092,0301,961 Peru
6,9006,9007,0597,5466,0595,708 Philippines
3,0003,0003,6482,9023,4923,720 Saudi Arabia
2,2002,2002,6842,2222,5802,458 Sudan
3,1003,1003,4972,8993,1734,064 Thailand
8,2008,00011,0876,5156,0924,736 Turkey
3,1003,1002,7462,8373,1192,596 Uzbekistan
3,4003,6003,5703,5004,7095,535 Vietnam
3,8003,8003,7283,6753,0103,278 Yemen
55,42154,66056,31048,97953,58556,570 Others
188,821186,710183,653167,912175,977176,678 Subtotal
3,4593,1254,8904,0953,9662,610 Unaccounted
3,3003,3002,8653,4974,3743,293 United States
195,580193,135191,408175,504184,317182,581 World Total
TY=Trade Year, see Endnotes.
Foreign Agricultural Service/USDA 19 March 2021Global Market Analysis

World Wheat Production, Consumption, and Stocks
Local Marketing Years, Thousand Metric Tons
2016/17 2017/18 2018/19 2019/20 2020/21
Feb
2020/21
Mar
none
Production
17,20017,20019,78019,50018,50018,400 Argentina
33,00030,00015,20017,59820,94131,819 Australia
6,2506,2505,2005,4284,2646,730 Brazil
35,18335,18332,67032,35230,37732,140 Canada
134,250134,250133,590131,430134,334133,271 China
8,9008,9008,7708,4508,4508,100 Egypt
135,800135,800154,510136,579151,125145,369 European Union
107,860107,592103,60099,87098,51087,000 India
16,75016,75016,80014,50014,00014,500 Iran
14,25614,25611,45213,94714,80214,985 Kazakhstan
25,20025,20024,30025,10026,60025,633 Pakistan
85,35485,30073,61071,68585,16772,529 Russia
18,25018,25017,50019,00021,00017,250 Turkey
25,50025,50029,17125,05726,98126,791 Ukraine
6,5106,5106,8006,0006,9416,940 Uzbekistan
56,82456,80358,38553,19853,40951,931 Others
727,087723,744711,338679,694715,401693,388 Subtotal
49,69149,69152,58151,30647,38062,832 United States
776,778773,435763,919731,000762,781756,220 World Total
none
Total Consumption
11,05011,05010,95010,75010,45010,350 Algeria
8,5008,0008,5009,2008,4757,450 Australia
12,20012,20012,10012,10012,00012,200 Brazil
9,90010,0009,2639,1459,02910,671 Canada
145,000140,000126,000125,000121,000119,000 China
20,80020,80020,30020,10019,80019,400 Egypt
118,500118,500122,500121,050130,400128,000 European Union
103,085103,01795,40395,62995,67797,234 India
10,50010,50010,30010,60010,60010,000 Indonesia
17,70017,70017,20016,10015,90016,250 Iran
10,40010,40010,40010,70010,50010,200 Morocco
25,80025,70025,20025,30025,00024,500 Pakistan
41,50041,50040,00040,50043,00040,000 Russia
20,20020,10019,90018,80018,50017,100 Turkey
9,5009,5009,5009,5009,7009,300 Uzbekistan
173,770173,607172,559167,734171,977170,530 Others
744,505737,940716,337704,714713,477705,921 Subtotal
31,38031,38030,56429,98929,24631,865 United States
775,885769,320746,901734,703742,723737,786 World Total
none
Ending Stocks
5,5985,0982,8984,4404,5495,750 Australia
150,432154,932151,682139,765131,196114,929 China
10,60010,60014,30015,91817,93514,760 European Union
27,50027,50024,70016,99213,2309,800 India
6,6066,6066,5566,2368,06610,416 Iran
12,58212,5287,2287,77812,01010,823 Russia
5,3215,2215,7713,4453,290927 Turkey
59,79358,97759,17459,31666,79667,385 Others
278,432281,462272,309253,890257,072234,790 Subtotal
22,75522,75527,98529,38629,90732,131 United States
301,187304,217300,294283,276286,979266,921 World Total
Foreign Agricultural Service/USDA 20 March 2021Global Market Analysis
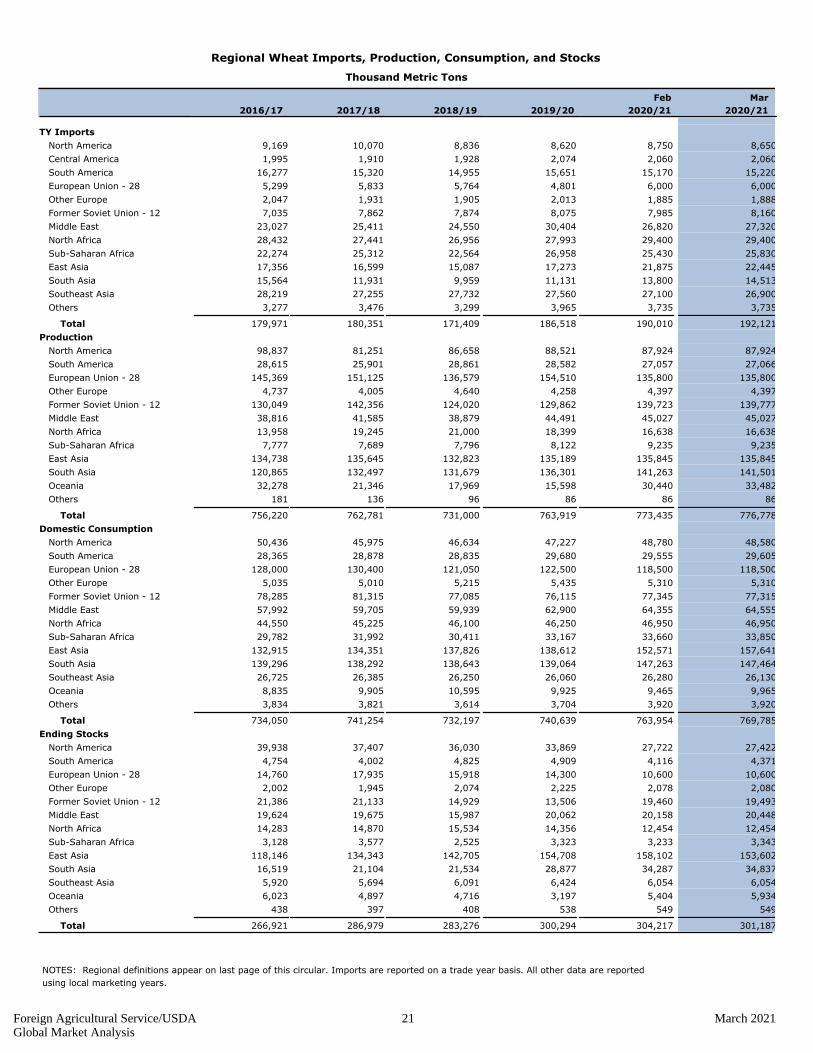
Regional Wheat Imports, Production, Consumption, and Stocks
Thousand Metric Tons
2016/17 2017/18 2018/19 2019/20
Feb
2020/21
Mar
2020/21
TY Imports none
9,169 North America 10,070 8,836 8,620 8,750 8,650
1,995 Central America 1,910 1,928 2,074 2,060 2,060
16,277 South America 15,320 14,955 15,651 15,170 15,220
5,299 European Union - 28 5,833 5,764 4,801 6,000 6,000
2,047 Other Europe 1,931 1,905 2,013 1,885 1,888
7,035 Former Soviet Union - 12 7,862 7,874 8,075 7,985 8,160
23,027 Middle East 25,411 24,550 30,404 26,820 27,320
28,432 North Africa 27,441 26,956 27,993 29,400 29,400
22,274 Sub-Saharan Africa 25,312 22,564 26,958 25,430 25,830
17,356 East Asia 16,599 15,087 17,273 21,875 22,445
15,564 South Asia 11,931 9,959 11,131 13,800 14,513
28,219 Southeast Asia 27,255 27,732 27,560 27,100 26,900
3,277 Others 3,476 3,299 3,965 3,735 3,735
179,971 Total 180,351 171,409 186,518 190,010 192,121
Production none
98,837 North America 81,251 86,658 88,521 87,924 87,924
28,615 South America 25,901 28,861 28,582 27,057 27,066
145,369 European Union - 28 151,125 136,579 154,510 135,800 135,800
4,737 Other Europe 4,005 4,640 4,258 4,397 4,397
130,049 Former Soviet Union - 12 142,356 124,020 129,862 139,723 139,777
38,816 Middle East 41,585 38,879 44,491 45,027 45,027
13,958 North Africa 19,245 21,000 18,399 16,638 16,638
7,777 Sub-Saharan Africa 7,689 7,796 8,122 9,235 9,235
134,738 East Asia 135,645 132,823 135,189 135,845 135,845
120,865 South Asia 132,497 131,679 136,301 141,263 141,501
32,278 Oceania 21,346 17,969 15,598 30,440 33,482
181 Others 136 96 86 86 86
756,220 Total 762,781 731,000 763,919 773,435 776,778
Domestic Consumption none
50,436 North America 45,975 46,634 47,227 48,780 48,580
28,365 South America 28,878 28,835 29,680 29,555 29,605
128,000 European Union - 28 130,400 121,050 122,500 118,500 118,500
5,035 Other Europe 5,010 5,215 5,435 5,310 5,310
78,285 Former Soviet Union - 12 81,315 77,085 76,115 77,345 77,315
57,992 Middle East 59,705 59,939 62,900 64,355 64,555
44,550 North Africa 45,225 46,100 46,250 46,950 46,950
29,782 Sub-Saharan Africa 31,992 30,411 33,167 33,660 33,850
132,915 East Asia 134,351 137,826 138,612 152,571 157,641
139,296 South Asia 138,292 138,643 139,064 147,263 147,464
26,725 Southeast Asia 26,385 26,250 26,060 26,280 26,130
8,835 Oceania 9,905 10,595 9,925 9,465 9,965
3,834 Others 3,821 3,614 3,704 3,920 3,920
734,050 Total 741,254 732,197 740,639 763,954 769,785
Ending Stocks none
39,938 North America 37,407 36,030 33,869 27,722 27,422
4,754 South America 4,002 4,825 4,909 4,116 4,371
14,760 European Union - 28 17,935 15,918 14,300 10,600 10,600
2,002 Other Europe 1,945 2,074 2,225 2,078 2,080
21,386 Former Soviet Union - 12 21,133 14,929 13,506 19,460 19,493
19,624 Middle East 19,675 15,987 20,062 20,158 20,448
14,283 North Africa 14,870 15,534 14,356 12,454 12,454
3,128 Sub-Saharan Africa 3,577 2,525 3,323 3,233 3,343
118,146 East Asia 134,343 142,705 154,708 158,102 153,602
16,519 South Asia 21,104 21,534 28,877 34,287 34,837
5,920 Southeast Asia 5,694 6,091 6,424 6,054 6,054
6,023 Oceania 4,897 4,716 3,197 5,404 5,934
438 Others 397 408 538 549 549
266,921 Total 286,979 283,276 300,294 304,217 301,187
NOTES: Regional definitions appear on last page of this circular. Imports are reported on a trade year basis. All other data are reported
using local marketing years.
Foreign Agricultural Service/USDA 21 March 2021Global Market Analysis
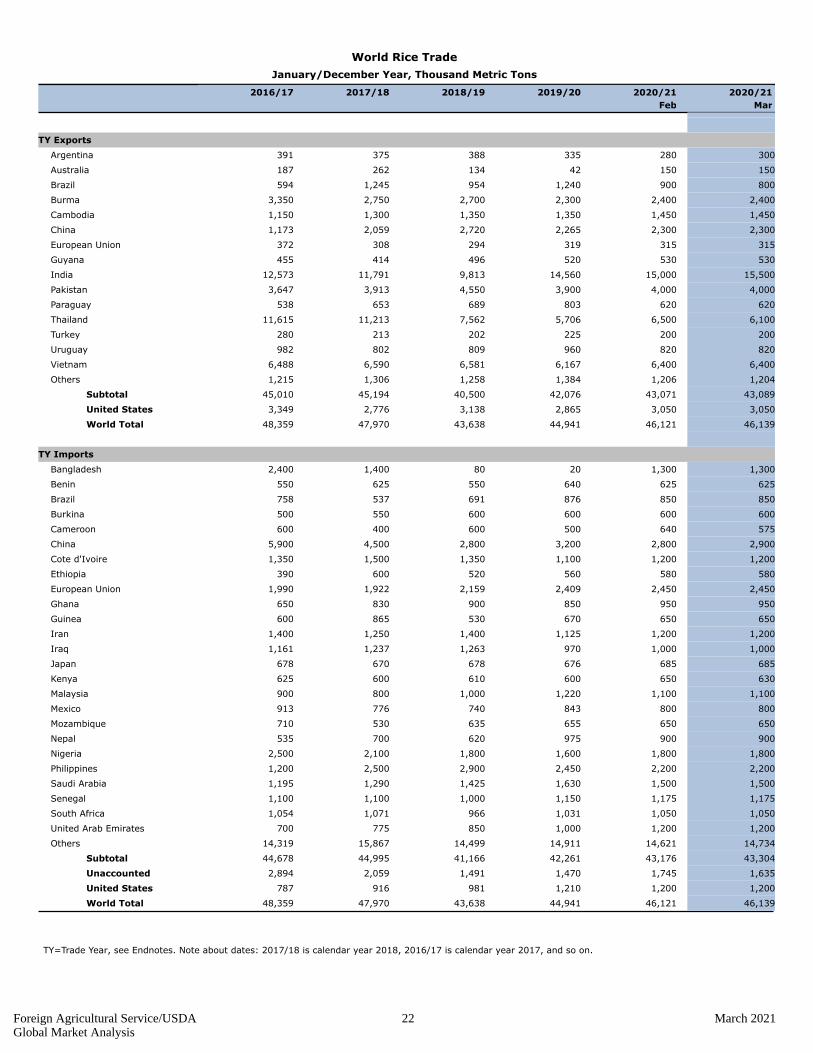
World Rice Trade
January/December Year, Thousand Metric Tons
2016/17 2017/18 2018/19 2019/20 2020/21
Feb
2020/21
Mar
none
TY Exports
300280335388375391 Argentina
15015042134262187 Australia
8009001,2409541,245594 Brazil
2,4002,4002,3002,7002,7503,350 Burma
1,4501,4501,3501,3501,3001,150 Cambodia
2,3002,3002,2652,7202,0591,173 China
315315319294308372 European Union
530530520496414455 Guyana
15,50015,00014,5609,81311,79112,573 India
4,0004,0003,9004,5503,9133,647 Pakistan
620620803689653538 Paraguay
6,1006,5005,7067,56211,21311,615 Thailand
200200225202213280 Turkey
820820960809802982 Uruguay
6,4006,4006,1676,5816,5906,488 Vietnam
1,2041,2061,3841,2581,3061,215 Others
43,08943,07142,07640,50045,19445,010 Subtotal
3,0503,0502,8653,1382,7763,349 United States
46,13946,12144,94143,63847,97048,359 World Total
none
TY Imports
1,3001,30020801,4002,400 Bangladesh
625625640550625550 Benin
850850876691537758 Brazil
600600600600550500 Burkina
575640500600400600 Cameroon
2,9002,8003,2002,8004,5005,900 China
1,2001,2001,1001,3501,5001,350 Cote d'Ivoire
580580560520600390 Ethiopia
2,4502,4502,4092,1591,9221,990 European Union
950950850900830650 Ghana
650650670530865600 Guinea
1,2001,2001,1251,4001,2501,400 Iran
1,0001,0009701,2631,2371,161 Iraq
685685676678670678 Japan
630650600610600625 Kenya
1,1001,1001,2201,000800900 Malaysia
800800843740776913 Mexico
650650655635530710 Mozambique
900900975620700535 Nepal
1,8001,8001,6001,8002,1002,500 Nigeria
2,2002,2002,4502,9002,5001,200 Philippines
1,5001,5001,6301,4251,2901,195 Saudi Arabia
1,1751,1751,1501,0001,1001,100 Senegal
1,0501,0501,0319661,0711,054 South Africa
1,2001,2001,000850775700 United Arab Emirates
14,73414,62114,91114,49915,86714,319 Others
43,30443,17642,26141,16644,99544,678 Subtotal
1,6351,7451,4701,4912,0592,894 Unaccounted
1,2001,2001,210981916787 United States
46,13946,12144,94143,63847,97048,359 World Total
TY=Trade Year, see Endnotes. Note about dates: 2017/18 is calendar year 2018, 2016/17 is calendar year 2017, and so on.
Foreign Agricultural Service/USDA 22 March 2021Global Market Analysis
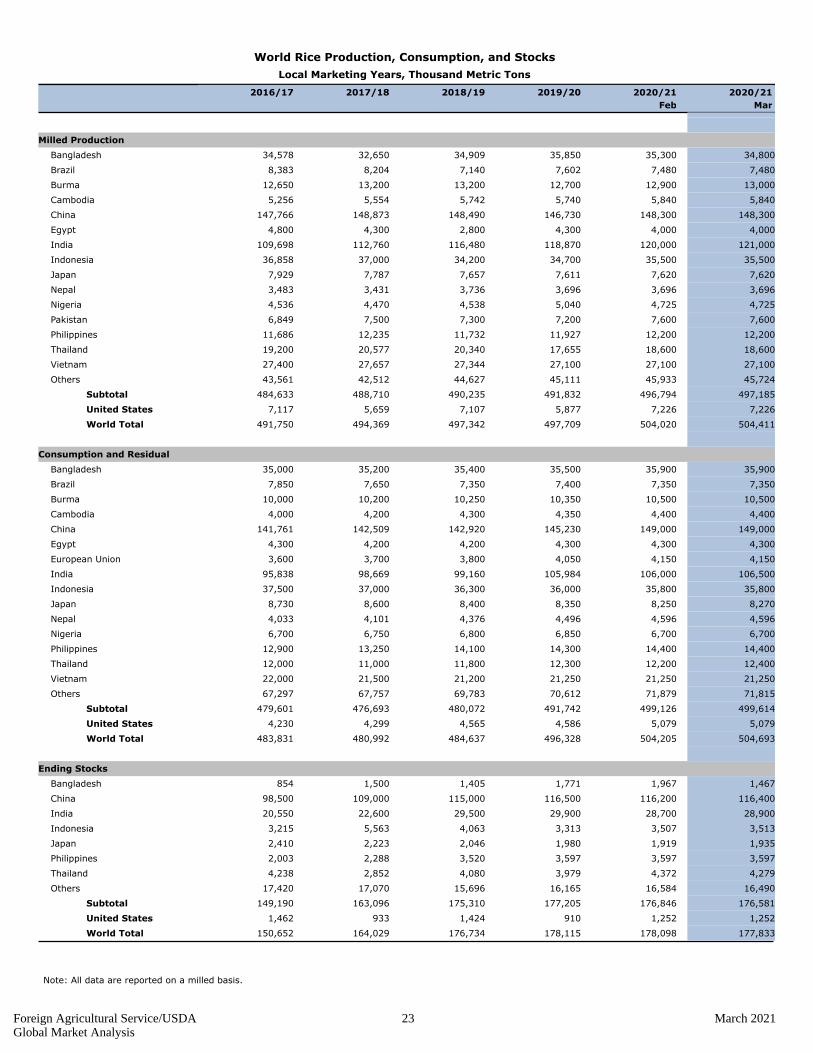
World Rice Production, Consumption, and Stocks
Local Marketing Years, Thousand Metric Tons
2016/17 2017/18 2018/19 2019/20 2020/21
Feb
2020/21
Mar
none
Milled Production
34,80035,30035,85034,90932,65034,578 Bangladesh
7,4807,4807,6027,1408,2048,383 Brazil
13,00012,90012,70013,20013,20012,650 Burma
5,8405,8405,7405,7425,5545,256 Cambodia
148,300148,300146,730148,490148,873147,766 China
4,0004,0004,3002,8004,3004,800 Egypt
121,000120,000118,870116,480112,760109,698 India
35,50035,50034,70034,20037,00036,858 Indonesia
7,6207,6207,6117,6577,7877,929 Japan
3,6963,6963,6963,7363,4313,483 Nepal
4,7254,7255,0404,5384,4704,536 Nigeria
7,6007,6007,2007,3007,5006,849 Pakistan
12,20012,20011,92711,73212,23511,686 Philippines
18,60018,60017,65520,34020,57719,200 Thailand
27,10027,10027,10027,34427,65727,400 Vietnam
45,72445,93345,11144,62742,51243,561 Others
497,185496,794491,832490,235488,710484,633 Subtotal
7,2267,2265,8777,1075,6597,117 United States
504,411504,020497,709497,342494,369491,750 World Total
none
Consumption and Residual
35,90035,90035,50035,40035,20035,000 Bangladesh
7,3507,3507,4007,3507,6507,850 Brazil
10,50010,50010,35010,25010,20010,000 Burma
4,4004,4004,3504,3004,2004,000 Cambodia
149,000149,000145,230142,920142,509141,761 China
4,3004,3004,3004,2004,2004,300 Egypt
4,1504,1504,0503,8003,7003,600 European Union
106,500106,000105,98499,16098,66995,838 India
35,80035,80036,00036,30037,00037,500 Indonesia
8,2708,2508,3508,4008,6008,730 Japan
4,5964,5964,4964,3764,1014,033 Nepal
6,7006,7006,8506,8006,7506,700 Nigeria
14,40014,40014,30014,10013,25012,900 Philippines
12,40012,20012,30011,80011,00012,000 Thailand
21,25021,25021,25021,20021,50022,000 Vietnam
71,81571,87970,61269,78367,75767,297 Others
499,614499,126491,742480,072476,693479,601 Subtotal
5,0795,0794,5864,5654,2994,230 United States
504,693504,205496,328484,637480,992483,831 World Total
none
Ending Stocks
1,4671,9671,7711,4051,500854 Bangladesh
116,400116,200116,500115,000109,00098,500 China
28,90028,70029,90029,50022,60020,550 India
3,5133,5073,3134,0635,5633,215 Indonesia
1,9351,9191,9802,0462,2232,410 Japan
3,5973,5973,5973,5202,2882,003 Philippines
4,2794,3723,9794,0802,8524,238 Thailand
16,49016,58416,16515,69617,07017,420 Others
176,581176,846177,205175,310163,096149,190 Subtotal
1,2521,2529101,4249331,462 United States
177,833178,098178,115176,734164,029150,652 World Total
Note: All data are reported on a milled basis.
Foreign Agricultural Service/USDA 23 March 2021Global Market Analysis
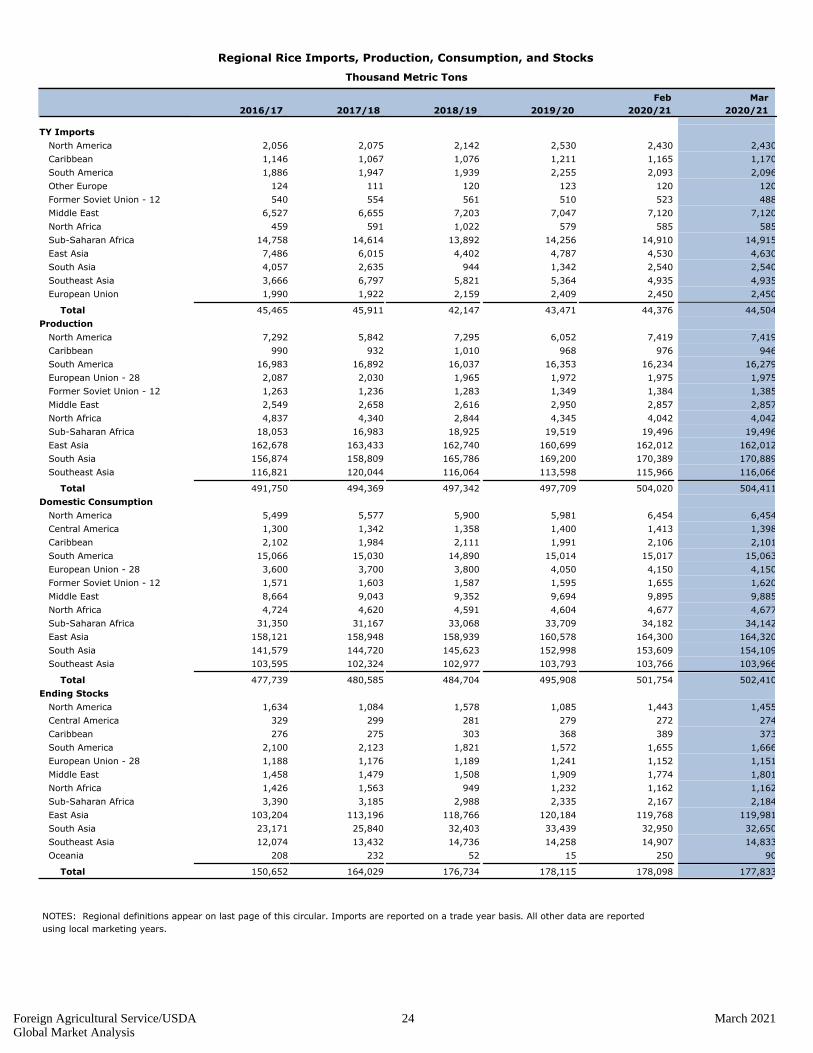
Regional Rice Imports, Production, Consumption, and Stocks
Thousand Metric Tons
2016/17 2017/18 2018/19 2019/20
Feb
2020/21
Mar
2020/21
TY Imports none
2,056 North America 2,075 2,142 2,530 2,430 2,430
1,146 Caribbean 1,067 1,076 1,211 1,165 1,170
1,886 South America 1,947 1,939 2,255 2,093 2,096
124 Other Europe 111 120 123 120 120
540 Former Soviet Union - 12 554 561 510 523 488
6,527 Middle East 6,655 7,203 7,047 7,120 7,120
459 North Africa 591 1,022 579 585 585
14,758 Sub-Saharan Africa 14,614 13,892 14,256 14,910 14,915
7,486 East Asia 6,015 4,402 4,787 4,530 4,630
4,057 South Asia 2,635 944 1,342 2,540 2,540
3,666 Southeast Asia 6,797 5,821 5,364 4,935 4,935
1,990 European Union 1,922 2,159 2,409 2,450 2,450
45,465 Total 45,911 42,147 43,471 44,376 44,504
Production none
7,292 North America 5,842 7,295 6,052 7,419 7,419
990 Caribbean 932 1,010 968 976 946
16,983 South America 16,892 16,037 16,353 16,234 16,279
2,087 European Union - 28 2,030 1,965 1,972 1,975 1,975
1,263 Former Soviet Union - 12 1,236 1,283 1,349 1,384 1,385
2,549 Middle East 2,658 2,616 2,950 2,857 2,857
4,837 North Africa 4,340 2,844 4,345 4,042 4,042
18,053 Sub-Saharan Africa 16,983 18,925 19,519 19,496 19,496
162,678 East Asia 163,433 162,740 160,699 162,012 162,012
156,874 South Asia 158,809 165,786 169,200 170,389 170,889
116,821 Southeast Asia 120,044 116,064 113,598 115,966 116,066
491,750 Total 494,369 497,342 497,709 504,020 504,411
Domestic Consumption none
5,499 North America 5,577 5,900 5,981 6,454 6,454
1,300 Central America 1,342 1,358 1,400 1,413 1,398
2,102 Caribbean 1,984 2,111 1,991 2,106 2,101
15,066 South America 15,030 14,890 15,014 15,017 15,063
3,600 European Union - 28 3,700 3,800 4,050 4,150 4,150
1,571 Former Soviet Union - 12 1,603 1,587 1,595 1,655 1,620
8,664 Middle East 9,043 9,352 9,694 9,895 9,885
4,724 North Africa 4,620 4,591 4,604 4,677 4,677
31,350 Sub-Saharan Africa 31,167 33,068 33,709 34,182 34,142
158,121 East Asia 158,948 158,939 160,578 164,300 164,320
141,579 South Asia 144,720 145,623 152,998 153,609 154,109
103,595 Southeast Asia 102,324 102,977 103,793 103,766 103,966
477,739 Total 480,585 484,704 495,908 501,754 502,410
Ending Stocks none
1,634 North America 1,084 1,578 1,085 1,443 1,455
329 Central America 299 281 279 272 274
276 Caribbean 275 303 368 389 373
2,100 South America 2,123 1,821 1,572 1,655 1,666
1,188 European Union - 28 1,176 1,189 1,241 1,152 1,151
1,458 Middle East 1,479 1,508 1,909 1,774 1,801
1,426 North Africa 1,563 949 1,232 1,162 1,162
3,390 Sub-Saharan Africa 3,185 2,988 2,335 2,167 2,184
103,204 East Asia 113,196 118,766 120,184 119,768 119,981
23,171 South Asia 25,840 32,403 33,439 32,950 32,650
12,074 Southeast Asia 13,432 14,736 14,258 14,907 14,833
208 Oceania 232 52 15 250 90
150,652 Total 164,029 176,734 178,115 178,098 177,833
NOTES: Regional definitions appear on last page of this circular. Imports are reported on a trade year basis. All other data are reported
using local marketing years.
Foreign Agricultural Service/USDA 24 March 2021Global Market Analysis
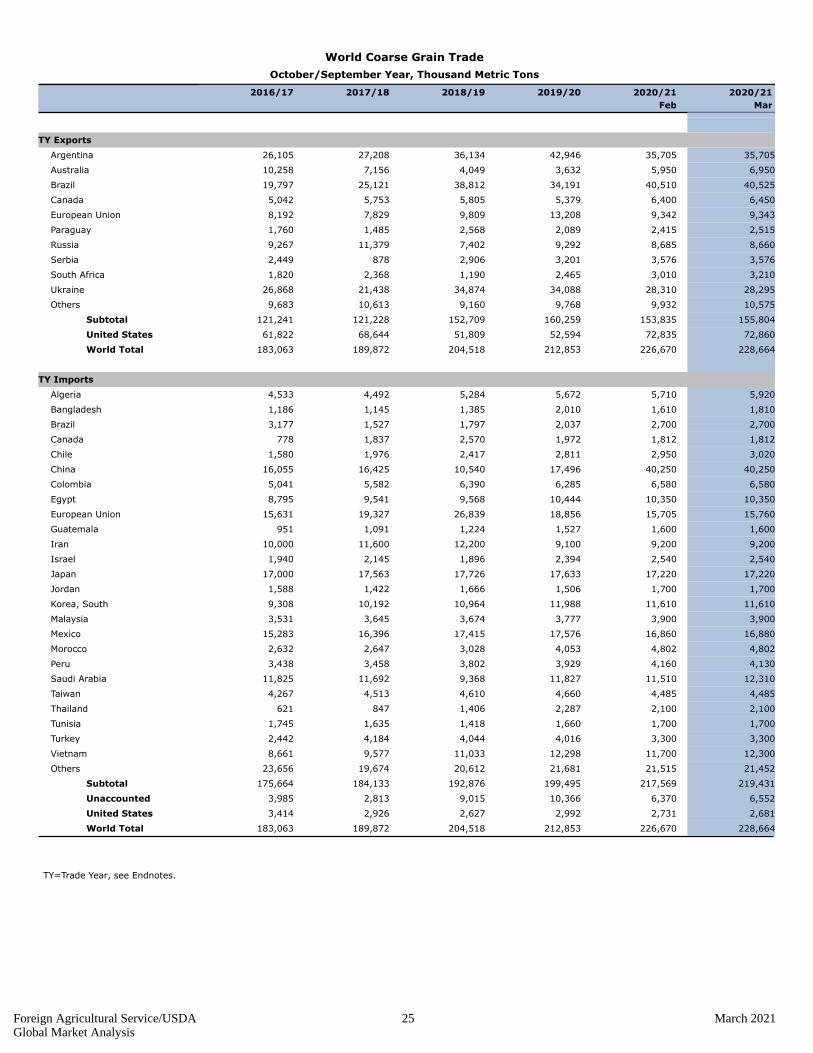
World Coarse Grain Trade
October/September Year, Thousand Metric Tons
2016/17 2017/18 2018/19 2019/20 2020/21
Feb
2020/21
Mar
none
TY Exports
35,70535,70542,94636,13427,20826,105 Argentina
6,9505,9503,6324,0497,15610,258 Australia
40,52540,51034,19138,81225,12119,797 Brazil
6,4506,4005,3795,8055,7535,042 Canada
9,3439,34213,2089,8097,8298,192 European Union
2,5152,4152,0892,5681,4851,760 Paraguay
8,6608,6859,2927,40211,3799,267 Russia
3,5763,5763,2012,9068782,449 Serbia
3,2103,0102,4651,1902,3681,820 South Africa
28,29528,31034,08834,87421,43826,868 Ukraine
10,5759,9329,7689,16010,6139,683 Others
155,804153,835160,259152,709121,228121,241 Subtotal
72,86072,83552,59451,80968,64461,822 United States
228,664226,670212,853204,518189,872183,063 World Total
none
TY Imports
5,9205,7105,6725,2844,4924,533 Algeria
1,8101,6102,0101,3851,1451,186 Bangladesh
2,7002,7002,0371,7971,5273,177 Brazil
1,8121,8121,9722,5701,837778 Canada
3,0202,9502,8112,4171,9761,580 Chile
40,25040,25017,49610,54016,42516,055 China
6,5806,5806,2856,3905,5825,041 Colombia
10,35010,35010,4449,5689,5418,795 Egypt
15,76015,70518,85626,83919,32715,631 European Union
1,6001,6001,5271,2241,091951 Guatemala
9,2009,2009,10012,20011,60010,000 Iran
2,5402,5402,3941,8962,1451,940 Israel
17,22017,22017,63317,72617,56317,000 Japan
1,7001,7001,5061,6661,4221,588 Jordan
11,61011,61011,98810,96410,1929,308 Korea, South
3,9003,9003,7773,6743,6453,531 Malaysia
16,88016,86017,57617,41516,39615,283 Mexico
4,8024,8024,0533,0282,6472,632 Morocco
4,1304,1603,9293,8023,4583,438 Peru
12,31011,51011,8279,36811,69211,825 Saudi Arabia
4,4854,4854,6604,6104,5134,267 Taiwan
2,1002,1002,2871,406847621 Thailand
1,7001,7001,6601,4181,6351,745 Tunisia
3,3003,3004,0164,0444,1842,442 Turkey
12,30011,70012,29811,0339,5778,661 Vietnam
21,45221,51521,68120,61219,67423,656 Others
219,431217,569199,495192,876184,133175,664 Subtotal
6,5526,37010,3669,0152,8133,985 Unaccounted
2,6812,7312,9922,6272,9263,414 United States
228,664226,670212,853204,518189,872183,063 World Total
TY=Trade Year, see Endnotes.
Foreign Agricultural Service/USDA 25 March 2021Global Market Analysis
World Coarse Grains Production, Consumption, and Stocks
Local Marketing Years, Thousand Metric Tons
2016/17 2017/18 2018/19 2019/20 2020/21
Feb
2020/21
Mar
none
Production
55,59255,59458,12559,22339,32048,569 Argentina
16,56114,75610,43611,50712,19117,267 Australia
112,405112,405105,571104,33485,058101,575 Brazil
29,64429,64428,61126,20326,24326,623 Canada
268,045268,045268,204263,957265,719269,895 China
17,25017,25017,10016,46515,78215,641 Ethiopia
161,855161,755161,976148,264152,130152,880 European Union
49,16245,53747,66043,21246,94343,466 India
12,10012,00012,00012,00011,90010,900 Indonesia
33,19033,59032,09533,47033,19133,262 Mexico
20,40020,40019,66519,84018,85920,657 Nigeria
41,39641,47540,49534,99841,71540,765 Russia
17,79317,15816,36612,41713,55218,117 South Africa
15,76115,76114,45113,25112,27110,776 Turkey
38,71038,71046,54544,50334,07139,217 Ukraine
180,401180,250172,955177,676166,682167,261 Others
1,070,2651,064,3301,052,2551,021,320975,6271,016,871 Subtotal
374,568374,568359,434377,905384,387402,607 United States
1,444,8331,438,8981,411,6891,399,2251,360,0141,419,478 World Total
none
Domestic Consumption
19,18219,18417,67518,09117,51316,044 Argentina
74,21574,21572,64470,98367,18164,032 Brazil
25,20625,20624,84524,10423,19821,971 Canada
312,180312,180295,070287,012282,598274,640 China
17,80817,80817,96417,13616,77916,027 Egypt
17,37517,37517,15516,54015,79815,642 Ethiopia
168,092168,092167,343168,194163,020160,940 European Union
47,42545,02045,77544,57144,76942,375 India
14,32014,32014,62016,52015,82014,520 Iran
17,53017,53017,90217,95317,64217,252 Japan
49,71049,79050,31050,50548,41046,845 Mexico
20,65020,65019,90020,06919,55020,303 Nigeria
32,44232,55031,38727,36731,01532,075 Russia
18,66118,66117,76116,65115,36112,891 Turkey
15,80015,70014,85014,33313,77713,150 Vietnam
285,704283,684274,562269,989261,497260,082 Others
1,144,3931,140,0451,107,4441,098,4881,050,8941,055,106 Subtotal
314,154314,159320,677323,013324,407327,476 United States
1,458,5471,454,2041,428,1211,421,5011,375,3011,382,582 World Total
none
Ending Stocks
3,4493,6494,8393,6103,3666,698 Argentina
6,6496,6625,2845,6529,70714,492 Brazil
3,7823,8323,9823,3044,5695,562 Canada
197,029197,029200,984210,395222,978223,494 China
14,11813,96413,93813,39315,66015,063 European Union
3,5973,8974,1385,7846,1815,999 Mexico
3,2883,0742,1031,3462,9093,942 South Africa
45,05842,93244,69544,27047,21248,370 Others
276,970275,039279,963287,754312,582323,620 Subtotal
41,10941,16051,83060,47157,91962,168 United States
318,079316,199331,793348,225370,501385,788 World Total
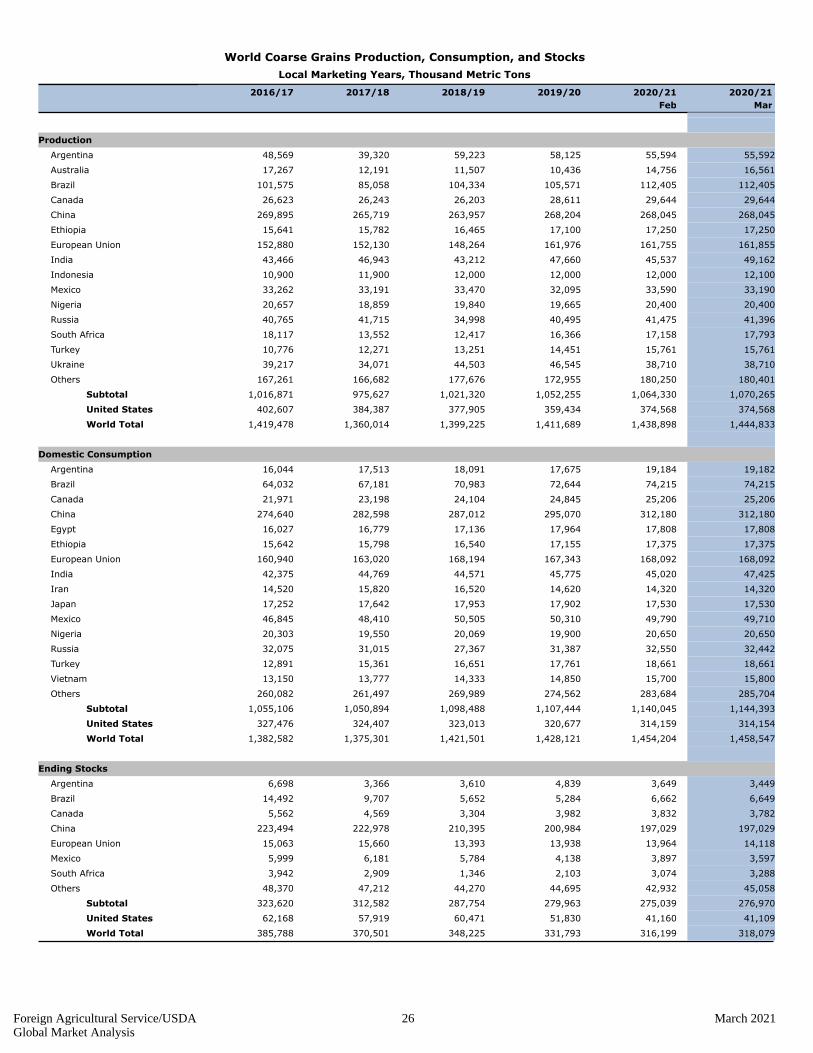
Foreign Agricultural Service/USDA 26 March 2021Global Market Analysis
Regional Coarse Grains Imports, Production, Consumption, and Stocks
Thousand Metric Tons
2016/17 2017/18 2018/19 2019/20
Feb
2020/21
Mar
2020/21
TY Imports none
19,475 North America 21,159 22,612 22,540 21,403 21,373
3,799 Central America 4,001 4,352 4,875 5,150 5,150
2,659 Caribbean 2,446 2,379 2,275 2,650 2,653
15,087 South America 14,806 15,587 16,831 17,890 17,955
15,631 European Union - 28 19,327 26,839 18,856 15,705 15,760
827 Former Soviet Union - 12 700 1,025 1,133 906 783
31,635 Middle East 34,973 32,903 32,589 31,911 32,711
19,468 North Africa 19,245 20,875 23,566 23,862 24,072
6,667 Sub-Saharan Africa 3,223 3,470 3,953 4,493 4,433
46,723 East Asia 48,740 43,903 51,836 73,615 73,615
14,169 Southeast Asia 15,529 17,858 20,031 19,200 19,945
2,938 Others 2,910 3,700 4,002 3,515 3,662
179,078 Total 187,059 195,503 202,487 220,300 222,112
Production none
462,492 North America 443,821 437,578 420,140 437,802 437,402
164,440 South America 139,304 179,168 177,435 182,177 182,223
152,880 European Union - 28 152,130 148,264 161,976 161,755 161,855
11,535 Other Europe 7,245 10,763 11,306 11,783 11,783
92,907 Former Soviet Union - 12 88,881 93,534 101,441 93,794 93,715
19,064 Middle East 19,417 19,496 24,192 25,505 25,506
9,163 North Africa 11,463 13,257 11,707 10,778 10,778
120,790 Sub-Saharan Africa 116,808 121,850 119,937 127,782 128,417
272,518 East Asia 268,365 266,697 271,036 270,851 270,851
56,519 South Asia 60,042 56,932 63,160 61,484 65,309
34,197 Southeast Asia 34,841 34,829 33,642 35,168 35,268
17,884 Oceania 12,700 12,103 11,043 15,385 17,092
5,089 Others 4,997 4,754 4,674 4,634 4,634
1,419,478 Total 1,360,014 1,399,225 1,411,689 1,438,898 1,444,833
Domestic Consumption none
396,292 North America 396,015 397,622 395,832 389,155 389,070
104,434 South America 110,683 115,484 117,192 120,329 120,557
160,940 European Union - 28 163,020 168,194 167,343 168,092 168,092
9,050 Other Europe 7,890 8,471 8,641 8,805 8,796
56,506 Former Soviet Union - 12 54,606 51,042 56,330 56,695 56,457
51,241 Middle East 53,809 53,807 54,845 56,463 57,263
31,040 North Africa 31,665 32,607 35,643 34,903 35,113
118,229 Sub-Saharan Africa 117,587 124,496 121,771 126,913 126,943
308,081 East Asia 317,259 322,994 332,110 348,608 348,608
56,636 South Asia 60,480 60,403 62,961 63,074 65,929
45,679 Southeast Asia 47,357 48,183 48,267 51,373 51,618
6,760 Oceania 6,482 8,138 7,555 9,184 9,475
11,377 Others 11,482 11,590 11,950 12,530 12,533
1,356,265 Total 1,378,335 1,403,031 1,420,440 1,446,124 1,450,454
Ending Stocks none
73,729 North America 68,669 69,559 59,950 48,889 48,488
24,137 South America 16,788 12,833 12,772 12,455 12,455
15,063 European Union - 28 15,660 13,393 13,938 13,964 14,118
1,713 Other Europe 886 1,158 1,395 1,530 1,518
6,923 Former Soviet Union - 12 5,942 4,974 6,394 5,824 5,853
6,606 Middle East 7,378 5,802 6,825 6,591 6,609
3,715 North Africa 3,320 3,796 3,845 3,572 3,572
13,856 Sub-Saharan Africa 12,622 10,631 8,992 10,283 10,497
227,632 East Asia 227,446 214,977 205,698 201,486 201,486
4,151 South Asia 4,948 3,355 4,456 3,580 4,747
4,107 Southeast Asia 3,131 3,982 4,212 4,345 4,645
2,746 Oceania 2,391 2,516 2,340 2,815 3,226
1,410 Others 1,320 1,249 976 865 865
385,788 Total 370,501 348,225 331,793 316,199 318,079
NOTES: Regional definitions appear on last page of this circular. Imports are reported on a trade year basis. All other data are reported
using local marketing years.
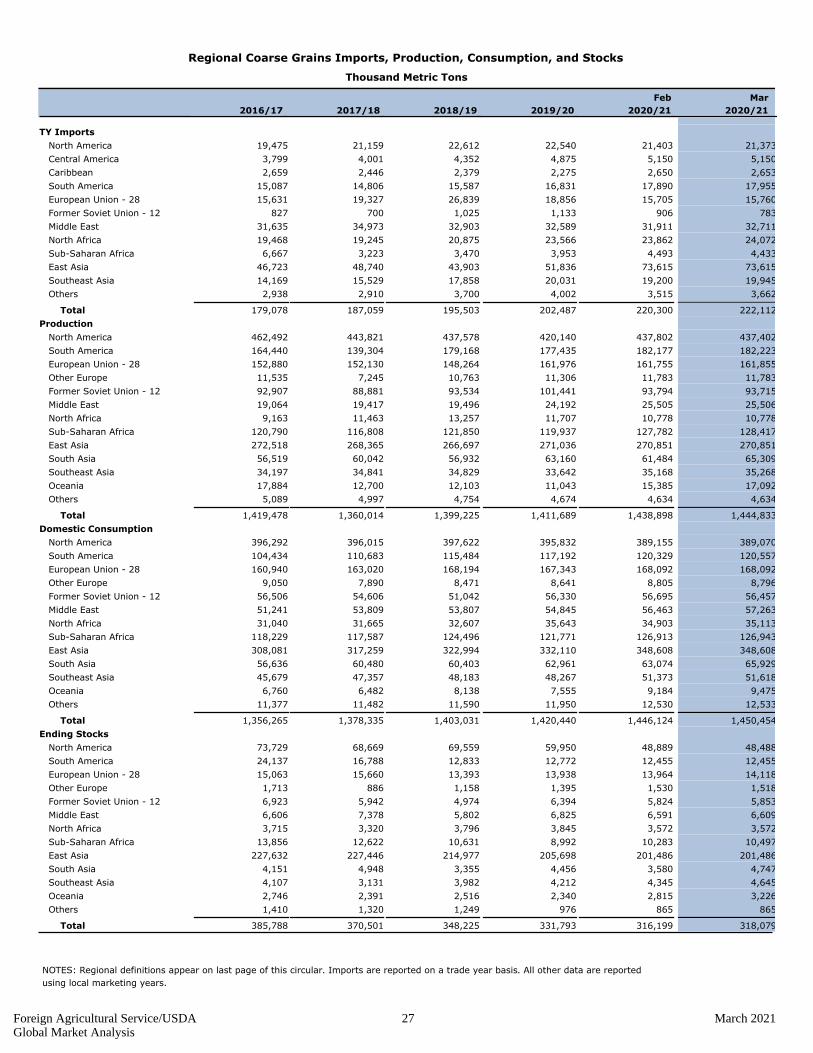
Foreign Agricultural Service/USDA 27 March 2021Global Market Analysis
World Corn Trade
October/September Year, Thousand Metric Tons
2016/17 2017/18 2018/19 2019/20 2020/21
Feb
2020/21
Mar
none
TY Exports
32,00032,00039,91732,87924,19822,951 Argentina
40,50040,50034,18738,77325,11619,794 Brazil
1,8001,8002,2091,5001,4001,500 Burma
2,2002,2004,8073,6321,7502,189 European Union
1,8001,5001,1254821,076553 India
2,5002,4002,0812,5591,4761,757 Paraguay
3,1003,1004,0722,7705,5325,598 Russia
3,5003,5003,1232,8368192,414 Serbia
3,2003,0002,4561,1832,3611,816 South Africa
24,00024,00028,92930,32118,03621,334 Ukraine
5,5105,1585,2056,4547,7927,440 Others
120,110119,158128,111123,38989,55687,346 Subtotal
65,00065,00046,92349,24163,66855,618 United States
185,110184,158175,034172,630153,224142,964 World Total
none
TY Imports
5,2005,2005,1564,8164,0463,989 Algeria
1,8001,6002,0031,3581,1451,181 Bangladesh
2,0002,0001,3461,1899432,439 Brazil
1,7001,7001,8672,5211,767686 Canada
2,8002,8002,7512,2921,8931,484 Chile
24,00024,0007,5964,4833,4562,464 China
6,2006,2005,9766,0485,2014,754 Colombia
1,0001,000953918873876 Costa Rica
1,5001,5001,3541,5361,3291,294 Dominican Republic
10,30010,30010,4329,3679,4648,773 Egypt
15,50015,50018,60725,25418,46914,971 European Union
1,6001,6001,5271,2241,091951 Guatemala
7,0007,0006,8009,0008,9007,800 Iran
2,2002,2001,9921,6111,8611,539 Israel
15,60015,60015,88816,05015,66815,169 Japan
11,50011,50011,89210,85610,0189,220 Korea, South
3,9003,9003,7773,6743,6453,531 Malaysia
16,50016,50016,52616,65816,12914,614 Mexico
3,2003,2002,9632,7282,2832,221 Morocco
4,0004,0003,8223,6943,4023,269 Peru
4,3004,3004,5173,6623,9833,421 Saudi Arabia
4,4004,4004,5804,5084,4104,163 Taiwan
1,2001,2001,6021,200700600 Thailand
2,5002,5003,0043,6693,4102,087 Turkey
12,00011,50012,10010,9009,4008,500 Vietnam
17,50217,34717,56815,78615,79418,896 Others
179,402178,547166,599165,002149,280138,892 Subtotal
5,0584,9617,4766,8283,1062,621 Unaccounted
6506509598008381,451 United States
185,110184,158175,034172,630153,224142,964 World Total
TY=Trade Year, see Endnotes.
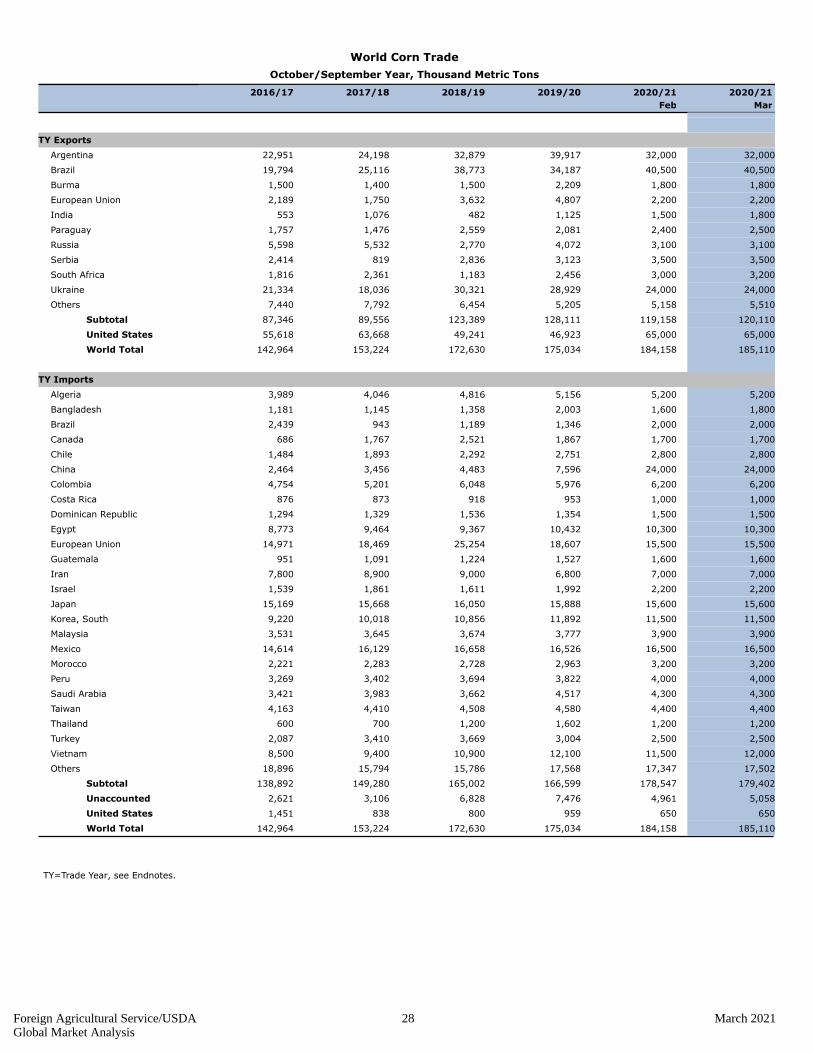
Foreign Agricultural Service/USDA 28 March 2021Global Market Analysis
World Corn Production, Consumption, and Stocks
Local Marketing Years, Thousand Metric Tons
2016/17 2017/18 2018/19 2019/20 2020/21
Feb
2020/21
Mar
none
Production
47,50047,50051,00051,00032,00041,000 Argentina
109,000109,000102,000101,00082,00098,500 Brazil
13,56313,56313,40413,88514,09613,889 Canada
260,670260,670260,779257,174259,071263,613 China
8,6008,6008,5008,3508,0077,847 Ethiopia
63,70063,60066,71864,37662,04661,935 European Union
30,20028,50028,76627,71528,75325,900 India
12,10012,00012,00012,00011,90010,900 Indonesia
27,80028,00026,65827,67127,56927,575 Mexico
11,50011,50011,00011,00010,42011,548 Nigeria
8,2008,2008,0307,6087,9808,087 Philippines
13,87214,00014,27511,41513,20115,305 Russia
8,0008,0007,7007,4004,0007,600 Serbia
17,00016,50015,84411,82413,10417,551 South Africa
29,50029,50035,88735,80524,11527,969 Ukraine
114,857114,665108,007112,502109,629103,821 Others
776,062773,798770,568760,725707,891743,040 Subtotal
360,252360,252345,962364,262371,096384,778 United States
1,136,3141,134,0501,116,5301,124,9871,078,9871,127,818 World Total
none
Total Consumption
15,00015,00013,50013,80012,40011,200 Argentina
70,00070,00068,50067,00063,50060,500 Brazil
14,80014,80013,96015,08713,98612,949 Canada
289,000289,000278,000274,000263,000255,000 China
16,90016,90016,90016,20015,90015,100 Egypt
77,00077,00081,00087,50077,15074,100 European Union
28,50027,70027,20028,50026,70024,900 India
13,00013,00012,60012,90012,40012,300 Indonesia
15,65015,65015,95016,00015,60015,200 Japan
11,60011,60011,80210,94710,0009,435 Korea, South
43,85043,85043,80044,10042,50040,400 Mexico
11,80011,80011,25011,30011,10011,400 Nigeria
10,90011,0009,8008,5008,3009,550 Russia
12,80012,80012,60012,53612,23012,663 South Africa
15,50015,50014,65014,20013,60013,000 Vietnam
193,403192,779187,318184,516179,859171,572 Others
846,320845,073825,113834,392775,891774,111 Subtotal
305,450305,450309,506310,446313,981313,785 United States
1,151,7701,150,5231,134,6191,144,8381,089,8721,087,896 World Total
none
Ending Stocks
2,1772,3773,6722,3672,4075,273 Argentina
6,2926,2924,7925,2929,31514,019 Brazil
2,0222,0222,5591,9802,4172,574 Canada
196,176196,176200,526210,163222,525223,017 China
7,1777,0777,1777,6599,1617,546 European Union
3,0653,2653,5155,1605,6495,409 Mexico
2,7642,6201,7641,0202,6723,695 South Africa
29,84528,55430,36331,16332,55232,164 Others
249,518248,383254,368264,804286,698293,697 Subtotal
38,15138,15148,75756,41054,36758,253 United States
287,669286,534303,125321,214341,065351,950 World Total
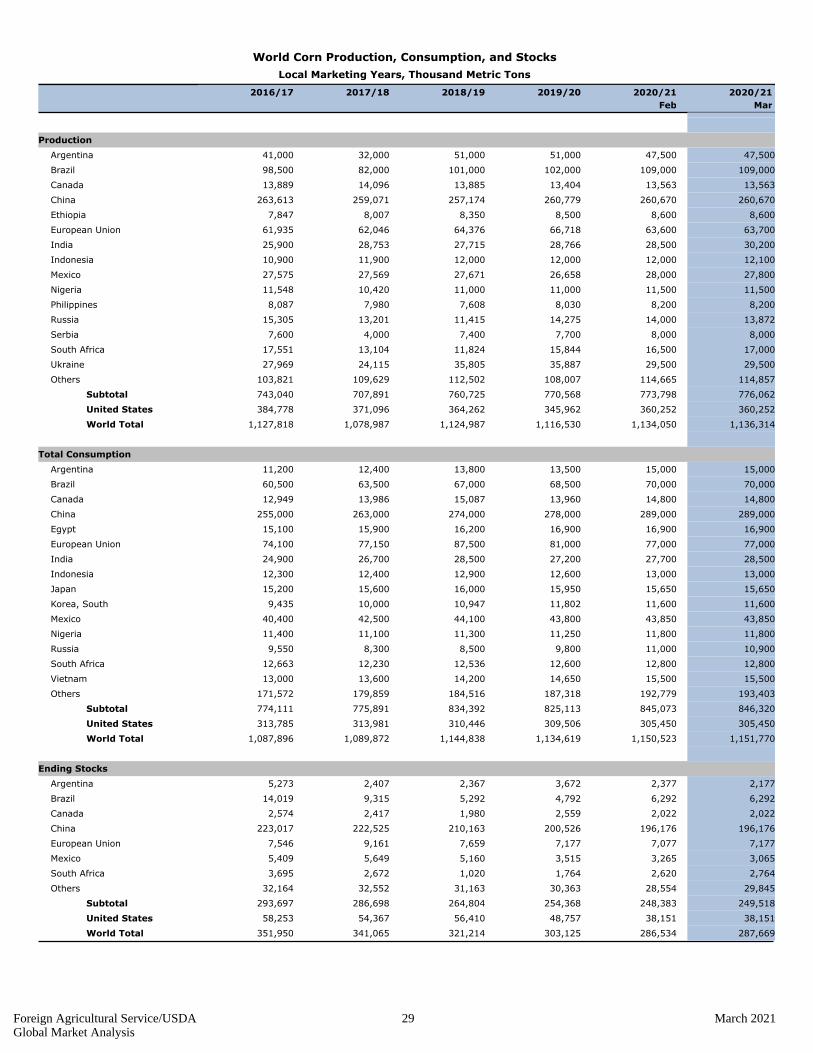
Foreign Agricultural Service/USDA 29 March 2021Global Market Analysis
Regional Corn Imports, Production, Consumption, and Stocks
Thousand Metric Tons
2016/17 2017/18 2018/19 2019/20
Feb
2020/21
Mar
2020/21
TY Imports none
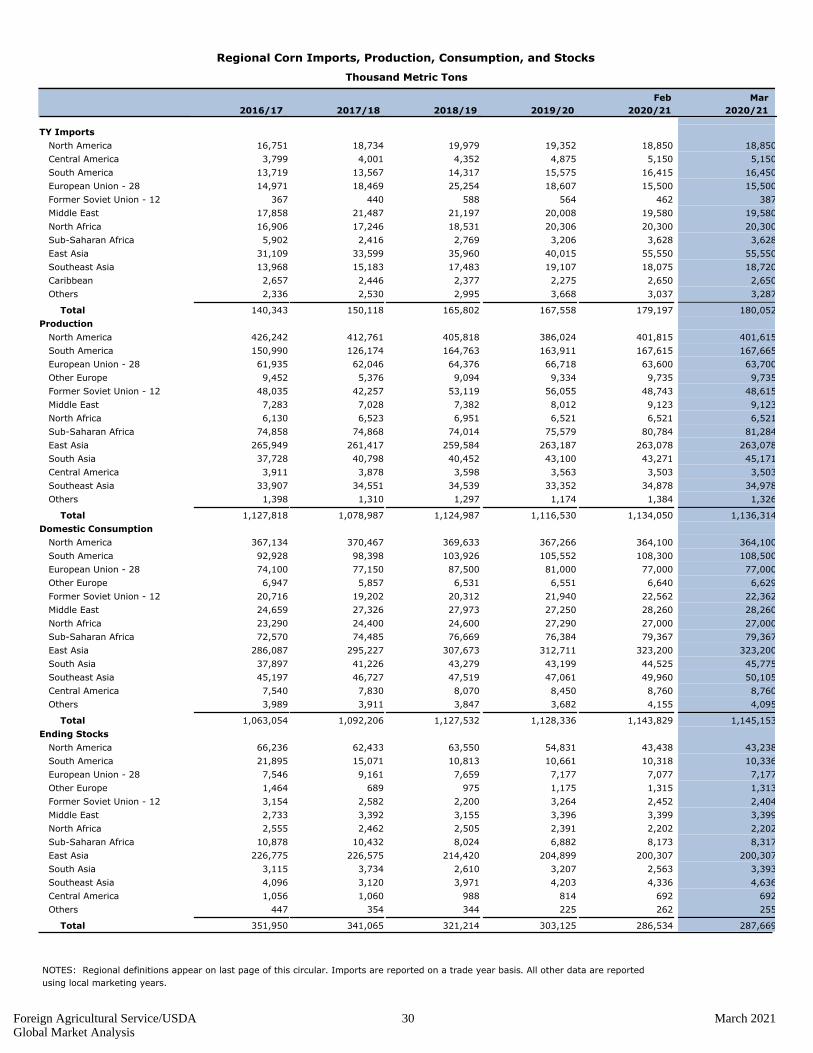
16,751 North America 18,734 19,979 19,352 18,850 18,850
3,799 Central America 4,001 4,352 4,875 5,150 5,150
13,719 South America 13,567 14,317 15,575 16,415 16,450
14,971 European Union - 28 18,469 25,254 18,607 15,500 15,500
367 Former Soviet Union - 12 440 588 564 462 387
17,858 Middle East 21,487 21,197 20,008 19,580 19,580
16,906 North Africa 17,246 18,531 20,306 20,300 20,300
5,902 Sub-Saharan Africa 2,416 2,769 3,206 3,628 3,628
31,109 East Asia 33,599 35,960 40,015 55,550 55,550
13,968 Southeast Asia 15,183 17,483 19,107 18,075 18,720
2,657 Caribbean 2,446 2,377 2,275 2,650 2,650
2,336 Others 2,530 2,995 3,668 3,037 3,287
140,343 Total 150,118 165,802 167,558 179,197 180,052
Production none
426,242 North America 412,761 405,818 386,024 401,815 401,615
150,990 South America 126,174 164,763 163,911 167,615 167,665
61,935 European Union - 28 62,046 64,376 66,718 63,600 63,700
9,452 Other Europe 5,376 9,094 9,334 9,735 9,735
48,035 Former Soviet Union - 12 42,257 53,119 56,055 48,743 48,615
7,283 Middle East 7,028 7,382 8,012 9,123 9,123
6,130 North Africa 6,523 6,951 6,521 6,521 6,521
74,858 Sub-Saharan Africa 74,868 74,014 75,579 80,784 81,284
265,949 East Asia 261,417 259,584 263,187 263,078 263,078
37,728 South Asia 40,798 40,452 43,100 43,271 45,171
3,911 Central America 3,878 3,598 3,563 3,503 3,503
33,907 Southeast Asia 34,551 34,539 33,352 34,878 34,978
1,398 Others 1,310 1,297 1,174 1,384 1,326
1,127,818 Total 1,078,987 1,124,987 1,116,530 1,134,050 1,136,314
Domestic Consumption none
367,134 North America 370,467 369,633 367,266 364,100 364,100
92,928 South America 98,398 103,926 105,552 108,300 108,500
74,100 European Union - 28 77,150 87,500 81,000 77,000 77,000
6,947 Other Europe 5,857 6,531 6,551 6,640 6,629
20,716 Former Soviet Union - 12 19,202 20,312 21,940 22,562 22,362
24,659 Middle East 27,326 27,973 27,250 28,260 28,260
23,290 North Africa 24,400 24,600 27,290 27,000 27,000
72,570 Sub-Saharan Africa 74,485 76,669 76,384 79,367 79,367
286,087 East Asia 295,227 307,673 312,711 323,200 323,200
37,897 South Asia 41,226 43,279 43,199 44,525 45,775
45,197 Southeast Asia 46,727 47,519 47,061 49,960 50,105
7,540 Central America 7,830 8,070 8,450 8,760 8,760
3,989 Others 3,911 3,847 3,682 4,155 4,095
1,063,054 Total 1,092,206 1,127,532 1,128,336 1,143,829 1,145,153
Ending Stocks none
66,236 North America 62,433 63,550 54,831 43,438 43,238
21,895 South America 15,071 10,813 10,661 10,318 10,336
7,546 European Union - 28 9,161 7,659 7,177 7,077 7,177
1,464 Other Europe 689 975 1,175 1,315 1,313
3,154 Former Soviet Union - 12 2,582 2,200 3,264 2,452 2,404
2,733 Middle East 3,392 3,155 3,396 3,399 3,399
2,555 North Africa 2,462 2,505 2,391 2,202 2,202
10,878 Sub-Saharan Africa 10,432 8,024 6,882 8,173 8,317
226,775 East Asia 226,575 214,420 204,899 200,307 200,307
3,115 South Asia 3,734 2,610 3,207 2,563 3,393
4,096 Southeast Asia 3,120 3,971 4,203 4,336 4,636
1,056 Central America 1,060 988 814 692 692
447 Others 354 344 225 262 255
351,950 Total 341,065 321,214 303,125 286,534 287,669
NOTES: Regional definitions appear on last page of this circular. Imports are reported on a trade year basis. All other data are reported
using local marketing years.
Foreign Agricultural Service/USDA 30 March 2021Global Market Analysis
World Barley Trade
October/September Year, Thousand Metric Tons
2016/17 2017/18 2018/19 2019/20 2020/21
Feb
2020/21
Mar
none
TY Exports
2,7002,7002,5983,0012,5372,696 Argentina
6,0005,0003,2313,6666,0889,192 Australia
3,3003,3002,6212,2691,8681,809 Canada
6,8006,8007,9085,8775,8575,683 European Union
4004000000 Iraq
1,2001,2001,2921,7621,411821 Kazakhstan
5,4005,4005,1414,3205,6613,626 Russia
300300300000 Syria
4,2004,2004,9904,4073,1885,337 Ukraine
100100416212111 Uruguay
176176144246343322 Others
30,57629,57628,26625,61026,96529,597 Subtotal
225200155101102125 United States
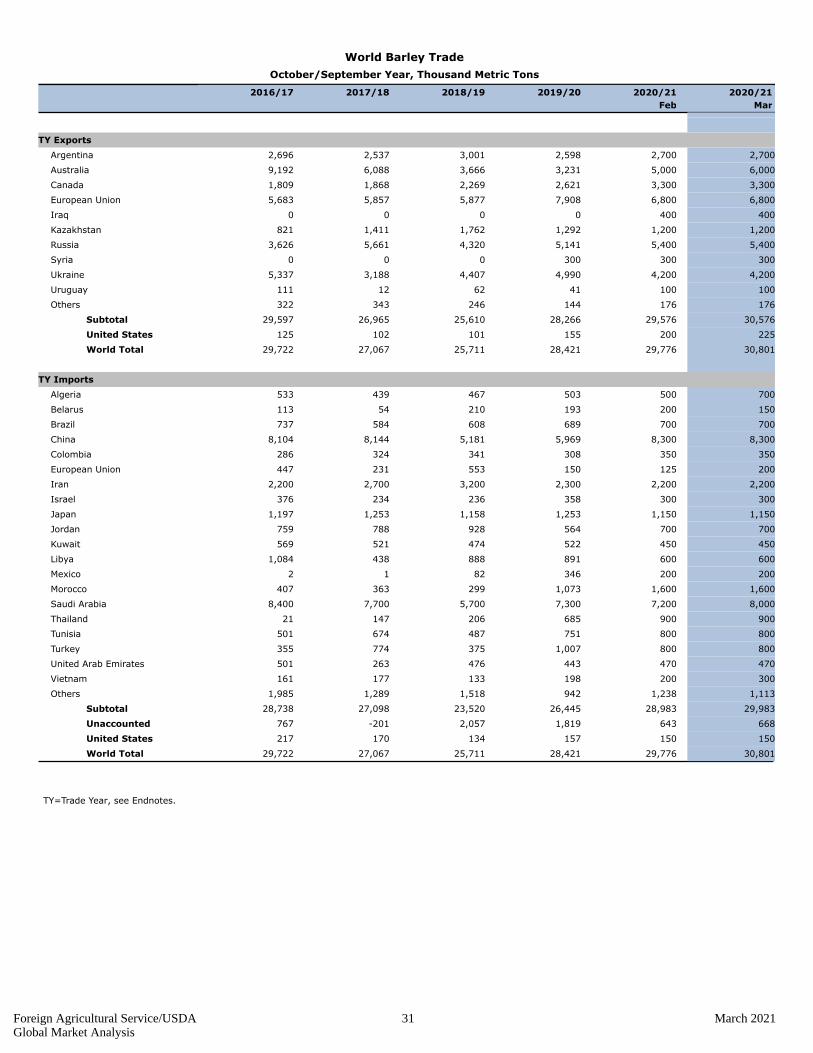
30,80129,77628,42125,71127,06729,722 World Total
none
TY Imports
700500503467439533 Algeria
15020019321054113 Belarus
700700689608584737 Brazil
8,3008,3005,9695,1818,1448,104 China
350350308341324286 Colombia
200125150553231447 European Union
2,2002,2002,3003,2002,7002,200 Iran
300300358236234376 Israel
1,1501,1501,2531,1581,2531,197 Japan
700700564928788759 Jordan
450450522474521569 Kuwait
6006008918884381,084 Libya
2002003468212 Mexico
1,6001,6001,073299363407 Morocco
8,0007,2007,3005,7007,7008,400 Saudi Arabia
90090068520614721 Thailand
800800751487674501 Tunisia
8008001,007375774355 Turkey
470470443476263501 United Arab Emirates
300200198133177161 Vietnam
1,1131,2389421,5181,2891,985 Others
29,98328,98326,44523,52027,09828,738 Subtotal
6686431,8192,057-201767 Unaccounted
150150157134170217 United States
30,80129,77628,42125,71127,06729,722 World Total
TY=Trade Year, see Endnotes.
Foreign Agricultural Service/USDA 31 March 2021Global Market Analysis

World Barley Production, Consumption, and Stocks
Local Marketing Years, Thousand Metric Tons
2016/17 2017/18 2018/19 2019/20 2020/21
Feb
2020/21
Mar
none
Production
1,8451,8452,0001,9509681,000 Algeria
4,1004,1003,8005,0603,7403,300 Argentina
13,00011,0009,0008,8199,25413,506 Australia
1,0501,0501,0989441,4201,253 Belarus
10,74110,74110,3838,3807,8918,839 Canada
2,3502,3502,3002,2002,0322,025 Ethiopia
63,05063,05063,21955,98058,65159,866 European Union
1,7221,6871,6331,7811,7471,438 India
3,7503,7503,6002,8003,1003,724 Iran
1,5501,5501,6007809751,550 Iraq
3,6593,6593,8303,9713,3053,231 Kazakhstan
20,62920,60019,93916,73720,21117,547 Russia
1,9001,9002,000400777720 Syria
8,1008,1007,9007,0006,4004,750 Turkey
8,0008,0009,5287,6048,6959,874 Ukraine
10,41910,37811,00611,68210,90010,110 Others
155,865153,760152,836136,088140,066142,733 Subtotal
3,6003,6003,7563,3433,1194,353 United States
159,465157,360156,592139,431143,185147,086 World Total
none
Total Consumption
2,5502,3502,3502,0001,8502,050 Algeria
6,5005,9005,5005,0003,7003,500 Australia
7,5007,5008,0206,5006,7996,760 Canada
9,0009,0006,7006,2009,3009,200 China
2,3752,3752,3252,2252,2252,025 Ethiopia
56,70056,70055,20051,60054,00055,100 European Union
1,9001,9001,8501,9001,9501,650 India
5,9005,9006,4006,2006,0005,200 Iran
2,5002,5002,4002,1502,1502,200 Kazakhstan
2,3002,3002,5002,9002,8002,400 Morocco
14,90014,90015,40012,20014,50014,700 Russia
8,0257,2257,0257,0258,5259,825 Saudi Arabia
1,6001,6001,370680850900 Syria
9,0009,0008,5007,5006,7005,500 Turkey
4,0004,0004,5004,2004,5004,900 Ukraine
20,03420,03119,94818,25617,69519,261 Others
155,532153,883150,444137,497142,784146,066 Subtotal
3,6143,6143,9223,5373,4664,375 United States
159,146157,497154,366141,034146,250150,441 World Total
none
Ending Stocks
993993998790517877 Algeria
2,5832,1832,0831,9081,7761,884 Australia
9989989578771,2502,120 Canada
4,5024,4274,7524,2454,6245,421 European Union
1,0971,068743640750839 Russia
1,1021,0841,1161,3271,8412,353 Saudi Arabia
8638581,0531,0081,1491,237 Ukraine
6,5036,5196,5405,0845,4025,384 Others
18,64118,13018,24215,87917,30920,115 Subtotal
1,6671,6891,7471,8842,0572,316 United States
20,30819,81919,98917,76319,36622,431 World Total
Foreign Agricultural Service/USDA 32 March 2021Global Market Analysis
Regional Barley Imports, Production, Consumption, and Stocks
Thousand Metric Tons
2016/17 2017/18 2018/19 2019/20
Feb
2020/21
Mar
2020/21
TY Imports none
293 North America 227 254 589 450 450
1,277 South America 1,082 1,167 1,194 1,260 1,230
447 European Union - 28 231 553 150 125 200
124 Other Europe 80 175 89 91 91
442 Former Soviet Union - 12 229 395 464 426 381
13,746 Middle East 13,424 11,650 12,521 12,280 13,080
2,542 North Africa 1,990 2,342 3,225 3,550 3,750
112 Sub-Saharan Africa 49 28 67 45 45
9,413 East Asia 9,499 6,441 7,324 9,560 9,560
346 South Asia 114 296 89 226 126
31 Oceania 19 14 7 20 20
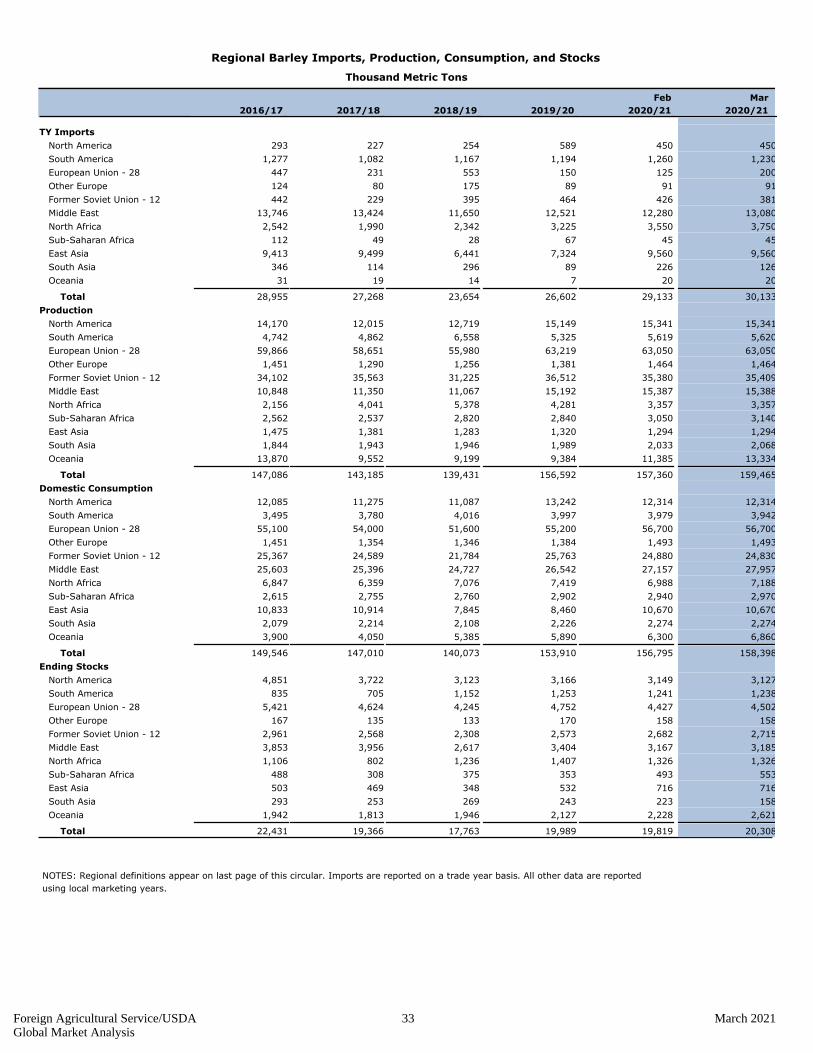
28,955 Total 27,268 23,654 26,602 29,133 30,133
Production none
14,170 North America 12,015 12,719 15,149 15,341 15,341
4,742 South America 4,862 6,558 5,325 5,619 5,620
59,866 European Union - 28 58,651 55,980 63,219 63,050 63,050
1,451 Other Europe 1,290 1,256 1,381 1,464 1,464
34,102 Former Soviet Union - 12 35,563 31,225 36,512 35,380 35,409
10,848 Middle East 11,350 11,067 15,192 15,387 15,388
2,156 North Africa 4,041 5,378 4,281 3,357 3,357
2,562 Sub-Saharan Africa 2,537 2,820 2,840 3,050 3,140
1,475 East Asia 1,381 1,283 1,320 1,294 1,294
1,844 South Asia 1,943 1,946 1,989 2,033 2,068
13,870 Oceania 9,552 9,199 9,384 11,385 13,334
147,086 Total 143,185 139,431 156,592 157,360 159,465
Domestic Consumption none
12,085 North America 11,275 11,087 13,242 12,314 12,314
3,495 South America 3,780 4,016 3,997 3,979 3,942
55,100 European Union - 28 54,000 51,600 55,200 56,700 56,700
1,451 Other Europe 1,354 1,346 1,384 1,493 1,493
25,367 Former Soviet Union - 12 24,589 21,784 25,763 24,880 24,830
25,603 Middle East 25,396 24,727 26,542 27,157 27,957
6,847 North Africa 6,359 7,076 7,419 6,988 7,188
2,615 Sub-Saharan Africa 2,755 2,760 2,902 2,940 2,970
10,833 East Asia 10,914 7,845 8,460 10,670 10,670
2,079 South Asia 2,214 2,108 2,226 2,274 2,274
3,900 Oceania 4,050 5,385 5,890 6,300 6,860
149,546 Total 147,010 140,073 153,910 156,795 158,398
Ending Stocks none
4,851 North America 3,722 3,123 3,166 3,149 3,127
835 South America 705 1,152 1,253 1,241 1,238
5,421 European Union - 28 4,624 4,245 4,752 4,427 4,502
167 Other Europe 135 133 170 158 158
2,961 Former Soviet Union - 12 2,568 2,308 2,573 2,682 2,715
3,853 Middle East 3,956 2,617 3,404 3,167 3,185
1,106 North Africa 802 1,236 1,407 1,326 1,326
488 Sub-Saharan Africa 308 375 353 493 553
503 East Asia 469 348 532 716 716
293 South Asia 253 269 243 223 158
1,942 Oceania 1,813 1,946 2,127 2,228 2,621
22,431 Total 19,366 17,763 19,989 19,819 20,308
NOTES: Regional definitions appear on last page of this circular. Imports are reported on a trade year basis. All other data are reported
using local marketing years.
Foreign Agricultural Service/USDA 33 March 2021Global Market Analysis
World Sorghum Trade
October/September Year, Thousand Metric Tons
2016/17 2017/18 2018/19 2019/20 2020/21
Feb
2020/21
Mar
none
TY Exports
1,0001,000426254473457 Argentina
50050010791449542 Australia
505029494334 China
757575757575 Ethiopia
5050315312324 India
8080315313673 Kenya
505050100100100 Nigeria
186170224235298402 Others
1,9911,9759739101,6971,707 Subtotal
7,6007,6005,4802,4374,8396,031 United States
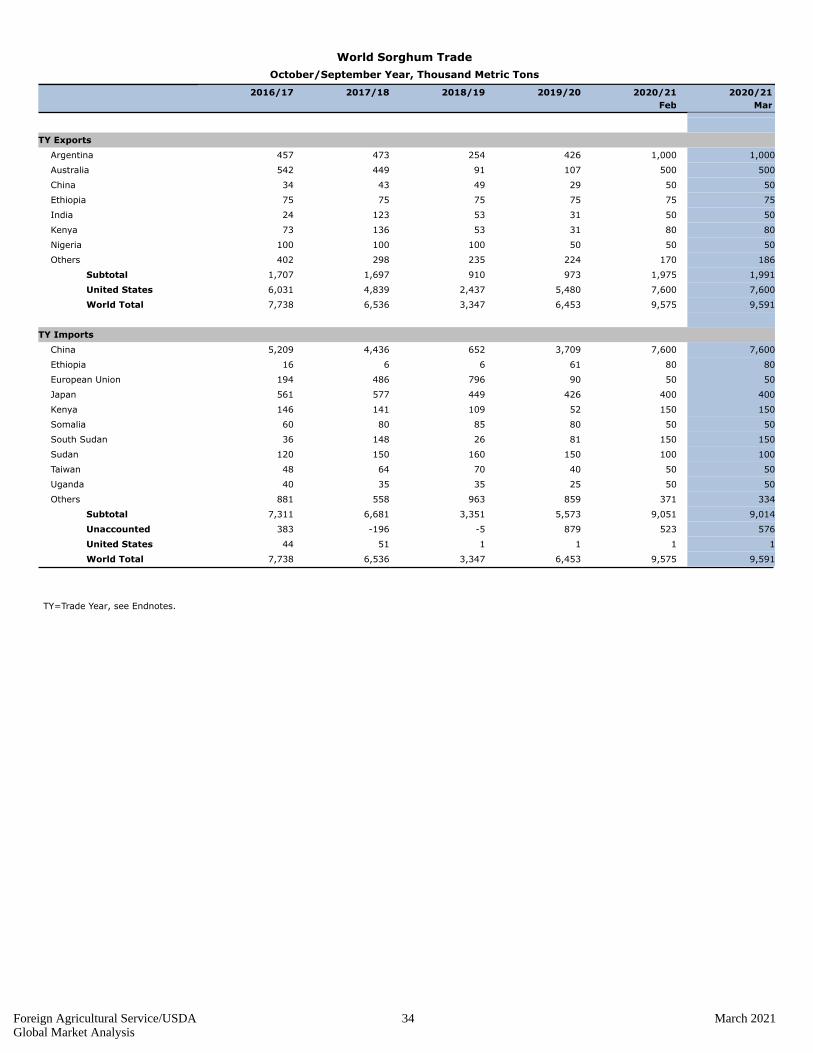
9,5919,5756,4533,3476,5367,738 World Total
none
TY Imports
7,6007,6003,7096524,4365,209 China
8080616616 Ethiopia
505090796486194 European Union
400400426449577561 Japan
15015052109141146 Kenya
505080858060 Somalia
150150812614836 South Sudan
100100150160150120 Sudan
505040706448 Taiwan
505025353540 Uganda
334371859963558881 Others
9,0149,0515,5733,3516,6817,311 Subtotal
576523879-5-196383 Unaccounted
11115144 United States
9,5919,5756,4533,3476,5367,738 World Total
TY=Trade Year, see Endnotes.
Foreign Agricultural Service/USDA 34 March 2021Global Market Analysis
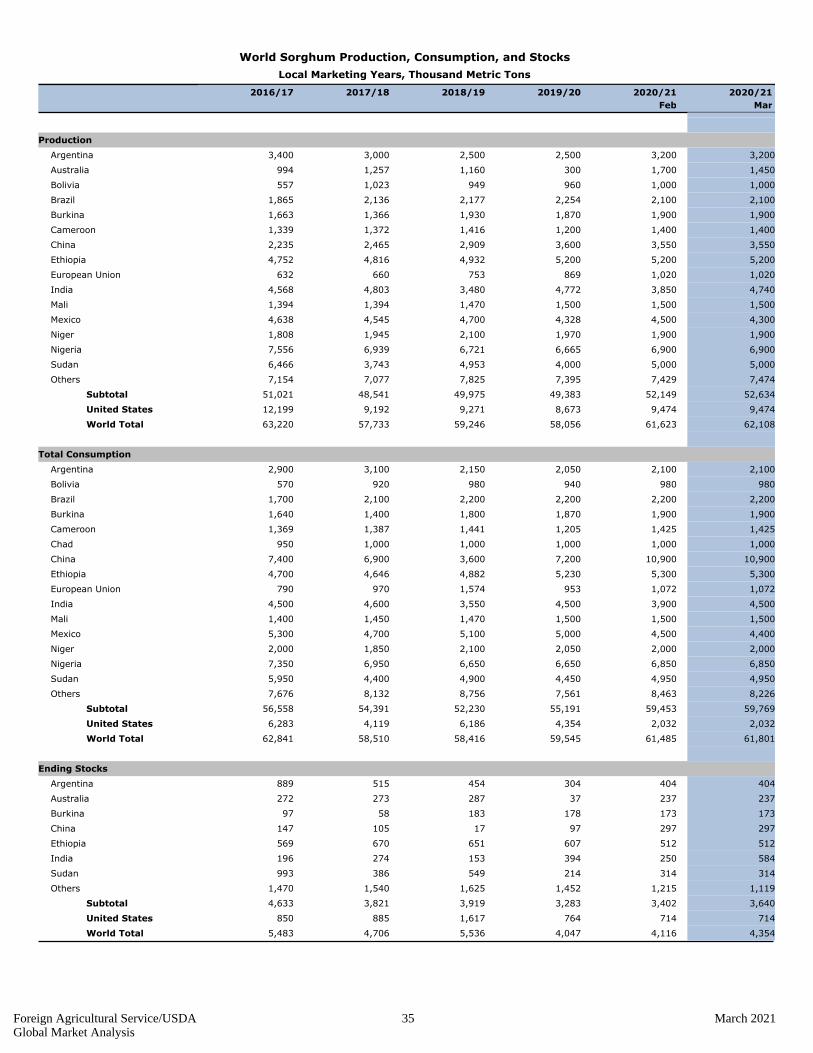
World Sorghum Production, Consumption, and Stocks
Local Marketing Years, Thousand Metric Tons
2016/17 2017/18 2018/19 2019/20 2020/21
Feb
2020/21
Mar
none
Production
3,2003,2002,5002,5003,0003,400 Argentina
1,4501,7003001,1601,257994 Australia
1,0001,0009609491,023557 Bolivia
2,1002,1002,2542,1772,1361,865 Brazil
1,9001,9001,8701,9301,3661,663 Burkina
1,4001,4001,2001,4161,3721,339 Cameroon
3,5503,5503,6002,9092,4652,235 China
5,2005,2005,2004,9324,8164,752 Ethiopia
1,0201,020869753660632 European Union
4,7403,8504,7723,4804,8034,568 India
1,5001,5001,5001,4701,3941,394 Mali
4,3004,5004,3284,7004,5454,638 Mexico
1,9001,9001,9702,1001,9451,808 Niger
6,9006,9006,6656,7216,9397,556 Nigeria
5,0005,0004,0004,9533,7436,466 Sudan
7,4747,4297,3957,8257,0777,154 Others
52,63452,14949,38349,97548,54151,021 Subtotal
9,4749,4748,6739,2719,19212,199 United States
62,10861,62358,05659,24657,73363,220 World Total
none
Total Consumption
2,1002,1002,0502,1503,1002,900 Argentina
980980940980920570 Bolivia
2,2002,2002,2002,2002,1001,700 Brazil
1,9001,9001,8701,8001,4001,640 Burkina
1,4251,4251,2051,4411,3871,369 Cameroon
1,0001,0001,0001,0001,000950 Chad
10,90010,9007,2003,6006,9007,400 China
5,3005,3005,2304,8824,6464,700 Ethiopia
1,0721,0729531,574970790 European Union
4,5003,9004,5003,5504,6004,500 India
1,5001,5001,5001,4701,4501,400 Mali
4,4004,5005,0005,1004,7005,300 Mexico
2,0002,0002,0502,1001,8502,000 Niger
6,8506,8506,6506,6506,9507,350 Nigeria
4,9504,9504,4504,9004,4005,950 Sudan
8,2268,4637,5618,7568,1327,676 Others
59,76959,45355,19152,23054,39156,558 Subtotal
2,0322,0324,3546,1864,1196,283 United States
61,80161,48559,54558,41658,51062,841 World Total
none
Ending Stocks
404404304454515889 Argentina
23723737287273272 Australia
1731731781835897 Burkina
2972979717105147 China
512512607651670569 Ethiopia
584250394153274196 India
314314214549386993 Sudan
1,1191,2151,4521,6251,5401,470 Others
3,6403,4023,2833,9193,8214,633 Subtotal
7147147641,617885850 United States
4,3544,1164,0475,5364,7065,483 World Total
Foreign Agricultural Service/USDA 35 March 2021Global Market Analysis
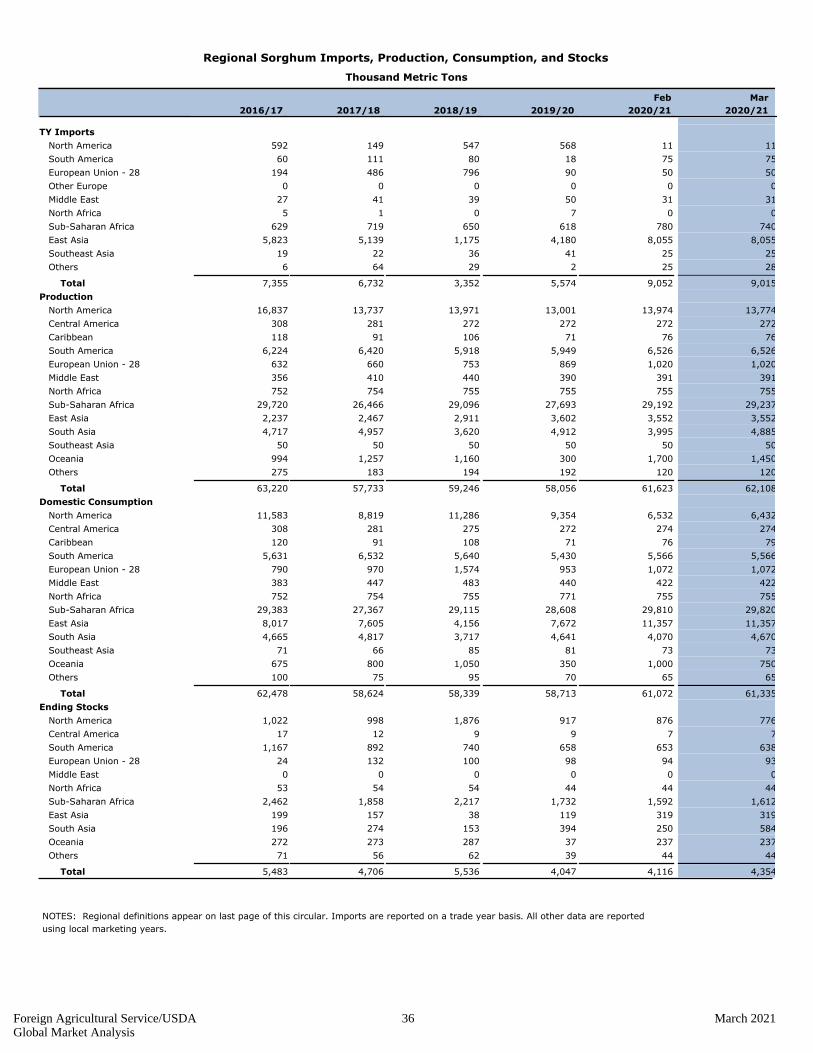
Regional Sorghum Imports, Production, Consumption, and Stocks
Thousand Metric Tons
2016/17 2017/18 2018/19 2019/20
Feb
2020/21
Mar
2020/21
TY Imports none
592 North America 149 547 568 11 11
60 South America 111 80 18 75 75
194 European Union - 28 486 796 90 50 50
0 Other Europe 0 0 0 0 0
27 Middle East 41 39 50 31 31
5 North Africa 1 0 7 0 0
629 Sub-Saharan Africa 719 650 618 780 740
5,823 East Asia 5,139 1,175 4,180 8,055 8,055
19 Southeast Asia 22 36 41 25 25
6 Others 64 29 2 25 28
7,355 Total 6,732 3,352 5,574 9,052 9,015
Production none
16,837 North America 13,737 13,971 13,001 13,974 13,774
308 Central America 281 272 272 272 272
118 Caribbean 91 106 71 76 76
6,224 South America 6,420 5,918 5,949 6,526 6,526
632 European Union - 28 660 753 869 1,020 1,020
356 Middle East 410 440 390 391 391
752 North Africa 754 755 755 755 755
29,720 Sub-Saharan Africa 26,466 29,096 27,693 29,192 29,237
2,237 East Asia 2,467 2,911 3,602 3,552 3,552
4,717 South Asia 4,957 3,620 4,912 3,995 4,885
50 Southeast Asia 50 50 50 50 50
994 Oceania 1,257 1,160 300 1,700 1,450
275 Others 183 194 192 120 120
63,220 Total 57,733 59,246 58,056 61,623 62,108
Domestic Consumption none
11,583 North America 8,819 11,286 9,354 6,532 6,432
308 Central America 281 275 272 274 274
120 Caribbean 91 108 71 76 79
5,631 South America 6,532 5,640 5,430 5,566 5,566
790 European Union - 28 970 1,574 953 1,072 1,072
383 Middle East 447 483 440 422 422
752 North Africa 754 755 771 755 755
29,383 Sub-Saharan Africa 27,367 29,115 28,608 29,810 29,820
8,017 East Asia 7,605 4,156 7,672 11,357 11,357
4,665 South Asia 4,817 3,717 4,641 4,070 4,670
71 Southeast Asia 66 85 81 73 73
675 Oceania 800 1,050 350 1,000 750
100 Others 75 95 70 65 65
62,478 Total 58,624 58,339 58,713 61,072 61,335
Ending Stocks none
1,022 North America 998 1,876 917 876 776
17 Central America 12 9 9 7 7
1,167 South America 892 740 658 653 638
24 European Union - 28 132 100 98 94 93
0 Middle East 0 0 0 0 0
53 North Africa 54 54 44 44 44
2,462 Sub-Saharan Africa 1,858 2,217 1,732 1,592 1,612
199 East Asia 157 38 119 319 319
196 South Asia 274 153 394 250 584
272 Oceania 273 287 37 237 237
71 Others 56 62 39 44 44
5,483 Total 4,706 5,536 4,047 4,116 4,354
NOTES: Regional definitions appear on last page of this circular. Imports are reported on a trade year basis. All other data are reported
using local marketing years.
Foreign Agricultural Service/USDA 36 March 2021Global Market Analysis
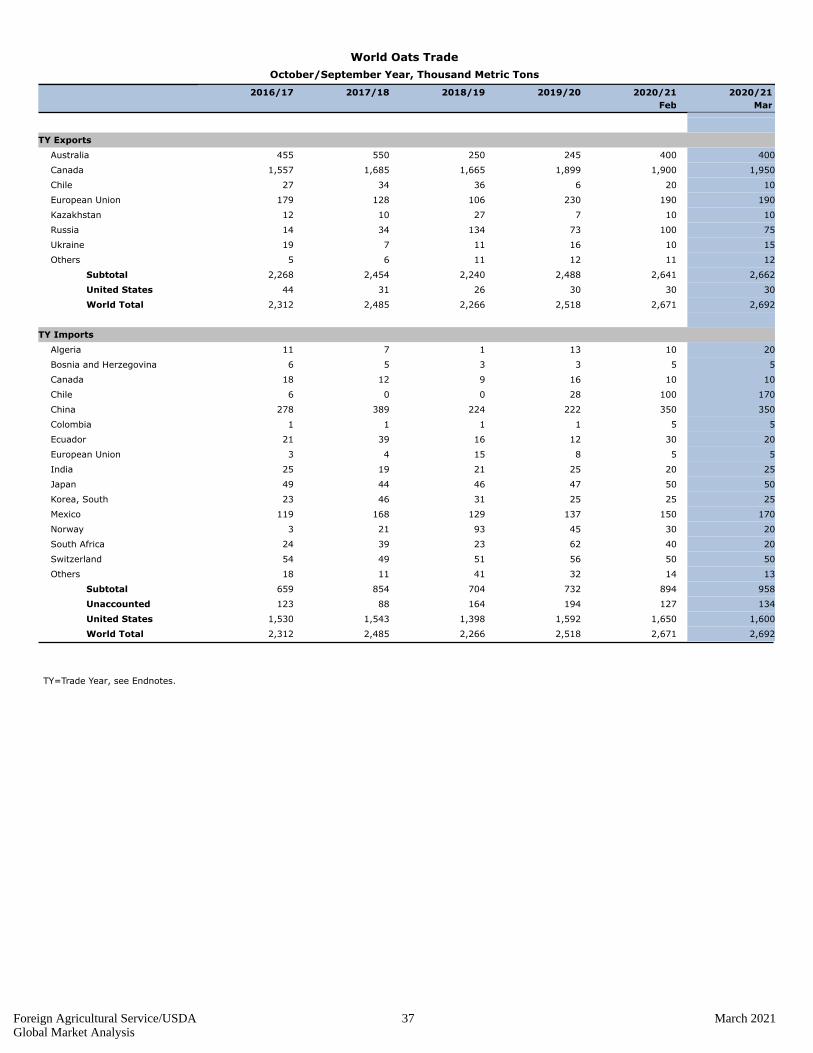
World Oats Trade
October/September Year, Thousand Metric Tons
2016/17 2017/18 2018/19 2019/20 2020/21
Feb
2020/21
Mar
none
TY Exports
400400245250550455 Australia
1,9501,9001,8991,6651,6851,557 Canada
10206363427 Chile
190190230106128179 European Union
10107271012 Kazakhstan
75100731343414 Russia
15101611719 Ukraine
1211121165 Others
2,6622,6412,4882,2402,4542,268 Subtotal
303030263144 United States
2,6922,6712,5182,2662,4852,312 World Total
none
TY Imports
2010131711 Algeria
553356 Bosnia and Herzegovina
10101691218 Canada
17010028006 Chile
350350222224389278 China
551111 Colombia
203012163921 Ecuador
5581543 European Union
252025211925 India
505047464449 Japan
252525314623 Korea, South
170150137129168119 Mexico
20304593213 Norway
204062233924 South Africa
505056514954 Switzerland
131432411118 Others
958894732704854659 Subtotal
13412719416488123 Unaccounted
1,6001,6501,5921,3981,5431,530 United States
2,6922,6712,5182,2662,4852,312 World Total
TY=Trade Year, see Endnotes.
Foreign Agricultural Service/USDA 37 March 2021Global Market Analysis
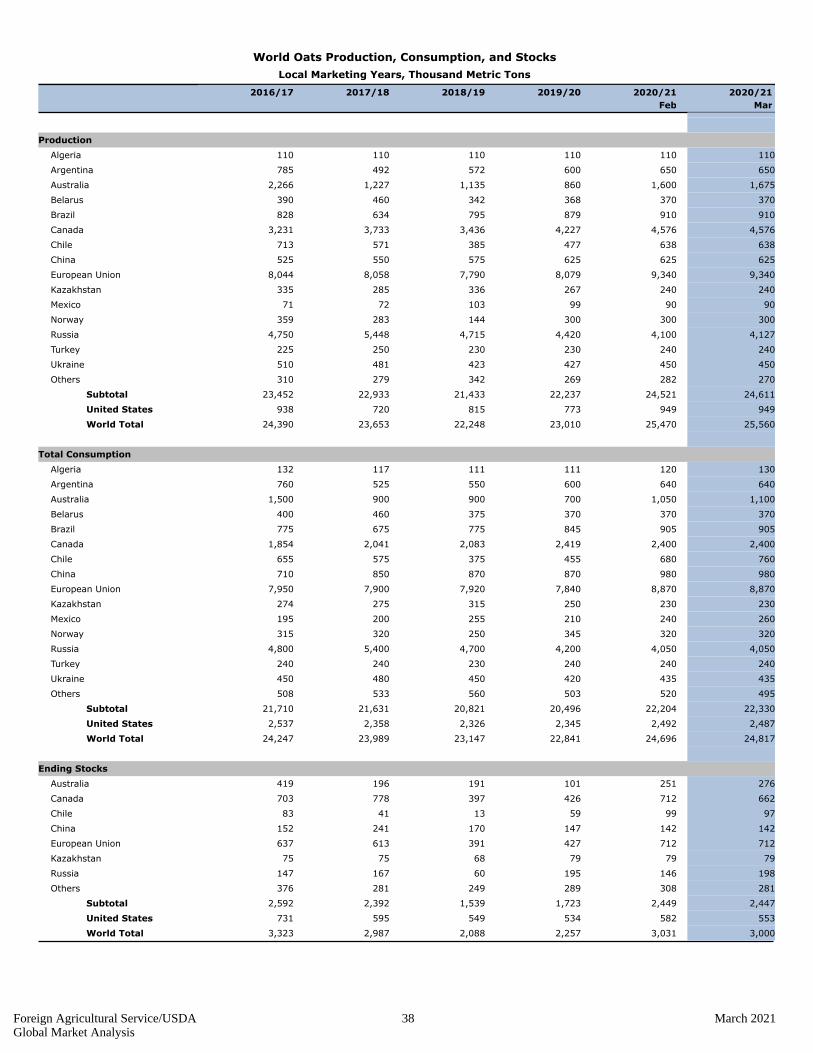
World Oats Production, Consumption, and Stocks
Local Marketing Years, Thousand Metric Tons
2016/17 2017/18 2018/19 2019/20 2020/21
Feb
2020/21
Mar
none
Production
110110110110110110 Algeria
650650600572492785 Argentina
1,6751,6008601,1351,2272,266 Australia
370370368342460390 Belarus
910910879795634828 Brazil
4,5764,5764,2273,4363,7333,231 Canada
638638477385571713 Chile
625625625575550525 China
9,3409,3408,0797,7908,0588,044 European Union
240240267336285335 Kazakhstan
9090991037271 Mexico
300300300144283359 Norway
4,1274,1004,4204,7155,4484,750 Russia
240240230230250225 Turkey
450450427423481510 Ukraine
270282269342279310 Others
24,61124,52122,23721,43322,93323,452 Subtotal
949949773815720938 United States
25,56025,47023,01022,24823,65324,390 World Total
none
Total Consumption
130120111111117132 Algeria
640640600550525760 Argentina
1,1001,0507009009001,500 Australia
370370370375460400 Belarus
905905845775675775 Brazil
2,4002,4002,4192,0832,0411,854 Canada
760680455375575655 Chile
980980870870850710 China
8,8708,8707,8407,9207,9007,950 European Union
230230250315275274 Kazakhstan
260240210255200195 Mexico
320320345250320315 Norway
4,0504,0504,2004,7005,4004,800 Russia
240240240230240240 Turkey
435435420450480450 Ukraine
495520503560533508 Others
22,33022,20420,49620,82121,63121,710 Subtotal
2,4872,4922,3452,3262,3582,537 United States
24,81724,69622,84123,14723,98924,247 World Total
none
Ending Stocks
276251101191196419 Australia
662712426397778703 Canada
979959134183 Chile
142142147170241152 China
712712427391613637 European Union
797979687575 Kazakhstan
19814619560167147 Russia
281308289249281376 Others
2,4472,4491,7231,5392,3922,592 Subtotal
553582534549595731 United States
3,0003,0312,2572,0882,9873,323 World Total
Foreign Agricultural Service/USDA 38 March 2021Global Market Analysis
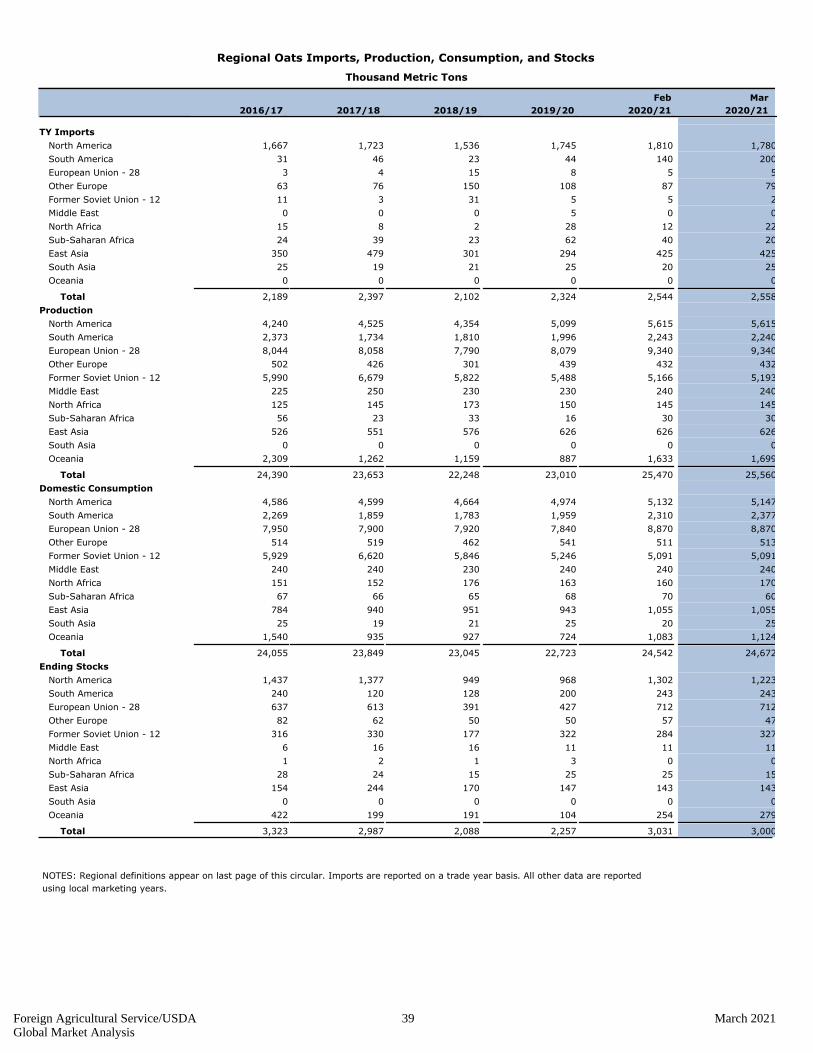
Regional Oats Imports, Production, Consumption, and Stocks
Thousand Metric Tons
2016/17 2017/18 2018/19 2019/20
Feb
2020/21
Mar
2020/21
TY Imports none
1,667 North America 1,723 1,536 1,745 1,810 1,780
31 South America 46 23 44 140 200
3 European Union - 28 4 15 8 5 5
63 Other Europe 76 150 108 87 79
11 Former Soviet Union - 12 3 31 5 5 2
0 Middle East 0 0 5 0 0
15 North Africa 8 2 28 12 22
24 Sub-Saharan Africa 39 23 62 40 20
350 East Asia 479 301 294 425 425
25 South Asia 19 21 25 20 25
0 Oceania 0 0 0 0 0
2,189 Total 2,397 2,102 2,324 2,544 2,558
Production none
4,240 North America 4,525 4,354 5,099 5,615 5,615
2,373 South America 1,734 1,810 1,996 2,243 2,240
8,044 European Union - 28 8,058 7,790 8,079 9,340 9,340
502 Other Europe 426 301 439 432 432
5,990 Former Soviet Union - 12 6,679 5,822 5,488 5,166 5,193
225 Middle East 250 230 230 240 240
125 North Africa 145 173 150 145 145
56 Sub-Saharan Africa 23 33 16 30 30
526 East Asia 551 576 626 626 626
0 South Asia 0 0 0 0 0
2,309 Oceania 1,262 1,159 887 1,633 1,699
24,390 Total 23,653 22,248 23,010 25,470 25,560
Domestic Consumption none
4,586 North America 4,599 4,664 4,974 5,132 5,147
2,269 South America 1,859 1,783 1,959 2,310 2,377
7,950 European Union - 28 7,900 7,920 7,840 8,870 8,870
514 Other Europe 519 462 541 511 513
5,929 Former Soviet Union - 12 6,620 5,846 5,246 5,091 5,091
240 Middle East 240 230 240 240 240
151 North Africa 152 176 163 160 170
67 Sub-Saharan Africa 66 65 68 70 60
784 East Asia 940 951 943 1,055 1,055
25 South Asia 19 21 25 20 25
1,540 Oceania 935 927 724 1,083 1,124
24,055 Total 23,849 23,045 22,723 24,542 24,672
Ending Stocks none
1,437 North America 1,377 949 968 1,302 1,223
240 South America 120 128 200 243 243
637 European Union - 28 613 391 427 712 712
82 Other Europe 62 50 50 57 47
316 Former Soviet Union - 12 330 177 322 284 327
6 Middle East 16 16 11 11 11
1 North Africa 2 1 3 0 0
28 Sub-Saharan Africa 24 15 25 25 15
154 East Asia 244 170 147 143 143
0 South Asia 0 0 0 0 0
422 Oceania 199 191 104 254 279
3,323 Total 2,987 2,088 2,257 3,031 3,000
NOTES: Regional definitions appear on last page of this circular. Imports are reported on a trade year basis. All other data are reported
using local marketing years.
Foreign Agricultural Service/USDA 39 March 2021Global Market Analysis
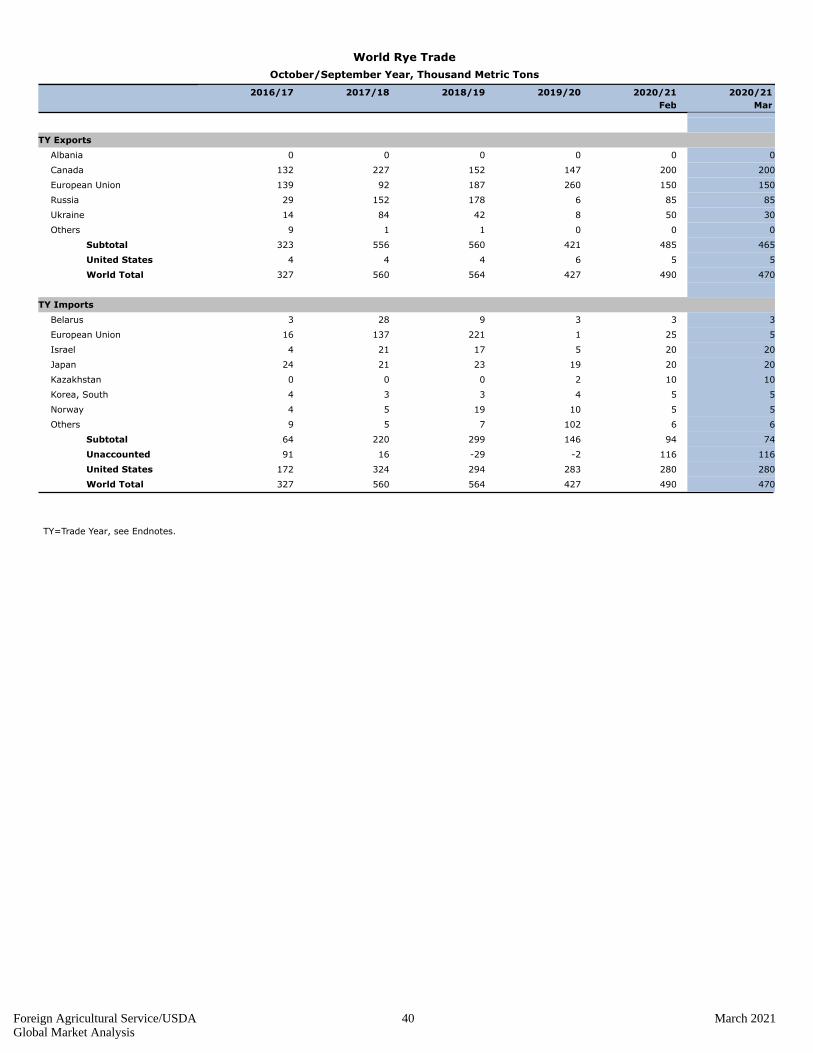
World Rye Trade
October/September Year, Thousand Metric Tons
2016/17 2017/18 2018/19 2019/20 2020/21
Feb
2020/21
Mar
none
TY Exports
000000 Albania
200200147152227132 Canada
15015026018792139 European Union
8585617815229 Russia
30508428414 Ukraine
000119 Others
465485421560556323 Subtotal
556444 United States
470490427564560327 World Total
none
TY Imports
3339283 Belarus
525122113716 European Union
2020517214 Israel
202019232124 Japan
10102000 Kazakhstan
554334 Korea, South
55101954 Norway
66102759 Others
749414629922064 Subtotal
116116-2-291691 Unaccounted
280280283294324172 United States
470490427564560327 World Total
TY=Trade Year, see Endnotes.
Foreign Agricultural Service/USDA 40 March 2021Global Market Analysis
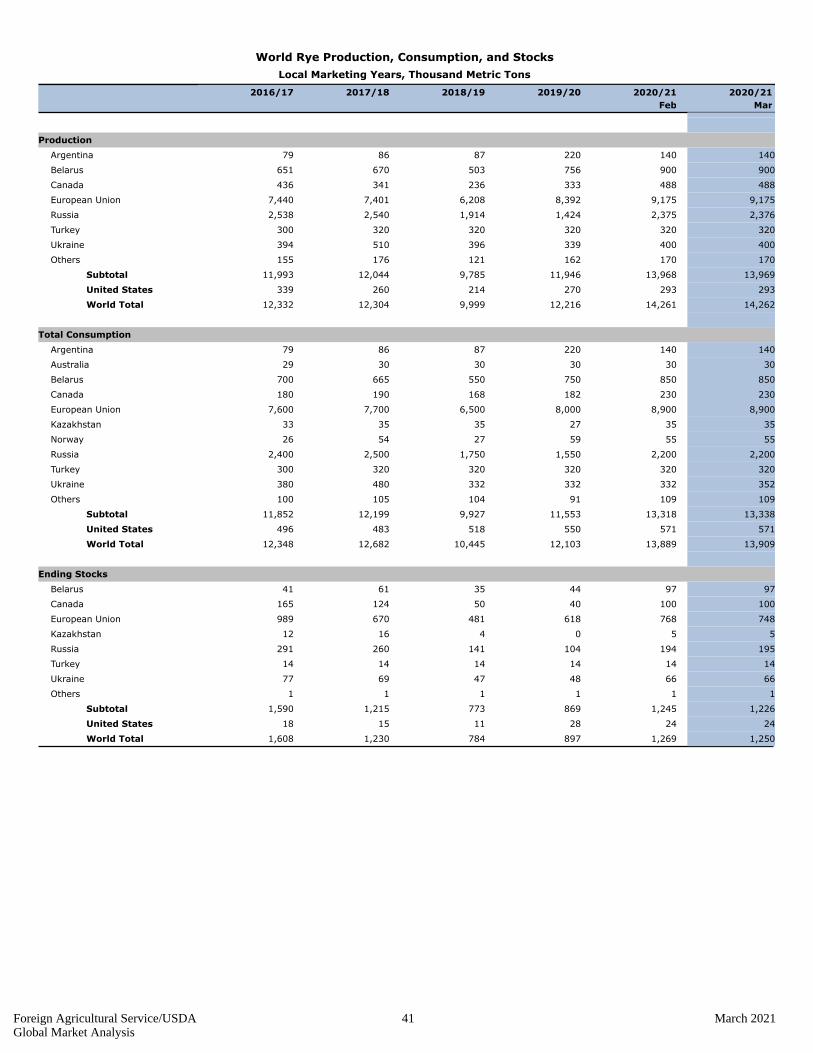
World Rye Production, Consumption, and Stocks
Local Marketing Years, Thousand Metric Tons
2016/17 2017/18 2018/19 2019/20 2020/21
Feb
2020/21
Mar
none
Production
140140220878679 Argentina
900900756503670651 Belarus
488488333236341436 Canada
9,1759,1758,3926,2087,4017,440 European Union
2,3762,3751,4241,9142,5402,538 Russia
320320320320320300 Turkey
400400339396510394 Ukraine
170170162121176155 Others
13,96913,96811,9469,78512,04411,993 Subtotal
293293270214260339 United States
14,26214,26112,2169,99912,30412,332 World Total
none
Total Consumption
140140220878679 Argentina
303030303029 Australia
850850750550665700 Belarus
230230182168190180 Canada
8,9008,9008,0006,5007,7007,600 European Union
353527353533 Kazakhstan
555559275426 Norway
2,2002,2001,5501,7502,5002,400 Russia
320320320320320300 Turkey
352332332332480380 Ukraine
10910991104105100 Others
13,33813,31811,5539,92712,19911,852 Subtotal
571571550518483496 United States
13,90913,88912,10310,44512,68212,348 World Total
none
Ending Stocks
979744356141 Belarus
1001004050124165 Canada
748768618481670989 European Union
55041612 Kazakhstan
195194104141260291 Russia
141414141414 Turkey
666648476977 Ukraine
111111 Others
1,2261,2458697731,2151,590 Subtotal
242428111518 United States
1,2501,2698977841,2301,608 World Total
Foreign Agricultural Service/USDA 41 March 2021Global Market Analysis
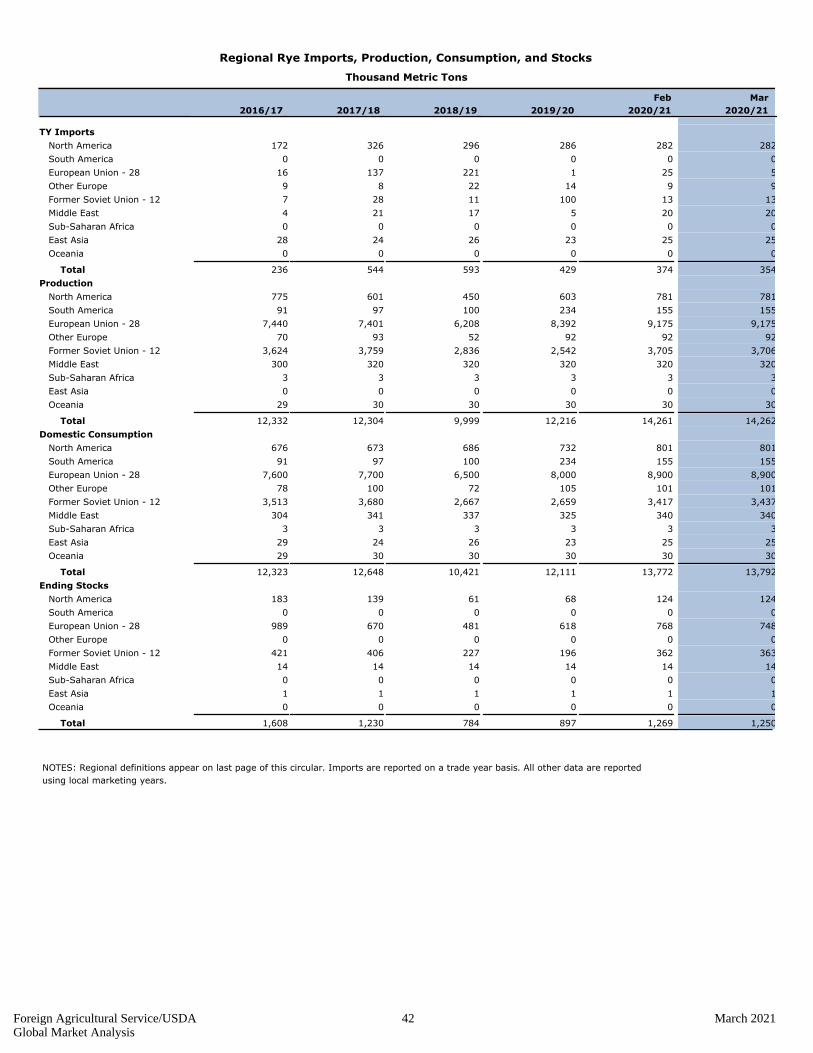
Regional Rye Imports, Production, Consumption, and Stocks
Thousand Metric Tons
2016/17 2017/18 2018/19 2019/20
Feb
2020/21
Mar
2020/21
TY Imports none
172 North America 326 296 286 282 282
0 South America 0 0 0 0 0
16 European Union - 28 137 221 1 25 5
9 Other Europe 8 22 14 9 9
7 Former Soviet Union - 12 28 11 100 13 13
4 Middle East 21 17 5 20 20
0 Sub-Saharan Africa 0 0 0 0 0
28 East Asia 24 26 23 25 25
0 Oceania 0 0 0 0 0
236 Total 544 593 429 374 354
Production none
775 North America 601 450 603 781 781
91 South America 97 100 234 155 155
7,440 European Union - 28 7,401 6,208 8,392 9,175 9,175
70 Other Europe 93 52 92 92 92
3,624 Former Soviet Union - 12 3,759 2,836 2,542 3,705 3,706
300 Middle East 320 320 320 320 320
3 Sub-Saharan Africa 3 3 3 3 3
0 East Asia 0 0 0 0 0
29 Oceania 30 30 30 30 30
12,332 Total 12,304 9,999 12,216 14,261 14,262
Domestic Consumption none
676 North America 673 686 732 801 801
91 South America 97 100 234 155 155
7,600 European Union - 28 7,700 6,500 8,000 8,900 8,900
78 Other Europe 100 72 105 101 101
3,513 Former Soviet Union - 12 3,680 2,667 2,659 3,417 3,437
304 Middle East 341 337 325 340 340
3 Sub-Saharan Africa 3 3 3 3 3
29 East Asia 24 26 23 25 25
29 Oceania 30 30 30 30 30
12,323 Total 12,648 10,421 12,111 13,772 13,792
Ending Stocks none
183 North America 139 61 68 124 124
0 South America 0 0 0 0 0
989 European Union - 28 670 481 618 768 748
0 Other Europe 0 0 0 0 0
421 Former Soviet Union - 12 406 227 196 362 363
14 Middle East 14 14 14 14 14
0 Sub-Saharan Africa 0 0 0 0 0
1 East Asia 1 1 1 1 1
0 Oceania 0 0 0 0 0
1,608 Total 1,230 784 897 1,269 1,250
NOTES: Regional definitions appear on last page of this circular. Imports are reported on a trade year basis. All other data are reported
using local marketing years.
Foreign Agricultural Service/USDA 42 March 2021Global Market Analysis