regional rural banks in maharashtra state - … 5 issue 2, february 2018 issn: 2394-4404 to make...
TRANSCRIPT

Page 363 www.ijiras.com | Email: [email protected]
International Journal of Innovative Research and Advanced Studies (IJIRAS)
Volume 5 Issue 2, February 2018
ISSN: 2394-4404
Regional Rural Banks In Maharashtra State - Performance
Evaluation Of Regional Rural Banks Of Maharashtra State Using
CAMEL Method
Suneet Sureshchandra Kopra
Research Scholar, Singhania University, Pacheri Bari,
Jhunjhunu, Rajasthan State, India
Dr Anurag Shrivastava
PhD, MBA Marketing, D Y Patil University School of
Management, Navi Mumbai
I. INTRODUCTION
Regional Rural Banks were established under the
provisions of an Ordinance passed on 26 September 1975 and
the RRB Act, 1976 to provide sufficient banking and credit
facilities for agriculture and other rural sectors. These were set
up on the recommendations of The Narasimham Working
Group during the tenure of Indira Gandhi's government with a
view to include rural areas into economic mainstream since
that time about 70% of the Indian Population was of Rural
Orientation. The development process of RRBs started on 2
October 1975 with the forming of the first RRB i.e. the
Prathama Bank. Also on 2 October 1975 five regional rural
banks were set up with a total authorised capital of 100
crores, which later increased to 500 crores. The Regional
Rural Banks were owned by the Central Government , the
State Government and the Sponsor Bank who held shares in
the ratios of 50% - 15% - 35%.
The following are major functions of these rural financial
institutions:
To take banking to the doorsteps of the rural masses
particularly in areas without banking facilities.
To mobilize rural savings and canalize them for
supporting productive activities in the rural areas.
Abstract: The Regional Rural Banks were established “with a view to developing the rural economy by providing, for
the purpose of development of agriculture, trade, commerce, industry and other productive activities in the rural areas,
credit and other facilities, particularly to small and marginal farmers, agricultural labourers, artisans, and small
entrepreneurs and for matters connected there with and incidental thereto”. The necessity of rural finance was felt to
provide protection & reliance to rural people who rely highly on informal source of finance like moneylenders, landlords
& traders etc. but they exploit farmers and small entrepreneurs by charging exorbitant rate of interest & force farmers to
sell their product at low price to them. Rural people also face the risk of unpredictable production of crops due to high
dependency on monsoon. The problems of finance suffer from lack of seeds, fertilizers, water supply and other facilities
which lead to rural ineptness.
Rural bank are providing finance to the weaker sections of society like small farmers, rural artisans, small producers,
rural labourers etc, to provide finance to cooperative societies, primary credit societies, Agricultural marketing societies,
Enhance & Improve banking facilities to semi urban, rural& other untapped market. The Regional Rural Banks help the
rural people to come out from the financial problems and secured the financial assistance to agriculture in India.
The study concentrated on Vidharbha Gramin Bank and Maharashtra Gramin Bank situated in Maharashtra to
provide financial support to agriculture and performance of the bank in various Identified potential areas. This bank
focused on the rural development, reaching the uncovered and being farmer friendly.
Keywords: RRB, Rural India, Economic development, Rural Economy, NABARD

Page 364 www.ijiras.com | Email: [email protected]
International Journal of Innovative Research and Advanced Studies (IJIRAS)
Volume 5 Issue 2, February 2018
ISSN: 2394-4404
To make available cheaper institutional credit to the
weaker sections of society, (who are to be the only clients
of these banks?).
To generate employment opportunities in the rural areas.
To bring down the cost of providing credit in rural areas.
To encourage small business and rural artisans.
Figure 1
The number of RRB in India as on 31st March 2016 were
56, with a network of 19000+ branches covering 642+ districts
in 26 states and UT of Puducherry and 120 Million customers.
Under PMJDY RRBs opened 23.7 million A/Cs churning
Rs 1700 crore in banks.
II. RESEARCH METHODOLOGY
The required data of the selected bank for a period of FY
2013-16 have been collected from the respective Banks
Finance, Planning, Treasury and Recovery departments,
published audited annual reports by the bank. So, collected
data analyzed with help of statistical tools to understand the
achievement done against the target assigned to RRB by their
respective sponsor bank.
III. LIMITATIONS OF THE STUDY
Period of Study: FY 2013-2016 (Last 3 FYs) .
Only some of key performance indicators are considered.
But, however, other indicators can be covered in future
research work.
Indian financial system has passed through second
generation reforms by giving emphasis on individual up
gradation, strengthening internal system, attention to different
prudential norms like capital adequacy, containment of NPA
and systemic improvements towards effecting credit delivery
system. It can be done only through proper supervisory and
regulatory mechanism. The CAMEL Methodology has been
developed and practiced by the North American bank
regulators to assess the financial and managerial soundness of
US commercial banks. Subsequently Basel committee on
banking supervision (BCBS) has been created in 1974 and
they also accept the CAMEL as uniform financial institution
rating system to evaluate and monitor the banks. In India is
adapting the Basel I & II norms in total so has to ensure the
better financial standing of own banks & financial Institutions.
CAMEL FRAMEWORK
"CAMEL" refers to the eight components of a bank's
financial condition Viz., Capital adequacy, Asset quality,
Management Efficiency, Earnings Quality, Liquidity,
Technology, Government Policy and Human Resources
characters of a commercial bank. CAMEL is basically a ratio-
based model for evaluating the performance of the banks
periodically.
Various ratios forming this model have been explained
individually and collectively. In the present study, the ratios
relating to capital adequacy, asset quality, management
efficiency, earning quality and liquidity has been found out.
Technology, government policy and human resources played
fundamental and supportive role for other components of this
model.
IV. OBJECTIVE OF THE STUDY
To study the Eight (8) Components of the CAMEL Model
with description are listed below and analysis along with
findings has be established on the performance evaluation.
Capital Adequacy,
Asset Quality,
Management efficiency,
Earning quality,
Technology,
Government policy,
Liquidity and
Human resources.
C- CAPITAL ADEQUACY
Capital base of financial institutions facilitates depositors
in forming their risk perception about the institutions. The
most widely used indicator of capital adequacy is capital to
risk-weighted assets ratio (CRWA). According to Bank
Supervision Regulation Committee (The Basle Committee) of
Bank for International Settlements, a minimum 9 percent
CRWA is required. Capital adequacy determines how well
financial institutions can cope with shocks to their balance
sheets. Thus, it is useful to track capital-adequacy ratios that
take into account the most important financial risks (foreign
exchange, credit, and interest rate risks) by assigning risk
weightings to the institution„s assets.
A – ASSET QUALITY
Asset quality determines the healthiness of financial
institutions against loss of value in the assets. The weakening
value of assets, being prime source of banking problems,
directly pour into other areas, as losses are eventually written-
off against capital, which ultimately expose the earning
capacity of the institution. The asset quality is gauged in
relation to the level and severity of non-performing assets,
adequacy of provisions, recoveries, distribution of assets etc.

Page 365 www.ijiras.com | Email: [email protected]
International Journal of Innovative Research and Advanced Studies (IJIRAS)
Volume 5 Issue 2, February 2018
ISSN: 2394-4404
Popular indicators include Gross NPA to Gross Advances
Ratio, Net NPA to Net Advances Ratio, Total Investments to
Total Assets Ratio and Net NPAs to Total Assets Ratio.
M – MANAGEMENT EFFICIENCY
Management of financial institution is generally evaluated
in terms of capital adequacy, asset quality, earnings and
profitability, liquidity and risk sensitivity ratings. In addition,
performance evaluation includes compliance with set norms,
ability to plan and react to changing circumstances, technical
competence, leadership and administrative ability of the bank.
Sound management is one of the most important factors
behind financial institutions‟ performance. Indicators of
quality of management, however, are primarily applicable to
individual institutions, and cannot be easily aggregated across
the sector.
E – EARNING ABILITY
Earnings and profitability, the prime source of increase in
capital base, is related with regards to interest rate policies and
adequacy of provisioning. Further, it also helps to support
present and future operations of the institutions. Good
earnings and profitability of banks reflects the ability to
support present and future operations. Specifically, this
determines the capacity to absorb losses, finance its
expansion, pay dividends to its shareholders, and build up an
adequate level of capital.
L – LIQUIDITY
An adequate liquidity position refers to a situation, where
institution can obtain sufficient funds, either by increasing
liabilities or by converting its assets quickly at a reasonable
cost. It is, therefore, generally assessed in terms of overall
assets and liability management, as mismatching gives rise to
liquidity risk. The term liquidity is used in various ways, all
relating to availability of, access to, or convertibility into cash.
An institution is said to have liquidity if it can easily meet its
needs for cash either because it has cash on hand or can
otherwise raise or borrow cash.
T – TECHNOLOGY
The technology deployed in a banks or financial
institutions affects its operational efficiency and determines its
competitive position. It must be comparable with the
standards.
Bank should analyze the level of information technology
and its integration within the departments of the bank or
financial institutions. The Banks should monitor the endeavors
of the bank for constant up-gradation of the technology.
G – GOVERNMENT POLICY
In addition to the above, government policy also affects
the operational efficiency for the industry in general and the
government owned public sector banks in particular. This is
because banks In India acts as a vehicle to fulfill the economic
needs, social requirements and obligation of the Government.
Government support plays a crucial role in case of banks and
is duly factored in analysis. Also the extent of ownership also
affects the capital raising ability of a bank in the future.
H – HUMAN RESOURCE
The people in a banks or financial institutions are the
most valuable resources and the major driving force for
successes and failures. The quality of human resources
employed by a bank greatly affects its performance. Bank
should analyze the recruitment process and training standard
of the financial institution, which reflects the quality of the
people in the organization. The banks should analyze their
ability to guidance and support to operations staff,
compensation package as per the industry norms and attrition
rate in the financial institution, which reflect the satisfaction
among the employees and staff towards their work and
organization. Besides the ratios of CAMEL Model, some
additional ratios were introduced in CAMEL framework for in
depth analysis of performance of RRBs of Gujarat State.
The list of the ratios used for the present study is stated
below.
Capital Adequacy
1. Capital Adequacy Reserve Ratio
2. Debt Equity Ratio
3. Net Advances to Total Assets Ratio
4. Government Securities to Total
Investments Ratio
Asset Quality
1. Gross NPA to Gross Advances Ratio
2. Net NPA to Net Advances Ratio
3. Total Investments to Total Assets
Ratio
4. Net NPAs to Total Assets Ratio
5. Percentage Change in net NPAs
Management
Efficiency
1. Total Advances to Total Deposits
Ratio
2. Business per Employee
3. Business per Branch
4. Profit per Employee
5. Profit per Branch
6. Return on Net Worth
Earning Quality
1. Operating Profit to Average Working
Fund
2. Net Interest Margin to Average
Working Fund
3. Return on Average Working Fund
4. Interest Income to Total Income
5. Interest Income to Average Working
Fund
6. Basic EPS
7. Diluted EPS
Liquidity
Liquidity
1. Liquid Assets to Total Asset
2. Government Securities to Total
Assets
3. Liquid Assets to Demand Deposits

Page 366 www.ijiras.com | Email: [email protected]
International Journal of Innovative Research and Advanced Studies (IJIRAS)
Volume 5 Issue 2, February 2018
ISSN: 2394-4404
4. Liquid Assets to Total Deposits
5. Approved Securities to Total Assets
Table 4.1
A. CAPITAL ADEQUACY RATIOS
Capital adequacy has emerged as one of the major
indicators of the financial health of a banking entity. It is
important for a bank to maintain depositors‟ confidence and
preventing the bank from going bankrupt. Capital is seen as a
cushion to protect depositors and promote the stability and
efficiency of financial system around the world. Capital
Adequacy reflects the overall financial condition of the banks
and also the ability of management to meet the need for
additional capital. It also indicates whether the bank has
enough capital to absorb unexpected losses. The following
ratios measure Capital Adequacy.
a. CAPITAL ADEQUACY RESERVE RATIO
The banks are required to maintain the capital adequacy
ratio (CAR) as specified by RBI from time to time. As per the
latest RBI norms, the banks in India should have a CAR of
9%. It is arrived at by dividing the sum of Tier-I, Tier-II and
Tier-III capital by aggregate of risk weighted assets (RWA).
Symbolically, CAR= (Tier-I + Tier-II + Tier-III)/RWA. Tier-I
capital includes equity capital and free reserves. Tier-II capital
comprises of subordinate debt of 5-7 years tenure, revaluation
reserves, hybrid debt capital instruments and undisclosed
reserves and cumulative perpetual preference shares. Tier-III
capital comprises of short-term subordinate debt. Risk
weighted assets means fund based assets such as cash, loans,
investments and other assets. Degrees of credit risk expressed
as percentage weights have been assigned by RBI to each such
assets. Subordinate debts are fully paid up instruments which
is unsecured debt. It should be subordinated to the claims of
other creditors. This means that the bank's holder's claims for
their money will be paid at last in order of preference as
compared with the claims of other creditors of the bank. The
bonds should not be redeemable at the option of the holders.
This means the repayment of bond value will be decided only
by the issuing bank. Higher the CAR makes the bank stronger.
Financial Years VKGB MGB Mean
2013-14 9.73% 10.88% 10.31%
2014-15 9.94% 10.92% 10.43%
2015-16 9.21% 10.44% 9.83%
Mean 9.63% 10.75% 10.19%
Source: Annuals reports of VKGB and MGB, NABARD
reports
Table 1.1: Capital Adequacy Ratio (CRAR)
From the above analysis in was revealed that capital
adequacy ratio of VKGB was 9.73% in 2014 which declined
to 9.21% in 2016 because of heavy growth of risk weighted
assets and low growth of total capital. The growth of capital
based on tier 1 and tier 2 capitals. Tier 1 and tier 2 capital
includes Paid up capital, share capital Deposits, Statutory
Reserves, Reserves and Surplus, General Provisions on
Standard Assets etc. Bank cannot use reserve and surplus
without the permission of RBI. Generally, banks do not
disturb the share capital deposits. Statutory reserves are based
on profit and variation in profit reflected the change in the
ratio. Provision on standard assets also based on advances and
the proportion of advances to total assets tends to decline
which may be another reason for reduction in capital adequacy
ratio. The average capital adequacy ratio of VKGB stood at
9.63%.
The capital adequacy ratio of MGB was 10.88% in 2006
which declined to 10.44% in 2016. The reason may be for the
variation in the ratio is heavy / low growth of risk weighted
assets and / or heavy / low growth of capital and improvement
or reduction in profit. The average capital adequacy ratio of
SGB stood at 10.75%.
The average capital adequacy ratio of Maharashtra region
was 10.31% in 2014 which improved to 10.43% in 2015 but
declined in 2016 to 9.83% because of reduction in the ratios of
both the two banks. It was improved in 2015 which was
10.43% due to improvement of the ratio of VKGB and MGB.
The average ratio of the Maharashtra region of the study
period stood at 10.19%. Although, all the banks have
maintained minimum level 9% and performed above the
bench mark ratio but the management should think about
reduction in the ratio and should take necessary steps to
improve the capital adequacy ratio.
b. DEBT EQUITY RATIO
Debt Equity Ratio of the bank indicates the risk
proportion created against net worth. Debt-Equity ratio is
arrived at by dividing total borrowings by shareholders‟ Net
Worth. Net Worth of the bank includes equity capital, share
capital deposit and reserves and surplus.
Generally equity capital and share capital deposit remains
stable in the capital structure of the bank but the balance of
reserve and surplus may change because reserves and surplus
includes statuary reserves which is based on profit, general
reserves and the balance of profit. Changes in reserves and
surplus affect the balance of net worth which ultimately
affects the debt equity ratio.
Financial Years VKGB MGB Mean
2013-14 234.55% 285.27% 259.91%
2014-15 254.84% 325.49% 290.17%
2015-16 152.30% 257.16% 204.73%
Mean 213.90% 289.31% 251.60%
Source: Annuals reports of VKGB and MGB, NABARD
reports
Table 1.2: Statement showing Debt Equity Ratio (In %)
With the view to the above analysis it was noticed that the
debt-equity ratio of VKGB was 234.55% in 2014 which
improved and increased to 254.84% in 2015 because of
12.35% increase in borrowings against only 11.37% increase
in net worth. It was dropped to 152.30% in 2016 because of
6.47% decline in borrowings may be due to heavy repayment
of borrowings and 10.83% increase in net worth. The another
probable reason for heavy increase in borrowings may be the
borrowing for sponsor banks or scheme of NABARD for
finance at lower rate for priority sector lending or for certain
specific object. In FY 2016, the net worth increased by
10.83% which grown less compare to FY 2015 could be the
other reason for heavy increase in debt equity ratio.

Page 367 www.ijiras.com | Email: [email protected]
International Journal of Innovative Research and Advanced Studies (IJIRAS)
Volume 5 Issue 2, February 2018
ISSN: 2394-4404
The debt-equity ratio of MGB was 285.27% in 2014
which improved to 325.49% due to 13.02% improvement in
borrowings and 11.41% improvement in net worth. It dropped
to 257.16% in 2016 because of repayment of a part of
borrowings which was declined by 9.58% and net worth
improved by 12.12%. It was improved to 325.49% in 2014
because of huge increase in borrowings due to specific scheme
of NABARD and from sponsor bank. The average debt equity
ratio of MGB was 289.31% highest compare to other bank.
It was observed that the average debt ratio in FY 2016
was 204.73% which was the lowest as compared during the
study period because the growth rate of borrowings of both the
banks was less compared to other 2 FYs. The average debt
equity ratio of the Maharashtra region stood at 251.60%
because of high debt equity ratio of both the banks during the
period of the study.
c. NET ADVANCES TO TOTAL ASSETS
The ratio of net advances to total assets indicates the
percentage of total assets deployed as credit which needed for
maximization of interest income as well as to reach to rural
mass. Net Advances arrived after making provision which is
specified by RBI on advances. Total assets mean the total of
all assets shown in the balance sheet of the bank.
Financial Years VKGB in % MGB in % Mean in %
2013-14 55.32 47.31 51.31
2014-15 54.03 44.37 49.20
2015-16 60.36 47.83 54.09
Mean 56.57 46.50 51.53
Source: Annuals reports of VKGB and MGB, NABARD
reports
Table 1.3: Statement showing Ratio of Net Advances to Total
Assets. (in %)
In accordance with the above ratio it was noticed that the
ratio of net advances to total assets of VKGB was 55.32% in
2014 which declined to 54.03% in 2015 because of the growth
rate of advances was less than the growth rate of total assets
which implied that the bank could not convert the portion of
total asset in to advances productively. In the year 2016 the
ratio was improved to 60.36% due to more growth rate of
advances against the growth rate of total assets. It can be said
that whenever the growth rate of advances was more than the
growth of total assets, the ratio of net advances to total assets
was improved and when growth rate of advances was less than
the growth of total assets, the ratio tends to decline. The
average ratio of VKGB during the 3 years study period was
56.57%.
The ratio of MGB ratio of net advances to total assets of
VKGB was 47.31% in 2014 which declined to 44.37 in FY
2014-15 because of the growth rate of advances was less than
the growth rate of total assets. In FY 2015-16, the ratio stood
at 47.83% with high margin because of the growth rate of
advances was more than the growth rate of total assets.
It should be noted that the ratio of net advances to total
assets of MGB shown more ups and downs in the study period
due to some reasons but the variations was not more than 2%
to 4% which shows the effective performance of the bank
compare to other banks because the level of this ratio was
more than the level of the ratio of VKGB. The average ratio of
VKGB during the 3 years study period was 46.50%.
It should be clear that the performance of VKGB towards
this ratio was effective compare to MGB. The average ratio of
VKGB was 56.57% compared to 46.50% of MGB. The
average ratio of Maharashtra region stood at 51.53% because
of the lower average of MGB.
d. GOVERNMENT SECURITIES TO TOTAL
INVESTMENTS
This ratio shows the risk involved in a bank‟s investment.
Government Securities are generally, statutory liquid
investments and considered as the most safe debt instrument,
which, as a result, carries the lowest return. Since government
securities are risk-free, the higher the Government Securities
to investment ratio, the lower the risk involved in a bank‟s
investment. It is arrived at by dividing the amount invested in
government securities by net investments which are
considered net of provisions on the investments.
Financial Years VKGB MGB Mean
2012-13 52.43 95.38 73.90
2013-14 55.77 81.29 68.53
2014-15 56.67 86.34 71.50
2015-16 70.14 71.87 71.01
Mean 58.75 83.72 71.24
Source: Annual reports of VKGB and MGB, NABARD reports
Table 1.4: Statement showing Ratio % of Government
Securities to Total Investments (In %)
Financial Years VKGB MGB Mean
2013-14 44.23 18.71 31.47
2014-15 43.33 13.66 28.50
2015-16 29.86 28.13 28.99
Mean 39.14 20.17 29.65
Source: Annual reports of VKGB and MGB, NABARD reports
Table 1.5: Statement showing Ratio of Non-SLR Investments
Securities to Total Investments (in %)
Bank has to invest some portion of deposits in
government securities with specified percentage as per the
guidelines of RBI issued by time to time. The variations in
deposits and the policy of bank to invest in non SLR
investments and other approved securities affects the ratio of
government securities to net investments.
Reduction in the proportion of non SLR investments to
total assets reduced the risk but on the other hand bank has
reduced the opportunity for earnings at higher rate because the
rate of non SLR investments are more than the rates applicable
in government securities.
The ratio of Government securities to total investment of
VKGB in FY 2013 was 52.43% which improved on yearly
basis and stood at 56.67% in Fy 2015-16. The average ratio
was 58.75% over the period of study.On the other hand, it has
been observed that the non SLR of VKGB also decreased over
period of the study. In the beginning of the study, in FY 2014 ,
it was 44.23% which reduced to 43.33% in FY 2015 and then
to 29.86% in FY 2016. The average ratio of Non SLR during
the period of study was 39.14% which means VKGB invested
40% of its investment to gain the earnings at higher rate.

Page 368 www.ijiras.com | Email: [email protected]
International Journal of Innovative Research and Advanced Studies (IJIRAS)
Volume 5 Issue 2, February 2018
ISSN: 2394-4404
The ratio of Government securities to total investment of
MGB in FY 2013 was 95.38% which declined on yearly basis
and stood at 71.87% in FY 2015-16. The average ratio was
82.72% over the period of study. On the other hand, the ratio
of non slr investment shows ups and downs over the period of
the study. In FY 2014, it was 18.71% which reduced to
13.66% in FY 2015. In FY 2016, the ratio increased to
28.13%. the average ratio of MGB over the period of study
was 20.17% which means MGB invested more in Govt
securities to protect their investment and earned lower
earnings as well.
The average ratio of SLR investment of Maharashtra
region of the study period stood at 71.24% and for non SLR
investment at 29.65%.
Sr No Capital Adequacy Ratios Ranks
VKGB MGB
1 Capital Adequacy Reserve Ratio 2 1
2 Debt Equity Ratio 1 2
3 Net Advances to Total Assets 1 2
4
Government Securities to Total
Investments 2 1
Total of the Ranks on First Position 2 2
Source: Annuals reports of VKGB and MGB, NABARD
reports
Table 4.1.1: Rank Based Performance Analysis of “Capital
Adequacy” Ratios
According to the rank based analysis of “Capital
Adequacy” ratios, it was examined that out of the four ratios
of Capital Adequacy, VKGB and MGB, both has got first
position in two ratios. MGB performed well in CAR and
Government securities and VKGB performed well in Debt
equity and net advances ratio.
B. ASSETS QUALITY
The quality of assets is an important parameter to gauge
the degree of financial strength. The prime motto behind
measuring the assets quality is to ascertain the component of
Non-Performing Assets (NPAs) as a percentage of the total
assets. This indicates what types of advances the bank has
made to generate interest income. The following ratios are
necessary to assess assets quality:
a. GROSS NPA TO GROSS ADVANCES
An asset, including a leased asset, becomes non-
performing when it ceases to generate income for the bank. A
non-performing asset (NPA) is a loan or an advance where;
Interest and / or installment of principal remain overdue
for a period of more than 90 days in respect of a term
loan. “Overdue” means any amount due to the bank under
any credit facility is overdue if it is not paid on the due
date fixed by the bank.
The account remains „out of order‟ in respect of an
Overdraft/Cash Credit. An account should be treated as
'out of order' if the outstanding balance remains
continuously in excess of the sanctioned limit/drawing
power. In cases where the outstanding balance in the
principal operating account is less than the sanctioned
limit/drawing power, but there are no credits continuously
for 90 days as on the date of Balance Sheet or credits are
not enough to cover the interest debited during the same
period, these accounts should be treated as 'out of order
The bill remains overdue for a period of more than 90
days in the case of bills purchased and discounted,
The installment of principal or interest thereon remains
overdue for two crop seasons for short duration crops,
The installment of principal or interest thereon remains
overdue for one crop season for long duration crops,
The amount of liquidity facility remains outstanding for
more than 90 days, in respect of a securitization
transaction undertaken in terms of guidelines on
securitization dated 1st February 2006.
In respect of derivative transactions, the overdue
receivables representing positive mark to market value of
a derivative contract, if these remain unpaid for a period
of 90 days from the specified due date for payment.
Banks should, classify an account as NPA only if the
interest due and charged during any quarter is not serviced
fully within 90 days from the end of the quarter. Gross NPAs
are the sum total of all loan assets that are classified as NPAs
as per RBI guidelines as on Balance Sheet date. Gross NPA
reflects the quality of the loans made by banks. It consists of
all the non-standard assets like as sub-standard, doubtful, and
loss assets. The Gross NPAs are measured as a percentage of
Gross Advances. The lower the ratio, the better is the quality
of advances.
Financial Years VKGB MGB Mean
2013-14 6.02% 4.52% 5.27%
2014-15 6.46% 4.90% 5.68%
2015-16 7.91% 4.40% 6.16%
Mean 6.80% 4.61% 5.70%
Source: Annual reports of VKGB and MGB, NABARD reports
Table 1.6: Statement showing Gross NPA to Gross Advances
Ratio (in %)
The ratio of VKGB was 6.02% in the beginning of the
study i.e. FY 2014 which was increased to 6.46% in FY 2015
and 7.91% in FY 2016 due to improvement in gross NPA
against the growth of gross advances over the period of the
study. The average ratio stood at 6.80% over the period of the
study.
The ratio of MGB was 4.52% in the beginning of the
study i.e. FY 2014 which was increased marginally to 4.90%
in FY 2015 and reduced to 4.40% in FY 2016 . the increasing
trend was observed due to improvement in gross NPA against
the growth of gross advances. The declined in the ratio was
because of reduction of gross NPA and marginal growth in
gross advances. The average ratio over the period of the study
stood at 4.61%.
The average ratio of Maharashtra stood at 5.70%.
b. NET NPA TO NET ADVANCES
Net NPAs are those type of NPAs in which the bank has
deducted the provision regarding NPAs. Provisions for net
NPA and provisions on gross advances for determination of
net advances also forms a part in measurement of the ratio of
net NPA to net advances. Net NPA shows the actual burden of
banks. Since in India, bank balance sheets contain a huge
Page 369 www.ijiras.com | Email: [email protected]
International Journal of Innovative Research and Advanced Studies (IJIRAS)
Volume 5 Issue 2, February 2018
ISSN: 2394-4404
amount of NPAs and the process of recovery and write off of
loans is very time consuming, the provisions the banks have to
make against the NPAs according to the central bank
guidelines, are quite significant. That is why the difference
between gross and net NPA is quite high. The lower the ratio,
the better is the quality of advances.
Financial Years VKGB MGB Mean
2013-14 3.90% 2.70% 3.30%
2014-15 3.57% 2.30% 2.94%
2015-16 4.02% 1.17% 2.60%
Mean 3.83% 2.06% 2.94%
Source: Annuals reports of VKGB and MGB, NABARD
reports
Table 1.7: Statement showing Net NPA to Net Advances Ratio
(in %)
During the period of study, the ratio of net NPA to net
advances of VKGB was 3.90% in 2014 which was dropped to
3.57% in 2015 due to effective growth of net advances and
reduction in net NPA. It was improved in 2016 and reached to
4.02% due to huge improvement in net NPA and the lower
growth of net advances against last year. The average ratio
observed during the period of study was 3.83%.
During the period of study, the ratio of net NPA to net
advances of MGB was 2.70% in 2014 which was dropped to
2.30% in 2015 due to effective growth of net advances and
reduction in net NPA. It further dropped to 1.17% in 2016 due
to huge decline in net NPA and remarkable growth of net
advances. The average ratio observed during the period of
study was 3.83%.
Looking the average ratio of the study period of both the
banks it was noticed that the average ratio of MGB was lower
in comparison to VKGB mainly due to the ratio of every year
of the study period of SGB was lower than the VKGB.
The average ratio of the study period of Maharashtra
region stood at 2.94%.
c. TOTAL INVESTMENTS TO TOTAL ASSETS
Total investments to total assets ratio indicates the extent
of deployment of assets in investment. This ratio is used as a
tool to measure the percentage of total assets locked up in
investments. It is arrived at by dividing total investments by
total assets. Total investments for this purpose the investment
shown in the balance sheet which are net of provisions and
total assets means the total of assets which is shown in the
balance sheet. A higher ratio means that the bank has
conservatively kept a high cushion of investments to guard
against NPAs.
Financial Years VKGB MGB Mean
2013-14 17.25 16.59 16.92
2014-15 19.96 25.47 22.72
2015-16 21.65 28.69 25.17
Mean 19.62 23.58 21.60
Source: Annual reports of VKGB and MGB, NABARD reports
Table 1.8: Statement showing Ratio of Total Investments
to Total Assets (In %)
During the period of study and in consonance with the
above analysis it was observed that the ratio of VKGB was
17.25% in 2014 which was constantly increased year by year.
The increase in the proportion of investments to total assets
mainly because of the proportion of net advances to total
assets was constantly increased and bank has invested less
amount in balance with other banks. The average ratio
observed during the period of study was 19.62%.
The ratio of MGB was 16.59% in 2014 which was
improved up to 28.69% in FY 2016 constantly because of the
major proportion of total assets locked in net advances and the
proportion of balance with banks was dropped. The average
ratio observed during the period of study was 23.58%.
By taking the view of average ratio of the study period it
was noticed that the ratio of MGB was more than VKGB
because of the high ratio of MGB was recorded during the
period of the study in comparison of VKGB which reflected in
the improvement of the ratio.
The average ratio of the study period of Maharashtra
region stood at 21.60%.
d. NET NPAS TO TOTAL ASSETS
Net NPA to total asset ratio is a measure of the quality of
total assets which indicates the portion of total assets retained
in net NPA. Lower ratio indicates the efficiency of banks with
respect of employment of total assets. The lower ratio
indicates the better the quality of total assets.
Financial Years VKGB MGB Mean
2013-14 2.16 1.33 1.75
2014-15 1.93 1.07 1.50
2015-16 2.43 0.59 1.51
Mean 2.17 1.00 1.58
Source: Annual reports of VKGB and MGB, NABARD reports
Table 1.9: Statement showing Ratio of Net NPAs to Total
Assets (In %)
The ratio of net NPA to total assets of VKGB was laid
down between 2.16% and 2.43% because of movement in net
NPAs against the growth of total assets.
The ratio of BGB was 1.33%in 2014 which was reduced
to 1.07% in 2015 due to huge decline in net NPA against the
good growth of total assets. It further lowered down to 0.59%
in 2016 because of heavy reduction in net NPA with effective
growth of total assets. Lower the ratio, better for the bank.
The average ratio observed during the study period of
VKGB was 2.17% and MGB was 1.00% which was lowest
when compared with VKGB in each year of the study period.
The average ratio of the Maharashtra state stood at 1.58%.
e. PERCENTAGE CHANGE IN NET NPAS
This measure gives the movement in Net NPAs in relation
to Net NPAs in the previous year. The higher the reduction in
Net NPAs levels, the better is for the bank. It is given by the
formula:
% Change in Net NPAs = (Net NPAs at the end of the
year – Net NPAs at the beginning of the year)/Net NPAs at the
beginning of the year.
Financial Years VKGB MGB Mean
2013-14 56.68 69.30 62.99
2014-15 80.80 66.35 73.58
2015-16 82.59 42.55 62.57
Mean 73.36 59.40 66.38
Source: Annual reports of VKGB and MGB, NABARD reports

Page 370 www.ijiras.com | Email: [email protected]
International Journal of Innovative Research and Advanced Studies (IJIRAS)
Volume 5 Issue 2, February 2018
ISSN: 2394-4404
Table 2.0: Statement showing Ratio of Percentage Change in
Net NPAs (In %)
From the view point of the above ratios it was noticed that
VKGB shown increase in change in percentage of NPAs
during the period of study due to heavy increase in net NPA. It
varied between 56.68% in 2014 to 82.59% in 2016.
In case of MGB, the percentage change in net NPAs
declined during the period of study because of the high
reduction in Net NPAs levels of MGB. It was 69.30% in 2014
and reduced to 42.55% in 2016.
The average ratio of VKGB over the period of the study
was 73.36% and MGB stood at 59.40%.
The average percentage change in net NPAs of
Maharashtra region stood at 66.38% because of huge average
ratio of VKGB.
Sr No Asset Quality Ratios Ranks
VKGB MGB
1 Gross NPA to Gross Advances 2 1
2 Net NPA to Net Advances 2 1
3
Total Investments to Total
Assets 2 1
4 Net NPAs to Total Assets 2 1
5 Percentage Change in Net NPAs 2 1
Total of the Ranks on First Position 0 5
With reference to the rank based analysis of “Asset
Quality” ratios, it was examined that out of the five ratios of
Asset Quality, MGB got first position having five ratios.
VKGB got second position having zero ratio. It can be said
that the performance of MGB was remarkable from the view
point of asset quality ratios.
C. MANAGEMENT EFFICIENCY
Management efficiency is another vital component of the
CAMEL Model that ensures the survival and growth of a
bank. The ratios in this segment involve subjective analysis
and efficiency of management. The management of the bank
takes crucial decisions depending on the risk perception. It
sets vision and goals for the organization and sees that it
achieves them.
This parameter is used to evaluate management efficiency
as to assign premium to better quality banks and discount
poorly managed ones. The ratios used to evaluate management
efficiency are described below.
a. TOTAL ADVANCES TO TOTAL DEPOSITS
The ratio measures the efficiency of management in
converting the deposits available with the bank into high
earning advances. it is also known as credit deposit ratio. Total
deposits include demand deposits, savings deposits, term
deposits and deposits of other banks.
Total advances include all advances which are before the
provisions on advances and denoted as gross advances.
Financial Years VKGB MGB Mean
2013-14 70.56 70.12 70.34
2014-15 69.12 71.86 70.49
2015-16 73.86 71.54 72.70
Mean 71.18 71.17 71.18
Source: Annual reports of VKGB and MGB, NABARD reports
Table 2.1: Statement showing Ratio of Total Advances to Total
Deposits (Credit - Deposit Ratio in %)
During the period of the study, the ratio of advances to
deposits of VKGB was 70.56% in 2014 which declined
marginally to 69.12% in 2015 due to more growth rate of
deposits compared to the growth rate of advances. In 2016, the
ratio of advances to deposits was 73.86% due to more growth
rate of advances compare to the growth rate of deposits. The
average ratio of advances to deposits during the period of
study stood at 71.18%.
During the period of the study, the ratio of advances to
deposits of MGB was 70.12% in 2014 which increased
marginally to 71.86% in 2015 due to more growth rate of
advances compared to the growth rate of deposits. In 2016, the
ratio of advances to deposits increased to 71.54% due to more
growth rate of deposits compare to the growth rate of
advances. The average ratio of advances to deposits during the
period of study stood at 71.17%.
It was noticed that advances to deposit ratio of VKGB
was more than MGB in each year whether it was increased or
decreased. The average ratio of Maharashtra region for the
year 2014 was 70.34% which improved to 70.49% in 2015
and 72.70% in 2016 subsequently. This was because of good
performance of VKGB over the period of study. The average
ratio of Gujarat region of the study period stood at 71.18%.
b. BUSINESS PER EMPLOYEE
Per Employee Business measures the efficiency of all the
employees of a bank in generating business for the bank. It is
arrived at by dividing the total business by total number of
employees. The term “Business” means the sum of total
deposits and total gross advances in a particular year.
Financial Years VKGB MGB Mean
2013-14 4.62 5.26 4.94
2014-15 4.66 5.86 5.26
2015-16 4.97 6.83 5.90
Mean 4.75 5.98 5.37
Source: Annual reports of VKGB and MGB, NABARD reports
Table 2.2: Statement showing Ratio of Business per employee
(in Lacs)
Financial Years VKGB MGB Mean
2013-14 0.65 5.84 3.24
2014-15 0.75 11.37 6.06
2015-16 6.70 16.54 11.62
Mean 2.70 11.25 6.97
Source: Annual reports of VKGB and MGB, NABARD reports
Table 2.3: Statement showing Growth % Business per
employee (In %)
The percentage of growth of business per employee of
VKGB was 0.65% in 2014 because of the growth of 11.33%
in business and % of employees by 10.67%.The growth % of
business per employee was increased marginally in 2015 to
0.75% % due to marginal increase in growth rate of business
by 11.39% and increase in growth rate of employees to
11.30%. It was further increased to 6.70% in 2016 because of
normal improvement in business by 10.87% but decrease in
number of employees to 10.19%. It was noticed that the
growth rate of business tends to decline year by year and
number of employees not reduced firmly because of the new
Page 371 www.ijiras.com | Email: [email protected]
International Journal of Innovative Research and Advanced Studies (IJIRAS)
Volume 5 Issue 2, February 2018
ISSN: 2394-4404
branches are opened or other reason may be. The average
business per employee stood at 4.75 lacs per employee with
average growth rate of 2.70%
The percentage of growth of business per employee of
MGB was 5.84% in 2014 because of the growth of 11.03% in
business and % of employees by 10.65%.The growth % of
business per employee was increased in 2015 to 11.37% %
due to increase in growth rate of business by 12.16% and
increase in growth rate of employees to 10.76%. It was further
increased to 16.54% in 2016 because of normal improvement
in business by 12.13% but decrease in number of employees to
10.49%. It was noticed that the growth rate of business tends
to decline year by year and number of employees not reduced
firmly because of the new branches are opened or other reason
may be. The average business per employee stood at 5.98 lacs
per employee with average growth rate of 11.25%.
The average growth rate of the study period of VKGB
was lowest in comparison to MGB because of fall in the
growth rate of business and heavy growth rate of total staff.
The average business per employee of Maharashtra region
stood at 5.37 lacs and the growth rate of business per
employee of Maharashtra region stood at 5.37%.
c. BUSINESS PER BRANCH
Business per Branch shows the efficiency of the branches
of the bank towards deployment of credit and deposit
mobilization. It is arrived with the help of dividing business by
number of branches. Increase in business per branch indicates
effective performance of branches.
Financial Years VKGB MGB Mean
2013-14 17.18 18.45 17.81
2014-15 18.81 21.38 20.09
2015-16 20.00 25.74 22.87
Mean 18.66 21.86 20.26
Source: Annual reports of VKGB and MGB, NABARD reports
Table 2.4: Statement showing Business per Branch (in Crore)
Financial Years VKGB MGB Mean
2013-14 10.40 10.95 10.68
2014-15 10.95 11.59 11.27
2015-16 10.63 12.04 11.34
Mean 10.66 11.53 11.09
Source: Annuals reports of VKGB and MGB, NABARD
reports
Table 2.5: Statement showing % Growth in Business per
Branch (In %)
Pursuant to the above analysis of growth of percentage of
business and branches of VKGB, it was examined that the
growth rate of business per branch of VKGB was 10.40%
because of 13.30% increase in business and only 2.72%
increase in branches. It was increased to 10.95% in 2015
because of growth rate of business was increased marginally
to 13.86% whereas the branches was increased by 3.97%. The
growth % in business per branch was decreased to 10.63% due
to decrease in % growth in business volume to 8.72% and
number of branches to 2.23%. The average growth % was
10.66% during the period of study.
Pursuant to the above analysis of growth of percentage of
business and branches of MGB, it was examined that the
growth rate of business per branch of MGB was 10.95%
because of 10.29% increase in business and only 7.69%
increase in branches. In FY 2015, it was increased to 11.59%
because of growth rate of business was increased to 19.85%
whereas the branches was increased by 3.44%. The growth %
in business per branch was increased to 12.04% due to
increase in % growth in business volume to 22.25% and
number of branches to 1.53%. The average growth % was
11.53% during the period of study.
The average growth rate of business per branch of the
study period of Maharashtra region stood at 11.09%.
d. PROFIT AFTER TAX PER EMPLOYEE
This ratio measures the efficiency of employees at the
branch level. It also gives valuable inputs to assess the real
strength of a bank‟s branch network. It is arrived at by
dividing the Profit after Tax (PAT) earned by the bank by the
total number of employees. The higher the ratio, higher is the
efficiency of the management.
Particulars
FY 2013-
14
FY 2014-
15
FY
2015-16 Mean
VKGB 1.85 1.95 2.68 2.16
MGB 2.68 4.21 4.36 3.75
Mean 2.27 3.08 3.52 2.95
Source: Annual reports of VKGB and MGB, NABARD reports
In line with the above ratio it was examined that the profit
after tax per employee of VKGB was Rs. 1.85 lacs in 2014
which was increased to Rs. 1.95 lacs in 2015 because of
18.60% increase in growth in profit and 13.01% increase in
the staff strength. It was reached to Rs.2.68 lacs in 2016
because of 31.36% decline in profit and 1.89% increase in the
staff. The average net profit during the period of study was
observed at 2.16 lacs.
In the year 2014, profit per employee of MGB was Rs
2.68 lacs and started to constant improvement in 2015 and
2016 because of effective growth in profit and reduction in the
total staff. The average net profit per employee stood at 3.75
lacs over the period of the study.
The average profit after tax of Maharashtra region of the
study period stood at Rs. 2.95 lacs.
e. PROFIT AFTER TAX PER BRANCH
Profit of the bank is the combination of the profit derived
by the branches. This ratio explains the spread of total profit
among the total branches of the bank. Movement in profit and
in number of branches affects the ratio of profit after tax per
branch. Higher ratio is desirable by the bank for strong
financial position.
Particulars FY 2013-14 FY 2014-15 FY 2015-16 Mean
VKGB 6.89 7.86 5.28 6.68
MGB 9.40 15.35 16.46 13.73
Mean 5.28 11.60 10.87 10.21
Source: Annual reports of VKGB and MGB, NABARD reports
Table 2.7: Statement showing Net profit after Tax (In Lacs)
The profit after tax per branch of VKGB was Rs. 6.89
lacs in 2014 which further increased to 7.86 lacs in 2007
because of 18.60% increase in profit and 3.97% improvement
in number of branches. Further in FY 2016, it declined to Rs.
5.28 lacs because of decline in net profit and less number of

Page 372 www.ijiras.com | Email: [email protected]
International Journal of Innovative Research and Advanced Studies (IJIRAS)
Volume 5 Issue 2, February 2018
ISSN: 2394-4404
branches. The average net profit per branch over the period of
study stood at Rs.6.68 lacs.
In case of MGB, profit per branch was Rs. 9.40 lacs in
2014 which was bounce to Rs. 15.35 lacs in 2015 because of
68.95% increase in profit with 3.44% reduction in total
branches. It was improved and reached to Rs. 16.46 lacs
because of 8.88 % growth in profit and 1.53% increase in
number of branches. The average net profit per branch over
the period of the study stood at 13.73 lacs.
With the view of average profit per branch, the average
profit per branch of MGB was more than VKGB because of in
majority of the years of the study period; profit per branch of
MGB was more in comparison of VKGB. The average profit
per branch of the study period of Maharashtra region was
stood at Rs. 10.21 lacs which was affected by the lower
average amount of VKGB.
f. RETURN ON NET WORTH (RETURN ON EQUITY)
Generally, the variations in profit affected by so many
reasons i.e., changes in combination of advances, investments
and balance with other banks and also because of changes in
the growth rate of deposits and borrowings. Besides that, the
rates of advances, deposits, investments and borrowings may
vary time to time plays vital role for variations in the profit.
Changes in the balances of operating expenses, provisions and
other expenses are other factors for the variations in the profit.
On the other hand, net worth of the bank includes equity
capital, share capital deposit and reserves and surplus.
Generally equity capital and share capital deposit remains
sTable in the capital structure of the bank but the balance of
reserve and surplus may change because reserves and surplus
includes statuary reserves which is based on profit, general
reserves and the balance of profit. Changes in reserves and
surplus affect the balance of net worth.
Financial Years VKGB MGB Mean
2013-14 11.31 11.52 11.42
2014-15 11.37 11.41 11.39
2015-16 10.83 5.38 8.11
Mean 11.17 9.44 10.30
Source: Annual reports of VKGB and MGB, NABARD reports
Table 2.8: Statement showing Return on Net Worth (in %)
The ratio of return on net worth of VKGB was 11.31% in
2014 which improved to 11.37% in 2015 because of 18.60%
increase in net profit and 13.71% increase in net worth. It
declined to 10.83% in 2016 due to negative growth of 31.36%
in the profit and decrease in networth growth to 8.27% from
the previous FY. The average return on networth over the
period of study stood at 11.17% for VKGB.
For MGB, In the year 2006, the ratio of return on net
worth was 11.52% which was declined to 11.41% in 2015 due
to 68.95% increase in profit and decrease in net worth to
14.10% It was further declined in 2016 to 8.11% because of
effective less growth in net profit and negative growth in net
worth as well. The average return ration stood at 9.44% during
the period of the study.
It was found that the average ratio of return on net worth
of VKGB was more than MGB. The average return ratio of
Maharashtra state stood at 10.30%.
Sr No Asset Quality Ratios Ranks
VKGB MGB
1 Total Advances to Total Deposits Ratio 2 1
2 Business per Employee 2 1
3 Business per Branch 2 1
4 Profit per Employee 2 1
5 Profit per Branch 2 1
6 Return on Net Worth 1 2
Total of the Ranks on First Position 1 5
Table 4.1.3: Rank Based Performance Analysis of
“Management Efficiency” Ratios
With reference to the rank based analysis of
“Management Efficiency” ratios, it was examined that out of
the six ratios of management efficiency, MGB got first
position having five ratios. VKGB got second position having
one ratio. It can be said that the performance of MGB was
noticeable from the view point of management efficiency
ratios.
D. EARNINGS
Earning quality reflects quality of a bank‟s profitability
and its ability to earn consistently. The quality of earning is a
very important criterion that determines the ability of a bank
to earn consistently, going into the future. It basically
determines the profitability of the bank. It also explains the
sustainability and growth in earnings in the future. This
parameter gains importance in the light of the argument that
much of bank‟s income is earned through non-core activities
like investments, treasury operation, and corporate advisory
service and so on. The following ratios try to assess the quality
of income in terms of income generated by core activity-
income from lending operation.
a. OPERATING PROFIT TO AVERAGE WORKING
FUNDS
Operating profit for this purpose the profit before the
provisions. Average working fund is the total resources
employed by a bank. It is weekly average of total assets or
liabilities during a year. The better utilization of funds will
result in higher operating profit. Thus, this ratio will indicate
how a bank has employed its working funds in generating
profit. Operating profit may fluctuate not only because of the
variations in the growth rate of deposits, borrowings,
investments and advances and their rates but also affected by
the variations in operating expenses and other incomes.
Financial Years VKGB MGB Mean
2013-14 1.05 1.67 1.36
2014-15 1.22 1.68 1.45
2015-16 1.37 1.41 1.39
Mean 1.22 1.59 1.4
Source: Annual reports of VKGB and MGB, NABARD reports
Table 2.9: Statement showing % Operating Profit to Average
Working Funds (in %)
The ratio of operating profit to average working fund of
VKGB was 1.05% in 2014 which was increased to 1.22% in
2015 due to higher growth rate of operating profit in
comparison of growth rate of average working fund. It was
increased to 1.37% in 2016 because of 16.86% increase in

Page 373 www.ijiras.com | Email: [email protected]
International Journal of Innovative Research and Advanced Studies (IJIRAS)
Volume 5 Issue 2, February 2018
ISSN: 2394-4404
operating profit and 4.53% increase in average working fund.
The average % Operating Profit to Average Working Funds
stood at 1.22% over period of the study.
The ratio of operating profit to average working fund of
MGB was 1.67% in 2014 which was marginally increased to
1.68% in 2015 due to higher growth rate of operating profit in
comparison of growth rate of average working fund. It was
decreased to 1.41% in 2016 because of negative growth rate of
-0.56% in operating profit and 19.25% increase in average
working fund. The growth rate of average working fund was
improved but with declining rate may be because of slow
growth rate of average deposit and / or average borrowings.
The average % Operating Profit to Average Working Funds
stood at 1.59% over period of the study.
It was further noticed that the average ratio of MGB was
highest compare to VKGB by the reason may be the bank has
utilize the average working fund effectively to generate
operating profit. While evaluating the ratio it should be keep
in mind that besides the proportion of borrowings, deposits,
advances and investments, other incomes and operating
expenses also performs important role to arrive operating
profit.
The average ratio of Maharashtra region of the study
period stood at 1.40%.
b. NET INTEREST MARGIN TO AVERAGE WORKING
FUND
NIM, being the difference between the interest income
and the interest expended as a percentage of average working
fund. It is an important measure of a bank‟s core income
(income from lending operations). A higher spread indicates
the better earnings given the average working fund. Interest
income includes interest on advances, interest on investments
and interest on balance with other banks. Interest expanded
includes interest paid on deposits and interest paid on
borrowings. The proportion of deposits, borrowings and the
proportion of advances, investments and balance with other
banks to total assets and average working fund affect the net
interest margin. Besides that the proportion of term deposits,
term loans, non-SLR investments, the rates of advances, rates
of investments, rates of deposits, rates of borrowings are the
key determinants to arrive net interest margin. Net interest
margin affected by all the factors which are influenced to
interest income and interest paid.
Financial Years VKGB MGB Mean
2013-14 3.90 3.53 3.72
2014-15 3.62 3.44 3.53
2015-16 3.62 3.16 3.39
Mean 3.72 3.37 3.55
Source: Annual reports of VKGB and MGB, NABARD reports
Table 3.0: Statement showing % Net Interest Margin to
Average Working Fund (In %)
Confirming to the above analysis it was noticed that net
interest margin to average working fund ratio of VKGB was
3.90% in 2014 which declined to 3.62% in 2015 because of
10.81% growth of NIM against the growth of 19.47% in
average working fund. It remain constant at 3.62% in 2016
because of low growth rate of NIM compare to the growth rate
of average working fund. The average growth in Net Interest
Margin to Average Working Fund over the period of the study
was 3.72.
The ratio of MGB was 3.53% in 2014 which decline
constantly up to 2016 because of low growth rate of net
interest margin compare to the growth rate of average working
fund.
MGB showed 3.44% ratio in 2015 which further declined
to 3.16 in 2016. The reduction in net interest margin ratio
indicates that the bank has not executed its average working
fund productively in the interest generating assets and/or
interest bearing liabilities. The average ratio of MGB was
3.37% over the period of the study.
The average ratio of Maharashtra region of the study
period stood at 3.55%.
c. RETURN ON AVERAGE WORKING FUND
This ratio measures return on Average Working Fund or
the efficiency in utilization of Average Working Fund. It is
arrived by dividing the profit earned by average working fund.
Higher ratio indicates better utilization of average
working fund in productive assets for generation of profit.
Major portion of profit is based on interest earned and interest
paid which is based on the growth rate of interest bearing
liabilities and interest generating assets and the combination
used by the bank of such assets and liabilities. Besides that,
operating expenses and other incomes are significant
indicators to arrive the profit. The Provisions are the important
factor for the determination of the net profit because operating
profit is before the provisions and net profit is after provision
profit. Hence the difference in the ratio of operating profit to
average working fund and return on average working fund is
affected by provisions. Changes in operating profit and
changes in provisions reflected the ratio of return on average
working fund.
Financial Years VKGB MGB Mean
2013-14 2.37 1.68 2.03
2014-15 1.97 0.88 1.43
2015-16 1.41 1.59 1.50
Mean 1.92 1.39 1.65
Source: Annual reports of VKGB and MGB, NABARD reports
Table 3.1: Statement showing % return on average working
fund (in %)
In accordance with the ratio of return on average working
fund of VKGB it was observed that the return on average
working fund of VKGB was 2.37% in 2014 which declined to
1.97% in 2015 and further to 1.41% in 2016 because of the
difference in the rate of provisions are more than the
difference in the rate of operating profit to average working
fund. It can be said that the return on average working fund
was significantly affected by the provisions. The average ratio
of return on average working fund over the period of the study
was 1.92%.
The ratio of MGB was 1.68% in 2014 which reduced to
0.88% in 2015 due to rate of provisions are more than the
difference in the rate of operating profit to average working
fund. It further increased to 1.59% in 2016 because of the ratio
of operating profit to average working fund was more than the
ratio of provisions to average working fund. The difference in
the rate of operating profit to average working fund was more
Page 374 www.ijiras.com | Email: [email protected]
International Journal of Innovative Research and Advanced Studies (IJIRAS)
Volume 5 Issue 2, February 2018
ISSN: 2394-4404
than the rate of difference in provisions to average working
fund. The average ratio of return on average working fund
over the period of the study was 1.39%.
The difference in the rate of operating profit to average
working fund was more than the rate of difference in
provisions to average working fund. The average ratio of
return on average working fund over the period of the study
was 1.65.
The average return on average working fund of VKGB
was more than MGB because of the ratio of provisions to
average working fund was low. The average ratio of the
Maharashtra region of the study period stood at 0.86%.
d. INTEREST INCOME TO TOTAL INCOME
Interest income is a basic source of revenue for banks.
The interest income to total income ratio indicates the ability
of the bank in generating income from its lending and
investments as well as interest on balance with other banks.
Increase in non-interest income can reduce the ratio.
Financial Years VKGB MGB Mean
2013-14 91.70 94.09 92.89
2014-15 95.12 93.50 94.31
2015-16 95.21 92.49 93.85
Mean 94.01 93.36 93.68
Source: Annual reports of VKGB and MGB, NABARD reports
Table 3.2: Statement showing ratio of Interest Income to Total
Income (in %)
Financial Years VKGB MGB Mean
2013-14 8.30 5.91 7.11
2014-15 4.88 6.50 5.69
2015-16 4.79 7.51 6.15
Mean 5.99 6.64 6.32
Source: Annual reports of VKGB and MGB, NABARD reports
Table 3.3: Statement showing ratio of Other Income to Total
Income (in %)
The ratio of Interest income to total income of VKGB was
91.70% in 2014 which was fluctuate in the range of maximum
95.21% with minor variations because of the ratio of other
incomes to total income non much differed during the study
period. MGB shown 94.09% ratio in 2014 which was dropped
to 92.49% in 2016 due to huge improvement in other incomes
to total income ratio which was 7.51%.
The average ratio of interest income to total income of
VKGB was 94.01% which was more than MGB because of
lower % of other incomes to total income.
The average ratio of Maharashtra region stood at 93.68%
of the study period.
e. INTEREST INCOME TO AVERAGE WORKING
FUND (FINANCIAL RETURN)
The ratio of interest income to average working fund is
arrived by dividing interest incomes with average working
fund. With the help of this ratio it can be understand that how
the bank has efficiently utilize the average working fund in
generation of interest income.
Higher the ratio indicates the better application of average
working fund for maximizing interest income by the bank.
Financial Years VKGB MGB Mean
2013-14 9.00 8.77 8.88
2014-15 9.01 9.11 9.06
2015-16 9.23 8.90 9.06
Mean 9.08 8.93 9.00
Source: Annual reports of VKGB and MGB, NABARD reports
Table 3.4: Statement showing ratio of Interest Income to
Average Working Fund. (in %)
Interest income to average working fund of VKGB was
9.00% in 2014 which was constantly improved up to 2016
because of good growth of interest income compare to the
growth of average working fund.
MGB shown 8.77% ratio in 2014 which was improved to
9.11 in 2015 due to more growth rate of interest income
compare to the growth rate of average working fund. It tends
to fall down in next one year to 8.90% because of the growth
rate of interest income was less than the growth rate of
average working fund.
It was noticed that the average ratio of VKGB was more
than MGB because of DGB has apply its average working
fund in such a way which has created more interest income
compare to MGB. The average ratio of the Maharashtra region
stood at 9.00% of the study period.
f. BASIC EPS
Earnings per share is one of the best tool to measure the
earning quality of the bank. In RRBs, share capital is fixed to
Rs. 300,00,000 of Rs. 100 each for each RRBs. It was not
changed during the study period but the variations in the profit
reflected in the movement of earning per share year to year. It
is arrived by dividing profit before tax to number of shares.
Financial
Years VKGB MGB Mean
Employee per
share ( In Rs)
Employee per
share ( In Rs)
2013-14 148.64 253.64 201.14
2014-15 176.29 428.57 302.43
2015-16 120.93 464.29 292.61
Mean 148.62 382.17 265.39
Source: Annual reports of VKGB and MGB, NABARD reports
Table 3.5: Statement showing Employee per Share (in Rs)
The earning per share of VKGB was Rs. 148.64 in 2014
which was increased to Rs.176.29 in 2015 because of increase
in profit. It was fall to Rs. 120.93 in 2015 due to reduction in
profit.
MGB shown EPS of Rs. 253.64 in 2013 which was
constantly improved up to Rs. 428.57 in FY 2015 and reached
to Rs. 464.27 in FY 2016 because of constant growth in profit.
The average EPS of the study period of MGB was more
than VKGB because of high range of profit recorded in three
years study period.
The average EPS of Maharashtra region of the study
period stood at Rs. 265.39.
Sr No Asset Quality Ratios Ranks
VKGB MGB
1
Operating Profit to Average
Working Fund 2 1
2 Net Interest Margin to Average 1 2
Page 375 www.ijiras.com | Email: [email protected]
International Journal of Innovative Research and Advanced Studies (IJIRAS)
Volume 5 Issue 2, February 2018
ISSN: 2394-4404
Working Fund
3 Return on Average Working Fund 1 2
4 Interest Income to Total Income 2 1
5
Interest Income to Average
Working Fund 1 2
6 Basic EPS 2 1
Total of the Ranks on First Position 3 3
Table 4.1.4: Rank Based Performance Analysis of “Earning
Quality” Ratios
According to the rank based analysis of “Earning Quality”
ratios, it was examined that out of the seven ratios of Earning
Quality, DGB got first position having five ratios. BGB got
second position having two ratios out of the total ratios
examined. SGB does not reached on first position in any ratios
of earning quality. It can be said that DGB performed very
well towards Earning Quality ratios.
E. LIQUIDITY
Liquidity is very important for any organization dealing
with money. For a bank, liquidity is a crucial aspect which
represents its ability to meet its financial obligations. It is of
utmost importance for a bank to maintain correct level of
liquidity, which will otherwise lead to declined earnings.
Banks have to take proper care in hedging liquidity risk, while
at the same time ensuring that a good percentage of funds are
invested in higher return generating investments, so that banks
can generate profit while at the same time provide liquidity to
the depositors. Among a bank‟s assets, cash investments are
the most liquid. A high liquidity ratio indicates that the bank is
more affluent. The ratios suggested to measure liquidity under
CAMEL Model are presented below.
a. LIQUID ASSETS TO TOTAL ASSETS
Liquid Assets include cash in hand, balance with the RBI,
balance with other banks (both in India and abroad), and
money at call and short notice. This ratio is arrived by
dividing liquid assets by total assets. The proportion of liquid
assets to total assets indicates the overall liquidity position of
the bank.
Financial Years VKGB MGB Mean
2013-14 42.30 45.63 43.97
2014-15 34.56 44.43 39.49
2015-16 22.49 38.60 30.55
Mean 33.12 42.89 38.00
Source: Annuals reports of VKGB and MGB, NABARD
reports
Table 3.6: Statement showing ratio of Liquid assets and Total
assets. (in %)
The proportion of liquid assets to total assets of VKGB
was 42.30% in FY 2014 which dropped to 34.56% in 2015
because of increase in the proportion of investments and
advances to total assets.
It further dropped and stood at 22.49% in 2016 due to the
progress of the proportion of investments and advances to total
assets.
The proportion of MGB shown this ratio little bit lower
compare to VKGB because of the major proportion of total
assets were located in advances and investments. It was
45.63% in 2014 which was declined in next two years and
reached to 38.06% because of betterment in the proportion of
investments and advances to total assets.
It can be said that MGB has allocated majority of the total
assets in liquid assets while VKGB has allocated maximum
assets in to advances and investments. Major proportion of
liquid assets to total assets creates less risk and Table income
of interest but on the other hand reduction in the proportion of
advances reduced the opportunity to earn higher interest.
Besides that the basic objective of RRBs to reach rural poor
hence advances must be improve as well as high earning non
SLR investments should not be reduced which can reflect in
reduction of interest income.
The average ratio of MGB was highest compare to VKGB
because of greater part of total assets was located in liquid
assets.
The average ratio of Maharashtra region stood at 38%
during the study period.
b. GOVERNMENT SECURITIES TO TOTAL ASSETS
Government securities are the most liquid and safe
investment. This ratio measures the proportion of risk-free
liquid assets invested in government securities as a percentage
of the assets held by the bank and is arrived by dividing
investment in government securities by the total assets. This
ratio measures the risk involved in the assets held by a bank.
Financial Years VKGB MGB Mean
2013-14 34.17 38.02 36.09
2014-15 38.02 44.81 41.41
2015-16 34.50 34.28 34.39
Mean 35.57 39.03 37.30
Source: Annual reports of VKGB and MGB, NABARD
reports)
Table 3.7: Statement showing ratio of Investment in SLR /
Govt Securities and Total assets. (in %)
The percentage of government securities to total assets of
DGB was 34.17% in 2014 which was increased in 2007 to
38.02% in spite of reduction in the proportion of total
investments to total assets may be for the reason of reduction
in the % of non SLR investments to total investments. It
further declined to 34.50% in FY 2016 because of
considerable decline in the proportion of investments to total
assets. It was continual declined in last two years for the
reason of reduction in percentage of total investments to total
assets.
38.02% of the total assets were settled in government
securities of MGB in 2014. It was increase to 44.81% in FY
2015 and declined to 34.28% in 2016 on the grounds of
constant reduction in percentage of investments to total assets.
It has shown ups and downs during period of the study for the
reason of variations in investments to total assets ratio as well
as the percentage change in non SLR investments to total
assets.
It was noticed that the declining trend was seen in VKGB
for government securities to total assets because of the
reduction in the proportion of investments to total assets while
MGB shown mix trend because of much ups and downs in the
proportion of investments to total assets.

Page 376 www.ijiras.com | Email: [email protected]
International Journal of Innovative Research and Advanced Studies (IJIRAS)
Volume 5 Issue 2, February 2018
ISSN: 2394-4404
The average ratio of government securities to total assets
of Maharashtra region stood at 37.30%.
c. LIQUID ASSETS TO DEMAND DEPOSITS
This ratio measures the ability of a bank to meet the
demand from demand deposits in a particular year. The term
“Demand Deposit” refers to a type of account held at banks
and financial institutions that may be withdrawn at any time
by the customer. The majority of such Demand Deposit
accounts are currents and savings accounts. Demand Deposits
also known as low cost deposit accounts. The ratio arrived at
dividing the liquid assets by total demand deposits. The liquid
assets include cash in hand, balance with the RBI, balance
with other banks, and money at call and short notice.
Financial Years VKGB MGB Mean
2013-14 4.78 4.98 4.88
2014-15 4.29 5.47 4.88
2015-16 3.21 5.16 4.19
Mean 4.09 5.20 4.65
Source: Annual reports of VKGB and MGB, NABARD reports
Table 3.8: Statement showing ratio of Liquid Deposits and
Demand Deposits (in %).
The ratio of liquid assets to demand deposit of VKGB
was 4.78% in 2014 which was reduced to 4.29% in 2015 due
to reduction in the growth of liquid assets compare to the
growth rate of demand deposits. It was dropped in 2016 to
3.21% because of more growth of demand deposits compare
to the growth of liquid assets.
For MGB, it was 4.98% in 2014 and increased to 5.47%
in 2015 because of liquid assets was growth at higher rate
compare to the negative or positive growth rate of demand
deposits.
MGB has shown tremendously high ratio compare to
VKGB during the study period. It was fluctuated but still it
was above the ratio of VKGB because of the margin of the
growth of liquid assets and growth of demand deposits was
very high. It should be noted that the ratio of liquid assets to
total assets of VKGB was low compare to MGB but due to
having lower amount of demand deposit, the ratio of liquid
assets to demand deposits becomes very high.
It can be said that MGB has retained more liquid assets to
meet demand deposit but still it was very high proportion and
bank should take opportunity by investing some part of liquid
assets in high yielding securities or should increase the
accounts of demand deposits to reduce the ratio. The average
ratio of the study period of Maharashtra region stood at
4.65%.
d. LIQUID ASSETS TO TOTAL DEPOSITS
This ratio measures the liquidity available to the
depositors of a bank. Liquid assets include cash in hand,
balance with the RBI, balance with other banks (both in India
and abroad), and money at call and short notice. Total deposits
include demand deposits, term deposits and deposits of other
financial institutions. This ratio help to know that how much
portion of deposits is retain in liquid assets. Higher the ratio
indicates the reduction the proportion of advances and
investments from the total deposits received.
Financial Years VKGB MGB Mean
2013-14 29.85 32.00 30.92
2014-15 23.89 31.93 27.91
2015-16 16.61 27.62 22.11
Mean 23.45 30.51 26.98
Source: Annual reports of VKGB and MGB, NABARD reports
Table 3.9: Statement showing ratio of Liquid Deposits and
Total Deposits (in %)
29.85% of the total deposits was retained as liquid assets
by VKGB in 2014 which was dropped in next two years
because of deposits were grown faster than the growth of
liquid assets and lower growth rate of liquid assets against the
growth rate of deposits.
MGB shown 32% ratio in 2014 and it was dropped in
next two years because of more growth rate of deposits
compare to the growth rate of liquid assets. It was dropped to
27.62% in 2016 because of growth rate of deposits was more
than the growth rate of liquid assets.
It was noticed that the average ratio of VKGB was lower
than MGB because the credit deposit ratio of these two banks
tends to decline and the it was the main reason for increase in
liquid assets because the bank has invested the balance money
apart from advances may invested in liquid assets. The
probable reason for lower ratio of VKGB may be the good
credit deposit ratio.
The average ratio of Maharashtra region stood at 26.98%
of the study period.
e. APPROVED SECURITIES TO TOTAL ASSETS
This ratio is arrived by dividing the total amount invested
in approved securities by total assets. Approved securities are
investments made in the state-associated bodies like electricity
boards, housing boards, and corporation bonds.
Financial Years VKGB MGB Mean
2013-14 1.93 2.07 2.00
2014-15 2.12 2.48 2.30
2015-16 2.17 1.97 2.07
Mean 2.07 2.17 2.12
Source: Annual reports of VKGB and MGB, NABARD reports
Table 4.0: Statement showing ratio of Total assets and
Approved Securities (in %)
The ratio of approved securities to total assets of VKGB
was 1.93% in FY 2014 which was little bit improved to 2.12%
in FY 2015 and further slight increase to 2.17% in FY 2016
due to increase in the proportion of government securities to
total investments, the ratio of other approved securities to total
investments tends to decline VKGB has not invested any
amount in other approved securities.
The ratio of approved securities of MGB was 2.07% in
FY 2014 which increased to 2.48% in FY 2015 due due to
increase in the proportion of government securities to total
investments, the ratio of other approved securities to total
investments tends to decline MGB has not invested any
amount in other approved securities . It declined to 1.97% in
FY 2016 due to decrease in investment in government
securities.
The average ratio of Maharashtra region stood at 2.12%
of the study period.
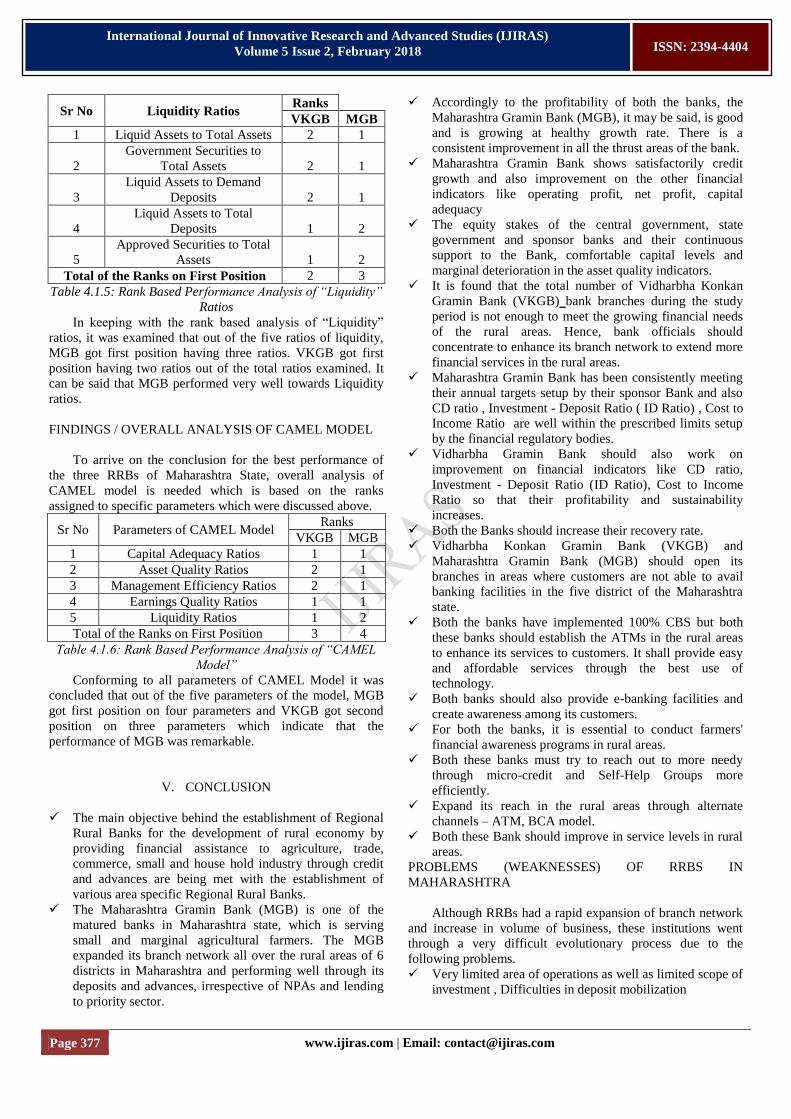
Page 377 www.ijiras.com | Email: [email protected]
International Journal of Innovative Research and Advanced Studies (IJIRAS)
Volume 5 Issue 2, February 2018
ISSN: 2394-4404
Sr No Liquidity Ratios Ranks
VKGB MGB
1 Liquid Assets to Total Assets 2 1
2
Government Securities to
Total Assets 2 1
3
Liquid Assets to Demand
Deposits 2 1
4
Liquid Assets to Total
Deposits 1 2
5
Approved Securities to Total
Assets 1 2
Total of the Ranks on First Position 2 3
Table 4.1.5: Rank Based Performance Analysis of “Liquidity”
Ratios
In keeping with the rank based analysis of “Liquidity”
ratios, it was examined that out of the five ratios of liquidity,
MGB got first position having three ratios. VKGB got first
position having two ratios out of the total ratios examined. It
can be said that MGB performed very well towards Liquidity
ratios.
FINDINGS / OVERALL ANALYSIS OF CAMEL MODEL
To arrive on the conclusion for the best performance of
the three RRBs of Maharashtra State, overall analysis of
CAMEL model is needed which is based on the ranks
assigned to specific parameters which were discussed above.
Sr No Parameters of CAMEL Model Ranks
VKGB MGB
1 Capital Adequacy Ratios 1 1
2 Asset Quality Ratios 2 1
3 Management Efficiency Ratios 2 1
4 Earnings Quality Ratios 1 1
5 Liquidity Ratios 1 2
Total of the Ranks on First Position 3 4
Table 4.1.6: Rank Based Performance Analysis of “CAMEL
Model”
Conforming to all parameters of CAMEL Model it was
concluded that out of the five parameters of the model, MGB
got first position on four parameters and VKGB got second
position on three parameters which indicate that the
performance of MGB was remarkable.
V. CONCLUSION
The main objective behind the establishment of Regional
Rural Banks for the development of rural economy by
providing financial assistance to agriculture, trade,
commerce, small and house hold industry through credit
and advances are being met with the establishment of
various area specific Regional Rural Banks.
The Maharashtra Gramin Bank (MGB) is one of the
matured banks in Maharashtra state, which is serving
small and marginal agricultural farmers. The MGB
expanded its branch network all over the rural areas of 6
districts in Maharashtra and performing well through its
deposits and advances, irrespective of NPAs and lending
to priority sector.
Accordingly to the profitability of both the banks, the
Maharashtra Gramin Bank (MGB), it may be said, is good
and is growing at healthy growth rate. There is a
consistent improvement in all the thrust areas of the bank.
Maharashtra Gramin Bank shows satisfactorily credit
growth and also improvement on the other financial
indicators like operating profit, net profit, capital
adequacy
The equity stakes of the central government, state
government and sponsor banks and their continuous
support to the Bank, comfortable capital levels and
marginal deterioration in the asset quality indicators.
It is found that the total number of Vidharbha Konkan
Gramin Bank (VKGB) bank branches during the study
period is not enough to meet the growing financial needs
of the rural areas. Hence, bank officials should
concentrate to enhance its branch network to extend more
financial services in the rural areas.
Maharashtra Gramin Bank has been consistently meeting
their annual targets setup by their sponsor Bank and also
CD ratio , Investment - Deposit Ratio ( ID Ratio) , Cost to
Income Ratio are well within the prescribed limits setup
by the financial regulatory bodies.
Vidharbha Gramin Bank should also work on
improvement on financial indicators like CD ratio,
Investment - Deposit Ratio (ID Ratio), Cost to Income
Ratio so that their profitability and sustainability
increases.
Both the Banks should increase their recovery rate.
Vidharbha Konkan Gramin Bank (VKGB) and
Maharashtra Gramin Bank (MGB) should open its
branches in areas where customers are not able to avail
banking facilities in the five district of the Maharashtra
state.
Both the banks have implemented 100% CBS but both
these banks should establish the ATMs in the rural areas
to enhance its services to customers. It shall provide easy
and affordable services through the best use of
technology.
Both banks should also provide e-banking facilities and
create awareness among its customers.
For both the banks, it is essential to conduct farmers'
financial awareness programs in rural areas.
Both these banks must try to reach out to more needy
through micro-credit and Self-Help Groups more
efficiently.
Expand its reach in the rural areas through alternate
channels – ATM, BCA model.
Both these Bank should improve in service levels in rural
areas.
PROBLEMS (WEAKNESSES) OF RRBS IN
MAHARASHTRA
Although RRBs had a rapid expansion of branch network
and increase in volume of business, these institutions went
through a very difficult evolutionary process due to the
following problems.
Very limited area of operations as well as limited scope of
investment , Difficulties in deposit mobilization

Page 378 www.ijiras.com | Email: [email protected]
International Journal of Innovative Research and Advanced Studies (IJIRAS)
Volume 5 Issue 2, February 2018
ISSN: 2394-4404
Delay in decision making and formation of policies as 3
they need to coordinate with 3 Government entities for
approvals,
High risk due to exposure only to the target group so their
revovery rate is poor
Inadequate skills in treasury management for profit
orientation.
Inadequate exposure and skills to innovate products
limiting the lending portfolios – lack of training Facilities.
Inadequate effort to achieve desired levels of excellence
in staff competence for managing the affairs and business
as an independent entity.
VI. SUGGESTIONS (RECOMMENDATIONS) FOR
IMROVEMENT OF RRBs
Government should encourage and support banks to take
appropriate steps in rural development.
Efforts should be made to ensure that the non-interest cost
of credit to small borrowers is kept as low as possible.
Policy should be made by government for opening more
branches in weaker and remote areas of state.
Productivity can be improved by controlling the costs and
increasing the income.
To participation cost, subsidy should be adjusted towards
the end of the transaction for which loan assistance is
sanctioned.
Government should take firm action against the defaulters
and shouldn‟t make popular announcements like waiving
of loans.
The RRBs have to make an important change in their
decision making with regard to their investments
The RRBs have to be very careful and reduce the
operating expenses, because it has been found from our
study that these expenses have increased the total
expenditure of the banks.
The RRBs have to give due preference to the micro-credit
scheme and encourage in the formation of self help group.
Cooperative societies may be allowed to sponsor or co-
sponsor with commercial banks in the establishment of
the RRB.
A uniform pattern of interest rate structure should be
devised for the rural financial agencies.
The RRB must strengthen effective credit administration
by way of credit appraisal, monitoring the progress of
loans and their efficient recovery.
The credit policy of the RRB should be based on the
group approach of financing rural activities.
The RRB may relax their procedure for lending and make
them easier for village borrowers.
REFERENCES
[1] Regional rural banks-problems and prospects A case
study”. Financing agriculture, 14(2), April-June, 1984,
New Delhi, pp54-56.
[2] “A Study of loan recovery of Regional Rural Banks in
Bihar” Financing Agriculture,16(2) April June,1984 New
delhi,pp37-39.
[3] Regional Rural Banks: A study “Kurukshetra, 33(8), May
1985, New Delhi, pp31-33.
[4] “Credit and Rural bank: A case study: published M.Phil,
Dissertation submitted to S, V.University, Thirupathi,
1985, pp89-91.
[5] “Credit Repayment performance of borrowers of Regional
Rural Banks: A case study” Southern Economist, July
1986, New Delhi, pp.15-17.
[6] ”Impact of Grameena Bank Intervention on the Rural
power Structure “Research monograph, Bangladesh
Institute of Development studies, No.61, Bangladesh,
1986, pp76-79.
[7] “Alleviation of rural poverty: Reliability of Grameena
Bank Model “Grameena bank Evaluation project,
Agriculture and Rural development studies, Economic
and political weekly, Vol.7, November, 1987.pp2934.
[8] “Disbursement, overdoes and factors Affecting
Repayment Capacity of Barrowers” Indian Journal of
Agricultural Economics, Vol.43, No...3, 1988, New
Delhi, p.p 433.
[9] Internet search for RRBs and Indian Government policies
towards rural development.
[10] Almelu K, Devamohan.A (2010). Regional Rural Banks;
the Turnaround Story. The Indian Economic Journal.
vol.58, pp.153-164
[11] Jha.B.K, (2008). Role of Banking Service in Rural
Entrepreneurship (A case study of Sultanpur District,
Uttar Pradesh). Banking Finance, pp.9-12
[12] Jaynal Uddin Ahmed (2014). The Efficacy and Working
of Regional Rural Banks: An Implication in Indian
Context. International Journal of Banking, Risk and
Insurance Volume 2, (1), pp.18-29.
[13] Jayaramaiah.N, Anand.M.B & Ramesh.H (2013). Rural
Banking Strategies for Inclusive Growth With special
reference to Rural Karnataka. Acme Intellects
International Journal of Research in Management, vol.1,
(1), pp.1-17
[14] Kanika & Nancy (2013). Financial Performance
Evaluation of RRBs in India. International Journal of
Management and Information Technology, vol.4, (2),
pp.237-247.
[15] Megha & Aparna Bhatia (2013). Performance Evaluation
of Regional Rural Banks in India during Pre And Post
Amalgamation Period. Abhigyan, vol.30 (4), pp.40-55
[16] Narasaiah.P.V et.al (2005). Regional Rural Banks- the
Current Scenario. Banking Finance, pp.14-16
[17] Shanabhogara Raghavendra & Chaya K Degaonkar
(2014). Regional Rural Banks and Agricultural Credit-
Changing Role and Dimensions. Monthly
Multidisciplinary Research Journal, Vol. 3, (9), pp.1-8.