regional rapid transit system (rrts) (delhi ......page 2 of 46 1. context 1.1. preamble: 1.1.1. the...
TRANSCRIPT

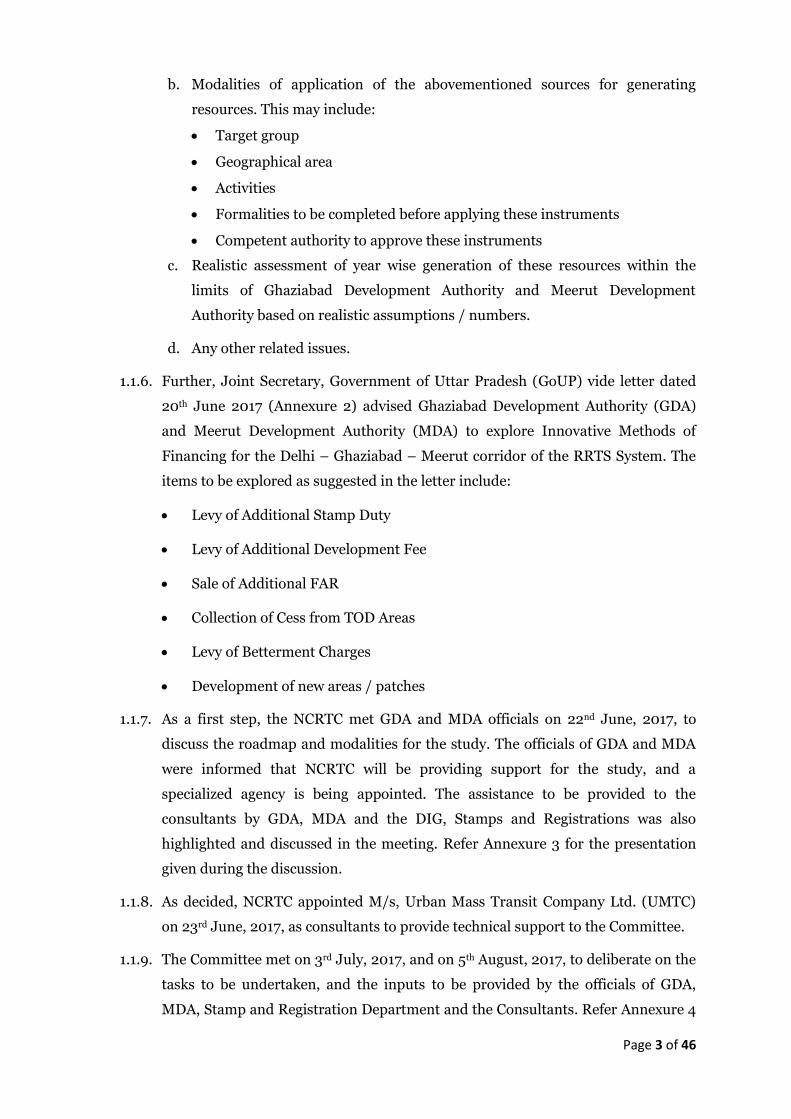
REGIONAL RAPID TRANSIT SYSTEM (RRTS)
(DELHI-GHAZIABAD-MEERUT CORRIDOR)
____________________________________
Report of Committee on innovative methods of revenue generation for implementation of
Regional Rapid Transit System (RRTS)
गति से प्रगति


Page 1 of 46
Table of Contents
1. Context ........................................................................................................................................... 2
2. Land Value Capture (LVC) instruments recommended in DPR ........................................... 7
3. Methodology for Analysis of LVC instruments ...................................................................... 16
4. LVC Instruments: International and Domestic case studies ............................................... 19
5. Review of Existing Policy Framework in the state of Uttar Pradesh................................... 25
6. Prioritization of LVC instruments and Estimated Revenue Potential ................................ 30
7. Recommendations and Action Plan ........................................................................................ 42

Page 2 of 46
1. Context
1.1. Preamble:
1.1.1. The Detailed Project Report (DPR) for Delhi-Ghaziabad-Meerut Regional Rapid
Transit System (RRTS) Corridor had recommended public funded model for its
implementation. Under this model, Government of Uttar Pradesh (GoUP) has
committed to contribute Rs. 4,304 Crores of equity. DPR has further identified
certain innovative revenue streams for project cash flows during operational stage
to help meet debt repayment obligations.
1.1.2. In this context, a videoconference was held on 15th June, 2017 by the Principal
Secretary, Housing and Urban Planning Department, Government of Uttar
Pradesh (GoUP) on implementation of Delhi - Ghaziabad - Meerut RRTS corridor.
Commissioner, Meerut Division; Managing Director, NCRTC; Vice Chairman,
GDA; and, Vice Chairman, MDA participated in the videoconference. During the
discussions in the conference, a need was felt to conduct a study to review the
revenue potential of innovative methods of financing suggested in the DPR based
on ground survey. MD, NCRTC offered to provide necessary knowledge support to
GDA and MDA by appointing a specialized agency to assist in the study to be
undertaken.
1.1.3. Following the video conference, Commissioner, Meerut Division, Meerut
constituted a committee for the subject matter, vide letter no. 66/PA-17 dated 16th
June, 2017 (Annexure 1), consisting of:-
1. Vice Chairperson, Ghaziabad Development Authority : Chairperson
2. Managing Director, NCR Transport Corporation, New Delhi : Member
3. Vice Chairman, Meerut Development Authority, Meerut : Member
4. DIG, Stamp and Registrations, Ghaziabad / Meerut : Member
1.1.4. The Committee was given an option to co-opt additional members as considered
necessary.
1.1.5. The terms of reference of the Committee were defined as follows:
a. Indirect Land Value Capture (LVC) through instruments like
• Transaction Cess in Transit Oriented Development (TOD) zones
• Additional levy of Stamp Duty
• Additional levy of Development Fee
• Sale of additional FAR
Page 3 of 46
b. Modalities of application of the abovementioned sources for generating
resources. This may include:
• Target group
• Geographical area
• Activities
• Formalities to be completed before applying these instruments
• Competent authority to approve these instruments
c. Realistic assessment of year wise generation of these resources within the
limits of Ghaziabad Development Authority and Meerut Development
Authority based on realistic assumptions / numbers.
d. Any other related issues.
1.1.6. Further, Joint Secretary, Government of Uttar Pradesh (GoUP) vide letter dated
20th June 2017 (Annexure 2) advised Ghaziabad Development Authority (GDA)
and Meerut Development Authority (MDA) to explore Innovative Methods of
Financing for the Delhi – Ghaziabad – Meerut corridor of the RRTS System. The
items to be explored as suggested in the letter include:
• Levy of Additional Stamp Duty
• Levy of Additional Development Fee
• Sale of Additional FAR
• Collection of Cess from TOD Areas
• Levy of Betterment Charges
• Development of new areas / patches
1.1.7. As a first step, the NCRTC met GDA and MDA officials on 22nd June, 2017, to
discuss the roadmap and modalities for the study. The officials of GDA and MDA
were informed that NCRTC will be providing support for the study, and a
specialized agency is being appointed. The assistance to be provided to the
consultants by GDA, MDA and the DIG, Stamps and Registrations was also
highlighted and discussed in the meeting. Refer Annexure 3 for the presentation
given during the discussion.
1.1.8. As decided, NCRTC appointed M/s, Urban Mass Transit Company Ltd. (UMTC)
on 23rd June, 2017, as consultants to provide technical support to the Committee.
1.1.9. The Committee met on 3rd July, 2017, and on 5th August, 2017, to deliberate on the
tasks to be undertaken, and the inputs to be provided by the officials of GDA,
MDA, Stamp and Registration Department and the Consultants. Refer Annexure 4
Page 4 of 46
and 5 for the presentations given during the discussion. The findings of the
Committee are discussed in subsequent sections of the report.
1.2. Background:
1.2.1. In order to enhance the connectivity, improve access to citizens and promote
balanced future growth in National Capital Region (NCR), NCRPB had
recommended development of multi modal transport system with special
emphasis on Regional Rapid Transit System (RRTS) for connecting major regional
centers in the Functional Plan on Transport for NCR-2032.
1.2.2. The objective of RRTS is to provide fast, reliable and comfortable connectivity
solution for NCR region. For NCR, the RRTS will be the main commuter transport
backbone significantly reducing the time for travel between key suburbs and towns
around Delhi. High speed, significant reduction in travel time and wider reach of
RRTS offer a very different proposition as compared to metro rail systems. Some
of the key value additions are (i) increase in land value along the RRTS corridor
(ii) wider catchment area not limited to station proximity, and (iii) time saving for
long distance transit compared to existing modes of transportation.
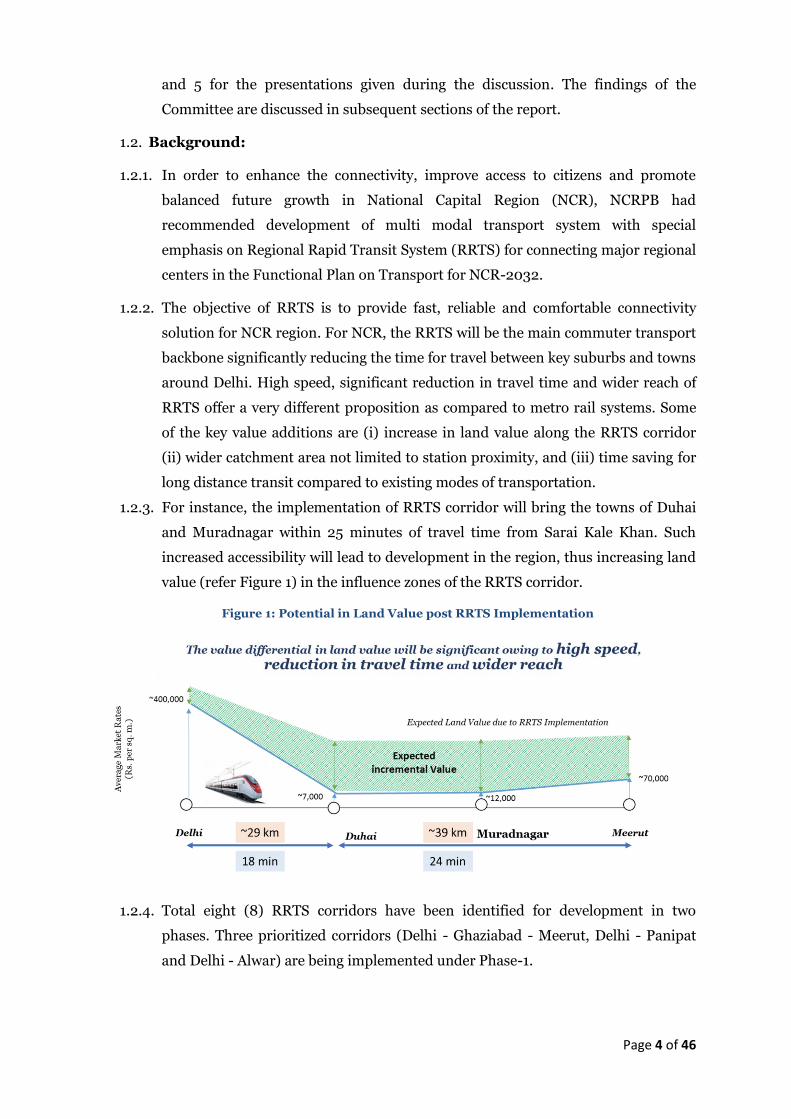
1.2.3. For instance, the implementation of RRTS corridor will bring the towns of Duhai
and Muradnagar within 25 minutes of travel time from Sarai Kale Khan. Such
increased accessibility will lead to development in the region, thus increasing land
value (refer Figure 1) in the influence zones of the RRTS corridor.
Figure 1: Potential in Land Value post RRTS Implementation
1.2.4. Total eight (8) RRTS corridors have been identified for development in two
phases. Three prioritized corridors (Delhi - Ghaziabad - Meerut, Delhi - Panipat
and Delhi - Alwar) are being implemented under Phase-1.
Page 5 of 46
1.2.5. Government of Uttar Pradesh (GoUP) has played an active role in the planning of
Delhi - Ghaziabad - Meerut RRTS corridor. It has supported the RRTS at all stages
of planning. GoUP provided necessary thrust to Delhi-Meerut corridor of RRTS by
a) Getting the NH-58 de-notified to enable construction of RRTS viaduct on the
median of the road, thereby keeping land acquisition minimal
b) Planning for the traffic diversions during the construction of RRTS
c) Approving the DPR and allocating token money in the budget 2017-18
1.2.6. This has fast tracked implementation of Delhi-Meerut RRTS Corridor to become
one of the first rapid transit systems at regional level in India. Pre-construction
activities have started on ground to enable NCRTC to commence work on the
corridor as soon as approvals are in place.
1.2.7. The Committee noted that the Government of Uttar Pradesh (GoUP) had
approved the DPR and its equity contribution on 19th May, 2017 and
had also initiated action for the provision of token amount of Rs. 100 crore in its
budget for 2017-18.
1.2.8. The Committee was also apprised that the aerial survey for utility identification,
stakeholder consultations on issues pertaining to utility diversion, removal of
encroachments, land acquisition, traffic diversion planning etc. have been started.
A project office is being set up at Ghaziabad for project execution headed by a
Chief Project Manager. Detailed Design Consultant has also been appointed. The
geo-technical investigation tenders are under finalization.
1.2.9. The Committee also noted that the ADB (Asian Development Bank) has
communicated to Department of Economic Affairs (DEA) their keen
interest for providing financial assistance for Delhi-Meerut RRTS corridor.
NCRTC is also engaging with other multi-lateral and bi-lateral agencies such as
AIIB, AFD, KfW Development Bank, etc., for exploring financing/co-financing
(soft loans) options. Formal proposal for the same has been initiated by NCRTC.
1.3. Innovative sources identified in Detailed Project Report (DPR)
1.3.1. The Committee noted that the Detailed Project Report, 2016 had identified a few
land value capture instruments as per the guidelines laid out (vide letter K-
14011/8/2012-MRTS, dated 20th January, 2012) by the Ministry of Housing and
Urban Affairs (earlier known as Ministry of Urban Development), such as:-
a) Sale of additional Floor Area Ratio (FAR) in influence Zone in UP
b) Levy of additional Stamp Duty
c) Levy of additional Development Charges
Page 6 of 46
d) Transaction Cess on TOD Zones
1.3.2. The Committee noted that the assessment study for the estimation for revenue
potential from above sources was initiated in 2011 and the same is required to be
validated in view of current policy framework and real estate market conditions.
1.3.3. The Committee, therefore, has deliberated on abovementioned sources as
identified in DPR, related assumptions and revenue potential in view of the
current policies/regulations within the framework of the overall terms of
reference.
Page 7 of 46
2. Land Value Capture (LVC) instruments recommended in
DPR
2.1. The Detailed Project Report (DPR, December 2016) projects the construction period
for the Delhi-Meerut RRTS corridor to start in July, 2018 and commencement of full
commercial operations from July, 2024. It recommends various options of land value
capture and estimates the potential revenue from the same for the lifecycle of the
project. These sources are as follows:
a) Sale of additional Floor Area Ratio (FAR) in influence zone of stations in UP
b) Levy of additional Stamp Duty
c) Levy of additional Development Charges
d) Transaction Cess in TOD Zones
2.2. Sale of Additional FAR along the Corridor
2.2.1. In order to maximize the benefits of the project, densification by allowing higher FAR
along Delhi-Meerut RRTS is required.
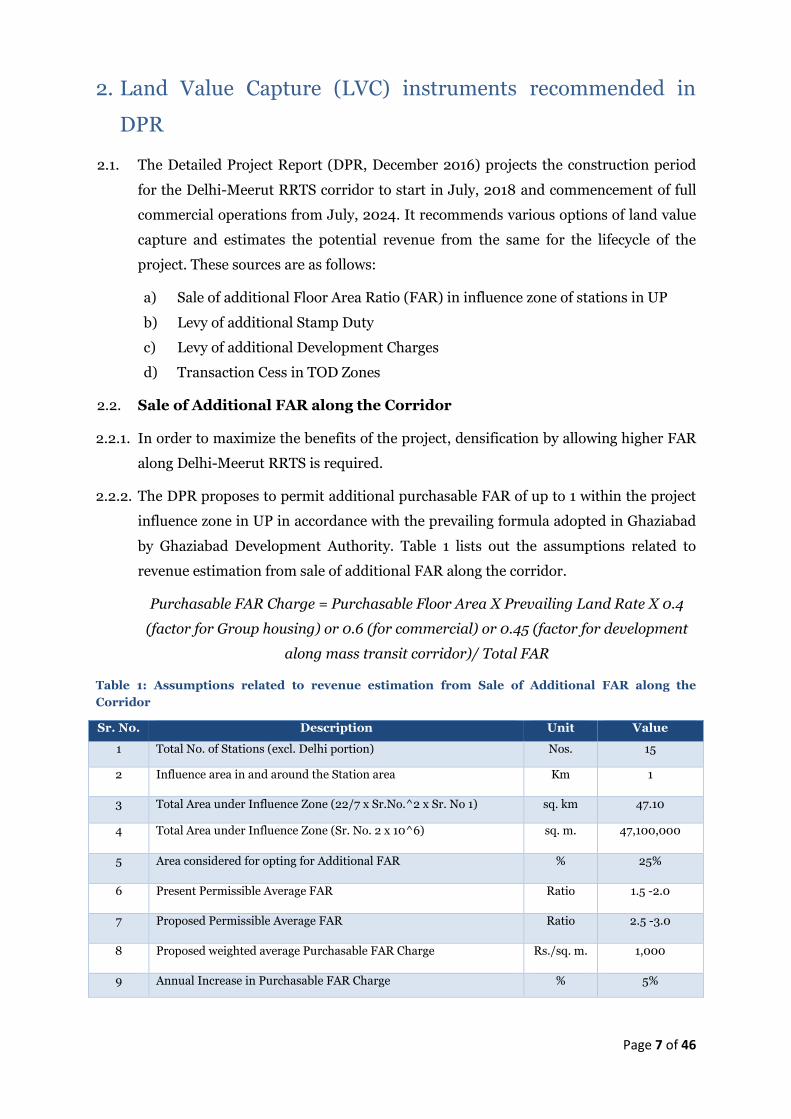
2.2.2. The DPR proposes to permit additional purchasable FAR of up to 1 within the project
influence zone in UP in accordance with the prevailing formula adopted in Ghaziabad
by Ghaziabad Development Authority. Table 1 lists out the assumptions related to
revenue estimation from sale of additional FAR along the corridor.
Purchasable FAR Charge = Purchasable Floor Area X Prevailing Land Rate X 0.4
(factor for Group housing) or 0.6 (for commercial) or 0.45 (factor for development
along mass transit corridor)/ Total FAR
Table 1: Assumptions related to revenue estimation from Sale of Additional FAR along the
Corridor
Sr. No. Description Unit Value
1 Total No. of Stations (excl. Delhi portion) Nos. 15
2 Influence area in and around the Station area Km 1
3 Total Area under Influence Zone (22/7 x Sr.No.^2 x Sr. No 1) sq. km 47.10
4 Total Area under Influence Zone (Sr. No. 2 x 10^6) sq. m. 47,100,000
5 Area considered for opting for Additional FAR % 25%
6 Present Permissible Average FAR Ratio 1.5 -2.0
7 Proposed Permissible Average FAR Ratio 2.5 -3.0
8 Proposed weighted average Purchasable FAR Charge Rs./sq. m. 1,000
9 Annual Increase in Purchasable FAR Charge % 5%
Page 8 of 46
10 % of total fund generated to be used for RRTS project % 60%
Source: Detailed Project Report, December 2016
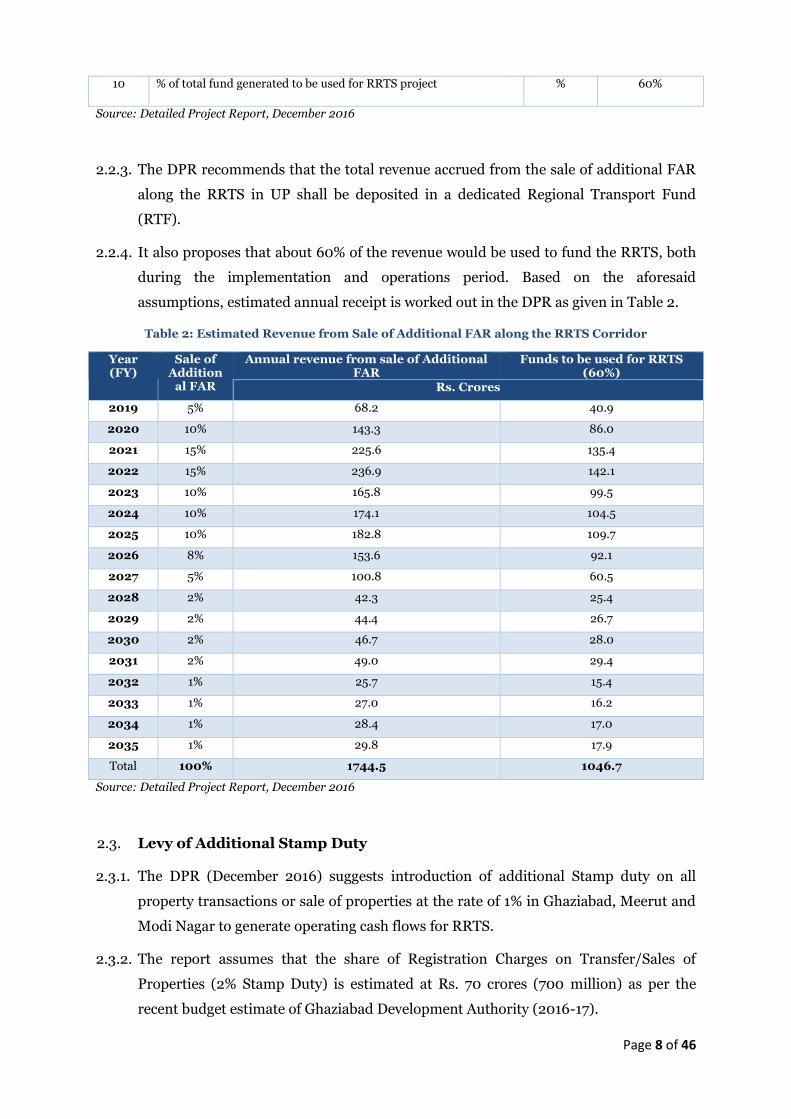
2.2.3. The DPR recommends that the total revenue accrued from the sale of additional FAR
along the RRTS in UP shall be deposited in a dedicated Regional Transport Fund
(RTF).
2.2.4. It also proposes that about 60% of the revenue would be used to fund the RRTS, both
during the implementation and operations period. Based on the aforesaid
assumptions, estimated annual receipt is worked out in the DPR as given in Table 2.
Table 2: Estimated Revenue from Sale of Additional FAR along the RRTS Corridor
Year (FY)
Sale of Addition
al FAR
Annual revenue from sale of Additional FAR
Funds to be used for RRTS (60%)
Rs. Crores
2019 5% 68.2 40.9
2020 10% 143.3 86.0
2021 15% 225.6 135.4
2022 15% 236.9 142.1
2023 10% 165.8 99.5
2024 10% 174.1 104.5
2025 10% 182.8 109.7
2026 8% 153.6 92.1
2027 5% 100.8 60.5
2028 2% 42.3 25.4
2029 2% 44.4 26.7
2030 2% 46.7 28.0
2031 2% 49.0 29.4
2032 1% 25.7 15.4
2033 1% 27.0 16.2
2034 1% 28.4 17.0
2035 1% 29.8 17.9
Total 100% 1744.5 1046.7
Source: Detailed Project Report, December 2016
2.3. Levy of Additional Stamp Duty
2.3.1. The DPR (December 2016) suggests introduction of additional Stamp duty on all
property transactions or sale of properties at the rate of 1% in Ghaziabad, Meerut and
Modi Nagar to generate operating cash flows for RRTS.
2.3.2. The report assumes that the share of Registration Charges on Transfer/Sales of
Properties (2% Stamp Duty) is estimated at Rs. 70 crores (700 million) as per the
recent budget estimate of Ghaziabad Development Authority (2016-17).

Page 9 of 46
2.3.3. One percent (1%) additional Stamp duty share is pegged at Rs. 35 crores (350 million)
based on the aforementioned estimates. Therefore, Rs. 35 crore has been kept as base
revenue from levy of additional stamp duty on transfer or sale of properties in
Ghaziabad. Similarly, it is estimated at Rs. 20 crore (200 million) and Rs.5 crore (50
million) in Meerut and Modi Nagar respectively.
2.3.4. The aforesaid revenues has been escalated at the rate of 3% per annum during the
analysis period. The year wise estimated revenues indicated in the DPR are given in
Table 3.
Table 3: Estimated Revenue from Levy of Additional Stamp Duty
Year Ghaziabad Meerut Modi Nagar Total
Rs. Crores
2017 35.0 20.0 5.0 60.0
2018 36.1 20.6 5.2 61.8
2019 37.1 21.2 5.3 63.7
2020 38.2 21.9 5.5 65.6
2021 39.4 22.5 5.6 67.5
2022 40.6 23.2 5.8 69.6
2023 41.8 23.9 6.0 71.6
2024 43.0 24.6 6.1 73.8
2025 44.3 25.3 6.3 76.0
2026 45.7 26.1 6.5 78.3
2027 47.0 26.9 6.7 80.6
2028 48.4 27.7 6.9 83.1
2029 49.9 28.5 7.1 85.5
2030 51.4 29.4 7.3 88.1
2031 52.9 30.3 7.6 90.8
2032 54.5 31.2 7.8 93.5
2033 56.2 32.1 8.0 96.3
2034 57.8 33.1 8.3 99.2
2035 59.6 34.0 8.5 102.1
2036 61.4 35.1 8.8 105.2
2037 63.2 36.1 9.0 108.4
2038 65.1 37.2 9.3 111.6
2039 67.1 38.3 9.6 115.0
2040 69.1 39.5 9.9 118.4
2041 71.1 40.7 10.2 122.0
2042 73.3 41.9 10.5 125.6
2043 75.5 43.1 10.8 129.4
2044 77.7 44.4 11.1 133.3
2045 80.1 45.8 11.4 137.3
2046 82.5 47.1 11.8 141.4
2047 85.0 48.5 12.1 145.6
2048 87.5 50.0 12.5 150.0

Page 10 of 46
Year Ghaziabad Meerut Modi Nagar Total
2049 90.1 51.5 12.9 154.5
2050 92.8 53.0 13.3 159.1
2051 95.6 54.6 13.7 163.9
2052 98.5 56.3 14.1 168.8
2053 101.4 58.0 14.5 173.9
2054 104.5 59.7 14.9 179.1
Total 2420.6 1383.2 345.8 4149.6
Source: Detailed Project Report, December 2016
2.4. Levy of Additional Development Fee
2.4.1. The Detailed Project Report indicates the prevailing Development Fee (as given in
Development Fee Rules, 2014) to be Rs. 2,500 per sq. m. and 1,000 per sq. m. in
Ghaziabad and Meerut respectively.
2.4.2. The Development Fee is assessed based on the total land parcel area, applicable
multiplication factor (in case of up to 0.2 hectares the factor is one and gradually
reduces to 0.4 where the gross land parcel area is more than 10 hectares) and density
factor based on the proposed development (number of dwelling units per hectare,
density factor will be 1.5 in case of highest density more than 325 dwelling units per
ha).
2.4.3. Considering the above, the DPR suggests levying of 100% additional Development Fee
for new developments more than 10,000 sq. m and 4,000 sq. m for commercial
developments and residential developments respectively. The assumptions related to
revenue estimation from the same have been presented in Table 4.
Table 4: Assumptions Related to Estimation of Revenue due to Levy of Additional Development
Fee
Sr. No. Description Unit Rate/Factor
1 Prevailing Development Fee
a) Ghaziabad Rs./sq. m. 2,500
b) Meerut Rs./sq. m. 1,000
2 Multiplication Factor
a) Up to 0.2 Ha Factor 1
b) 0.2 to 1.0 Ha Factor 0.9
c) 1 Ha to 5 Ha Factor 0.8
d) 5 Ha to 10 Ha Factor 0.6
e) More than 10 Ha Factor 0.4
3 Average Multiplication Factor used for estimation Factor 0.5
4 Proposed Additional Development Fee % 100%
5 Additional Development Fee Escalation % per year 5%
6 Total Area of Ghaziabad Development Authority sq. km 133.5
7 Total Area of Meerut Development Authority sq. km 141.8

Page 11 of 46
Sr. No. Description Unit Rate/Factor
8 Area Considered for Estimation of Additional Development Fee (more than 20, 000 sq. m. area) – till 2041 (next development plan period )
a) Ghaziabad % of total area 3%
b) Meerut % of total area 3%
9 Additional Development Fee on area considered
a) Ghaziabad sq. m. 4005000
b) Meerut sq. m. 4254000
10 Funds proposed for RRTS project % of Total 60%
Source: Detailed Project Report, December 2016
2.4.4. The DPR also indicates that for the implementation of the aforementioned initiatives,
necessary administrative changes and amendments where required would require to
be carried out in the Town and Country Planning Act, Regulations and Rules. Based
on the aforesaid assumption, the DPR estimates the revenue from additional
development fee as shown in Table 5.
Table 5: Estimated Revenue from Additional Development Fee
Sr. No. Year (FY) Ghaziabad Meerut Ghaziabad Meerut Total For RRTS
Development Phasing Rs. Crores
1 2018 5% 5% 26.3 11.2 37.4 22.5
2 2019 5% 5% 27.6 11.7 39.3 23.6
3 2020 5% 5% 29.0 12.3 41.3 24.8
4 2021 5% 5% 30.4 12.9 43.4 26.0
5 2022 6% 6% 38.3 16.3 54.6 32.8
6 2023 10% 10% 67.1 28.5 95.6 57.4
7 2024 10% 10% 70.4 29.9 100.4 60.2
8 2025 10% 10% 74.0 31.4 105.4 63.2
9 2026 7% 7% 54.4 23.1 77.5 46.5
10 2027 7% 7% 57.1 24.3 81.3 48.8
11 2028 5% 5% 42.8 18.2 61.0 36.6
12 2029 5% 5% 45.0 19.1 64.1 38.4
13 2030 3% 3% 28.3 12.0 40.4 24.2
14 2031 3% 3% 29.7 12.6 42.4 25.4
15 2032 3% 3% 31.2 13.3 44.5 26.7
16 2033 2% 2% 21.9 9.3 31.1 18.7
17 2034 2% 2% 22.9 9.8 32.7 19.6
18 2035 1% 1% 12.0 5.1 17.2 10.3
19 2036 1% 1% 12.7 5.4 18.0 10.8
20 2037 1% 1% 13.3 5.6 18.9 11.4
21 2038 1% 1% 13.9 5.9 19.9 11.9
22 2039 1% 1% 14.6 6.2 20.9 12.5
23 2040 1% 1% 15.4 6.5 21.9 13.1
24 2041 1% 1% 16.1 6.9 23.0 13.8
Page 12 of 46
Sr. No. Year (FY) Ghaziabad Meerut Ghaziabad Meerut Total For RRTS
Total 794.4 337.5 1132.2 679.2
Source: Detailed Project Report, December 2016
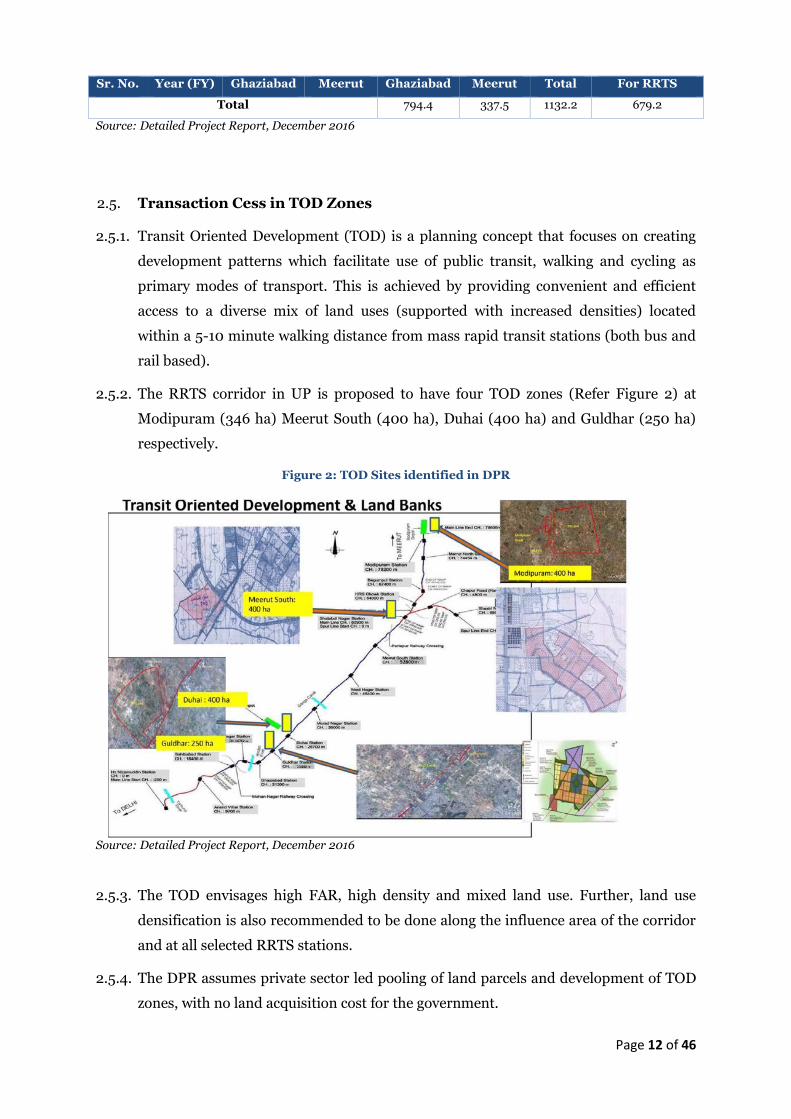
2.5. Transaction Cess in TOD Zones
2.5.1. Transit Oriented Development (TOD) is a planning concept that focuses on creating
development patterns which facilitate use of public transit, walking and cycling as
primary modes of transport. This is achieved by providing convenient and efficient
access to a diverse mix of land uses (supported with increased densities) located
within a 5-10 minute walking distance from mass rapid transit stations (both bus and
rail based).
2.5.2. The RRTS corridor in UP is proposed to have four TOD zones (Refer Figure 2) at
Modipuram (346 ha) Meerut South (400 ha), Duhai (400 ha) and Guldhar (250 ha)
respectively.
Figure 2: TOD Sites identified in DPR
Source: Detailed Project Report, December 2016
2.5.3. The TOD envisages high FAR, high density and mixed land use. Further, land use
densification is also recommended to be done along the influence area of the corridor
and at all selected RRTS stations.
2.5.4. The DPR assumes private sector led pooling of land parcels and development of TOD
zones, with no land acquisition cost for the government.

Page 13 of 46
2.5.5. It is envisaged in the DPR that due to the RRTS project, the value of land and value of
the built-up area would increase in these proposed TOD zones and adjacent influence
areas. Further, velocity of transaction of property is also envisaged to be high owing to
the implementation of RRTS project. To raise funds required for the project, the DPR
proposes that the state government could levy Cess on each property transaction both
on land and built up area in the aforesaid TOD zones.
2.5.6. Following rates (shown in Table 6) have been used in the DPR that could be charged
at the time of registration of property from the buyers/sellers:
Table 6: Proposed Cess Rate
Sr. No. Description Unit Rate
Rupees
1 Land /Site/Plot Per sq. m. / transaction 1,000
2 Developed Area
A Residential Per sq. m. / transaction 1,000
B Commercial Per sq. m. / transaction 2000
C Office Per sq. m. / transaction 1,500
Source: Detailed Project Report, December 2016
2.5.7. It is assumed that towards completion of construction of RRTS project, the velocity of
transaction would increase. To estimate the total Cess generated from TOD area, the
following formula is adopted;
Total Cess for the year = Cess Rate per transaction x Total TOD area x velocity of
transaction for the corresponding year
2.5.8. As per the DPR, the total estimated Cess from the four TOD Zones during construction
is Rs. 600.3 crores (6,003 million). The year-wise transaction Cess during
construction is presented is Table 7.
Table 7: Estimated Transaction Cess during Construction
Year (FY) Velocity of Transaction % Area (Ha) Total Cess
Rs. Crore
2018 5% 1396 69.8
2019 10% 1396 139.6
2020 8% 1396 111.7
2021 5% 1396 69.8
2022 5% 1396 69.8
2023 5% 1396 69.8
2024 5% 1396 69.8
Total 600.3
Source: Detailed Project Report, December 2016
Page 14 of 46
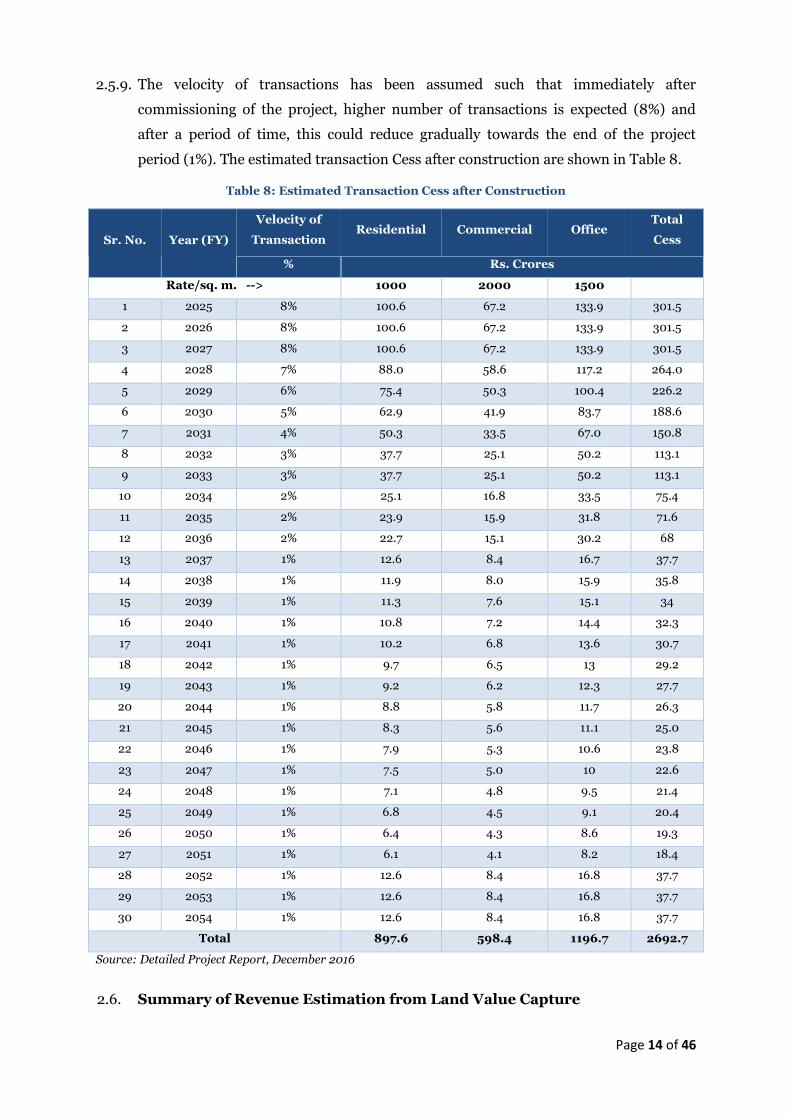
2.5.9. The velocity of transactions has been assumed such that immediately after
commissioning of the project, higher number of transactions is expected (8%) and
after a period of time, this could reduce gradually towards the end of the project
period (1%). The estimated transaction Cess after construction are shown in Table 8.
Table 8: Estimated Transaction Cess after Construction
Sr. No.
Year (FY)
Velocity of
Transaction Residential Commercial Office
Total
Cess
% Rs. Crores
Rate/sq. m. --> 1000 2000 1500
1 2025 8% 100.6 67.2 133.9 301.5
2 2026 8% 100.6 67.2 133.9 301.5
3 2027 8% 100.6 67.2 133.9 301.5
4 2028 7% 88.0 58.6 117.2 264.0
5 2029 6% 75.4 50.3 100.4 226.2
6 2030 5% 62.9 41.9 83.7 188.6
7 2031 4% 50.3 33.5 67.0 150.8
8 2032 3% 37.7 25.1 50.2 113.1
9 2033 3% 37.7 25.1 50.2 113.1
10 2034 2% 25.1 16.8 33.5 75.4
11 2035 2% 23.9 15.9 31.8 71.6
12 2036 2% 22.7 15.1 30.2 68
13 2037 1% 12.6 8.4 16.7 37.7
14 2038 1% 11.9 8.0 15.9 35.8
15 2039 1% 11.3 7.6 15.1 34
16 2040 1% 10.8 7.2 14.4 32.3
17 2041 1% 10.2 6.8 13.6 30.7
18 2042 1% 9.7 6.5 13 29.2
19 2043 1% 9.2 6.2 12.3 27.7
20 2044 1% 8.8 5.8 11.7 26.3
21 2045 1% 8.3 5.6 11.1 25.0
22 2046 1% 7.9 5.3 10.6 23.8
23 2047 1% 7.5 5.0 10 22.6
24 2048 1% 7.1 4.8 9.5 21.4
25 2049 1% 6.8 4.5 9.1 20.4
26 2050 1% 6.4 4.3 8.6 19.3
27 2051 1% 6.1 4.1 8.2 18.4
28 2052 1% 12.6 8.4 16.8 37.7
29 2053 1% 12.6 8.4 16.8 37.7
30 2054 1% 12.6 8.4 16.8 37.7
Total 897.6 598.4 1196.7 2692.7
Source: Detailed Project Report, December 2016
2.6. Summary of Revenue Estimation from Land Value Capture
Page 15 of 46
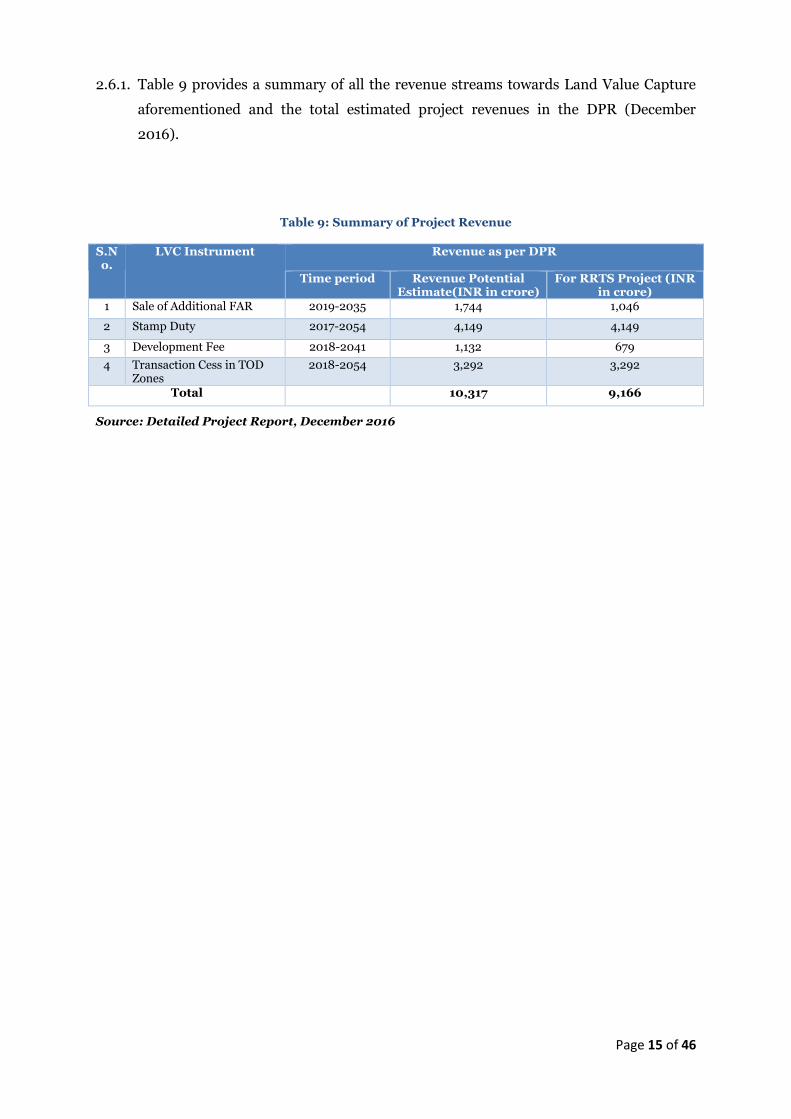
2.6.1. Table 9 provides a summary of all the revenue streams towards Land Value Capture
aforementioned and the total estimated project revenues in the DPR (December
2016).
Table 9: Summary of Project Revenue
S.No.
LVC Instrument Revenue as per DPR
Time period Revenue Potential Estimate(INR in crore)
For RRTS Project (INR in crore)
1 Sale of Additional FAR 2019-2035 1,744 1,046
2 Stamp Duty 2017-2054 4,149 4,149
3 Development Fee 2018-2041 1,132 679
4 Transaction Cess in TOD Zones
2018-2054 3,292 3,292
Total 10,317 9,166
Source: Detailed Project Report, December 2016

Page 16 of 46
3. Methodology for Analysis of LVC instruments
3.1. Based on the review of the DPR, a detailed list of data required to establish the
assumptions for revenue estimation was prepared. The Consultants engaged with the
relevant stakeholders such as GDA, MDA, Stamps and Registrations Department and
other local authorities to gather all the relevant information necessary to estimate a
realistic potential from land value capture instruments. The list of data requirements
and data collected/received are detailed out in Annexure 6 and Annexure 7
3.2. Further, site visits and field surveys at station locations (within 1.0 to 1.5 km radius)
were conducted by Consultants for primary data collection for mapping broad land
use, built-up coverage area, type of property, circle rates, existing building heights, etc.
3.3. The survey data was then attached to the spatial database along with the
corresponding circle rates. The analysis was carried out to understand the
predominant land use and the number of floors, thereby estimating the consumed
FAR within the station areas. Analytical thematic maps generated from the primary
survey analysis of Sahibabad station are shown in figures below as an illustration
(Figure 3, Figure 4, Figure 5). The detailed analysis of all stations are provided in
Annexure 18. Additionally, based on the primary surveys and the analysis done, the
FAR consumed in each of the station influence areas has also been calculated.
Figure 3: Land use analysis for Sahibabad Station

Page 17 of 46
Figure 4: Number of floors and FAR consumed
Figure 5: Circle Rates
3.4. Additionally, thorough secondary research has been undertaken to study the various
mechanism and potential of land value capture instruments adopted in other rail
based and urban mass transit systems both domestic and international (refer chapter
4).
Page 18 of 46
3.5. For each of the land value capture instruments, the existing regulatory and policy
framework for the state of Uttar Pradesh was studied in detail to understand the
institutional mechanisms (refer chapter 5)
3.6. Methodology adopted for revenue estimation from each of the prioritized instruments
has been detailed in chapter 6.
Page 19 of 46
4. LVC Instruments: International and Domestic case studies
4.1. Over the last two decades, a number of Indian cities have implemented metro rail
systems as well as bus based rapid public transport systems. These include cities like
Delhi, Nagpur, Bangalore, Chennai, Kochi, Pune, Ahmedabad etc. As part of
innovative financing for these projects, cities have adopted a number of land value
capture instruments such as permitting additional FSI in the metro influence zones.
Implementation has been through either Development Control Regulations (DCR)
modification or a new policy intervention. The cities have also explored other
instruments such as stamp duty, Cess on properties, etc., in order to contribute
towards a unified Urban Transport Fund. In each of the cities, an institutional
framework and fund flow mechanism has been established depending upon the type
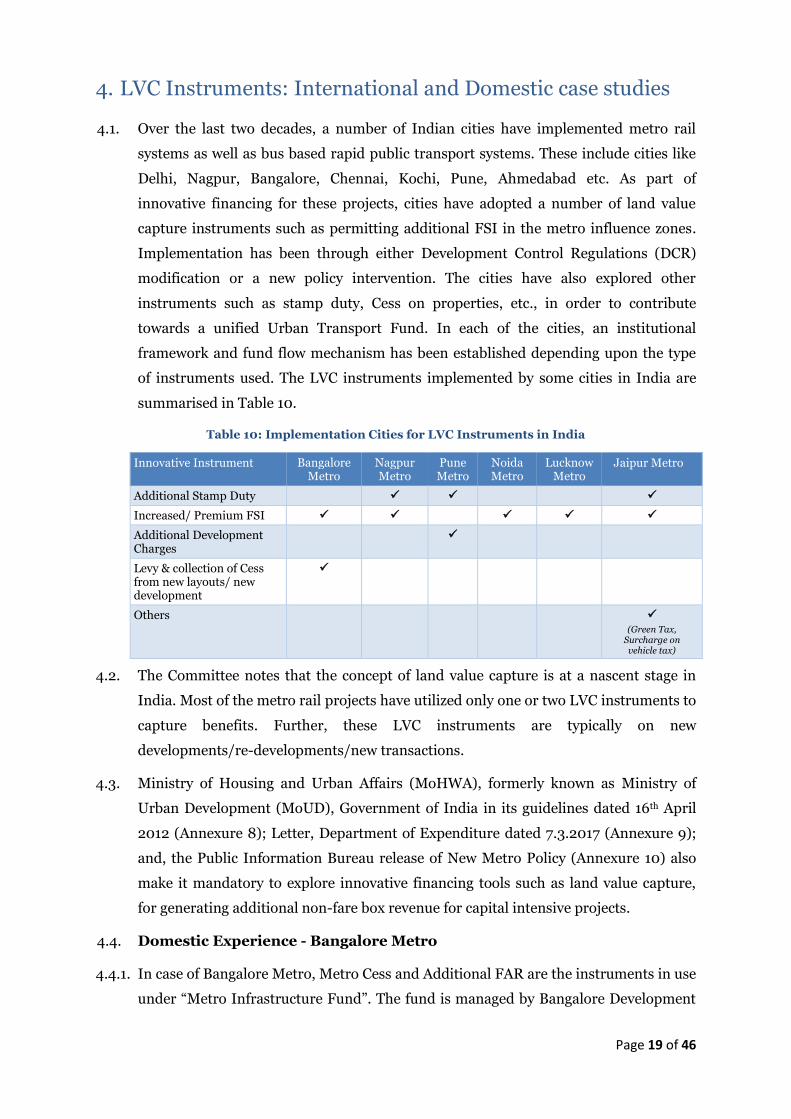
of instruments used. The LVC instruments implemented by some cities in India are
summarised in Table 10.
Table 10: Implementation Cities for LVC Instruments in India
Innovative Instrument Bangalore Metro
Nagpur Metro
Pune Metro
Noida Metro
Lucknow Metro
Jaipur Metro
Additional Stamp Duty ✓ ✓ ✓
Increased/ Premium FSI ✓ ✓ ✓ ✓ ✓
Additional Development Charges
✓
Levy & collection of Cess from new layouts/ new development
✓
Others ✓ (Green Tax,
Surcharge on vehicle tax)
4.2. The Committee notes that the concept of land value capture is at a nascent stage in
India. Most of the metro rail projects have utilized only one or two LVC instruments to
capture benefits. Further, these LVC instruments are typically on new
developments/re-developments/new transactions.
4.3. Ministry of Housing and Urban Affairs (MoHWA), formerly known as Ministry of
Urban Development (MoUD), Government of India in its guidelines dated 16th April
2012 (Annexure 8); Letter, Department of Expenditure dated 7.3.2017 (Annexure 9);
and, the Public Information Bureau release of New Metro Policy (Annexure 10) also
make it mandatory to explore innovative financing tools such as land value capture,
for generating additional non-fare box revenue for capital intensive projects.
4.4. Domestic Experience - Bangalore Metro
4.4.1. In case of Bangalore Metro, Metro Cess and Additional FAR are the instruments in use
under “Metro Infrastructure Fund”. The fund is managed by Bangalore Development

Page 20 of 46
Authority (BDA). BDA is also responsible for revenue collections from these two
sources as well as for transfer of funds to recipients such as BDA, BMRL, BBMP and
BWSSB.
4.4.2. The following schematic diagram (Figure 6) represent the institutional and fund flow
mechanism in case of Bangalore metro:
Figure 6: Institutional and fund flow mechanism in case of Bangalore metro
4.4.3. Of the total collections under two LVC instruments, 60% to 65% is transferred to
Bangalore Metro (BMRL), whereas remaining is appropriated among other
beneficiaries to meet investment requirement for augmentation of civic infrastructure.
Refer Figure 7.
Figure 7: Sharing mechanism of revenue from LVC instruments
Source: Government of Karnataka (Bangalore Metro Rail Project Phase 2 Approval)

Page 21 of 46
4.5. Domestic Experience - Nagpur Metro
4.5.1. Two LVC instruments, viz., Additional Stamp Duty and Increased FAR, are under
implementation in Nagpur to generate revenues for Nagpur Metro project.
4.5.2. Additional Stamp Duty has been implemented vide amendment in Maharashtra
Municipal Corporation Act, 1949 in 2015 (Insertion of Section 149B)1. The proposed
fund flow mechanism for collection and appropriation of Additional Stamp Duty is as
follows:
a) Department of Stamp and Registration, Government of Maharashtra will collect
and deposit additional stamp duty with the State Government
b) State Government to release money on regular basis to
i. Nagpur Metro (50%)
ii. Nagpur Municipal Corporation (NMC) – (50%)
4.5.3. Increased FSI – the Urban Development Department (UDD) notified the increased
floor to space index (FSI) up to 4.02 on both sides of metro rail corridor within 500 m
of the alignment. The premium will be charged at the rate of 60% of ready reckoner
value for residential constructions and at the rate of 90% for commercial
constructions. The same has been enacted by amendment to DCR vide Urban
Development Department, Government of Maharashtra notification dated 9th June,
2017. The proposed fund flow mechanism for collection and appropriation of
Increased FAR is as follows:
a) Local Government (Nagpur Municipal Corporation)
b) The proceeds from sale of increased FAR shall be appropriated as follows:
i. Nagpur Metro (50%)
ii. Nagpur Municipal Corporation (NMC) – (50%)
4.6. International Experience – Hong Kong Mass Transit Railway (MTR)3
4.6.1. The 218-kilometer mass transit railway (MTR) network consists of 10 railway lines
with 84 stations serving Hong Kong Island, Kowloon, and the New Territories, with
more than 4 million passenger trips a day.
4.6.2. The investment in mass rapid transit system has not only promoted sustainable urban
development, but also led to effective utilization of development-based land value
capture (LVC) instruments to be ploughed back into the project.
1 Maharashtra Government Gazette dated 21st August, 2015 2 Notification issued by Government of Maharashtra for modification in DCR 3 http://www.hlrn.org/img/documents/Suzuki_Land_Values.pdf
Page 22 of 46
4.6.3. By using land value capture mechanisms, Hong Kong, China, has enjoyed a world
class level of mass transit railway service with limited public financial support.
4.6.4. This financial success is attributable to the Rail plus Property (R+P) program
implemented by the MTR Corporation.
4.6.5. Under the R+P program, the Hong Kong SAR, China, government gives exclusive
property development rights of government-owned land at a “before-rail” market
price to MTR.
4.6.6. The Comprehensive Development Area zoning sets special FARs around key stations
to attract private investment to strategic locations, while providing flexibility for
private developers to negotiate and design.
4.6.7. MTR then captures the land value increment created by R+P, such as accessibility and
agglomeration benefits owing to transit and transit-oriented development related
investments, by partnering with private developers in developing the land and selling
the completed development at an “after-rail” market price.
4.6.8. After project completion, the railway corporation stays on as an asset manager not
only to capture the upfront profits of property development but also to maximize
management-related recurring revenues from the long-term business portfolio.
4.6.9. MTR is able to recoup the capital, operating, and maintenance costs of railway
projects through this model. R+P also allows MTR to integrate different phases of rail
and property development projects, ensuring smooth project implementation and
reducing transaction costs.
4.6.10. Further, although MTR is entitled to capture land value increments, its financial
benefits are distributed to the government through dividends and appreciation of the
value of its shareholding.
4.6.11. MTR thus contributes to sustainable urban development and economic development
by providing efficient transit services and high quality property development.
4.7. International Experience – London Crossrail4
4.7.1. Crossrail is a new railway line that will run in London from Maidenhead and
Heathrow in the west to Shenfield and Abbey Wood in the east. The line is expected to
bring an additional 1.5 million people from outer London and beyond within the reach
of central London and major employment centers in 45 minutes.
4.7.2. In the 10 years since the project was announced, all 40 stations along the 73-mile line
have seen house prices rise by more than 41%, compared with a 25% rise in England
over the same period. To internalize the windfall surpluses of land value due to
4 Greater London Authority (GLA) – Initial prospectus for levy of BRS; https://moneywise.co.uk

Page 23 of 46
proximity to the project, a Business Rate Supplement (BRS) is put in place, thus
helping repay the project borrowings and partly fund the construction costs.
4.7.3. Powers were granted to the GLA (Greater London Authority) to introduce this under
the Business Rate Supplements Act 2009 (the ‘BRS Act’). The GLA will exercise these
powers under the direction of the Mayor of London.
4.7.4. BRS collected will be used to repay loan for Crossrail. It will remain in place until loan
is repaid, ultimately funding around 1/3rd of project costs for a period of about 24 to
30 years at a rate of 2 pence per £1 across London on rateable values of more than
£50,000 for business properties only.
4.8. International Experience – New York Avenue - Florida Avenue Galludet
University Metro Station5
4.8.1. The New York Avenue-Florida Avenue Galludet University Metro Station was
proposed to become an important part of the district’s strategic economic
development plan, which was built with funds from private land owners, the District
of Columbia and the federal government.
4.8.2. The land owners were the key beneficiaries of the project, who were educated about
the impact of the project on land value by the District of Columbia’s Department of
Housing and Community Development. The landowners agreed to a pay a special
assessment over the period of 30 years to raise the funds.
4.8.3. This special assessment would be an additional charge on top of usual property taxes
that the District would collect along with the property taxes. The assessment district
was defined as commercially-zoned parcels that were within 2,500 feet (~800 meters)
of the transit station entrances but not within 1,250 feet (~400 meters) of Union
Station.
4.8.4. Council of the District of Columbia passed the New York Avenue Metro Special
Assessment Authorization Emergency Act of 2001 to create the special assessment
district and allow the district to collect the assessment.
4.8.5. The district began collecting the assessment from 2002. The District of Columbia
issued bonds to bring in the capital and repay the bonds using the funds collected
through the special assessment.
4.9. Learning from domestic and international experiences: Study of various
domestic and international scenarios as per paras 4.1 to 4.8 and detailed in above
shows that:
5 www.transportation–finance.org

Page 24 of 46
a) A nodal agency is identified or established to manage, collect and transfer funds
appropriated from the LVC instruments, to the different beneficiaries (such as
transit authorities, development agencies, urban local bodies, etc.).
b) Additional Stamp Duty (or surcharge on stamp duty) is collected by the stamp
and registrar office at state government level and transferred by state government
to the beneficiaries.
c) 50% to 100% of the proceeds under various LVC instruments are being
transferred to the rail-based infrastructure projects by the nodal agency / state
government either as operating cash flows or upfront by securitizing future
receipts.
4.10. Similar mechanism can be instituted for the identified LVC instruments for the RRTS
project. In case of RRTS, proceeds from these instruments can be allocated to the
project (Delhi-Ghaziabad-Meerut RRTS Corridor) and other appropriate beneficiaries
as necessary for each of the instruments and/or collectively from a dedicated fund.

5. Review of Existing Policy Framework in the state of Uttar
Pradesh
5.1. Review of current policy mechanisms for LVC instruments in Uttar Pradesh
- GDA and MDA being the planning and development authorities, with expert
understanding of the local areas, have reviewed the current policy mechanisms in the
state of Uttar Pradesh. These policies either enable or have potential for enabling the
implementation of the various suggested LVC instruments in para 2.1. This section of
the report discusses the current policy framework in Uttar Pradesh as regards LVC
instruments and brings out the steps required to be taken to enable the suggested
mechanisms.
5.2. Major Acts and Rules
5.2.1. The major acts, rules and policies relevant to the identified land value capture
instruments are listed below:
a) Indian Stamp Duty Act, 1899
• Uttar Pradesh Stamp Valuation Rules, 1997
b) Uttar Pradesh Planning and Development Act (UPPADA) of 1973
• Uttar Pradesh Urban Planning and Development (Assessment, Levy and
Collection of Development Fee) Rules, 2014
• Master Plans, Development Plans and Building Bye-Laws for Ghaziabad
and Meerut
• Planning norms, Zoning regulations and Building bye-laws for Mixed Use
and TOD – 2015
• The Uttar Pradesh Planning and Development (Procedure Regarding
Determination of the Betterment Charge by the Chairman) Rules, 1983
5.2.2. It was noted that there are no provisions for TOD Cess in the existing policy framework.
The regulatory framework relevant to the other instruments has been reviewed and
documented herein.
5.3. Uttar Pradesh Stamp Valuation Rules, 1997: The stamp duty on transactions in Uttar
Pradesh are levied under the Uttar Pradesh Stamp Valuation Rules, 1997. Refer
Annexure 11.
Page 26 of 46
(a) According to the Sub-Registrar Offices of Ghaziabad and Meerut, the stamp duty
rate currently levied in the GDA and MDA jurisdiction areas is 7%6.
(b) As per Uttar Pradesh Planning and Development Act (UPPADA) of 1973, the rate of
stamp duty could be increased by up to 5% through notification by the state
government (Sec 39, UPUPADA 1973). Refer Annexure 12.
5.4. Uttar Pradesh Urban Planning and Development Act (UPUPADA), 1973: The Uttar
Pradesh Urban Planning and Development Act, 1973 (Annexure 12) entitles the local
development Authority to prepare master plan, zonal development plans and bye-laws
for the purpose of carrying out development in their respective regions. Further, the Act
provisions the levy of betterment charges on increase in value of properties resulting
from execution of any development, and entitles the Authority to assess the betterment
charges to be levied. Additionally, the Act also provisions the levy of additional stamp
duty on certain transfer of properties situated within the development area, and entitles
the State Government to increase the percentage of stamp duty to be levied by up to five
by issuing the notification in Gazette.
5.5. Uttar Pradesh Urban Planning and Development (Assessment, Levy and Collection of
Development Fee) Rules, 2014):
(a) According to the Uttar Pradesh Planning and Development (Assessment, Levy and
Collection of Development Fee) Rules-2014 (Annexure 13), the development fees for
Ghaziabad and Meerut are notified as Rs. 2500 and Rs. 1000 per sq. m. respectively.
However based on cost index, the development fee rate are modified from time to time.
Refer Annexure 14.
(b) Apart from the above specified rates, sub-section (2-A) of section-15 of the rules,
states that, in case of special amenity or impact-oriented or zone-based development
(e.g., transit oriented development along mass transit corridors), an additional
development fee not exceeding 25 percent of the development fee prescribed in the
Schedule, may also be levied.
5.6. Master Plan/Development and Building Bye-Laws for Ghaziabad and Meerut (2011 and
2016): The Master Plan/Development Plan for Ghaziabad and Meerut along with the
respective bye-laws contain the development control regulations (DCRs). These DCRs
cover the permissible FAR and ground coverage according to land use and plot sizes.
The bye-laws also permit purchase of additional FAR subject to meeting certain
conditions. Refer Annexure 16.
6 Source: Primary interaction with officials of Stamp and Registrations Department; relevant notification not available; to be
provided by concerned Authority.
Page 27 of 46
5.7. Planning norms, Zoning regulations and Building bye-laws for Mixed Use and TOD –
2015: The Planning norms, Zoning regulations and Building Bye-laws for mixed use and
TOD – 2015 (refer Annexure 17); hereon referred as UP TOD Policy consists of the
guidelines, norms and standards for the following special activities along the transit
corridors in Uttar Pradesh.
a. Transit Oriented Development
b. Mixed Land Use
c. Provisions for land assembly
(a) The UP TOD Policy underlines the following criteria for implementing Transit
Oriented Development (TOD) in Uttar Pradesh along the transit corridors:
• The influence areas of MRTS/Transit/Metro Corridors to be earmarked as TOD
Zones in the Master Plan/Zonal Development Plan
• TOD Boundary can extend up to 500 m on either side of the
MRTS/transit/metro corridor whereas near metro stations, based on local
conditions and development potential, the delineation could be more than 500
m
• TOD Zone shall be earmarked based on physical features such as roads, railway
line, river/drain/canal etc.
• The zoning regulations and planning norms for all developments in the
earmarked TOD Zones shall be as per sections 1.3 and 1.4 of the said policy.
According to the policy, a maximum purchasable FAR of 4 is permitted in
developed and built-up areas on a minimum plot size of 0.5 ha while a
maximum purchasable FAR of 5 is permitted on a minimum plot size of 4 ha in
the TOD zones. The document also lists the bye laws for TOD Zones.
(b) The policy also has provisions for special mixed land use developments which are
permitted in the following cases specifically for new developments/ re-development
schemes:
• Development nodes around Expressways/Major Highways
• Transit Oriented Development (TOD) Zones along MRTS Corridors
• New Township/Integrated Township schemes
• Urban Re-development Schemes
• Potential Locations earmarked in Development Plan/Zonal Development Plan
The planning norms and bye-laws for above mentioned special cases on mixed land use
developments are given in the policy.
Page 28 of 46
(c) The policy also outlines the guidelines for land assembly in TOD zones and states
that,
• All parcels of land should be of same land use, in other case, land use
conversion has to be done
• Land parcels identified for assembly/amalgamation should be under single
ownership (person/firm/company)
• Minimum access road width shall be 18m
• On approval of the proposed land assembly/amalgamation in the approved
scheme/layout plan by the competent authority, the development authority
shall modify and incorporate the same in the layout plan
• Land assembly fee shall be 10% of the circle rate payable to the development
authority
5.8. The Uttar Pradesh Planning and Development (Procedure Regarding Determination of
the Betterment Charge by the Chairman) Rules, 1983: The Uttar Pradesh Planning and
Development (Procedure Regarding Determination of the Betterment Charge by the
Chairman) Rules, 1983 enlists the duty of the assessment of the betterment charges in
respect to any property to the Chairman (Annexure 15) as also the enabling procedure
for assessment of Betterment Charges. However, in current scenario, MDA and GDA
have not collected any charges under this provision.
5.9. Potential Avenues for Policy Interventions to enable implementation of
LVC instruments
In view of the assessment of the current policy framework for implementation of LVC
instruments in Uttar Pradesh, the Committee is of the view that there is a significant
potential to utilise the current policy framework in the state to enable revenue
generation from various sources. Policy interventions may be required in some cases
and the same have been listed out in Chapter 6 of the report. The potential avenues in
current framework are given in subsequent sections herein.
5.10. The following potential areas in the “Planning norms, Zoning regulations and Building
Bye-laws for Mixed Use and TOD – 2015” have been identified for intervention in order
to enable the implementation of the TOD concept and other various LVC instruments
for revenue generation for RRTS project
(a) The policy specifies that near ‘Metro Stations’, based on the local conditions and
development potential, the TOD boundary delineation could be more than 500m. In
view of this, it is desirable that stations of the RRTS project which is also approved
under the “Metro Act” are considered equivalent to metro stations. Also, since RRTS is a

Page 29 of 46
regional level project with a larger catchment area, the above provision enables
delineation of TOD influence zones beyond 500m.
(b) The policy specifies that 500 m on the either side of the MRTS/transit/metro corridor is
to be delineated as TOD influence area boundary. However, in case of RRTS, inter-
station distances being comparatively large, the impact on urban development is
expected to be more focused around the stations rather than along the corridor. Hence,
the influence zones for RRTS stations may be considered only at the level of station
influence areas.
(c) There is a potential to develop specifically identified Greenfield sites as Mixed Land Use
developments at potential locations earmarked in Development Plan/Zonal
Development Plan
5.11. Since the UPPADA 1973, has a provision to increase stamp duty, the instrument is seen
as a potential source for additional revenue generation.
5.12. The committee also sees an opportunity to utilize the provision of levying 25%
additional development fee due to the impact of the RRTS project as special amenity
project on the cities.
6. Prioritization of LVC instruments and Estimated Revenue
Potential
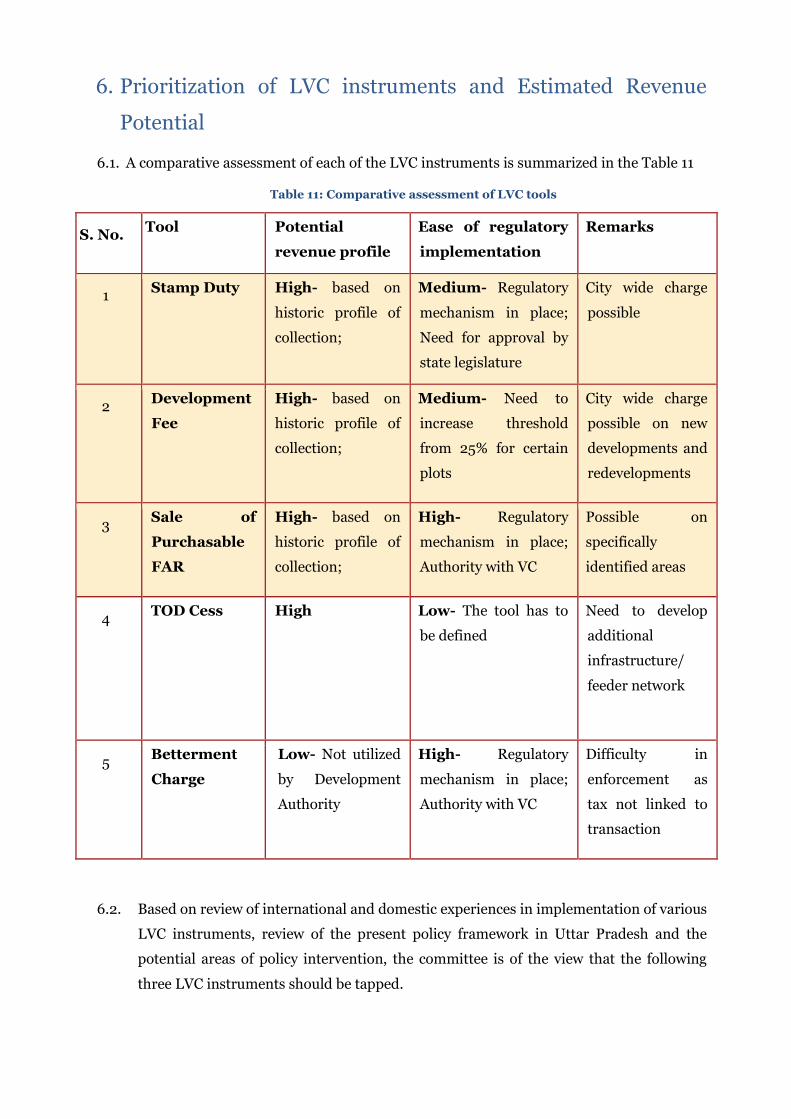
6.1. A comparative assessment of each of the LVC instruments is summarized in the Table 11
Table 11: Comparative assessment of LVC tools
S. No. Tool Potential
revenue profile
Ease of regulatory
implementation
Remarks
1 Stamp Duty High- based on
historic profile of
collection;
Medium- Regulatory
mechanism in place;
Need for approval by
state legislature
City wide charge
possible
2 Development
Fee
High- based on
historic profile of
collection;
Medium- Need to
increase threshold
from 25% for certain
plots
City wide charge
possible on new
developments and
redevelopments
3 Sale of
Purchasable
FAR
High- based on
historic profile of
collection;
High- Regulatory
mechanism in place;
Authority with VC
Possible on
specifically
identified areas
4 TOD Cess High Low- The tool has to
be defined
Need to develop
additional
infrastructure/
feeder network
5 Betterment
Charge
Low- Not utilized
by Development
Authority
High- Regulatory
mechanism in place;
Authority with VC
Difficulty in
enforcement as
tax not linked to
transaction
6.2. Based on review of international and domestic experiences in implementation of various
LVC instruments, review of the present policy framework in Uttar Pradesh and the
potential areas of policy intervention, the committee is of the view that the following
three LVC instruments should be tapped.
Page 31 of 46
1. Levy of additional Stamp Duty
2. Levy of additional Development Fee
3. Sale of Additional Purchasable FAR
o Around proposed RRTS Stations
o Development of Special Mixed Land Use Areas
6.3. The other instruments such as TOD Cess and Betterment Fee have not been considered
by the committee as either the potential of revenues has been identified to be low or
there are high regulatory interventions required in implementation of such instruments.
6.4. In reference to the terms of reference defined for the committee, the maximum and
realizable estimated potential of LVC sources identified in para 6.1 have been estimated.
The various recommendations and assumptions related to the estimation of revenue
have been discussed herein.
6.5. Levy of Additional Stamp Duty
6.5.1. The DPR has proposed the levy of an additional one percent (1%) Stamp Duty in the
entire jurisdiction areas of the respective authorities. The UPPADA, 1973 enables such
increase in additional stamp duty by up to 5% through a gazette notification.
6.5.2. The time period for estimation of revenue from levy of additional stamp duty has been
considered as 2019-2054.
6.5.3. Based on the actual realization of stamp duty revenue by GDA and MDA from
transfer/sales of properties for 2016-17, the revenue for 2019 as base year has been
estimated.
6.5.4. For estimation of maximum revenue potential from levy of additional stamp duty, an
annual increment of 3% has been considered for the whole time period in line with the
DPR. The annual increment reflects the increase in the number of transactions as well
as the increase in circle rates. This percentage has been considered at 3% from 2019-
2033 and 2% thereafter up to 2054 for the estimation of realizable revenue.
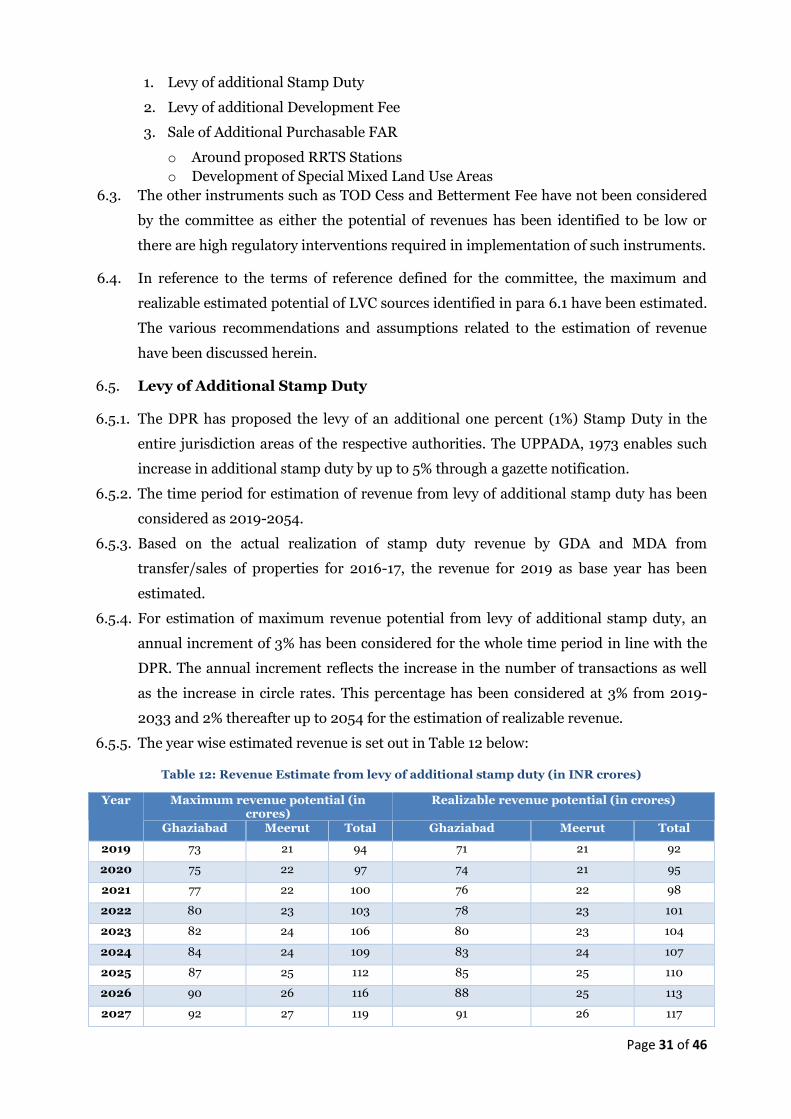
6.5.5. The year wise estimated revenue is set out in Table 12 below:
Table 12: Revenue Estimate from levy of additional stamp duty (in INR crores)
Year Maximum revenue potential (in crores)
Realizable revenue potential (in crores)
Ghaziabad Meerut Total Ghaziabad Meerut Total
2019 73 21 94 71 21 92
2020 75 22 97 74 21 95
2021 77 22 100 76 22 98
2022 80 23 103 78 23 101
2023 82 24 106 80 23 104
2024 84 24 109 83 24 107
2025 87 25 112 85 25 110
2026 90 26 116 88 25 113
2027 92 27 119 91 26 117
Page 32 of 46
Year Maximum revenue potential (in crores)
Realizable revenue potential (in crores)
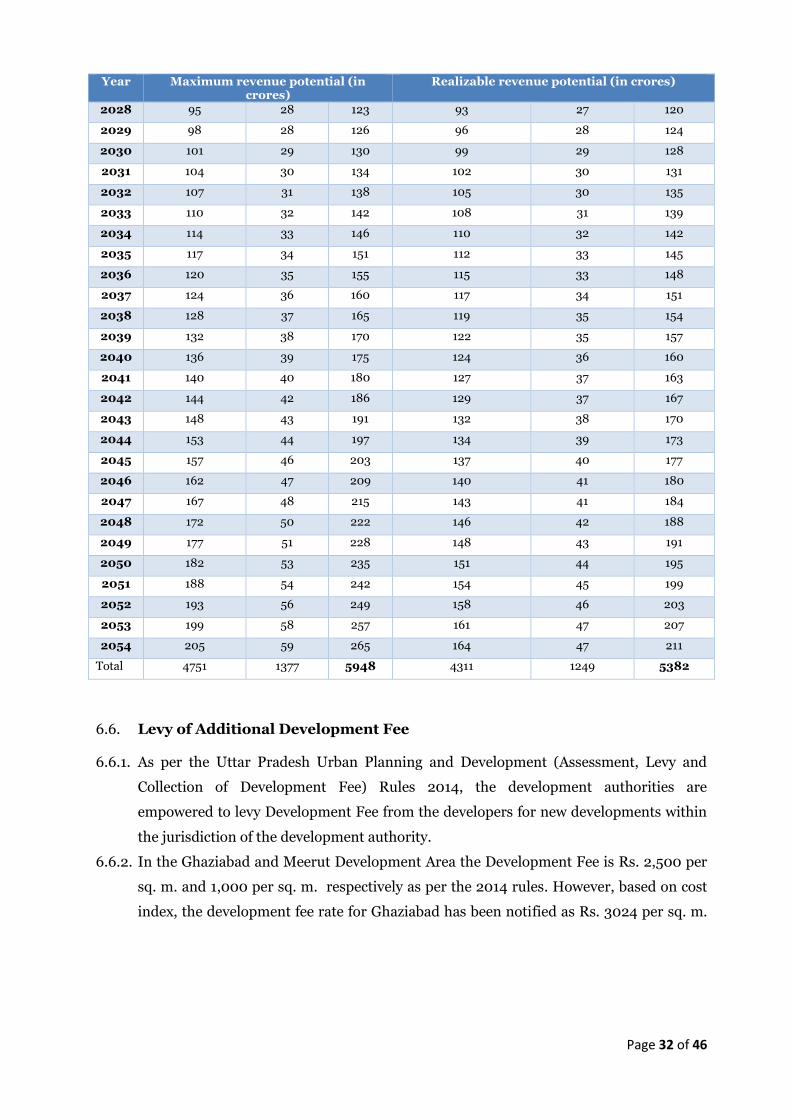
2028 95 28 123 93 27 120
2029 98 28 126 96 28 124
2030 101 29 130 99 29 128
2031 104 30 134 102 30 131
2032 107 31 138 105 30 135
2033 110 32 142 108 31 139
2034 114 33 146 110 32 142
2035 117 34 151 112 33 145
2036 120 35 155 115 33 148
2037 124 36 160 117 34 151
2038 128 37 165 119 35 154
2039 132 38 170 122 35 157
2040 136 39 175 124 36 160
2041 140 40 180 127 37 163
2042 144 42 186 129 37 167
2043 148 43 191 132 38 170
2044 153 44 197 134 39 173
2045 157 46 203 137 40 177
2046 162 47 209 140 41 180
2047 167 48 215 143 41 184
2048 172 50 222 146 42 188
2049 177 51 228 148 43 191
2050 182 53 235 151 44 195
2051 188 54 242 154 45 199
2052 193 56 249 158 46 203
2053 199 58 257 161 47 207
2054 205 59 265 164 47 211
Total 4751 1377 5948 4311 1249 5382
6.6. Levy of Additional Development Fee
6.6.1. As per the Uttar Pradesh Urban Planning and Development (Assessment, Levy and
Collection of Development Fee) Rules 2014, the development authorities are
empowered to levy Development Fee from the developers for new developments within
the jurisdiction of the development authority.
6.6.2. In the Ghaziabad and Meerut Development Area the Development Fee is Rs. 2,500 per
sq. m. and 1,000 per sq. m. respectively as per the 2014 rules. However, based on cost
index, the development fee rate for Ghaziabad has been notified as Rs. 3024 per sq. m.

Page 33 of 46
with effect from 1.4.2017 (refer Annexure 14). On similar lines, for Meerut, development
fee of Rs. 1210 per sq. m. has been considered7.
6.6.3. Based on the primary and secondary data analysis the vacant area in Ghaziabad and
Meerut Development Authority has been estimated to be 38% and 43% respectively of
the total jurisdiction area.
6.6.4. In such vacant areas, after making necessary deductions for roads, central greens,
utilities, social infrastructure etc. the net developable area has been considered to be
60% which has been split as 12% group housing and commercial development, 33% for
plotted developments and 15% for industrial developments. Additional development fee
of 25% has been considered for plotted and industrial development and 50% on group
housing and commercial developments. It is also been assumed that of the total vacant
land 30% of plotted, 50% of group housing and commercial and 50% of industrial
developments will be developed during the revenue estimation period; which translates
to 9% of the total jurisdiction area for Ghaziabad and 10.1% for Meerut.
6.6.5. For the already developed areas, only 10% of group housing and commercial and 10% of
plotted has been considered for additional development fee during the revenue
estimation period, which translates to 2.7% of the total jurisdiction area for Ghaziabad
and 2.6% for Meerut.
6.6.6. Based on the assumptions above, the estimated area that has been considered for
development / re-development, and hence falling within the ambit of additional
development fee for Ghaziabad, is a total of 11.7% (9%+2.7%) of the city area has been
considered. Likewise, for Meerut, a total of 12.7% (10.1%+2.6%) of the city area has been
considered for revenue estimation through additional development fee.
6.6.7. Considering that the entire city of Ghaziabad/Meerut is the catchment area/impact zone
of RRTS project being special amenity (ref. Development Fee Rules, 2014), an
additional Development Fee of 25% of base fee is proposed to be levied in the GDA and
MDA areas on all new developments/re-developments, whereas on plot sizes greater
than 10,000 sq. m. , an additional fee of 50% shall be levied.
6.6.8. For estimation of maximum revenue potential from levy of additional Development Fee,
an annual increment of 5% in line with the DPR has been considered on the rates as
given in para 6.6.2
6.6.9. For the purpose of estimation of realizable revenue, the annual increment in
development fee has been considered as 3% and the percentage of additional fee for all
plot sizes has been considered as 25% (including those greater than 10,000 sq. m. ).
7 Relevant notification not available; hence, assumed similar cost index as that in case of Ghaziabad has
been used to estimate present development fee.

Page 34 of 46
6.6.10. Demand for additional stock picks up as project nears start of commercial operations.
Delhi-Meerut RRTS is expected to begin full commercial operations in July, 2024.
Therefore, the time period for estimation of revenue from levy of additional
Development Fee has been considered as 2024-2054.
6.6.11. The estimated revenue from the additional development fee is as shown in Table 13
below.
Table 13: Revenue Estimate from levy of additional Development Fee (in INR Cr)
Year (FY) Development Phasing
Maximum revenue potential Realisable revenue potential
Ghaziabad Meerut Total Ghaziabad Ghaziabad Meerut
2024 5% 46.9 21.7 68.6 29.9 15.7 45.6
2025 5% 49.3 22.7 72.0 30.8 16.4 47.3
2026 6% 62.1 28.7 90.7 38.1 20.7 58.8
2027 7% 76.0 35.1 111.1 45.8 25.4 71.2
2028 7% 79.8 36.9 116.7 47.2 26.6 73.8
2029 7% 119.8 55.3 175.0 69.4 40.0 109.4
2030 7% 125.7 58.0 183.8 71.5 42.0 113.5
2031 7% 92.4 42.7 135.1 51.6 30.8 82.4
2032 5% 69.3 32.0 101.3 37.9 23.1 61.1
2033 5% 72.8 33.6 106.4 39.1 24.3 63.4
2034 3% 76.4 35.3 111.7 40.2 25.5 65.7
2035 3% 48.1 22.2 70.4 24.9 16.1 40.9
2036 3% 50.6 23.3 73.9 25.6 16.9 42.5
2037 2% 53.1 24.5 77.6 26.4 17.7 44.1
2038 2% 37.2 17.2 54.3 18.1 12.4 30.5
2039 1% 39.0 18.0 57.0 18.7 13.0 31.7
2040 1% 20.5 9.5 29.9 9.6 6.8 16.4
2041 1% 21.5 9.9 31.4 9.9 7.2 17.1
2042 1% 22.6 10.4 33.0 10.2 7.5 17.7
2043 1% 23.7 10.9 34.7 10.5 7.9 18.4
2044 1% 24.9 11.5 36.4 10.8 8.3 19.1
2045 1% 26.1 12.1 38.2 11.1 8.7 19.9
2046 1% 27.4 12.7 40.1 11.5 9.2 20.6
2047 1% 28.8 13.3 42.1 11.8 9.6 21.4
2048 1% 30.3 14.0 44.2 12.2 10.1 22.3
2049 1% 31.8 14.7 46.4 12.5 10.6 23.1
2050 1% 33.4 15.4 48.8 12.9 11.1 24.0
2051 1% 35.0 16.2 51.2 13.3 11.7 25.0
2052 1% 36.8 17.0 53.8 13.7 12.3 26.0
2053 1% 38.6 17.8 56.5 14.1 12.9 27.0
2054 1% 40.6 18.7 59.3 14.5 13.5 28.1
Total 1540.5 711.1 2251.6 794.1 514.0 1308.1
6.7. Sale of Additional Purchasable FAR- Station Area TOD Zones
Page 35 of 46
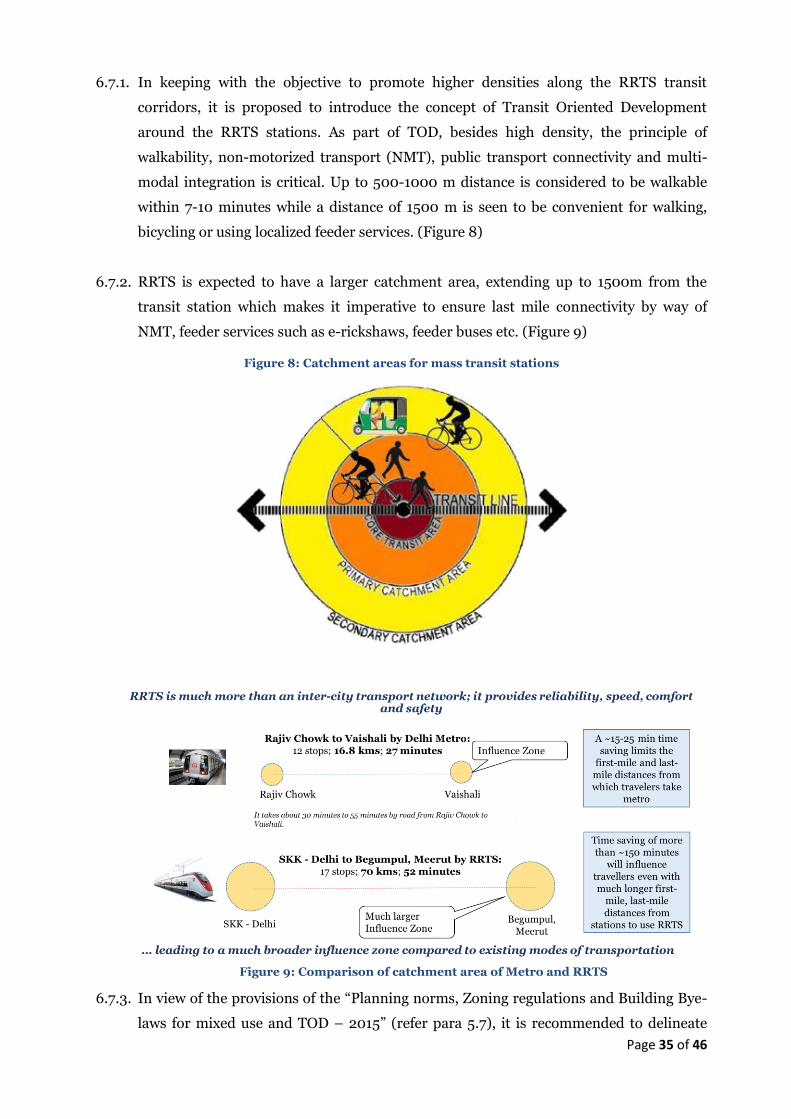
6.7.1. In keeping with the objective to promote higher densities along the RRTS transit
corridors, it is proposed to introduce the concept of Transit Oriented Development
around the RRTS stations. As part of TOD, besides high density, the principle of
walkability, non-motorized transport (NMT), public transport connectivity and multi-
modal integration is critical. Up to 500-1000 m distance is considered to be walkable
within 7-10 minutes while a distance of 1500 m is seen to be convenient for walking,
bicycling or using localized feeder services. (Figure 8)
6.7.2. RRTS is expected to have a larger catchment area, extending up to 1500m from the
transit station which makes it imperative to ensure last mile connectivity by way of
NMT, feeder services such as e-rickshaws, feeder buses etc. (Figure 9)
Figure 8: Catchment areas for mass transit stations
Figure 9: Comparison of catchment area of Metro and RRTS
6.7.3. In view of the provisions of the “Planning norms, Zoning regulations and Building Bye-
laws for mixed use and TOD – 2015” (refer para 5.7), it is recommended to delineate
Page 36 of 46
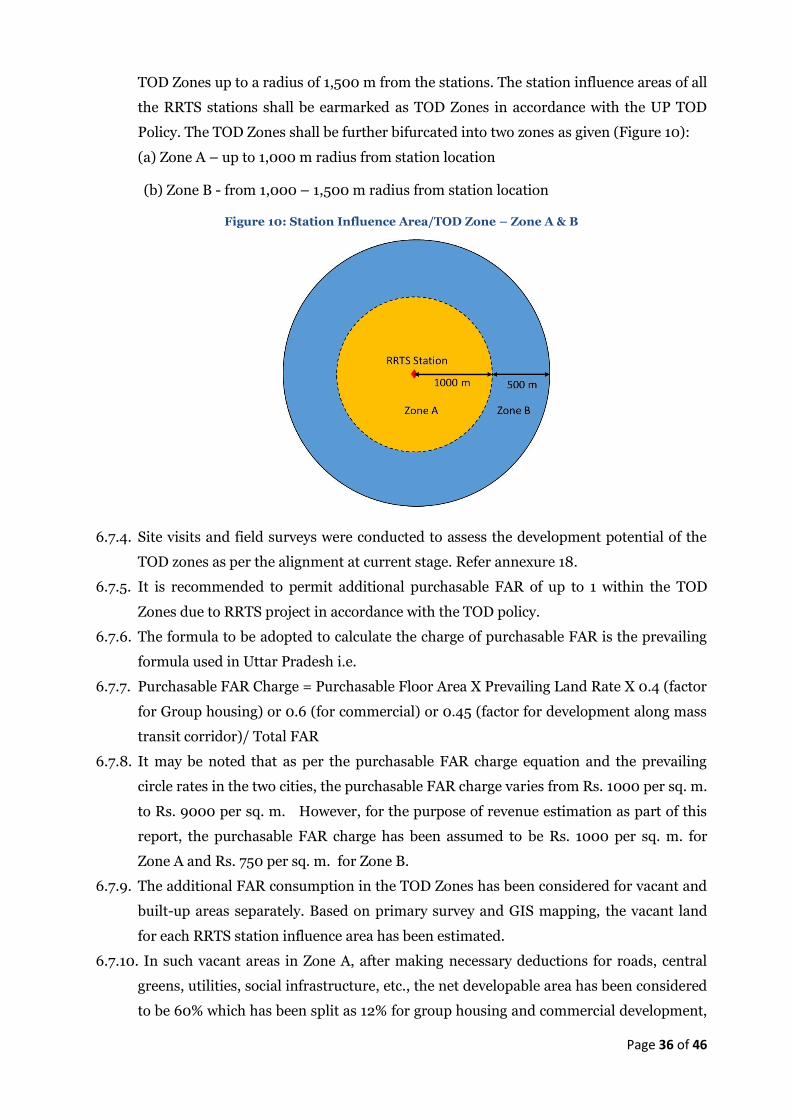
TOD Zones up to a radius of 1,500 m from the stations. The station influence areas of all
the RRTS stations shall be earmarked as TOD Zones in accordance with the UP TOD
Policy. The TOD Zones shall be further bifurcated into two zones as given (Figure 10):
(a) Zone A – up to 1,000 m radius from station location
(b) Zone B - from 1,000 – 1,500 m radius from station location
Figure 10: Station Influence Area/TOD Zone – Zone A & B
6.7.4. Site visits and field surveys were conducted to assess the development potential of the
TOD zones as per the alignment at current stage. Refer annexure 18.
6.7.5. It is recommended to permit additional purchasable FAR of up to 1 within the TOD
Zones due to RRTS project in accordance with the TOD policy.
6.7.6. The formula to be adopted to calculate the charge of purchasable FAR is the prevailing
formula used in Uttar Pradesh i.e.
6.7.7. Purchasable FAR Charge = Purchasable Floor Area X Prevailing Land Rate X 0.4 (factor
for Group housing) or 0.6 (for commercial) or 0.45 (factor for development along mass
transit corridor)/ Total FAR
6.7.8. It may be noted that as per the purchasable FAR charge equation and the prevailing
circle rates in the two cities, the purchasable FAR charge varies from Rs. 1000 per sq. m.
to Rs. 9000 per sq. m. However, for the purpose of revenue estimation as part of this
report, the purchasable FAR charge has been assumed to be Rs. 1000 per sq. m. for
Zone A and Rs. 750 per sq. m. for Zone B.
6.7.9. The additional FAR consumption in the TOD Zones has been considered for vacant and
built-up areas separately. Based on primary survey and GIS mapping, the vacant land
for each RRTS station influence area has been estimated.
6.7.10. In such vacant areas in Zone A, after making necessary deductions for roads, central
greens, utilities, social infrastructure, etc., the net developable area has been considered
to be 60% which has been split as 12% for group housing and commercial development,

Page 37 of 46
33% for plotted developments and 15% for industrial developments. On the 12% group
housing and commercial component it is assumed that 100% developments shall avail
the additional FAR within the revenue estimation period. Likewise, on the 33% plotted,
only 25% of the development has been considered for estimating additional FAR.
6.7.11. For the already developed areas in Zone A, only 10% of the overall built-up area has
been considered for additional FAR.
6.7.12. For vacant areas in Zone B, on the 12% group housing and commercial component it is
assumed that 50% developments shall avail the additional FAR within the revenue
estimation period. Likewise, on the 33% plotted, only 25% of the development has been
considered for additional FAR.
6.7.13. For the already developed areas in Zone B, only 5% of the overall built-up area has been
considered for additional FAR.
6.7.14. Based on the assumptions as above, In Zone A, only 20% of the additional purchasable
FAR in undeveloped areas, and 10% of the additional purchasable FAR in
developed/built-up areas has been considered for potential revenue estimation.
Likewise, for Zone B, only 14% of the additional purchasable FAR in undeveloped areas
and 5% of the additional purchasable FAR in developed/built-up areas, has been
considered for revenue calculations.
6.7.15. For estimation of maximum revenue potential from sale of additional FAR, an annual
increment of 5% has been considered in line with the DPR on the charge as given in
para 6.7.8. This percentage has been decreased to 3% for the estimation of realizable
revenue.
6.7.16. Demand for additional stock picks up as project nears start of commercial operations.
Delhi-Meerut RRTS is expected to begin full commercial operations in July, 2024.
Therefore, the time period for estimation of revenue from sale of additional FAR has
been considered as 2024-2054.
6.7.17. The Table 14 below gives the total estimated maximum and realizable revenue from the
sale of additional FAR in the earmarked TOD zones. The assumptions towards
absorption rate for sale of additional FAR are given in Annexure 19.
Table 14: Revenue Estimates from Sale of Additional FAR (in INR crores)
Year Maximum revenue potential (in crores) Realizable revenue potential (in crores)
Ghaziabad Meerut Total Ghaziabad Meerut Total
2024 7.0 11.5 18.5 6.0 9.9 15.8
2025 7.3 12.1 19.4 6.1 10.2 16.3
2026 12.1 19.9 32.0 10.0 16.4 26.4
2027 12.7 20.9 33.6 10.3 16.9 27.2
2028 20.5 34.0 54.5 16.3 27.0 43.2
2029 22.8 37.8 60.6 17.8 29.4 47.2
2030 31.9 52.9 84.8 24.4 40.4 64.8

Page 38 of 46
Year Maximum revenue potential (in crores) Realizable revenue potential (in crores)
2031 33.5 55.5 89.1 25.1 41.6 66.7
2032 38.2 63.2 101.4 28.1 46.3 74.4
2033 44.7 74.0 118.7 32.3 53.2 85.5
2034 50.3 83.0 133.3 35.6 58.6 94.2
2035 37.6 61.8 99.4 26.1 42.7 68.8
2036 41.3 67.9 109.2 28.1 46.0 74.1
2037 43.4 71.2 114.7 29.0 47.4 76.3
2038 43.5 71.6 115.1 28.5 46.7 75.2
2039 33.4 54.6 88.0 21.5 34.9 56.3
2040 30.6 50.2 80.8 19.3 31.5 50.8
2041 32.1 52.7 84.8 19.9 32.4 52.3
2042 21.7 35.6 57.2 13.1 21.5 34.6
2043 12.7 20.8 33.4 7.5 12.3 19.8
2044 13.3 21.8 35.1 7.8 12.6 20.4
2045 14.0 22.9 36.8 8.0 13.0 21.0
2046 14.7 24.0 38.7 8.2 13.4 21.6
2047 12.3 20.2 32.4 6.7 11.1 17.8
2048 12.9 21.2 34.1 7.0 11.4 18.4
2049 13.5 22.3 35.8 7.2 11.8 18.9
2050 14.2 23.4 37.6 7.4 12.1 19.5
2051 14.9 24.5 39.4 7.6 12.5 20.1
2052 15.6 25.8 41.4 7.8 12.8 20.7
2053 16.4 27.1 43.5 8.1 13.2 21.3
2054 17.2 28.4 45.7 8.3 13.6 21.9
Total 736.3 1212.8 1949.0 488.8 802.7 1291.5
6.8. Sale of Additional FAR- Special Mixed Use Development Areas
6.8.1. The four specifically identified land parcels in DPR, with a total area up to 1396 ha along
the RRTS corridor are recommended to be developed as “Special Mixed Use
Development” areas in accordance with the Planning norms, Zoning regulations and
building bye-laws for mixed use and TOD- 2015. GDA and MDA may identify additional
area to be qualified as special mixed use development areas.
6.8.2. It is recommended to permit additional purchasable FAR of up to 1 due to RRTS on the
gross area within these special mixed use development areas earmarked, in accordance
with the Planning norms, Zoning regulations and building bye-laws for mixed use and
TOD- 2015.
6.8.3. The formula to be adopted to calculate the charge of purchasable FAR is the prevailing
formula used in Uttar Pradesh i.e.
Purchasable FAR Charge = Purchasable Floor Area X Prevailing Land Rate X 0.4
(factor for Group housing) or 0.6 (for commercial) or 0.45 (factor for development
along mass transit corridor)/ Total FAR

Page 39 of 46
6.8.4. For the purpose of revenue estimation as part of this report, the purchasable FAR
charge has been assumed to be Rs. 1000 per sq. m.
6.8.5. Since these areas are proposed to be earmarked as Mixed Land Use areas, the additional
FAR is considered on the gross area as per the provisions of the policy.
6.8.6. In accordance with the policy guidelines, 50% of the area is proposed to be developed as
residential and 25% as commercial/office/institutional. The additional FAR is therefore
considered on 75% of the gross land area.
6.8.7. For the purposes of revenue assessment it is assumed that 60% of the development will
take place during the revenue estimation period, hence 45% of the gross area has been
considered for additional purchasable FAR for revenue calculations.
6.8.8. For estimation of maximum revenue potential from sale of additional FAR from special
mixed use development areas, an annual increment of 5% in line with the DPR has been
considered on the charge as given in para 6.8.4. This percentage has been decreased to
3% for the estimation of realizable revenue.
6.8.9. Demand for additional stock picks up as project nears start of commercial operations.
Delhi-Meerut RRTS is expected to begin full commercial operations in July, 2024.
Therefore, the time period for estimation of revenue from special mixed use
development areas has been considered as 2024-2054.
6.8.10. Table 15 below gives the total estimated maximum and realizable revenue from the sale
of additional FAR in the earmarked TOD zones.
Table 15: Revenue Estimate from “Special Mixed Use Development” areas (in INR Cr)
Year Maximum revenue Potential
(in crores) Realizable revenue potential
(in crores)
2024 18.6 15.9
2025 19.5 16.4
2026 20.5 16.9
2027 21.5 17.4
2028 33.8 26.9
2029 35.5 27.7
2030 37.3 28.5
2031 39.2 29.4
2032 68.6 50.4
2033 72.0 51.9
2034 105.8 74.9
2035 111.1 77.1
2036 116.7 79.4
2037 140.0 93.5
2038 128.6 84.3
2039 96.5 62.0
2040 101.3 63.9
2041 63.8 39.5
Page 40 of 46
Year Maximum revenue Potential
(in crores) Realizable revenue potential
(in crores)
2042 67.0 40.6
2043 70.4 41.9
2044 49.3 28.7
2045 51.7 29.6
2046 54.3 30.5
2047 57.0 31.4
2048 29.9 16.2
2049 31.4 16.7
2050 33.0 17.2
2051 34.7 17.7
2052 36.4 18.2
2053 38.2 18.8
2054 40.1 19.3
Total 1823.7 1182.5
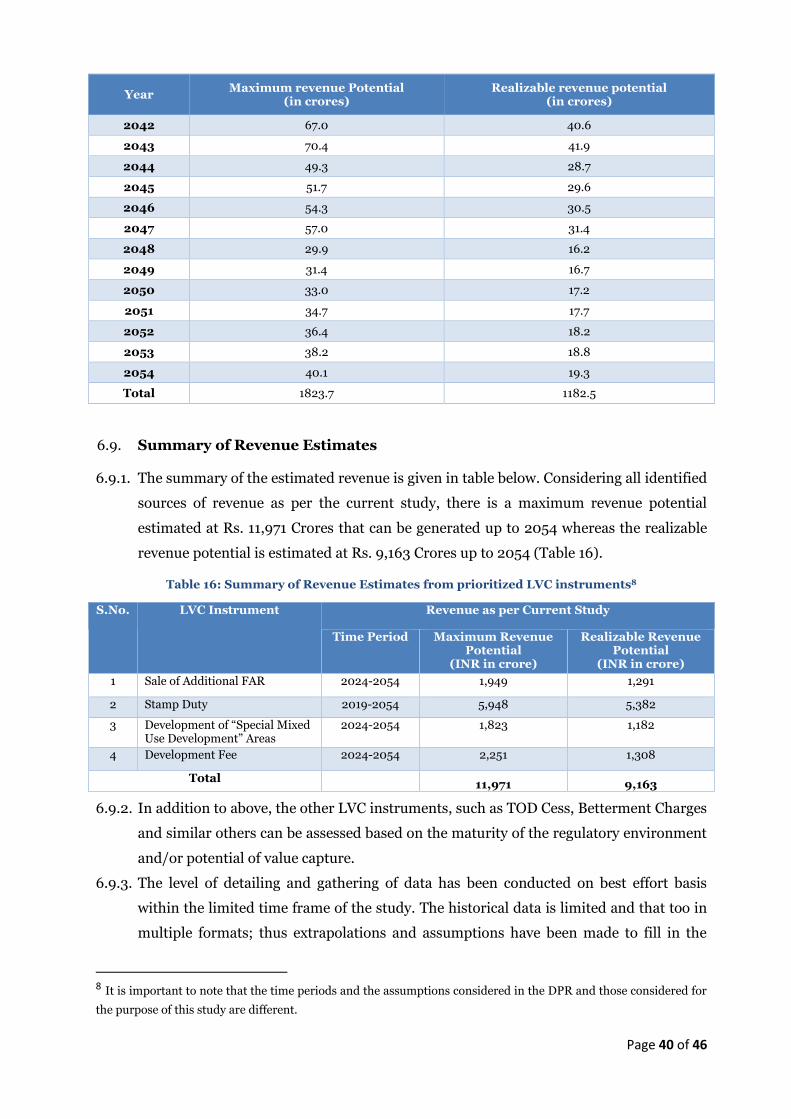
6.9. Summary of Revenue Estimates
6.9.1. The summary of the estimated revenue is given in table below. Considering all identified
sources of revenue as per the current study, there is a maximum revenue potential
estimated at Rs. 11,971 Crores that can be generated up to 2054 whereas the realizable
revenue potential is estimated at Rs. 9,163 Crores up to 2054 (Table 16).
Table 16: Summary of Revenue Estimates from prioritized LVC instruments8
S.No. LVC Instrument Revenue as per Current Study
Time Period Maximum Revenue Potential
(INR in crore)
Realizable Revenue Potential
(INR in crore)
1 Sale of Additional FAR 2024-2054 1,949 1,291
2 Stamp Duty 2019-2054 5,948 5,382
3 Development of “Special Mixed Use Development” Areas
2024-2054 1,823 1,182
4 Development Fee 2024-2054 2,251 1,308
Total 11,971 9,163
6.9.2. In addition to above, the other LVC instruments, such as TOD Cess, Betterment Charges
and similar others can be assessed based on the maturity of the regulatory environment
and/or potential of value capture.
6.9.3. The level of detailing and gathering of data has been conducted on best effort basis
within the limited time frame of the study. The historical data is limited and that too in
multiple formats; thus extrapolations and assumptions have been made to fill in the
8 It is important to note that the time periods and the assumptions considered in the DPR and those considered for
the purpose of this study are different.

Page 41 of 46
gaps. In some cases there is no precedence or prior experience/data. The projections
arrived in this report are forward looking that inherently can be impacted by
macroeconomic risks and other uncertainties.
Page 42 of 46
7. Recommendations and Action Plan
7.1. Recommendations
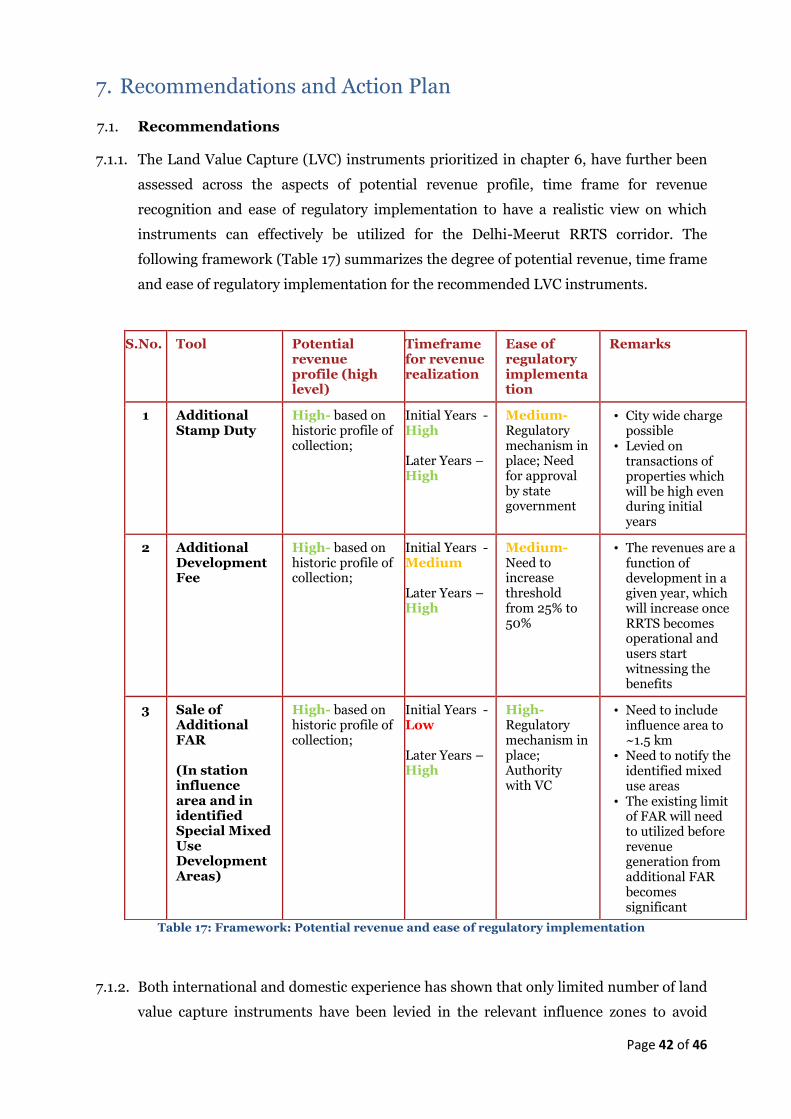
7.1.1. The Land Value Capture (LVC) instruments prioritized in chapter 6, have further been
assessed across the aspects of potential revenue profile, time frame for revenue
recognition and ease of regulatory implementation to have a realistic view on which
instruments can effectively be utilized for the Delhi-Meerut RRTS corridor. The
following framework (Table 17) summarizes the degree of potential revenue, time frame
and ease of regulatory implementation for the recommended LVC instruments.
Table 17: Framework: Potential revenue and ease of regulatory implementation
7.1.2. Both international and domestic experience has shown that only limited number of land
value capture instruments have been levied in the relevant influence zones to avoid
S.No. Tool Potential revenue profile (high level)
Timeframe for revenue realization
Ease of regulatory implementation
Remarks
1 Additional Stamp Duty
High- based on historic profile of collection;
Initial Years - High Later Years – High
Medium- Regulatory mechanism in place; Need for approval by state government
• City wide charge possible
• Levied on transactions of properties which will be high even during initial years
2 Additional Development Fee
High- based on historic profile of collection;
Initial Years - Medium Later Years – High
Medium- Need to increase threshold from 25% to 50%
• The revenues are a function of development in a given year, which will increase once RRTS becomes operational and users start witnessing the benefits
3 Sale of Additional FAR (In station influence area and in identified Special Mixed Use Development Areas)
High- based on historic profile of collection;
Initial Years - Low Later Years – High
High- Regulatory mechanism in place; Authority with VC
• Need to include influence area to ~1.5 km
• Need to notify the identified mixed use areas
• The existing limit of FAR will need to utilized before revenue generation from additional FAR becomes significant

Page 43 of 46
multiplicity of taxes on the beneficiaries. The following table proposes the land value
capture instruments and the respective region of implementation for revenue
realization in context of Delhi-Meerut RRTS corridor. (Table 18)
Table 18: Region of Implementation of LVC instruments
(Note: Only Additional Stamp Duty and Additional Development Fee are tax-based instruments recommended here; none of the beneficiaries would be paying for more than two suggested LVC tools above)
Basis the recommendations in para 7.1.1 and para 7.1.2 as detailed in chapter 6, the committee
proposes
7.1.3. An additional 1% Stamp Duty to be levied in the GDA and MDA areas on all
transactions. The entire proceeds of this additional stamp duty will go towards RRTS
project (refer para 6.5)
7.1.4. Considering that the entire city of Ghaziabad/Meerut would be the influence zones for
the RRTS project, an additional Development Fee of 25% of base fee (as per
Development Fee Rules, 2014) shall be levied in the GDA and MDA areas on all new
developments/re-developments. Further it is recommended to increase this fee to 50%
on plot sizes greater than 10,000 sq. m. (refer para 6.6)
7.1.5. In accordance with the planning norms, zoning regulations and building bye-laws for
Mixed Use and TOD- 2015 (UP TOD Policy), based on local conditions and development
potential, the influence area identified for TOD zone around RRTS stations is proposed
to be extended up to 1500m radius around station location. The same to be notified as
TOD Zones, wherein the sale of additional purchasable FAR is recommended as per the
UP TOD Policy. (refer para 6.7)
7.1.6. Four land parcels as identified in DPR and any other additional/alternative areas
(~1,500 ha. or more) along the RRTS corridor are recommended to be developed as
“Special Mixed Use Development” areas in accordance with the Planning norms, Zoning
S.No. Tool Region of implementation
1. Additional Stamp Duty Entire jurisdiction areas of Authorities of: • Ghaziabad • Meerut
2. Additional Development Fee
• New developments / re-developments within the jurisdiction of respective Development Authorities of Ghaziabad and Meerut
3a. Sale of Additional Purchasable FAR (Station Area TOD Zone)
• Within radius of 1500 m of all RRTS stations
3b. Sale of Additional Purchasable FAR (Special Mixed Use Development)
• Four specifically identified land parcels and any other additional/alternative areas along the RRTS corridor (total area of ~1500 Ha. or more)
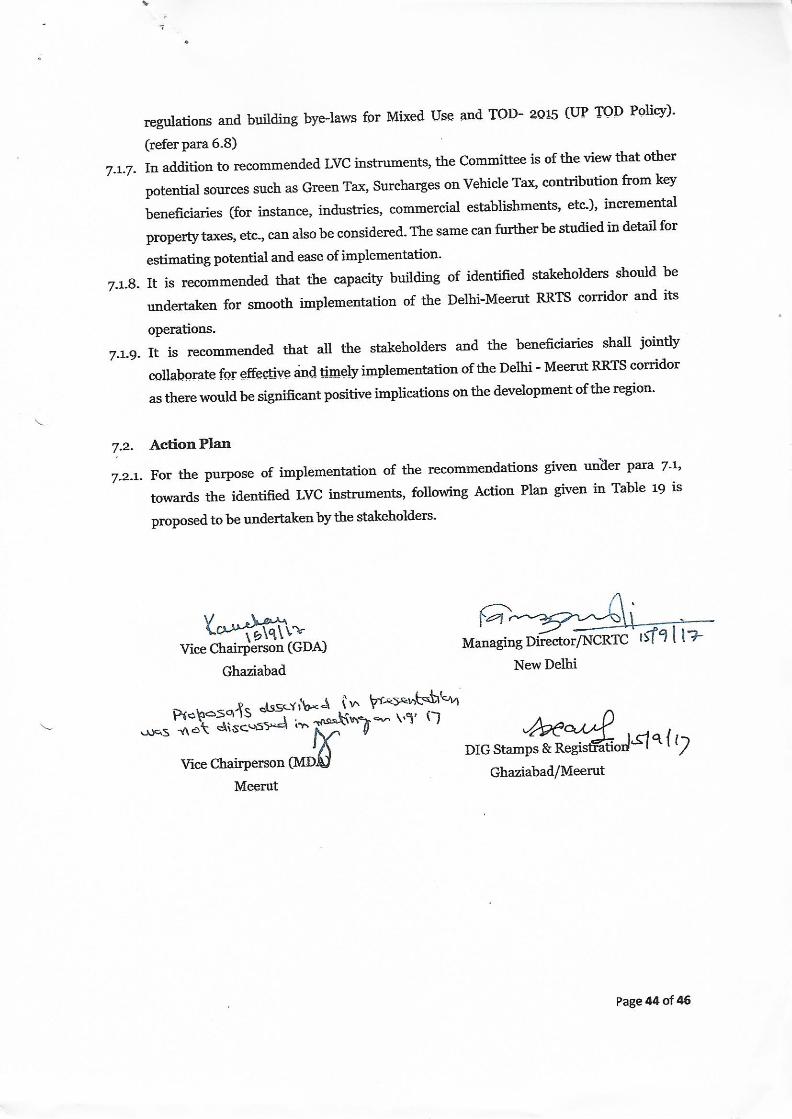
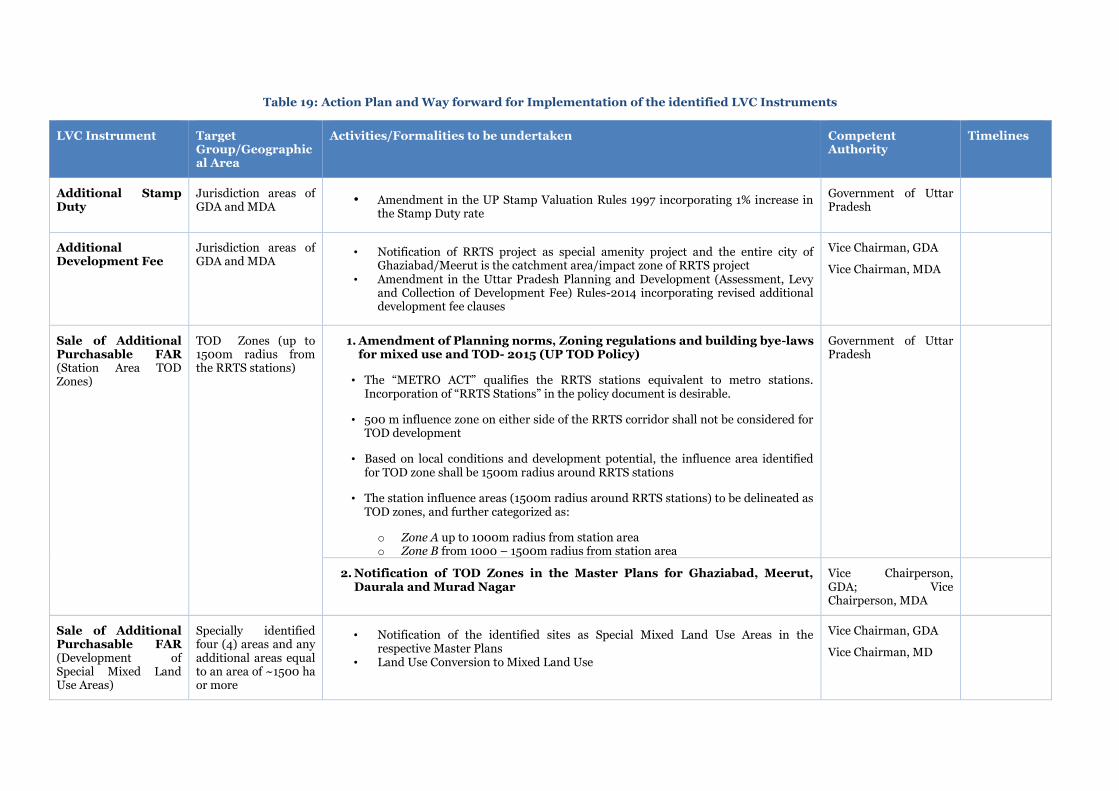
Table 19: Action Plan and Way forward for Implementation of the identified LVC Instruments
LVC Instrument Target Group/Geographical Area
Activities/Formalities to be undertaken Competent Authority
Timelines
Additional Stamp Duty
Jurisdiction areas of GDA and MDA
• Amendment in the UP Stamp Valuation Rules 1997 incorporating 1% increase in the Stamp Duty rate
Government of Uttar Pradesh
Additional Development Fee
Jurisdiction areas of GDA and MDA
• Notification of RRTS project as special amenity project and the entire city of Ghaziabad/Meerut is the catchment area/impact zone of RRTS project
• Amendment in the Uttar Pradesh Planning and Development (Assessment, Levy and Collection of Development Fee) Rules-2014 incorporating revised additional development fee clauses
Vice Chairman, GDA
Vice Chairman, MDA
Sale of Additional Purchasable FAR (Station Area TOD Zones)
TOD Zones (up to 1500m radius from the RRTS stations)
1. Amendment of Planning norms, Zoning regulations and building bye-laws for mixed use and TOD- 2015 (UP TOD Policy)
• The “METRO ACT” qualifies the RRTS stations equivalent to metro stations. Incorporation of “RRTS Stations” in the policy document is desirable.
• 500 m influence zone on either side of the RRTS corridor shall not be considered for TOD development
• Based on local conditions and development potential, the influence area identified for TOD zone shall be 1500m radius around RRTS stations
• The station influence areas (1500m radius around RRTS stations) to be delineated as TOD zones, and further categorized as:
o Zone A up to 1000m radius from station area o Zone B from 1000 – 1500m radius from station area
Government of Uttar Pradesh
2. Notification of TOD Zones in the Master Plans for Ghaziabad, Meerut, Daurala and Murad Nagar
Vice Chairperson, GDA; Vice Chairperson, MDA
Sale of Additional Purchasable FAR (Development of Special Mixed Land Use Areas)
Specially identified four (4) areas and any additional areas equal to an area of ~1500 ha or more
• Notification of the identified sites as Special Mixed Land Use Areas in the respective Master Plans
• Land Use Conversion to Mixed Land Use
Vice Chairman, GDA
Vice Chairman, MD
