regional profile—east marine region...regional profile—east marine region description of...
TRANSCRIPT
Regional Profile—East MarineRegion
Description of commercial, recreational and charter fishing activities
Anthony Moore, Rupert Summerson, Phil Sahlqvist, Shannon Kellett, Alex McNee, Cecily Maller, Simon Vieira, Patrick Stakelum, James Larcombe, James Woodhams and Julia Pickworth
© Commonwealth of Australia 2007 This work is copyright. Apart from any use as permitted under the Copyright Act 1968, no part may be reproduced by any process without prior written permission from the Commonwealth. Requests and inquiries concerning reproduction and rights should be addressed to the Commonwealth Copyright Administration, Attorney General’s Department, Robert Garran Offices, National Circuit, Barton ACT 2600 or posted at http://www.ag.gov.au/cca.
The Australian Government acting through the Bureau of Rural Sciences has exercised due care and skill in the preparation and compilation of the information and data set out in this publication. Notwithstanding, the Bureau of Rural Sciences, its employees and advisers disclaim all liability, including liability for negligence, for any loss, damage, injury, expense or cost incurred by any person as a result of accessing, using or relying upon any of the information or data set out in this publication to the maximum extent permitted by law.
Postal address: Bureau of Rural Sciences GPO Box 858 Canberra, ACT 2601
Copies available from: BRS Publication Sales GPO Box 858 Canberra ACT 2601
Ph: 1800 020 157 Fax: 02 6272 2330 Email: [email protected] Internet: http://www.brs.gov.au
East Marine Region – description of commercial, recreational and charter fishing activities ii

Executive Summary East Marine Region The East Marine Region (EMR) covers more than 2.4 million
square kilometres of water off the east coast of Queensland and New South Wales (including Lord Howe Island and Norfolk Island), from the town of Bermagui to the tip of Cape York. The Region includes waters between 3 and 200 n. miles from the coastline but does not include the Great Barrier Reef Marine Park, which is managed separately by the Great Barrier Reef Marine Park Authority.
Socio-economics Commercial fishing generates both direct and indirect employment opportunities in coastal regions and can be a substantial contributor to the economic and social wellbeing of communities. Key indicators of social and economic wellbeing include: • Key landing and/or home ports
• Fishing sector employment
• Regional dependence on fishing and
• An overview of recent changes affecting fisheries in the EMR.
Employment It is estimated that 3,600 persons are employed in commercial fishing in the EMR, representing 0.2% of the total employment for the region. It is recognised this is indicative only as it does not reflect unpaid family workers, prevalent in the sector, and high levels of seasonal casual employment (Larcombe et. al. 2006). Employment data for fishing were obtained from 2001 Census data from the Australian Bureau of Statistics. Data from the 2006 Census will be released in late October, 2007 but this data was not available at the time of writing.
Regional Fisheries Employment by key ports
Main Port Fishing employment (% of total regional employment)
Cairns < 1a 0.5b
Innisfail 1.4b
Townsville 1.3b
Mackay 0.3b
Gladstone 0.6b
Bundaberg 0.8b
(Mooloolaba < 1a 0.4b
Brisbane 0.2b
Southport 0.1b
Coffs < 1a 1.1b
Harbour
Sydney 0.1b
Ulladulla 0.5b
Bermagui 2.3b
East Marine Region – description of commercial, recreational and charter fishing activities iii

Key Ports The key ports for commercial fishing in the EMR include: Cairns, Innisfail, Townsville, Mackay, Gladstone, Bundaberg, Mooloolaba, Brisbane, and Southport in Queensland (Qld), and Coffs Harbour, Sydney, Ulladulla, and Bermagui in New South Wales (NSW). Employment data suggests that Bermagui, Innisfail and Townsville are the ports with the highest dependencies on commercial fishing in the EMR. This said, dependency studies suggest all key ports had a strong reliance on fishing related industries.
Fisheries Fisheries within the region target a broad range of species—from sedentary Beche-de-mer on reefs in the Coral Sea, to wide-ranging pelagic species such as tunas and billfish, targeted within the EMR and indeed in international waters beyond the Australian Fishing Zone (AFZ). Details of fishing gear used in the region can be found in Appendix 4. A snapshot of the value of fishing in the region is provided in the following table. Full details of catch volume and value by fishery can be found in the overview table at the end of the executive summary.
Estimated value of commercial fishing in the EMR*
Fishery Value $m
Qld 60.9
NSW 30.1
Australian Government
230.47+
Combined 321.47
Total Australian Fisheries
213 000#
* values are calculated for proportions of fishing activity that occurs within the EMR and in many cases have been extrapolated from whole fishery data and may be under or over representation. + Some fisheries will be underrepresented due to the five boat rule and the break up of each fishery # 2005/06 figure includes aquaculture production
It is important to remember that while every effort has been made within this report to present information relevant to the EMR and associated planning, many species of fish targeted commercially are highly mobile. Fisheries, both Commonwealth and State, are usually defined by where fish and fishers are, which unfortunately does not always neatly overlap with the biogeographic regionalisation that underpin regional marine planning. A true picture of fishing effort and regional dependencies for a particular fishery may require consideration of information presented for several adjacent regional marine areas.
Summaries of commercial fishing activity in the EMR are presented in the overview table below
Recreational Fishing The two States bounded by the EMR (NSW & Qld) were shown in the national survey to have the highest participation in recreational
East Marine Region – description of commercial, recreational and charter fishing activities iv

fishing, with an estimated 1.7 million people indicating they had participated in recreational fishing at least once in a 12 month period.
Resource management Climate change and resource sharing are emerging as major future challenges management challenges for fishing in the EMR.
East Marine Region – description of commercial, recreational and charter fishing activities v

East Marine Region – description of commercial, recreational and charter fishing activities vi

Overview of fishing in the east marine region
Fishery Management area Species Fishing method Catch within bioregion (value)
Operators/ businesses Status
Commonwealth
Hand collection, otter trawl, seine
net, long-line, trap, trot-line, drop-line
and handlines
153 t (A$0.377 m) 18 permits All fisheries uncertain
Longline fishery and small minor-line
component
6363 t (A$$30.1 m) 115 longline permits and 50 minor-line permits
Bigeye and yellowfin (overfishing, but not overfished).
Striped marlin and broadbill swordfish (overfished status
uncertain and overfishing status uncertain); Albacore (not
overfished, no overfishing)
Otter trawl and demersal line
Inshore 5 t (value N/A)
Offshore (no current fishing activity)
Inshore - no permits
Offshore - no current permits as exploratory fishery ceased
in 2003
Inshore (uncertain), offshore (uncertain)
Purse seine and some pole-and-line
fishing
confidential
(less than 5 boats)
20 permits (Not overfished and not subject to overfishing)
Coral Sea Fishery
Extends from Cape York to Sandy Cape off Queensland. AFZ
boundary and on the west by a line 10 to 100 n. mile seawards of the
Bêche-de-mer, aquarium fish,
trochus, lobster, various reef fish
Great Barrier Reef
Eastern Tuna and Billfish Fishery
Cape York to the South Australia-Victoria border, out to AFZ
boundary including Lord Howe and Norfolk Islands, Tasmania and High
Seas
Yellowfin tuna, bigeye tuna,
albacore tuna, broadbill
swordfish and striped marlin
Norfolk Island
Norfolk Island is located 1500 km east of Brisbane. Australia exercises
Labrids, Pomacentrids and
Fishery territorial control over the surrounding 200 n. miles EEZ
cods, kingfish, trevally, tunas and
Lethrinids, Serranidids
Skipjack Fishery
Eastern skipjack: southern New South Wales to north-eastern
Tasmania between November and
Skipjack tuna
East Marine Region – description of commercial, recreational and charter fishing activities vii

June each year
Small Southern Queensland to southern Blue mackerel, Purse seining and Blue mackerel 1972 t 74 permits Blue mackerel (not overfished and Pelagics Western Australia, currently divided jack mackerel, mid-water trawling (confidential); jack not subject to overfishing). Jack Fishery into four management zones redbait and mackerel 744 t mackerel, yellowtail scad and
pilchards (confidential); redbait redbait (uncertain) 8344 t (confidential)
Southern Off the coast of central and southern Southern bluefin Long-line in eastern Total Australian 98 SFR holders (Overfished and subject to Bluefin NSW (also Great Australian Bight) tuna bioregion, purse fishery 5244 t ($140m) overfishing) Tuna seine in SA Fishery
Southern Offshore of Lakes Entrance, Arrow squid Squid jigging 619 t ($1m) N/A (Uncertain) Squid Jig Queenscliff and Portland in Victoria Fishery
South East Trawl sector from Sydney Blue warehou, Mid-water trawl, Trawl TAC species 59 trawl SFRs, and 56 hook (Eight stocks overfished; nine Scalefish southwards around Tasmania to deepwater sharks, demersal otter trawl, 18330 t, non- SFRs; 10 for deepwater trawl stocks not overfished; overfishing and Shark Cape Jervis in SA; adjoins east eastern gemfish, pair trawl, demersal TAC species 3550 t (1 active) status of seven stocks uncertain; no Fishery coast deepwater sector that extends orange longline and ($59m); deepwater stocks classified as overfishing; 15 (Commonwe to 24°30´S off Queensland. roughy, redfish, dropline trawl (no catch in stocks not subject to overfishing; -alth trawl, Scalefish-hook sector from the same silver trevally, 2006; 2005 overfishing status of nine stocks is scalefish- boundary off Queensland to dories, blue-eye confidential) uncertain): deepwater alfonsino hook and SA/WA border. Within the East trevalla, blue (uncertain) deepwater Bioregion, the main effort is on grenadier, flathead trawl seamounts from Sydney to and alfonsino sectors) Brisbane. Deepwater to 4000 m
East Marine Region – description of commercial, recreational and charter fishing activities viii
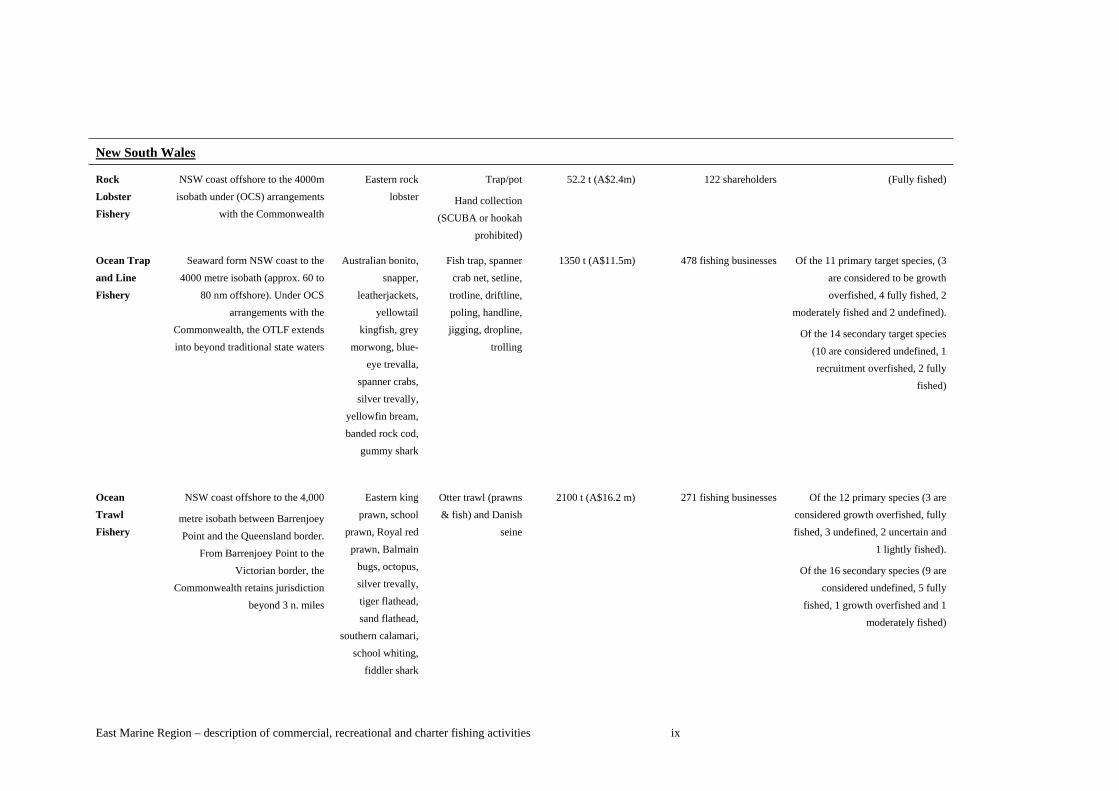
New South Wales
Rock Lobster Fishery
Ocean Trap and Line Fishery
Ocean Trawl Fishery
NSW coast offshore to the 4000m isobath under (OCS) arrangements
with the Commonwealth
Seaward form NSW coast to the 4000 metre isobath (approx. 60 to
80 nm offshore). Under OCS arrangements with the
Commonwealth, the OTLF extends into beyond traditional state waters
NSW coast offshore to the 4,000
metre isobath between Barrenjoey Point and the Queensland border.
From Barrenjoey Point to the Victorian border, the
Commonwealth retains jurisdiction beyond 3 n. miles
Eastern rock Trap/pot 52.2 t (A$2.4m) 122 shareholders (Fully fished) lobster Hand collection
(SCUBA or hookah prohibited)
Australian bonito, Fish trap, spanner 1350 t (A$11.5m) 478 fishing businesses Of the 11 primary target species, (3 snapper, crab net, setline, are considered to be growth
leatherjackets, trotline, driftline, overfished, 4 fully fished, 2 yellowtail poling, handline, moderately fished and 2 undefined).
kingfish, grey jigging, dropline, Of the 14 secondary target species morwong, blue- trolling (10 are considered undefined, 1
eye trevalla, recruitment overfished, 2 fully spanner crabs, fished) silver trevally,
yellowfin bream, banded rock cod,
gummy shark
Eastern king Otter trawl (prawns 2100 t (A$16.2 m) 271 fishing businesses Of the 12 primary species (3 are prawn, school & fish) and Danish considered growth overfished, fully
prawn, Royal red seine fished, 3 undefined, 2 uncertain and prawn, Balmain 1 lightly fished).
bugs, octopus, Of the 16 secondary species (9 are silver trevally, considered undefined, 5 fully tiger flathead, fished, 1 growth overfished and 1 sand flathead, moderately fished)
southern calamari, school whiting,
fiddler shark
East Marine Region – description of commercial, recreational and charter fishing activities ix

Offshore Offshore from the 3 n. mile Game—black, Recreational and Charter Boat fishery
boundary off the NSW coast to the continental shelf and beyond
(commonly out to approximately 50 n. miles)
blue and striped marlin, yellowfin
tuna, albacore, broadbill
swordfish, various sharks. Demersal
snapper pearl perch, ocean
jackets, morwong, flathead,
nannygai, dories, teraglin, blue-eye
trevalla. Bait— blue (slimy)
mackerel and striped/skipjack
tuna
Game, demersal and Catch N/A 279 licensed charter—not all Unknown charter fishing— Value Recreational fish offshore
predominantly line N/A fishing
Charter (A$212 000 m) 2001—2002
East Marine Region – description of commercial, recreational and charter fishing activities x

Queensland
Blue Swimmer Crab Fishery
Spanner Crab Fishery
East Coast Inshore Fin Fish Fishery
East Coast otter Trawl
The fishery area extends along the Blue swimmer entire Qld coastline. crabs
Most catch is taken in inshore and continental shelf waters up to
approximately 50 m depth, mainly in southern Qld, south of the Great
Barrier Reef Marine Park
The fishery area covers inshore and Spanner crab offshore (>3 n. miles) waters off the Qld coast, from the NSW border to
the NT border. Catch is concentrated in coastal waters up to
80 m depth between Yeppoon and the Qld—NSW border
The ECIFF area includes all tidal Barramundi, king waters along QLDs east coast salmon, blue
eastward of 142˚09' E, near Crab threadfin, grey Island (approximately 11˚ S), to the mackerel and
Qld—NSW border various sharks
The ECOTF is Queensland’s largest Tiger prawns, commercial fishery, extending from Endeavour
the tip of Cape York to the prawns, red spot QLD/NSW border. The majority of king prawns,
the fishery occurs in banana prawns, Commonwealth waters though the and scallops fishery is managed by QLD under
OCS agreements with the commonwealth
Crab pots and collapsible traps
Crab pots, collapsible traps and
dillies
A variety of net methods and hook
and line
Otter Trawl and Beam Trawl
875 t (A$5.9 m) 190 commercial boats accessing the fishery
875 t (A$5.9 m) 504 licences
5,437 t 499 net fishery and 1649 line
(A$23 m) fishery licenses
2185 t (A$32 m) 501 licences combined
weight/value with East Coast Stout Whiting
Fishery
Stout Whiting Fishery for 2005 1,130t $2.5
million
East Marine Region – description of commercial, recreational and charter fishing activities xi
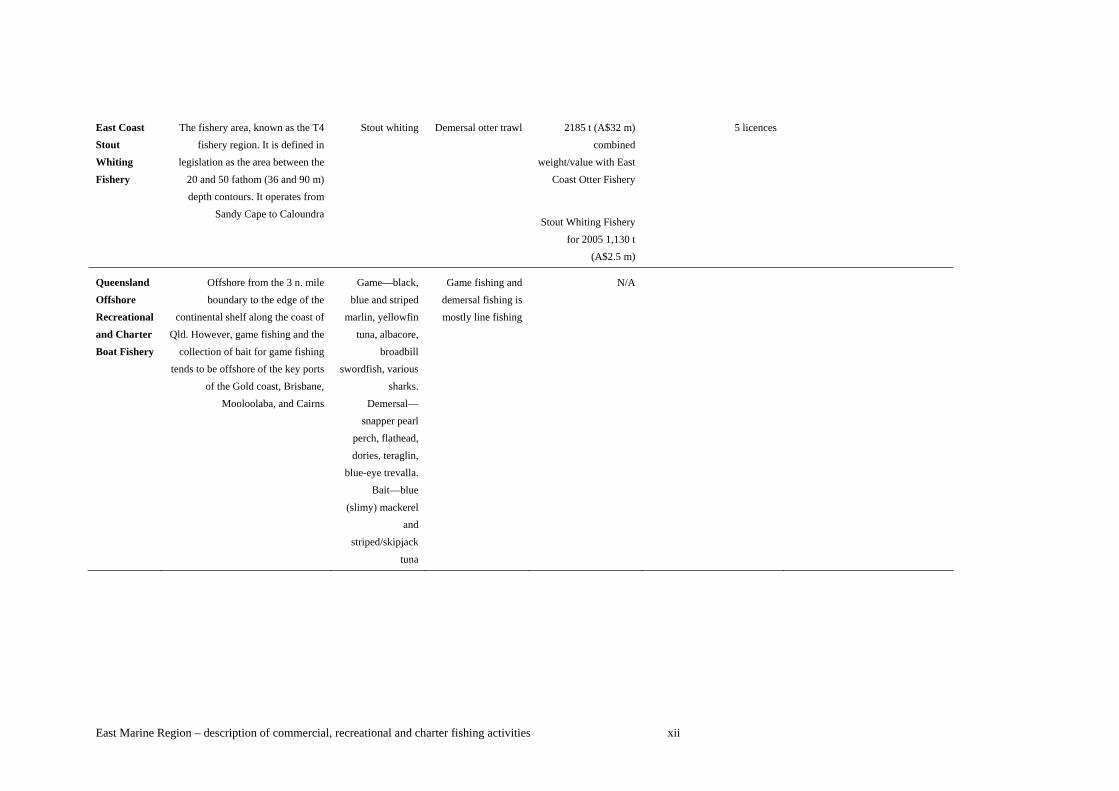
East Coast The fishery area, known as the T4 Stout whiting Demersal otter trawl 2185 t (A$32 m) 5 licences Stout fishery region. It is defined in combined Whiting legislation as the area between the weight/value with East Fishery 20 and 50 fathom (36 and 90 m) Coast Otter Fishery
depth contours. It operates from Sandy Cape to Caloundra
Stout Whiting Fishery for 2005 1,130 t
(A$2.5 m)
Queensland Offshore from the 3 n. mile Game—black, Game fishing and N/A Offshore boundary to the edge of the blue and striped demersal fishing is Recreational continental shelf along the coast of marlin, yellowfin mostly line fishing and Charter Qld. However, game fishing and the tuna, albacore, Boat Fishery collection of bait for game fishing broadbill
tends to be offshore of the key ports swordfish, various of the Gold coast, Brisbane, sharks.
Mooloolaba, and Cairns Demersal— snapper pearl
perch, flathead, dories, teraglin,
blue-eye trevalla. Bait—blue
(slimy) mackerel and
striped/skipjack tuna
East Marine Region – description of commercial, recreational and charter fishing activities xii

Contents
Executive Summary .........................................................................................................................iii
Overview of fishing in the east marine region .............................................................................. vii
Contents ..........................................................................................................................................xiii
1. Introduction....................................................................................................................................1
Regional Marine Planning ..............................................................................................................1
Overview of the East Marine Region..............................................................................................1
An overview of the socio-economics of the fishery profile ..........................................................3
2. Commercial Fishing ......................................................................................................................5
Introduction - commercial fishing in the region ..............................................................................5
Commonwealth Fisheries.............................................................................................................11
Introduction................................................................................................................................11
Profiles.......................................................................................................................................13
Coral Sea Fishery - Bêche-De-Mer, Aquarium Fish, Line, Trap & Trawl, Trochus, Lobster.13
Eastern Tuna and Billfish Fishery..........................................................................................19
Skipjack Fisheries
South East Scalefish and Shark Fishery – Commonwealth Trawl and Scalefish Hook
..................................................................................................................25
Small Pelagic Fishery............................................................................................................32
Southern Bluefin Tuna Fishery..............................................................................................35
South East Scalefish and Shark Fishery...............................................................................39
Overview................................................................................................................................39
Sectors ..................................................................................................................................40
South East Scalefish and Shark Fishery – Shark Hook Sector ............................................51
South East Scalefish and Shark Fishery – East Coast Deepwater Trawl Sector ................53
Norfolk Island – Inshore and Offshore Demersal Finfish Fishery .........................................56
Southern Squid Jig Fishery ...................................................................................................61
Socio-economic profile ..............................................................................................................62
New South Wales Fisheries .........................................................................................................64
Introduction................................................................................................................................64
Fishery profiles ..........................................................................................................................65
Ocean Trap and Line Fishery................................................................................................65
Ocean Trawl Fishery .............................................................................................................68
Rock Lobster Fishery ............................................................................................................72
Socio-economic profile ..............................................................................................................75
Queensland Fisheries ..................................................................................................................79
Introduction................................................................................................................................79
Fishery profiles ..........................................................................................................................81
East Marine Region – description of commercial, recreational and charter fishing activities xiii

East Coast Otter Trawl Fishery (ECOTF)..............................................................................81
East Coast Stout Whiting Fishery..........................................................................................84
East Coast Inshore Fin Fish Fishery (ECIFF) .......................................................................87
Line Fishery ...........................................................................................................................90
Blue Swimmer Crab Fishery..................................................................................................95
Spanner Crab Fishery ...........................................................................................................97
Socio-economic profile ........................................................................................................... 100
Information gaps for commercial fishing ................................................................................... 102
3. Recreational and Charter Fishing........................................................................................... 104
Recreational, Game and Charter fishing in New South Wales ................................................. 104
Key Recreational Ports........................................................................................................... 109
Fishing Tournaments in NSW ................................................................................................ 109
Socio-economic analysis........................................................................................................ 110
Queensland Offshore Recreational, Game and Charter Fishery.............................................. 111
Key Recreational Ports........................................................................................................... 112
Fishing Tournaments in Qld ................................................................................................... 113
Socio-economic analysis........................................................................................................ 113
Information gaps for recreational, game and charter fishing..................................................... 114
4. Resource management challenges ........................................................................................ 115
Overview of recent changes affecting fisheries in the region................................................. 115
5. Sources of information and further reading.......................................................................... 118
Acknowledgements ................................................................................................................... 119
Appendices ................................................................................................................................... 120
Appendix 1 – Fishery maps......................................................................................................... 121
Commonwealth Commercial Fisheries ..................................................................................... 122
Coral Sea................................................................................................................................ 122
Eastern Tuna and Billfish Fishery........................................................................................... 122
Southern Bluefin Tuna............................................................................................................ 127
South East Scalefish and Shark Fishery................................................................................ 128
New South Wales Commercial Fisheries.................................................................................. 130
Ocean Trap and Line Fishery................................................................................................. 134
Ocean Trawl Fishery .............................................................................................................. 134
Rock Lobster Fishery ............................................................................................................. 136
Queensland Commercial Fisheries ........................................................................................... 139
East Coast Otter Trawl and Stout Whiting Fisheries.............................................................. 140
East Coast Inshore Fin Fish fishery ....................................................................................... 141
Line Fishery ............................................................................................................................ 143
East Marine Region – description of commercial, recreational and charter fishing activities xiv

Line Fishery ............................................................................................................................ 144
Crab Fisheries ........................................................................................................................ 146
Recreational and Charter Fishing ............................................................................................. 149
New South Wales................................................................................................................... 152
Queensland ............................................................................................................................ 156
Appendix 2 - Fishing methods.................................................................................................... 159
Appendix 3 – Table of key ports identified for Commonwealth and State Fisheries in the EastMarine Region............................................................................................................................... 165
Appendix 4 – Results of the ‘buyback’ ...................................................................................... 169
East Marine Region – description of commercial, recreational and charter fishing activities xv

East Marine Region – description of commercial, recreational and charter fishing activities xvi

1. Introduction
Regional Marine Planning The Australian Government's Environment Protection and Biodiversity Conservation Act 1999 (EPBC Act) provides a wide range of options for dealing with the challenges posed by immediate environmental threats as well as the longer term need for greater sustainability in our use of the oceans. One of the greatest challenges is to apply the right suite of measures to ensure that the environment is adequately protected and doing so in a way that is economically and socially viable and an efficient use of public resources. Taking a "system-wide" approach to conservation and environmental management through marine bioregional planning provides an opportunity to deliver an integrated package of measures.
Marine bioregional plans are prepared under Section 176 of the EPBC Act. The marine bioregional planning process is also the means by which the Australian Government is meeting its commitments under the National Representative System of Marine Protected Areas by identifying a representative system of marine protected areas in its waters.
An underlying objective in marine bioregional planning (MBP) is to balance conservation, social and economic objectives. In undertaking MBP it is therefore important that the social and economic characteristics of commercial fisheries operating in the East Marine Region (EMR) are understood and inform the development of marine protected areas (MPA) and other conservation options. The three stages in marine bioregional planning are development of the Bioregional Profile, the draft Bioregional Marine Plan and the final Bioregional Marine Plan. This paper’s purpose is to provide the fisheries information for the development of the regional profile for the EMR. It will also be the starting point for identifying the potential implications for fisheries of various conservation options considered during the development of the draft plan.
Overview of the East Marine Region (EMR) (The physical description of the East Marine Region draws on details published on the Dept. of Environment and Water Resources website - http://www.environment.gov.au/coasts/mbp/east/index.html) The MBP framework divides the oceans off Australia into 41 provincial bioregions (large biogeographical areas defined by similar ecological characteristics). The East Marine Region includes 14 provincial bioregional units. The EMR covers more than 2.4 million square kilometres of water off the east coast of Queensland and New South Wales (including Lord Howe Island and Norfolk Island), from the town of Bermagui to the tip of Cape York. The Region includes waters between 3 and 200 n. miles from the coastline but does not include the Great Barrier Reef Marine Park, which is managed separately by the Great Barrier Reef Marine Park Authority. The EMR spans both tropical waters and warm temperate waters and is recognised for its globally significant marine biodiversity. Large numbers of marine organisms are unique to the area, particularly in the temperate waters off New South Wales. The EMR's biological diversity is heavily influenced by the East Australian Current (EAC). The EAC flows south through the tropical Coral Sea towards the temperate regions with "cold core" and "warm core" eddies peeling off into the Tasman Sea along the way. This is the largest ocean current close to the coast of Australia, shaping the ecology of both marine and terrestrial environments over a wide area.
East Marine Region – description of commercial, recreational and charter fishing activities 1

Figure 1 - East Marine Region Boundary
Oceans in the EMR are relatively low in nutrients and primary productivity. Exceptions occur where water bodies converge and mix to create "hot spots" of primary productivity containing chlorophyll rich waters. These seasonal and transient upwellings are significant features of the EMR and occur periodically near places like Cape Byron, Smoky Cape and Sugar Loaf Point, drawing nutrient-rich water from depths of 200 metres or more. A chain of seamounts runs parallel to the outer shelf from Fraser Island south to Sydney. Seamounts are key geological features in the Region, and their interaction with ocean currents creates a variety of habitats on their slopes. Detritus, nutrients and organisms are transported to the seamounts by deep water currents. These support large aggregations of deepwater fish such as oreos and orange roughy. A number of geographically isolated oceanic reefs are also present in the East Marine Region, mainly in the Coral Sea. Water depths in the Region range from 200 metres along the shelf to more than 5800 metres in the deep holes and valleys between New South Wales and Lord Howe Island. Other geomorphological features include canyons, basins, plateaus, ridges, saddles, the continental shelf, slope and terraces. Many large predators (e.g. whales, seals, sharks, marlin, swordfish and tuna) live in and migrate through the Region, although they were considerably more abundant before European settlement of the Australian continent and the development of industrial scale fishing in the 19th and 20th centuries. The key ports for commercial and recreational fishing in the EMR include: Cairns, Innisfail, Townsville, Mackay, Gladstone, Bundaberg, Mooloolaba, Brisbane, and Southport in Queensland (Qld), and Coffs Harbour, Sydney, Ulladulla, and Bermagui in New South Wales (NSW).
East Marine Region – description of commercial, recreational and charter fishing activities 2

East Marine Region – description of commercial, recreational and charter fishing activities 3
An overview of the socio-economics of the fishery profile The socio-economic analysis of fishing in the EMR includes activity associated with Commonwealth and State fisheries that occurs in towns and ports spread along the coast, including where catch is landed and businesses are located, as well as the locations where people engaged in fishing activity live. Commercial fishing generates both direct and indirect employment opportunities in coastal regions and can be a substantial contributor to the economic and social wellbeing of communities. To provide a profile of this activity, the following indicators were used: • Key landing and/or home ports
• Fishing sector employment – direct and indirect
• Regional dependence on fishing and
• An overview of recent changes affecting fisheries in the EMR.
The analysis identifies key ports for the fisheries based on landed and/or home port data, where this data is available from the Commonwealth and/or States. Landed ports tend to have on-shore linkages focussed on the processing sector (such as co-operatives, handling and transportation). On-shore linkages of home ports tend to be focussed on sectors providing repairs and maintenance as well as sectors where other business and family expenditure and activity occur (including household expenses, schools).
A word of caution It should be recognised that the regional marine planning framework that this document informs only takes place in Commonwealth waters. While this is consistent with the legislative requirements of the EPBC Act, it is important to realise that fisheries management boundaries in Australian waters frequently follows the locations of the resource being targeted rather than political boundaries. Offshore Constitutional Settlement arrangements can see fisheries under state control extending through Australian territorial waters (and similarly Commonwealth controlled fisheries extending to the coast).
Figure 2 - OCS boundaries in the EMR

In an effort to fully reflect fishing effort in the EMR, catch effort from that component of fisheries that intersect the region have been reported in this document. However, this data is normally recorded for an entire fishery, and not separated into that catch taken from state or commonwealth waters. Further in many cases only a small proportion of the catch from a fishery may be taken in the EMR. To get a true scale and value of individual fisheries, particularly their importance to regional sectors, it is necessary to review information in a fishery by fishery basis as presented by the relevant Commonwealth and State fishery agencies. As a final note, while bioregional planning provides a biophysical framework in which to categorise areas in Australia’s territorial waters, these waters are also home to many highly migratory fish species which are found around the coastline and into international waters beyond. Fisheries data for these fisheries will cover several marine regions, and while efforts have been made to identify catch relevant to the EMR, data for the fishery as a whole need to be considered to get the full picture.
East Marine Region – description of commercial, recreational and charter fishing activities 4

2. Commercial Fishing
Introduction - commercial fishing in the region For many of the port cities and towns along the east coast of Australia, commercial, recreational and charter fishing and associated support business and industries make a significant contribution to the regional economy. Extending from the northern tip of Queensland to almost the Victorian border, the EMR intersects with fisheries managed by the Commonwealth, New South Wales and Queensland governments. These fisheries, or at least the components of the fisheries that intersect with the EMR, are described in more detail in the fishery by fishery profiles presented later in this chapter. Maps have been used to better illustrate fishing catch, effort and value where data is available and can be presented (confidentiality issues mean it is not possible to present detailed information for fisheries where there may be limited operations occurring within the EMR) and these are included at Appendix 1. Descriptions of commercial fishing gear used in the EMR (including illustrations) can be found in Appendix 2. Fisheries within the region target a broad range of species – from sedentary Bêche-de-mer on reefs in the Coral Sea, to wide ranging pelagic species such as tunas and billfish, targeted within the EMR and indeed in international waters beyond the Australian Fishing Zone. Fishers operate from a number of ports within the region and beyond and details of the associations between fishing operations and regional socio-economic structures are investigated further below. It is important to remember that while every effort has been made within this report to present information relevant to the EMR and associated planning, many species of fish targeted commercially are highly mobile. Fisheries, both Commonwealth and State, are usually defined by where fish and fishers are, which does not always neatly overlap the biogeographic regionalisation that underpin regional marine planning. A true picture of fishing effort and regional dependencies for a particular fishery, may require consideration of information presented for several adjacent regional marine areas. Summary of key ports for the region Drawing on a range of sources, including 2001 Census data from the Australian Bureau of Statistics (ABS) and data from the Australian Fisheries Management Authority (AFMA), the key ports for commercial fishing in the EMR include: Cairns, Innisfail, Townsville, Mackay, Gladstone, Bundaberg, Mooloolaba, Brisbane, and Southport in Queensland (Qld), and Richmond/Tweed, Coffs Harbour, Sydney, Ulladulla, and Bermagui in New South Wales (NSW). Further detail for key ports for the commercial fishing sector is provided in Appendix 3. The following section describes the basic demographics for the geographic areas of some of these ports, using available data from the ABS 2001 Census and where available, data from AFMA. Descriptions for Innisfail, Brisbane, Southport and Sydney ports are unable to be provided due to the nature of the statistical areas used in the 2001 Census, which render this data unsuitable for the purposes of this document. Cairns Cairns City Statistical Subdivision (SSD) had a population of 120,483 in 2001. It has slightly lower levels of the population born overseas (18.3%, compared to the national average of 21.8%). The average taxable income of individuals is lower than the national average ($35,800 compared to $40,829). It has lower levels of unemployment (4.7%) than the national average (5.7%) and only slightly higher levels of dependency of government cash benefits (11.3% receive cash benefits, compared to the national average of 11.0%). The industry structure of the area is concentrated in Retail (17.2% of employment), Accommodation (10.7%), and Health (9.2%). This is in contrast to the national average of Retail (14.6%), Manufacturing (12.2%), and Business (11.1%). The area has low concentrations of employment in Agriculture, Forestry and Fishing (only 1.7% of employment, compared to the national average of 4.0%) (ABS, National Regional Profile, 2004 and ABS Population Census, 2001).
East Marine Region – description of commercial, recreational and charter fishing activities 5

For the Eastern Tuna and Billfish Fishery (ETBF) in 2005/06, Cairns was the fourth largest homeport (after Mooloolaba, Sydney, and Ulladulla) with 7% of the total ETBF fleet. Commercial fishing provided 162 jobs or 0.3% of the total employment in Cairns in 2001 (ABS, Working Population Profile, 2001). Townsville Townsville City Pt A SSD had a population of 94,409 in 2001. It has much lower levels of the population born overseas (12.6%, compared to the national average of 21.8%). The average taxable income of individuals is lower than the national average ($38,947 compared to $40,829). It has about the same level of unemployment (5.8%) than the national average (5.7%) and about the same levels of dependency of government cash benefits (10.9% receive cash benefits, compared to the national average of 11.0%). The industry structure of the area is concentrated in Retail (14.6% of employment), Accommodation (10.7%), and Health (9.2%). This is in contrast to the national average of Retail (14.6%), Government administration (12.8%), and Health (10.9%). The area has low concentrations of employment in Agriculture, Forestry and Fishing (only 1.0% of employment, compared to the national average of 4.0%) (ABS, National Regional Profile, 2004 and ABS Population Census, 2001). Overall, the area has a major regional city which has government administration and health as well as tourism activities. The immediate area has low levels of agricultural activity. Mackay Mackay City Pt A SLA had a population of 68,488 in 2001. It has much lower levels of the population born overseas (9.1%, compared to the national average of 21.8%). The average taxable income of individuals is only slightly lower than the national average ($39,526 compared to $40,829). It has much higher levels of unemployment (7.2%) than the national average (5.7%) and slightly higher levels of dependency of government cash benefits (12.4% receive cash benefits, compared to the national average of 11.0%). The industry structure of the area is concentrated in Retail (18.3% of employment), Manufacturing (11.1%), and Health (9.4%). This is in contrast to the national average of Retail (14.6%), Manufacturing (12.2%), and Business (11.1%). The area has lower concentrations of employment in Agriculture, Forestry and Fishing (only 2.8% of employment, compared to the national average of 4.0%) (ABS, National Regional Profile, 2004 and ABS Population Census, 2001). In summary, the area has similar levels of average income to the national average. Gladstone Gladstone City SLA had a population of 28,548 in 2001. It has much lower levels of the population born overseas (9.8%, compared to the national average of 21.8%). The average taxable income of individuals is higher than the national average ($42,938 compared to $40,829). It has slightly lower levels of unemployment (5.5%) than the national average (5.7%) and slightly lower levels of dependency of government cash benefits (10.1% receive cash benefits, compared to the national average of 11.0%). The industry structure of the area is concentrated in Manufacturing (18.5% of employment), Retail (16.1%), and Business (9.0%). This is in contrast to the national average of Retail (14.6%), Manufacturing (12.2%), and Business (11.1%). The area has low concentrations of employment in Agriculture, Forestry and Fishing (only 1.0% of employment, compared to the national average of 4.0%) (ABS, National Regional Profile, 2004 and ABS Population Census, 2001). Gladstone is a major manufacturing location in Queensland, and has above average levels of income. Bundaberg In 2001, Bundaberg (or Burnett Pt A SLA, the costal part of the area) had a population of 13,738. It has lower levels of the population born overseas (14.5%, compared to the national average of 21.8%). The average taxable income of individuals is much lower than the national average ($32,536 compared to $40,829). It has very high levels of unemployment (12.1%) than the national average (5.7%) and consequently much higher levels of dependency of government cash benefits (22.9% receive cash benefits, compared to the national average of 11.0%). The industry structure
East Marine Region – description of commercial, recreational and charter fishing activities 6

of the area is concentrated in Retail (16.2% of employment), Health (11.5%), and Education (10.9%). This is in contrast to the national average of Retail (14.6%), Manufacturing (12.2%), and Business (11.1%). The area has very high concentrations of employment in Agriculture, Forestry and Fishing (11.0% of employment, compared to the national average of 4.0%) (ABS, National Regional Profile, 2004 and ABS Population Census, 2001). In summary, the coastal part of Bundaberg is heavily concentrated in Agriculture and has high levels of unemployment and high levels of welfare dependency. Maroochy-Mooloolaba In 2001, the Maroochy-Mooloolaba SLA had a population of 10,900. It has slightly lower levels of the population born overseas (17.8%, compared to the national average of 21.8%). The average taxable income of individuals is lower than the national average ($36,538 compared to $40,829). It has higher levels of unemployment (7.1%) than the national average (5.7%) and only slightly higher levels of dependency of government cash benefits (13.8% receive cash benefits, compared to the national average of 11.0%). The industry structure of the area is concentrated in Retail (18.6% of employment), Business (11.7%), and Accommodation (10.9%). This is in contrast to the national average of Retail (14.6%), Manufacturing (12.2%), and Business (11.1%). The area has nearly half the concentration of employment in Agriculture, Forestry and Fishing (2.3% of employment, compared to the national average of 4.0%) (ABS, National Regional Profile, 2004, and ABS Population Census, 2001). Commercial fishing provided 27 jobs or 0.8% of the total employment in Mooloolaba in 2001 (ABS, Working Population Profile, 2001 Richmond/Tweed The Richmond/Tweed Statistical Division (SD) had a population of 223,500 in 2001. It has very low levels of the population born overseas (10.9%, compared to the national average of 21.8%). The average taxable income of individuals is much lower than the national average ($32,981 compared to $40,829). It has higher levels of unemployment (7.7%) than the national average (5.7%) and much higher levels of dependency of government cash benefits (22.5% receive cash benefits, compared to the national average of 11.0%). The industry structure of the Richmond/Tweed areas is concentrated in Retail (17.6% of employment), Health (12.0%), and Education (8.5%). This is in contrast to the national average of Retail (14.6%), Manufacturing (12.2%), and Business (11.1%). The Richmond/Tweed has nearly double the concentration of employment in Agriculture, Forestry and Fishing (7.5% of employment, compared to the national average of 4.0%) (ABS, National Regional Profile, 2004 and ABS Population Census, 2001). The Tweed area had a high proportion of revenue from ocean hauling fishing (estimated to be 38% of the total fishing revenue obtained by fishers in the Tweed) (Dominion Consulting, 2002). Coffs Harbour Coffs Harbour SLA had a population of 48,941 in 2001. It has much lower levels of the population born overseas (10.6%, compared to the national average of 21.8%). The average taxable income of individuals is much lower than the national average ($33,900 compared to $40,829). It has higher levels of unemployment (7.8%) than the national average (5.7%) and much higher levels of dependency of government cash benefits (20.5% receive cash benefits, compared to the national average of 11.0%). The industry structure of the area is concentrated in Retail (20.4% of employment), Health (11.0%), and Business (9.0%). This is in contrast to the national average of Retail (14.6%), Manufacturing (12.2%), and Business (11.1%). The area has lower concentrations of employment in Agriculture, Forestry and Fishing (3.0% of employment, compared to the national average of 4.0%) (ABS, National Regional Profile, 2004 and ABS Population Census, 2001). In summary, Coffs Harbour is a major tourism centre on the NSW coast and has very high levels of employment concentrated in retail. Ulladulla Shoalhaven PtB SLA (Ulladulla) had a population of 59,614 in 2001. It has low levels of the population born overseas (12.9%, compared to the national average of 21.8%). The average taxable income of individuals is lower than the national average ($35,502 compared to $40,829). It
East Marine Region – description of commercial, recreational and charter fishing activities 7
has high levels of unemployment (9.4%) compared to the national average (5.7%) and high levels of dependency of government cash benefits (21.2% receive cash benefits, nearly double the national average of 11.0%). The industry structure of the area is concentrated in Retail (18.0% of employment), Construction (10.7%), and Health (9.9%). This is in contrast to the national average of Retail (14.6%), Manufacturing (12.2%), and Business (11.1%). The area has about national average concentrations of employment in Agriculture, Forestry and Fishing (3.9% of employment, compared to the national average of 4.0%) (ABS, National Regional Profile, 2004 and ABS Population Census, 2001). For the ETBF in 2005/06, Ulladulla was the third largest homeport (after Mooloolaba and Sydney) with 9% of the total ETBF fleet. Employment in commercial fishing in 2001 was 60, 0.8% of the total employment in the area (7,813) (ABS, Working Population Profile, 2001). Bermagui In 2001, the Bega Valley SLA (including Bermagui) had a population of 31,905. It has low levels of the population born overseas (11.1%, compared to the national average of 21.8%). The average taxable income of individuals is lower than the national average ($33,831 compared to $40,829). It has higher levels of unemployment (6.3%) compared to the national average (5.7%) and high levels of dependency of government cash benefits (17.5% receive cash benefits compared to the national average of 11.0%). The industry structure of the area is concentrated in Retail (17.0% of employment), Agriculture (10.6%), and Health (10.5%). This is in contrast to the national average of Retail (14.6%), Manufacturing (12.2%), and Business (11.1%). The area is dependent on agriculture with more than double the national average concentrations of employment in Agriculture, Forestry and Fishing (10.6% of employment, compared to the national average of 4.0%) (ABS, National Regional Profile, 2004 and ABS Population Census, 2001). For the ETBF in 2005/06, Bermagui was the fifth largest homeport (after Mooloolaba, Sydney, Ulladulla, and Cairns) with 6% of the total ETBF fleet. Employment in commercial fishing in the Bega Valley SLA in 2001 was 184, 1.8% of the total employment in the area (10,085) (ABS, Working Population Profile, 2001). Summary of fishing sector employment Census data from the ABS for 1991, 1996 and 2001 is analysed in Marine Matters by Larcombe et al. (2006) and provides an indication of fishing sector employment in fisheries within the EMR. The EMR has approximately 3,600 persons directly employed in commercial fishing, which is 0.2% of persons employed in the region (Larcombe et al., 2006). Based on SLAs, data is provided for commercial fishing, fish wholesaling, seafood processing and the consolidated fishing industry (CFI) (including aquaculture) in Table 1. Table 1 also contains 2001 census data from the ABS for percentages of the total population for each SLA employed in the fishing industry. Based on fishing employment as a percentage of total employment, the data in Table 1 suggests that Bermagui, Innisfail and Townsville are the ports most dependent on fishing in the EMR. The data presented here should be taken as an indication only of employment in fishing for the EMR. Census data on fishing employment (including commercial fishing and downstream activities) underestimates the total numbers of those employed in this industry due to the large number of unpaid family workers and the casual workforce employed in fishing in peak times (Larcombe et al., 2006). Furthermore, more recent data from the 2006 Census will be available in late October, 2007. Data specific to individual fisheries and ports are largely unavailable, but have been included where possible in the profiles for individual fisheries presented below.
East Marine Region – description of commercial, recreational and charter fishing activities 8

Table 1: Summary of direct and indirect employment in fishing for Statistical Local Areas for key ports within the East Marine Region Main SLA (Port) Commercial Fish Seafood Consolidated Fishing
fishing (no.) wholesaling (no.)
Processing (no.)
fishing industry (CFI) (no.)
employment (% of total
employment)
Cairns (Cairns) 228a 161a 21a 410a < 1a 0.5b
Johnston 42a 3a 3a 48a 1.4b
(Innisfail)
Townsville 29a 9a 3a 41a 1.3b
(Townsville)
Mackay 61a 36a 5a 102a 0.3b
(Mackay)
Gladstone 77a 57a 20a 154a 0.6b
(Gladstone)
(Bundaberg) 72a 40a 16a 128a 0.8b
Maroochy - - - - < 1a 0.4b
(Mooloolaba)
Various - - - - 0.2b
(Brisbane)
Southport - - - - 0.1b
(Southport)
Coffs Harbour 71a 22a 3a 96a < 1a 1.1b
(Coffs Harbour)
Various - - - - 0.1b
(Sydney)
Shoalhaven - - - - 0.5b
(Ulladulla)
Bega Valley - - - - 2.3b
(Bermagui)
Sources: a – Larcombe et al., 2006; b – ABS 2001 Census data
Summary of regional dependence on fishing Changes impact in differing ways at a regional level. The extent of this impact will depend, in part, on the levels of regional dependence on fishing activity. The contribution which the fishing sector makes to regional employment, and the number of businesses directly associated with fishing activity is a useful indicator of this dependence. To gain a general picture of the fishing-related business activity, a review of the 2006/07 Yellow Pages online directory www.yellowpages.com.au was conducted for home/landed ports which service the targeted fisheries. Fourteen separate search categories were selected as being both closely connected to the commercial fishing sector and specifically targeted to that sector. A number of categories which provided fishing-related results contained unusable proportions of non-fishing activity, such as diesel engine and machinery services, and refrigerated goods storage. Similar judgements had to be made regarding businesses reported in multiple categories – the most appropriate category was chosen based on the information provided in the business advertisement or website. Four broad categories were developed to maximise coverage of fishing industry businesses while excluding, as far as possible, other business types. These categories covered both ‘downstream’ businesses and key marine services: � Fish and seafood (production and manufacturing)
� Fish processing and wholesaling
East Marine Region – description of commercial, recreational and charter fishing activities 9

� Fishing trips
� Boats and Marine.
Despite the scale and widespread use of the Yellow Pages, it cannot be assumed that all businesses are included in the directory. Different towns and regions may have different rates of participation in the directory, and the varying ‘response rate’ of the directory search could under or overrepresent some areas. For the purposes of this profile, each port was classified in terms of whether the level of associated business activity is high (>10 businesses), medium (5-10 businesses) or low (< 5 businesses). These categories were based on previous work undertaken by the Bureau of Rural Sciences (BRS) for the Department of Agriculture, Fisheries and Forestry (DAFF), and are a ‘best-fit’ for the range fishing dependent businesses across south-eastern Australia. Table 2 lists the number of businesses for key ports included in the EMR. Using the above classification, all of the key ports identified for the EMR can be considered as having a high level of business activity associated with fishing.
Table 2: Number of fishing related businesses sourced from the Yellow Pages Online Directory 2006-2007 for some of the key ports identified in the East Marine Region Port Number of Fishing Related Businesses
Cairns QLD 122
Innisfail QLD 22
Townsville QLD 42
Mackay QLD 28
Gladstone QLD 30
Bundaberg QLD 36
Mooloolaba QLD 38
Brisbane QLD 168
Southport QLD 96
Bowen QLD 13
Yeppoon QLD 18
Hervey Bay QLD 44
Coffs Harbour NSW 28
Greater Sydney NSW 666
Ulladulla NSW 20
Bermagui NSW 28
Port Stephens NSW 84
Fisheries specific socio-economic profiles for Commonwealth and State fisheries were developed using data available at the time of writing and are present with the fishery profiles that follow.
East Marine Region – description of commercial, recreational and charter fishing activities 10

Commonwealth Fisheries
Introduction The Commonwealth fisheries that occur partly or wholly within the EMR include: � Coral Sea � Eastern skipjack � Eastern Tuna and Billfish � Small pelagics � Southern bluefin tuna � South East Scalefish and Shark (SESS) - east coast deep water trawl � SESS – trawl � SESS – gillnet, hook and trap � Norfolk Island - offshore demersal finfish � Norfolk Island - inshore � Southern squid jig
For the purposes of this review, data for some of these fisheries may have been combined, particularly where only a small portion of the fishery occurs within the EMR. Where possible, data has been collated and mapped on catch, effort and Gross Value of Production (GVP) for the component of individual fisheries that occurs within the EMR. As fisheries data is not currently recorded against bioregional areas, much of the data is estimates based around spatial information provided with catch returns. Data for the fishery as a whole should always be referred to when making assessments of the fishery (production, value), the data presented here has been generated specifically to attempt to illustrate fishing activity in the EMR. Again, in some cases because there is only limited effort for an individual fishery within the EMR data confidentiality issues mean it has not been possible to provide detailed analysis and presentations of data. The profiles below provide a brief synopsis of each fishery, and where possible an analysis of catch data for the period 2002 -2006. Key information sources are provided at the end of each profile for those seeking further information on individual fisheries. In discussing the economics of fisheries several terms are used recurringly. For the purposes of these profiles the following definitions have been applied: Latent effort exists where rights (such as boat Statutory Fishing Rights (SFRs), gear SFRs, quota SFRs and permits) that could be used in a fishery are left idle. It can be used as an indicator of fishery profitability whereby high levels of latent effort suggest that low profits in the fishery do not justify fishing. Net returns are the long run profits from a fishery after all costs have been met, including fuel, crew costs, repairs and maintenance, the opportunity cost of capital, depreciation, the opportunity cost of family and owner labour and management costs. Although net returns do not provide an indication of the potential returns available from a fishery in the long run, a time series of net returns may indicate in which direction returns in a fishery are heading.
East Marine Region – description of commercial, recreational and charter fishing activities 11

Figure 4 - Commonwealth Fishery Boundaries in the EMR
East Marine Region – description of commercial, recreational and charter fishing activities 12

Profiles
Coral Sea Fishery - Bêche-De-Mer, Aquarium Fish, Line, Trap & Trawl, Trochus, Lobster
GEAR TYPE(S): Hand collection (including diving gear), mid-water and benthic otter trawl, long-line, trap, trot-line, drop-line and handlines.
LOCATION: Extends from Cape York to Sandy Cape off Queensland. It is bounded on the east by the Australian Fishing Zone (AFZ) boundary and on the west by a line 10 to 100 n. mile seaward of the Great Barrier Reef, excluding the areas that comprise Coringa-Herald and Lihou Reef National Nature Reserves.
MAIN SPECIES: Bêche-de-mer White teatfish (Holothuria fuscogilva), black teatfish (H. whitmaei), blackfish (probably Actinopynga miliaris), prickly redfish (Thelenota ananas), greenfish (Stichopus chloronotus), surf redfish (Actinopyga mauritiana), sandfish (H. scabra), lollyfish (H. atra) and amberfish (T. anax). Aquarium fish Damselfish (Pomacentridae), butterflyfish (Chaetodontidae), angelfish (Pomacanthidae), wrasses (Labridae), anemone fish (Amphiprion spp., Premnas spp.) and gobies (Gobiidae). Trochus Thought to be Tectus pyramis Lobster Tropical rock lobsters (Panulirus ornatus, P. versicolor and P.pennisiulatus) Line and trawl Reef species including coral cods (Epinephelus spp.), snapper and emperor species (Lethrinidae, Lutjanidae) and threadfin bream (Nemypteridae) and crustaceans.
East Marine Region – description of commercial, recreational and charter fishing activities 13

COMMERCIAL ENDORSMENTS:
Whole fishery (2007) 18 fishing permits spread across the demersal line, otter trawl, bêche-de-mer, aquarium collection, and lobster- and trochuscollection sectors. 2 permits for trawling 2 for taking bêche-de-mer 2 for aquarium fish 3 permits for lobster and trochus 9 permit holders that have access to the demersal line and trawl sector
MANAGEMENT: Australian Fisheries Management Authority Input controls
Limited entry Gear restrictions Spatial closures
Output controls TAC Size limits Catch triggers and move-on provisions
CATCH (GVP): The fishery produced 105 t ($0.503m) in 2006 of an assortment of fishes, crustaceans, molluscs and echinoderms. The entire Within east bioregion Coral Sea Fishery occurs within the East Marine Region.
STATUS: Black teatfish, white teatfish, surf redfish, prickly redfish, sandfish, and other species of Bêche-de-mer uncertain Aquarium fish sector, line-fishing, trawling, lobster and trochus sector uncertain
East Marine Region – description of commercial, recreational and charter fishing activities 14

CATCH Bêche-de-mer DESCRIPTION: White teatfish (Holothuria fuscogilva), black teatfish (H. whitmaei), blackfish (probably Actinopynga miliaris), prickly redfish
(Thelenota ananas), greenfish (Stichopus chloronotus), surf redfish (Actinopyga mauritiana), sandfish (H. scabra), lollyfish (H. atra) and amberfish (T. anax) with or without the use of diving equipment. Aquarium fish Fish can be taken by hand, by a barbless hook and line, or by nets used to herd fish into collection areas. SCUBA equipment can be used by commercial operators. Target species include damselfish (Pomacentridae), butterflyfish (Chaetodontidae), angelfish (Pomacanthidae), wrasses (Labridae), anemone fish (Amphiprion spp., Premnas spp.) and gobies (Gobiidae). Line, trap and trawl sector A range of gear, including trawl and bottom longline, are used to target reef and seamount species. Demersal and mid-water otter trawling targets fish and crustaceans. Line-fishing sector predominantly targeting coral cods (Epinephelus spp.), snapper and emperor species (Lethrinidae, Lutjanidae) and threadfin bream (Nemypteridae). The sector is not permitted to take tuna or tuna-like species. Trial fishing with traps for demersal finfish is also currently underway. Lobster and trochus Collection of lobster and trochus by hand with or without SCUBA equipment.
HISTORY OF THE FISHERY:
The Australian Fisheries Management Authority (AFMA) has prepared a ‘Statement of Management Arrangements’ for the Coral Sea Fishery. AFMA manages each sector under permit conditions, using different controls that include limited entry, gear restrictions, size limits, total allowable catch (TAC) and spatial controls. There are 18 fishing permits spread across the demersal line, otter trawl, bêche-de-mer, aquarium collection, and lobster- and trochus-collection sectors. There are currently 2 permits for trawling, 2 for taking bêche-de-mer, 2 for aquarium fish and 3 permits for lobster and trochus. There are 9 permit holders that have access to the demersal line and trawl sector. Bêche-de-mer The targeted bêche-de-mer species in this sector are white teatfish (Holothuria fuscogilva), black teatfish (H. whitmaei), prickly redfish (Thelenota ananas), surf redfish (Actinopyga mauritiana), sandfish (H. scabra), lollyfish (H. atra) and amberfish (T. anax). Collection is permitted by hand only, with or without the use of diving equipment. There are annual individual quota allocations per permit for black teatfish (500 kg), white teatfish (2 t), prickly red fish (10 t), sandfish (5 t) and surf red fish (5 t). For all other species of béche-de-mer, the remaining uncaught proportion of the combined
East Marine Region – description of commercial, recreational and charter fishing activities 15
TAC determines the catch limit. The combined bêche-de-mer TAC for the sector is 150 t, which is far in excess of recent catches. In a measure to avoid heavy localised depletion, operators may take a maximum of 5 t in one area, after which they are required to move a minimum of 15 n. miles before resuming fishing. An updated, detailed assessment of catches and catch rates that accounts for reefs and targeting behaviour is a high priority for this sector. Since July 2005, operators in the bêche-de-mer sector in the Coral Sea have been signatories to the Memorandum of Understanding in relation to the Queensland Sea Cucumber Association for the Waters Under Australian Fisheries Management Authority Jurisdiction (2005–2008). This stipulates a 3-year rotational harvesting strategy for bêche-de-mer on 21 reefs within the Coral Sea. The conditions of this memorandum have since been built into the ‘Management Arrangements’ for the sector from 2006. Aquarium species Most aquarium fish taken in this sector are species broadly distributed throughout the western Pacific, but some are considered endemic to the Coral Sea region. There is limited information on the extent of resource use by the sector. Catches are currently recorded at genus level in a Queensland Department of Primary Industries and Fisheries logbook, with no detailed effort data. Fish can be taken by hand, by a barbless hook and line, or by nets used to herd fish into collection areas. SCUBA equipment can be used by commercial operators. The main groups of fish harvested are damselfish (Pomacentridae), butterflyfish (Chaetodontidae), angelfish (Pomacanthidae), wrasses (Labridae), anemone fish (Amphiprion spp., Premnas spp.) and gobies (Gobiidae). Fish are air-freighted live to domestic and export markets. Each permit has a maximum number of persons authorised to take fish with the boat specified in the permit. Built into the Management Arrangements for 2006/2007 is a precautionary trigger requires that if combined fishing effort reaches 200 days, then the sustainability and impacts of fishing at this level will be evaluated. Line, trap and trawl A range of gear, including trawl and bottom longline, are used to target reef and seamount species. Demersal otter trawling targets fish and crustaceans. If approved by AFMA, automatic longline equipment can be used, and finfish traps are currently being used after an initial trial. Permit holders are required to have turtle exclusion devices (TEDs) installed and operational when trawling for crustaceans. A total catch of 105 t was reported for line-fishing and trawl in 2006. To date there have been no assessments of the impact of fishing on the stocks. However, AFMA monitors catches to assess species composition and species dominance. Lobster and trochus A minimum tail length of 125 mm for lobster and a size range of 80 to 125 mm for trochus apply in this sector. ‘Move on’ provisions are in place for lobster and trochus to limit the potential for localised stock depletion on reefs and the potential
East Marine Region – description of commercial, recreational and charter fishing activities 16

overfishing of the resource. When the lobster tail catch at a location reaches 3 t, the mother ship must move at least 15 n. miles to a new anchorage. For trochus the equivalent ‘move on’ trigger is a 5 t catch. When the total catch for these sectors reaches 30 t, an initial stock assessment to determine a TAC is required. Permits allow the collection of lobster and trochus by hand with or without the assistance of SCUBA equipment. There is a limit on the number of persons allowed to take fish at any one time within the lobster and trochus sector using the boat nominated on the fishing permit. Lobster and trochus catches for 2005 and 2006 remain confidential owing to low participation in the sector.
ECONOMIC No economic surveys of the fishery have been conducted and constructing indicators of the fishery’s economic performance is CHARACTERISTICS: difficult given the multi-sector nature of the fishery. The low gross value of production of the fishery indicates that any
significant expenditure on fishery management for this fishery would dissipate any net returns in the fishery.
FORECAST: The low trochus catches are a result of the non-commercial value of the species collected. Removal of minimum fishing days may decrease effort and catch in some sectors. With high fuel costs, changes in the frequency of fishing may occur. However, there is still the possibility for effort to increase if new fisheries are discovered.
COMMENTS: • The Coral Sea Fishery is a multi-species, multi-gear fishery • The Coral Sea Fishery has relatively low participation levels and comprises diverse fishing methods and an equally diverse
catch, ranging from deep sea fishes to coral reef molluscs. • These aspects, coupled with a remote location, present a significant challenge for fisheries management. • There are 18 fishing permits spread across the demersal line, otter trawl, bêche-de-mer, aquarium collection, and lobster-
and trochus-collection sectors.
SOURCES: AFMA (2003) Environmental Assessment Report – Coral Sea Fishery. Australian Fisheries Management Report, Canberra. AFMA (2006) Coral Sea Fishery Statement of Management Arrangements. Australian Fisheries Management Report, Canberra. DEW (2004) Assessment of the Coral Sea Fishery. Department of Environment and Heritage, Canberra. Hunter, C., Skewes, T, Burridge, C. and Dennis, D. (2002) Research for management of the Coral Sea Collector Sector (bêche-
East Marine Region – description of commercial, recreational and charter fishing activities 17

de-mer). CSIRO Division of Marine Research, Cleveland. Woodhams, J. (2007) Coral Sea Fishery. In: Larcombe, J. and McLoughlin, K. (eds.) (2007) Fishery Status Reports 2006: Status of Fish Stocks Managed by the Australian Government. Bureau of Rural Sciences, Canberra.
Table 3: Catch data for the Coral Sea Fishery YEAR Catch (t) GVP (A$ m) Active vessels
2002 157 0.574 10 2003 222 0.825 13 2004 209 0.875 12 2005 276 155.1 13 2006 105 0.503 9
East Marine Region – description of commercial, recreational and charter fishing activities 18

Eastern Tuna and Billfish Fishery
GEAR TYPE(S): Longline fishery and small minor-line component
LOCATION: Cape York to the South Australia-Victoria border, out to the edge of the Australian Fishing Zone and includes waters around Lord Howe and Norfolk Islands and Tasmania and High seas
MAIN SPECIES: Yellowfin tuna (Thunnus albacares), bigeye tuna (Thunnus obesus), albacore tuna (Thunnus alalunga), broadbill swordfish (Xiphias gladius), and striped marlin (Tetrapturus audax)
COMMERCIAL In 2004 and 2005, there were 222 longline permits and 67 minor-line permits; in 2007 there are 115 longline permits and 50 ENDORSMENTS: minor-line permits
MANAGEMENT: Australian Fisheries Management Authority Input controls Limited entry Gear and area restrictions Byproduct and bycatch restrictions Statutory management plan with transferable effort rights are being implemented in April 2008 Mitigation measures in place to reduce bycatch Output controls Maximum catch limits, bycatch limits and a series of trigger catch levels have been introduced to limit swordfish and albacore catches
ECONOMIC ABARE estimates based on regular surveys show that net returns in the fishery have generally been low. Net returns have been CHARACTERISTICS: positive in only three of the last eleven surveyed years, and the three most recent estimates have all been negative, at
East Marine Region – description of commercial, recreational and charter fishing activities 19

$18.7 million in 2002-03 (in 2005-06 dollars), -$15.1 million in 2003-04 and -$8.3 million in 2004-05. Net returns have been affected recently by relatively high diesel costs, relatively low export prices (partly as a consequence of the appreciation of the Australian dollar) and probable localised depletions of the inshore swordfish stock. Latent effort has been an issue for the fishery as the current management arrangements allow operators to increase their effort as net returns increase. For example, targeting of swordfish off Mooloolaba (Queensland) in the late 1990s generated modest net returns, but these were dissipated by 2001-02 as interest in this species increased. The proposed management system of individual transferable effort (ITE) units has the potential to constrain fishing effort to a greater degree than current management arrangements and reduce latency. However, input control regimes provide fishers with an incentive to use unrestricted inputs in place of restricted inputs to increase fishing power in a process known as ‘effort creep’ whereby catching capacity increases but costs are not minimised.
CATCH (GVP): In 2006 catch within the East Marine Bioregion was estimated to be: yellowfin tuna 1785 t (A$15.3 million); bigeye tuna 495 t Within east bioregion (A$5.0 million); swordfish 1131 t (A$7.5 million†); striped marlin 369 t (A$2.4 million†); albacore tuna 2583 t (A$4.4 million)
†Based on reported value for billfish collectively`
STATUS: Overfishing of bigeye tuna and yellowfin tuna in the western and central Pacific Ocean (WCPO), but stocks not overfished; striped marlin and broadbill swordfish in the south western Pacific overfished status uncertain and overfishing status uncertain; South Pacific albacore tuna not overfished and not subject to overfishing.
CATCH The most important species in the longline catch in 2006 were yellowfin (1690 t); swordfish (983 t); bigeye (437t); striped marlin DESCRIPTION: (461 t); and albacore (2426 t). The species mix can vary significantly between years depending on availability and targeting
practices. For example, in 2002 yellowfin made up over half the recorded catch whilst in 2006 albacore made up over 40 percent of the catch. Nominal catch per unit effort (CPUE) for domestic-longlined yellowfin peaked at around 25 fish per 1000 hooks in 1989 (when 1.0 million hooks were reported in logbooks). During 1992–96 catch rates varied between 12.2 and 18.0, decreasing to 8.4 during 1997 when a significant part of the fleet switched to targeting swordfish. Since 1998 catch rates have varied between 4.4 (in 1999) and 8.6 yellowfin per thousand hooks (in 2002). Nominal CPUE for swordfish and bigeye peaked in 1997 (when 6.1 million hooks were set), and then fell quickly. Since 2000, catch rates of both species have remained well below their peak, declining to record low levels in 2006. Catch rates of swordfish in inshore regions declined significantly, and localised depletion is apparent on the inshore “Brisbane Grounds”.
East Marine Region – description of commercial, recreational and charter fishing activities 20

Large vessels had maintained higher catch rates by operating progressively further offshore. However, increased fuel and bait prices resulted in a shift to albacore, and the proportion of swordfish taken from outside the AFZ declined from almost 40% of the total weight in 2004 to 10% in 2006.
HISTORY OF THE FISHERY:
Broadbill swordfish (Xiphias gladius), bigeye tuna (Thunnus obesus) and yellowfin tuna (Thunnus albacares) are the most valuable commercial species. They are caught by pelagic longline and either airfreighted fresh-chilled to Japan and the United States or, sold on the domestic market. Longliners also take significant amounts of albacore tuna (Thunnus alalunga) and striped marlin (Tetrapturus audax). Annual longline effort in the domestic fishery has fallen from around 12 million hooks in recent years to about 9 million hooks in 2006 as a result of increased operating costs and declining catch rates. The gross value of production has fallen by 50% since the early 2000s. Catches of yellowfin, bigeye, swordfish and striped marlin peaked in 2001–03 and the total retained catch reached 6254 t in 2002. In 2006 the retained catch declined to 5771 t. Sporadic troll catches of pelagic species have been reported off New South Wales since first European settlement. With the introduction of live-bait-and-pole techniques for southern bluefin tuna (Thunnus maccoyii) and sporadic catches of skipjack (Katsuwonus pelamis) and yellowfin, the fishery expanded rapidly in the 1950s. The introduction of purse seining in the 1970s boosted catches further. Japanese longliners operated off the east coast from the early 1960s until the mid 1990s. Domestic longlining for yellowfin commenced off New South Wales in the early 1960s, with the catch sold to canneries and local fish markets. Longlining increased markedly following the successful airfreighting of fresh-chilled tuna to Japan in the early 1980s. However, many vessels left the fishery in 1988 because yellowfin catch rates off central and southern New South Wales (the centre of activity) had become too variable, possibly reflecting either variable natural abundance or local depletion at this southern extremity of the species’ range. There was a rapid expansion in the 1990s in northern Queensland waters, where catch rates of yellowfin and bigeye were high. In the mid-1990s, improved access to swordfish markets in the United States prompted many fishers to move to southern Queensland ports such as Mooloolaba to target swordfish. Longline catches of striped marlin increased markedly in the late 1990s. Many swordfish longliners switched to albacore in 2006 in response to reduced swordfish availability, high operating costs, and market demand for albacore. Domestic longliners are mostly 15–25 m long. ETBF longliners use monofilament gear and, on average, set about 1200 hooks each day on around 93 days per year. Trip length ranges up to 30 days, but most are between 2 and 15 days. The catch is stored on ice, in ice slurry or in refrigerated brine. Some vessels range up to 1000 n. mile or further from port to fish, but 40–300 n. miles is more typical. Actual fishing practices vary with target species, location and season.
East Marine Region – description of commercial, recreational and charter fishing activities 21

FORECAST: Effort continues to reduce (number of hooks and boats) across the fishery with a change of target species from higher value broadbill swordfish to lower value albacore. Processors are marketing albacore as fresh product into Spain to gain a higher price than the canned food market in Samoa. The fishery is characterised by rapid expansions and contractions linked to variations in foreign exchange rates, the discovery of new resources and markets, and fluctuations in local abundances.
COMMENTS: • Annual longline effort in the domestic fishery has fallen from around 12 million hooks in recent years to about 9 million hooks in 2006 as a result of increased operating costs and declining catch rates.
• The gross value of production has fallen by 50% since the early 2000s. • Of concern are declines in catch rates of yellowfin, bigeye and, in inshore areas, swordfish. The catch rate declines combined
with increasing operating costs and fluctuating market returns resulted in many longliners targeting low-value albacore during 2006.
• The management plan for the domestic longline fishery is implementing a hook-based management system incorporating transferable effort rights.
• Move to Statutory Fishing Rights in April 2008. • Recent moves to sell fresh albacore into Spain at approximately $8 kilo compared to $2 kilo into Samoan canneries. • Until recently, latent effort in the fishery was a problem, however the structural adjustment resulted in the surrender of almost
100 of the more than 200 longlining permits originally available in the fishery. • The bycatch of sharks, marlins, seabirds and sea turtles is a major issue in the management of longline fisheries throughout the
world.
SOURCE: Bromhead, D., Ackerman, J., Graham, S., Wight, M., Wise, B. and Findlay, J. (2005) Byproduct: Catch, Economics and Co-occurrence in Australia’s Pelagic Longline Fisheries. Bureau of Rural Sciences, Canberra. Knight, E., Park, T., Bromhead, D., Ward, P., Barry, S. and Summerson, R. (2006) Analyses of Interactions Between Longline and Recreational Gamefish Fisheries Taking or Tagging Striped Marlin off New South Wales. Bureau of Rural Sciences,Canberra.Ward, P. (2007) Eastern Tuna and Billfish Fishery. In: Larcombe, J. and McLoughlin, K. (eds.) (2007) Fishery Status Reports 2006: Status of Fish Stocks Managed by the Australian Government. Bureau of Rural Sciences, Canberra.
East Marine Region – description of commercial, recreational and charter fishing activities 22

Table 4: Catch data for key ETBF species (catch adjusted for East Bioregion area)
YEAR Yellowfin Bigeye Albacore Broadbill Striped marlin
Other species
Total catch (t) GVP ($m)
% of total GVP million hooks active boats
2002 2763 805 523 1963 592 874 7519 74.9 91 10.6 138
2003 2955 840 462 1666 600 733 7257 58.7 91 11.4 134
2004 1901 748 637 1378 409 957 6030 44.1 92 9.1 120
2005 1263 685 730 1390 344 646 5059 33.5 93 8.4 96
2006 1637 417 2399 874 436 617 6380 28.7 95 8.4 79
East Marine Region – description of commercial, recreational and charter fishing activities 23

Figure 5 - Eastern Tuna and Billfish Fishery catch for the period 2002 – 2006
East Marine Region – description of commercial, recreational and charter fishing activities 24

Figure 6 - Eastern Tuna and Billfish Fishery catch breakdown for 2006
East Marine Region – description of commercial, recreational and charter fishing activities 25

Figure 7 - Tuna and Billfish Fishery GVP for the period 2002 – 2006
East Marine Region – description of commercial, recreational and charter fishing activities 26

Figure 8 - Eastern Tuna and Billfish Fishery GVP breakdown for 2006
East Marine Region – description of commercial, recreational and charter fishing activities 27

Skipjack Fisheries
GEAR TYPE(S): The majority of skipjack are caught using purse seine. Pole-and-line methods have also been used to take skipjack or to assist purse-seine operations in taking skipjack.
LOCATION: Eastern skipjack: Southern New South Wales to north-eastern Tasmania between November and June each year.
MAIN SPECIES: Skipjack tuna (Katsuwonis pelamus), plus incidental catches of yellowfin and bigeye tuna, frigate mackerel and occasionally sharks, mahi mahi, rays and marlins) which are believed to be less than 2% of the total landings.
COMMERCIAL Eastern skipjack: 20 permits (2007) ENDORSMENTS:
MANAGEMENT: Australian Fisheries Management Authority Input controls
Limited entry Gear restrictions Area restrictions
Output controls Bycatch limits
CATCH (GVP): Eastern Fishery Within east bioregion 2004–05: confidential
2003–04: confidential 2002–03: 0 t (A$0.0 million) 2001–02: 194 t (A$0.3 million) 2000–01: 1544 t (A$2.7 million)
STATUS: Not overfished and not subject to overfishing
East Marine Region – description of commercial, recreational and charter fishing activities 28

CATCH Skipjack are widely distributed within the AFZ, however the AFZ is at the southern extent of the range of the species, DESCRIPTION: and Australian operators take only a very small proportion of the total Indian Ocean and Western and Central Pacific
Ocean (WCPO) catches. Fishing has generally been confined to two main areas in Southern Australian waters with the main fishing areas off south east NSW and in the Great Artesian Bight with skipjack taken in Australian waters supplied almost exclusively to the cannery in Port Lincoln.
HISTORY OF THE FISHERY:
Skipjack tuna (Katsuwonis pelamus) is a small, oceanic tuna species that is found in nearly all tropical and sub-tropical waters except the eastern Mediterranean and the Black Sea. It is a highly migratory, schooling species characterised by rapid growth, early maturation and high fecundity. Skipjack tuna is the only target species in the Australian fishery and is used in the canned tuna market. Landings of other species (mainly yellowfin and bigeye tuna, frigate mackerel and occasionally sharks, mahi mahi, rays and marlins) are believed to be less than 2 per cent of the total landings. The majority of skipjack are caught using purse seine. Pole-and-line methods have also been used to take skipjack or to assist purse-seine operations in taking skipjack. When used to assist purse-seine operations, poling is managed under skipjack fisheries; conversely, when used on its own, it is managed as a minor line component of the ETBF and the WTBF. Skipjack is used in the canned tuna market. In 2003–04, purse-seine fishery entitlements for skipjack tuna were separated from the ETBF and the former Southern and Western Tuna and Billfish Fishery (SWTBF) to form the Eastern Skipjack Fishery (ESF) and the Western Skipjack Fishery (WSF) respectively. These fisheries extend generally throughout the areas of the WTBF and the ETBF, with the exception of Area E (Cairns- Townsville Restricted Area) of the ETBF. Individual permits have access to different areas of the overall fisheries. They also extend into the high seas areas of the Indian Ocean and the WCPO. Pacific and Indian Ocean populations of skipjack are assumed to be discrete. Tagging data have not shown any exchange between the two oceans. The most recent stock assessment in the WCPO found that skipjack was exploited at a modest level relative to its biological potential, and concluded that the stock was not overfished and that overfishing was not occurring. There is no quantitative stock assessment available for skipjack tuna in the Indian Ocean. However, in 2006 the Indian Ocean Tuna Commission noted that the range of available stock indicators suggest there is no immediate concern about the status of skipjack tuna in the Indian Ocean. Global catches of skipjack tuna have been increasing steadily since 1950. In the past decade, skipjack has been the most commonly caught species in the WCPO, accounting for over two-thirds of the total tuna catch. Catches of skipjack in the WCPO were an estimated 1.38 million t in 2004 (the highest on record) and 981 000 t in 2005. Purse-seine is the most common method used, but a significant percentage of skipjack is also caught using pole-and-line and other methods.
East Marine Region – description of commercial, recreational and charter fishing activities 29

Although skipjack are widely distributed throughout the AFZ, the main Australian fishing grounds have been historically located off south-eastern Australia and in the Great Australian Bight. In the ESF, skipjack are fished from southern NSW to north-eastern Tasmania between November and June each year. Between December and April, some of the southern bluefin tuna (Thunnus maccoyii) purse-seine fleet fish for skipjack in the Great Australian Bight. Operators primarily use the ports of Port Lincoln and, to a lesser extent, Eden. The closure of the Eden cannery in 1999 reduced local demand; however, some skipjack is still landed for road transfer to the sole remaining cannery in Port Lincoln. Australia’s skipjack fisheries are small, with relatively low catches compared with Pacific and Indian Ocean fisheries. The Australian fisheries are considered to have little impact on global Pacific and Indian Ocean stocks because they are located at the edge of the species’ range. Catches in the south-eastern AFZ are highly variable and dependent on recruitment from lower latitudes. In response to the separation of the purse seine component from the ETBF and SWTBF, the Australian Fisheries Management Authority (AFMA) established the Skipjack Consultative Committee to advise the AFMA Board on skipjack tuna management. The current management regime consists of limited entry (permit issued annually), restrictions on net size, area restrictions and bycatch limits. Other tuna species are the main bycatch species encountered in the skipjack fisheries. Regulations limit the yellowfin and bigeye bycatch to less than 50% of the total catch in any trip and less than 2% of each vessel’s annual catch. In addition, any blue or black marlin caught must be returned to sea and there is a trip limit of 20 sharks (retained with fins intact). Southern bluefin tuna can only be retained by operators who hold quota for that species. All operators are required to keep logbooks, and only authorised vessels are permitted to tranship at sea. In 2005, AFMA released the first bycatch action plan for tuna purse-seine fisheries, covering both the skipjack and southern bluefin tuna fisheries. The aim of the plan is to gain an understanding of the range of significant bycatch issues and, if required, develop and implement mitigation measures. Purse-seine fisheries are considered to be highly selective and result in minimal interactions with non-target species. The main issue currently associated with bycatch in Australia’s skipjack fisheries is the absence of verified data on it. Independent data collection by observers will assist in achieving the aims of the plan (there is currently no observer data from vessels targeting skipjack). Ecological risk assessments for the two skipjack fisheries are currently being finalised. The fisheries were declared a Wildlife Trade Operation under the Environment Protection and Biodiversity Conservation Act 1999 on 30 November 2005. The declaration is valid until 30 November 2008 and allows the export of product from the fishery. The Ministerial Direction to AFMA in 2005 required that management of skipjack fisheries responds to a range of matters including the development of a harvest strategy and the use of output controls. The harvest strategy for skipjack tuna is currently under development and will take into account the bycatch of other tuna species.
East Marine Region – description of commercial, recreational and charter fishing activities 30

ECONOMIC CHARACTERISTICS:
Only a small number of the permits issued for the fishery are fished against, partly because of low market prices. The existence of this latent effort suggests that net returns are probably low.
FORECAST: There has been very low effort and catches in the fishery in recent years. This is primarily due to the economic factors. Increase in effort in the fishery is dependent on the global price for skipjack and cost of transport of the catch to canneries.
COMMENTS: • Single species fishery targeting skipjack • Fisheries Southern New South Wales to north-eastern Tasmania (east) • Very important fishery worldwide, though Australia’s fisheries are small in comparison • Some bycatch of yellowfin and bigeye tuna, frigate mackerel and occasionally sharks, mahi mahi, rays and
marlins) are believed to be less than 2% of the total landings • Highly transient and variable stocks, with several years of zero or near-zero catches over the past five years
SOURCES: Hindmarsh, S. (2007) Skipjack Fisheries. In: Larcombe, J. and McLoughlin, K. (eds.) (2007) Fishery Status Reports 2006: Status of Fish Stocks Managed by the Australian Government. Bureau of Rural Sciences, Canberra.
East Marine Region – description of commercial, recreational and charter fishing activities 31

Small Pelagic Fishery
GEAR TYPE(S): Purse seining and mid-water trawling Permission for pair trawling is not routine at present
LOCATION: The Small Pelagics Fishery extends from southern Queensland south to southern Western Australia. It is currently divided into four management zones, though only zone D is applicable for the East Bioregional Plan in that it encompasses the area from Bass Strait to southern Queensland and waters more than 3 n. miles from the coast.
MAIN SPECIES: Blue mackerel (Scomber australasicus); jack mackerel (Trachurus declivis, T. symmetricus); redbait (Emmelichthys nitidus) and more recently pilchards (Sardinops neopilchardus). Yellowtail scad (Trachurus novaezelandiae) are managed as a byproduct species.
COMMERCIAL ENDORSMENTS:
In 2006 there were 76 licences in the fishery; however only 12 were active. After the restructure there are 74 licences remaining in 2007.
MANAGEMENT: Australian Fisheries Management Authority Input controls
Limited entry Gear restrictions
Output controls TAC limits and trigger catch levels in four management Catch limits - blue mackerel 3500 t; Jack mackerel 2500 t; redbait 1000 t
CATCH (GVP): Within east bioregion
In 2006 catch within the East Marine Bioregion was estimated to be: blue mackerel 1972t (N/A); jack mackerel 744t(N/A); redbait 8344t (N/A) confidential
STATUS: Blue mackerel not overfished and not subject to overfishing. Jack mackerel, yellowtail scad and redbait uncertain
East Marine Region – description of commercial, recreational and charter fishing activities 32

CATCH DESCRIPTION:
Fishery has primarily targeted jack mackerel, but now also includes redbait and pilchards. Recent move from capturing small pelagics for fish meal, lobster bait and tuna food to processing for recreational fishing bait and human consumption.
HISTORY OF THE FISHERY:
From 2002, trawling replaced purse seining as the predominant method. In recent years redbait, comprising more than 70% of the catch, has replaced jack mackerel as the main species caught. Historically, most SPF catches have been jack mackerel, purse seined in Zone A within 3 n. mile of eastern Tasmania. The fishery developed rapidly from an annual catch of 6000 t in 1984–85 to a peak of almost 42 000 t in 1986–87. Catches during the next decade were between 8000 t and 32 000 t. Tonnages taken since 1994–95 are confidential because of the small number of fishers involved, but between 1996 and 2002 have been the lowest on record—far below 8000 t. In 2003 and 2004, increased catches mainly comprised redbait. Catches in Zone D have remained low and stable. Previously, almost all of the purse-seine catch in Zone A was processed into fishmeal, with some frozen for use as rock lobster bait. In the last two years, much of the catch has been used as feed for southern bluefin tuna (Thunnus maccoyii) aquaculture ventures around Port Lincoln. In the last few years some operators have moved to processing for consumption and recreational fishing bait. In 2004, foreign fishing interests began to secure fishing rights to operate in the SPF. In response to stakeholder concerns about the impact of very large fishing vessels entering the fishery, AFMA froze all boat nominations. In early 2005, AFMA decided to develop a Statutory Plan of Management for the SPF, including the allocation of individually transferable quotas (ITQs). This plan is expected to be finalised in 2008.
ECONOMIC The fishery is characterised by high levels of latent effort, with only 12 of the 76 permit packages issued being fished CHARACTERISTICS: against in 2006. Further, TACs are set much higher than recent catches. These facts indicate that the fishery is unlikely
to be highly profitable. The high level of latent effort suggests that any increases in demand for small pelagic species could result in increased fishing effort and the dissipation of any above average returns.
East Marine Region – description of commercial, recreational and charter fishing activities 33

FORECAST: There is considerable purse-seine capacity in Australia with which to catch small pelagic species, but rapid expansion is not expected unless market demand changes. Expansion of the fishery will require caution because small pelagic fish prey on phytoplankton and zooplankton, and are themselves prey for many species of fish, birds and marine mammals. There is a potential for their localised depletion or overexploitation.
COMMENTS: • From 2002, trawling replaced purse seining as the predominant method • In recent years redbait, comprising more than 70% of the catch, has replaced jack mackerel as the main species
caught • Catches from the east coast section of the fishery have remained low and stable • The majority of the SPF catch has been off the coast of Tasmania and not within the East Bioregion
SOURCES: Findlay, J. (2007) Small Pelagics Fishery. In: Larcombe, J. and McLoughlin, K. (eds.) (2007) Fishery Status Reports 2006: Status of Fish Stocks Managed by the Australian Government. Bureau of Rural Sciences, Canberra.
East Marine Region – description of commercial, recreational and charter fishing activities 34

Southern Bluefin Tuna Fishery
GEAR TYPE(S): The main gear used within the East Marine Region is longlining off the NSW coast, though 98% of the catch is taken via purse seining in South Australia
LOCATION: Off the coast of central and southern NSW (also Great Australian Bight)
MAIN SPECIES: Southern bluefin tuna (Thunnus maccoyii)
COMMERCIAL ENDORSMENTS:
98 SFR holders as of July (2007)
MANAGEMENT: Australian Fisheries Management Authority Must be an SFR holder Output controls
TAC limits Individual Transferable Quotas (ITQs)
CATCH (GVP): Total global catch for 2005 was reported as 21686 t: Australia 5244 t (A$140 million); Japan 7327 t; South Korea 38 t; Taiwan 940 t; New Zealand 264 t; Indonesia 1799 t; Philippines 53 t
STATUS: Overfished and subject to overfishing
CATCH DESCRIPTION:
Around 98% of Australia’s SBT quota is taken by 5-10 purse seine vessels fishing in the GAB for 15-25 kg SBT. These are towed alive back to static grow out cages off Port Lincoln and fattened for up to 6 months before harvest and export to Japan. SBT is also a valuable and largely incidental catch for long-line vessels operating in southern Australian waters (in recent years less than 10 tonnes). They are also taken in small amounts by pole and line, and trolling.
East Marine Region – description of commercial, recreational and charter fishing activities 35

HISTORY OF THE FISHERY:
Southern bluefin tuna (Thunnus maccoyii) (SBT) is one of the most highly valued fish species for sashimi, especially in Japan, the main market. The typical wholesale price of A$30–50/kg encourages targeting even when stock levels and catch rates are very low. Consequently, SBT is vulnerable to overfishing. In the early 1950s Australians established a pole-and-live-bait fishery for surface schooling SBT off New South Wales, South Australia and, later (1970), Western Australia. In 1982, when Australian catches peaked at 21 500 t, most of the catch was taken for canning. The introduction of a TAC of 21 000 t in 1983, then the reduction of that TAC and of the quotas allocated to individual fishers, closed down the Western Australian pole fishery for very small juveniles. It also forced the south-eastern fishery to target larger (hence, more valuable) SBT for sashimi. Surface-fishery catches decreased further between 1989 and 1995, when up to half of the Australian national catch allocation was taken by Australia-Japan joint-venture longliners in the Australian Fishing Zone (AFZ). In 1990–91, about 20 t of SBT that were pole-caught off South Australia were transferred to floating enclosures and fattened to increase their market value. ‘Tuna farming’ now involves purse-seining the schools of SBT, transferring them to floating pens, towing the pens to Port Lincoln in South Australia and transferring the fish to moored ‘farm’ pens. While it accounted for 3% of the Australian TAC in 1991–92, farming now uses more than 98%, with the remainder taken by domestic longline vessels. The farmed SBT, fattened for up to 6 months, are a premium export product. Most domestic longline vessels target broadbill swordfish (Xiphias gladius), bigeye tuna (T. obesus), yellowfin tuna (T. albacares) and albacores (T. alalunga), but some also take SBT as both a target and byproduct species. Japanese longliners began to fish for SBT in the 1950s on the spawning grounds south of Java. In the 1960s, they expanded into SBT areas of the southern oceans, where catches spanned all age groups from young juveniles to old adults. The longline catch peaked at 81 605 t in the early 1960s. The subsequent decline persisted despite increasing fishing effort until the catch was stabilised by the quota regime of the late 1980s. From 1979 to 1997, Japanese longliners operated in the AFZ under licence. There were no meaningful constraints at first, but their access to the zone, and later their catch from it, were progressively reduced until their exclusion in 1997 after failure to reach agreement on a global TAC for 1998. In the early 1980s, when there were clear signs that the SBT stock was overfished, Australia, Japan and New Zealand developed informal collaborative-management arrangements. Their signing of an international convention in 1993, which came into force in 1994, formally established the Commision for the Conservation of Southern Bluefin Tuna (CCSBT). From 1989 to 1997, the three countries set informal, then CCSBT allocated, limits of 5265 t (Australia), 6065 t (Japan) and 420 t (New Zealand), but from 1998 to 2002 there was no agreement on a global TAC or national allocations. In the absence of agreement, Australia and New Zealand maintained the previous CCSBT limits. In 1995, Japan had sought a
East Marine Region – description of commercial, recreational and charter fishing activities 36

quota increase of up to 6000 t over and above their previous allocation of 6065 t, either as an additional commercial catch, or an ‘experimental fishing programme’ (EFP), or a combination of these. Australia and New Zealand opposed an increase, concerned that it would increase risk to the spawning stock and its ability to rebuild. No agreements were reached despite numerous and extensive meetings, so in 1998 Japan undertook an EFP without CCSBT endorsement, increasing its reported catch by 1464 t to 7500 t. In 1999, Australia, New Zealand and Japan again could not create an acceptable joint EFP. Japan proceeded unilaterally, including an EFP of 2241 t in its reported catch of 7554 t. Australia and New Zealand, maintaining their previous quota allocation, sought and obtained the prescription of interim measures by the International Tribunal for the Law of the Sea (ITLOS) to halt the Japanese ‘experimental catch’ pending the constitution of a formal arbitral tribunal to consider the dispute. At the sixth meeting of the CCSBT in March 2000, Japan advised that it would deduct the amount of the EFP catch over the previously agreed national allocation from its year 2000 catch in accordance with the ITLOS order. In August 2000, the international arbitral tribunal determined that ITLOS did not have jurisdiction in the matter. Subsequently, Japan stated that it would voluntarily set its catch at 6065 t, but would also increase this level by 711 t in 2001 to recover catch paid back as a result of the ITLOS interim measures. As part of the dispute resolution, Australia and New Zealand agreed to let Japan catch 365 t of the 711 t on a one-off basis during one fishing year. In 2001 Japan reported a total of 6674 t. At the Scientific Committee meeting in September 2005, Australia formally raised concerns about new information that showed that sales of SBT in Japanese markets over many years had far exceeded those expected from the reported global catch. At the Commission meeting later that year the CCSBT agreed to undertake an independent review of the Japanese market data. By July 2006 it was clear that there had been significant levels of unreported catch over at least 20 years. Estimates of the total amount of unreported catch were as high as 178 000 t. In 2006, Japan also reported that a number of its vessel had under-reported their catch in 2005 by a total of 1500 t. Investigations as to the extent and impact of the unreported catch are ongoing. In the meantime, the CCSBT has agreed to cut Japan’s national allocation to 3000 t (previously 6065 t) for the next five years (2007–11).
ECONOMIC CHARACTERISTICS:
The two key indicators of economic performance in the fishery suggest that net returns are substantial. The first indicator, the price of quota, is related to industry’s perception about the current and future profits of the fishery. For aseasonal lease in 2004-05, estimates of the price of SBT quota were over $10 a kilogram. For a permanent transfer, estimates are in excess of $100 a kilogram. Relative to other Commonwealth fishery quota species, these values are high. The second indicator is a measure of latent effort. The fact that the TAC set for the fishery is essentially filled each seasonmeans that effort is being restricted and net returns are probably positive.
East Marine Region – description of commercial, recreational and charter fishing activities 37

FORECAST: The only expansion predicted is due to the recovery of the spawning stock and subsequent rebuilding of the fishery off the coast of NSW. However, 98% of the catch is taken in the South Australian purse seine tuna fishery.
COMMENTS: • Single species fishery targeting SBT • Predominant catch in Great Australian Bight mainly used for grow out in aquaculture pens • East Coast fishery is a longline fishery focussed off the central and southern coast of NSW • Southern bluefin tuna are slow-growing (relative to other tunas), live to about 40 years and mature at about 12 years. • The population of SBT is comprised of a single stock that migrates widely in the southern hemisphere. • SBT is especially valuable, they are marketed almost exclusively in Japan as sashimi. • The Southern Bluefin Tuna Fishery is an international fishery, managed since 1994 through the CCSBT, which is advised
by a scientific committee of member-country scientists and independent international scientists. • Excessive catches over many years (1960–80) reduced the spawning stock to a low level. More recently, catches outside
the Commission’s control and unreported catches by some members, frustrated efforts to rebuild the stock. • The spawning stock is estimated to be at a low fraction of its original biomass and available data suggests that recruitment
has been very low in recent years (2000–04).
SOURCES: Findlay, J. (2007) Southern Bluefin Tuna Fishery. In: Larcombe, J. and McLoughlin, K. (eds.) (2007) Fishery Status Reports 2006: Status of Fish Stocks Managed by the Australian Government. Bureau of Rural Science, Canberra.
East Marine Region – description of commercial, recreational and charter fishing activities 38

South East Scalefish and Shark Fishery
Overview
The Southern and Eastern Scalefish and Shark Fishery (SESSF) was created in 2003 through the amalgamation of four fisheries previously under separate management arrangements. A management plan for the fishery came into operation on 1 January 2005, but management arrangements (including total allowable catches [TACs]) are revised annually. The SESSF is a complex, multi-sector, multi-gear and multispecies fishery targeting scalefish and shark stocks of various size, distribution and composition. It extends from waters off southern Queensland, south around Tasmania and then west to Cape Leeuwin in Western Australia. The fishery’s management area encompasses almost half the waters of the Australian Fishing Zone (AFZ). The fishery operates in both Commonwealth and state waters under complex jurisdictional arrangements resulting from different Offshore Constitutional Settlement (OCS) arrangements with state governments. The SESSF is one of the most important Commonwealth-managed fisheries, with landings of over 35 000 t annually and a value of approximately A$100 million in 2004–05. The principle sectors of the SESSF that are managed under the Southern and Eastern Scalefish and Shark Fishery Management Plan 2003 are as follows: 1. Commonwealth trawl sector (CTS)—derived from the South East Fishery trawl sector (which includes the Danish-seine fleet) 2. Scalefish-hook sector (ScHS)—derived from the South East Fishery nontrawl sector 3. Great Australian Bight trawl sector (GABTS)—derived from the former Great Australian Bight Trawl Fishery (no activity in the EMR) 4. Shark hook sector (ShHS)—derived from the Southern Shark Fishery 5. Gillnet sector (GS)—derived from the Southern Shark Fishery (no activity in the EMR) 6. East coast deepwater trawl sector (ECDWTS)—near Lord Howe Island, was managed as a separate fishery until 2000
East Marine Region – description of commercial, recreational and charter fishing activities 39

South East Scalefish and Shark Fishery – Commonwealth Trawl and Scalefish Hook Sectors
GEAR TYPE(S): Mid-water trawl, demersal otter trawl, pair trawl, demersal longline and dropline
LOCATION: The Commonwealth trawl sector stretches from Sydney southwards around Tasmania to Cape Jervis in South Australia, where it abuts the Great Australian Bight Trawl Sector (GABTS). To the north, the Commonwealth trawl sector adjoins the east coast deepwater sector that extends to 24°30´S off Queensland. The scalefish-hook sector extends from the same boundary off Queensland to the South Australia-Western Australia border. Within the East Bioregion, the main hook fishing focuses on seamounts from Sydney to Brisbane.
MAIN SPECIES: Blue warehou, deepwater sharks, eastern gemfish, orange roughy, redfish, silver trevally, smooth oreo dory and other oreo dories, blue-eye trevalla, blue grenadier, eastern school whiting, flathead, mirror dory, ribaldo and silver warehou.
COMMERCIAL In 2007 there are 59 trawl SFRs, and 56 hook SFRs. ENDORSMENTS:
MANAGEMENT: Australian Fisheries Management Authority Input controls
Limited entry Statutory Fishing Rights (SFRs)
Output controls TAC limits Individual Transferable Quotas (ITQs) Area and gear restrictions Size limits on some species Harvest strategy
East Marine Region – description of commercial, recreational and charter fishing activities 40

CATCH (GVP): 2005: Trawl TAC species 18,330 t, non-TAC species 3550 t (A$59 million in 2004–05) Within east bioregion
STATUS: Eight stocks overfished; nine stocks not overfished; overfishing status of seven stocks uncertain; no stocks classified as overfishing; 15 stocks not subject to overfishing; overfishing status of nine stocks is uncertain
CATCH DESCRIPTION: The Commonwealth trawl and scalefish-hook sectors continue to be an important component of the Australian fishing industry, taking the largest marketed tonnage and supplying most of the fresh fish for Sydney and Melbourne. The 2005 value of the sectors was around A$60 million. This value is derived from ABARE fish-market prices, with a 21% deduction for marketing costs. Onboard value-adding by freezer trawlers in the winter blue grenadier fishery is not adequately represented in these Gross Value of Production (GVP) estimates. Trawl sector The trawl sector recorded landings of 18 330 t of quota species in 2005—a marked decrease of 16% from 2004. Landings were further reduced by 16% (to 15 419 t) in 2006. This includes orange roughy from the Remote Zone, but excludes the shark sector landings. The decline was mainly a consequence of smaller landings of blue grenadier and silver warehou. Landings of non-TAC species (excluding those of small pelagic species) were 3550 t in 2005 and 3290 t in 2006, a decrease when compared with 4683 t in 2004. Orange roughy catches from the continental slope management zones (eastern, southern and western) remained steady at 1030 t in 2005, but declined to 677 t in 2006. 2005 orange roughy catches from the Cascade Plateau were 1175 t—a decrease of 17% when compared with 2004. The 2006 Cascade Plateau orange roughy catch was nearly half that of 2005, with 677 t landed. In 2005, comparative landings of nine species declined by more than 10%, with pronounced falls (>20%) for blue-eye trevalla, blue grenadier, John dory, pink ling and silver trevally. Catches of eastern gemfish, mirror dory, redfish and southern zone orange roughy increased by greater than 10% in 2005. The landings of eight species was similar to those in 2004 (less than 10 % difference). The landings of 12 species declined more than 10% from 2005 to 2006, with catches of mirror dory, ocean perch, orange roughy (eastern western, southern and Cascade Plateau zones), redfish and silver trevally declining by greater than 20%. Blue-eye trevalla, blue warehou, ribaldo and royal red prawn landings increased in 2006, the most notable being blue warehou and ribaldo (up by 50% and 23% respectively). The landings of five species were similar in both 2005 and 2006. Overall landings in 2005 and 2006 declined along with trawl effort, which fell to 96 400 and 84 210 bottom-time hours respectively. This represents a 13% reduction in trawl effort from 2004 (110 720 bottomtime hours) to 2005, and a 13%
East Marine Region – description of commercial, recreational and charter fishing activities 41

reduction in effort from 2005 to 2006. Scalefish-hook sector Landings of quota species in 2005 totalled 1257 t, 18% lower than in 2004 (1529 t). The 2006 landings were an additional 10% lower than the 2005 figure. These decreases were largely attributed to reduced catches of pink ling in both 2005 and 2006 (down by 24% and 29% respectively). Hook effort increased by 35% from 2004 (3 600 930 hooks) to 2005 (4 853 329 hooks); however, this effort was reduced by 22% in 2006 (3 802 364 hooks). A further 192 t and 243 t of non-quota species were landed in 2005 and 2006. These non-quota totals almost certainly included some bycatch from the shark sectors, because a common logbook is used.
HISTORY OF THE FISHERY:
Trawl sector Before 1996, the South East Fishery (SEF) consisted solely of the multispecies trawl and Danish-seine fishery and was commonly called the South East Trawl Fishery. However, in 1996, Commonwealth managed non-trawl demersal fishing was included, giving rise to trawl and non-trawl (now scalefish-hook) sectors. Some of the species and stocks involved extend beyond the fisheries’ boundaries and are managed by other state or Australian Government fisheries. However, under Offshore Constitutional Settlement (OCS) arrangements, the pertinent states have largely ceded control of Southern and Eastern Scalefish and Shark Fishery (SESSF) quota-managed species to the Australian Government. Thus, in most instances, the catches in state waters by Australian Government-endorsed vessels are debited against the respective SESSF TAC limits. However, NSW retains jurisdiction over non-trawl fishers out to 80 n. miles along its entire coastline, and over trawl fishers for the same distance offshore north of Sydney and out to 3 n. miles offshore south of Sydney. The NSW fleets fishing area expanded southwards to waters off Victoria in the 1950s. Trawlers began fishing in deeper and more southerly waters during the 1970s. By the early 1980s the NSW fleet had increased to 130 vessels, almost double that of 1970. Before 1985 there was a limit on the number of trawlers over 32 m long permitted to enter the fishery, but there were no regulations controlling the number of smaller vessels. Despite the introduction of several management measures aimed at limiting fleet expansion, both fishing capacity and effort continued to increase. The fishery was seen to be in a worsening economic state, with the decline of stocks such as eastern gemfish exacerbating the situation. The discovery and development of the deepwater orange roughy fishery in the late 1980s and early 1990s led to further increases in fleet capacity and fishing effort. TACs were introduced for eastern gemfish in 1988 and orange roughy in 1990. TACs and ITQs for another 15 important commercial stocks taken by the fishery were introduced in 1992. The sector takes more than 100 commercial species, but the quota managed stocks comprise more than 80% of the recorded weight of landed catch.
East Marine Region – description of commercial, recreational and charter fishing activities 42

About 140 vessels were active in the trawl sector in 1991. Vessel numbers declined after the introduction of quotas. In 1997 there were 108 active vessels, but a further 42 fishing permits were held by inactive fishers at the start of the year. During 1997, an Australian Government-funded adjustment scheme removed 27 permits from the fishery. Nonetheless, annual fishing effort (hours of bottom-time) doubled between 1992 and 2001 and has remained at high levels. There were 75 trawlers and 16 Danish seiners active in 2004. Landings from NSW and eastern Bass Strait waters dominated the total trawl catch until the mid 1980s, when targeting of orange roughy and, to a lesser extent, blue grenadier in waters around Tasmania markedly increased the Tasmanian and Victorian landings. The downturn in the orange roughy fishery saw effort shift back into shallower waters, with Eden (NSW) the main landing port in 1996 and 1998. Increased landings of blue grenadier, silver warehou and remote-zone orange roughy resulted in Hobart again becoming the main landing port for three years, but Eden has since dominated. Scalefish-hook sector The scalefish-hook sector was derived from the SEF non-trawl sector. This sector incorporates all waters outside a line 80 n. mile off the NSW coast, and all waters outside state internal water boundaries of Victoria, Tasmania and South Australia. The number of active Australian Government-endorsed SESSF hook vessels in 2004 was 49. The most commonly used hook methods are droplines and demersal longlines, with many fishers using both methods. In the past four years there has been a marked increase in automatic-longline effort. The main quota species targeted are blue-eye trevalla and pink ling. In addition to hook methods, five trap permits have been granted, with the main target species being ling. Shark gillnetting also catches scalefish bycatch. While blue warehou once constituted a major target species for ‘shark’ gillnetters, a marked stock decline has ended targeted gillnet fishing for this species. Entry to the scalefish-hook sector (and the previous non-trawl sector) has been limited since the mid 1980s, with more stringent entry criteria introduced in 1996. However, until 1997 there were no constraints on catch weights (other than trip limits for eastern gemfish since 1991). In 1997 a TAC of 250 t was introduced for blue warehou. ‘Global’ TACs, encompassing all commercial fishing methods in Australian Government-managed SEF waters, started in 1998 for blue-eye trevalla, blue warehou and pink ling. Such global TACs were extended to all SEF quota species in 2001. Prior to 2002 there was only one autolongline permit in the non-trawl sector. In early 2002, a further 14 ‘trial’ permits were issued. Concerns over possible overfishing and perceived inequities in the allocation of permits led to a moratorium in October 2002 on the issue of further permits. This is still in place. Owing to the efficiency of these additional auto-longliners, SESSF hook effort rose sharply from 665 000 hooks set in 2001 to 8 504 902 hooks set in 2004. OCS arrangements for quota species have now been finalised with every relevant state; however, the agreement between NSW and the Australian Government impedes effective management because some stocks—including overfished stocks—subject to total catch limits in the Australian Government-managed component of the fishery are not subject to limits in the NSW-managed component.
East Marine Region – description of commercial, recreational and charter fishing activities 43

ECONOMIC CHARACTERISTICS:
Trawl sector ABARE has conducted regular economic surveys of the Commonwealth trawl sector since the mid 1990s. Estimates of net returns for the sector have usually been low, with the highest estimate in the last ten years being $5.5 million (in 2005-06 dollars) in 1997-98. Net returns have decreased substantially since then, and in 2004-05 they were -$4.3 million. The decline in net returns has been driven by falling catches, static prices, increased effort and relatively high costs (Vieira et al. 2007). Low profitability is also indicated by high latency in the fishery as a consequence of non-binding TACs. In 2006, only three species in the fishery — ling, blue grenadier and orange roughy (Cascade Plateau) — had greater than 90 per cent of their TAC filled. Under non-binding TACs, quota prices will tend to be relatively low and less likely to offset the transaction costs of trading. Therefore, it is likely that quota trade and autonomous adjustment in the fishery (where effort gravitates to the most efficient operators) have been impeded. Latency in the fishery has also allowed substantial increases in fishing effort over time. Effort (measured in hours trawled) increased from 58 000 hours in 1992 to 117 000 hours in 2004. Over the same period however, total catch has declined so that catch — measured in tonnes or value terms — per hour trawled has also declined. Kompas et al. (2006) report preliminary results from a bioeconomic model for the sector based on the 2004 fishing season. They find that for each of the five stocks analysed [orange roughy (eastern zone), orange roughy (Cascade Plateau zone), spotted warehou, ling (trawl) and flathead] the long run stock size is larger at maximum economic yield (MEY) than at maximum sustainable yield (MSY) and that TACs need to be reduced from 2004 levels to rebuild stocks to levels associated with MEY. In some cases the necessary reductions in catch are large [almost 60 per cent for orange roughy (Cascade Plateau)] but for others the reductions are relatively small (only 7 per cent for flathead). However, the benefits of restricting catches now are realised in the future when for almost all species a TAC could be set that results in larger levels of catch than were being made in 2004. For example, implementing a TAC of 2980 tonnes now for flathead allows a TAC of 3850 tonnes to be set in the future when the stock has recovered to a long run equilibrium biomass. Again, it is important to note that these TACs are based on the 2004-05 stock assessment and if the stock assessment is updated, the results would likely change. Many TACs for the 2007 fishing season have been reduced and for the species analysed by Kompas et al. (2006) reductions have been broadly in line with model results. A significant number of boats were also recently removed from the fishery. For these reasons the SESSF and its trawl sector are likely to be more profitable in the future. However, over the next few years it is likely that revenues will be lower than they have been in the past because TACs are lower. While fishing costs will likely fall in the short term, profits are likely to be higher when stocks rebuild and the cost per unit of catch falls. Scalefish-hook sector While ABARE does survey the scalefish-hook sector, published results are aggregated into the broader gillnet, hook and trap sector. For this sector, net returns over the period 1998-99 to 2002-03 averaged $1.3 million in real terms (in 2005-06 dollars).
East Marine Region – description of commercial, recreational and charter fishing activities 44

In 2003-04 and 2004-05 net returns peaked at their highest levels since economic surveying began with values of $3.7 million and $2.3 million respectively. Like the trawl sector, latent effort in the form of non-binding TACs has been an issue. It is therefore possible that higher net returns could be achieved in the sector. Recent reductions in TACs and vessel numbers should lead to a more profitable sector once stocks rebuild and the cost per unit of catch falls.
FORECAST: The size of the fishery has decreased due to the restructure and unlikely to decrease substantially in the near future.
COMMENTS: • The Commonwealth trawl and scalefish-hook sectors supply most of the fresh fish to the markets of New South Wales, Victoria and Tasmania.
• There is a limit on the TAC of each of the 24 stocks, species or species groups that provide over 80% of landings. The remaining landings of around 100 commercial species are unrestricted.
• The second year (2006) of implementation of the harvest strategy framework had substantially reduced TACs, and no stocks are classified as subject to overfishing. The 2007 TAC was reduced for 23 stocks, maintained for 8 stocks and increased for 2 stocks. The 2007 TAC is now at bycatch levels for 11 other stocks.
• The principal hook species are blue-eye trevalla and pink ling. A shift to autolonglining technology has led to increased pink ling catches by this sector and continued rises in effort during recent years.
• The number of active trawlers has decreased since 1992, but total fleet capacity and horsepower have increased. The annual trawl-fishing effort has fallen in recent years—117 569 bottom-time hours in 2004, 96 400 hours in 2005 and 84 210 hours in 2006. Danish-seine effort has also decreased—8224 shots in 2004, 7572 shots in 2005 and 6072 shots in 2006.
• Total landed catch weight of quota species has decreased in recent years—22 674 t in 2004, 19 587 t in 2005 and16 553 t in 2006. Rising fuel prices and relatively static fish prices greatly reduced fishers’ profit margins.
SOURCES: Morison, A., Tilzey, R. and McLoughlin, K. (2007) Commonwealth Trawl and Scalefish-Hook Sectors. In: Larcombe, J. and McLoughlin, K. (eds.) (2007) Fishery Status Reports 2006: Status of Fish Stocks Managed by the Australian Government. Bureau of Rural Sciences, Canberra.
East Marine Region – description of commercial, recreational and charter fishing activities 45

Table 5: Summary table for the SESSF Trawl Fishery 2002 – 2006 (catch adjusted for East Marine Bioregion area).
Year Redfish Flathead Royal red
prawn Mirror dory School whiting
Other species
Total catch (t) GVP ($m)
% Fishery GVP Trawl hours Active boats
2002 500 297 437 83 76 794 2188 5.7 8 17000 36
2003 434 304 213 272 104 867 2193 4.8 8 17602 39
2004 325 281 192 170 52 872 1893 3.8 7 16718 38
2005 294 156 172 260 117 883 1881 3.5 7 14980 31
2006 182 144 191 210 86 670 1483 3.1 7 10887 27
East Marine Region – description of commercial, recreational and charter fishing activities 46

Figure 9 - Catch breakdown over time for the SESSF Trawl Sector
East Marine Region – description of commercial, recreational and charter fishing activities 47

Figure 10 - SESSF Trawl Sector catch breakdown for 2006
East Marine Region – description of commercial, recreational and charter fishing activities 48

Figure 11 - GVP over time in the SESSF Trawl Sector
East Marine Region – description of commercial, recreational and charter fishing activities 49

Figure 12 - GVP breakdown for the SESSF Trawl Sector for 2006.
East Marine Region – description of commercial, recreational and charter fishing activities 50

South East Scalefish and Shark Fishery – Shark Hook Sector
GEAR TYPE(S):
LOCATION: The shark hook fishing sector covers the area offshore from the South Australian and Western Australian border, through Victoria, around Tasmania and along the east coast to southern Queensland. However, despite the management area for the Shark Hook sector covering the east coast to southern Queensland, the fishery does not moved north past the Victorian and New South Wales border. Given that the fishery currently does not extend into the eastern zone it wild not be covered in greater detail.
MAIN SPECIES: Gummy shark (Mustelus antarcticus), southern sawshark (Pristiophorus nudipinnis), common sawshark (P. cirratus), elephant fish (Callorhinchus milii)
ECONOMIC CHARACTERISTICS
Shark hook sector While ABARE does survey the shark hook sector, published results are aggregated with the broader gillnet, hook and trap sector. For this sector, net returns over the period 1998-99 to 2002-03 averaged $1.3 million in real terms (in 2005-06 dollars). In 200304 and 2004-05 net returns peaked at their highest levels since economic surveying began with values of $3.7 million and $2.3 million respectively. The major share of shark catch in the SESSF is made up of gummy shark. Relative to quota prices for other species in the SESSF, prices for gummy shark quota are relatively high. Furthermore, approximately 96 per cent of the gummy shark TAC was caught in 2006. This evidence suggests that gummy shark is profitable species. Recent TACs for school shark have been low to allow stocks to recover from previous overfishing. However, like gummy shark, the 2006 TAC for school shark was close to filled with 89 per cent of the TAC caught. School shark quota prices are also high relative to other SESSF species. So although stocks remain overfished the species is likely to be profitable. For other shark species in the sector, TACs have been relatively less binding and latency is an issue indicating that these species may be less profitable.
FORECAST: The fishery is not predicted to expand along the east coast at present, but has the potential to do so.
East Marine Region – description of commercial, recreational and charter fishing activities 51

SOURCES: McLoughlin, K. (2007) Shark Gillnet and Hook Sectors. In: Larcombe, J. and McLoughlin, K. (eds.) (2007) Fishery Status Reports 2006: Status of Fish Stocks Managed by the Australian Government. Bureau of Rural Sciences, Canberra.
East Marine Region – description of commercial, recreational and charter fishing activities 52

South East Scalefish and Shark Fishery – East Coast Deepwater Trawl Sector
GEAR TYPE(S): Otter trawl
LOCATION: Beyond the 4000m isobath to the boundary of the AFZ from southern QLD to southern NSW
MAIN SPECIES: Alfonsino (Beryx splendens), spiky oreo, (Neocyttus rhomboidalis), boarfish (Family Pentacerotidae) and blue-eye trevalla (Hyperoglyphe antarctica)
COMMERCIAL ENDORSMENTS:
10 endorsements with 1 active (2007).
MANAGEMENT: Australian Fisheries Management Authority Input controls
Limited entry Gear restrictions
Output controls TAC ITQs
CATCH (GVP): Within east bioregion
There was no catch (or effort) in this sector in 2006; confidentiality requirements prevent reporting of catches in 2005
STATUS: Uncertain for alfonsino
CATCH DESCRIPTION: Effort within the fishery remains low due to economic constraints. Primary targets are alfonsino, boarfish and blue-eye trevalla.
HISTORY OF THE The east coast deepwater trawl sector (ECDWTS) was initially established as an exploratory fishery, termed the East Coast FISHERY: Deepwater Trawl Fishery. This fishery was located beyond the 4000 m isobath of the continental margin, between Barrenjoey
Point (New South Wales) and Cape York (Queensland). The northern sector of the fishery was transferred to the Coral Sea Fishery in 1994, and the remainder was integrated with the former South East Fishery in 2000 to become the east coast
East Marine Region – description of commercial, recreational and charter fishing activities 53

deepwater trawl zone. Operations in this zone were subject to South East Fishery quotas. When amalgamated into the SESSF under the Southern and Eastern Scalefish and Shark Fishery Management Plan 2003, the zone became known as them ECDWTS. AFMA established a permanent trawl exclusion area to protect a chain of seamounts called the Eastern Australian Seamounts that lie within the ECDWTS area. Trawling is also prohibited within 25 n. miles of Lord Howe Island and Ball’s Pyramid. Fishers must have SFRs for the Commonwealth trawl sector in order to be granted permits to operate in the ECDWTS. In the 1990s, most fishing effort involved searching for orange roughy (Hoplostethus atlanticus) around the Lord Howe Rise. In 1993–94, the catch from the northern Lord Howe Rise area comprised approximately 68 t of orange roughy, 13 t of oreo (mainly spiky oreo, Neocyttus rhomboidalis), 5 t of cardinal fish (Epigonus sp.) and 2 t of ribaldo (Mora moro). More recently, alfonsino (Beryx splendens) has become the major target species and has dominated catches. During the period 2001 to 2005, 1142 t of alfonsino was caught, in addition to 100 t of boarfish (Family Pentacerotidae) and 89 t of blue-eye trevalla (Hyperoglyphe antarctica); the orange roughy catch was insignificant during this period. In 2006, Individually Transferable Quotas (ITQs) were introduced for alfonsino, with a TAC of 500 t for both 2006 and 2007. Orange roughy was listed in November 2006 as conservation dependent under the Environment Protection and Biodiversity Conservation Act 1999 (EPBC Act). The orange roughy TAC for 2007 was reduced to zero and replaced by a 50 t bycatch limit. There was no catch or fishing effort in 2006.
ECONOMIC ABARE does not perform economic surveys of the ECDWTS. However, given that only 1 out of 10 permits was active in 2007 CHARACTERISTICS: it is likely that the profitability of the fishery is not high.
FORECAST: Effort has decreased recently due to the costs of operating in the fishery (mainly diesel costs involved with travelling the large distances and long trawl runs required) and the low abundance of fish on the abyssal plain. Economic and fish densities are unlikely to change in the near future, therefore an expansion of effort in this fishery is unlikely.
COMMENTS: • Decreased effort within the fishery as a result of economic constraints (high fuel prices with naturally low fish abundances on the abyssal plain)
• TACs and ITQs used within the fishery for key species • During the 1990s orange roughy were the primary target species • Today alfonsino, boarfish and blue-eye trevalla are the main target species
East Marine Region – description of commercial, recreational and charter fishing activities 54
SOURCES: Sampaklis, A. (2007) East Coast Deepwater Trawl Sector. In: Larcombe, J. and McLoughlin, K. (eds.) (2007) Fishery Status Reports 2006: Status of Fish Stocks Managed by the Australian Government. Bureau of Rural Sciences, Canberra.
East Marine Region – description of commercial, recreational and charter fishing activities 55

Norfolk Island – Inshore and Offshore Demersal Finfish Fishery
GEAR TYPE(S): Otter trawl and demersal line
LOCATION: Norfolk Island is located 1500 km east of Brisbane. Australia exercises territorial control over the surrounding 200 n. mile Exclusive Economic Zone (EEZ).
MAIN SPECIES: Labrids, pomacentrids and cods (Serranidae), periwinkles (Nerita atramentosa), kingfish, Seriola lalandi; trevally, Caranx spp.; and tunas, Thunnidae) and (Lethrinidae and Serranidae), emperor, Lethrinus miniatus, serranid cods (Epinephelus rhyncholepis, Promicrops lanceolatus), snapper (Chrysophrys auratus), kingfish, yellowfin tuna (Thunnus albacares), skipjack (Katsuwonus pelamis) and black marlin (Makaira indica).
COMMERCIAL Inshore ENDORSMENTS: Recreational fishing only no commercial endorsements
Offshore No current permits as exploratory fishery ceased in 2003 (Management Plan currently being developed)
MANAGEMENT: Australian Fisheries Management Authority Input controls
Limited entry Gear restrictions
Output controls Inshore fisher has voluntary catch limits TAC limits and trigger catch levels in four management
East Marine Region – description of commercial, recreational and charter fishing activities 56

CATCH (GVP): Inshore Within east bioregion Inshore Fishery was previously estimated to be about 80–100 t. Recent catches were 6 t in 2004 (value N/A) and 5 t in 2005
(value N/A). Offshore Nil since 2003 1st exploratory fishery 2000-2003 2nd exploratory fishery under development
STATUS: Inshore uncertain, offshore uncertain
CATCH Inshore DESCRIPTION: Semi-subsistence fishery targeting small labrids, pomacentrids and cods (Serranidae), and the gathering of periwinkles (Nerita
atramentosa). Recreational sports fishery targeting kingfish, Seriola lalandi; trevally, Caranx spp.; and tunas, Thunnidae) and demersal fish (including Lethrinidae and Serranidae). Recreational/ semi-professional fishery targeting emperor, Lethrinus miniatus, serranid cods (Epinephelus rhyncholepis, Promicrops lanceolatus), snapper (Chrysophrys auratus) and kingfish. Pelagic species, particularly yellowfin tuna (Thunnus albacares), skipjack (Katsuwonus pelamis) and black marlin (Makaira indica). Offshore Initial targets in the fishery were alfonsino (Beryx splendens) and orange roughy (Hoplostethus atlanticus), however the low catches of these species suggests that these species are not abundant in this area. Recently bass groper (Polyrion americanus), hapuka (P. oxygeneois) and blue-eye trevalla (Hyperoglyphe antarctica) dominated hook catches, but their life histories render the long-term commercial viability and sustainability of a demersal fishery as uncertain.
HISTORY OF THE Approximately 38 commercial species have been identified from the Norfolk Island inshore fishery to date. Local catches of FISHERY: seafood are erratic; thus, local demand is also met with imported frozen fish.
Currently, the inshore fishery consists of three components: • A semi-subsistence ‘traditional’ shore fishery involving pole-and-line fishing with small hooks for small labrids,
pomacentrids and cods (Serranidae), and the gathering of periwinkles (Nerita atramentosa) • A recreational ‘sports’ fishery from rocky shores using modern rod-and-reel gear with lures or bait to take pelagic
East Marine Region – description of commercial, recreational and charter fishing activities 57

species (such as kingfish, Seriola lalandi; trevally, Caranx spp.; and tunas, Thunnidae) and demersal fish (including Lethrinidae and Serranidae)
• A recreational/semi-commercial small-boat fishery for domestic consumption, selling surplus catch to restaurants and residents. This fishery is composed of approximately 70 fishing boats. Only 12–15 of these vessels regularly take significant quantities of fish, and only small vessels are used owing to a lack of mooring facilities. In most years fishing effort is constrained by weather conditions, allowing for only 50–100 days of fishing. Demersal species are primarily targeted on reefs and pinnacles 5–10 n. mile (but up to 30 n. mile) offshore, at depths of 20–50 m. The catch is dominated by emperor, Lethrinus miniatus, known locally as ‘trumpeter’. Other important catch includes serranid cods (Epinephelus rhyncholepis, Promicrops lanceolatus), snapper (Chrysophrys auratus) and kingfish. Pelagic species, particularly yellowfin tuna (Thunnus albacares) and skipjack (Katsuwonus pelamis) are trolled. The occasional capture of black marlin (Makaira indica) indicates scope for game fishing with improvements to maritime infrastructure (i.e. moorings).
Little specific research has been conducted on the fisheries of Norfolk Island. Private catch records and anecdotal evidence indicate that catches of trumpeter and other demersal species have declined since at least the 1980s. From late 1950 to the 1970s, large catches were taken from inshore waters in areas that are now unproductive. Despite only 20 years of relatively moderate fishing effort, low catch rates persist, suggesting limited recruitment from more productive areas. If fish populations are isolated then they may be vulnerable to overfishing. There are no management controls other than voluntary catch limits of trumpeter during the breeding season (December to January). The function of AFMA around Norfolk Island is concentrated on the commercial East Coast Tuna and Billfish Fishery and the Norfolk Island Offshore Demersal Finfish Fishery (both outside the Norfolk Island box). AFMA has established an interim management policy for the inshore fishery, which was reviewed in July 2005 and remained in effect through 2006. This policy was endorsed by the Administration of Norfolk Island and a data-sharing agreement ratified through a Memorandum of Understanding (MOU). Under the MOU, the parties will collaborate to maintain and enhance bilateral cooperation on fisheries data and management of the inshore fishery. AMFA has also distributed Catch Cards to known fishers to record catch. Minimal participation has occurred (<10%), and effective management measures will hence depend on the support of local fishers. Offshore exploratory fishery Interest from mainland operators in the potential catches of deep-slope species such as alfonsino (Beryx splendens) and orange roughy (Hoplostethus atlanticus) resulted in exploratory fishing around Norfolk Island. The status of fishery resources was unknown, so AFMA issued two trawl and five demersal line 3-year exploratory fishing permits in late 2000. The permits excluded fishing in the 40 x 67 n. mile Norfolk Island box and stipulated annual catch limits for each species, at least one trip per year, and completion of at least 50 days of fishing over the 3 years.
East Marine Region – description of commercial, recreational and charter fishing activities 58

Fishers were also subject to strict environmental and bycatch provisions (for example, the obligatory setting of bird-scaring ‘tori’ lines when hook fishing, restrictions on offal discharge, and 25% observer coverage). Permit holders failed to meet the required 50 days of fishing and catches did not reach annual set limits. A cumulative 82 t was landed over this 3-year period, with trawl catch contributing less than 1 t. Although trawl effort was low, catches suggested that orange roughy and alfonsino are not abundant within the Norfolk Island EEZ. Bass groper (Polyrion americanus), hapuka (P. oxygeneois) and blue-eye trevalla (Hyperoglyphe antarctica) dominated hook catches, but their life histories render the long-term commercial viability and sustainability of a demersal fishery as uncertain. No further exploratory permits have been issued since 2003; however, a 5-year management plan for future fishing arrangements in the offshore fishery is currently being examined by AFMA and it is anticipated that fishing will resume in late 2007. There is no harvest strategy or ecological risk assessment planned for the Norfolk Island fisheries owing to a lack of data and the limited extent of the fisheries.
ECONOMIC No indicators of the economic performance of either the inshore or offshore fishery are available. The low gross value of CHARACTERISTICS: production of the fishery indicates that any significant expenditure on fishery management for this fishery would dissipate any
net returns in the fishery.
FORECAST: Inshore The inshore fishery is unlikely to expand in the future. Offshore The offshore exploratory fishing permits have expired and are presently being reviewed by AFMA. Offshore effort may be retarded due to a lack of commercial quantities of target species or a reticence of fishers to invest in the fishery due to the uncertain nature of the endorsements. The fishery may expand if more certainty is provided in the future.
COMMENTS: • Two main fisheries – inshore and offshore • Inshore fishery consists of locally based fishers providing food for the local community • Offshore experimental fishery with 2 trawl and 5 line endorsements • Offshore experimental fishery expired and is currently under review within AFMA • Recently fishers in the offshore zone have failed to meet minimum fishing days
East Marine Region – description of commercial, recreational and charter fishing activities 59
SOURCES: Sampaklis, A. (2007) Norfolk Island Fishery. In: Larcombe, J. and McLoughlin, K. (eds.) (2007) Fishery Status Reports 2006: Status of Fish Stocks Managed by the Australian Government. Bureau of Rural Sciences, Canberra. Zann, L. Thompson, G. Clifton, D. and Kuster, C. The Fisheries and Marine Environment of Norfolk Island: Baseline Studies, Issues and Options for Management. Final Report to AFMA and Queensland Government, Southern Cross University, Lismore.
East Marine Region – description of commercial, recreational and charter fishing activities 60

Southern Squid Jig Fishery
GEAR TYPE(S): Squid jigging
LOCATION: The fishery is managed by the Australian Government in waters beyond the coastal waters of New South Wales, Victoria, Tasmania, South Australia, and in a small area of oceanic water off southern Queensland. However, despite the management zone for the Southern Squid Jig Fishery extending up the New South Wales coast to Queensland, fishing effort has not moved up the coast beyond Lakes Entrance and is mainly focussed offshore of Queenscliff and Portland in Victoria. Given that the fishery currently does not extend into the eastern zone it will not be covered in greater detail.
MAIN SPECIES: Arrow squid (Nototodarus gouldi)
CATCH (GVP): Catch for 2006: 619 t ($1m) Within east bioregion
STATUS: Uncertain
ECONOMIC ABARE estimates for net returns in the squid jig fishery are available for the 1997-98, 1998-99 and 2000-01 financial years CHARACTERISTICS: (Galeano et al. 2003). Real net economic returns for all three years were negative. The most recent estimate (for the 2000-01
financial year) was -$0.8 million (2005-06 dollars). Continued low to negative net returns are likely given the high levels of latent effort in the SSJF.
FORECAST: The fishery is not predicted to expand along the east coast at present, but has the potential to do so. Squid are commercially taken within the eastern trawl fishery as a byproduct.
SOURCES: Lynch, A. (2005) Southern Squid Fishery: Data Summary 2003 – 2004. Australian Fisheries Management Authority, Canberra. Sahlqvist, P. (2007) Southern Squid Jig Fishery. In: Larcombe, J. and McLoughlin, K. (eds.) (2007) Fishery Status Reports 2006: Status of Fish Stocks Managed by the Australian Government. Bureau of Rural Sciences, Canberra.
East Marine Region – description of commercial, recreational and charter fishing activities 61

Socio-economic profile All home ports in the Commonwealth Fisheries have been included below. For the purposes of this profile, key landed ports were defined as those where greater than 50 tonnes of catch were landed in 2006. Summary of key ports The key home ports for Commonwealth Fisheries include Cairns and Mooloolaba in QLD, and Sydney, Eden, Ulladulla and Bermagui in NSW (Vieira and Galeano, 2007). The key landed ports are Cairns, Mooloolaba, Brisbane and Southport in Queensland, and Coffs Harbour, Nelson Bay, Port Jackson, Sydney, Wollongong, Greenwell Point, Ulladulla and Bermagui in NSW. These ports have been selected using the home and landed port data available for the ETBF and the SESSF (presented in more detail below). Data for the other Commonwealth fisheries is largely unavailable; hence this section focuses on the ETBF and the SESSF. Fishing sector employment ABARE collects data on the average number of crew (which includes boat skippers) per vessel in its economic surveys of the ETBF and SESSF. Unpublished estimates provided by ABARE show that in 2004-05, approximately 450 crew (including skipper) were employed in the ETBF and approximately 550 crew were employed in both the Commonwealth trawl sector and the gillnet hook and trap sector of the SESSF. Additional employment data for this fishery is presented in Table 6. This table indicates that of the key Commonwealth Fishery ports, Bermagui is the most dependent on commercial fishing with 184 people employed in fishing, 1.8% of the total employment for the area. However, this data should be interpreted with caution as fishing employment here refers to employment in both state and Commonwealth Fisheries.
Table 6: Summary of available data for employment in fishing for some of the key ports within Commonwealth Fisheries
Main Ports SLA or SD Numbers employed Fishing employment in commercial (% of total fishing employment)
Cairns Cairns City (SSD) 162 0.3
Mooloolaba Mooloolaba (SLA) 27 0.8
Sydney Sydney (SD) 277 0.0
Ulladulla Shoalhaven (SLA) 60 0.8
Bermagui Bega Valley (SLA) 184 1.8
(based on Statistical Local Areas, Statistical Divisions, or Statistical Subdivision)
Source: ABS, Working Population Profile, 2001
Regional dependence on fishing Using available data from the Yellow Pages Online Directory, the number of businesses directly associated with some of the key ports in Commonwealth fisheries are presented in Table 4. All of the key ports in Table 4 have a high level of business activity associated with fishing.
East Marine Region – description of commercial, recreational and charter fishing activities 62

Table 7: Number of fishing related businesses sourced from the Yellow Pages Online Directory 2006-2007 for some of the key ports identified in the Commonwealth Fisheries Port Number of Fishing Related Businesses
Cairns QLD 122
Mooloolaba QLD 38
Brisbane QLD 168
Coffs Harbour NSW 28
Greater Sydney NSW 666
Ulladulla NSW 20
Bermagui NSW 28
Port Stephens NSW 84
Note: Fishing related businesses are those operating within all fisheries, not those specific to the Commonwealth Fisheries only
Eastern Tuna and Billfish Fishery (ETBF) � Major ports for this fishery include: Cairns and Mooloolaba in QLD, and Sydney, Ulladulla
and Bermagui in NSW (Vieira and Galeano, 2007). For the ETBF in 2005/06, 34% of the fleet
nominated Mooloolaba as their homeport.
� Key landed ports include: Cairns, Mooloolaba, Brisbane, and Southport in QLD, Coffs
Harbour, Nelson Bay, Sydney, Ulladulla and Bermagui in NSW (NSW DPI and QLD DPI&F
2006 catch data).
Southern and Eastern Shark and Scalefish Fishery (SESSF) � Major ports for this fishery include: Sydney, Eden, Ulladulla and Bermagui in NSW (Vieira
and Galeano, 2007).
� Key landed ports for the SESSF include: Sydney, Wollongong, Greenwell Point, Ulladulla,
Port Jackson and Bermagui in NSW (NSW DPI and QLD DPI&F 2006 catch data).
East Marine Region – description of commercial, recreational and charter fishing activities 63

New South Wales Fisheries
Introduction The New South Wales fisheries that occur partly or wholly within the EMR include: � Ocean Trap and Line � Ocean Fish Trawl � Ocean Prawn Trawl � Rock lobster
For the purposes of this review, data for some of these fisheries may have been combined, particularly where only a small portion of the fishery occurs within the EMR. Where possible, data has been collated and mapped on catch, effort and Gross Value of Production (GVP) for the component of individual fisheries that occurs within the EMR. As fisheries data is not currently recorded against bioregional areas, much of the data is estimates based around spatial information provided with catch returns. Data for the fishery as a whole should always be referred to when making assessments of the fishery (production, value), the data presented here has been generated specifically to attempt to illustrate fishing activity in the EMR. Again, in some cases because there is only limited effort for an individual fishery within the EMR data confidentiality issues mean it has not been possible to provide detailed analysis and presentations of data. The profiles below provide a brief synopsis of each fishery, and where possible an analysis of catch data for the period 2002 -2006. Key information sources are provided at the end of each profile for those seeking further information on individual fisheries.
East Marine Region – description of commercial, recreational and charter fishing activities 64

Fishery profiles
Ocean Trap and Line Fishery
GEAR TYPE(S): Fish trap, spanner crab net, setline, trotline, driftline, poling, handline, jigging, dropline, trolling
LOCATION: The fishery extends from the NSW coastline seaward to the 4,000 metre isobath (approx. 60 to 80 nm offshore). Under OCS arrangements with the Commonwealth, the Ocean Trap and Line fishery extends beyond traditional state waters (3nm offshore).
MAIN SPECIES: 11 primary species - Australian bonito, snapper, leatherjackets, yellowtail kingfish, grey morwong, blue-eye trevalla, spanner crabs, silver trevally, yellowfin bream, banded rock cod, gummy shark. 14 key secondary species - bass groper, eastern blackspot pigfish, gemfish, hapuku, jackass morwong, mahi mahi, mulloway, pearl perch, mixed sharks, Spanish mackerel, spotted mackerel, silver sweep, teraglin, wobbegong sharks.
COMMERCIAL 478 fishing businesses (2006) ENDORSMENTS/ BUSINESSES:
MANAGEMENT: NSW Department of Primary Industries The Ocean Trap and Line Fishery is a category 1 share managed fishery. Share management provides fishers with a secure access right in the form of shares. A minimum shareholding must be acquired before an endorsement is issued. Input controls
Limited entry Vessel restrictions Gear restrictions
Output controls Size restrictions Catch per trip limits for some species
ECONOMIC Economic analysis of the fishery performed by Dominion Consulting (2004) showed that the fishery had a net return of
East Marine Region – description of commercial, recreational and charter fishing activities 65
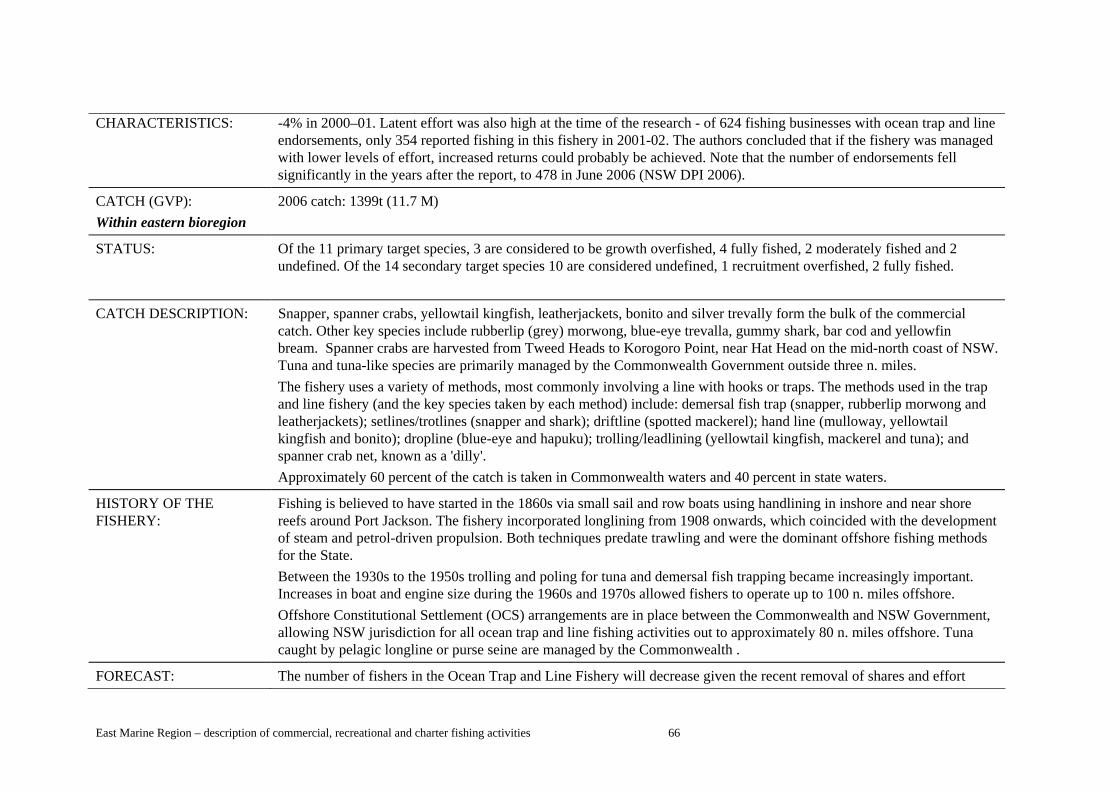
CHARACTERISTICS: -4% in 2000–01. Latent effort was also high at the time of the research - of 624 fishing businesses with ocean trap and line endorsements, only 354 reported fishing in this fishery in 2001-02. The authors concluded that if the fishery was managed with lower levels of effort, increased returns could probably be achieved. Note that the number of endorsements fell significantly in the years after the report, to 478 in June 2006 (NSW DPI 2006).
CATCH (GVP): 2006 catch: 1399t (11.7 M) Within eastern bioregion
STATUS: Of the 11 primary target species, 3 are considered to be growth overfished, 4 fully fished, 2 moderately fished and 2 undefined. Of the 14 secondary target species 10 are considered undefined, 1 recruitment overfished, 2 fully fished.
CATCH DESCRIPTION: Snapper, spanner crabs, yellowtail kingfish, leatherjackets, bonito and silver trevally form the bulk of the commercial catch. Other key species include rubberlip (grey) morwong, blue-eye trevalla, gummy shark, bar cod and yellowfin bream. Spanner crabs are harvested from Tweed Heads to Korogoro Point, near Hat Head on the mid-north coast of NSW. Tuna and tuna-like species are primarily managed by the Commonwealth Government outside three n. miles. The fishery uses a variety of methods, most commonly involving a line with hooks or traps. The methods used in the trap and line fishery (and the key species taken by each method) include: demersal fish trap (snapper, rubberlip morwong and leatherjackets); setlines/trotlines (snapper and shark); driftline (spotted mackerel); hand line (mulloway, yellowtail kingfish and bonito); dropline (blue-eye and hapuku); trolling/leadlining (yellowtail kingfish, mackerel and tuna); and spanner crab net, known as a 'dilly'. Approximately 60 percent of the catch is taken in Commonwealth waters and 40 percent in state waters.
HISTORY OF THE FISHERY:
Fishing is believed to have started in the 1860s via small sail and row boats using handlining in inshore and near shore reefs around Port Jackson. The fishery incorporated longlining from 1908 onwards, which coincided with the development of steam and petrol-driven propulsion. Both techniques predate trawling and were the dominant offshore fishing methods for the State. Between the 1930s to the 1950s trolling and poling for tuna and demersal fish trapping became increasingly important. Increases in boat and engine size during the 1960s and 1970s allowed fishers to operate up to 100 n. miles offshore. Offshore Constitutional Settlement (OCS) arrangements are in place between the Commonwealth and NSW Government, allowing NSW jurisdiction for all ocean trap and line fishing activities out to approximately 80 n. miles offshore. Tuna caught by pelagic longline or purse seine are managed by the Commonwealth .
FORECAST: The number of fishers in the Ocean Trap and Line Fishery will decrease given the recent removal of shares and effort
East Marine Region – description of commercial, recreational and charter fishing activities 66

through the implementation of marine parks and by the Securing Our Fishing Future Commonwealth initiative. Further restructuring of industry is also likely to see a reduction in the number of fishers operating in this fishery.
COMMENTS: • Multi method, multi species fishery targeting demersal and pelagic fisheries • Capture methods are various line and trap techniques targeting a range of finfish and spanner crabs • OCS arrangements with the Commonwealth allow this fishery into Commonwealth waters • Tuna caught by pelagic longline are managed by the Commonwealth
SOURCES: Fishery Management Strategy for the Ocean Trap and Line Fishery (2006), NSW Department of Primary Industries. http://www.fisheries.nsw.gov.au/commercial/commercial2/ocean_trap_and_line_fishery Dominion Consulting Pty Ltd (2004). An Assessment of Economic and Social issues in the NSW Ocean Trap and Line Fishery Management Strategy, a report to NSW Fisheries, May 2004, www.fisheries.nsw.gov.au/__data/assets/pdf_file/60583/OTL_EIS_-_Appendix_B3.pdf
Table 8: Catch data for the Ocean trap and Line Fishery Year Effort (days) Landings (tonnes) GVP $m
2001 126084 1142 10.4
2002 99535 1076 10.3
2003 85026 879 8.6
2004 95439 995 8.7
2005 86991 995 9.3
2006 92269 1399 11.7
These catch, effort and value statistics only represent fishing activity outside 3 nm. These values have been estimated using interpolation because NSW DPI does not collect explicit data on whether fishing activity is occurring in State or Commonwealth waters for the Ocean Trap and Line Fishery.
East Marine Region – description of commercial, recreational and charter fishing activities 67
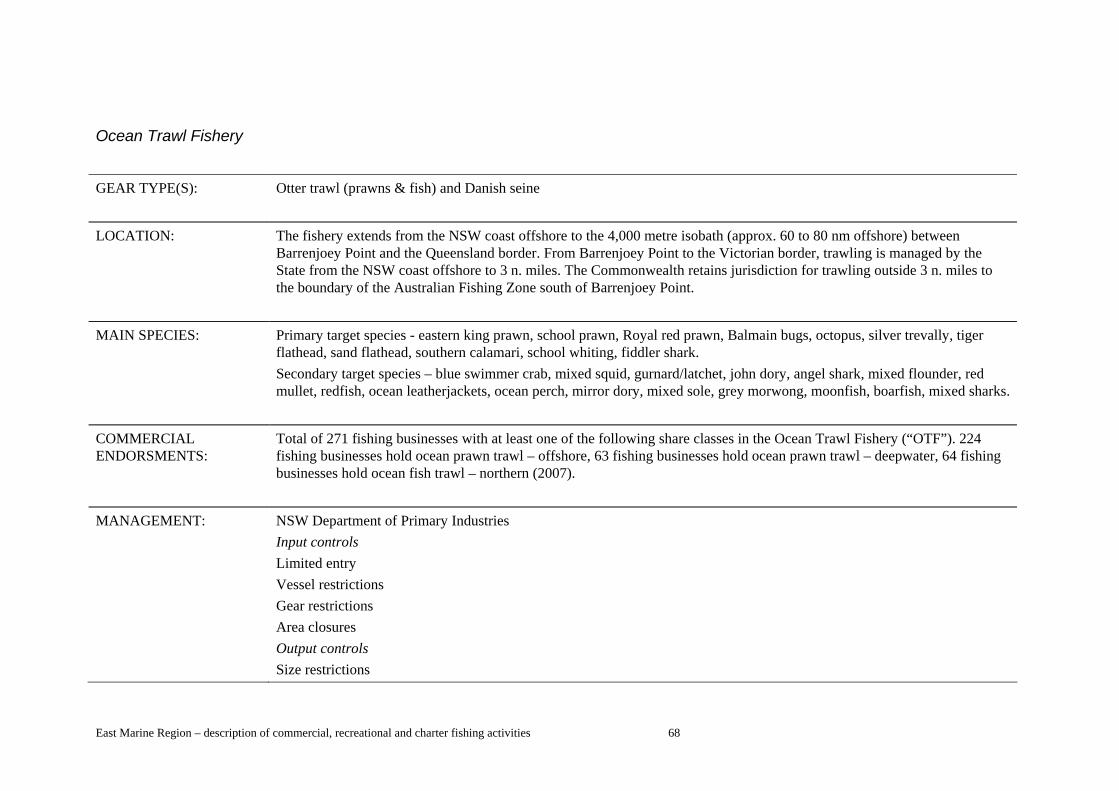
Ocean Trawl Fishery
GEAR TYPE(S): Otter trawl (prawns & fish) and Danish seine
LOCATION: The fishery extends from the NSW coast offshore to the 4,000 metre isobath (approx. 60 to 80 nm offshore) between Barrenjoey Point and the Queensland border. From Barrenjoey Point to the Victorian border, trawling is managed by the State from the NSW coast offshore to 3 n. miles. The Commonwealth retains jurisdiction for trawling outside 3 n. miles to the boundary of the Australian Fishing Zone south of Barrenjoey Point.
MAIN SPECIES: Primary target species - eastern king prawn, school prawn, Royal red prawn, Balmain bugs, octopus, silver trevally, tiger flathead, sand flathead, southern calamari, school whiting, fiddler shark. Secondary target species – blue swimmer crab, mixed squid, gurnard/latchet, john dory, angel shark, mixed flounder, red mullet, redfish, ocean leatherjackets, ocean perch, mirror dory, mixed sole, grey morwong, moonfish, boarfish, mixed sharks.
COMMERCIAL Total of 271 fishing businesses with at least one of the following share classes in the Ocean Trawl Fishery (“OTF”). 224 ENDORSMENTS: fishing businesses hold ocean prawn trawl – offshore, 63 fishing businesses hold ocean prawn trawl – deepwater, 64 fishing
businesses hold ocean fish trawl – northern (2007).
MANAGEMENT: NSW Department of Primary Industries Input controls Limited entry Vessel restrictions Gear restrictions Area closures Output controls Size restrictions
East Marine Region – description of commercial, recreational and charter fishing activities 68

Trip limit
ECONOMIC Analysis of economic performance in the OTF for the 2001–02 financial year by Dominion Consulting (2004) showed that CHARACTERISTICS: profits were low in that year. They calculated a mean net economic return across businesses of 2% to capital. They suggest
that the result was due to the excessive number of boats and effort levels.
CATCH (GVP): 2006 catch: 2102 tonnes ($16.2 m) Within eastern bioregion
STATUS: Of the 12 primary species, 3 are considered growth overfished, 3 fully fished, 3 undefined, 2 uncertain and 1 lightly fished. Of the 16 secondary species 9 are considered undefined, 5 fully fished, 1 growth overfished and 1 moderately fished. *for a more detailed explanation see the Fisheries Management Strategy for the Ocean Trawl Fishery
CATCH DESCRIPTION: The OTF consists of two primary fisheries that operate at different locations within the eastern zone. These are broadly fish trawling and prawn trawling. The ocean prawn trawl fishery primarily targets prawns and bugs off the northern NSW coast, and to a lesser extent deepwater prawns on the continental slope. Incidental catch of various cephalopods and finfish make up an important part of the catch. The ocean fish trawl primarily targets fin fish off the central NSW coast (Newcastle to Sydney). Approximately 50 percent of catch is taken in Commonwealth waters and 50 percent in state waters.
HISTORY OF THE FISHERY:
Fish trawling Trawling for fish off the NSW coast occurred directly after the First World War. The fishery expanded to 17 vessels in 1929 with a catch in excess of 6,500 t. The fishery focussed on targeting tiger flathead on the shelf offshore between Newcastle and Gabo island, with catches exceeding 4,000 during the 1930s. Increases in technology including the use of diesel powered engines and Danish seine nets expanded the fishery through the 1930s and 1940s to approximately 60 seine operators. As a result, flathead stocks were reportedly showing signs of being overfished and the fishery started to land species such as jackass morwong and redfish. To help in the recovery of the flathead stock, minimum mesh sizes were introduced in the 1950s to allow juvenile flathead to escape for future recruitment. However, the stock recovery was slow. The fishery expanded again with the implementation of modern diesel engines that allowed trawlers to extend to the continental shelf and target deepwater species such as gemfish, redfish, mirror dory, ling, ocean perch and various sharks. In
East Marine Region – description of commercial, recreational and charter fishing activities 69

the 1980s there were approximately 130 trawlers working from ports between Crowdy Head and Eden, and a decrease in the Danish fleet to 6 vessels. Landings increased to a combined catch of 12,000 t, with gemfish, redfish, jackass morwong and tiger flathead the primary landings. In 1990 an Offshore Constitutional Settlement (OCS) was entered into with the Commonwealth gave NSW jurisdiction over trawling in depths less than 4000m (approx. 60-80nm off the coast) for water between Barrenjoey Point and the Queensland border. The Commonwealth retained jurisdiction for trawling outside 3nm south of Barrenjoey Point. There has been a considerable decrease in vessel number and landings since the early 1990s. This trend is attributed to the collapse of the eastern gemfish stock and the level of fishing pressure on species such redfish and silver trevally. Prawn trawling Ocean based prawn trawling started in NSW in 1948 off Newcastle. The fishery started as an inshore fishery for school prawns, however the fishery soon expanded offshore targeting eastern king prawns. The major fishing grounds were located off northern NSW large rivers such as the Richmond, Clarence and Macleay. By the late 1950s the fishery had expanded to around 75 vessels, with annual landings of about 900 t, with some additional landings of commercial fish species and discarding of non-target invertebrates. During the expansion of the fishery in the 1960s and 1970s markets developed for these discard species and major landing followed. A fishery developed in the 1970s for deepwater royal red prawns. The fishery continued to expand and by the mid 1980s had reached in excess of 300 vessels operating in NSW ocean waters with catches reaching 800 t of king prawns, 350 t of school prawns and 300 t of royal red prawns. A secondary fishery emerged in the late 1970s with increased landing of school whiting for an export market. Both red spot whiting and stout whiting were no longer discarded, and there was increased targeting of these species. Landings reached 800 to 1,000 t by the late 1980s, declining to around 500 t by the 1990s. Landings increased again in the late 1990s to a peak of 1500 t, then decreased in the late 1990’s, potentially as a result of the introduction of bycatch reduction devices into the fishery (but significant targeted fishing still occurs). The ocean fish and prawn trawl fisheries were first declared as restricted fisheries in 1997. In 2007 a statutory management plan for the Ocean Trawl Fishery (encompassing both sectors) was introduced and the fishery commenced operation as a share management fishery.
FORECAST: Production is expected to remain stable across both fish trawl and prawn trawl sectors in the coming years, with potential for an increase in production of prawns if current weather patterns prevail. It is unlikely the fishery will expand in terms of technology or numbers of vessels. It is possible that target areas will change as a result of changes in stock distribution.
COMMENTS: • Multi species fishery with two primary fisheries being ocean fish trawling and ocean prawn trawling
East Marine Region – description of commercial, recreational and charter fishing activities 70

• Fishery was split through OCS arrangements with the Commonwealth north and south of Barrenjoey Point • Landings decreased with the collapse of the eastern gemfish, but a large number of other species are still caught • The ocean prawn trawl fishery fishes offshore water for eastern king prawns and bugs • The prawn trawl fishery also targets deepwater royal red prawns • A secondary fishery targets school whiting using both prawn and fish trawl gear.
SOURCES: Environmental Impact Statement for the Ocean Trawl Fishery, Chapter B – Review of the existing operation of the fishery (2004), NSW Department of Primary Industries. Fisheries Management Strategy for the Ocean Trawl Fishery (2007), NSW Department of Primary Industries. Dominion Consulting Pty Ltd (2004) An Assessment of Economic and Social issues in the NSW ocean trawl fishery management strategy, a report to NSW Fisheries, May 2004, http://www.fisheries.nsw.gov.au/commercial/commercial2/ocean_trawl_fishery_-_eis
Table 9: Catch data for the Ocean Trawl Fishery (catch adjusted for East Marine Bioregion area) Year Effort (days) Landings (tonnes) GVP $m
2001 14955 2921 26.9
2002 15021 2734 23.5
2003 13961 2646 21.4
2004 13131 2595 18.8
2005 9560 1884 14.1
2006 9705 2102 16.2
These catch, effort and value statistics only represent fishing activity outside 3 nm. These values have been estimated using interpolation because NSW DPI does not collect explicit data on whether fishing activity is occurring in State or Commonwealth waters.
East Marine Region – description of commercial, recreational and charter fishing activities 71

Rock Lobster Fishery
GEAR TYPE(S): Trap/pot and hand collection (SCUBA or hookah prohibited)
LOCATION: The fishery extends along the entire NSW coast offshore to the 4,000m isobath (approx. 80nm) under (OCS) arrangements with the Commonwealth
MAIN SPECIES: Eastern rock lobster (Jasus verreauxi) as well as small amounts of tropical (Panulirus longipes) and (Panulirus ornatus) and southern rock lobster (Jasus edwardsii)
COMMERCIAL ENDORSMENTS:
122 shareholders as of August 2007
MANAGEMENT: NSW Department of Primary Industries Performance indicators and catch trigger points in place Input controls Limited entry Gear restrictions Output controls Size limits Quota Total allowable catch (124 tonnes – 2007/2008)
ECONOMIC CHARACTERISTICS:
Survey data collected by Roy Morgan (2001) for the 1999-2000 financial year revealed that the economic rate of return for the lobster component of the average fishing business was lower than the overall profitability of the whole fishing business: -11% compared to –5% (NSW DPI 2004). Profitability was also lower for fishers with smaller holdings of lobster fishery shares (NSW DPI 2004). Since then, the fishery’s economic performance may have improved. The commercial TAC has been reduced to allow stock rebuilding, and catch per unit effort has increased as a result so that more product is being caught at lower cost. Lobster prices have also increased recently from $41 per kilogram in 2005-06 to $46 per kilogram in 2006-07. Greater than 95%of the commercial TAC was caught in 2004–05 and 2005–06. Average share prices in the fishery also increased between 2005–06 and 2006–07 by 32% (TAC Committee 2007). This would suggest that profits in
East Marine Region – description of commercial, recreational and charter fishing activities 72

the fishery are improving.
CATCH (GVP): 2006 catch: 52.2 tonnes ($2.4m) Within eastern bioregion
STATUS: Fully fished
CATCH DESCRIPTION: The fishery targets Eastern rock lobster (Jasus verreauxi) over a wide range of depths from inshore reefs to the continental slope. There is a small bycatch of other lobster species (Southern rock lobster, Jasus edwardsii; tropical rock lobsters, Panulirus spp.) and other crustaceans and fish species. Lobsters are primarily caught in baited traps, with some hand collection inshore.
HISTORY OF THE FISHERY:
Commercial rock lobster landings were first recorded in 1873 and size limits were first introduced into the fishery in 1902. The 1940s saw motorised vessels enter the fishery, with effort significantly increasing after World War II. Catches are reported to have peaked in 1949 at approximately 400 t. During the mid 1950s it became an offence to land females bearing eggs. During the early 1970s, new lobster grounds were discovered on the edge of the continental shelf (170 – 200m). A ban on the use of compressed air in the capture of lobsters was introduced in the 1980s. A rapid decline in the landings occurred after a peak in the early 1980s and soon after the number of vessels operating in the fishery was frozen. Major management changes in 1993 and 1994 included the declaration of a restricted fishery, introduction of a TAC/individual transferable quota (ITQ) system; individually numbered management tags, a maximum legal length for lobsters and a daily logbook for the commercial fishery. In 2000 a statutory management plan for the fishery was introduced and the fishery commenced operation as a share management fishery.
FORECAST: Following positive signs from monitoring programs in recent years, the TACC for 2007-08 was increased to 124 t from 112t in 2006-07 and 102t in 2005-06. This represents a distribution of some of the benefits of improved stock status to fishers immediately whilst also meeting the imperative for continued rebuilding of stock. Under the current TACC, model-based projections indicate the likelihood of further increases in stock biomass. Future increases in TACC will be contingent upon further evidence of improvement of stock status. It is likely that the number of shareholders will reduce with further restructuring in the fishery.
COMMENTS: • Fishery is a single target operation with little bycatch • Predominant fishing method are baited traps, with a small amount of hand collection • Fishery is limited entry and has a quota system with trigger points
East Marine Region – description of commercial, recreational and charter fishing activities 73

SOURCES: Environmental Impact Statement for the Rock Lobster Fishery, Chapter B – Review of the existing operation of the fishery (2004), NSW Department of Primary Industries. Fisheries Management Strategy for the Rock Lobster Fishery (2007), NSW Department of Primary Industries. Department of the Environment and Heritage (2006) Assessment of the NSW Lobster Share Management Fishery. DEH, Canberra, www.environment.gov.au/coasts/fisheries/nsw/lobster/pubs/nsw-lobster-assessment.pdfNew South Wales Department of Primary Industries (2004) Lobster Fishery: Environmental Impact Statement – Publicconsultation document, New South Wales Department of Primary Industries, Primary Industries Agriculture and Fisheries Division, www.fisheries.nsw.gov.au/commercial/commercial2/lobster_fishery_-_eis
Roy Morgan (2001). Economic Survey Results, Unpublished Research, Roy Morgan Research, Sydney. TAC Committee (2007 Total Allowable Catch Committee – Report and Determination for 2007/08: Rock Lobster Fisherywww.fisheries.nsw.gov.au/__data/assets/pdf_file/30247/TAC-Lobster-Fishery-Report-0708.pdf
Table 10: Catch data for the Rock Lobster Fishery (catch adjusted for East Marine Bioregion area) Year Effort (days) Effort (Trap lifts) Landings (tonnes) GVP $m
2001 875 10155 41.6 1.9
2002 802 10328 41.6 2.9
2003 860 10395 61.4 2.5
2004 921 12433 48.2 1.8
2005 763 8929 48.9 1.8
2006 650 6906 52.2 2.4
These catch, effort and value statistics only represent fishing activity outside 3 nm. These values have been estimated using interpolation because NSW DPI does not collect explicit data on whether fishing activity is occurring in State or Commonwealth waters.
East Marine Region – description of commercial, recreational and charter fishing activities 74

Socio-economic profile Due to the nature of the available data it is difficult to determine precise locations for the home and landed ports for NSW. For NSW fisheries, home ports for this part of the profile are identified according to the Fisheries Districts used by NSW Department of Primary Industries (DPI). Landed ports are identified using a combination of available catch data (provided by NSW DPI) and numbers of fishing businesses from NSW DPI. For the purposes of this profile, key landed ports were defined as those with 16 or more fishers or fishing businesses. Summary of key ports The key home ports identified for NSW fisheries include those in the Tweed fisheries district (e.g. Tweed Heads and Chinderah), the Richmond district (e.g. Evans Head and Ballina), and the Clarence district (e.g. Maclean), Coffs Harbour district (e.g. Coffs Harbour and Woolgoolga), Hastings district (e.g. Port Macquarie), Manning district (e.g. Harrington), Wallis Lake district (e.g. Bungwahl), Port Stephens district (e.g. Port Stephens, Nelson Bay), Hunter district (e.g. Swansea), Central NSW Coast (e.g. Woy Woy), greater Sydney, Illawarra district (e.g. Kiama), the Batemans Bay district (e.g. Ulladulla), and the Far South Coast district (e.g. Montague) (NSW DPI 2004a, 2004b). Using available data, it appears that the key landed ports in NSW fisheries are likely to include the Richmond fisheries district (e.g. Evans Head and Ballina), the Clarence fisheries district (e.g. Maclean), the Coffs Harbour district (e.g. Woolgoolga, Coffs Harbour), Hastings district (e.g. Port Macquarie), the Wallis Lake district (e.g. Bungwahl), the Port Stephens district (e.g. Port Stephens, Nelson Bay), the Hunter district (e.g. Port Macquarie), the North and South Sydney fisheries districts, the Illawarra district (e.g. Wollongong), the port of Ulladulla and the Batemans Bay district (NSW DPI 2006 catch data), the Montague district and the port of Bermagui (NSW DPI 2006 catch data; NSW DPI 2004a; NSW DPI 2004b; NSW DPI 2006). Summary of fishing sector employment Employment in fishing in NSW for the main SLAs was presented in Table 1, which indicates that fishing accounts for between 0.1 and 2.3% of total employment (ABS 2001 Census data). Data from 2003 indicates that there were around 1900 fishers in NSW (Dominion Consulting 2004 in NSW DPI 2006), but more reliable figures are likely to be available once the 2006 Census data becomes available. Other employment data for individual fisheries is presented below. Summary of regional dependence on fishing Using available data from the Yellow Pages Online Directory, the number of businesses directly associated with some of the key ports in NSW fisheries are presented in Table 5. All of the key ports identified for the NSW Fisheries in Table 11 have a high level of business activity associated with fishing.
Table 11: Number of fishing related businesses sourced from the Yellow Pages Online Directory 2006-2007 for the key ports identified in NSW Fisheries Port Number of Fishing Related Businesses
Coffs Harbour NSW 28
Greater Sydney NSW 666
Ulladulla NSW 20
Bermagui NSW 28
Port Stephens NSW 84
Note: Fishing related businesses are those operating within all fisheries, not those specific to NSW Fisheries only
Further data specific to the Rock Lobster, Ocean Trawl and Ocean Trap and Line fisheries are presented in the following section.
East Marine Region – description of commercial, recreational and charter fishing activities 75

Rock Lobster � It is difficult to determine home from landed ports for this fishery. Based on 2001/2002 data,
the key home/landed ports for the Lobster Fishery are all within NSW and include those in the Manning district (e.g. Harrington), the Port Stephens district (e.g. Nelson Bay), the Illawarra district (e.g. Wollongong) and the Batemans Bay district (e.g. Batemans Bay, Ulladulla) (NSW DPI Fish Catch Records 2003 in NSW DPI 2004a).
� Using catch data, it appears that the key landed ports are likely to be in the Batemans Bay fisheries district (e.g. Batemans Bay, Ulladulla), the Illawarra district (e.g. Wollongong), the North and South Sydney fisheries districts, the Port Stephens district (e.g. Nelson Bay) , and the Hastings district (e.g. Port Macquarie) (NSW DPI 2006 catch data).
� In 2004 it was estimated that there were 161 fishing businesses in NSW with shareholdings in the Lobster Fishery (NSW DPI 2004a). Results of a Roy Morgan Survey conducted in 2001 show that there were approximately 330 people directly employed in this fishery (including full-time, part-time and casual workers (NSW DPI 2004a). It is reported that for every job in the Lobster Fishery, another 0.5 jobs are created in the broader community, implying that another 490 people have jobs associated with Lobster fishing (NSW DPI 2004a).
� Table 12 contains data on regional distribution of income from lobster fishing for some of the main ports identified for this fishery. The Batemans Bay fisheries district appears to have the highest dependence on lobster fishing. However, NSW DPI catch records indicate that the Sydney South fisheries district has the highest dependence on lobster fishing with an average 85% of fishers’ incomes derived from lobster (NSW DPI 2004a).
Table 12: Percent of fishers’ income derived from lobster fishing in NSW for some of the key fisheries districts (NSW DPI fish catch records in NSW DPI 2004a) Fisheries District Potential Ports Average % Income
Lobster Fishing
Manning Harrington 34
Port Stephens Port Stephens, 63 Nelson Bay
Illawarra Wollongong 69
Batemans Bay Ulladulla 71
Source: NSW DPI, 2004
Ocean Trawl • Key home ports for the Ocean Trawl Fishery include those in the Richmond district (e.g. Evans
Head and Ballina), and the Clarence district (e.g. Maclean), Coffs Harbour district (e.g. Coffs Harbour and Woolgoolga), Hastings district (e.g. Port Macquarie), Wallis Lake district (e.g. Forster/Tuncurry), Port Stephens district (e.g. Port Stephens, Nelson), Hunter district (e.g. Swansea), the Sydney district, Batemans Bay district (e.g. Ulladulla), the Montague district (e.g. Narooma), and the Far South Coast district (Dominion Consulting, 2004 in NSW 2004b).
• Using catch data, it appears that the key landed ports are likely to be in the Richmond fisheries district (e.g. Evans Head and Ballina), the Clarence fisheries district (e.g. Maclean), the Coffs Harbour district (e.g. Woolgoolga, Coffs Harbour), the North and South Sydney fisheries districts, the Illawarra district (e.g. Wollongong), the Hastings district (e.g. Port Macquarie), the Port Stephens district (e.g. Nelson Bay), and the Manning district (e.g. Harrington) (NSW DPI 2006 catch data).
� According to data from 2004, there are approximately 800 to 13,00 people employed in the Ocean Trawl Fishery (Dominion Consulting 2004 in NSW DPI 2004b).
� Table 13 shows the number of fishers in the Ocean Trawl Fishery for each of the key home ports, plus the percentage of fishers employed in this fishery as a percentage of the total labour force. The Clarence and Far South Coast fisheries districts appear to be the most dependent on Ocean Trawl fishing as a source of income (Table 13).
East Marine Region – description of commercial, recreational and charter fishing activities 76

Table 13: Number of fishers in the Ocean Trawl fishery in NSW for some of the key fisheries districts and the percentage employed in this fishery as a total percentage of the labour force (based on fishers’ home district post codes) Fisheries District Potential Home Number of fishers in Employed in OTF as
Ports Ocean Trawl Fishery % of labour force
Richmond Evans Head 39 0.46
Clarence Maclean 127 1.53
Coffs Harbour Coffs Harbour 42 0.10
Hastings Port Macquarie 22 0.15
Wallis Lake Forster/Tuncurry 17 0.17
Port Stephens Port Stephens, 26 0.17 Nelson Bay
Hunter Wollongong 26 0.06
Sydney Sydney 50 0.0
Batemans Bay Ulladulla 76 0.18
Montague Narooma 17 0.23
Far South Coast Merimbula? 36 1.01
Total 478 4.06
Source: ABS 2001 data in NSW DPI 2004b
Ocean Trap and Line � The key home ports for the Ocean Trap and Line Fishery include those in the Tweed fishing
district (e.g. Tweed Heads and Chinderah), the Richmond district (e.g. Evans Head and Ballina), and the Clarence district (e.g. Maclean), Coffs Harbour district (e.g. Coffs Harbour and Woolgoolga), Hastings district (e.g. Port Macquarie), Manning district (e.g. Taree), Wallis Lake district (e.g. Bungwahl), Port Stephens district (e.g. Port Stephens, Nelson Bay), Hunter district (e.g. Swansea), Central NSW Coast (e.g. Woy Woy), Sydney, Illawarra district (e.g. Kiama), the Batemans Bay district (e.g. Ulladulla), the Far South Coast district (e.g. Montague), and Bermagui (Dominion Consulting, 2004 in NSW DPI 2006).
� Using catch data, it appears that the key landed ports for the Ocean Trap and Line Fishery include those in the Tweed fishing district (e.g. Tweed Heads and Chinderah), the Richmond district (e.g. Evans Head and Ballina), and the Clarence district (e.g. Maclean), Coffs Harbour district (e.g. Coffs Harbour and Woolgoolga), Hastings district (e.g. Port Macquarie), Manning district (e.g. Taree), the Wallis Lake district (e.g. Bungwahl), the Port Stephens district (e.g. Port Stephens, Nelson Bay), the North and South Sydney fisheries districts, the Illawarra district (e.g. Wollongong), the Shoalhaven district (e.g. Greenwell Point), and the Batemans Bay district (e.g. Batemans Bay, Ulladulla) (NSW DPI 2006 catch data).
� It is estimated that there were between 991 and 1925 fishers employed in the Ocean Trap and Line Fishery in 2004, while indirect employment in the fishery was estimated to be between 364 and 1130 (Dominion Consulting 2004 in NSW DPI 2006).
� Table 14 shows the number of fishers in the Ocean Trap and Line Fishery for each of the key home ports, plus the percentage of fishers employed in this fishery as a percentage of the total labour force. The Clarence, Montague and Far South Coast fisheries districts appear to be the most dependent on the Ocean Trap and Line fishery as a source of employment (Table 14).
East Marine Region – description of commercial, recreational and charter fishing activities 77

Table 14: Number of fishers in the Ocean Trap and Line Fishery in NSW for some of the key fisheries districts and the percentage employed in this fishery as a total percentage of the labour force (based on fishers’ home district post codes)
Fisheries District Potential Home Ports
Number of fishers in Ocean Trap and Line
Employed in OTL as % of labour force
Fishery
Tweed Chinderah 28 0.20
Richmond Evans Head 30 0.30
Clarence Maclean 73 1.00
Coffs Harbour Coffs Harbour 70 0.50
Hastings Port Macquarie 41 0.30
Manning Taree 31 0.30
Wallis Lake Forster/Tuncurry 35 0.90
Port Stephens Port Stephens, Nelson Bay
21 0.20
Hunter Wollongong 18 0.10
Central Coast Woy Woy 36 0.00
Sydney Sydney 33 0.00
Illawarra Narooma 16 0.10
Shoalhaven Greenwell Point 35 0.30
Batemans Bay Ulladulla 47 0.40
Montague Narooma 37 1.1
Far South Coast Merimbula? 21 0.90
Total 572 6.6
Source: ABS 2001 data in NSW DPI 2006
East Marine Region – description of commercial, recreational and charter fishing activities 78

Queensland Fisheries
Introduction The Queensland fisheries that occur partly or wholly within the EMR include: � Trawl fisheries:
o Scallops o Prawns o Stout whiting
� Net Fishery (East Coast Inshore Finfish Fishery) � Line Fishery � Crab Fisheries
o Blue Swimmer Crab Fishery o Spanner Crab Fishery
For the purposes of this review, data for some of these fisheries may have been combined, particularly where only a small portion of the fishery occurs within the EMR. Where possible, data has been collated and mapped on catch, effort and Gross Value of Production (GVP) for the component of individual fisheries that occurs within the EMR. As fisheries data is not currently recorded against bioregional areas, much of the data is estimates based around spatial information provided with catch returns. Data for the fishery as a whole should always be referred to when making assessments of the fishery (production, value), the data presented here has been generated specifically to attempt to illustrate fishing activity in the EMR. Again, in some cases because there is only limited effort for an individual fishery within the EMR data confidentiality issues mean it has not been possible to provide detailed analysis and presentations of data. The profiles below provide a brief synopsis of each fishery, and where possible an analysis of catch data for the period 2002 -2006. Key information sources are provided at the end of each profile for those seeking further information on individual fisheries. Queensland commercial fisheries operate in State waters, within the Great Barrier Reef (GBR) management area and in Commonwealth waters that intersect with the proposed EMR. While the profiles that follow provide a description of operations and management throughout the entire fishery, an effort has been made to identify only that component of catch taken from the EMR as required. State fishery catch data is not normally split in this manner so the data represent estimates calculated from available data. To get a complete picture of volume and value of catches it is necessary to review the annual fisheries status reports for individual fisheries prepared by the Queensland Department of Primary Industries and Fisheries. The information relating to the entire fishery would be of most value in determining social and economic valuations and reliance of regional centres on the fishing industry.
East Marine Region – description of commercial, recreational and charter fishing activities 79

Figure 13 - Queensland Fisheries in the EMR
East Marine Region – description of commercial, recreational and charter fishing activities 80

Fishery profiles
East Coast Otter Trawl Fishery (ECOTF)
*please note this information is based on areas outside state waters (3nm) and outside the GBR management area
GEAR TYPE(S): Otter Trawl and Beam Trawl
LOCATION: The ECOTF is Queensland’s largest commercial fishery, extending from the tip of Cape York to the Queensland/New South Wales (NSW) border. The majority of the fishery occurs in Commonwealth waters; however, the entire fishery is managed by Queensland under an Offshore Constitutional Settlement (OCS) agreement between the Australian Government and the Government of Queensland. Most of the catch for this fishery comes from the Great Barrier Reef area which is not included in the East Marine Bioregion.
MAIN SPECIES: The principal species harvested in the northern areas of the East Coast Otter Trawl Fishery are tiger prawns (Penaeus esculentus, P. semisulcatus and P. monodon), Endeavour prawns (Metapenaeus endeavouri and M. ensis), red spot king prawns (Penaeus longistylus), banana prawns (Penaeus merguiensis). In the southern section of the East Coast Otter Trawl Fishery, the harvest is mostly eastern king prawns (Penaeus plebejus ), banana prawns and scallops (Amusium japonicum balloti). The Moreton Bay Otter Trawl Fishery harvests mostly Bay prawns (Metapenaeus bennettae and M. macleayi), banana prawns, eastern king prawns and tiger prawns (P. esculentus). Squid and Moreton Bay bugs are also considered to be principal species although not taken in as large quantities and are caught throughout the fishery.
COMMERCIAL Otter trawl licences: 499 in 2007 (38 restricted Moreton Bay only – 90 able to access Moreton Bay). Beam trawl licences: 152 ENDORSMENTS: in 2007
MANAGEMENT: The fishery is managed by a range of input (effort) and output (harvest) controls. • Limited entry, Quota management, Effort cap • Trade and surrender: effort trading and surrender provisions in the Trawl Plan have reduced effort annually by between 1% and 2% from 2000 to 2005. These provisions were removed in July 2006. • Gear restrictions, Seasonal closures. • Mandatory use of turtle exclusion devices (TEDs) and bycatch reduction devices (BRDs). • A range of byproduct harvesting protection arrangements
East Marine Region – description of commercial, recreational and charter fishing activities 81

• Logbooks, surveillance by fisheries enforcement officers and remote tracking of otter trawl vessel movements.
ECONOMIC Effort latency has been an issue. There were a total of 501 authorities in the fishery and 443 boats in operation in 2005. CHARACTERISTICS: However, 114 of these authorities have since been purchased by the Department of Environment and Heritage as part of the
Great Barrier Reef Marine Park Structural Adjustment Scheme. If latent effort remains in the fishery, any positive net returns in the fishery could be quickly dissipated.
CATCH (GVP): 2006 catch: 2185t ($32 M) combined weight/value with East Coast Stout Whiting Fishery Within east bioregion Stout whiting fishery in 2005 1,130t $2.5 million
*please note that catch for the East Coast Otter Trawl Fishery and East Coast Stout Whiting Trawl Fishery are combined
STATUS: Tiger and endeavour prawn stocks in north Queensland are regarded as ‘fully exploited’ with stocks of eastern king, tiger and endeavour prawns considered close to the maximum sustainable yield. There are also concerns about the level of bycatch and the impact of trawling on the seabed. Stock assessment of east coast banana prawns (Penaeus merguiensis) showed that the current exploitable biomass levels were approximately 50–70% of virgin biomass.
CATCH DESCRIPTION:
The Queensland East Coast Trawl Fishery (ECTF) comprises the East Coast Otter Trawl Fishery (ECOTF), the Moreton BayTrawl Fishery and the River and Inshore Beam Trawl Fishery (RIBTF). Target species of these fisheries include prawns, scallops, bugs and squid. Various byproduct species are also retained by the fleet. The ECTF is the largest fishery in Queensland, both in terms of the volume of product caught and economic value of the product. The Queensland Fisheries (East Coast Trawl) Management Plan 1999 (the Trawl Plan) was introduced in 1999. During the transition period for management arrangements, significant changes occurred to fishing operations.
HISTORY OF THE FISHERY:
The number of vessels in the trawl fleet has declined from about 1400 licensed operators in the early 1980s to 520 in May 2004. The introduction of a Management Plan for the East Coast Trawl Fishery in 1999, and in particular, the revision of this plan in 2000, had a significant impact on the reduction of effort in the fishery. Through a Commonwealth and Queensland Government jointly funded structural adjustment scheme and a voluntary surrender of effort units by industry, more than 15% of effort was removed from the fishery in early 2001. These reductions in effort have assisted greatly in pursuing the sustainable management of the fishery.
FORECAST: The fishery is unlikely to expand into new species due to legislative controls. Fishery area is unlikely to expand as the fishery area is defined in legislation and Marine Park closures apply to a large amount of the fishery area.
COMMENTS: • About 70% of the fishery operates within the Great Barrier Reef Marine Park. Therefore, therefore the fishery comes under the jurisdiction of the Great Barrier Reef Marine Park Authority (GBRMPA).
East Marine Region – description of commercial, recreational and charter fishing activities 82

• Most wild caught prawns are exported to Asian markets. • The United States (US) stopped importing prawns from countries that did not use Turtle Excluder Devices (TEDs) in 1996.
TEDs are now compulsory on all trawlers in Queensland. In 2004, the US market re-opened to Australian wild-caught prawns however this exemption expired in early 2006 pending introduction of improved definitions of TEDs in legislation, still to be implemented.
SOURCES: Queensland Government. Department of Primary Industries and Fisheries Web Page. http://www2.dpi.qld.gov.au/fishweb/12545.html#4 CRC Reef Research Centre. Current State of Knowledge, May 2005. Queensland’s East Coast Trawl Fishery. http://www.reef.crc.org.au/research/fishing_fisheries/statusfisheries/statustrawl.htm Queensland Government. Department of Primary Industries and Fisheries. Annual Status Report. East Coast Trawl Fishery,October 2006. Australian Government, Department of the Environment and Water Resources. Assessment of the Queensland East Coast Otter Trawl Fishery
Table 15: Annual reported catch (tonnes) of principal fish species (otter trawl) Combined all trawl (catch adjusted for East Marine Bioregion area) Year Effort (days) Landings (tonnes) GVP $m
2001 33304 2162 31.0
2002 27196 1769 24.3
2003 31502 1709 28.2
2004 37674 2390 34.1
2005 34096 2244 31.3
2006 31916 2185 32.0
East Marine Region – description of commercial, recreational and charter fishing activities 83

East Coast Stout Whiting Fishery
*please note this information is based on areas outside state waters (3nm) and outside the GBR management area
GEAR TYPE(S): Demersal otter trawl. One operator trialling the use of Danish Seine in 2007 under permit
LOCATION: The fishery area, known as the T4 fishery region. It is defined in legislation as the area between the 20 and 50 fathom (36 and 90 m) depth contours. It operates from Sandy Cape (24°42’ S, 153°15’ E) to Caloundra (26°40’ S, 153°8’ E).
MAIN SPECIES: The principal species harvested is stout whiting (Sillago robusta)
COMMERCIAL Five licenses in the fishery (2006). ENDORSMENTS:
MANAGEMENT: The fishery uses otter trawl methods, where single multi- filament nets pass over the seabed to harvest stout whiting. The total net length (combined head rope and foot rope) is restricted to 88 m, sweep length is restricted to a maximum of 128 m each and mesh size is regulated with a minimum of 38 mm and a maximum of 60 mm. The input and output controls are a combination of voluntary agreements, permits and legislation. Controls in the fishery include: • limited entry to the fishery with a maximum of five licence holders • vessel and gear restrictions • an annually reviewed voluntary commercial total allowable catch (TAC) based on a regular stock assessment • a combination of mandatory and voluntary seasonal closures • a restricted fishery area • in-possession limits on byproduct species • prevention of interactions with endangered species through the enforcement of closed waters and the introduction of mandatory use of turtle exclusion devices (TEDs). Licence holders in the FTF contribute significantly to the management of the fishery through voluntary closures, provision of biological samples for assessment purposes and compliance with the voluntary commercial TAC.
ECONOMIC No information exists regarding the profitability of this fishery. All licences in the fishery are active, suggesting that net returns
East Marine Region – description of commercial, recreational and charter fishing activities 84

CHARACTERISTICS: are probably positive.
CATCH (GVP): Within east bioregion
2006 catch: 2185t ($32 M) combined weight/value with East Coast Otter Fishery 1,130t $2.5 million (2005) *please note that catch for the East Coast Otter Trawl Fishery and East Coast Stout Whiting Trawl Fishery are combined
STATUS: The stock assessment indicates that the biomass of stout whiting is above the level which supports maximum sustainable yield (MSY). The commercial TAC is precautionary to allow for uncertainty in ECOTF discards. An annual review of the commercial TAC for the target species is undertaken. This process ensures that the harvest rate remains sustainable and allows the stock to remain at a level above MSY.
CATCH DESCRIPTION:
The stout whiting fishery has a variable depending on market prices and volume caught. Production from overseas fisheries can cause gluts in the supply of stout whiting to the market, causing highly variable prices. Stocks are principally exported to Japan, Taiwan, Thailand, China and Vietnam. Some of this product makes it back to Australia in a processed form.
HISTORY OF THE FISHERY:
The fishery began in 1981 with one operator targeting red spot whiting. The fishery progressively began targeting stout whiting as new commercially viable grounds were identified. The fishery underwent rapid expansion between 1989 and 1990, with 10 boats landing a catch of 1789 tonnes of stout whiting in 1990. The fishery was restructured in 1991 to a limited entry of 5 operators. The licensing structure was further refined with the introduction of the Fisheries Act 1994, which defined a specific finfish endorsement (T4) for the stout whiting trawl fishery and a management area for operation.
FORECAST: The fishery is unlikely to change target species or increase the area fished as this is defined in legislation.
COMMENTS: • Stout whiting are not known to take baited hooks and are generally not large enough to be targeted by recreational or Indigenous fishers. As a result, harvest by recreational, charter and Indigenous sectors is considered negligible.
• Permitted fish catch limits are reviewed annually and set at the start of each season. • Stout whiting forms a substantial portion of the bycatch taken in the ECOTF. An estimated 1705 t of stout whiting was
discarded in the ECOTF in 2005. SOURCES: Queensland Government. Department of Primary Industries and Fisheries. Annual Status Report 2006. Finfish (Stout Whiting)
Trawl Fishery, July 2006. Australian Government, Department of the Environment and Water Resources. Assessment of the Queensland Finfish (Stout Whiting) Trawl Fishery Queensland Government. Department of Primary Industries and Fisheries Web Page. http://www2.dpi.qld.gov.au/fishweb/12545.html#4
East Marine Region – description of commercial, recreational and charter fishing activities 85

Table 16: catch data for East Coast Stout Whiting Fishery (catch adjusted for East Marine Bioregion area) Year Effort (days) Landings (tonnes) GVP $m
2001 33304 2162 31.0
2002 27196 1769 24.3
2003 31502 1709 28.2
2004 37674 2390 34.1
2005 34096 2244 31.3
2006 31916 2185 32.0
Combined with East Coast Otter Trawl Fishery
East Marine Region – description of commercial, recreational and charter fishing activities 86

East Coast Inshore Fin Fish Fishery (ECIFF)
*please note this information is based on areas outside state waters (3nm) and outside the GBR management area
GEAR TYPE(S): A variety of net methods and hook and line
LOCATION: The ECIFF area includes all tidal waters along Queensland’s east coast eastward of 142˚09' E, near Crab Island (approximately 11˚ S), to the Queensland–New South Wales border (approximately 153˚34' E, 28˚10' S).
MAIN SPECIES: Northern Inshore Fishery Barramundi (Lates calcarifer), king threadfin (Polydactylus sheridani), blue threadfin (Eleutheronema tetradactylum), king salmon (Polydactylus macrochir), bream (Acanthopagrus australis and A berda), grey mackerel (Scomberomorus semifasciatus), swallow tailed dart (Trachinotus botla), queenfish (Scomberoides commersonnianus), spotted grunter (Pomadasys kaakan), garfish (Hemihamphus quoyi), sea mullet (Mugil cephalus), tailor (Pomatomus saltatrix), mangrove jack (Lutjanus agentimaculatus), jewelfish (Nibea squamosa), black jew (Protonibea (Johnius) diacanthus), spotted mackerel (Scomberomorus munroi), sand whiting (Sillago spp), rabbitfish (Siganidae), flathead (Platycephalus spp), pilchards, black tip whaler (Carcharhinus tilstoni) and sorrah whaler (C. sorrah).
COMMERCIAL There were 499 net fishery and 1649 line fishery licenses (at 30 June 2005). ENDORSMENTS:
MANAGEMENT: The ECIFF fishery is the largest and one of the most complex fisheries in Queensland. A range of input and output controls are used to manage the ECIFF fishery including: • limits on the type of nets that can be used, the way a net can be used, their length and mesh size • minimum legal size limits for many species and maximum size limits for some • competitive commercial Total Allowable Catch for tailor and spotted mackerel • commercial possession limits for spotted mackerel • recreational bag limits for popular angling species and • permanent, temporal and seasonal closures.
ECONOMIC Effort latency is an issue in the line sector of this fishery. At June 2005, 1649 fishery symbols were on issue while only 367 CHARACTERISTICS: boats operated in the sector in that calendar year. In contrast, the net sector has recently undergone a 40% reduction in fishery
East Marine Region – description of commercial, recreational and charter fishing activities 87

symbols following the implementation of a policy to reduce excess capacity in Queensland’s net fisheries. At June 2005, 499 symbols were on issue in the net sector while 452 boats operated in the same calendar year.
CATCH (GVP): Approximately $23 million in 2005 Within east bioregion
The GVP has fluctuated between $20 million to $30 million since 1990. A decrease in GVP for 2005 from closer to $30 million in 2004 down to approximately $23 million is thought to be a result of the closure of inshore waters to fishing as part of the rezoning of the Great Barrier Reef Marine Park (GBRMP) in July 2004 and the subsequent removal of 59 active net fishing licences under the associated structural adjustment package.
STATUS: The Queensland and New South Wales sea mullet (Mugil cephalus) stock assessments have shown the stock has been heavily exploited since the fishery’s start more than 100 years ago. Recruitment is highly variable and appeared to have dropped in 1993 and has not yet fully recovered, despite reasonably constant catch rates. Current biomass could not be estimated with any certainty but was considered likely to be less than 60% of unfished levels. Stock assessments conducted for Queensland and New South Wales tailor stocks performed in 2004 suggest that the population is heavily exploited with both exploitable biomass and egg production having declined an estimated 50% from 1970s levels. The assessment found no evidence that fishing at current levels had affected recruitment. Long term monitoring programs (LTMP) are in place for a number of species in this fishery. These include barramundi, tailor, mullet and spotted mackerel. These surveys provide valuable information on age, size frequency and reproduction. This data in combination with commercial logbook and recreational diary data supports/or will support stock assessments. Concerns have been voiced over the sustainability of current harvest levels of some shark species given the longevity and low reproductive output of some species. Some of this concern is starting to be addressed through information gathered through the fishery observer program and other research. Measures to manage the sustainable harvest of shark and ray species is being considered as part of the development of the management plan.
CATCH The ECIFF is a multi-species fishery with commercial, recreational and traditional fishers targeting a range of finfish species. DESCRIPTION: Gear permitted in the commercial fishery includes mesh, haul (seine), tunnel and cast nets as well as hook and line.
Commercial fishers preferentially utilise equipment that will select fish size and species to meet market demand. Gear used by the recreational sector includes cast, small seine (bait) nets, and hook and line. Indigenous fishers use traditional subsistence fishing methods that include the use of spears, stone fish traps and nets.
HISTORY OF THE The Queensland East Coast Inshore Fin Fish Fishery is Queensland’s oldest fishery. The first European settlement FISHERY: in Queensland was established at Redcliffe, Moreton Bay in 1824. The community relied on fin fish and
crustaceans for its survival.
East Marine Region – description of commercial, recreational and charter fishing activities 88

Fishing for custom and trade has also been an integral element of the history and culture of the Indigenous people of Queensland. Commercial net fishing began in a significant way in Moreton Bay in the 1850’s, and quickly expanded north as coastal population centres developed. Recreational fishing has always been an important part of the Queensland cultural and continues to be popular along the entire coastline.
EXPANSION OF THE FISHERY:
The inshore finfish fishery will continue to be managed under the principles of ESD. Consequently, consideration will be given to economic expansion in fisheries so long as they are within the bounds of biological sustainability and fair access.
The closure of some inshore waters as part of the rezoning of the GBRMP in July 2004 and the associated buyout of 59 active net fishing licences under the structural adjustment package is likely to have impacted the catch and effort figures for 2005. Shark and spotted mackerel catches over recent years resulted in the issue of a number of investment warnings in 2002 and 2003, advising against any further expansion of fishing effort targeted at sharks.
COMMENTS: Bycatch in the ECIFF net fishery has been shown to be low when compared to the retained component of the catch, indicating the gear and methods used in net fishing are relatively selective for target species. Bycatch, as a percentage of the total number of fish caught, was less than 20% for netting operations targeting most species, with the exception of sand whiting. In this case, bycatch accounted for 28% of the total catch (by number). Turtles were the most frequently reported interaction with a protected species according to logbook and observer data analysis. Other protected species interactions included sea snakes, cormorants, sawfish and a grey nurse shark.
SOURCES: Queensland Government. Department of Primary Industries and Fisheries. Annual Status Report. East Coast Inshore Fin Fish Fishery, November 2006. http://www2.dpi.qld.gov.au/extra/pdf/fishweb/StatusReport_EastCoastInshoreFinfish.pdf Australian Government, Department of the Environment and Water Resources. Assessment of the Queensland East Coast Inshore Fin Fish Fishery. http://www.environment.gov.au/coasts/fisheries/qld/east-coast-finfish/pubs/east-coast-finfish-assessment.pdf
CRC Reef Research Centre. Current State of Knowledge, May 2005. Queensland’s East Coast Trawl Fishery. http://www.reef.crc.org.au/research/fishing_fisheries/statusfisheries/statustrawl.htm
East Marine Region – description of commercial, recreational and charter fishing activities 89

Line Fishery This profile contains information for the Deepwater finfish (DWFF), Rock Reef finfish (RRFF), Coral Reef finfish (CRFF) and East coast Spanish Mackerel (ECSMF) Fisheries.
*please note this information is based on areas outside state waters (3nm) and outside the GBR management area
GEAR TYPE(S): DWFF - multi-hook apparatus on trotline or dropline. A maximum of six vertically set droplines, with not more than 50 hooks on each, can be used at one time. Alternatively, operators can use up to three bottom set trotlines, with no more than a total of 300 hooks RRFF / CRFF – hook and line – up to 6 hooks ECSMF - line-only fishery - maximum of three lines and up to six hooks (commercial and recreational)
LOCATION: DWFF – can operate in all waters off the Queensland coast deeper than 200 m. RRFF – primary catch from area south of GBR ECSMF – all Qld waters (actual endorsement defines zones) CRFF – Bundaberg north to Torres Strait.
MAIN SPECIES: DWFF - the main target species tend to be flame snapper (, ruby snapper, cods, and jobfish RRFF – primary: snapper, pearl perch; secondary: teraglin jew, Samson fish, dolphin fish, yellowtail kingfish, black kingfish, amberjack CRFF – coral trout (Plectropomus spp), red throat emperor (Lethrinus miniatus), spanish mackerel (Scomberomorus commerson), red emperor (Lutjanus sebae), tropical snappers (Lutjanus spp), jobfish (Pristipomoides spp.), nannygai (Lutjanus malabaracus & L.erythropterus) ECSMF – spanish mackerel,
COMMERCIAL ENDORSMENTS:
DWFF—7 – 6 operating in 2005 RRFF—1536 ECSMF—297 – 154 boats operating in 2005–06 CRFF—373 primary vessels + 718 endorsed tenders (dories) & 411 charter boats in 2005–06
MANAGEMENT: QLD DPI Fisheries
East Marine Region – description of commercial, recreational and charter fishing activities 90

DWFF—Commercial fishery only RRFF – commercial, recreational and charter ECSMF – commercial, recreational and charter CRFF – commercial, recreational and charter Performance measurement systems including by-catch and by-product risk assessment processes being developed for all fisheries. Input controls
Limited entry Gear restrictions Boat size
Output controls Prohibited species Size limits Quota TAC
ECONOMIC CHARACTERISTICS:
DWFF— No information exists regarding the profitability of this fishery. A historically low 7 endorsements existed for the fishery on 30 June 2005 and 6 boats actually operated in 2005. The value of the fishery in 2005 was only $130 000. Significant expenditures on management would quickly dissipate any net returns in the fishery. ECSMF— While the fishery has been managed with ITQs since 2004, the economic benefits of utilising such a management scheme may not have been fully realised given that catches have fallen short of TACs. The 2005–06 TAC was set at approximately 560 tonnes but only 271 tonnes of product was caught in that year. Effort latency in the form of unused licences may also be an issue with only 154 boats operating in the fishery out of a total of 297 licences. RRFF— A number of indicators suggest that profitability in this fishery is low. Effort latency is extremely high. In 2005, approximately 120 boats reported catches of snapper and just fewer than 100 boats reported catches of pearl perch. However, 1536 primary licences were on issue for the fishery in 2005. Stock assessments also show that the snapper stock is overfished. Consequently, fishers are targeting new areas in the fishery. CRFF— High prices for coral trout make this a valuable fishery. The fishery has been managed with ITQs since July 2004. In 2005–06, TACs were close to binding for coral trout with 89% of its TAC being filled. This suggests that profits for this species are high. However, TACs for red throat emperor and other species (a collective TAC for all other species caught in the fishery) only had 35% and 34% of their TACs filled respectively, suggesting that profits are relatively low for these species. There were
East Marine Region – description of commercial, recreational and charter fishing activities 91

412 fishing endorsements on issue in the fishery in 2005–06 and 373 primary vessels operated in the same year. While there is some latency in terms of the number of endorsements available, it is not excessively high.
CATCH (GVP): 2005 Within east bioregion DWFF – 25 t
ECSMF – commercial 271 t, recreational 425 t, charter 33t 2005–06 RRFF – commercial 325 t, recreational – 330 t (2002 est), charter 68 t CRFF—commercial 1544 t, recreational 2601 t, charter 27 t, indigenous 108 t. Total GVP 2005–06: ~A$33 million
STATUS: DWFF – catch considered sustainable RRFF – Concerns-possible overfishing, particularly Snapper Pearl perch & Teraglin jew – uncertain ECSMF – current catch considered sustainable CRFF—status of ‘other coral reef finfish’ uncertain.
CATCH DWFF - the main target species tend to be flame snapper, ruby snapper, cods, and jobfish DESCRIPTION: ECSMF – historically catch equally shared between Commercial and recreational sectors; however, recreational has recently
become a more significant component of the catch RRFF—snapper and pearl perch have been most important species. In 2005, commercial catch was higher than recreational catch. Previously, recreational catch has sometimes been twice that of commercial catch. CRFF—main target species are coral trout and red throat emperor. In 2005–06, the recreational sector harvested ~61% of total coral reef product, while commercial, Indigenous and charter sectors combined harvested ~39%. Targets dead, filleted and live fish.
HISTORY OF THE FISHERY:
DWFF—a relatively small, commercial-only fishery operating at depths > 200 m. Catch historically dominated by jobfish and cods, but nowadays by pearl perch, pelagics and flame snapper. Has been primarily a winter fishery. Most product has been sold domestically. ECSMF—The northern region of the east coast fishery has historically dominated the commercial catch, and has consistently exhibited higher (although variable) catch rates. Conversely, more than half of the recreational catch is estimated to be taken by south-east Queensland anglers. It should be noted, however, that the recreational catch estimates are based on where anglers live, as opposed to where the fish were caught.
East Marine Region – description of commercial, recreational and charter fishing activities 92

RRFF—mostly restricted to southern QLD (i.e. south of GBR), targeting suite of species associated with rocky reefs. Recreational catch has historically exceeded commercial catch. Product has been sold almost exclusively on domestic market. CRFF—concentrated between Cooktown and the southern end of the GBR Marine Park. Takes >120 species. Historically managed under limited-entry system, but since July 2004 under quota system. Recent growth of live fish trade in Asian markets has seen >50% of product destined for overseas.
FORECAST: ECSMF—Competition from overseas imported product establishes the base price offered to commercial fishers. Given current imports of Spanish mackerel the price is unlikely to increase in the future. Also access to labour has been difficult given that dory fishers are making a limited income from harvesting Spanish mackerel and there are higher paying alternative employment opportunities elsewhere. Consequently, Spanish mackerel quotas have not been caught in recent years. RRFF—there is significant concern that current levels of fishing mortality are too high too ensure long-term sustainability of stocks (especially snapper). Possible hyperstability exists in this fishery, whereby good catch rates may continue to be achieved despite overall declining stock abundances. CRFF—over the past decade, the live coral trout trade has expanded significantly, particularly in Asian markets. This may continue in the future. Exporters are attempting to develop overseas markets for some other species. However, a shortage of labour and perceptions that management changes have made it impossible to earn a good living as a deck hand may constrain the fishery.
COMMENTS: DWFF • catch has historically been dominated by jobfish and cods • Shift towards a fishery where catch dominated by pearl perch, pelagics and flame snapper
SOURCES: QDPIF (2006) Annual Status Report – Rocky Reef Finfish Fishery, July 2006. Queensland Government, www2.dpi.qld.gov.au/extra/pdf/fishweb/rockyreeffinfishery.pdf QDPIF (2006) Annual Status Report – Deepwater Finfish Fishery, July 2006. Queensland Government, www2.dpi.qld.gov.au/extra/pdf/fishweb/deepwaterfinfishery.pdf QDPIF (2006) Annual Status Report – Coral Reef Finfish Fishery, 2006. Queensland Government, www2.dpi.qld.gov.au/extra/pdf/fishweb/StatusReport_CoralReefFinfishFishery-2006.pdf QDPIF (2006) Annual Status Report – East Coast Spanish Mackerel Fishery, April 2007. Queensland Government, www2.dpi.qld.gov.au/extra/pdf/fishweb/StatusReport_EastCoastSpanishMackerel_April2007.pdf Williams, L.E (ed) (2002) Queensland’s fisheries resources – current condition and recent trends 1988-2000. Queensland Department of Primary Industries.
East Marine Region – description of commercial, recreational and charter fishing activities 93

Table 17: Catch data for East Coast Line Fisheries (catch adjusted for East Marine Bioregion area) Year Effort (days) Landings (tonnes) GVP $m
2001 8719 377 4.0
2002 9357 334 3.6
2003 10893 333 3.3
2004 9050 342 3.3
2005 10185 449 4.5
2006 9694 366 3.6
East Marine Region – description of commercial, recreational and charter fishing activities 94

Blue Swimmer Crab Fishery
*please note this information is based on areas outside state waters (3nm) and outside the GBR management area
GEAR TYPE(S): Crab pots and collapsible traps. Some trawl byproduct.
LOCATION: The fishery management area extends along the entire Queensland coastline (the area of the fishery is the same as “Qld_OCS_3” in the OCS map). Most catch is taken in inshore and continental shelf waters up to approximately 50 m depth, mainly in southern Queensland, south of the Great Barrier Reef Marine Park.
MAIN SPECIES: Blue swimmer crabs (Portunus pelagicus)
COMMERCIAL ENDORSMENTS:
859 licences (77 held by the Department of the Environment and Water Resources through Great Barrier Reef Marine Park structural adjustment) (June 30, 2006). 190 commercial boats accessing the fishery (2006).
MANAGEMENT: QLD DPI Fisheries. Commercial fishers taking blue swimmer crab must hold an authority endorsed with a C1 or T1 trawl fishery symbol. Input controls
Limited entry (licences). 50 pots per licence. Limited number and size (14 m maximum) of vessels.Spatial closures (under Queensland regulations and Great Barrier Reef Marine Park zoning).
Output controls Minimum legal size limit of 11.5 cm carapace width. Prohibition on taking female crabs. Trawl byproduct catch limit (100 crabs in Moreton Bay and 500 elsewhere).
East Marine Region – description of commercial, recreational and charter fishing activities 95

ECONOMIC Effort latency is a significant issue in this fishery. Although only 187 boats participated in the fishery in 2005, more than 858 CHARACTERISTICS: endorsements remained on issue at August 2006. This suggests that any positive net returns that might arise in the fishery could
quickly be dissipated with the activation of the available latent effort.
CATCH (GVP): 2006 total for the fishery: 875 t ($5.9M) – both crab fisheries combined Within east bioregion
STATUS: Unknown
CATCH DESCRIPTION:
About 80% of the blue swimmer crab harvest is taken between November and May in gutters and along edges of sandbanks in water depths greater than 3m, in estuaries and adjacent offshore areas, mainly in Moreton Bay, Hervey Bay and nearby offshore waters. Over the last decade there has been an expansion of fishing effort into offshore waters where the harvest has generally consisted of larger crabs than those found in the traditional estuarine areas.
HISTORY OF THE FISHERY:
Relatively light fishing for blue swimmer crabs in the Brisbane region dates back to the early 1800s. The fishery gradually developed into the 20th century and the first detailed catch records are from the 1930s. Catches were 11 t in 1937, over 35 t in 1947 and over 140 t during the 1960s following a rapid development resulting from increased prawn trawling and recreational fishing. Historically, there has been quite a high degree of variability in the annual catches of blue swimmer crab. The fishery expanded from the western shores of Moreton Bay in the 1940s into the southern part of Moreton Bay. Through to the mid-1900s the bulk of the catch was still coming from Moreton Bay, however over the past three decades Hervey Bay and the Great Sandy Straits regions have increased in importance. More recently the expansion of the fishery has continued into offshore waters. Effort in more remote, offshore areas in southern Queensland has fallen in recent years.
FORECAST: The tendency for operators to fish more distant, offshore areas is inversely related to operating costs, particularly fuel prices.
COMMENTS: • The Queensland fishery produces about 25% of the Australian commercial blue swimmer crab production. • The recreational sector is an important component of the fishery, taking some 15 percent of the total catch.
SOURCES: Queensland Department of Primary Industries and Fisheries (2007) Annual status report - Blue Swimmer Crab Fishery, 2007. www2.dpi.qld.gov.au/extra/pdf/fishweb/StatusReport_SwimmerCrabFishery.pdf Williams, L. E. (ed) (2002) Queensland’s fisheries resources: Current condition and recent trends 1988-2000. QI02012. Department of Primary Industries Queensland. Brisbane.
East Marine Region – description of commercial, recreational and charter fishing activities 96

Spanner Crab Fishery
GEAR TYPE(S): baited tangle nets.
LOCATION: The fishery management area covers inshore and offshore (>3 nm) waters off the Queensland coast, from the New South Wales (NSW) border to the Northern Territory border; however, Stocks are concentrated in coastal waters up to 80 m depth between Yeppoon (central Queensland) and Ballina in northern NSW.
MAIN SPECIES: Spanner crab (Ranina ranina)
COMMERCIAL Total fishery – 504 licences (2006) ENDORSMENTS: Area A (south of Yeppoon) – 239 ‘C2’ licenses.
Area B (north of Yeppoon) – 421 ‘C3’ licenses. Area A + B –156 licences.
MANAGEMENT: QLD DPI Fisheries Fishery is managed in accordance with the Queensland’s Fisheries Act 1994, the Fisheries (Spanner Crab) Management Plan 1999. Input controls
Vessel restrictions. Spawning season closures (20 November–20 December). Maximum possession limit of 45 dillies, set 15 per trot line in Area A and 30 dillies, set 10 per trot line in Area B. Recreational fishers have a maximum possession limit of four apparatus per fisher.
Output controls Area A – a variable total allowable catch (in 2005 1727 tonne) assigned to licence holders as individual transferable quota. Area B has a daily quota of 16 baskets. Recreational fishers are subject to a possession limit of 20 spanner crabs. Minimum size limits of 10 cm carapace length. Egg-bearing (berried) females may not be taken.
East Marine Region – description of commercial, recreational and charter fishing activities 97

ECONOMIC Annual catches since 2002 have fallen slightly short of the 1727 tonne variable TAC, with 84% of the TAC being filled in 2005. CHARACTERISTICS: TAC may be revised for 2006—2008). This suggests that net returns in the fishery might not be high. The introduction of ITQ
management to the fishery in 1999 may have led to efficiency gains in the fishery. Indeed, the Qld DPI (2006) suggests that the decline in boat numbers from 139 in 2000 to 90 in 2005 is a consequence of market forces in the quota market, with quota moving to a decreasing numbers of operators.
CATCH (GVP): 2006 total for the fishery: 875 t ($5.9M)—both crab fisheries combined Within east bioregion
STATUS: Fishery considered sustainable and well managed. Trends in catch rate from fishery and fisher-independent sources show an increasing trend over recent years. The prohibition on the take of egg-bearing females and undersized crabs affords protection to the stock biomass from increases in effort.
CATCH The fishery is located on the continental shelf, in depths between about 20 and 80 metres, with catches highest at depths of 60–69 DESCRIPTION: m. Traps are usually set on relatively uniform sandy substrates with little vertical relief. However there appears to be a high
degree of spatial variability in crab population density in some regions that may be related to, largely unmapped, habitat variability.
HISTORY OF THE FISHERY:
The fishery for spanner crabs commenced in coastal waters offshore of Moreton Bay and the Gold Coast in the late 1970s. During the 1980s the fleet comprised mainly small outboard-powered runabouts with annual catches around 300 t. A minimumlegal size of 10 cm carapace length was introduced at this time to improve quality and prevent the taking of a large proportion of the (smaller sized) female crabs. In the late 1980s, new fishing grounds were discovered further north along the Sunshine Coast and Fraser Island and south into the northern rivers region of NSW. A live export market to Asia was developed in the 1990s with an associated development of a dedicated spanner crab fishing fleet of larger vessels. This resulted in an almost exponential increase in fishing effort between 1990 and 1994 as crabbers expandedtheir operations northwards, beyond Hervey Bay.In response to this increase and biological concerns, a warning against further investment in the fishery was issued in 1994. New management arrangements, including limited entry and total allowable catch and individual transferable quotas were introduced between 1995 and 1999.
East Marine Region – description of commercial, recreational and charter fishing activities 98
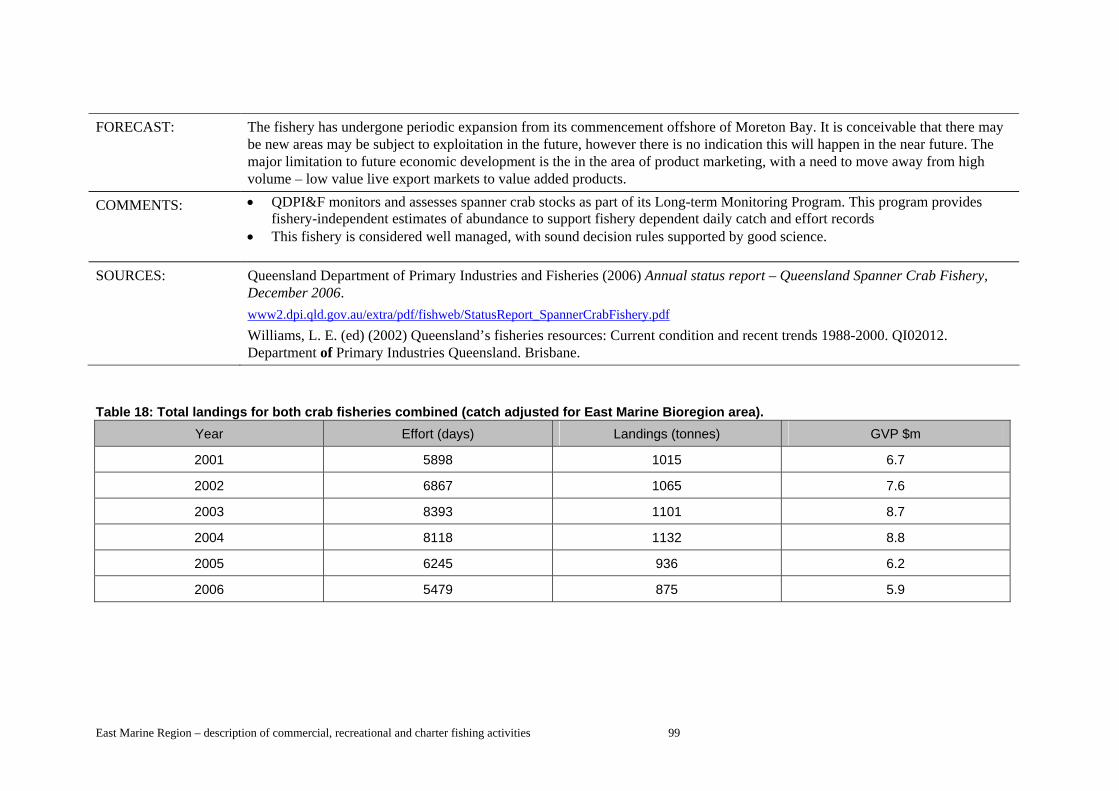
FORECAST: The fishery has undergone periodic expansion from its commencement offshore of Moreton Bay. It is conceivable that there may be new areas may be subject to exploitation in the future, however there is no indication this will happen in the near future. The major limitation to future economic development is the in the area of product marketing, with a need to move away from high volume – low value live export markets to value added products.
COMMENTS: • QDPI&F monitors and assesses spanner crab stocks as part of its Long-term Monitoring Program. This program provides fishery-independent estimates of abundance to support fishery dependent daily catch and effort records
• This fishery is considered well managed, with sound decision rules supported by good science.
SOURCES: Queensland Department of Primary Industries and Fisheries (2006) Annual status report – Queensland Spanner Crab Fishery, December 2006. www2.dpi.qld.gov.au/extra/pdf/fishweb/StatusReport_SpannerCrabFishery.pdf Williams, L. E. (ed) (2002) Queensland’s fisheries resources: Current condition and recent trends 1988-2000. QI02012. Department of Primary Industries Queensland. Brisbane.
Table 18: Total landings for both crab fisheries combined (catch adjusted for East Marine Bioregion area). Year Effort (days) Landings (tonnes) GVP $m
2001 5898 1015 6.7
2002 6867 1065 7.6
2003 8393 1101 8.7
2004 8118 1132 8.8
2005 6245 936 6.2
2006 5479 875 5.9
East Marine Region – description of commercial, recreational and charter fishing activities 99

Socio-economic profile Due to the nature of the available data it is difficult to distinguish between landed and home ports for this fishery. For the purposes of this profile, key ports were defined as those which had 16 or more fishing businesses for each fishery type. Summary of key ports The key ports for Qld fisheries include Cairns, Innisfail, Townsville, Mackay, Gladstone, Bundaberg, Mooloolaba, Brisbane and Southport (based on data from Fenton and Marshall 2001). Fishing sector employment According to Fenton and Marshall (2001) there were 2,679 individual licence holders in Qld in 2000. Of these, most were located in the Bundaberg region, while one third of fishing businesses were located between Mackay to Hervey Bay, and another third were found between Mooloolaba and Southport (Fenton and Marshal 2001). In terms of employment in fishing, it is estimated that in 2000 there were over 7,000 people employed in fishing in Qld (during peak season) (Fenton and Marshall 2001). Regional dependence on fishing Using available data from the Yellow Pages Online Directory, the number of businesses directly associated with some of the key ports in Qld fisheries are presented in Table 9. All of the key ports identified for the Qld fisheries in Table 9 have a high level of business activity associated with fishing.
Table 19: Number of fishing related businesses sourced from the Yellow Pages Online Directory 2006-2007 for some of the key ports identified in Qld Fisheries
Port Number of Fishing Related Businesses
Cairns Qld 122
Innisfail Qld 22
Townsville Qld 42
Mackay Qld 28
Gladstone Qld 30
Bundaberg Qld 36
Bowen Qld 13
Yeppoon Qld 18
Hervey Bay Qld 44
Mooloolaba Qld 38
Brisbane Qld 168
Southport Qld 96
Note: Fishing related businesses are those operating within all fisheries, not those specific to Qld Fisheries only
Port data specific to the Crab, Trawl, Line and Net fisheries are presented in the following section. Crab (Spinner and Spanner Crab) � The key ports for this fishery include Mackay, Yeppoon, Gladstone, Bundaberg, Mooloolaba,
and Brisbane. Of these, Bundaberg and Brisbane are reported to have more than 10% of crab fishing businesses operating from their ports (Fenton and Marshall, 2001).
Trawl � The key ports for this fishery include Cairns, Innisfail, Townsville, Gladstone, Bundaberg,
Hervey Bay, Tin Can Bay, Mooloolaba, Brisbane and Southport. Of these, Bundaberg,
East Marine Region – description of commercial, recreational and charter fishing activities 100

Mooloolaba and Brisbane are reported to have more than 10% of trawl fishing businesses operating from their ports (Fenton and Marshall, 2001).
Line � The key ports for this fishery include Cairns, Innisfail, Townsville, Bowen, Mackay, Yeppoon,
Gladstone, Bundaberg, Mooloolaba, and Brisbane. Of these, Bundaberg and Mooloolaba are reported to have more than 10% of line fishing businesses operating from their ports (Fenton and Marshall, 2001).
Net � The key ports for this fishery include Innisfail, Mackay, Yeppoon, Bundaberg, Mooloolaba,
and Brisbane. Of these, Brisbane is reported to have more than 10% of net fishing businesses operating from its port (Fenton and Marshall, 2001).
East Marine Region – description of commercial, recreational and charter fishing activities 101
Information gaps for commercial fishing The socioeconomic profiles of fisheries in the EMR presented above highlight a number of gaps in data, mostly associated with the locations of home and landed ports, and accurate figures on employment in individual fisheries. However, there are a number of other gaps associated with the social context of the fishing industry. In addition to a range of data and information about the biological and physical features of marine and coastal environments, there is considerable recognition that good decision making requires an understanding of the social systems in which the fishing industry is embedded and which have a range of social, economic, and environmental benefits and costs. Social information and data can help decision makers solve a range of problems by filling important information gaps about: � how a (particular natural) resource is used and with what effects for communities, industries
and individuals, including how well that industry is meeting sustainability targets
� what happens to communities, industries and individuals when those resource use patterns are
changed
� how to mitigate negative effects and enhance benefits and
� how various stakeholders think about and value the different sectors of the fishing industry.
Despite an increased knowledge about the social dimensions of the fishing industry, generally, there tends to be a shortage of regular (quantitative and qualitative) data collection relating to the social and economic aspects of Commonwealth and State-managed fisheries. There are information and data sets that are collected at different (and sometimes irregular) intervals, at different scales and for a range of different purposes. In addition, emerging policy issues will create new and/or different data and information needs. Regularity of data collection Part of the work that the Bureau of Rural Sciences (BRS) undertakes to understand the social characteristics and effects of the fishing industry, is to analyse ABS Census data on employment in the fishing industry, and the proportion of total employment that fishing employment represents. As these data are collected every five and two years, respectively, they may not fully reflect the pace of change being experienced in particular fisheries and communities. Generally, BRS, other agencies, and the research community gather a range of information and data on the social dimensions of fishing, albeit on an ‘as needed’ basis. Issues of scale and reliability ABS Census data is collected at the SLA level. Within SLAs there may be very small numbers of people employed (0-5 people), which create difficulties when seeking to determine how those figures apply to larger areas (i.e. regions and subregions). The ABS Census data provides figures on employment in the fishing industry as a whole, as well as some basic demographic characteristics (of the employment force and regional population). There is little available information which specifically outlines these kinds of details for the specific fisheries, such as the ETBF or the SESSF. Other limitations associated with the use of ABS Census data include some underreporting of employment in the fishing industry due to the large number of unpaid family works and casual workers engaged in fishing activities during peak season times (Larcombe et al., 2006; Fenton and Marshall, 2001). There are further limitations given the underestimation in actual numbers of people employed due to seasonality—fishing activities are greatly affected by season factors (e.g. temporary closures of fisheries) which are not captured in Census collection. Generally, data collected by ABARE typically examines industry-wide economic performance. However, understanding the social effects of natural resource industries also requires
East Marine Region – description of commercial, recreational and charter fishing activities 102

understanding social and economic factors at the business and operator levels (e.g. role of succession in business viability, etc.). There are varying definitions of ‘regions’ among agencies collecting (or planning to collect) data for this spatial unit, such as the ABS’s SLAs, the marine regions used for bioregional planning, or DAFF and AFMA’s marine geography boundaries for fisheries management. Data and information collected at these different scales may not allow for direct comparisons, necessitating some degree of inference to determine its relevance for the particular research/policy issue under investigation. For example, the Marine Matters Atlas notes that its use of ‘marine regions’ boundaries do not align precisely with SLA or State/Territory boundaries (Larcombe et al. 2006). Purpose and scope issues The particular policy or management issues inform the purpose of the research, and therefore the scope and method of (qualitative and quantitative) data and information collected. For example, fisheries policy and management requires an understanding of fishing practices and stock levels, hence fisheries management boundaries are based on marine areas (bodies of water), species or gear type. The more recent need to understand the degree of community dependence on fishing, requires different, particular and further data and information than what has been collected in the past. These include details about how businesses and individuals operate and are involved in specific fisheries (e.g. employment levels, economic flow on effects, age distribution, place of residence, income levels, skill base etc). The socio-economic and demographic information which is currently collected tends to be done either on a fishery basis (focused on a boat/business enterprise level) or else is done on a regional level of geography. Hence, socio-economic information which tends to be available at the national or regional levels is not useful to considerations of particular fisheries. In addition, fishers may operate across fisheries (both Australian government and State—licensed). As a means of addressing some of these issues, data based on ports of landing is often relied upon to identify areas of fishery dependence. However it is clear that fishers do not necessarily live in the same ports they land fish in.
East Marine Region – description of commercial, recreational and charter fishing activities 103

3. Recreational and Charter Fishing
Introduction – importance of recreational fishing A significant number of Australians participate in recreational fishing every year. With estimates of fisher expenditure at over a billion dollars annually, recreational fishing is also extremely valuable to the Australian economy. The National Recreational and Indigenous Fishing Survey conducted in 2003 by the Fishing Research and Development Corporation (Henry and Lyle, 2003), discovered that most people who fish recreationally are doing so for a number of reasons, including to relax, for sport or to spend time with family. Although most of the recreational fishing on the Eastern seaboard takes place from the shore, a noteworthy amount of effort occurs off the coast within the Commonwealth waters of the EMR. While there is no detailed recreational fishing information specific to the EMR, the survey by the FRDC measures the amount of recreational fishing that occurs in Commonwealth waters nationwide at approximately 4% of the total recreational fishing effort (Henry and Lyle, 2003). The survey also notes key offshore species, some of which are whiting, emperors and pink snapper, but it does not provide the detail of fishing locations. According to the survey, Nation-wide there are approximately twice as many men who fish recreationally as women (Henry and Lyle, 2003).
Figure 14 - Results from National Recreational Fishing Survey
East Marine Region – description of commercial, recreational and charter fishing activities 104

Recreational, Game and Charter fishing in New South Wales GEAR TYPE(S): Game fishing including trolling (live baits, dead baits and
artificial lures), live and dead drift baiting, and spinning (casting and retrieving artificial lures). Demersal fishing including jigging (using artificial lures and multi-hook jigs), live baiting, and dead baiting. Bait gathering included bait jigging and lure trolling.
LOCATION: Offshore from the 3nm boundary off the NSW coast to the continental shelf and beyond (commonly out to approximately 50nm). However, game fishing and the collection of bait for game fishing tends to be offshore of the key ports of Sydney, Port Stephens, Coffs Harbour, Wollongong, Batemans Bay, and Bermagui. There are also currently 21 fish aggregation devices along the coast, off Brunswick Heads, Richmond River, Evans Head, Wooli, Coffs Harbour, Macleay River, Hastings River, Camden Haven, Cape Hawke Harbour, Tomaree, Swansea Channel, Terrigal, Broken Bay, Port Jackson, Botany Bay, Port Hacking, Flagstaff Point, Kiama, Currarong and Eden.
MAIN SPECIES: Primary game fish targets include black marlin (Makaira indica), striped marlin (Tetrapturus audax), blue marlin (Makaira nigricans), yellowfin tuna (Thunnus albacares), albacore (Thunnus alalunga), broadbill swordfish (Xiphias gladius), tiger shark (Galeocerdo cuvier), mako shark (Isurus spp.), hammerhead sharks (Sphyrna spp.) and various whaler sharks. Other primary pelagic fish targets include yellowtail kingfish (Seriola lalandi), mahi mahi (Coryphaena hippurus), Spanish and spotted mackerel (Scomberomorus spp.), cobia (Rachycentron canadum), wahoo (Acanthocybium solandri) and samson fish (Seriola hippos). Primary demersal fish targets include snapper (Pagrus auratus), pearl perch (Glaucosoma scapulare), ocean jackets (Nelusetta ayraudi), morwong (Nemadactylus and Cheilodatylus spp.), flathead (Platycephalus spp.), nannygai (Centroberyx affinis), John (Zeus faber) and mirror (Zenopsis nebulosus) dory, teraglin (Atractoscion aequidens), blue-eye trevalla (Hyperoglyphe Antarctica), bar cod (Epinephelus ergastularius), bass groper (Polyprion americanus) and hapuku/hapuka (Polyprion oxygeneios). Primary bait species targeted include blue (slimy) mackerel (Scomber australasicus) and striped/skipjack tuna (Katsuwonus pelamis).
COMMERCIAL The Fisheries Management Act 1994 provides for the ENDORSMENTS: management of recreational charter fishing boat activities by
the issuance of a recreational charter fishing boat licence. The licensing scheme came into effect in November 2000 and followed three years of extensive consultation between the
East Marine Region – description of commercial, recreational and charter fishing activities 105

charter fishing boat industry, community and Government. Charter boat operators providing fishing trips for anglers in NSW need a Charter Fishing Boat (CFB) licence to operate their business. There are 279 licensed charter fishing boat operations in NSW. Authorised activities must also be connected to a licence to enable a charter fishing operation to target certain species in ocean waters. These are: nearshore bottom fishing and sportfishing, game fishing and deep sea bottom fishing.
MANAGEMENT: Recreational fisheries are managed by state agencies and in NSW the Department of Primary Industries is the overseeing agency. Recreational fishers must pay a fee to fish off the NSW coast. Licensed charter fishing boat operators may pay for an exemption certificate (block licence), which allows anglers to fish without the need to have paid the recreational fishing fee. Input controls Gear restrictions (limited number of lines per angler - 4) Limited entry (charter) Limited effort (limited number of anglers per boat—charter) — specified on each CFB licence. Temporal and spatial closures and restrictions, such as Marine Park sanctuary zones and grey nurse shark critical habitat areas Output controls Size limits (for all common species) Daily bag and possession limit for all species is 20, unless a more proscriptive limit applies (e.g. yellowtail kingfish has a limit of 5 fish per person)
ECONOMIC CHARACTERISTICS:
Very limited information exists regarding the economic characteristics of recreational fisheries in NSW. Results from the National Recreational and Indigenous Fishery Survey (Henry and Lyle 2003) showed that total recreational fishing expenditure in NSW was approximately $554 million or $555 per fisher in 1999-00. This expenditure includes money spent during the survey period on both directly related fishing items, such as bait and boat hire, as well as indirect expense items such as travel and accommodation. While these expenditure figures provide some indication of the level of recreational fishing activity in NSW, they do not represent the gross value or economic value (in terms of net returns) of recreational fishing in NSW.
An ABARE study of charter and recreational fishing in Australia’s eastern tuna and billfish fishery (Galeano et al 2005) showed that net returns in both the charter sector and the recreational sector of the entire fishery are fairly low. For
East Marine Region – description of commercial, recreational and charter fishing activities 106

the NSW charter sector of the fishery, net returns in 2001—02 were -$212 000. While for the NSW recreational sector of the fishery, net returns were positive with a net return estimate of $1.5 million in 2001-02.
CATCH DESCRIPTION: Game fishing and the collection of bait for game fishing tends to be offshore of the key ports of Sydney, Port Stephens, Coffs Harbour Batemans Bay and Bermagui, which are also where many game fishing tournaments are held. Catch is highest around Port Stephens, Sydney and Batemans Bay. Game fishing targets large pelagic species and is predominantly a tag and release fishery, though a portion of the catch is landed.
HISTORY OF THE FISHERY:
Game fishing in NSW began in the early part on the 20th
century, with Port Stephens laying claim to the site of the first black marlin landed on rod and reel in the world in 1913. Port Stephens now hosts some of the largest game fishing tournaments in Australia. Bermagui was made internationally famous by the American author Zane Grey who pioneered the sport of game fishing in the area in the 1930s. The edge of the continental shelf is closest to the mainland off Bermagui and this has traditionally provided excellent fishing grounds for deep sea and game fishing. Game fishing expanded as motorised vessels became common, and game fishing clubs were established along the NSW coast. Activity slowed during WWII, but expanded soon after. The fishing power of the game fishing fleet has increased markedly due to increases in boat design, more reliable engines and tackle and increases in electronic technologies such as echo sounders and GPS. Significant conflict exists between recreational and commercial fisheries regarding allocation of resources and when and where the commercial fishing fleet operates. Commercial fishers are excluded from landing black and blue marlin, though significant conflict remains over striped marlin and yellowfin tuna. Negotiations are continuing between these sectors. The offshore deepwater demersal recreational fishery, like game fishing, has typically been a comparatively low participation fishery (compared to estuarine and inshore fisheries). However, over the last five years there has seen an increase in popularity of deepwater jigging for kingfish, snapper and other large deepwater demersal species. This trend has led to recreational fishers travelling further offshore and fishing in much deeper locations. Guided recreational charter fishing activities gained in popularity in the early 1980s, although some informal operations commenced in the late 1960s. These tended to be
East Marine Region – description of commercial, recreational and charter fishing activities 107

operated by fishers that also held commercial fishing licences, as a way of supplementing income. In anticipation of potential licensing arrangements, warnings were issued against further investment in the NSW charter fishing industry, the first of which occurred on 22 October 1997. These warnings were part of a strategy to allow the capping of the number of charter fishing operators at the levels that existed at that time, as part of the Government’s comprehensive approach to ensuring the conservation and sustainable management of fish stocks. Following the formal licence assessment and review process in 2000, the NSW charter fishing industry was capped at 279 licences.
FORECAST: It is feasible that the offshore recreational fishery may gradually expand over time due to, for example, increasing demand and competition for inshore fisheries resources, the declaration of coastal and inshore marine parks and technological advancements (e.g. GPS, EPIRB, powered reels). Due to current management arrangements, the NSW charter fishing industry is not likely to significantly expand or contract, although some restructuring is anticipated over time.
COMMENTS: • Charter boat and recreational fishing are extremely important economic contributors to regional economies
• Fishing is usually diffuse, although there are key ports for charter boat and game fishing activities
• Effort is spread throughout the state • There are two distinct fisheries—game fishing for
pelagics and deepwater demersal fishing
SOURCES: Assessment of black marlin and blue marlin in the Australian fishing zone (2000) Report of the black and blue marlin working group. Department of Agriculture, Fisheries and Forestry, Canberra. Bromhead, D., Pepperell, J., Wise, B., and Findlay, J. (2004) Striped marlin: biology and fisheries. Bureau of Rural Sciences. Canberra. Economic impact of the NSW striped marlin fishery (2004) Ernst and Young, Report to NSW Fisheries, Cronulla. Galeano, D., Langenkamp, D., Levantis, C., Shafron, W. and Redmond, I. 2004, Economic Value of Charter and Recreational Fishing in Australia’s Eastern Tuna and Billfish Fishery, ABARE eReport 04.10 Prepared for the Fisheries Resources Research Fund, Canberra, July. NSW DPI Marine and estuarine recreational charter fishing (2007), NSW Department of Primary Industries. http://www.fisheries.nsw.gov.au/recreational/saltwater/saltwa
East Marine Region – description of commercial, recreational and charter fishing activities 108

ter/charter/background_information NSW DPI Recreational fishing (2007), NSW Department of Primary Industries. http://www.fisheries.nsw.gov.au/recreational Henry, G.W. and Lyle, J.M. (2003) The National recreational and indigenous fishing survey. FRDC Project 99/158. Australian Government Department of Agriculture, Fisheries and Forestry. www.affa.gov.au/recfishsurvey Pepperell, J. and Henry, G. (1997) Development and implementation of a catch/effort monitoring system for the organised game fish fishery off eastern Australia.
Key Recreational Ports Tweed Heads
Coffs Harbour Port Stephens
Sydney
Batemans Bay
Narooma/ Bermagui
Fishing Tournaments in NSW Regular fishing tournaments in NSW include:
Monster Mako Tournament, Sydney (January) Bill Heyward Memorial Tournament, Botany Bay (January) Golden Lure Game fishing Tournament, Port Macquarie (January) Tollgate Islands Classic, Batemans Bay (January) Blue Water Classic, Bermagui (January) Jess Sams Fishing Tournament, Ulladulla (January – February) Ulladulla Ex-Servos Fishing Club Tournament, Ulladulla (February) Port Hacking Anniversary Tournament, Port Hacking (February) Big Fish Bonanza Tournament, Lake Macquarie (February) Anniversary Tournament, Port Hacking (February) Southern Zone Interclub Tournament, Batemans Bay (February) Toyota Interclub Tournament, Port Stephens (February-March) Alliance T&R Tournament, Bermagui (March) Broken Bay Invitational Tournament, Broken Bay (March) Riviera Port Stephens GFC Shootout, March Shoalhaven Open Tournament (March) Eden Open Invitational Tournament (March) Kiama Blowhole Big Fish Classic (April) Merimbula Open Tournament (April) Canberra Yellowfin Tuna Tournament, Bermagui (May) Batemans Bay Yellowfin Tuna Tournament (May) Merimbula Broadbill Tournament (May)
East Marine Region – description of commercial, recreational and charter fishing activities 109

Sussex Inlet Annual Family Fishing Carnival (July) Evans Head Classic, Evans Head
Socio-economic analysis The National survey by the FRDC (2003) suggests that in NSW, there were approximately 999,000 people who fished at least once in the 12 months prior to May 2000. The total number of fishers is the greatest number of any state or territory; accordingly, NSW also had the greatest fishing effort at 7.7 million fishing events (Henry and Lyle, 2003). The survey states that New South Wales also had the most expenditure of any state at $554 million dollars total for the 12 months recorded (Henry and Lyle, 2003).
The largest proportion of fishing effort that occurred from a vessel in NSW was recorded as occurring from private vessels (92%), as oppose to hire and charter boats (Henry and Lyle, 2003). NSW is described in the survey as a ‘net importer’ of fishing effort. That is, 19% of people who fish interstate of their home state go to NSW to fish (Henry and Lyle, 2003).
East Marine Region – description of commercial, recreational and charter fishing activities 110

Queensland Offshore Recreational, Game and Charter Fishery
*please note this information is based on areas outside state waters (3nm) and outside the GBR management area
GEAR TYPE(S): Game fishing including trolling (live baits, dead baits and artificial lures), live and dead drift baiting, and spinning (casting and retrieving artificial lures). Demersal fishing including jigging (using artificial lures and multi-hook jigs), live baiting, and dead baiting. Bait gathering included bait jigging and lure trolling.
LOCATION: Offshore from the 3 n. mile boundary to the edge of the continental shelf along the coast of Qld. However, game fishing and the collection of bait for game fishing tends to be offshore of the key ports of the Gold coast, Brisbane, Mooloolaba, and Cairns.
MAIN SPECIES: Primary game fish targets include black marlin (Makaira indica), striped marlin (Tetrapturus audax), blue marlin (Makaira nigricans), mahi mahi (Coryphaena hippurus), yellowfin tuna (Thunnus albacares), wahoo (Acanthocybium solandri), sailfish (Istiophorus platypterus), tiger shark (Galeocerdo cuvier), mako shark (Isurus spp.), hammerhead shark (Sphyrna spp.), thresher sharks (Alopias spp.), porbeagle shark (Lamna nasus), and broadbill swordfish (Xiphias gladius). Primary demersal fish targets include yellowtail kingfish (Seriola lalandi), cobia (Rachycentron canadum), samson fish (Seriola hippos), snapper (Pagrus auratus), pearl perch (Glaucosoma scapulare), trumpeter (Latris lineata), deepwater flatheads (Platycephalus spp.), blue-eye trevalla (Hyperoglyphe Antarctica), bar cod bass (Epinephelus ergastularius), groper (Polyprion americanus) and hapuka (Polyprion oxygeneios). Primary bait species targeted include blue (slimy) mackerel (Scomber australasicus) and skipkjack tuna (Katsuwonus pelamis).
ECONOMIC CHARACTERISTICS:
There is little available information on the economic characteristics of recreational fisheries in Qld. Results from the National Recreational and Indigenous Fishery Survey (Henry and Lyle 2003) showed that total recreational fishing expenditure in Qld was approximately $320 million or $407 per fisher in 1999—00. This expenditure includes money spent during the survey period on both directly related fishing items, such as bait and boat hire, as well as indirect expense items such as travel and accommodation. While these expenditure figures provide some indication of the level of recreational fishing activity in Qld, they do not represent the gross value or economic value (in terms of net returns) of recreational fishing in Qld.
East Marine Region – description of commercial, recreational and charter fishing activities 111

An ABARE study of charter and recreational fishing in Australia’s eastern tuna and billfish fishery (Galeano et al 2005) showed that net returns in both the charter sector and the recreational sector of the fishery in general are fairly low. For the Qld charter sector of the fishery specifically, net returns in 2001—02 were $187 000. While for the Qld’s recreational sector of the fishery, net returns were estimated at $3.3 million in 2001-02.
CATCH DESCRIPTION: Game fishing and the collection of bait for game fishing tends to be offshore of the key ports of Gold coast, Brisbane, Mooloolaba, Port Douglas, Cairns, Townsville, Rockhampton, Whitsundays and Gladstone which are also where many game fishing tournaments are held. Game fishing targets large pelagic species and is predominantly a tag and release fishery, though a portion of the catch is landed.
SOURCES: Assessment of black marlin and blue marlin in the Australian fishing zone (2000) Report of the black and blue marlin working group. Department of Agriculture, Fisheries and Forestry, Canberra. Bromhead, D., Pepperell, J., Wise, B., and Findlay, J. (2004) Striped marlin: biology and fisheries. Bureau of Rural Sciences. Canberra. Economic impact of the NSW striped marlin fishery (2004) Ernst and Young, Report to NSW Fisheries, Cronulla. Galeano, D., Langenkamp, D., Levantis, C., Shafron, W. and Redmond, I. 2004, Economic Value of Charter and Recreational Fishing in Australia’s Eastern Tuna and Billfish Fishery, ABARE eReport 04.10 Prepared for the Fisheries Resources Research Fund, Canberra, July. Henry, G.W. and Lyle, J.M. (2003) The National recreational and indigenous fishing survey. FRDC Project 99/158. Australian Government Department of Agriculture, Fisheries and Forestry. www.affa.gov.au/recfishsurvey Pepperell, J. and Henry, G. (1997) Development and implementation of a catch/effort monitoring system for the organised game fish fishery off eastern Australia. QLD Department of Primary Industries and Fisheries, (2007) A brief guide to recreational fishing. http://www.dpi.qld.gov.au/cps/rde/xchg/dpi/hs.xsl/28_2981_E NA_HTML.htm
Key Recreational Ports Port Douglas
Cairns Townsville Rockhampton
East Marine Region – description of commercial, recreational and charter fishing activities 112

Whitsundays
Gladstone Mooloolaba Brisbane Gold Coast
Fishing Tournaments in Qld Fishing tournaments in Qld include:
Fraser Classic, Fraser Island Gold Coast Flathead Classic, Gold Coast Tournament of Champions (January) Light Tackle Masters (January) Billfish Challenge (January) Game Fish Classic (February) Yamaha Classic & Lees Industry Inter-club Shield (February) Couran Cove All Tackle (March) Heavy Tackle Tournament (March) Blue Marlin Heavy Tackle (April) Billfish Bonanza (April) Blue Water Classic (April-May) Cairns Black Marlin Classic (September) Burleigh Pools Junior Tournament (November) Billfish Bash (November)
Socio-economic analysis The National survey by the FRDC (2003) states that Qld has 785,000 people who fished recreationally fished at least once in the 12 months prior to May 2000. This level of participation is the second highest in Australia (behind NSW). Also, Qld had the second highest rate of participation in the Nation, at 5.8 million fisher events. According to a survey conducted in 2004, the most numerous and active of recreational fishers in Qld are from Brisbane City and the Gold Coast (QDPI&F, 2006) and the overwhelming majority of fishing events occur in saltwater (QDPI&F, 2006). Additionally, Queensland is a net importer of fishing, with approximately 11% of the total exported effort (Henry and Lyle, 2003). Qld also saw a high percentage of privately owned boat-based fishing effort, at 91% (Henry and Lyle, 2003).
East Marine Region – description of commercial, recreational and charter fishing activities 113

Information gaps for recreational, game and charter fishing The information gaps in understanding recreational fishing in Australia are numerous. Many peak fishing and recreational fishing bodies are seeking to remedy these with various research projects scheduled including an extensive research plan from AFMA and Recfish Australia on their respective websites. Some of the information gaps identified by these groups include; • limited socio-economic analyses available (i.e. all data reported in this report was derived from
just three surveys, a national survey and two state surveys, one each from Qld and NSW); • there is limited primary data from recreational fishers in each affected state (available data but it
is quickly outdated and non-ongoing); • there are no data or information in relation to recreational fishing on a per fishery basis or a per
marine region basis, or if there are, the information is not in-depth. Along these lines there are no in depth analyses on location and types of recreational fishing i.e. where it occurs and how fish are caught there. Additionally, there are no Commonwealth fisheries data on recreational fishing, and there is generally a limited understanding of the effects of recreational fishing on ecosystems, the economy and society as a whole.
East Marine Region – description of commercial, recreational and charter fishing activities 114

4. Resource management challenges There are emerging policy issues, which will require further and integrated social and economic information about the social and economic aspects of fisheries. Climate change is likely to have significant impacts on the marine environment, as well as flow-on effects for operations of Commonwealth and State commercial fisheries. Australia’s ability to predict the potential impacts on fisheries is not well developed compared to current efforts identifying impacts on agriculture. Resource sharing between fishing sectors (recreational and commercial) is coming to the fore in many fisheries. The trend was seen initially in more accessible inshore fisheries under State and Territory control, but more recently we are seeing this debate in offshore fisheries. The regional marine planning process also adds another dimension and user groups to the resource sharing mix.
Overview of recent changes affecting fisheries in the region The commercial fishing sector is undergoing rapid change and faces a range of challenges in dealing with increasing pressures on the fishing resource as well as changing market conditions and technologies. Effectively driving and managing change will be a key factor in the industry’s future profitability. The implementation of the Australian government’s $150 million Securing our Fishing Future voluntary fishing concession buyback is likely to have had substantial impact in the EMR fisheries.
Table 20: Ports affected by the buyback in the EMR State/Region1 Port Accepted Tenders
Queensland
Brisbane Region Brisbane 7
Far North Queensland Cairns 15
Sunshine Coast Mooloolaba 33
Other Queensland Regions Undefined Ports 3
New South Wales
Sydney Region Port Jackson 5
Sydney 10
Hunter Port Stephens 5
Illawarra Wollongong 6
Mid North Coast Coffs Harbour 5
Undefined Ports 5
Northern Rivers Undefined Ports 1
Shoalhaven Ulladulla 17
Undefined Ports 2
South East New South Wales Bermagui 10
Eden 13
Undefined Ports 5
1 Regions are based on Area Consultative Committee geographical boundaries, www.acc.gov.au. Source: DAFF (2006) “Commonwealth fisheries set for a more secure and profitable future - Results of Round 2 of the fishing concession buyback announced”, Media Release, DAFF06/153A 22 December 2006 http://www.mffc.gov.au/releases/2006/06153a.html (accessed 05/01/07)
East Marine Region – description of commercial, recreational and charter fishing activities 115

The outcome of the tender indicates substantial take-up of the buyback in these fisheries and their associated ports, with significant reductions in the number of remaining concessions (Appendix 4). For example, 99 longline permits (45% reduction) and 112 minor line permits (49% reduction) were surrendered in the ETBF during Round One and Two of the buyback (Table A, Appendix 4). Table 10 contains the number of accepted tenders for ports within the EMR. The Sunshine Coast (Mooloolaba) and Shoalhaven (Ulladulla) have the highest number of tenders accepted at 33 and 17 respectively (Table 10).The social system surrounding fishing, including the values and attitudes of fishers, is important in determining how this change is experienced. Likewise, relationships and networks impact on the capacity of fishers to adjust to change. These factors determine how challenges are identified and addressed. To date, few Australian studies have considered the social aspects of managing change in the fisheries sector. The Adapting to Change in Fisheries: Social and cultural impediments to change (‘Adapting to Change Project’ - commissioned through DAFF’s Rural Policy and Innovation Division as part of its Industry Partnerships Programme (Pickworth et al., 2007)) explored some of the social dimensions of change in Australian fisheries. The project examined: • how individuals in key fishing industry sectors have been responding to changes, such as
resource access competition, rising input costs, and increasing complexity in operations, management and compliance
• how change is being experienced and the factors influencing those experiences and • key impediments to adaptation by fishers and strategies to address those impediments. The research did not target and is not representative of fishers who had already exited the industry. Fifty-seven people across the ETBF and the SESSF participated in a series of interviews or a focus group. Participants were from a range of industry sectors – including fishers, seafood supply chain, trainers, government, industry organisations and NGOs (non-government organisations). Key Issues: Findings from the Project � Fishers were found to be cautiously optimistic about the future of their industry. However, they
experienced frustrations with continued change and uncertainty. They were also keen to ‘get on with it’, with time to adjust to key changes, particularly the Australian Government ‘buyback’. Some fishers felt overloaded, overwhelmed and had therefore disengaged with the change process (e.g. no longer attending industry or government meetings).
� There are different social groups within the fishing industry and across particular fisheries: family businesses, corporate fishers, women, cultural groups, newer entrants and historical groupings.
� Across these social groups, fishers adapt in different ways and to varying degrees. Some recent adaptations include diversification, improving gear, and developing bycatch mitigation measures. Some fishers adapt proactively (‘on the front foot’ – ‘proactive adapters’). These ‘adapters’ tend to have more business management and strategic planning skills (or have greater access to staff/consultants with those skills) and better access to formal and informal fishing networks. Given their skill set, valuable contacts, information access, and improved lobbying capacities, they are more likely to adapt better to change than other fishers. Other fishers make changes just to keep up and to ‘keep their heads above water’ (‘on the back foot’ – ‘reactive adapters’).
� The project did not target fishers who had left the fishery in the 1st round of the ‘buyback’, but several participants had tendered in the 1st and/or 2nd round of the ‘buyback’. These participants who had submitted a tender in the ‘buyback’ were either ‘rationalisers’ (using the tender to reduce their operations by selling unused/extra licenses) or ‘retirees’ (older fishers seeking to exit the industry). Those fishers not tendering were generally more confident about their future in the industry, loved their occupation and/or had succession plans in place.
Key drivers and barriers to change in the fishing industry
East Marine Region – description of commercial, recreational and charter fishing activities 116

How fishers adapt to change generally depends on interrelated factors, which can drive or impede positive change. The Project found particular drivers and barriers to change corresponding to those factors: � Fisher’s aspirations, including their values, culture and motivations (“Do I want to do it”,
“Does it fit with what I want”), are central to shaping responses to change and vary among individuals and cultural/professional groups. Fishers’ responses to change are informed by their judgements about how well the change fits with their goals, motivations and culture (e.g. will this change help me run a successful business, or pass my business on to my children?). In some cases competitive and secretive cultures obstructed collaboration and cooperation in the fishery, given perceptions of competing interests (e.g. ‘winners and losers’).
� Fishers access to adequate and appropriate resources supporting the change (“Do I have the means to do it?”). Some fishers lacked certain resources/skills – particularly, entrepreneurial and business knowledge and skills, strategic planning, time or staff, especially for many smaller family businesses and particular cultural groupings. In some cases there were inadequate linkages and information flows between and within different groups, especially for fishers not linked into formal networks.
� The characteristics of the desired change (“Does it work – will it benefit me?”) as perceived by fishers (and other stakeholders) will influence how readily and appropriately fishers respond. Some people were unsure why the change was happening, felt burdened by the rate of change, experienced difficulty incorporating additional administrative and other business requirements into their operations, did not see sufficient (economic) incentives for change, and believed some management recommendations were overly prescriptive and reduced the innovation and competitive advantage of their fishing skills.
� Change processes may not sufficiently recognise (and engage with) the diversity of operations and individuals in fisheries – some key people and groups were not sufficiently targeted and therefore engaged in the change process (e.g. chandlers, women, younger people).
East Marine Region – description of commercial, recreational and charter fishing activities 117

5. Sources of information and further reading Australian Bureau of Statistics (ABS) 2004. National Regional Profile
http://www.abs.gov.au/AUSSTATS/[email protected]/nrpbygeogtype?openview&restricttocategory= Main+Areas&Expand=1& Accessed 20/07/07
Dominion Consulting 2002. An Assessment of Social and Economic Issues in the NSW Ocean Hauling Fisheries Management Strategy – A Report to NSW Fisheries. Dominion Consulting, Sutherland NSW
Fenton, M. & Marshall, N. 2001. A Guide to the Fishers of Queensland - Part A: TRC-Analysis and Social Profiles of Queensland’s Commercial Fishing Industry. Technical Report 36, CRC Reef Research Centre, Townsville QLD
Henry, G. W. and Lyle, J. M. 2003. The National Recreational and Indigenous Fishing Survey. Fisheries Research and Development Corporation and the Australian Government Department of Agriculture, Fisheries and Forestry, Canberra ACT
Larcombe, J., Charalambou, C., Herreria, E., Casey, A.M., and Hobsbawn, P. Marine Matters National – Atlas of Australian Marine Fishing and Coastal Communities. Department of Agriculture, Fisheries and Forestry, Canberra ACT
NSW Department of Primary Industries. 2004a. Environmental Impact Statement on the Lobster Fishery in NSW – Public Consultation Document. NSW Department of Primary Industries, Cronulla NSW
NSW Department of Primary Industries. 2004b. Environmental Impact Statement on the Trawl Fishery in NSW – Public Consultation Document. NSW Department of Primary Industries, Cronulla NSW
NSW Department of Primary Industries. 2006. Ocean Trap and Line Fishery Environmental Impact Statement – Public Consultation Document. NSW Department of Primary Industries, Cronulla NSW
Pickworth, J., Casey, AM, Maller, C.J. & Stenekes, N. 2007. Adapting to Change in Fisheries. Report to the Commonwealth Fisheries Action Partnership Project, Bureau of Rural Sciences, Canberra ACT
QLD Department of Primary Industries and Fisheries. 2006.2004 Biennial Recreational Fishing Telephone Survey of Queensland Residents. Queensland Department of Primary Industries and Fisheries, Brisbane QLD
Vieira, S. and Galeano, D. 2007. Regional Expenditure and Employment in the Southern and Eastern Scalefish and Shark Fishery and The Eastern Tuna and Billfish Fishery. ABARE report for the Fisheries Resources Research Fund Canberra, June 2007.
East Marine Region – description of commercial, recreational and charter fishing activities 118

Acknowledgements The following individuals and organisations have provided their time and resources in processing data and providing expert opinion and review that has assisted in the compilation of this report. We would like to acknowledge and thank them for their contributions.
NSW Department of Primary Industries – in particular James Scandol, Qld Department of Primary Industries and Fisheries – in particular Malcolm Dunning, Nadia Engstrom and Len Olyott, The Australian Fisheries Management Authority The Australian Bureau of Agriculture and Resource Economics – in particular Dave Galeano Queensland Game Fishing Association
East Marine Region – description of commercial, recreational and charter fishing activities 119

Appendices
East Marine Region – description of commercial, recreational and charter fishing activities 120

Appendix 1 – Fishery maps
East Marine Region – description of commercial, recreational and charter fishing activities 121

Commonwealth Commercial Fisheries
Coral Sea
East Marine Region – description of commercial, recreational and charter fishing activities 122

Eastern Tuna and Billfish Fishery
East Marine Region – description of commercial, recreational and charter fishing activities 123
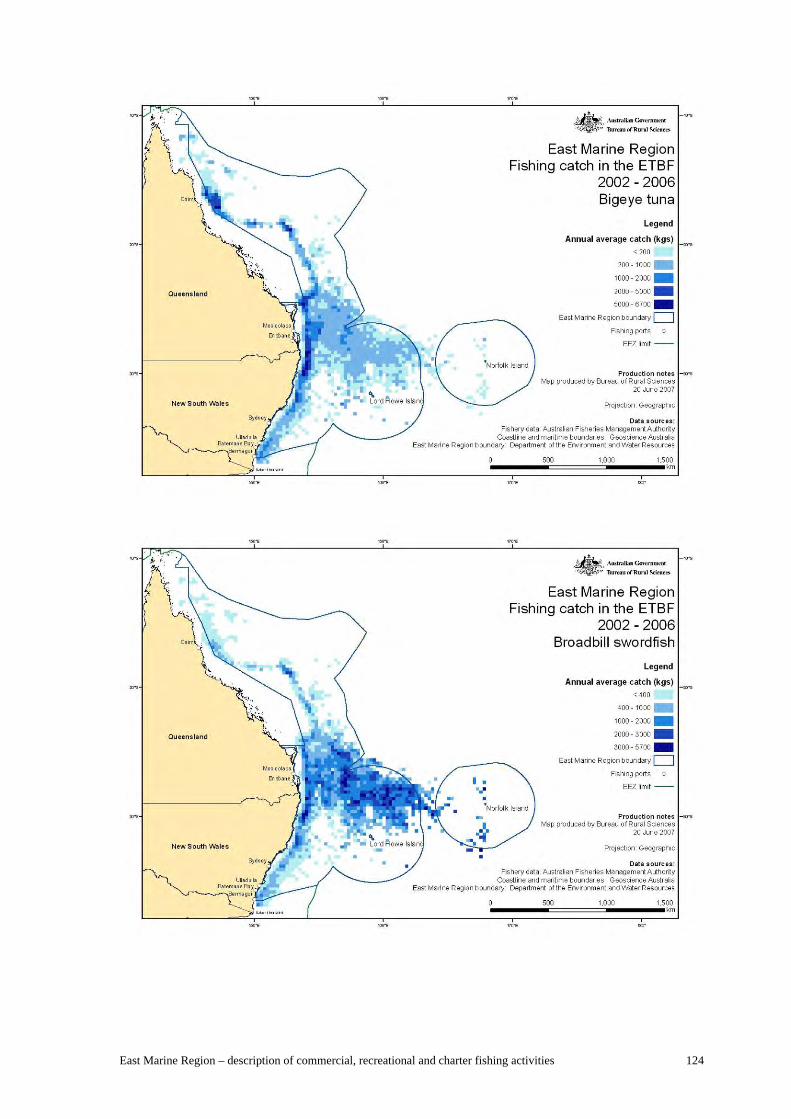
East Marine Region – description of commercial, recreational and charter fishing activities 124

East Marine Region – description of commercial, recreational and charter fishing activities 125

East Marine Region – description of commercial, recreational and charter fishing activities 126
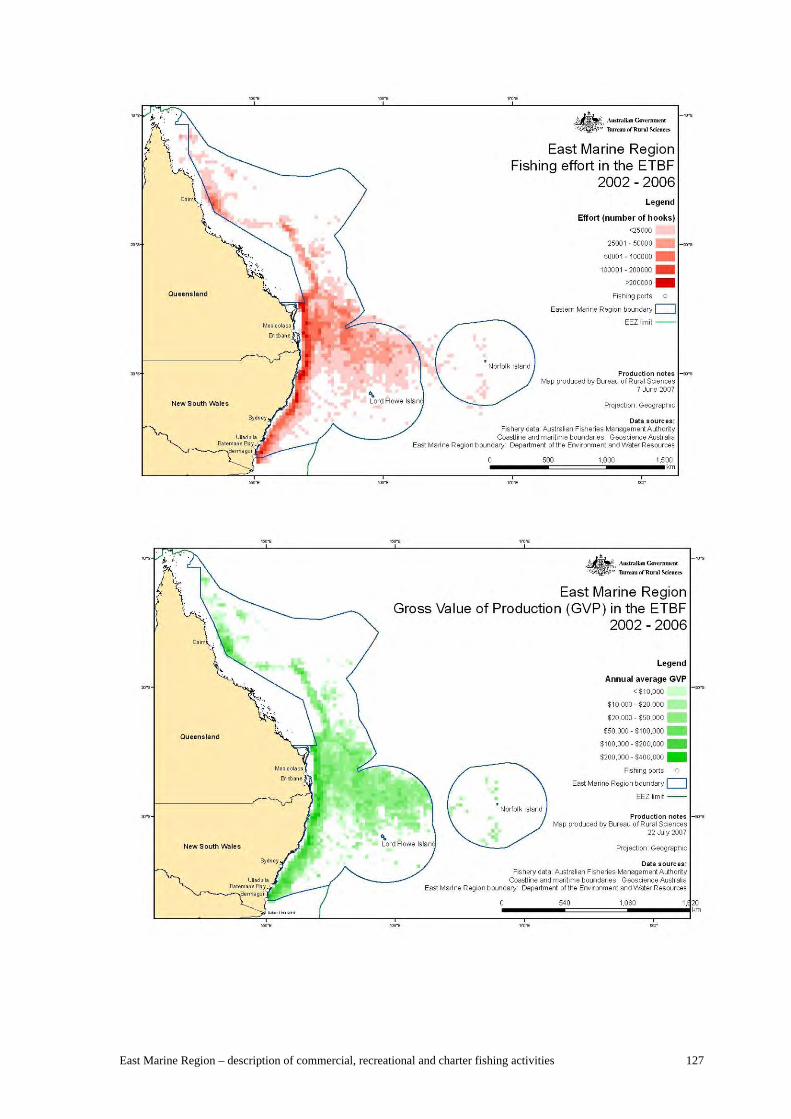
East Marine Region – description of commercial, recreational and charter fishing activities 127

Southern Bluefin Tuna
East Marine Region – description of commercial, recreational and charter fishing activities 128

South East Scalefish and Shark Fishery
East Marine Region – description of commercial, recreational and charter fishing activities 129

East Marine Region – description of commercial, recreational and charter fishing activities 130
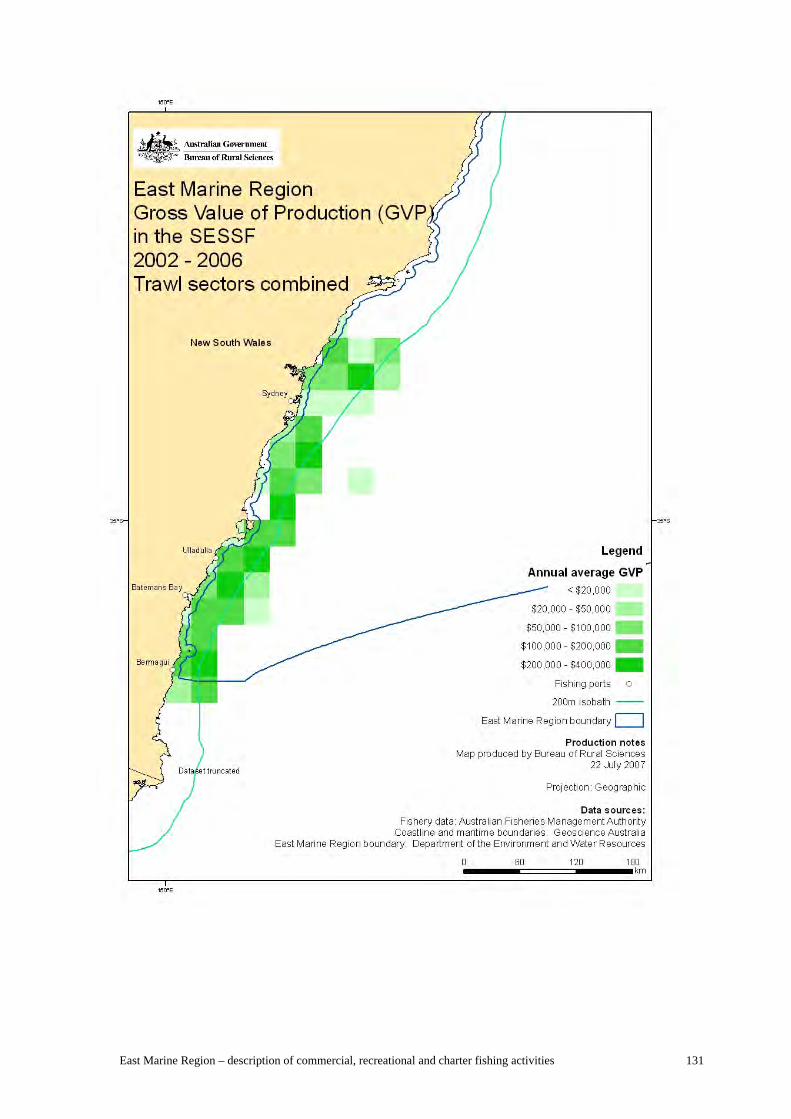
East Marine Region – description of commercial, recreational and charter fishing activities 131
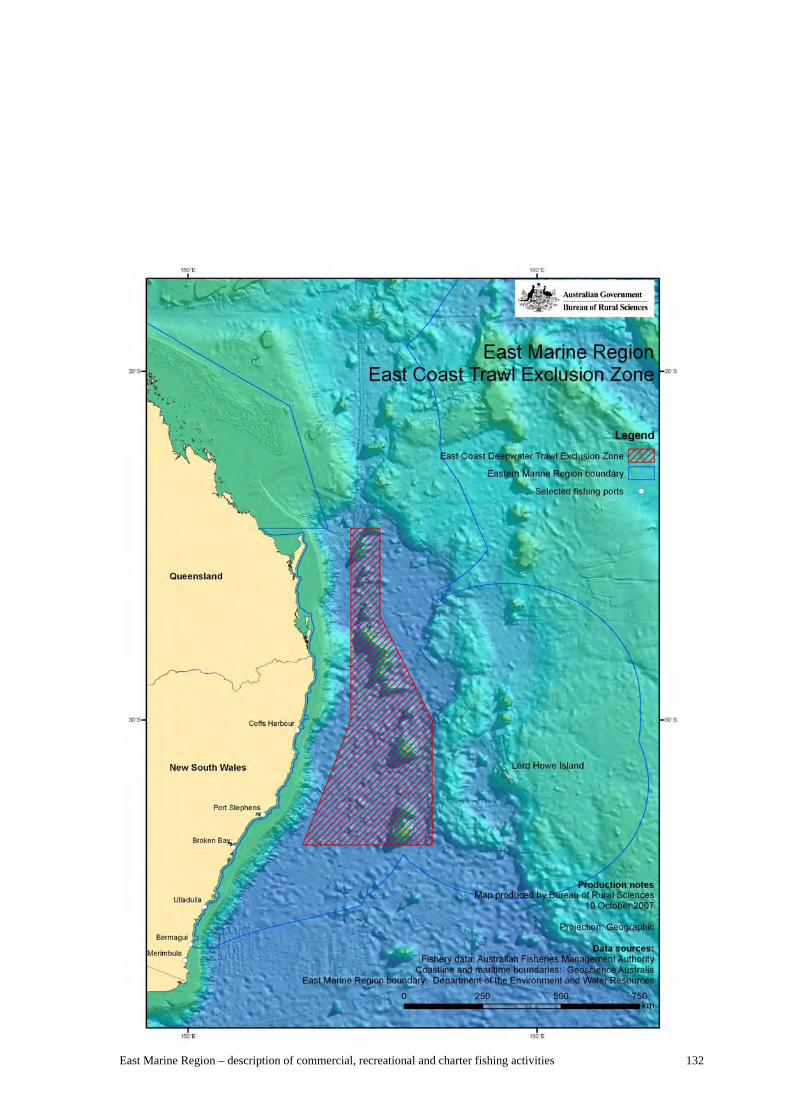
East Marine Region – description of commercial, recreational and charter fishing activities 132

East Marine Region – description of commercial, recreational and charter fishing activities 133

New South Wales Commercial Fisheries
Ocean Trap and Line Fishery
East Marine Region – description of commercial, recreational and charter fishing activities 134

East Marine Region – description of commercial, recreational and charter fishing activities 135

Ocean Trawl Fishery
East Marine Region – description of commercial, recreational and charter fishing activities 136

East Marine Region – description of commercial, recreational and charter fishing activities 137

Rock Lobster Fishery
East Marine Region – description of commercial, recreational and charter fishing activities 138

East Marine Region – description of commercial, recreational and charter fishing activities 139

Queensland Commercial Fisheries
East Coast Otter Trawl and Stout Whiting Fisheries
East Marine Region – description of commercial, recreational and charter fishing activities 140

East Marine Region – description of commercial, recreational and charter fishing activities 141

East Marine Region – description of commercial, recreational and charter fishing activities 142

East Coast Inshore Fin Fish fishery
East Marine Region – description of commercial, recreational and charter fishing activities 143

East Marine Region – description of commercial, recreational and charter fishing activities 144

East Marine Region – description of commercial, recreational and charter fishing activities 145

Line Fishery
East Marine Region – description of commercial, recreational and charter fishing activities 146

East Marine Region – description of commercial, recreational and charter fishing activities 147

East Marine Region – description of commercial, recreational and charter fishing activities 148

Crab Fisheries
East Marine Region – description of commercial, recreational and charter fishing activities 149
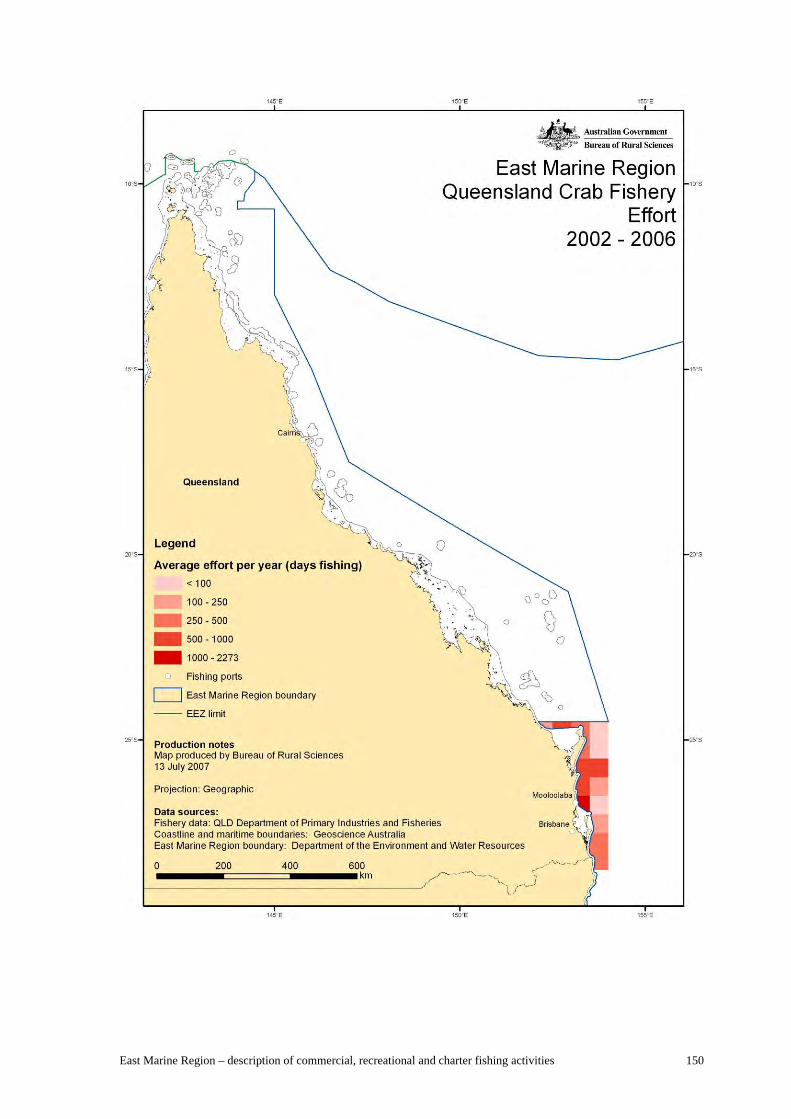
East Marine Region – description of commercial, recreational and charter fishing activities 150

East Marine Region – description of commercial, recreational and charter fishing activities 151

Recreational and Charter Fishing
New South Wales
East Marine Region – description of commercial, recreational and charter fishing activities 152

East Marine Region – description of commercial, recreational and charter fishing activities 153

East Marine Region – description of commercial, recreational and charter fishing activities 154

East Marine Region – description of commercial, recreational and charter fishing activities 155

Queensland
East Marine Region – description of commercial, recreational and charter fishing activities 156

East Marine Region – description of commercial, recreational and charter fishing activities 157

East Marine Region – description of commercial, recreational and charter fishing activities 158

Appendix 2 - Fishing methods
East Marine Region – description of commercial, recreational and charter fishing activities 159

Purse seine Net s are const ruct ed w it h a sm aller m esh sizet han t he size of f ish being t arget ed. A skif f or buoy anchors one end of t he net w hile it is set around a school of f ish , af t er w hich a purse line is pulled t o close t he bot t om of t he net . Used t o t arget h igh-volum e schooling species including t unas, in coast al and oceanic w at ers.
Lampara net Sim ilar t o a purse seine, how ever t he net has t apered panels t o g ive a charact er ist ic scoop shape rat her t han being f lat . The net is set around a school and w hen bot h ends are ret r ieved t he vessel t ow s t he net forw ard, closing t he bot t om t hen t op of t he net . Used t o cat ch p ilchards and anchovy in inshore w at ers.
Beach seine The seine net is set parallel t o t he shoreline, som e dist ance of f t he beach, usually by a d inghy. One haul line is ret ained on t he beach w hile t he ot her is ret urned by t he d inghy and bot h lines are hauled unt il t he seine net and ent rapped f ish are dragged ont o t he shore. Beach seine are used t o cat ch m any species, includ ing m ullet , Aust ralian salm on, w hit ing and t ailor .
Gillnet Panels of net are set ver t ically in t he w at er co lum n, eit her at t he sur face or in cont act w it h t he seabed. The size of t he m esh in t he net det erm ines t he size range o f t he species caught , as sm aller f ish are able t o sw im t hrough t he m esh and f ish t hat are t oo large t end t o bounce of f .
East Marine Region – description of commercial, recreational and charter fishing activities 160

Pots and t raps Traps are usually bait ed and set on t he seabed w it h a line t o a sur face f loat . A w ide range o f designs are used t o t ake crust aceans such as lobst ers and crabs, and som e species o f f ish. Pot s and t raps are set in dept hs f rom a few m et res t o over 200 m et res.
Bottom otter t raw l A cone-shaped net , held open across t he seabed by large hydrodynam ic p lat es called ot t er boards. The ot t er boards are usually at t ached t o t he net by lines called sw eeps, w hich are of t en quit e long, relat ive t o t he net w idt h and aid in herding f ish t ow ards t he net m out h. As t he net is pu lled along, f ish accum ulat e in t he rear sect ion, or cod end, o f t he net . Depending on t he vessel and gear , bot t om ot t er t raw ling m ay occur t o a dept h in excess of 1,500 m et res, but generally above 1,000 m et res.
Mid-w ater t raw l Is usually m uch larger t han a bot t om t raw l and designed t o f ish of f t he seabed, in m idw at er . The hor izont al opening is m aint ained by ot t er boards. Float s on t he headline (at t he t op) and w eight s on t he groundline (at t he bot t om ) m aint ain t he ver t ical opening . Mid-w at er t raw l gear is used t o t arget species such as b lue grenadier (Macru ronu s novaezelandiae) o f f w est ern Tasm ania.
East Marine Region – description of commercial, recreational and charter fishing activities 161

Praw n traw l Net s are sim ilar t o bot t om ot t er t raw ls but do not use sw eep. Chains are hung below t he foot rope t o d ist urb t he praw ns, causing t hem t o ‘jum p’ in t o t he pat h o f t he oncom ing net . Ar rays of t w o, t hree or even four such net s are com m only t ow ed by a single vessel. Praw n t raw ling of t h is t ype is generally lim it ed t o w at ers shallow er t han about 80 m et res.
Danish seine Net s are a cross bet w een a t raw l net and a seine net , in t erm s of shape. The line and net is paid out in a pear shape, and t hen hauled back t o t he st at ionary or slow ly st eam ing vessel in a sim ilar fashion t o a bot t om t raw l. The t w o lines act as ‘sw eeps’, herd ing f ish t ow ards t he net . Danish seine gear is used on t he cont inent al shelf t o t arget f lat head, w hit ing and m orw ong.
Scallop dredge Mainly box-shaped m ud dredges, up t o 3.5 m et res w ide, dragged along t he seabed and d igging int o t he subst rat e t o collect anim als on and w it h in it . Scallop dredges are used in relat ively shallow cont inent al shelf w at ers, t o a dept h o f 100 m et res.
East Marine Region – description of commercial, recreational and charter fishing activities 162

Pole and line (pole and live bait ) Surface sw im m ing schools o f t una are at t ract ed t o t he vessel using live or dead bait . The t una, in a f renzy o f feeding, t ake a barbless hook and lure and are hauled aboard using a po le and shor t , f ixed line. Pole and line m ay be com bined w it h purse sein ing t o at t ract and aggregat e a schoo l o f f ish, around w h ich t he net is set . The po le boat subsequent ly escapes over t he t op of t he purse seine net .
Pelagic longline (drif t ing longlines) Com pr ise a m ain line suspended hor izont ally by buoy lines. Branch lines, each w it h a single bait ed hook, are at t ached t o t he m ain line at regular in t ervals. The line is allow ed t o ‘soak’ for several hours before ret r ieval. Pelagic long lines are used t o cat ch t una and b illf ish in oceanic w at ers, and usually set hooks shallow er t han 300 m et res.
Dropline A single m ain line, w it h num erous bait ed hooks (usually no m ore t han 100) at t ached t o t he bot t om por t ion of t he line via branch-lines and clips. The m ain line is set ver t ically in t he w at er colum n, bet w een a large sur face f loat and a bo t t om w eight . Drop lines are regular ly set t o dept hs in excess o f 500 m et res and cat ch b lueeye t revalla (Hypero glyphe ant arct ica), and hapuku (Poyp rion oxygeneio s) am ong ot her species.
East Marine Region – description of commercial, recreational and charter fishing activities 163

Troll Troll lines are run f rom t he st ern of t he vessel and f rom boom s on t he side o f t he vessel. Hooked bait s and lures are pu lled t hrough t he w at er behind t he m oving vessel. Tro lling is used t o cat ch t una and m ackerel in coast al w at ers and w at ers of f t he cont inent al shelf .
Bottom longline A m ain line, w it h at t ached branch-lines (snoods) and hooks, t hat are set across t he seabed. Var iat ions m ay have f loat s incorporat ed t o lif t t he bait s aw ay f rom t he bot t om (t rot lines). Bot t om longlines are used t o cat ch ling (Genypt eru s b lacodes) and schoo l shark (Galeorh inu s galeu s) am ong o t her species, and m ay be set in dept hs exceeding 1,000 m et res.
Squid jig Occurs at n ight , w it h br ight light s at t ract ing squid t o t he vessel’s side. Lines w it h several barbless lures are ‘jigged’ up and dow n and squ id caught on t he lures are hau led ont o t he vessel. Most vessels in Aust ralia use aut om at ed, m echanical jigg ing m achines. Squid jigg ing occurs m ain ly in coast al w at ers.
Source: Larcombe, J., Brooks, K., Charalambou, C., Fenton, M., Fisher, M., Kinloch, M., and Summerson, R. (2002). Marine Matters – Atlas of marine activities and coastal communities in Australia’s South-East Marine Region, Bureau of Rural Sciences, Canberra.
East Marine Region – description of commercial, recreational and charter fishing activities 164

Appendix 3 – Table of key ports identified for Commonwealth and State Fisheries in the East Marine Region
East Marine Region – description of commercial, recreational and charter fishing activities 165

Home and landed ports for Commercial Commonwealth, NSW and QLD fisheries (based on available data, 2007) Caveat: This table has been constructed based on data available at the time of writing. All data sourced was collected by other researchers and has been interpreted for the purposes of this profile. This table should be used only as an estimate of the key home and landed ports in the East Marine Region.
Port/Fisheries Commonwealth NSW QLD District/Town Resource (Vieira & Galeano (Fenton & Marshall 2001) NOTE: difficult to determine exact home and Centres (TRCs) 2007) landed ports for each fishery.
ETBF SESSF Rock Lobster Ocean Trawl Ocean Trap and Line Crab (Swimmer and Trawl (scallops, stout Line Net
(log book (NSW DPI Fish (Dominion Consulting, (Dominion Consulting Spanner) whiting, prawns)
data also Catch Records 2004 in NSW DPI 2004b) 2004 in NSW DPI 2006)
included) 2003 in NSW DPI 2004a)
?Karumba TRC H H H
?Weipa TRC H H H
?Thursday Island TRC H
Lockhart River H
Cooktown H L H L H L
Port Douglas H L H L H L H L
Cairns H L H L H* L H* L H L
Innisfail TRC H* L H L H* L H* L
Lucinda TRC H L H L H L H L
Townsville H L H* L H L H
Ayr TRC H L H L H L H L
Bowen TRC H L H L H* L H L
Airlie Beach TRC H H H H
East Marine Region – description of commercial, recreational and charter fishing activities 166

Mackay
Yeppoon
Gladstone
Bundaberg TRC
Hervey Bay TRC
Maryborough TRC
Tin Can Bay TRC
Mooloolaba H L
Brisbane TRC L
Southport
Tweed District
Richmond District (incl Evans Head)
Clarence District
Coffs Harbour District (including Woolgoolga)
Hastings District
Manning District (incl Manning Point and Crowdy Head)
Wallis Lake District (incl Forster/Tuncurry)
Port Stephens District
H* L H L H* L H* L
H* L H L H* L H* L
H* H* H* H
H** H** H** H*
H L H* L H L H L
H L? H L? H L? H L?
H L H L H L H L
H L H** L H** L H* L
H** L H** L H* L H** L
H H* H H
H L
H L
L
L H L
H L L
L
H L
L
L H? H L
H L H L
L H? H L H L
L H? H L H L
L H? H L H L
L H? H L H L
L H? H L H L
East Marine Region – description of commercial, recreational and charter fishing activities 167

Hunter District (incl Nelson Bay)
L L H? H L H L
Central NSW Coast District
L H? H L H
Sydney/Sydney District (incl Port Jackson)
H L H L L H? H L H L
Illawarra District (incl Wollongong)
L
L H? H L H L
Ulladulla H L H L H? L
Batemans Bay L L H? H L H L
Montague District (incl Narooma)
H L H L H L
Far South Coast/Shoalhaven District (incl Greenwell Point) L
L H? H L H
Bermagui H L H L H? L
?Eden L H L H
Key: H = Home; L = Landed; * = more than 5% of each type of fishing businesses operating out of TRCs (Fenton and Marshall 2001); ** = more than 10% of each type of fishing businesses operating out of TRCs (Fenton and Marshall 2001)
Note: For the Commonwealth fisheries home port data, ports were included were those that were nominated by greater than 5 per cent of operators in a fishery (Vieira and Galeano, 2007).
Legend Key port CW: > 50 tonnes landed in 2006 NSW: L – 16 or > fish businesses QLD: 16 or > fish businesses
Important port QLD: 6-15 fish businesses NSW L: 6-15 fish businesses
Smaller port (confidential) QLD: 1-5 fish businesses NSW L: 1-5 fish businesses
Outside of EMR EMR Key Port (overall assessment based on other ratings, incl rec fishing)
East Marine Region – description of commercial, recreational and charter fishing activities 168

Appendix 4 – Results of the ‘buyback’ Table A: Commonwealth fishing concessions surrendered from the Securing our Fishing Future voluntary fishing concession buyback
Fishery Type of concession Total number of Total % concessions in reductio Reduction fishery prior to n buyback
Northern Class B Statutory Fishing Right 95 43 45 Prawn (SFR)
Fishery Gear SFR 53844 18365 34
Southern and Gillnet Boat SFR 88 26 30
Eastern Scalefish Hook Boat SFR 122 63 52 Scalefish
and Shark Shark Hook Boat SFR 30 17 57 Fishery
Trawl Boat SFR 118 59 50
Trap Permit/Auto Longline 20 8 40 Permit
East Coast Deepwater Permit 18 8 44
SA Coastal Waters Permit 41 17 41
Tasmanian Coastal Waters 82 38 46 Permit
Victorian Coastal Waters Permit 51 28 55
Redfish Quota SFR 586720 112822 19
John Dory Quota SFR 235784 30889 13
Silver Trevally Quota SFR 538740 74912 14
Jackass Morwong Quota SFR 1480633 114872 8
Royal Red Prawn Quota SFR 485394 103296 21
Eastern Tuna Total Longline permits 218 99 45 and
Billfish Minor Line Permits 230 112 49 Fishery
Bass Strait Packages (Boat SFR [Round 152 22 14 Central Zone One only] + 3500 Commercial Scallop Scallop Quota SFRs + 3500 Fishery Doughboy Scallop Quota SFRs)
Other Other permits ~360 39 11 Fisheries
TOTAL Total Expenditure $148.580 ~1600 >550 million
Source: DAFF (2006) “Commonwealth fisheries set for a more secure and profitable future - Results of Round 2 of the fishing concession buyback announced”, Media Release, DAFF06/153A 22 December 2006 http://www.mffc.gov.au/releases/2006/06153a.html (accessed 05/01/07)
East Marine Region – description of commercial, recreational and charter fishing activities 169

Table B: Geographic spread of accepted tenders
NOTE: Individual tenders may include multiple fishing concessions. Tenders accepted from ports should not be interpreted in terms of concessions removed or reductions in fishing activity. To protect the privacy of tenderers, some locations are undefined. Additionally, this information is based on tenderers identified unload port; in some instance tenderers identified multiple unload ports.
State/Region1 Port Accepted Tenders
Northern Territory
Northern Territory Darwin 15
Western Australia
Undefined WA Regions Undefined Ports 2
Queensland
Brisbane Region Brisbane 7
Far North Queensland Cairns 15
North Queensland Karumba 14
Sunshine Coast Mooloolaba 33
Other Queensland Regions Undefined Ports 3
South Australia
Adelaide Region Undefined Ports 2
Flinders Port Lincoln 12
Other Ports 1
Limestone Coast Beachport 5
Undefined Ports 4
South Central Undefined Ports 4
New South Wales
Sydney Region Port Jackson 5
Sydney 10
Hunter Port Stephens 5
Illawarra Wollongong 6
Mid North Coast Coffs Harbour 5
Undefined Ports 5
Northern Rivers Undefined Ports 1
Shoalhaven Ulladulla 17
Undefined Ports 2
South East New South Wales Bermagui 10
Eden 13
Undefined Ports 5
Victoria
Melbourne Region Melbourne 5
Geelong Undefined Ports 4
Gippsland Lakes Entrance 22
East Marine Region – description of commercial, recreational and charter fishing activities 170

San Remo 5
Undefined Ports 5
Greater Green Triangle Portland 15
Undefined Ports 3
Tasmania
Tasmania Hobart 16
Undefined Ports 26
1 Regions are based on Area Consultative Committee geographical boundaries, www.acc.gov.au. Source: DAFF (2006) “Commonwealth fisheries set for a more secure and profitable future - Results of Round 2 of the fishing concession buyback announced”, Media Release, DAFF06/153A 22 December 2006 http://www.mffc.gov.au/releases/2006/06153a.html (accessed 05/01/07)
East Marine Region – description of commercial, recreational and charter fishing activities 171